Embed Size (px)
Citation preview

SAT, ACT, Preparing for the Test, and the New State Cut Scores
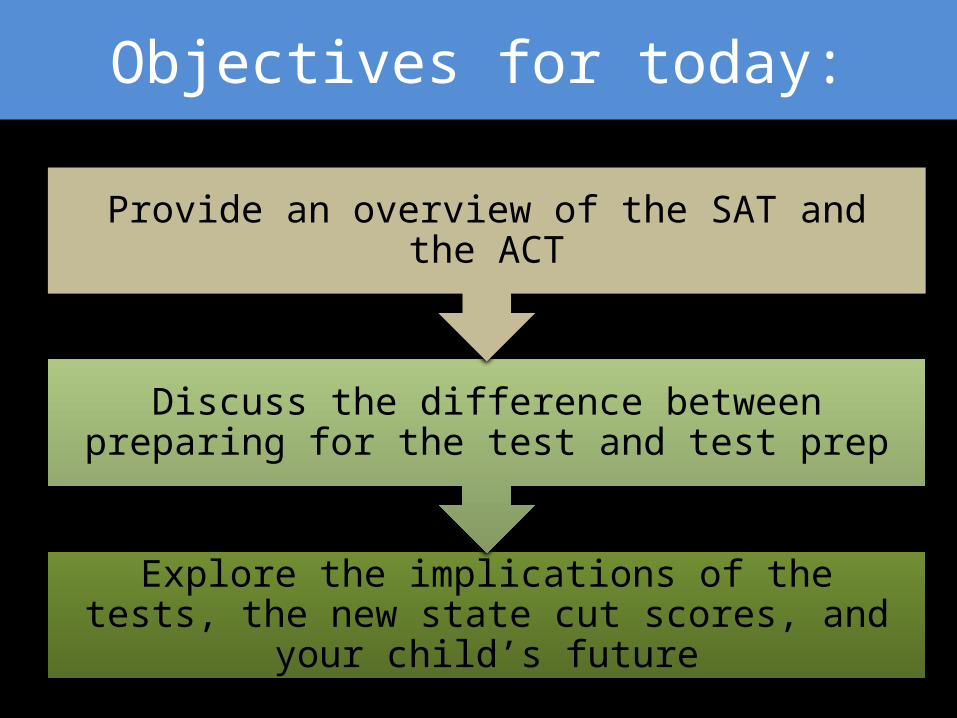
Objectives for today:
Explore the implications of the tests, the new state cut scores, and your child’s future
Discuss the difference between preparing for the test and test prep
Provide an overview of the SAT and the ACT


The Scholastic Aptitude Test:• Began as an IQ test; rooted in verbal aptitude • Measures innate aptitude or general mental ability
rather than achievement
• Originally designed to sort for a meritocracy
• Based in research on norming students

Test series: PSAT/NMSQT and SAT200-800 pts/test
Four main parts: Analogies Critical Reading Math Writing (0-12) Experimental section (for research only, does not count)
Primary uses: Merit Scholarship Eligibility College Entrance

SectionAverage Score
Time (Minutes) Content
Writing 493 60Grammar, usage, and diction.
Mathematics 515 70
Number and operations; algebra and functions; geometry; statistics, probability, and data analysis
Critical Reading 501 70Critical reading and sentence-level reading

The American College Test:• Measures academic achievement
• Designed to predict success in college and eventually career
• Based in annual research with universities and employers

• Test Series: EPAS– Explore 1-25– PLAN 1-32– ACT 1-36– Work Keys
• Five Main Parts of the ACT– English– Reading– Math– Science reasoning– Writing (0-12)

• Work Keys– Reading for Information (Technical Reading)– Applied Mathematics
• Each test is described in explicit developmental skills divided into scorebands
• 1-12• 13-15• 16-19• 20-23
• 24-27• 28-32• 33-36

Section Number of questions
Time (minutes)
Average score
College Readiness Benchmark Content
English 75 45 20.6 18 usage/mechanics and rhetorical skills
Mathematics 60 60 21.0 22
pre-algebra, elementary algebra, intermediate algebra, coordinate geometry, geometry, and elementary trigonometry
Reading 40 35 21.4 21 reading comprehension
Science 40 35 20.9 24interpretation, analysis, evaluation, reasoning, and problem-solving
Optional Writing Test 1 essay prompt 30 7.7 writing skills
Composite 21.1

20th Century Model:
Students were sorted by those can do school and those who cannot.

DRIVING PRINCPLE:
Time is held constant while achievement varies
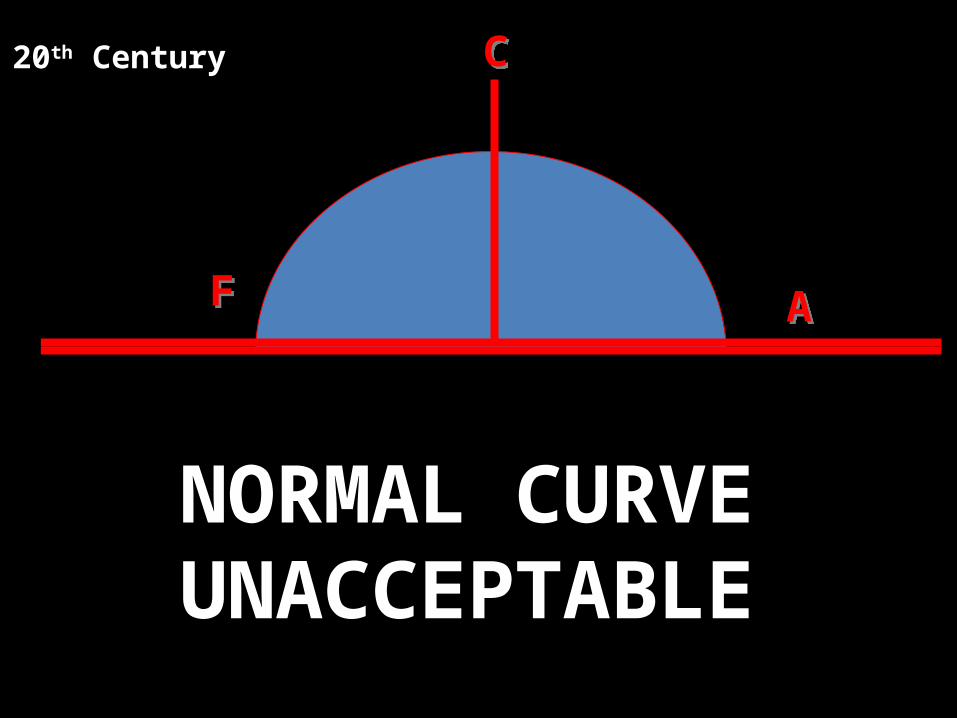
NORMAL CURVEUNACCEPTABLE
FF
CC
AA
20th Century

ALL STUDENTS MEETING STANDARDS
MEETS STANDARD21th Century

For the last 50+ years, what has been the #1 predictor of academic success?

FAMILY INCOMELess than $20,000 (+7) 1329$ 20,000 - $40,000 (+9) 1399$ 40,000 - $60,000 (+7) 1468$ 60,000 - $80,000 (+4) 1510$ 80,000 - $100,000 (+2) 1552$100,000 - $120,000 (+8) 1587$120,000 - $140,000 (+11) 1602$140,000 - $160,000 (+12)1625$160,000 - $180,000 (+17)1648More than $200,000/year (26) (+19) 1721
No Response --35% (’08 scores not reported) 1619calculated by FairTest from: College Board, College-Bound Seniors 2009:Total Group Profile Report and College-Bound Seniors 2008: Total Group Profile Report
Highest SAT Score
COLLEGE BOUND SENIORS AVERAGE SAT SCORES2010

How do we push back on this?

“Test Prep” and
“Preparing for the Test”are
two entirely different things!!!

Test Prep• One of the first supports we often think of
• Can be beneficial
• Teaches strategies:– To perform efficiently in timed, test like environment– To attack certain types of questions
• Considerations– Often expensive– Studies have shown limited impact

Standards Based Education and Practice!
• ACT College Readiness Standards– http://www.act.org/standard/index.html
• Common Core Standards– http://www.corestandards.org/the-standards

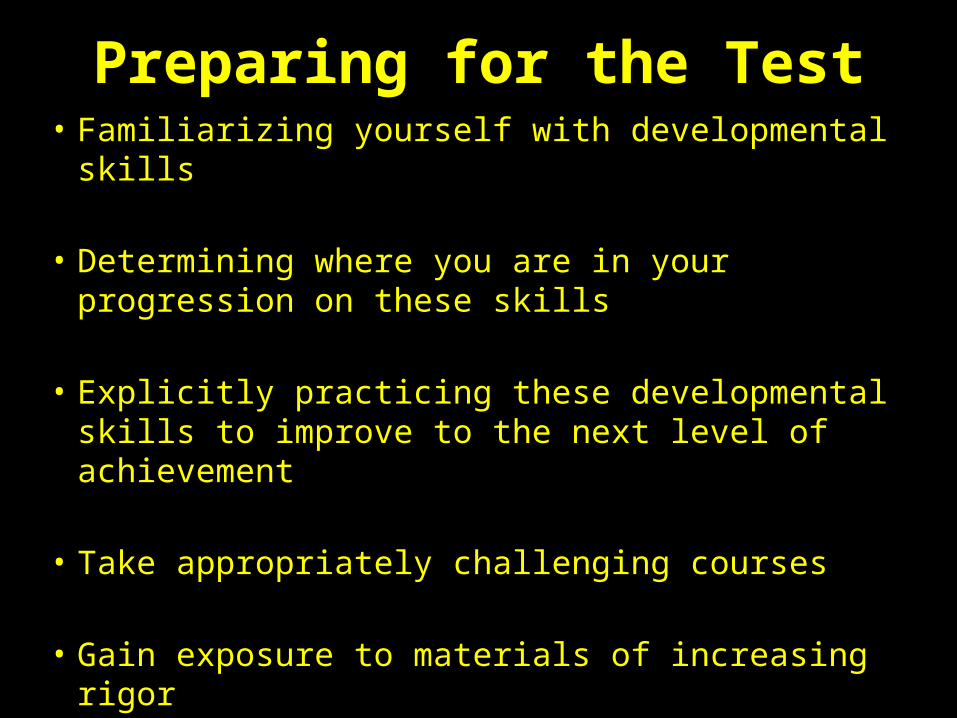
Preparing for the Test• Familiarizing yourself with developmental skills
• Determining where you are in your progression on these skills
• Explicitly practicing these developmental skills to improve to the next level of achievement
• Take appropriately challenging courses
• Gain exposure to materials of increasing rigor

• Switch to CRS Documents

Empowered High Schools, 2010 © Used with Permission
KEY TERMS
Strategies
Benchmarks
Standards
Skills

Benchmarks – ACT Scorebands13-15 Select a single piece of
data (numerical or nonnumerical) from a simple data presentation
(e.g.,
24-27 - Compare or combine data from two or more simple
Standards – CRS ScienceInterpretation of
DataScientific
InvestigationEvaluation of
Models…
Skills – ACT College Readiness Skills
Reading Math English Science

Curriculum Alignment C

Ineffective curricula looks like broken DNA

Effective curricula look like healthy DNA
Two Essential Elements
Scaffolding
Spiraling

Rubric Level 1b 1a 2 3 4 5 6
EPAS Equivalent 1-12 13-15 16-19 20-23 24-27 28-32 33-36
AP/Honors
Q1-Review for Mastery SENIOR
Regular
Q1-Review for Mastery
Q2-Q4-Mastery
AP/Honors
Q1-Review for Mastery
Q2-Q4-Mastery JR
Regular
Q1-Review for Mastery
Q2-Q4-Mastery Q4-Exposure
AP/Honors
Q1--Review for Mastery
Q2-Q4-Mastery Q4-Exposure SOPH
Regular
Q1-
Review Q2-Q4-Mastery Q4-Exposure
AP/Honors
Q1-Review and Mastery
Q2-Q4-
MasteryQ4-
Exposure FRESH
Regular
Q1-Review for Mastery
Q2-Q4-Mastery Q4-Exposure
Curriculum alignment = Guaranteed and Viable Curriculum
EMPOWERED HIGH SCHOOLS- COPYRIGHT 2009- ALL RIGHTS RESERVED

Grades measure:
Student resiliency to obtain a Four Year College Degree
EMPOWERED HIGH SCHOOLS- COPYRIGHT 2009- ALL RIGHTS RESERVED

Data DrivenCurriculum

Building WideData

Effective Schools Movement: Valued Added by Demographic Group (Sub-Groups)
rather than
SESACHIEVEMENT DEMOGRAPHIC

Demographic by ACT Explore Score Range:
Group 1 b 1-12Group 1 a 13-15
Group 2 16-19
Group 3 20-23
Group 4 24-25Rolling Meadows High School

http://www.benham.com/images/L3ANDON-toprite.jpg

> = 2.0 Program Viability
1.9 -1.0 Weaker Program
< 0 Program Crisis EMPOWERED HIGH SCHOOLS- COPYRIGHT 2009- ALL RIGHTS
RESERVED
1.0 - 0 Under-Performing
~ VALUE-ADDED PERFORMANCE REPORT ~

PLC-DEPARTMENT GOALS
Example : Reading (Av. > 2.0)
3.2 3.0 2.8 2.3 2.21 b 1a 2 3 4
Value-Added EPAS score increases
Group
Goal

EPAS Value Added – Class A Explore to Plan Growth
1b
1-121a
13-152
16-193
20-234
24-25
Math 3.22 1.61 1.53 -0.15 0.57
English 2.59 2.1 2.08 1.58 0.3
Reading 3.01 2.77 1.34 -3.76 -6.8
Science 0 1.94 1.18 -5.02 -6.1
Comp. 2.27 1.85 1.99 -1 2.5
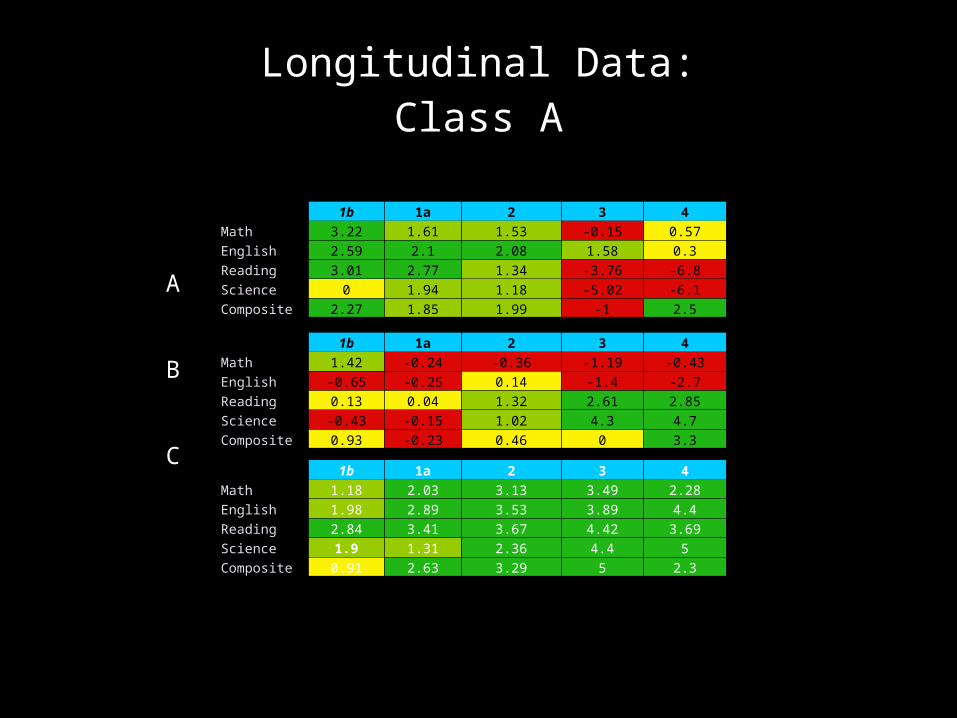
Longitudinal Data:Class A
1b 1a 2 3 4Math 3.22 1.61 1.53 -0.15 0.57English 2.59 2.1 2.08 1.58 0.3Reading 3.01 2.77 1.34 -3.76 -6.8Science 0 1.94 1.18 -5.02 -6.1Composite 2.27 1.85 1.99 -1 2.5
1b 1a 2 3 4Math 1.42 -0.24 -0.36 -1.19 -0.43English -0.65 -0.25 0.14 -1.4 -2.7Reading 0.13 0.04 1.32 2.61 2.85Science -0.43 -0.15 1.02 4.3 4.7Composite 0.93 -0.23 0.46 0 3.3
1b 1a 2 3 4Math 1.18 2.03 3.13 3.49 2.28English 1.98 2.89 3.53 3.89 4.4Reading 2.84 3.41 3.67 4.42 3.69Science 1.9 1.31 2.36 4.4 5Composite 0.91 2.63 3.29 5 2.3
Fr. Year Growth
So. Year Growth
Jr . Year Growth
A
B
C

EPAS Growth Explore to Plan
1b 1a 2 3 4MathEnglishReadingScienceComposite
Class of
2010
MathEnglishReadingScienceComposite
Class of
2011
Class of
2012MathEnglishReadingScienceComposite
MathEnglishReadingScienceComposite
Class of
2013

Class of 2010
Test MeasureRubric Level 1b (1-12) 1a (13-15) 2 (16-19) 3 (20-23) 4 (24-25)
Exp-PLAN Growth Math 3.22 1.61 1.53 -0.15 0.57 English 2.59 2.1 2.08 1.58 0.3 Reading 3.01 2.77 1.34 -3.76 -6.8 Science 0 1.94 1.18 -5.02 -6.1 Composite 2.27 1.85 1.99 -1 2.5
Class of 2011
Test MeasureRubric Level 1b (1-12) 1a (13-15) 2 (16-19) 3 (20-23) 4 (24-25)
Exp-PLAN Growth Math 4.03 1.44 1.12 2.66 1.88 English 1.73 1.47 1.23 0.13 -0.16 Reading 2.82 3.01 1.94 1.25 1.23 Science 3.85 1.68 1.29 2.5 0.72 Composite 2.19 1.46 1.6 2.1 2.83
Class of 2012
Test MeasureRubric Level 1b (1-12) 1a (13-15) 2 (16-19) 3 (20-23) 4 (24-25)
Exp-PLAN Growth Math 2.71 1.01 1.47 2.2 1.1 English 2.87 2.17 1.47 1.34 0.94 Reading 2.86 2.4 2.41 0.93 1.3 Science 4.5 2.17 1.75 1.78 1.95 Composite 1.95 1.74 1.75 2.48 4
Class of 2013
Test MeasureRubric Level 1b (1-12) 1a (13-15) 2 (16-19) 3 (20-23) 4 (24-25)
Exp-PLAN Growth Math 3.9 1.5 2.36 3.34 3.42 English 2.42 2.34 2.57 2.26 3.32 Reading 3.11 2.77 3.43 0.89 1.67 Science 4.95 2.45 1.74 2.08 0.31 Composite 2.57 2.14 2.23 3.25 3.8
Longitudinal EPAS Growth at the Freshman Level

Class of 2010
Test MeasureRubric Level 1b (1-12) 1a (13-15) 2 (16-19) 3 (20-23) 4 (24-25)
PLAN-IACT Growth Math 1.42 -0.24 -0.36 -1.19 -0.43 English -0.65 -0.25 0.14 -1.4 -2.7 Reading 0.13 0.04 1.32 2.61 2.85 Science -0.43 -0.15 1.02 4.3 4.7
Composite 0.93 -0.23 0.46 0 3.3
Class of 2011
Test MeasureRubric Level 1b (1-12) 1a (13-15) 2 (16-19) 3 (20-23) 4 (24-25)
PLAN-IACT Growth Math 0.6 0.25 0.76 0.75 1.33 English 0.09 0.06 1.65 3.5 5 Reading -0.57 -0.24 1.85 2.34 4.25 Science -0.7 -0.26 0.77 1.69 2.6
Composite 0.03 -0.18 1.08 2.5 3
Class of 2012
Test MeasureRubric Level 1b (1-12) 1a (13-15) 2 (16-19) 3 (20-23) 4 (24-25)
PLAN-IACT Growth Math 1.34 1 1.32 1.3 0.33 English 1.14 2.05 2.5 2.96 3.39 Reading 0.38 2.19 2.33 3.56 4.39 Science -0.38 0.48 0.79 2.06 1.24
Composite 0.68 1.02 1.66 2.63 3.33
Longitudinal EPAS Growth at the Sophomore Level

Class of 2010
Test MeasureRubric Level 1b (1-12) 1a (13-15) 2 (16-19) 3 (20-23) 4 (24-25)
IACT-ACT Growth Math 1.18 2.03 3.13 3.49 2.28
English 1.98 2.89 3.53 3.89 4.4
Reading 2.84 3.41 3.67 4.42 3.69
Science 1.9 1.31 2.36 4.4 5
Composite 0.91 2.63 3.29 5 2.3
Class of 2011
Test MeasureRubric Level 1b (1-12) 1a (13-15) 2 (16-19) 3 (20-23) 4 (24-25)
IACT-ACT Growth Math 1.8 1.99 2.87 3.29 3.16
English 2.7 4.17 4.45 3.64 2.43
Reading 2.96 4.02 3.13 3.27 1.67
Science 2 2.83 2.19 1.69 1.08
Composite 1.88 3.02 3.29 2.84 2
Longitudinal EPAS Growth at the Junior Level

STANDARDS
INTERIMASSESSMENT
EXTERNAL ASSESSMENT
CRS
GAINS
EPAS
DEVELOPMENTAL BENCHMARKS
FORMATIVEASSESSMENTS
SUMMATIVEASSESSMENTS
EXTERNAL TESTING
INTERNAL ASSESSMENT

CONCEPTSCONCEPTS
Gov. by the People• Big ideas, which are vital or basic for understanding a subject NOT sets of facts
PROCESSESPROCESSES Research Processes• Following steps in a sequence
to produce a result
SKILLSSKILLS
Read, Write,Strategize, Solve
• having the practiced capacity to manage complex tasks

STANDARDS practiced curriculum content:STANDARDS practiced curriculum content:
CONCEPTSCONCEPTS
PROCESSESPROCESSES
SKILLSSKILLS
McMackin2007

CORE
StandardsWithin
Context
Important to Know
Worth knowing or Advanced
REQUIRED FOR ALL LEVELSREQUIRED FOR ALL LEVELS
Grant Wiggins: UBD

Social Science 3 Unit 1: RMHS Program Standard 1
National Standards for Civics and Government (9-12): I. WHAT ARE CIVIC LIFE, POLITICS, AND GOVERNMENT? B. What are the essential characteristics of limited and unlimited government?
Concept: Limited government provides a basis for protecting individual rights and promoting the common good in contrast to unlimited government which endangers these values. Limited government is constitutional government. Unlimited governments include authoritarian and totalitarian systems.
Concept: The rule of law is an essential component of limited government. The central notion of a rule of law is that society is governed according to widely known and accepted rules followed not only by the governed but also by those in authority.
ISBE: Goal 14F: Understand political system, with emphasis on the US; Understand
the development of US political ideas and traditions
Concept Standard: The belief that the “divine right of kings”, which states that a king had a God-given right to rule, changed to a belief that countries must be ruled by governments which must follow the law.
1. The student can explain the difference between divine right and government by law. The student can give simple definitions using very simple examples
2. The student can tell a story about the transition from divine right to rule by law. The story uses basic events from history. The student maintains a naive but accurate understanding.
3. The student studied and used detailed historic events to explain how divine right evolved and how it was replaced with government by law. The student communicated the relationship of these ideas using original documents.
4. While meeting all the requirements of level 3 (below), the student uses an external set of variables to organize and explain the ideas and events.
VALIDATEVALIDATE

Program Standards
Syste
m 1PROCESS
PROCESS2
McMackin2007
Benchmarks
Measurable Standards:Developmental Benchmark
Performance Levels
PROCESS3
PLT-DdC
TIER ONE
S

Developmental Benchmarks
Program Standard Rubric
1
2
3
4 Sufficiency
6 Exceeds
5 Mastery
* The size and placement of the labels may vary rubric to rubric.
McMackin2007
Web

2
ACT16-19
RubricScore
3
ACT20-23
Generalizations & Conclusions
1. Draw simple generalizations and conclusions about people, ideas, and so on in uncomplicated passages.
1. Draw generalizations and conclusions about people, ideas, and so on in uncomplicated passages.
2. Draw simple generalizations and conclusions using details that support the main points of more challenging passages.
1. Draw subtle generalizations and conclusions about characters, ideas, and so on in uncomplicated literary narratives.
2. Draw generalizations and conclusions about people, ideas, and so on in more challenging passages.
1. Use information from one or more sections of a more challenging passage to draw generalizations and conclusions about people, ideas, and so on.
4
ACT24-27
5
ACT28-32
1. Draw complex or subtle generalizations and conclusions about people, ideas, and so on, often by synthesizing information from different portions of the passage.
2. Understand and generalize about portions of a complex literary narrative.
6
ACT28-32
Validating Standard: ACT College Readiness Standards: Reading
RMHS Standard: The student can draw generalizations and conclusions from written material.
Standard Type: Skill
Mastery is constant across program of
courses
2
ACT16-19
RubricScore
3
ACT20-23
Interpretations of Data (IOD)
4
ACT24-27
5
ACT28-32
6
ACT28-32
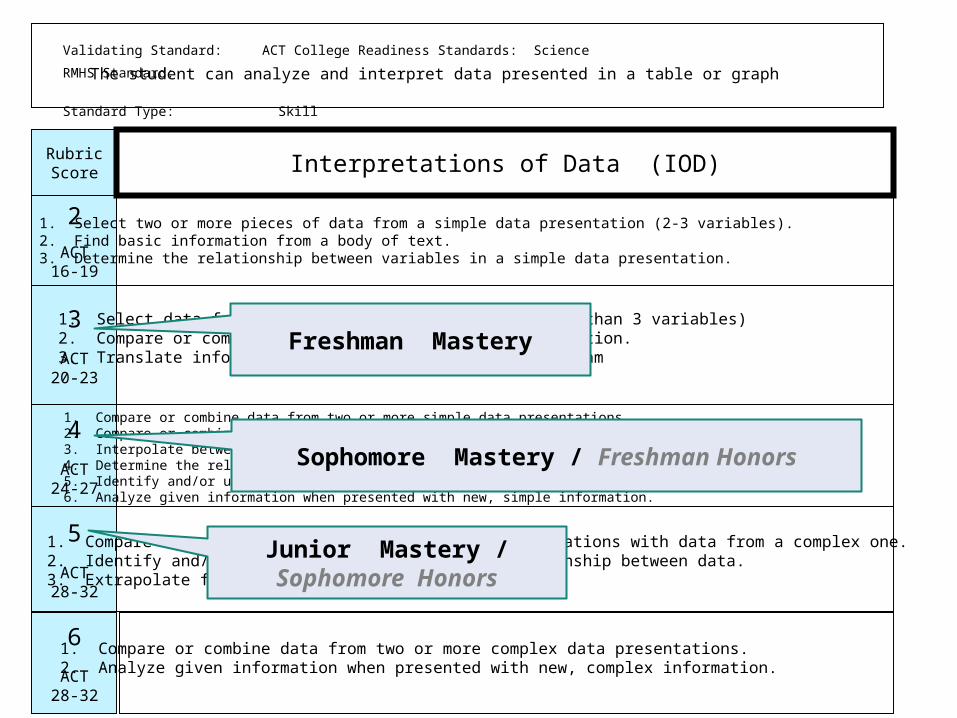
Validating Standard: ACT College Readiness Standards: Science
RMHS Standard: The student can analyze and interpret data presented in a table or graph
Standard Type: Skill
1. Select two or more pieces of data from a simple data presentation (2-3 variables).2. Find basic information from a body of text.3. Determine the relationship between variables in a simple data presentation.
1. Select data from a complex data presentation (more than 3 variables)2. Compare or combine data from a simple data presentation.3. Translate information into a table, graph, or diagram
1. Compare or combine data from two or more simple data presentations.2. Compare or combine data from a complex data presentation.3. Interpolate between data point in a table or graph.4. Determine the relationship between variables in a complex data presentation.5. Identify and/or use a simple mathematical relationship between data.6. Analyze given information when presented with new, simple information.
1. Compare or combine data from a simple data presentations with data from a complex one.2. Identify and/or use a complex mathematical relationship between data.3. Extrapolate from data points in a table or graph.
1. Compare or combine data from two or more complex data presentations.2. Analyze given information when presented with new, complex information.
The student can analyze and interpret data presented in a table or graph
Junior Mastery / Sophomore Honors
Freshman Mastery
Sophomore Mastery / Freshman Honors

IMPROVEMENT STEPS
BOYSGOL
D 13 12 11 10 9 8 7 6 5 4 3 2 1 WT.CV (12 min. run) 21+ 19.00 18.50 18.00 17.50 17.00 16.50 16.00 15.50 15.00 14.50 14.00 13.50 13.00 10
Mus. Str. (bench) 1.19+ 1.18-141.13-
09 1.08-041.03-.9
9.98-.9
4.93-.8
9 .88-.84 .83-.79 .78-.76 .75-.73 .72-.70 .69< 5Mus. End. (sit-ups 65 64-60 59 58 57 56 55 54 53-52 51-50 49-48 47-46 45-44 43< 5Flex (sit/reach) 42 41 40 39 38 37 36 35 34 33 32 31 30 29< 5
IMPROVEMENT STEPS
GIRLSGOL
D 13 12 11 10 9 8 7 6 5 4 3 2 1 WT.CV (12 min. run) 17.5 16.00 15.50 15.00 14.50 14.00 13.50 13.00 12.50 12.00 11.50 11.00 10.50 10.00 10
Mus. Str. (bench) .72+ .71-.69 .68-.66 .65-.63 .62-.60.59-.5
7.56-.5
4 .53-.52 .51-.49 0.48 0.47 0.46 .45< 5Mus. End. (sit-ups 54 53-51 50 49 48 47 46 45 44 43 42-41 40-39 38-37 36< 5Flex (sit/reach) 50 49-46 45 44 43 42 41 40 39 38 37 36 35 34< 5
Group 1 Group 2 Group 3 Group 4
251-325 176-250 100-175 25-99GRADE
Achieving
Advancing
Progressing
Emerging
A>=1 to -
14>=75 to
26>=100 to
51>=75 to
51B -15 to -49 25 to -14 50 to 11 50 to 26C -50 to -74-15 to -49 10 to -24 25 to 1D -75 -50 to -59 -25 to -51 0F > -75 > -59 > -51 < 0
Developmental LevelsRubric
STANDARDS:
1. Strength2. Endurance3. Flexibility4. Cardio-Vascular Group 1 Group 2 Group 3 Group 4
251-325 176-250 100-175 25-99
Achieving Advancing Progressing Emerging
>=1 to -14 >=75 to 26 >=100 to 51 >=75 to 51-15 to -49 25 to -14 50 to 11 50 to 26-50 to -74 -15 to -49 10 to -24 25 to 1
-75 -50 to -59 -25 to -51 0> -75 > -59 > -51 < 0
Mastery by Developmental Group
Physical Education

Rubric Level 1b 1a 2 3 4 5 6
EPAS Equivalent 1-12 13-15 16-19 20-23 24-27 28-32 33-36
AP/Honors
Q1-Review for Mastery SENIOR
Regular
Q1-Review for Mastery
Q2-Q4-Mastery
Prep
Q1-Review for Mastery
Q2-Q4-Mastery Q4-Exposure
AP/Honors
Q1-Review for Mastery
Q2-Q4-Mastery JR
Regular
Q1-Review for Mastery
Q2-Q4-Mastery Q4-Exposure
Prep
Q1-Review for Mastery
Q2-Q4-Mastery Q4-Exposure
AP/Honors
Q1--Review for Mastery
Q2-Q4-Mastery Q4-Exposure SOPH
Regular
Q1-
Review Q2-Q4-Mastery Q4-Exposure
Prep
Q1-Review for Mastery
Q2-Q4-Mastery Q4-Exposure
AP/Honors
Q1-Review and Mastery
Q2-Q4-
MasteryQ4-
Exposure FRESH Regular
Q1-Review for Mastery
Q2-Q4-Mastery Q4-Exposure
Prep
Q1-Review for Mastery
Q2-Q4-Mastery Q4-Exposure
Curriculum alignment = Guaranteed and Viable Curriculum
PREPREG
HONOR
EMPOWERED HIGH SCHOOLS- COPYRIGHT 2009- ALL RIGHTS RESERVED
LEVELS:AP/Honors
RegularPrep
BENCHMARK LEVELS:ACT Achievement levels
Review
Mastery
Exposure
4 Yr. Goal