Embed Size (px)
Citation preview
Page 1 of 23
SASSEUR REAL ESTATE INVESTMENT TRUST
Unaudited Financial Statements and Distribution Announcement For the Fourth Quarter and Financial Year Ended 31 December 2019
TABLE OF CONTENTS
Item No. Description Page No.
- Introduction 2 – 3
- Summary of Sasseur REIT Group Results 3 – 4
1(a) Consolidated Statement of Total Return and Distribution Statement 5 – 7
1(b)(i) Statements of Financial Position 8 – 9
1(b)(ii) Aggregate Amount of Borrowings and Debt Securities 10
1(c) Consolidated Statement of Cash Flows 11 – 12
1(d)(i) Statements of Changes in Unitholders’ Funds 12 – 13
1(d)(ii) Details of Any Changes in Units 14
1(d)(iii) Total number of issued units 14
1(d)(iv) Sales, transfers, cancellation and/or use of Treasury units 14
2 & 3 Audit Statement 14
4 & 5 Changes in Accounting Policies 15
6 Consolidated Earnings Per Unit (“EPU”) and Distribution Per Unit (“DPU”)
15
7 Net Asset Value (“NAV”) and Net Tangible Asset (“NTA”) Per Unit 16
8 Review of the Performance 16
9 Variance between Actual and Projection Results 17 – 18
10 Outlook and Prospects 19
11 & 12 Distribution 20
13 General Mandate relating to Interested Person Transactions 20
14 Confirmation Pursuant to Rule 720(1) of the Listing Manual 20
15 & 16 Segmental Information 21
17 Breakdown of Revenue 21
18 Breakdown of Total Distribution 21
19 Confirmation Pursuant to Rule 704(13) of the Listing Manual 22
DBS Bank Ltd. was the sole financial adviser and issue manager for the initial public offering of Sasseur REIT (the "Offering"). DBS Bank Ltd. and Bank of China Limited, Singapore Branch were the joint global coordinators to the Offering. DBS Bank Ltd., Bank of China Limited, Singapore Branch, China International Capital Corporation (Singapore) Pte. Limited, Citigroup Global Markets Singapore Pte. Ltd., Credit Suisse (Singapore) Limited, Haitong International Securities (Singapore) Pte. Ltd. and Maybank Kim Eng Securities Pte. Ltd. were the joint bookrunners and underwriters to the Offering.
SASSEUR REAL ESTATE INVESTMENT TRUST Unaudited Financial Statements and Distribution Announcement For the Fourth Quarter and Financial Year Ended 31 December 2019
___________________________________________________________________________
Page 2 of 23
Introduction Sasseur Real Estate Investment Trust (the “Sasseur REIT”) is a Singapore real estate investment trust constituted as a private trust (“Sasseur Trust”) by a trust deed dated 30 October 2017 which was supplemented by a first supplemental deed dated 19 March 2018, entered into by Sasseur Asset Management Pte. Ltd. as Manager of Sasseur REIT (the “Manager”) and DBS Trustee Limited as Trustee of Sasseur REIT (the “Trustee”). Sasseur Real Estate Investment Trust and its subsidiaries are collectively known as the “REIT Group”. Sasseur REIT was listed on the Main Board of the Singapore Exchange Securities Trading Limited (“SGX-ST”) on 28 March 2018 (the “Listing Date”). Sasseur REIT’s investment strategy is investing principally, directly or indirectly, in a diversified portfolio of income-producing real estate, which primarily comprises retail outlet malls, as well as real estate-related assets in relation to the foregoing, with an initial focus on Asia. Sasseur REIT’s initial portfolio comprise the following four retail outlet malls (the “Properties”) strategically located in cities of economic potential in the People’s Republic of China (“PRC”):
• Chongqing Outlets Chongqing Outlets is a retail outlet mall that targets middle and upper-class consumers with higher disposable incomes. Chongqing Outlets was designed and built to reflect an Italian architectural style, distinguishing itself through an experiential shopping concept. Chongqing Outlets houses a cinema, children recreational facilities as well as an array of restaurants. The Chongqing Outlets is located in the northeast region of the city and is approximately 10 km away from the Chongqing Jiangbei International Airport.
• Bishan Outlets Bishan Outlets was designed to be a one-stop shopping destination in the Bishan and West Chongqing areas, combining retail shopping with entertainment, food, education and leisure. Bishan Outlets features (i) a “Super Children’s Centre” (which features retail stores offering a selection of infant and children’s clothing labels, an early childhood education centre, an enrichment centre, a children’s playground, a children’s photography centre and a children’s theatre); and (ii) a “Super Sports Hall” (which houses the outlet stores of sports brands such as Nike, Adidas and Le Coq Sportif and also features a fitness centre). In addition to the foregoing, there are several pubs and bars found in Bishan Outlets and Bishan Outlets is poised to be a trendy meeting point for the young. Bishan Outlets is located in the west of Chongqing. As the closest district to the downtown area of Chongqing, Bishan Outlets can be accessed within a one-hour drive (approximately 37 km) from the downtown area of Chongqing.
• Hefei Outlets Hefei Outlets caters to middle class consumers by offering a wide range of entertainment choices as well as luxury brand stores. Hefei Outlets also features one of the largest cinemas in east China and the first five-star cinema in Hefei under the UME cinema chain, with 17 cinemas equipped with state-of-the-art audio and visual systems and more than 2,500 seats. Hefei Outlets is located in the High-Tech Industrial Development Zone, which is one of the PRC’s national high-tech industrial development zones.
• Kunming Outlets
Kunming Outlets offers a wide array of retail options including outlet mall shopping, healthcare services, entertainment and cultural facilities, thereby providing its customers with a comprehensive lifestyle and entertainment experience intended to promote retail spending and enhance customer loyalty. Kunming Outlets is targeted at middle class consumers, catering to their growing preference for luxury brands such as Burberry. Kunming Outlets also carries popular domestic brands to cater to a wide customer base. Kunming Outlets is located in Taiping New City, a new development platform for urban expansion by the government of Anning City.
On 14 May 2019, Sasseur REIT completed the acquisition of additional shop units in Hefei Outlets with existing tenancies at the annex block of its Hefei site with total acquisition costs of RMB 100.1 million (S$20.1 million). The shop units comprise gross floor area (“GFA”) of 6,133.84 sqm. The acquisition has increased Sasseur REIT’s ownership of the Hefei outlet mall from 77.8% to 81.2% by GFA. Sasseur REIT is presenting its financial results for the fourth quarter ended 31 December 2019 (“4Q 2019”) and for the financial year from 1 January 2019 to 31 December 2019 (“FY 2019”).
SASSEUR REAL ESTATE INVESTMENT TRUST Unaudited Financial Statements and Distribution Announcement For the Fourth Quarter and Financial Year Ended 31 December 2019
___________________________________________________________________________
Page 3 of 23
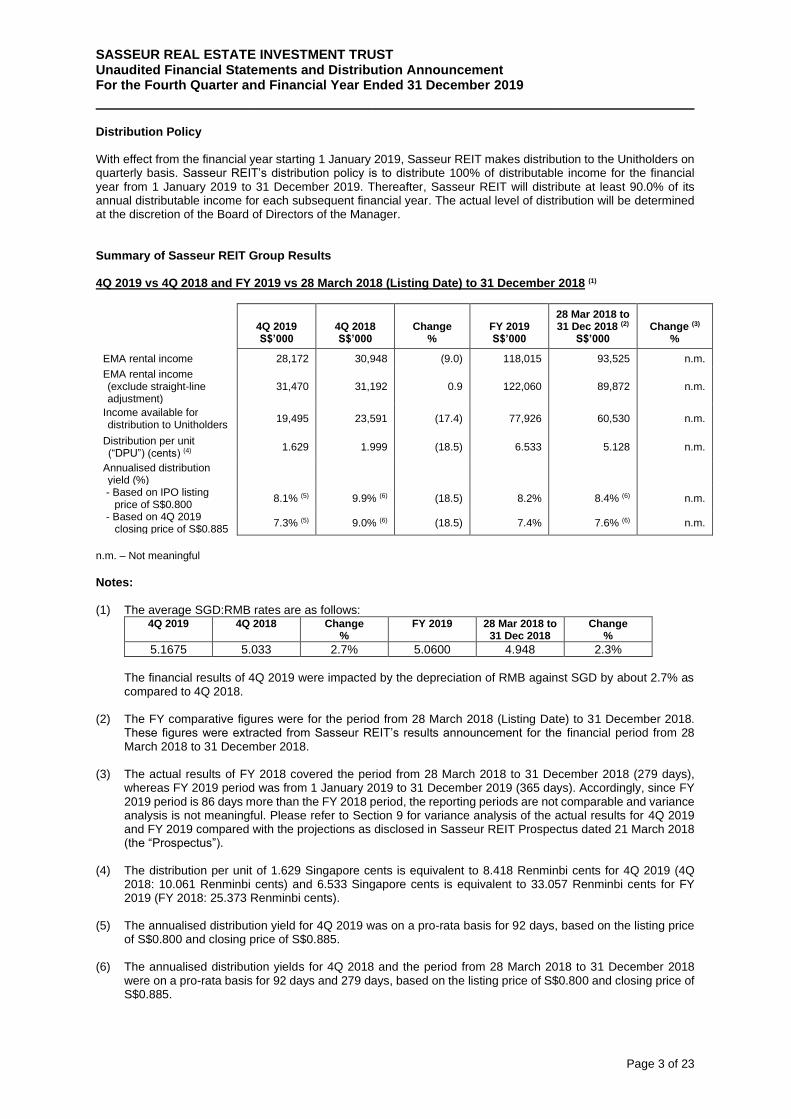
Distribution Policy With effect from the financial year starting 1 January 2019, Sasseur REIT makes distribution to the Unitholders on quarterly basis. Sasseur REIT’s distribution policy is to distribute 100% of distributable income for the financial year from 1 January 2019 to 31 December 2019. Thereafter, Sasseur REIT will distribute at least 90.0% of its annual distributable income for each subsequent financial year. The actual level of distribution will be determined at the discretion of the Board of Directors of the Manager. Summary of Sasseur REIT Group Results 4Q 2019 vs 4Q 2018 and FY 2019 vs 28 March 2018 (Listing Date) to 31 December 2018 (1)
4Q 2019
S$’000
4Q 2018
S$’000
Change
%
FY 2019
S$’000
28 Mar 2018 to 31 Dec 2018 (2)
S$’000
Change (3)
%
EMA rental income 28,172 30,948 (9.0) 118,015 93,525 n.m.
EMA rental income (exclude straight-line adjustment)
31,470 31,192 0.9 122,060 89,872 n.m.
Income available for distribution to Unitholders
19,495 23,591 (17.4) 77,926 60,530 n.m.
Distribution per unit (“DPU”) (cents) (4)
1.629 1.999 (18.5) 6.533 5.128 n.m.
Annualised distribution yield (%)
- Based on IPO listing price of S$0.800
8.1% (5) 9.9% (6) (18.5) 8.2% 8.4% (6) n.m.
- Based on 4Q 2019 closing price of S$0.885
7.3% (5) 9.0% (6) (18.5) 7.4% 7.6% (6) n.m.
n.m. – Not meaningful
Notes: (1) The average SGD:RMB rates are as follows:
4Q 2019 4Q 2018 Change %
FY 2019 28 Mar 2018 to 31 Dec 2018
Change %
5.1675 5.033 2.7% 5.0600 4.948 2.3%
The financial results of 4Q 2019 were impacted by the depreciation of RMB against SGD by about 2.7% as compared to 4Q 2018.
(2) The FY comparative figures were for the period from 28 March 2018 (Listing Date) to 31 December 2018. These figures were extracted from Sasseur REIT’s results announcement for the financial period from 28 March 2018 to 31 December 2018.
(3) The actual results of FY 2018 covered the period from 28 March 2018 to 31 December 2018 (279 days),
whereas FY 2019 period was from 1 January 2019 to 31 December 2019 (365 days). Accordingly, since FY 2019 period is 86 days more than the FY 2018 period, the reporting periods are not comparable and variance analysis is not meaningful. Please refer to Section 9 for variance analysis of the actual results for 4Q 2019 and FY 2019 compared with the projections as disclosed in Sasseur REIT Prospectus dated 21 March 2018 (the “Prospectus”).
(4) The distribution per unit of 1.629 Singapore cents is equivalent to 8.418 Renminbi cents for 4Q 2019 (4Q
2018: 10.061 Renminbi cents) and 6.533 Singapore cents is equivalent to 33.057 Renminbi cents for FY 2019 (FY 2018: 25.373 Renminbi cents).
(5) The annualised distribution yield for 4Q 2019 was on a pro-rata basis for 92 days, based on the listing price
of S$0.800 and closing price of S$0.885.
(6) The annualised distribution yields for 4Q 2018 and the period from 28 March 2018 to 31 December 2018 were on a pro-rata basis for 92 days and 279 days, based on the listing price of S$0.800 and closing price of S$0.885.
SASSEUR REAL ESTATE INVESTMENT TRUST Unaudited Financial Statements and Distribution Announcement For the Fourth Quarter and Financial Year Ended 31 December 2019
___________________________________________________________________________
Page 4 of 23
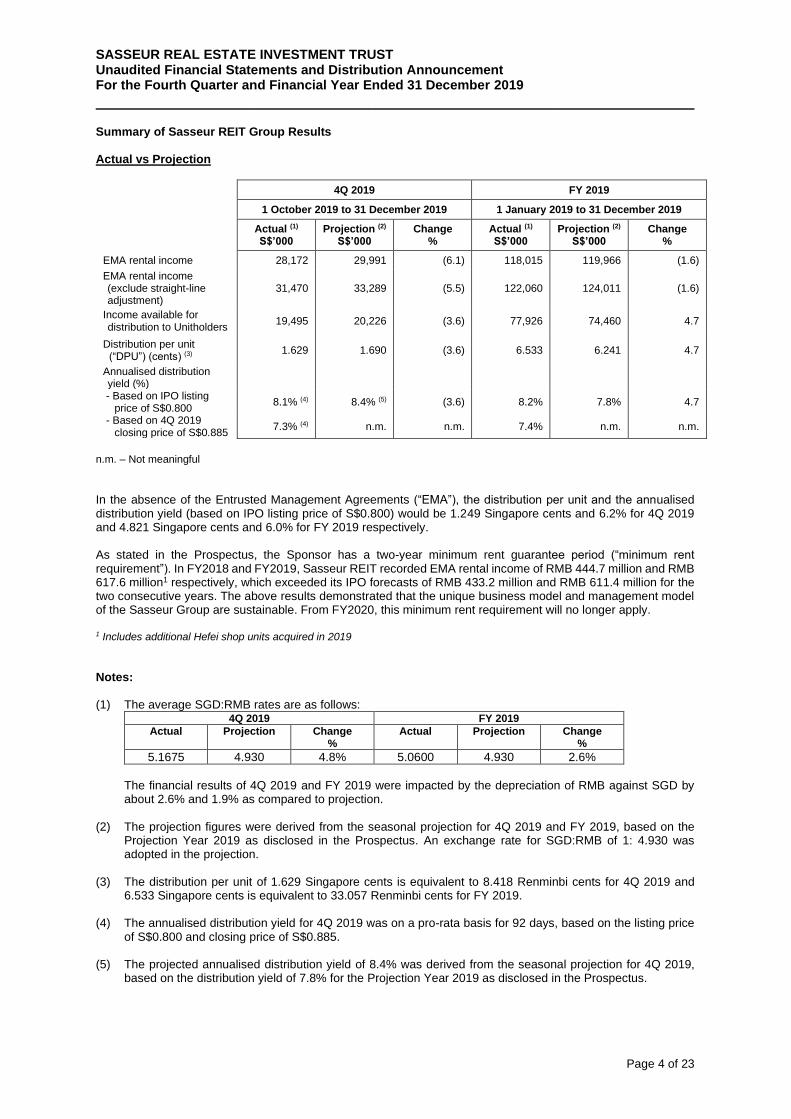
Summary of Sasseur REIT Group Results Actual vs Projection
4Q 2019 FY 2019
1 October 2019 to 31 December 2019 1 January 2019 to 31 December 2019
Actual (1) S$’000
Projection (2)
S$’000 Change
% Actual (1)
S$’000 Projection (2)
S$’000 Change
%
EMA rental income 28,172 29,991 (6.1) 118,015 119,966 (1.6)
EMA rental income (exclude straight-line adjustment)
31,470 33,289 (5.5) 122,060 124,011 (1.6)
Income available for distribution to Unitholders
19,495 20,226 (3.6) 77,926 74,460 4.7
Distribution per unit (“DPU”) (cents) (3)
1.629 1.690 (3.6) 6.533 6.241 4.7
Annualised distribution yield (%)
- Based on IPO listing price of S$0.800
8.1% (4) 8.4% (5) (3.6) 8.2% 7.8% 4.7
- Based on 4Q 2019 closing price of S$0.885
7.3% (4) n.m. n.m. 7.4% n.m. n.m.
n.m. – Not meaningful
In the absence of the Entrusted Management Agreements (“EMA”), the distribution per unit and the annualised distribution yield (based on IPO listing price of S$0.800) would be 1.249 Singapore cents and 6.2% for 4Q 2019 and 4.821 Singapore cents and 6.0% for FY 2019 respectively. As stated in the Prospectus, the Sponsor has a two-year minimum rent guarantee period (“minimum rent requirement”). In FY2018 and FY2019, Sasseur REIT recorded EMA rental income of RMB 444.7 million and RMB 617.6 million1 respectively, which exceeded its IPO forecasts of RMB 433.2 million and RMB 611.4 million for the two consecutive years. The above results demonstrated that the unique business model and management model of the Sasseur Group are sustainable. From FY2020, this minimum rent requirement will no longer apply. 1 Includes additional Hefei shop units acquired in 2019
Notes: (1) The average SGD:RMB rates are as follows:
4Q 2019 FY 2019
Actual Projection Change %
Actual Projection Change %
5.1675 4.930 4.8% 5.0600 4.930 2.6%
The financial results of 4Q 2019 and FY 2019 were impacted by the depreciation of RMB against SGD by about 2.6% and 1.9% as compared to projection.
(2) The projection figures were derived from the seasonal projection for 4Q 2019 and FY 2019, based on the Projection Year 2019 as disclosed in the Prospectus. An exchange rate for SGD:RMB of 1: 4.930 was adopted in the projection.
(3) The distribution per unit of 1.629 Singapore cents is equivalent to 8.418 Renminbi cents for 4Q 2019 and
6.533 Singapore cents is equivalent to 33.057 Renminbi cents for FY 2019.
(4) The annualised distribution yield for 4Q 2019 was on a pro-rata basis for 92 days, based on the listing price of S$0.800 and closing price of S$0.885.
(5) The projected annualised distribution yield of 8.4% was derived from the seasonal projection for 4Q 2019,
based on the distribution yield of 7.8% for the Projection Year 2019 as disclosed in the Prospectus.
SASSEUR REAL ESTATE INVESTMENT TRUST Unaudited Financial Statements and Distribution Announcement For the Fourth Quarter and Financial Year Ended 31 December 2019
___________________________________________________________________________
Page 5 of 23
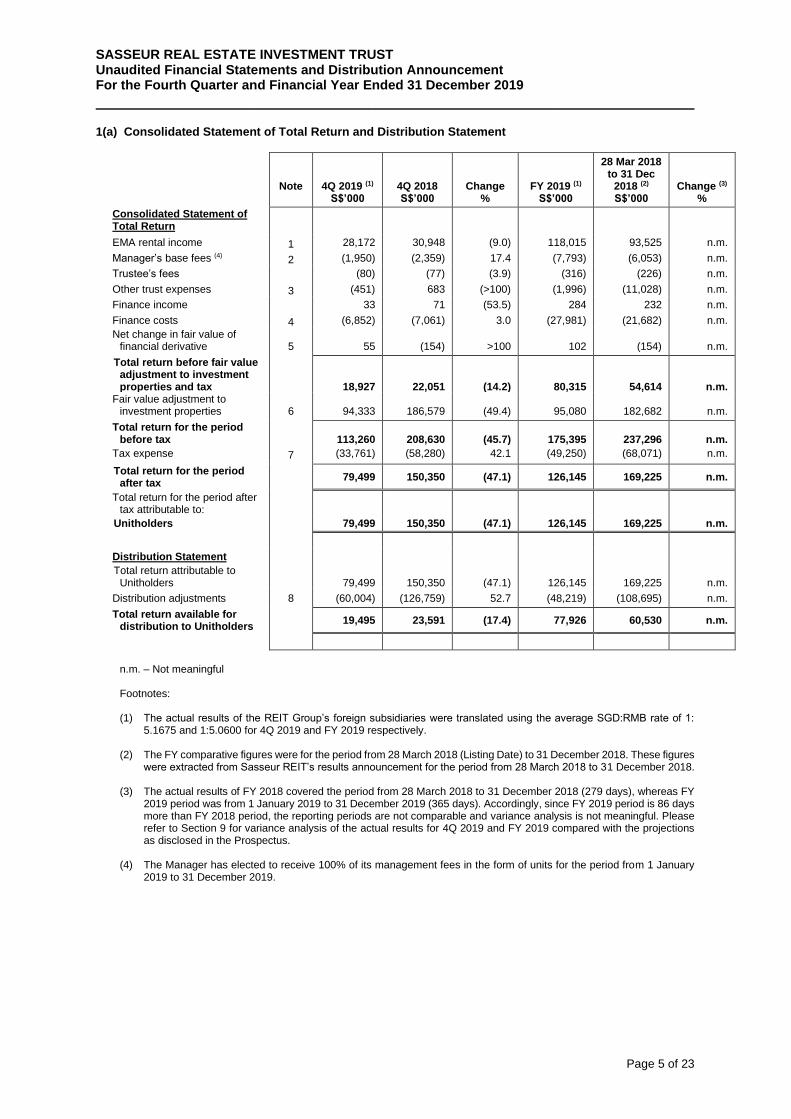
1(a) Consolidated Statement of Total Return and Distribution Statement
Note
4Q 2019 (1)
S$’000
4Q 2018
S$’000
Change %
FY 2019 (1)
S$’000
28 Mar 2018 to 31 Dec
2018 (2)
S$’000
Change (3) %
Consolidated Statement of Total Return
EMA rental income 1 28,172 30,948 (9.0) 118,015 93,525 n.m.
Manager’s base fees (4) 2 (1,950) (2,359) 17.4 (7,793) (6,053) n.m.
Trustee’s fees (80) (77) (3.9) (316) (226) n.m.
Other trust expenses 3 (451) 683 (>100) (1,996) (11,028) n.m.
Finance income 33 71 (53.5) 284 232 n.m.
Finance costs 4 (6,852) (7,061) 3.0 (27,981) (21,682) n.m.
Net change in fair value of financial derivative 5 55 (154) >100 102 (154) n.m.
Total return before fair value adjustment to investment properties and tax 18,927 22,051 (14.2) 80,315 54,614 n.m.
Fair value adjustment to investment properties
6 94,333 186,579 (49.4) 95,080 182,682 n.m.
Total return for the period before tax 113,260 208,630 (45.7) 175,395 237,296 n.m.
Tax expense 7 (33,761) (58,280) 42.1 (49,250) (68,071) n.m.
Total return for the period after tax
79,499 150,350 (47.1) 126,145 169,225 n.m.
Total return for the period after tax attributable to:
Unitholders 79,499 150,350 (47.1) 126,145 169,225 n.m.
Distribution Statement Total return attributable to
Unitholders 79,499 150,350 (47.1) 126,145 169,225 n.m.
Distribution adjustments 8 (60,004) (126,759) 52.7 (48,219) (108,695) n.m. Total return available for
distribution to Unitholders 19,495 23,591 (17.4) 77,926 60,530 n.m.
n.m. – Not meaningful
Footnotes:
(1) The actual results of the REIT Group’s foreign subsidiaries were translated using the average SGD:RMB rate of 1:
5.1675 and 1:5.0600 for 4Q 2019 and FY 2019 respectively.
(2) The FY comparative figures were for the period from 28 March 2018 (Listing Date) to 31 December 2018. These figures were extracted from Sasseur REIT’s results announcement for the period from 28 March 2018 to 31 December 2018.
(3) The actual results of FY 2018 covered the period from 28 March 2018 to 31 December 2018 (279 days), whereas FY
2019 period was from 1 January 2019 to 31 December 2019 (365 days). Accordingly, since FY 2019 period is 86 days more than FY 2018 period, the reporting periods are not comparable and variance analysis is not meaningful. Please refer to Section 9 for variance analysis of the actual results for 4Q 2019 and FY 2019 compared with the projections as disclosed in the Prospectus.
(4) The Manager has elected to receive 100% of its management fees in the form of units for the period from 1 January
2019 to 31 December 2019.
SASSEUR REAL ESTATE INVESTMENT TRUST Unaudited Financial Statements and Distribution Announcement For the Fourth Quarter and Financial Year Ended 31 December 2019
___________________________________________________________________________
Page 6 of 23
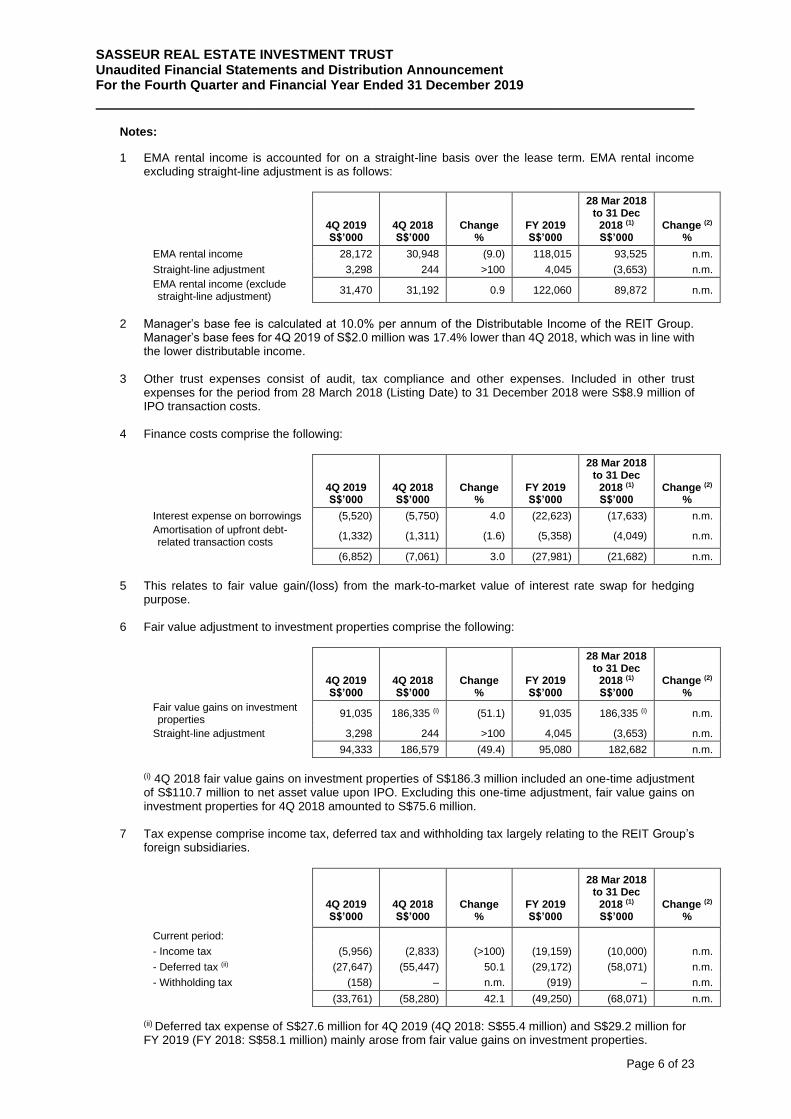
Notes:
1 EMA rental income is accounted for on a straight-line basis over the lease term. EMA rental income excluding straight-line adjustment is as follows:
4Q 2019 S$’000
4Q 2018 S$’000
Change
%
FY 2019 S$’000
28 Mar 2018 to 31 Dec
2018 (1) S$’000
Change (2)
%
EMA rental income 28,172 30,948 (9.0) 118,015 93,525 n.m.
Straight-line adjustment 3,298 244 >100 4,045 (3,653) n.m.
EMA rental income (exclude straight-line adjustment)
31,470 31,192 0.9 122,060 89,872 n.m.
2 Manager’s base fee is calculated at 10.0% per annum of the Distributable Income of the REIT Group.
Manager’s base fees for 4Q 2019 of S$2.0 million was 17.4% lower than 4Q 2018, which was in line with the lower distributable income.
3 Other trust expenses consist of audit, tax compliance and other expenses. Included in other trust expenses for the period from 28 March 2018 (Listing Date) to 31 December 2018 were S$8.9 million of IPO transaction costs.
4 Finance costs comprise the following:
4Q 2019 S$’000
4Q 2018 S$’000
Change %
FY 2019 S$’000
28 Mar 2018 to 31 Dec
2018 (1) S$’000
Change (2)
%
Interest expense on borrowings (5,520) (5,750) 4.0 (22,623) (17,633) n.m.
Amortisation of upfront debt-related transaction costs
(1,332) (1,311) (1.6) (5,358) (4,049) n.m.
(6,852) (7,061) 3.0 (27,981) (21,682) n.m.
5 This relates to fair value gain/(loss) from the mark-to-market value of interest rate swap for hedging
purpose.
6 Fair value adjustment to investment properties comprise the following:
4Q 2019 S$’000
4Q 2018 S$’000
Change %
FY 2019 S$’000
28 Mar 2018 to 31 Dec
2018 (1) S$’000
Change (2)
%
Fair value gains on investment properties
91,035 186,335 (i) (51.1) 91,035 186,335 (i) n.m.
Straight-line adjustment 3,298 244 >100 4,045 (3,653) n.m.
94,333 186,579 (49.4) 95,080 182,682 n.m.
(i) 4Q 2018 fair value gains on investment properties of S$186.3 million included an one-time adjustment of S$110.7 million to net asset value upon IPO. Excluding this one-time adjustment, fair value gains on investment properties for 4Q 2018 amounted to S$75.6 million.
7 Tax expense comprise income tax, deferred tax and withholding tax largely relating to the REIT Group’s foreign subsidiaries.
4Q 2019 S$’000
4Q 2018 S$’000
Change %
FY 2019 S$’000
28 Mar 2018 to 31 Dec
2018 (1) S$’000
Change (2)
%
Current period:
- Income tax (5,956) (2,833) (>100) (19,159) (10,000) n.m.
- Deferred tax (ii) (27,647) (55,447) 50.1 (29,172) (58,071) n.m.
- Withholding tax (158) – n.m. (919) – n.m.
(33,761) (58,280) 42.1 (49,250) (68,071) n.m.
(ii) Deferred tax expense of S$27.6 million for 4Q 2019 (4Q 2018: S$55.4 million) and S$29.2 million for FY 2019 (FY 2018: S$58.1 million) mainly arose from fair value gains on investment properties.
SASSEUR REAL ESTATE INVESTMENT TRUST Unaudited Financial Statements and Distribution Announcement For the Fourth Quarter and Financial Year Ended 31 December 2019
___________________________________________________________________________
Page 7 of 23
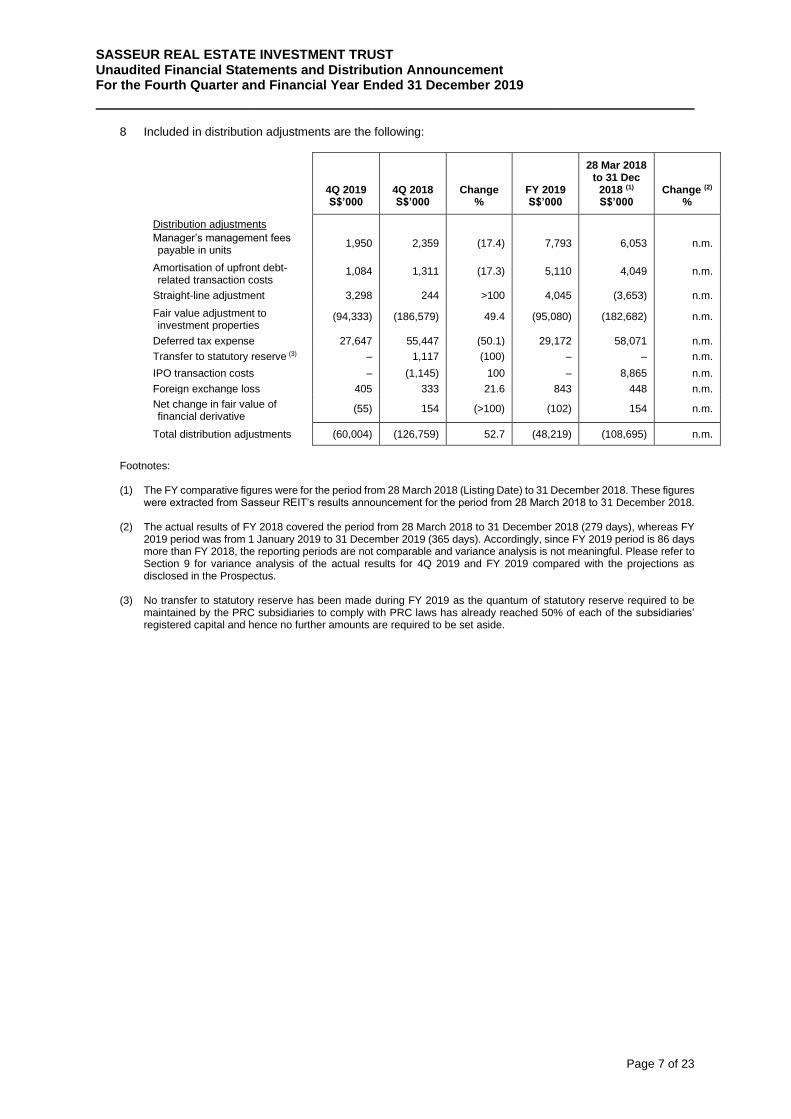
8 Included in distribution adjustments are the following:
4Q 2019 S$’000
4Q 2018 S$’000
Change %
FY 2019 S$’000
28 Mar 2018 to 31 Dec
2018 (1) S$’000
Change (2)
%
Distribution adjustments
Manager’s management fees payable in units
1,950 2,359 (17.4) 7,793 6,053 n.m.
Amortisation of upfront debt-related transaction costs
1,084 1,311 (17.3) 5,110 4,049 n.m.
Straight-line adjustment 3,298 244 >100 4,045 (3,653) n.m.
Fair value adjustment to investment properties
(94,333) (186,579) 49.4 (95,080) (182,682) n.m.
Deferred tax expense 27,647 55,447 (50.1) 29,172 58,071 n.m.
Transfer to statutory reserve (3) – 1,117 (100) – – n.m.
IPO transaction costs – (1,145) 100 – 8,865 n.m.
Foreign exchange loss 405 333 21.6 843 448 n.m.
Net change in fair value of financial derivative
(55) 154 (>100) (102) 154 n.m.
Total distribution adjustments (60,004) (126,759) 52.7 (48,219) (108,695) n.m.
Footnotes: (1) The FY comparative figures were for the period from 28 March 2018 (Listing Date) to 31 December 2018. These figures
were extracted from Sasseur REIT’s results announcement for the period from 28 March 2018 to 31 December 2018.
(2) The actual results of FY 2018 covered the period from 28 March 2018 to 31 December 2018 (279 days), whereas FY 2019 period was from 1 January 2019 to 31 December 2019 (365 days). Accordingly, since FY 2019 period is 86 days more than FY 2018, the reporting periods are not comparable and variance analysis is not meaningful. Please refer to Section 9 for variance analysis of the actual results for 4Q 2019 and FY 2019 compared with the projections as disclosed in the Prospectus.
(3) No transfer to statutory reserve has been made during FY 2019 as the quantum of statutory reserve required to be maintained by the PRC subsidiaries to comply with PRC laws has already reached 50% of each of the subsidiaries’ registered capital and hence no further amounts are required to be set aside.
SASSEUR REAL ESTATE INVESTMENT TRUST Unaudited Financial Statements and Distribution Announcement For the Fourth Quarter and Financial Year Ended 31 December 2019
___________________________________________________________________________
Page 8 of 23
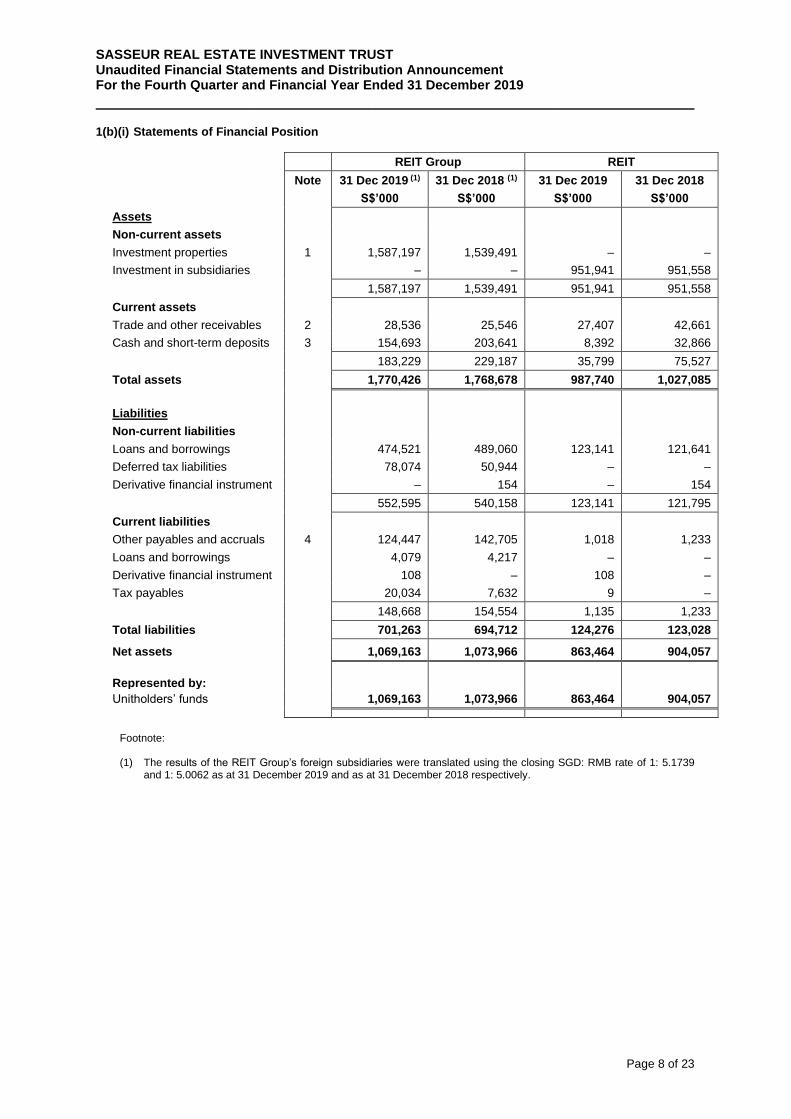
1(b)(i) Statements of Financial Position
REIT Group REIT
Note 31 Dec 2019 (1) 31 Dec 2018 (1) 31 Dec 2019 31 Dec 2018
S$’000 S$’000 S$’000 S$’000
Assets
Non-current assets
Investment properties 1 1,587,197 1,539,491 – –
Investment in subsidiaries – – 951,941 951,558
1,587,197 1,539,491 951,941 951,558
Current assets
Trade and other receivables 2 28,536 25,546 27,407 42,661
Cash and short-term deposits 3 154,693 203,641 8,392 32,866
183,229 229,187 35,799 75,527
Total assets 1,770,426 1,768,678 987,740 1,027,085
Liabilities
Non-current liabilities
Loans and borrowings 474,521 489,060 123,141 121,641
Deferred tax liabilities 78,074 50,944 – –
Derivative financial instrument – 154 – 154
552,595 540,158 123,141 121,795
Current liabilities
Other payables and accruals 4 124,447 142,705 1,018 1,233
Loans and borrowings 4,079 4,217 – –
Derivative financial instrument 108 – 108 –
Tax payables 20,034 7,632 9 –
148,668 154,554 1,135 1,233
Total liabilities 701,263 694,712 124,276 123,028
Net assets 1,069,163 1,073,966 863,464 904,057
Represented by:
Unitholders’ funds 1,069,163 1,073,966 863,464 904,057
Footnote:
(1) The results of the REIT Group’s foreign subsidiaries were translated using the closing SGD: RMB rate of 1: 5.1739
and 1: 5.0062 as at 31 December 2019 and as at 31 December 2018 respectively.
SASSEUR REAL ESTATE INVESTMENT TRUST Unaudited Financial Statements and Distribution Announcement For the Fourth Quarter and Financial Year Ended 31 December 2019
___________________________________________________________________________
Page 9 of 23
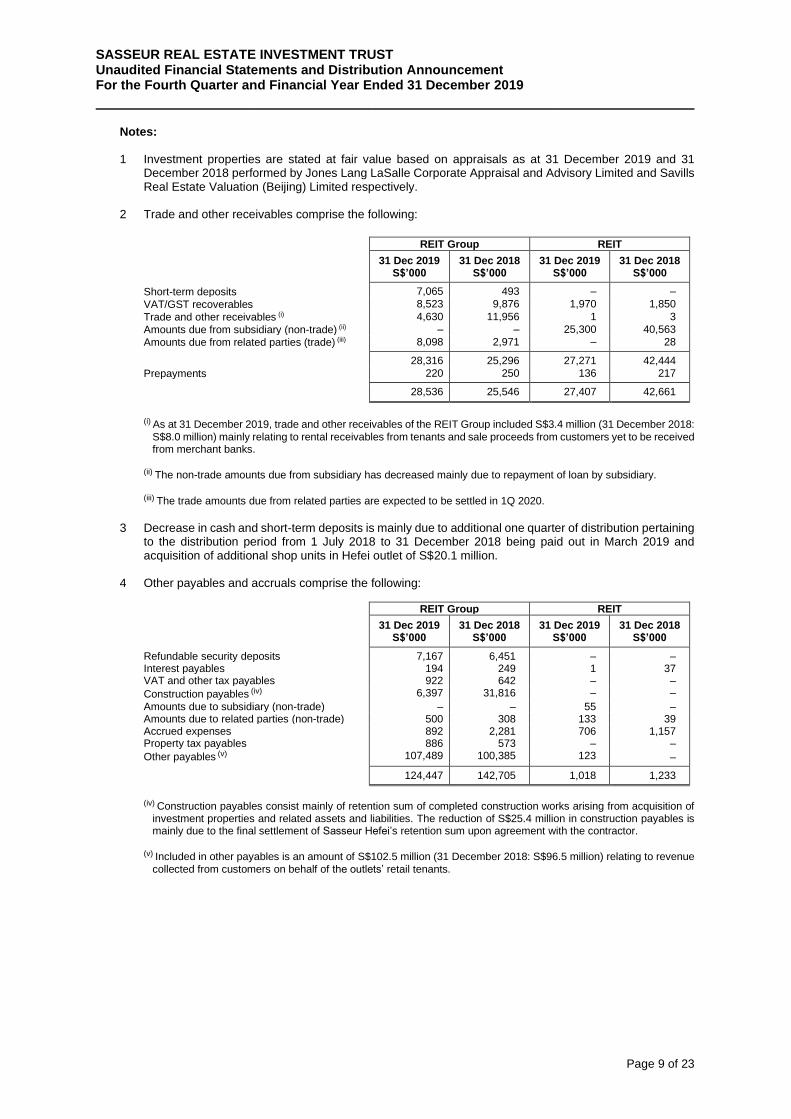
Notes: 1 Investment properties are stated at fair value based on appraisals as at 31 December 2019 and 31
December 2018 performed by Jones Lang LaSalle Corporate Appraisal and Advisory Limited and Savills Real Estate Valuation (Beijing) Limited respectively.
2 Trade and other receivables comprise the following:
REIT Group REIT
31 Dec 2019 S$’000
31 Dec 2018 S$’000
31 Dec 2019 S$’000
31 Dec 2018 S$’000
Short-term deposits 7,065 493 – –
VAT/GST recoverables 8,523 9,876 1,970 1,850
Trade and other receivables (i) 4,630 11,956 1 3
Amounts due from subsidiary (non-trade) (ii) – – 25,300 40,563
Amounts due from related parties (trade) (iii) 8,098 2,971 – 28
28,316 25,296 27,271 42,444
Prepayments 220 250 136 217
28,536 25,546 27,407 42,661
(i) As at 31 December 2019, trade and other receivables of the REIT Group included S$3.4 million (31 December 2018:
S$8.0 million) mainly relating to rental receivables from tenants and sale proceeds from customers yet to be received from merchant banks.
(ii) The non-trade amounts due from subsidiary has decreased mainly due to repayment of loan by subsidiary.
(iii) The trade amounts due from related parties are expected to be settled in 1Q 2020.
3 Decrease in cash and short-term deposits is mainly due to additional one quarter of distribution pertaining
to the distribution period from 1 July 2018 to 31 December 2018 being paid out in March 2019 and acquisition of additional shop units in Hefei outlet of S$20.1 million.
4 Other payables and accruals comprise the following:
REIT Group REIT
31 Dec 2019 S$’000
31 Dec 2018 S$’000
31 Dec 2019 S$’000
31 Dec 2018 S$’000
Refundable security deposits 7,167 6,451 – – Interest payables 194 249 1 37 VAT and other tax payables 922 642 – –
Construction payables (iv) 6,397 31,816 – –
Amounts due to subsidiary (non-trade) – – 55 – Amounts due to related parties (non-trade) 500 308 133 39 Accrued expenses 892 2,281 706 1,157 Property tax payables 886 573 – –
Other payables (v) 107,489 100,385 123 – 124,447 142,705 1,018 1,233 (iv) Construction payables consist mainly of retention sum of completed construction works arising from acquisition of
investment properties and related assets and liabilities. The reduction of S$25.4 million in construction payables is mainly due to the final settlement of Sasseur Hefei’s retention sum upon agreement with the contractor.
(v) Included in other payables is an amount of S$102.5 million (31 December 2018: S$96.5 million) relating to revenue
collected from customers on behalf of the outlets’ retail tenants.
SASSEUR REAL ESTATE INVESTMENT TRUST Unaudited Financial Statements and Distribution Announcement For the Fourth Quarter and Financial Year Ended 31 December 2019
___________________________________________________________________________
Page 10 of 23
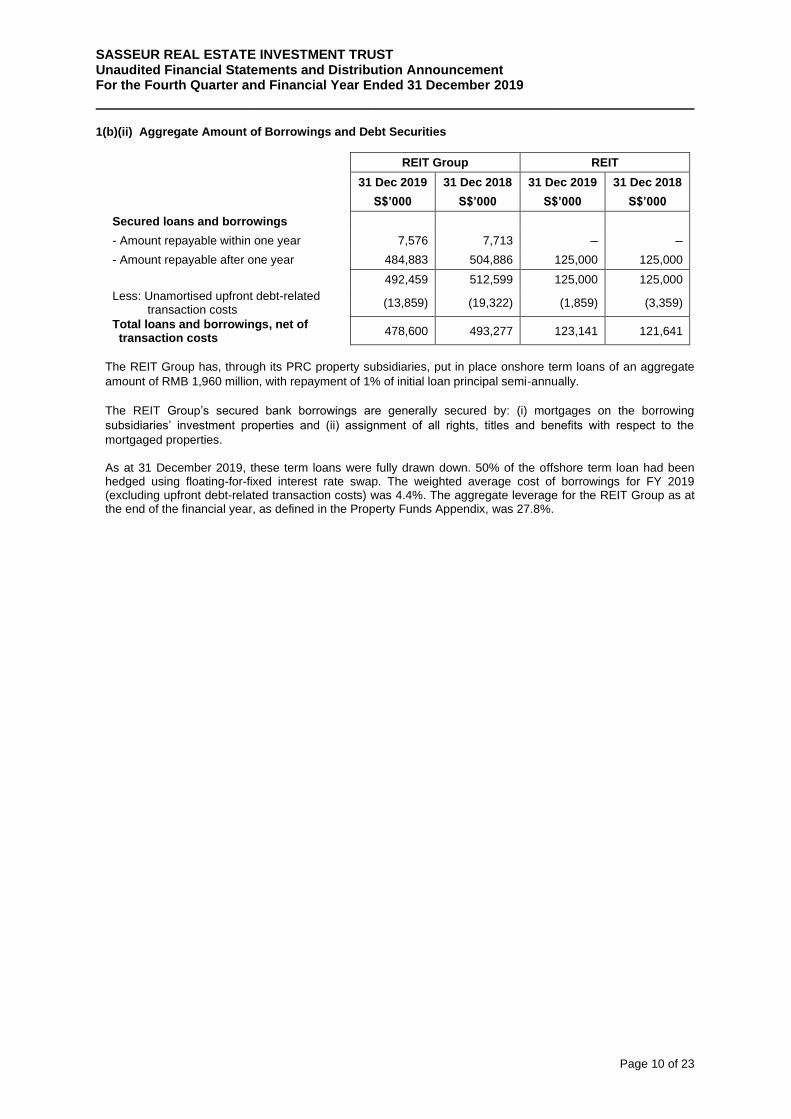
1(b)(ii) Aggregate Amount of Borrowings and Debt Securities
REIT Group REIT
31 Dec 2019 31 Dec 2018 31 Dec 2019 31 Dec 2018
S$’000 S$’000 S$’000 S$’000
Secured loans and borrowings
- Amount repayable within one year 7,576 7,713 – –
- Amount repayable after one year 484,883 504,886 125,000 125,000
492,459 512,599 125,000 125,000
Less: Unamortised upfront debt-related transaction costs
(13,859) (19,322) (1,859) (3,359)
Total loans and borrowings, net of transaction costs
478,600 493,277 123,141 121,641
The REIT Group has, through its PRC property subsidiaries, put in place onshore term loans of an aggregate
amount of RMB 1,960 million, with repayment of 1% of initial loan principal semi-annually.
The REIT Group’s secured bank borrowings are generally secured by: (i) mortgages on the borrowing
subsidiaries’ investment properties and (ii) assignment of all rights, titles and benefits with respect to the
mortgaged properties.
As at 31 December 2019, these term loans were fully drawn down. 50% of the offshore term loan had been hedged using floating-for-fixed interest rate swap. The weighted average cost of borrowings for FY 2019 (excluding upfront debt-related transaction costs) was 4.4%. The aggregate leverage for the REIT Group as at the end of the financial year, as defined in the Property Funds Appendix, was 27.8%.
SASSEUR REAL ESTATE INVESTMENT TRUST Unaudited Financial Statements and Distribution Announcement For the Fourth Quarter and Financial Year Ended 31 December 2019
___________________________________________________________________________
Page 11 of 23
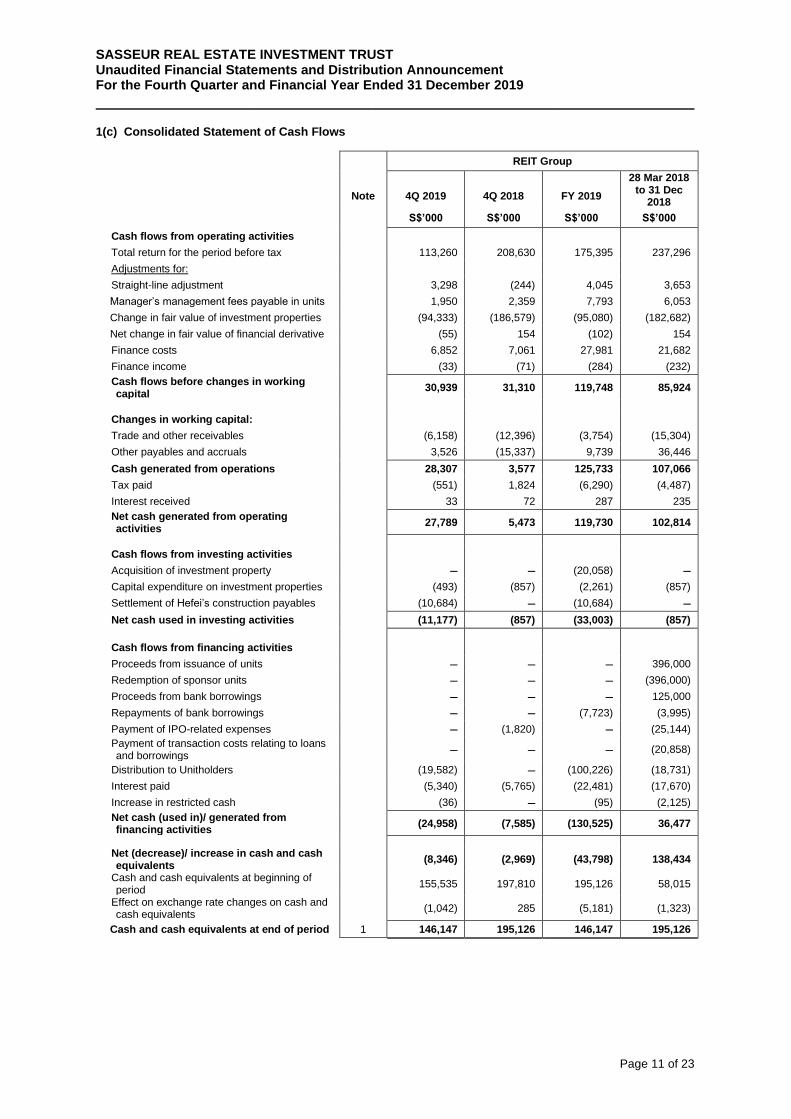
1(c) Consolidated Statement of Cash Flows
REIT Group
Note
4Q 2019
4Q 2018
FY 2019
28 Mar 2018 to 31 Dec
2018
S$’000 S$’000 S$’000 S$’000
Cash flows from operating activities
Total return for the period before tax 113,260 208,630 175,395 237,296
Adjustments for:
Straight-line adjustment 3,298 (244) 4,045 3,653
Manager’s management fees payable in units 1,950 2,359 7,793 6,053
Change in fair value of investment properties (94,333) (186,579) (95,080) (182,682)
Net change in fair value of financial derivative (55) 154 (102) 154
Finance costs 6,852 7,061 27,981 21,682
Finance income (33) (71) (284) (232)
Cash flows before changes in working capital
30,939 31,310 119,748 85,924
Changes in working capital:
Trade and other receivables (6,158) (12,396) (3,754) (15,304)
Other payables and accruals 3,526 (15,337) 9,739 36,446
Cash generated from operations 28,307 3,577 125,733 107,066
Tax paid (551) 1,824 (6,290) (4,487)
Interest received 33 72 287 235
Net cash generated from operating activities
27,789 5,473 119,730 102,814
Cash flows from investing activities
Acquisition of investment property – – (20,058) – Capital expenditure on investment properties (493) (857) (2,261) (857)
Settlement of Hefei’s construction payables (10,684) – (10,684) –
Net cash used in investing activities (11,177) (857) (33,003) (857)
Cash flows from financing activities
Proceeds from issuance of units – – – 396,000
Redemption of sponsor units – – – (396,000)
Proceeds from bank borrowings – – – 125,000
Repayments of bank borrowings – – (7,723) (3,995)
Payment of IPO-related expenses – (1,820) – (25,144)
Payment of transaction costs relating to loans and borrowings
– – – (20,858)
Distribution to Unitholders (19,582) – (100,226) (18,731)
Interest paid (5,340) (5,765) (22,481) (17,670)
Increase in restricted cash (36) – (95) (2,125)
Net cash (used in)/ generated from financing activities
(24,958) (7,585) (130,525) 36,477
Net (decrease)/ increase in cash and cash equivalents
(8,346) (2,969) (43,798) 138,434
Cash and cash equivalents at beginning of period
155,535 197,810 195,126 58,015
Effect on exchange rate changes on cash and cash equivalents
(1,042) 285 (5,181) (1,323)
Cash and cash equivalents at end of period 1 146,147 195,126 146,147 195,126
SASSEUR REAL ESTATE INVESTMENT TRUST Unaudited Financial Statements and Distribution Announcement For the Fourth Quarter and Financial Year Ended 31 December 2019
___________________________________________________________________________
Page 12 of 23
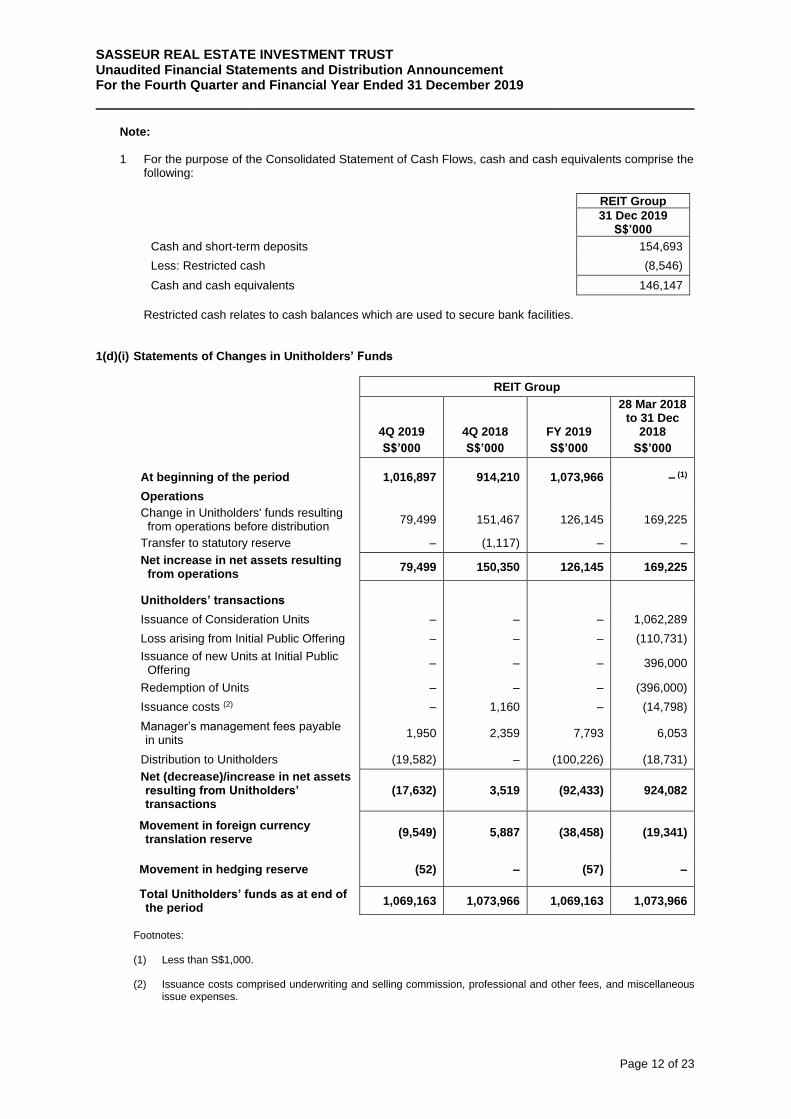
Note:
1 For the purpose of the Consolidated Statement of Cash Flows, cash and cash equivalents comprise the
following:
REIT Group
31 Dec 2019 S$’000
Cash and short-term deposits 154,693
Less: Restricted cash (8,546)
Cash and cash equivalents 146,147
Restricted cash relates to cash balances which are used to secure bank facilities. 1(d)(i) Statements of Changes in Unitholders’ Funds
REIT Group
4Q 2019
4Q 2018
FY 2019
28 Mar 2018 to 31 Dec
2018
S$’000 S$’000 S$’000 S$’000
At beginning of the period 1,016,897 914,210 1,073,966 – (1)
Operations
Change in Unitholders' funds resulting from operations before distribution
79,499 151,467 126,145 169,225
Transfer to statutory reserve – (1,117) – –
Net increase in net assets resulting from operations
79,499 150,350 126,145 169,225
Unitholders’ transactions
Issuance of Consideration Units – – – 1,062,289
Loss arising from Initial Public Offering – – – (110,731)
Issuance of new Units at Initial Public Offering
– – – 396,000
Redemption of Units – – – (396,000)
Issuance costs (2) – 1,160 – (14,798)
Manager’s management fees payable in units
1,950 2,359 7,793 6,053
Distribution to Unitholders (19,582) – (100,226) (18,731)
Net (decrease)/increase in net assets resulting from Unitholders’ transactions
(17,632) 3,519 (92,433) 924,082
Movement in foreign currency translation reserve
(9,549) 5,887 (38,458) (19,341)
Movement in hedging reserve (52) – (57) –
Total Unitholders’ funds as at end of the period
1,069,163 1,073,966 1,069,163 1,073,966
Footnotes:
(1) Less than S$1,000. (2) Issuance costs comprised underwriting and selling commission, professional and other fees, and miscellaneous
issue expenses.
SASSEUR REAL ESTATE INVESTMENT TRUST Unaudited Financial Statements and Distribution Announcement For the Fourth Quarter and Financial Year Ended 31 December 2019
___________________________________________________________________________
Page 13 of 23
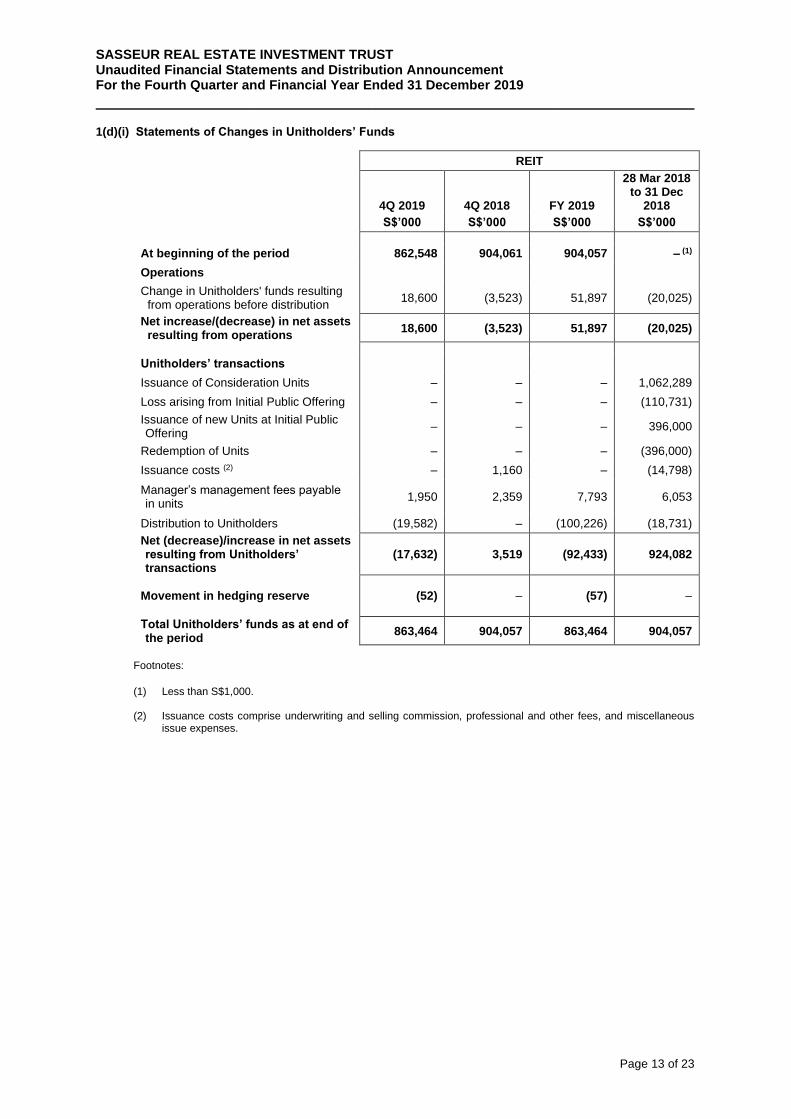
1(d)(i) Statements of Changes in Unitholders’ Funds
REIT
4Q 2019
4Q 2018
FY 2019
28 Mar 2018 to 31 Dec
2018
S$’000 S$’000 S$’000 S$’000
At beginning of the period 862,548 904,061 904,057 – (1)
Operations
Change in Unitholders' funds resulting from operations before distribution
18,600 (3,523) 51,897 (20,025)
Net increase/(decrease) in net assets resulting from operations
18,600 (3,523) 51,897 (20,025)
Unitholders’ transactions
Issuance of Consideration Units – – – 1,062,289
Loss arising from Initial Public Offering – – – (110,731)
Issuance of new Units at Initial Public Offering
– – – 396,000
Redemption of Units – – – (396,000)
Issuance costs (2) – 1,160 – (14,798)
Manager’s management fees payable in units
1,950 2,359 7,793 6,053
Distribution to Unitholders (19,582) – (100,226) (18,731)
Net (decrease)/increase in net assets resulting from Unitholders’ transactions
(17,632) 3,519 (92,433) 924,082
Movement in hedging reserve (52) – (57) –
Total Unitholders’ funds as at end of the period
863,464 904,057 863,464 904,057
Footnotes:
(1) Less than S$1,000. (2) Issuance costs comprise underwriting and selling commission, professional and other fees, and miscellaneous
issue expenses.
SASSEUR REAL ESTATE INVESTMENT TRUST Unaudited Financial Statements and Distribution Announcement For the Fourth Quarter and Financial Year Ended 31 December 2019
___________________________________________________________________________
Page 14 of 23
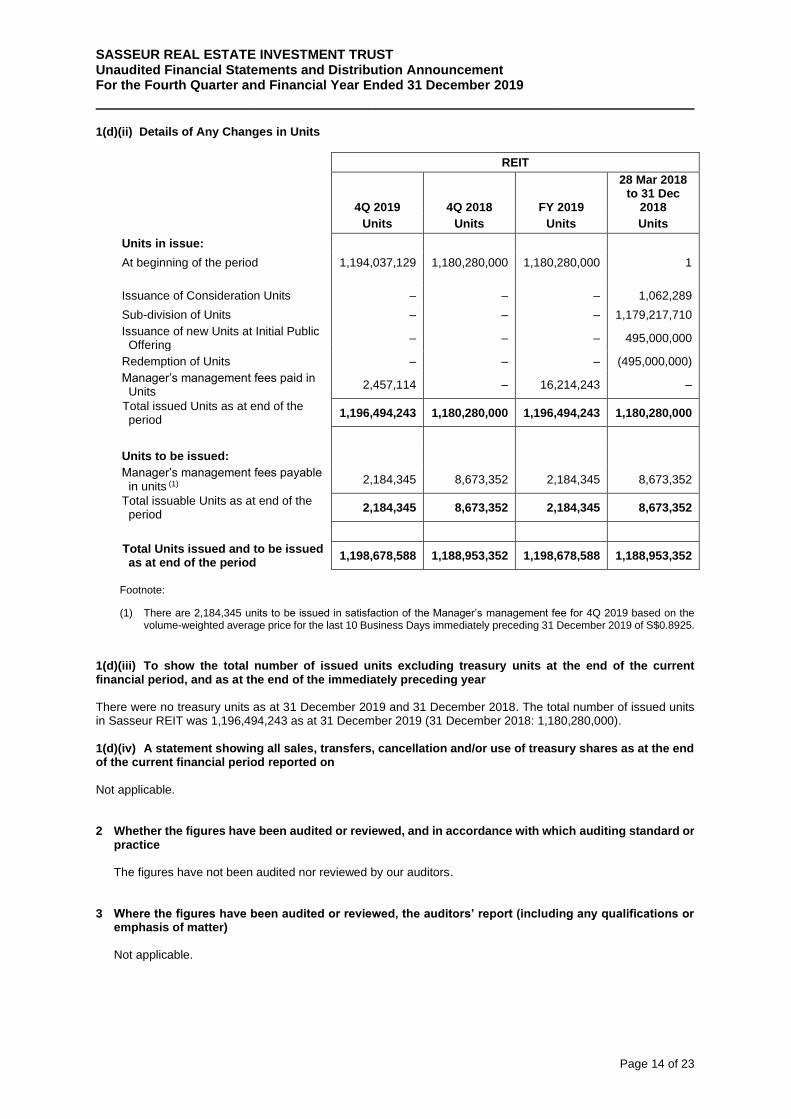
1(d)(ii) Details of Any Changes in Units
REIT
4Q 2019
4Q 2018
FY 2019
28 Mar 2018 to 31 Dec
2018
Units Units Units Units
Units in issue:
At beginning of the period 1,194,037,129 1,180,280,000 1,180,280,000 1
Issuance of Consideration Units – – – 1,062,289
Sub-division of Units – – – 1,179,217,710
Issuance of new Units at Initial Public Offering
– – – 495,000,000
Redemption of Units – – – (495,000,000)
Manager’s management fees paid in Units
2,457,114 – 16,214,243 –
Total issued Units as at end of the period
1,196,494,243 1,180,280,000 1,196,494,243 1,180,280,000
Units to be issued:
Manager’s management fees payable in units (1)
2,184,345 8,673,352 2,184,345 8,673,352
Total issuable Units as at end of the period
2,184,345 8,673,352 2,184,345 8,673,352
Total Units issued and to be issued as at end of the period
1,198,678,588 1,188,953,352 1,198,678,588 1,188,953,352
Footnote:
(1) There are 2,184,345 units to be issued in satisfaction of the Manager’s management fee for 4Q 2019 based on the volume-weighted average price for the last 10 Business Days immediately preceding 31 December 2019 of S$0.8925.
1(d)(iii) To show the total number of issued units excluding treasury units at the end of the current financial period, and as at the end of the immediately preceding year There were no treasury units as at 31 December 2019 and 31 December 2018. The total number of issued units in Sasseur REIT was 1,196,494,243 as at 31 December 2019 (31 December 2018: 1,180,280,000). 1(d)(iv) A statement showing all sales, transfers, cancellation and/or use of treasury shares as at the end of the current financial period reported on Not applicable. 2 Whether the figures have been audited or reviewed, and in accordance with which auditing standard or
practice
The figures have not been audited nor reviewed by our auditors. 3 Where the figures have been audited or reviewed, the auditors’ report (including any qualifications or
emphasis of matter)
Not applicable.
SASSEUR REAL ESTATE INVESTMENT TRUST Unaudited Financial Statements and Distribution Announcement For the Fourth Quarter and Financial Year Ended 31 December 2019
___________________________________________________________________________
Page 15 of 23
4 Whether the same accounting policies and methods of computation as in the issuer’s most recent
audited annual financial statements have been applied
Except as disclosed in paragraph 5 below, the REIT Group has applied the same accounting policies and methods of computation in the financial statements for the current financial period as those of the audited financial statements for the financial period ended 31 December 2018.
5 If there are any changes in the accounting policies and methods of computation, including any required
by an accounting standard, what had changed, as well as the reasons for, and the effect of, the change
The REIT Group has adopted the new Financial Reporting Standards (“FRSs”) and interpretations which are effective for application for the financial period beginning on 1 January 2019. The adoption of these new FRSs and interpretations has no significant impact on the financial statements of the REIT Group.
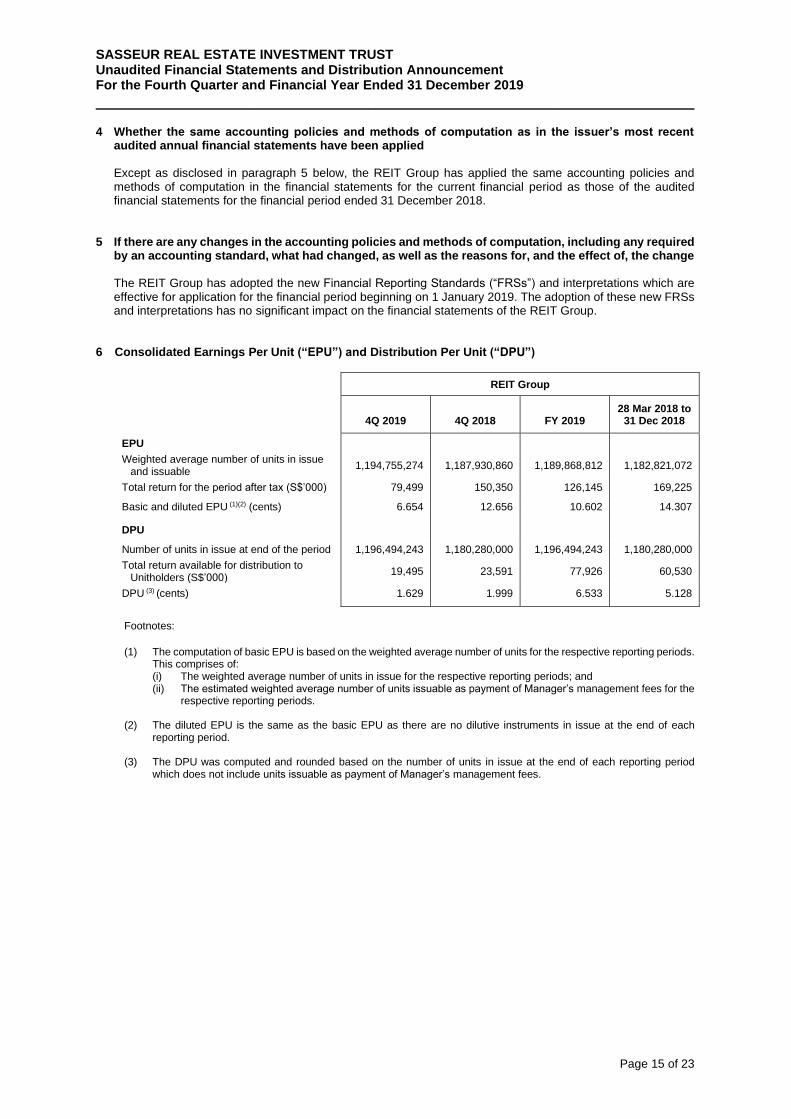
6 Consolidated Earnings Per Unit (“EPU”) and Distribution Per Unit (“DPU”)
REIT Group
4Q 2019
4Q 2018
FY 2019 28 Mar 2018 to
31 Dec 2018
EPU
Weighted average number of units in issue and issuable
1,194,755,274 1,187,930,860 1,189,868,812 1,182,821,072
Total return for the period after tax (S$’000) 79,499 150,350 126,145 169,225
Basic and diluted EPU (1)(2) (cents) 6.654 12.656 10.602 14.307
DPU
Number of units in issue at end of the period 1,196,494,243 1,180,280,000 1,196,494,243 1,180,280,000
Total return available for distribution to Unitholders (S$’000)
19,495 23,591 77,926 60,530
DPU (3) (cents) 1.629 1.999 6.533 5.128
Footnotes:
(1) The computation of basic EPU is based on the weighted average number of units for the respective reporting periods.
This comprises of: (i) The weighted average number of units in issue for the respective reporting periods; and (ii) The estimated weighted average number of units issuable as payment of Manager’s management fees for the
respective reporting periods. (2) The diluted EPU is the same as the basic EPU as there are no dilutive instruments in issue at the end of each
reporting period. (3) The DPU was computed and rounded based on the number of units in issue at the end of each reporting period
which does not include units issuable as payment of Manager’s management fees.
SASSEUR REAL ESTATE INVESTMENT TRUST Unaudited Financial Statements and Distribution Announcement For the Fourth Quarter and Financial Year Ended 31 December 2019
___________________________________________________________________________
Page 16 of 23
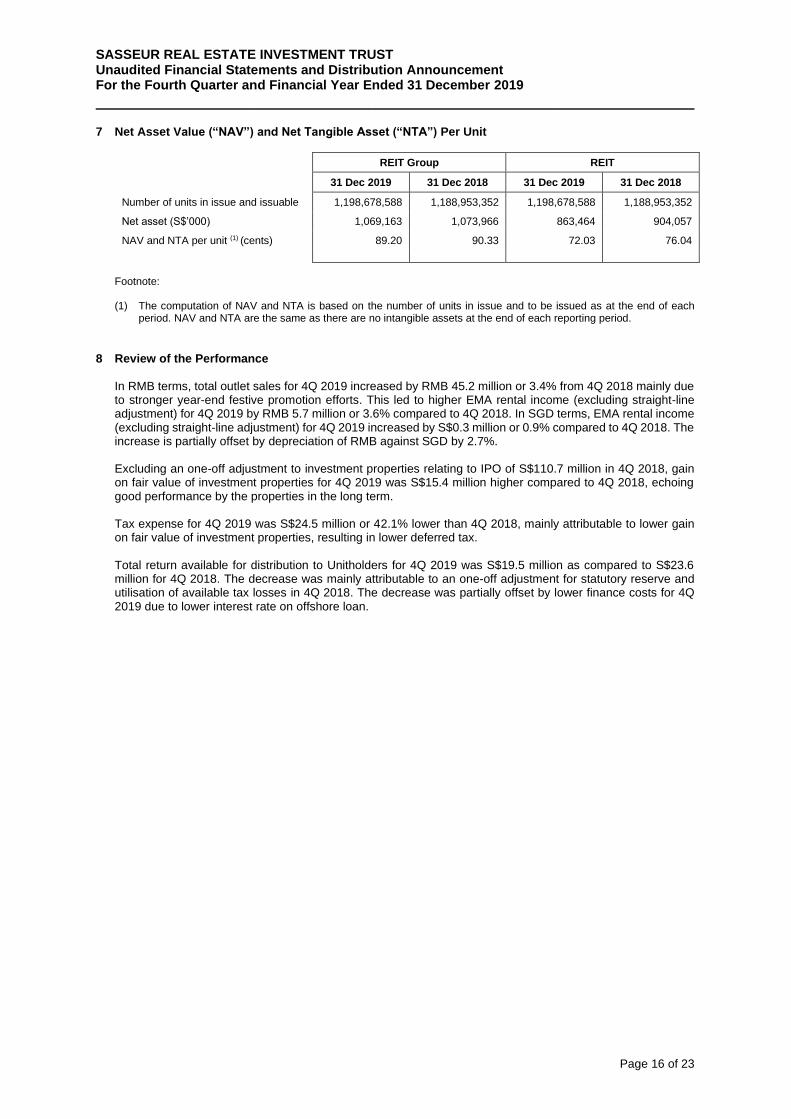
7 Net Asset Value (“NAV”) and Net Tangible Asset (“NTA”) Per Unit
REIT Group REIT
31 Dec 2019 31 Dec 2018 31 Dec 2019 31 Dec 2018
Number of units in issue and issuable 1,198,678,588 1,188,953,352 1,198,678,588 1,188,953,352
Net asset (S$’000) 1,069,163 1,073,966 863,464 904,057
NAV and NTA per unit (1) (cents) 89.20 90.33 72.03 76.04
Footnote:
(1) The computation of NAV and NTA is based on the number of units in issue and to be issued as at the end of each
period. NAV and NTA are the same as there are no intangible assets at the end of each reporting period. 8 Review of the Performance
In RMB terms, total outlet sales for 4Q 2019 increased by RMB 45.2 million or 3.4% from 4Q 2018 mainly due to stronger year-end festive promotion efforts. This led to higher EMA rental income (excluding straight-line adjustment) for 4Q 2019 by RMB 5.7 million or 3.6% compared to 4Q 2018. In SGD terms, EMA rental income (excluding straight-line adjustment) for 4Q 2019 increased by S$0.3 million or 0.9% compared to 4Q 2018. The increase is partially offset by depreciation of RMB against SGD by 2.7%. Excluding an one-off adjustment to investment properties relating to IPO of S$110.7 million in 4Q 2018, gain on fair value of investment properties for 4Q 2019 was S$15.4 million higher compared to 4Q 2018, echoing good performance by the properties in the long term. Tax expense for 4Q 2019 was S$24.5 million or 42.1% lower than 4Q 2018, mainly attributable to lower gain on fair value of investment properties, resulting in lower deferred tax. Total return available for distribution to Unitholders for 4Q 2019 was S$19.5 million as compared to S$23.6 million for 4Q 2018. The decrease was mainly attributable to an one-off adjustment for statutory reserve and utilisation of available tax losses in 4Q 2018. The decrease was partially offset by lower finance costs for 4Q 2019 due to lower interest rate on offshore loan.
SASSEUR REAL ESTATE INVESTMENT TRUST Unaudited Financial Statements and Distribution Announcement For the Fourth Quarter and Financial Year Ended 31 December 2019
___________________________________________________________________________
Page 17 of 23
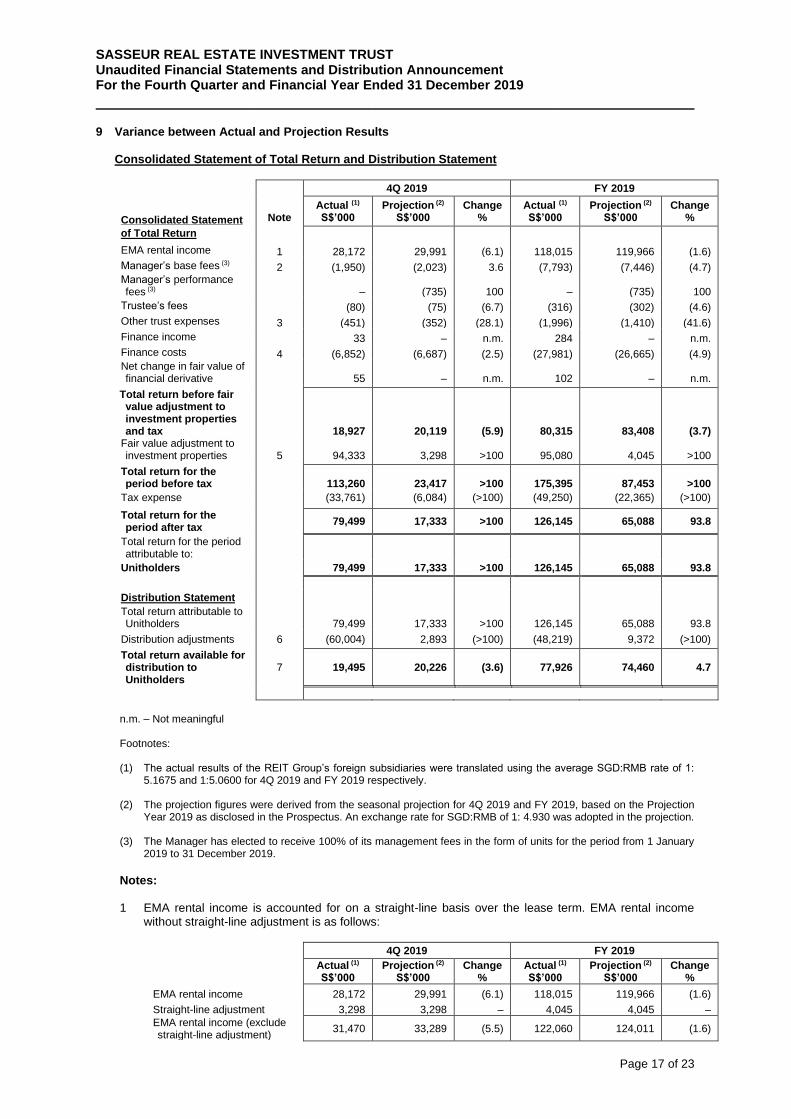
9 Variance between Actual and Projection Results
Consolidated Statement of Total Return and Distribution Statement
4Q 2019 FY 2019
Consolidated Statement
Note
Actual (1)
S$’000 Projection (2)
S$’000 Change
% Actual (1)
S$’000 Projection (2)
S$’000 Change
%
of Total Return
EMA rental income 1 28,172 29,991 (6.1) 118,015 119,966 (1.6)
Manager’s base fees (3) 2 (1,950) (2,023) 3.6 (7,793) (7,446) (4.7) Manager’s performance fees (3) – (735) 100 – (735) 100
Trustee’s fees (80) (75) (6.7) (316) (302) (4.6)
Other trust expenses 3 (451) (352) (28.1) (1,996) (1,410) (41.6)
Finance income 33 – n.m. 284 – n.m.
Finance costs 4 (6,852) (6,687) (2.5) (27,981) (26,665) (4.9) Net change in fair value of financial derivative 55 – n.m. 102 – n.m.
Total return before fair value adjustment to investment properties and tax 18,927 20,119 (5.9) 80,315 83,408 (3.7)
Fair value adjustment to investment properties
5 94,333 3,298 >100 95,080 4,045 >100
Total return for the period before tax 113,260 23,417 >100 175,395 87,453 >100
Tax expense (33,761) (6,084) (>100) (49,250) (22,365) (>100)
Total return for the period after tax
79,499 17,333 >100 126,145 65,088 93.8
Total return for the period attributable to:
Unitholders 79,499 17,333 >100 126,145 65,088 93.8
Distribution Statement Total return attributable to Unitholders 79,499 17,333 >100 126,145 65,088 93.8
Distribution adjustments 6 (60,004) 2,893 (>100) (48,219) 9,372 (>100) Total return available for distribution to Unitholders
7 19,495 20,226 (3.6) 77,926 74,460 4.7
n.m. – Not meaningful Footnotes:
(1) The actual results of the REIT Group’s foreign subsidiaries were translated using the average SGD:RMB rate of 1:
5.1675 and 1:5.0600 for 4Q 2019 and FY 2019 respectively. (2) The projection figures were derived from the seasonal projection for 4Q 2019 and FY 2019, based on the Projection
Year 2019 as disclosed in the Prospectus. An exchange rate for SGD:RMB of 1: 4.930 was adopted in the projection.
(3) The Manager has elected to receive 100% of its management fees in the form of units for the period from 1 January 2019 to 31 December 2019.
Notes: 1 EMA rental income is accounted for on a straight-line basis over the lease term. EMA rental income
without straight-line adjustment is as follows:
4Q 2019 FY 2019
Actual (1)
S$’000 Projection (2)
S$’000 Change
% Actual (1)
S$’000 Projection (2)
S$’000 Change
%
EMA rental income 28,172 29,991 (6.1) 118,015 119,966 (1.6)
Straight-line adjustment 3,298 3,298 – 4,045 4,045 –
EMA rental income (exclude straight-line adjustment)
31,470 33,289 (5.5) 122,060 124,011 (1.6)
SASSEUR REAL ESTATE INVESTMENT TRUST Unaudited Financial Statements and Distribution Announcement For the Fourth Quarter and Financial Year Ended 31 December 2019
___________________________________________________________________________
Page 18 of 23
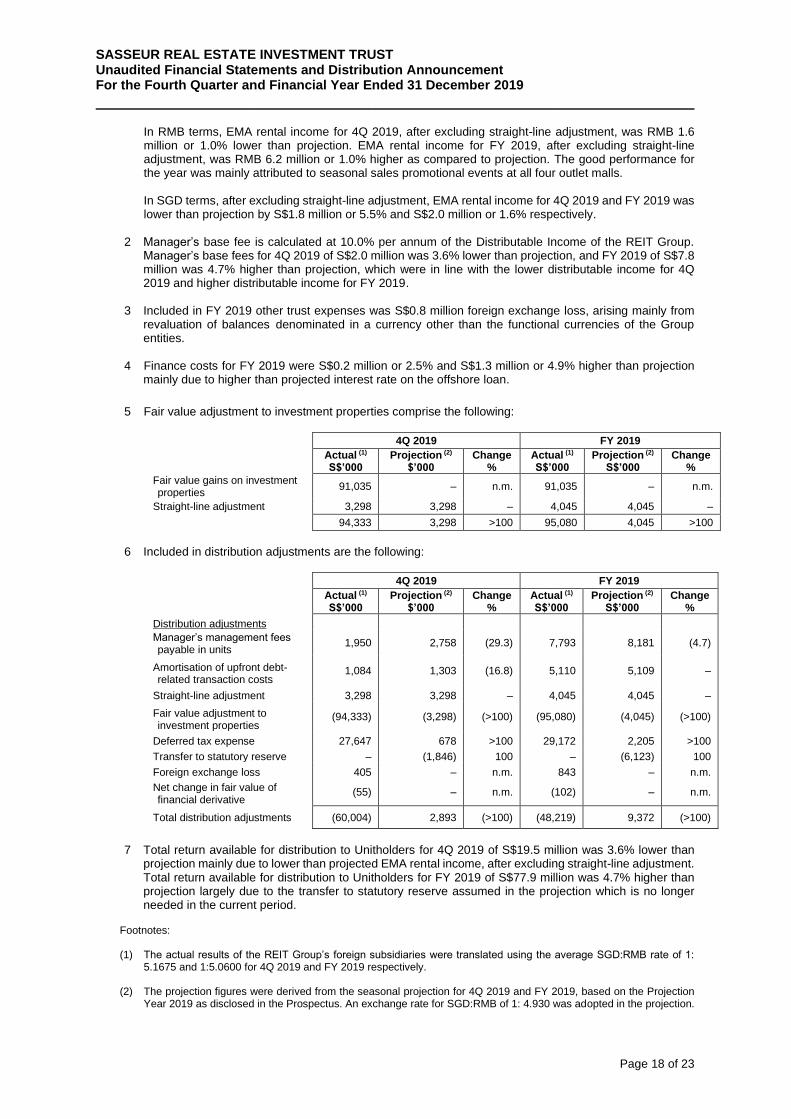
In RMB terms, EMA rental income for 4Q 2019, after excluding straight-line adjustment, was RMB 1.6 million or 1.0% lower than projection. EMA rental income for FY 2019, after excluding straight-line adjustment, was RMB 6.2 million or 1.0% higher as compared to projection. The good performance for the year was mainly attributed to seasonal sales promotional events at all four outlet malls. In SGD terms, after excluding straight-line adjustment, EMA rental income for 4Q 2019 and FY 2019 was lower than projection by S$1.8 million or 5.5% and S$2.0 million or 1.6% respectively.
2 Manager’s base fee is calculated at 10.0% per annum of the Distributable Income of the REIT Group.
Manager’s base fees for 4Q 2019 of S$2.0 million was 3.6% lower than projection, and FY 2019 of S$7.8 million was 4.7% higher than projection, which were in line with the lower distributable income for 4Q 2019 and higher distributable income for FY 2019.
3 Included in FY 2019 other trust expenses was S$0.8 million foreign exchange loss, arising mainly from revaluation of balances denominated in a currency other than the functional currencies of the Group entities.
4 Finance costs for FY 2019 were S$0.2 million or 2.5% and S$1.3 million or 4.9% higher than projection mainly due to higher than projected interest rate on the offshore loan.
5 Fair value adjustment to investment properties comprise the following:
4Q 2019 FY 2019
Actual (1)
S$’000 Projection (2)
$’000 Change
% Actual (1) S$’000
Projection (2) S$’000
Change %
Fair value gains on investment properties
91,035 – n.m. 91,035 – n.m.
Straight-line adjustment 3,298 3,298 – 4,045 4,045 –
94,333 3,298 >100 95,080 4,045 >100
6 Included in distribution adjustments are the following:
4Q 2019 FY 2019
Actual (1)
S$’000 Projection (2)
$’000 Change
% Actual (1) S$’000
Projection (2) S$’000
Change %
Distribution adjustments
Manager’s management fees payable in units
1,950 2,758 (29.3) 7,793 8,181 (4.7)
Amortisation of upfront debt-related transaction costs
1,084 1,303 (16.8) 5,110 5,109 –
Straight-line adjustment 3,298 3,298 – 4,045 4,045 –
Fair value adjustment to investment properties
(94,333) (3,298) (>100) (95,080) (4,045) (>100)
Deferred tax expense 27,647 678 >100 29,172 2,205 >100
Transfer to statutory reserve – (1,846) 100 – (6,123) 100
Foreign exchange loss 405 – n.m. 843 – n.m.
Net change in fair value of financial derivative
(55) – n.m. (102) – n.m.
Total distribution adjustments (60,004) 2,893 (>100) (48,219) 9,372 (>100)
7 Total return available for distribution to Unitholders for 4Q 2019 of S$19.5 million was 3.6% lower than
projection mainly due to lower than projected EMA rental income, after excluding straight-line adjustment. Total return available for distribution to Unitholders for FY 2019 of S$77.9 million was 4.7% higher than projection largely due to the transfer to statutory reserve assumed in the projection which is no longer needed in the current period.
Footnotes: (1) The actual results of the REIT Group’s foreign subsidiaries were translated using the average SGD:RMB rate of 1:
5.1675 and 1:5.0600 for 4Q 2019 and FY 2019 respectively. (2) The projection figures were derived from the seasonal projection for 4Q 2019 and FY 2019, based on the Projection
Year 2019 as disclosed in the Prospectus. An exchange rate for SGD:RMB of 1: 4.930 was adopted in the projection.
SASSEUR REAL ESTATE INVESTMENT TRUST Unaudited Financial Statements and Distribution Announcement For the Fourth Quarter and Financial Year Ended 31 December 2019
___________________________________________________________________________
Page 19 of 23
10 Commentary on the significant trends and competitive conditions of the industry in which the REIT Group operates and any known factors or events that may affect the REIT Group in the next reporting period and the next 12 months China’s gross domestic product (“GDP”) was RMB 89,164.6 billion from January to December of 2019, a year-on-year increase of 6.1%1 at constant prices. The 6.1% GDP growth met the target range set by the central government, and is significant in the context of the huge Chinese economy. China’s per capita GDP has for the first time, exceeded US$10,000 and its GDP has expanded to about RMB 100 trillion (US$ 14.37 trillion) in 2019. Consumption by the growing middle class Chinese remains strong; total retail sales of consumer goods reached RMB 41,164.9 billion, an increase of 8.0% year-on-year. The China-US trade tension may be abating3, with China set to launch a purchasing program that will significantly increase its imports from the US. The outbreak of the Novel Coronavirus (“COVID-19”) in recent weeks is therefore an unexpected setback, and it has impacted various sectors ranging from manufacturing, travel, retail and hospitality, etc. As announced on 28 January 2020, the Sponsor has temporarily closed the four outlet malls in Sasseur REIT’s portfolio since 26 January 2020 for Chongqing and Bishan, and since 27 January 2020 for Hefei and Kunming. The measures are to safeguard the health and safety of its staff and customers, and to comply with guidelines of the relevant authorities in China. Sasseur REIT will continue to work closely with the local and central governments to coordinate the recommencement of work and quick resumption of business operations when it is deemed suitable to do so. Due to the timing of the Chinese New Year break (in late January) and mall closures of about three weeks thus far, Management expects that sales for the first quarter of FY 2020 (“1Q 2020”) will be affected. However, given that Sasseur REIT’s EMA rental model protects the REIT with a fixed income component, the impact on total distributable income will be mitigated. Sasseur REIT is mindful of the challenges posted by the COVID-19 situation and will continue to monitor the situation closely. Overall, we remain positive on the fundamentals for the outlet business in China.
Chongqing Market Update For the year ending 2019, an estimated retail gross floor area (GFA) of around 660,000 sqm was added into the Chongqing market. The projected supply for the next five years is estimated at around 4.5 million sqm. Hefei Market Update For 4Q 2019, no new outlet malls were opened in Hefei. Kunming Market Update A conventional shopping mall, Living mall, which is operated by Kali Hui-Feng real estate group, opened for business on 18 October 2019. The GFA is around 110,000 sqm, located on the southern part of Kunming city and about 33 km away from our Sasseur Outlet. Capital outlet, which is located about 27 km away from our Sasseur outlet, is expected to open for business in the middle of 2020. This outlet is owned and managed by Beijing Capital Group. This outlet’s GFA is around 136,000 sqm with 1,200 car parking lots.
1 National Bureau of Statistics of China 3 BBC News 15 January 2020
SASSEUR REAL ESTATE INVESTMENT TRUST Unaudited Financial Statements and Distribution Announcement For the Fourth Quarter and Financial Year Ended 31 December 2019
___________________________________________________________________________
Page 20 of 23
11 Distribution
(a) Current financial period Any distribution declared for the current financial period? Yes Name of distribution: Distribution for the financial period from 1 October 2019 to 31 December 2019 Distribution type: Tax-Exempt Income Distribution Distribution rate: 1.629 cents per unit Par value of units: Not applicable Tax rate: Tax-exempt income distribution is exempt from Singapore income tax in the
hands of all Unitholders. No tax will be deducted from such distribution.
(b) Corresponding period of the preceding financial period Any distribution declared for the corresponding period of the immediate preceding financial period? Yes Name of distribution: Distribution for the financial period from 1 July 2018 to 31 December 2018 Distribution type: Capital Distribution Distribution rate: 3.541 cents per unit Par value of units: Not applicable
(c) Book closure date
The Transfer Books and Register of Unitholders of Sasseur REIT will be closed at 5.00 p.m. on 6 March 2020 for the purpose of determining unitholders’ entitlements to Sasseur REIT distribution. The ex-dividend date will be on 5 March 2020.
(d) Date payable
The date of distribution is on 26 March 2020.
12 If no distribution has been declared/recommended, a statement to that effect and the reason(s) for the
decision.
Not applicable. A distribution has been declared for the period from 1 October 2019 to 31 December 2019.
13 If the Group has obtained a general mandate from Unitholders for interested person transactions
(“IPTs”), the aggregate value of such transactions are required under Rule 920(1)(a)(ii). If no IPT mandate has been obtained, a statement to that effect.
The REIT Group has not obtained a general mandate from Unitholders for interested person transactions.
14 Confirmation Pursuant to Rule 720(1) of the Listing Manual
The Manager confirms that it has procured undertakings from all its directors and executive officers in the format set out in Appendix 7.7 pursuant to Rule 720(1) of the Listing Manual.
SASSEUR REAL ESTATE INVESTMENT TRUST Unaudited Financial Statements and Distribution Announcement For the Fourth Quarter and Financial Year Ended 31 December 2019
___________________________________________________________________________
Page 21 of 23
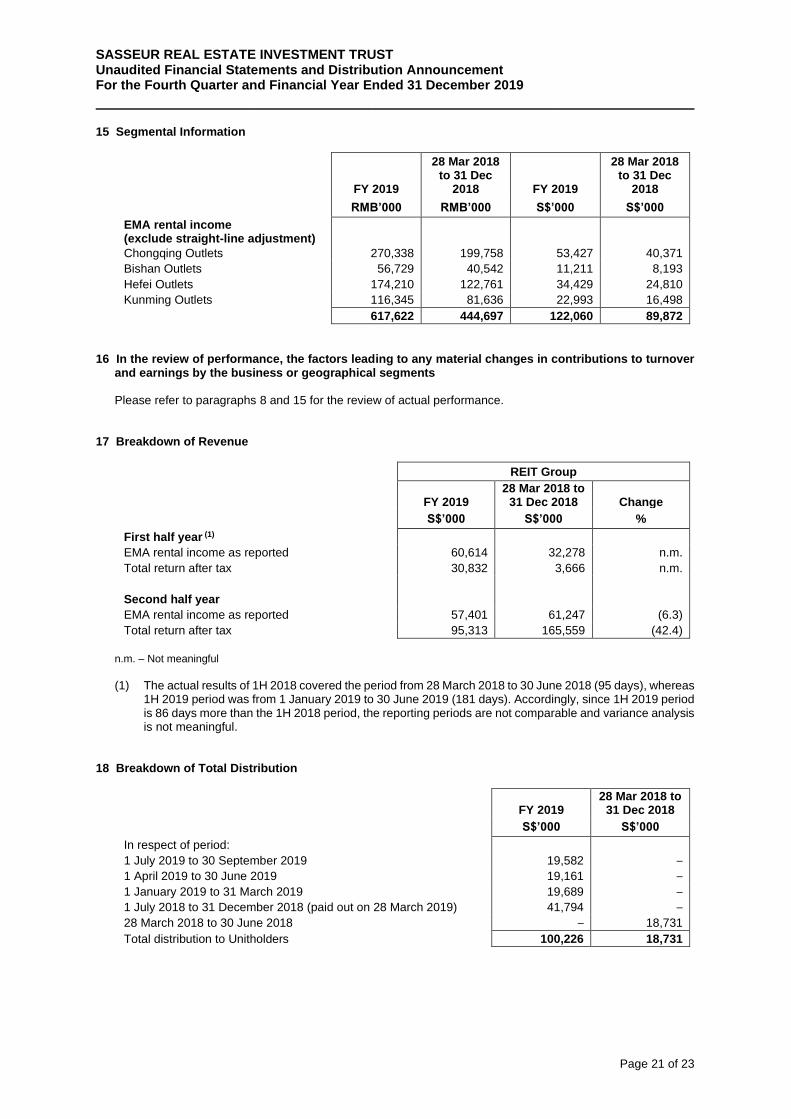
15 Segmental Information
FY 2019
28 Mar 2018 to 31 Dec
2018
FY 2019
28 Mar 2018 to 31 Dec
2018
RMB’000 RMB’000 S$’000 S$’000
EMA rental income (exclude straight-line adjustment)
Chongqing Outlets 270,338 199,758 53,427 40,371
Bishan Outlets 56,729 40,542 11,211 8,193
Hefei Outlets 174,210 122,761 34,429 24,810
Kunming Outlets 116,345 81,636 22,993 16,498
617,622 444,697 122,060 89,872
16 In the review of performance, the factors leading to any material changes in contributions to turnover
and earnings by the business or geographical segments
Please refer to paragraphs 8 and 15 for the review of actual performance. 17 Breakdown of Revenue
REIT Group
FY 2019 28 Mar 2018 to
31 Dec 2018
Change
S$’000 S$’000 %
First half year (1)
EMA rental income as reported 60,614 32,278 n.m.
Total return after tax 30,832 3,666 n.m.
Second half year
EMA rental income as reported 57,401 61,247 (6.3)
Total return after tax 95,313 165,559 (42.4)
n.m. – Not meaningful
(1) The actual results of 1H 2018 covered the period from 28 March 2018 to 30 June 2018 (95 days), whereas
1H 2019 period was from 1 January 2019 to 30 June 2019 (181 days). Accordingly, since 1H 2019 period is 86 days more than the 1H 2018 period, the reporting periods are not comparable and variance analysis is not meaningful.
18 Breakdown of Total Distribution
FY 2019 28 Mar 2018 to
31 Dec 2018
S$’000 S$’000
In respect of period:
1 July 2019 to 30 September 2019 19,582 –
1 April 2019 to 30 June 2019 19,161 –
1 January 2019 to 31 March 2019 19,689 –
1 July 2018 to 31 December 2018 (paid out on 28 March 2019) 41,794 –
28 March 2018 to 30 June 2018 – 18,731
Total distribution to Unitholders 100,226 18,731
SASSEUR REAL ESTATE INVESTMENT TRUST Unaudited Financial Statements and Distribution Announcement For the Fourth Quarter and Financial Year Ended 31 December 2019
___________________________________________________________________________
Page 22 of 23
19 Confirmation Pursuant to Rule 704(13) of the Listing Manual
Pursuant to Rule 704(13) of the Listing Manual of the Singapore Exchange Securities Trading Limited, Sasseur Asset Management Pte. Ltd. (the “Company”), being the manager of Sasseur Real Estate Investment Trust, confirms that there is no person occupying a managerial position in the Company who is a relative of a director, chief executive officer, substantial shareholder of the Company or substantial unitholder of Sasseur Real Estate Investment Trust.
For and on behalf of the Board of Directors of Sasseur Asset Management Pte. Ltd.
Mr Cheng Heng Tan Dr Gu Qingyang Director Director
SASSEUR REAL ESTATE INVESTMENT TRUST Unaudited Financial Statements and Distribution Announcement For the Fourth Quarter and Financial Year Ended 31 December 2019
___________________________________________________________________________
Page 23 of 23
This announcement may contain forward-looking statements that involve assumptions, risks and uncertainties. Actual future performance, outcomes and results may differ materially from those expressed in forward-looking statements as a result of a number of risks, uncertainties and assumptions. Representative examples of these factors include (without limitation) general industry and economic conditions, interest rate trends, cost of capital and capital availability, competition from other companies and venues for the sale/distribution of goods and services, shifts in customer demands, customers and partners, changes in operating expenses, including employee wages, benefits and training, governmental and public policy changes and the continued availability of financing in the amounts and the terms necessary to support future business. Investors are cautioned not to place undue reliance on these forward-looking statements, which are based on current view of management on future events. The value of units in Sasseur REIT (“Units”) and the income derived from them may fall as well as rise. Units are not obligations of, deposits in, or guaranteed by the Manager, DBS Trustee Limited (as trustee of Sasseur REIT), Sasseur Cayman Holding Limited (as the sponsor of Sasseur REIT) or any of their respective affiliates. An investment in the Units is subject to investment risks, including the possible loss of the principal amount invested. Holders of Units (“Unitholders”) have no right to request that the Manager redeem or purchase their Units while the Units are listed. It is intended that Unitholders may only deal in their Units through trading on Singapore Exchange Securities Trading Limited (the “SGX-ST”). Listing of the Units on the SGX-ST does not guarantee a liquid market for the Units. The past performance of Sasseur REIT is not necessarily indicative of the future performance of Sasseur REIT.
By Order of the Board of Directors of Sasseur Asset Management Pte. Ltd. (Company registration no. 201707259N) As Manager of Sasseur Real Estate Investment Trust Anthony Ang Chief Executive Officer 20 February 2020