Embed Size (px)
Citation preview

• INDIA • CHINA • JAPAN • GERMANY • USA • CANADA • SWEDEN • UK • FRANCE
Products and services names mentioned herein are trademarks and service marks of Sasken Communication Technologies Limited
or the respective companies. Copyright 2005.
Sasken annual report 2004 - 2005
Sa
ske
na
nn
ua
lre
po
rt2
00
4 - 2
00
5
PRIN
T@PR
AGAT
I.CO
M
Sasken_Cov_PAP.indd 1Sasken_Cov_PAP.indd 1 5/18/05 11:13:17 PM5/18/05 11:13:17 PM


where the future is shapedannual report 2004 - 2005
1
05050449_003_138.indd 305050449_003_138.indd 3 5/19/05 4:28:42 PM5/19/05 4:28:42 PM

05050449_003_138.indd 405050449_003_138.indd 4 5/19/05 4:28:42 PM5/19/05 4:28:42 PM

Clay. A simple object that adapts itself to anyform and gives wings to imagination. Stretch it. Shapeit. Mould it. And do it all over again.
Quite like Sasken Technologies. Where flexibility,adaptability and creativity form the core of every solution.Where people come eager to be shaped. To blend together and translate the company’s vision to reality.
Giving the Company the freedom to dream.
And the power to create.
05050449_003_138.indd 505050449_003_138.indd 5 5/19/05 4:28:42 PM5/19/05 4:28:42 PM

6
Table of Contents8 Board of Directors
11 Letter to Shareholders
15 People First
21 Technology and Markets
27 A Seven Year Snapshot
Year at a Glance
33 Financials
34 Directors’ Report
38 Annexure to Directors’ Report
41 Corporate Governance
05050449_003_138.indd 605050449_003_138.indd 6 5/19/05 4:28:42 PM5/19/05 4:28:42 PM
Sasken annual report 2004 - 2005 7
55 Financial Statements in Compliance with Indian GAAP
56 Auditors’ Report
57 Annexure to Auditors’ Report
59 Balance Sheet
60 Profit & Loss Account
61 Schedules Forming Part of the Balance Sheet
69 Schedules Forming Part of the Profit & Loss Account
73 Notes Forming Part of Accounts
89 Cash Flow Statement
91 Balance Sheet Abstract
92 Consolidated Financial Statements Auditors’ Report
93 Consolidated Balance Sheet
94 Consolidated Profit & Loss Account
95 Schedules forming part of the Consolidated Balance Sheet
101 Schedules forming part of the Consolidated Profit & Loss Account
105 Notes forming part of Consolidated Accounts
119 Consolidated Cash Flow Statement
121 Statement pursuant to Section 212
122 Management’s Discussion and Analysis of Financial Performance
139 Sasken Network Systems Limited
140 Directors’ Report
142 Auditors’ Report
143 Annexure to the Auditors’ Report
144 Balance Sheet
145 Profit & Loss Account
146 Schedules Forming Part of the Balance Sheet
150 Schedules Forming Part of the Profit & Loss Account
152 Notes Forming Part of Accounts
158 Cash Flow Statement
159 Balance Sheet Abstract
161 Sasken Network Engineering Limited
162 Directors’ Report
164 Auditors’ Report
165 Annexure to the Auditors’ Report
166 Balance Sheet
167 Profit & Loss Account
168 Schedules Forming Part of the Balance Sheet
171 Schedules Forming Part of the Profit & Loss Account
173 Notes Forming Part of Accounts
178 Cash Flow Statement
179 Balance Sheet Abstract
181 Financial Statements in Compliance with US GAAP
182 Management Report
183 Report of Independent Auditors
184 Consolidated Balance Sheet as at March 31
185 Consolidated Income Statements for the years ending March 31
186 Statement of Stockholders’ Equity
187 Consolidated Statement of Cash Flows for the year ending March 31
189 Notes to Consolidated Financial Statements
210 Management’s Discussion and Analysis of Financial Performance
05050449_003_138.indd 705050449_003_138.indd 7 5/19/05 6:46:07 PM5/19/05 6:46:07 PM
8
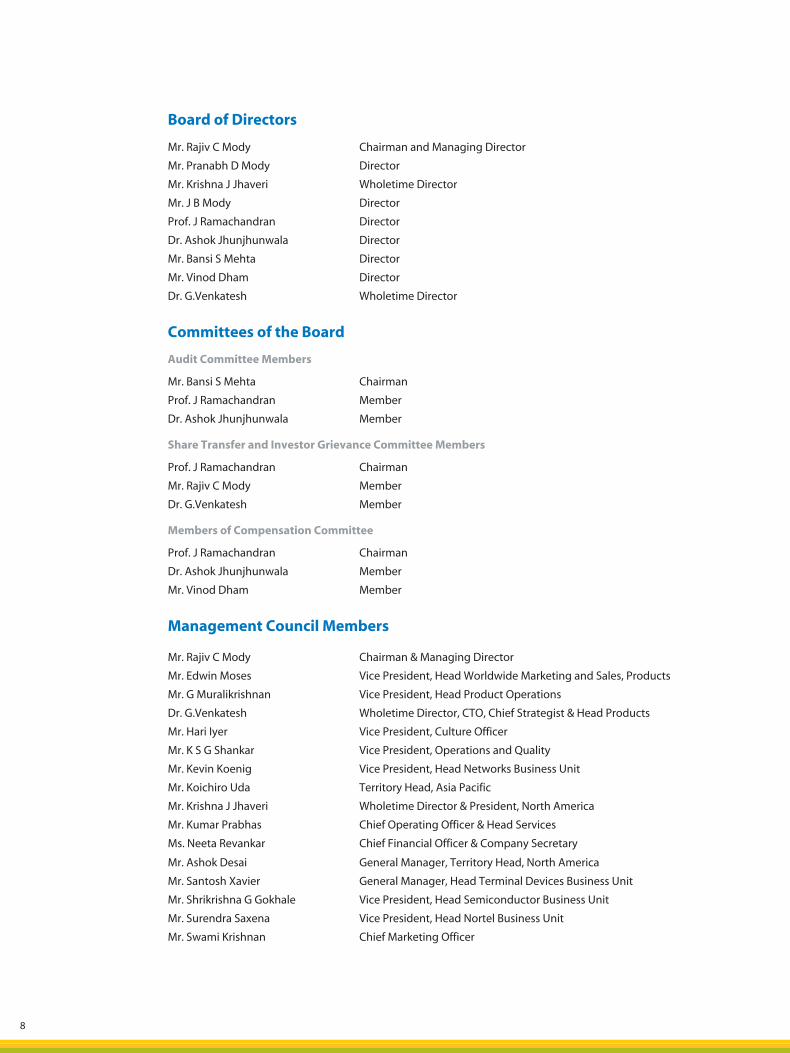
Board of Directors
Mr. Rajiv C Mody Chairman and Managing Director
Mr. Pranabh D Mody Director
Mr. Krishna J Jhaveri Wholetime Director
Mr. J B Mody Director
Prof. J Ramachandran Director
Dr. Ashok Jhunjhunwala Director
Mr. Bansi S Mehta Director
Mr. Vinod Dham Director
Dr. G.Venkatesh Wholetime Director
Committees of the Board
Audit Committee Members
Mr. Bansi S Mehta Chairman
Prof. J Ramachandran Member
Dr. Ashok Jhunjhunwala Member
Share Transfer and Investor Grievance Committee Members
Prof. J Ramachandran Chairman
Mr. Rajiv C Mody Member
Dr. G.Venkatesh Member
Members of Compensation Committee
Prof. J Ramachandran Chairman
Dr. Ashok Jhunjhunwala Member
Mr. Vinod Dham Member
Management Council Members
Mr. Rajiv C Mody Chairman & Managing Director
Mr. Edwin Moses Vice President, Head Worldwide Marketing and Sales, Products
Mr. G Muralikrishnan Vice President, Head Product Operations
Dr. G.Venkatesh Wholetime Director, CTO, Chief Strategist & Head Products
Mr. Hari Iyer Vice President, Culture Officer
Mr. K S G Shankar Vice President, Operations and Quality
Mr. Kevin Koenig Vice President, Head Networks Business Unit
Mr. Koichiro Uda Territory Head, Asia Pacific
Mr. Krishna J Jhaveri Wholetime Director & President, North America
Mr. Kumar Prabhas Chief Operating Officer & Head Services
Ms. Neeta Revankar Chief Financial Officer & Company Secretary
Mr. Ashok Desai General Manager, Territory Head, North America
Mr. Santosh Xavier General Manager, Head Terminal Devices Business Unit
Mr. Shrikrishna G Gokhale Vice President, Head Semiconductor Business Unit
Mr. Surendra Saxena Vice President, Head Nortel Business Unit
Mr. Swami Krishnan Chief Marketing Officer
05050449_003_138.indd 805050449_003_138.indd 8 5/19/05 4:28:43 PM5/19/05 4:28:43 PM
Sasken annual report 2004 - 2005 9
Company Secretary
Neeta Revankar
Statutory Auditors
S R Batliboi & Co.
Chartered Accountants
Internal Auditors
S B Billimoria & Co.
Chartered Accountants
Bankers & Financial Institutions
Citibank N.A.
Dena Bank
HDFC
Union Bank of India
Solicitors and Attorneys
Dua Associates
Wilson Sonsini Goodrich and Rosatti
Registered and Corporate Office
Sasken Communication Technologies Limited
No. 139/25
Domlur Layout
Ring Road, Domlur P.O.
Bangalore 560 071
05050449_003_138.indd 905050449_003_138.indd 9 5/19/05 4:28:43 PM5/19/05 4:28:43 PM

05050449_003_138.indd 1005050449_003_138.indd 10 5/19/05 4:28:43 PM5/19/05 4:28:43 PM

Letter to shareholders. In the last few years our growth has been dramatic. We started from scratch, but every year we shoot beyond the stretch targets we’ve set for ourselves.Our confidence is high, so is our commitment to continue toscale greater heights.
05050449_003_138.indd 1105050449_003_138.indd 11 5/19/05 4:28:44 PM5/19/05 4:28:44 PM
12
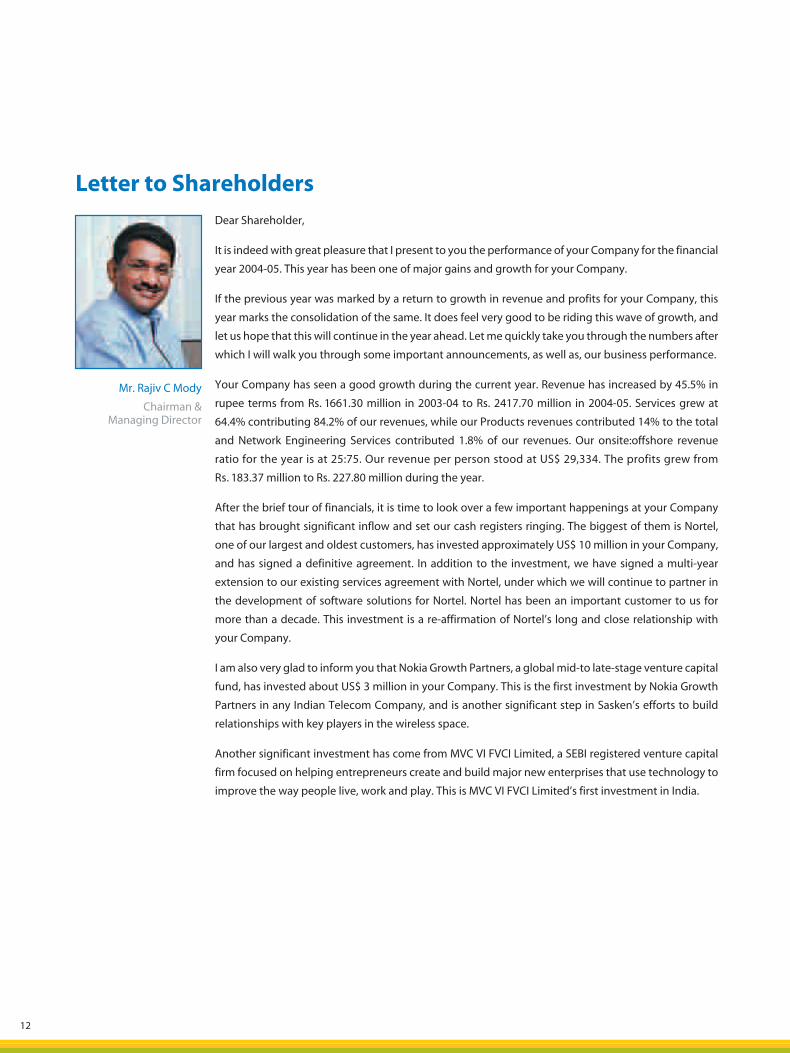
Dear Shareholder,
It is indeed with great pleasure that I present to you the performance of your Company for the financial
year 2004-05. This year has been one of major gains and growth for your Company.
If the previous year was marked by a return to growth in revenue and profits for your Company, this
year marks the consolidation of the same. It does feel very good to be riding this wave of growth, and
let us hope that this will continue in the year ahead. Let me quickly take you through the numbers after
which I will walk you through some important announcements, as well as, our business performance.
Your Company has seen a good growth during the current year. Revenue has increased by 45.5% in
rupee terms from Rs. 1661.30 million in 2003-04 to Rs. 2417.70 million in 2004-05. Services grew at
64.4% contributing 84.2% of our revenues, while our Products revenues contributed 14% to the total
and Network Engineering Services contributed 1.8% of our revenues. Our onsite:offshore revenue
ratio for the year is at 25:75. Our revenue per person stood at US$ 29,334. The profits grew from
Rs. 183.37 million to Rs. 227.80 million during the year.
After the brief tour of financials, it is time to look over a few important happenings at your Company
that has brought significant inflow and set our cash registers ringing. The biggest of them is Nortel,
one of our largest and oldest customers, has invested approximately US$ 10 million in your Company,
and has signed a definitive agreement. In addition to the investment, we have signed a multi-year
extension to our existing services agreement with Nortel, under which we will continue to partner in
the development of software solutions for Nortel. Nortel has been an important customer to us for
more than a decade. This investment is a re-affirmation of Nortel’s long and close relationship with
your Company.
I am also very glad to inform you that Nokia Growth Partners, a global mid-to late-stage venture capital
fund, has invested about US$ 3 million in your Company. This is the first investment by Nokia Growth
Partners in any Indian Telecom Company, and is another significant step in Sasken’s efforts to build
relationships with key players in the wireless space.
Another significant investment has come from MVC VI FVCI Limited, a SEBI registered venture capital
firm focused on helping entrepreneurs create and build major new enterprises that use technology to
improve the way people live, work and play. This is MVC VI FVCI Limited’s first investment in India.
Letter to Shareholders
Mr. Rajiv C Mody
Chairman &Managing Director
05050449_003_138.indd 1205050449_003_138.indd 12 5/19/05 4:28:45 PM5/19/05 4:28:45 PM
Sasken annual report 2004 - 2005 13
Sasken plans to use the proceeds from the
investments for Mergers & Acquisitions. Our M&A
strategy is to acquire companies that either bring
new capabilities to service existing customers or new
customers for existing capabilities. In addition to our
regular business and financial due diligence, our M&A
process will check for cultural compatibility before
proceeding with any transactions.
After giving you a brief tour of the financials for the
year, let me now take you through our business that
generates these numbers. We track our business
by revenues generated from services and products
separately. Our services business has been growing
handsomely over the last few quarters at a handsome
growth rate per quarter. Our revenues from the
products business continues to show choppiness
quarter on quarter, and will remain like that for the
coming few quarters till the products offerings are
mature and start yielding royalties.
Your Company continues to invest on the technology
and R&D front. Last year, our R&D expenses were about
1.1% of the revenues. In the coming year, we expect
to ramp this spend. Your Company differentiates itself
in the market place by developing technology and
technical expertise. I would like to re-emphasize that
to sustain this differentiation, continued investments
in R&D are a must.
During the year, your Company also promoted
Sasken Network Engineering Limited (“SNEL”),
a wholly owned subsidiary in India. SNEL was
incorporated on September 29, 2004 and is headed
by capable individuals. SNEL provides installation,
commissioning and project management services
in cellular network. SNEL acquired the assets and a
contract of Blue Broadband Technologies Private
Limited on October 28, 2004.
On the people front, we grew from a team size of 1437
at the beginning of the year to 1902 on March 31. You
will read more of this in the People First segment.
I am concluding on the note that this augurs well
for a promising future for your Company. Of course
there are going to be bigger challenges that will test
our strength and character. I am sure that we shall
overcome every single challenge and surge ahead
with renewed vigor.
Finally, I am proud of each and every Sasian worldwide
who has delivered this result. I am also thankful to you
for supporting the management of this Company.
Thanking you,
Rajiv C Mody
Chairman & Managing Director
05050449_003_138.indd 1305050449_003_138.indd 13 5/19/05 4:28:45 PM5/19/05 4:28:45 PM

05050449_003_138.indd 1405050449_003_138.indd 14 5/19/05 4:28:45 PM5/19/05 4:28:45 PM

eople first. There are those few who are leaders.Who show the world the way. And guide the rest through,to tomorrow. At Sasken, every Sasian is a leader. Simply put, they wouldn’t be here otherwise.
P
05050449_003_138.indd 1505050449_003_138.indd 15 5/19/05 4:28:48 PM5/19/05 4:28:48 PM
16
Our People. Our Wealth.
Our Corporate Credo is People First. We believe that
respect for the individual comes before organizational
imperatives.
And this year that strategy has won us public
accolades. In the Business Today-Mercer Survey
which covered corporates across sectors, in which IT
was one, Sasken was awarded the No. 1 position as
The Best Company To Work For.
We also earned recognition on other platforms:
• Ranked sixth in the DQ-IDC Survey of Indian IT Best
Employers
• Ranked sixth in the BW-Grow Talent Study of Great
Places to Work
These awards are natural outcomes of the unique
people-oriented practices that Sasken has nurtured
over several years. Drawing on the foundation of our
five core values has enabled us to build an institution
of character, commitment and competence.
On the other hand though, while our scores in
the Gallup Organisation’s Employee Engagement
survey improved a bit, our global percentile position
remained the same.
This indicates that, even as Sasken is constantly
bettering its people practices, we need to do so faster.
Building Intellectual Wealth
P-CMM: People Capability Maturity Model
The initiative of getting Sasken assessed at Level 5 as
per the People Capability Maturity Model (P-CMM)
is an effort to achieving global levels of employee
engagement. The P-CMM effort was launched this
year as a project, with a Project Manager and an
external consultant to head it. A Task Force and a
Steering Committee have been formed. The people
management processes have been documented and
the gaps in them identified. Efforts are now on to
bridge these gaps.
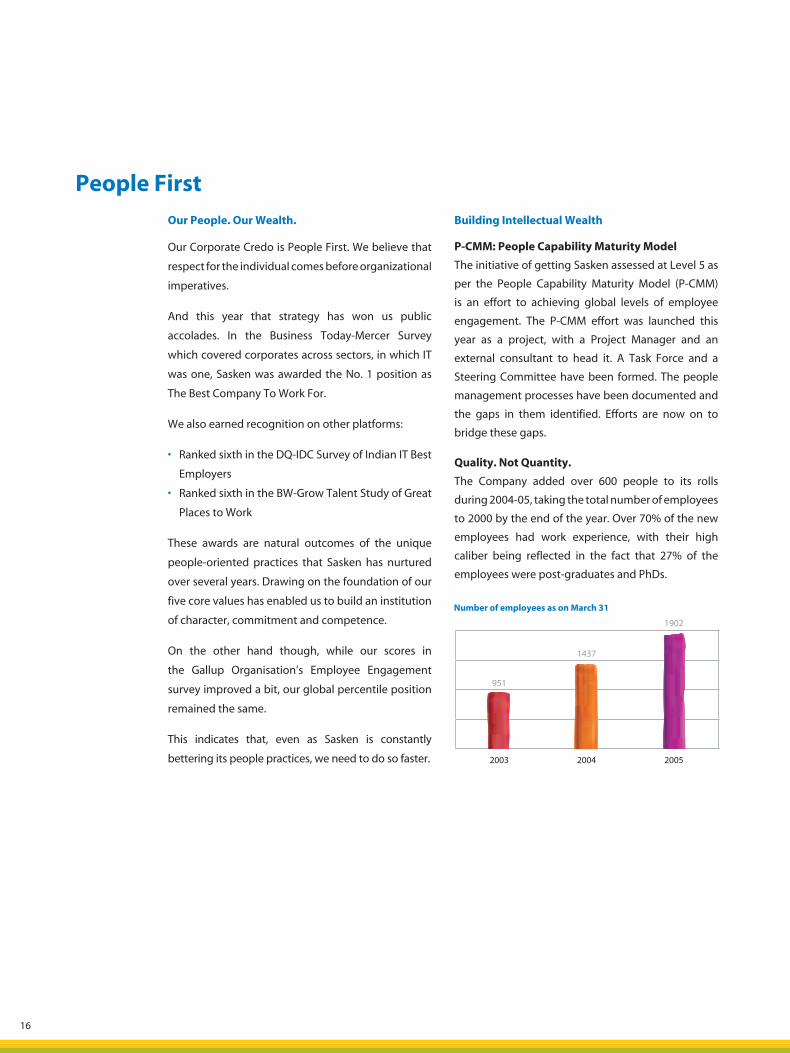
Quality. Not Quantity.
The Company added over 600 people to its rolls
during 2004-05, taking the total number of employees
to 2000 by the end of the year. Over 70% of the new
employees had work experience, with their high
caliber being reflected in the fact that 27% of the
employees were post-graduates and PhDs.
People First
2003 2004 2005
951
1437
1902
Number of employees as on March 31
05050449_003_138.indd 1605050449_003_138.indd 16 5/19/05 4:28:48 PM5/19/05 4:28:48 PM
Sasken annual report 2004 - 2005 17
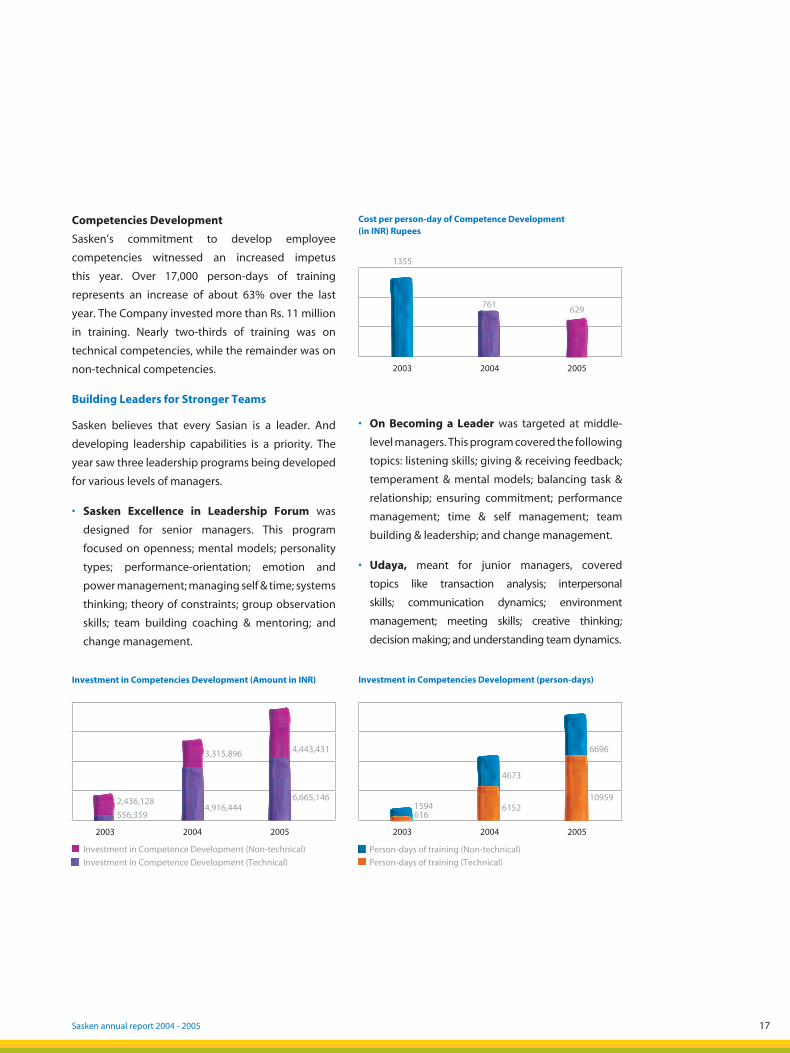
Competencies Development
Sasken’s commitment to develop employee
competencies witnessed an increased impetus
this year. Over 17,000 person-days of training
represents an increase of about 63% over the last
year. The Company invested more than Rs. 11 million
in training. Nearly two-thirds of training was on
technical competencies, while the remainder was on
non-technical competencies.
Building Leaders for Stronger Teams
Sasken believes that every Sasian is a leader. And
developing leadership capabilities is a priority. The
year saw three leadership programs being developed
for various levels of managers.
• Sasken Excellence in Leadership Forum was
designed for senior managers. This program
focused on openness; mental models; personality
types; performance-orientation; emotion and
power management; managing self & time; systems
thinking; theory of constraints; group observation
skills; team building coaching & mentoring; and
change management.
2003 2004 2005
761629
Cost per person-day of Competence Development (in INR) Rupees
1355
2003 2004 2005
556,359
Investment in Competencies Development (Amount in INR)
4,916,444
3,315,896
6,665,146
4,443,431
2,436,128
Investment in Competence Development (Non-technical)
Investment in Competence Development (Technical)
2003 2004 2005
616
Investment in Competencies Development (person-days)
1594 6152
4673
10959
6696
Person-days of training (Non-technical)
Person-days of training (Technical)
• On Becoming a Leader was targeted at middle-
level managers. This program covered the following
topics: listening skills; giving & receiving feedback;
temperament & mental models; balancing task &
relationship; ensuring commitment; performance
management; time & self management; team
building & leadership; and change management.
• Udaya, meant for junior managers, covered
topics like transaction analysis; interpersonal
skills; communication dynamics; environment
management; meeting skills; creative thinking;
decision making; and understanding team dynamics.
05050449_003_138.indd 1705050449_003_138.indd 17 5/19/05 4:28:50 PM5/19/05 4:28:50 PM
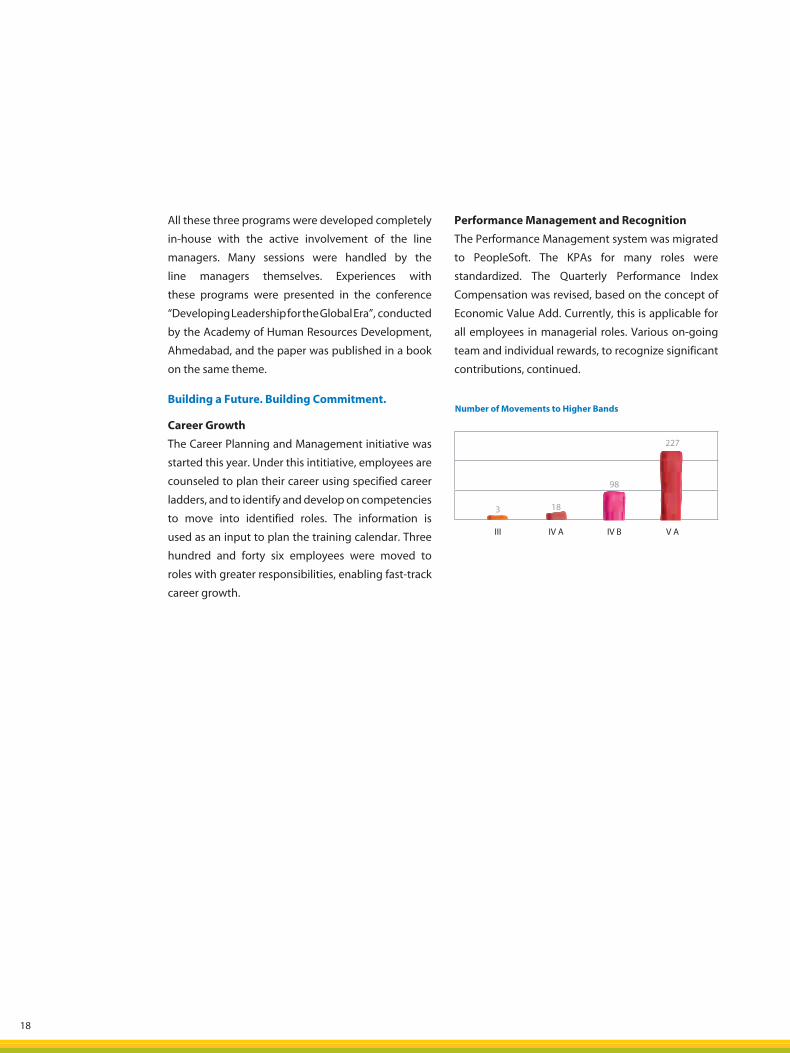
18
III IV B V A
18
Number of Movements to Higher Bands
3
98
227
IV A
All these three programs were developed completely
in-house with the active involvement of the line
managers. Many sessions were handled by the
line managers themselves. Experiences with
these programs were presented in the conference
“DevelopingLeadershipfor theGlobalEra”, conducted
by the Academy of Human Resources Development,
Ahmedabad, and the paper was published in a book
on the same theme.
Building a Future. Building Commitment.
Career Growth
The Career Planning and Management initiative was
started this year. Under this intitiative, employees are
counseled to plan their career using specified career
ladders, and to identify and develop on competencies
to move into identified roles. The information is
used as an input to plan the training calendar. Three
hundred and forty six employees were moved to
roles with greater responsibilities, enabling fast-track
career growth.
Performance Management and Recognition
The Performance Management system was migrated
to PeopleSoft. The KPAs for many roles were
standardized. The Quarterly Performance Index
Compensation was revised, based on the concept of
Economic Value Add. Currently, this is applicable for
all employees in managerial roles. Various on-going
team and individual rewards, to recognize significant
contributions, continued.
05050449_003_138.indd 1805050449_003_138.indd 18 5/19/05 4:28:52 PM5/19/05 4:28:52 PM
Sasken annual report 2004 - 2005 19
Employee Communication
Sasken strongly believes in two-way employee
communicationprocesses.Platforms likeperformance
planning and appraisal; general information
sharing; quarterly business update meets; touch-
time meetings; one-on-one meetings between the
employee and the reporting manager; skip-level
meetings etc., continued. Under the new initiative
of “Sasken Daily Media Monitor” by the Branding
and Communication unit, employees are informed
daily about media reports related to Sasken and
its business.
Work-life Balance
A team that laughs together lives together.
Continuing our emphasis on work-life balance,
softer entertainment and recreation programmes for
employees and their families wereheldonanon-going
basis. Sasken definitely isn’t only about achievement
and competitiveness in the work sphere.
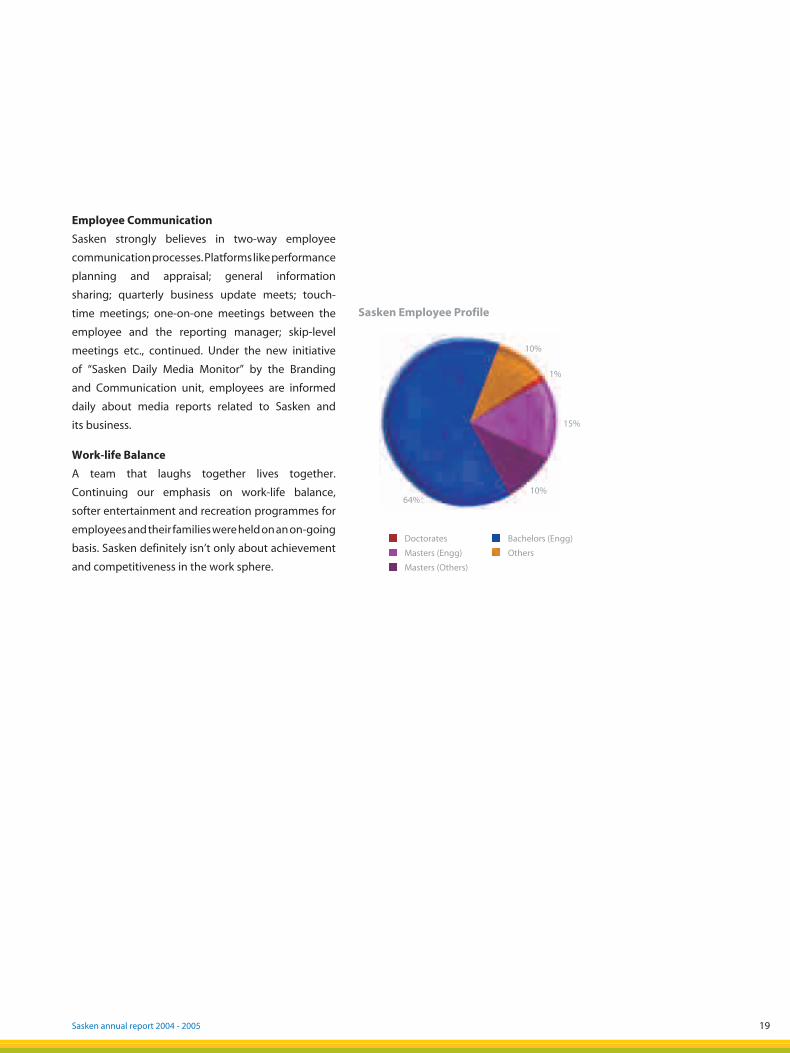
Sasken Employee Profile
Doctorates
Masters (Engg) Others
Masters (Others)
Bachelors (Engg)
10%
1%
15%
10%64%
2
05050449_003_138.indd 1905050449_003_138.indd 19 5/19/05 4:28:53 PM5/19/05 4:28:53 PM

05050449_003_138.indd 2005050449_003_138.indd 20 5/19/05 4:28:54 PM5/19/05 4:28:54 PM
echnology and markets. Today, the globe is our marketplace.Our single-minded focus on telecom helps us constantly spot and evaluate telecom trends and prepareourselves for tomorrow’s technology, today. And tomorrow,we’re not going to be reading the trends, we’re going to besetting standards.
T
05050449_003_138.indd 2105050449_003_138.indd 21 5/19/05 4:28:56 PM5/19/05 4:28:56 PM
22
The Indian IT Industry
In FY 2003-04, the Indian IT services and software
sector grossed US$ 12.8 billion in revenue – an
annual growth of 29.6 percent over FY 2002-03. The
segment is expected to exceed US$ 16.5 billion by
the end of the current fiscal – translating to a CAGR of
25.7 percent over FY 2000-05. The share of exports in
total industry revenue is expected to rise further and
to account for nearly three-fourths of the segment
revenue by the end of the current fiscal.
Analysis of IT Services and Software Exports
The economic upswing in key markets towards the
second and third quarters of FY 2003-04 helped fuel
the growth of Indian IT services and software exports.
IT services and software exports grew from US$ 7.1
billion in FY 2002-03 to US$ 9.2 billion in FY 2003-04
– a growth of over 30 percent over the previous year.
Based on the good performance observed in the
first three quarters of the current fiscal, IT service
and software exports are expected to reach
US$ 12.2 billion by March 2005 – a forecast growth of
32 percent over FY 2003-04.
R&D Services and Software Product Exports
Indian R&D services and software product exports,
though at a nascent stage, are undergoing a quiet
change. Currently valued at US$ 2.3 billion (barely 1.3
percent of the worldwide market), global R&D and
product development sourced from India is likely to
grow rapidly – driven by the strong global demand for
embedded software and systems and the increasing
adoption of offshore product development. Analysts
forecast Indian R&D services and software products
market to grow to US$ 8-11 billion by 2008-10.
Embedded Software and Systems
The worldwide market for embedded software and
systems is currently valued at US$ 25 billion, and
is estimated to be growing at an annual rate of 16
percent. Rapidly increasing global demand has helped
Indian exports of embedded systems and software to
reach US$ 1.6 billion in FY 2003-04 – a growth of 44
percent over the previous fiscal. The high levels of
growth in segment revenues is expected to continue
as increasing levels of convergence and digitization
and declining costs increase the global adoption of
electronic devices – and manufacturers are forced
to seek technically superior / low cost sourcing
destinations to remain competitive.
Offshore Product Development
The value of offshore product development exports
(includes the export of software products made by
Indian companies) sourced from India is estimated
to have increased from US$ 560 million in FY 2002-
03 to US$ 710 million in FY 2003-04. Many global
Independent Software Vendors (ISVs) are eyeing India
as a location for establishing captive centers for R&D
activities. Since the beginning of 2001, approximately
230 multinationals have opened offices in India.
The market for outsourced R&D activities in India
reached US$ 800 million to US$ 1 billion in 2003, and
is expected to reach US$ 11 billion by 2008.
Unlike large IT service organizations, product-centric
firms are often small set-ups typically funded through
the venture capital route. As a result the pressure to
deliver on financial profitability metrics is very high.
Offshore product development has proven to be an
effective means of extracting more value out of every
dollar of funding raised. Analysts believe that, as in
services, global sourcing of product development
will become an integral part of most product-centric
strategies over the next few years.
Cellular Infrastructure Market
The leading vendors in the market are Nortel, Lucent
and Motorola from North America, and Ericsson, Nokia,
Siemens and Alcatel from Europe. The worldwide
market for mobile infrastructure is estimated to have
been about US$ 39.2 billion in 2004. The worldwide
cellular network equipment revenue has declined
from US$ 40 billion in 2002 and is expected to grow
to US$ 40.1 billion by 2008.
Technology and Markets
05050449_003_138.indd 2205050449_003_138.indd 22 5/19/05 4:28:57 PM5/19/05 4:28:57 PM
Sasken annual report 2004 - 2005 23
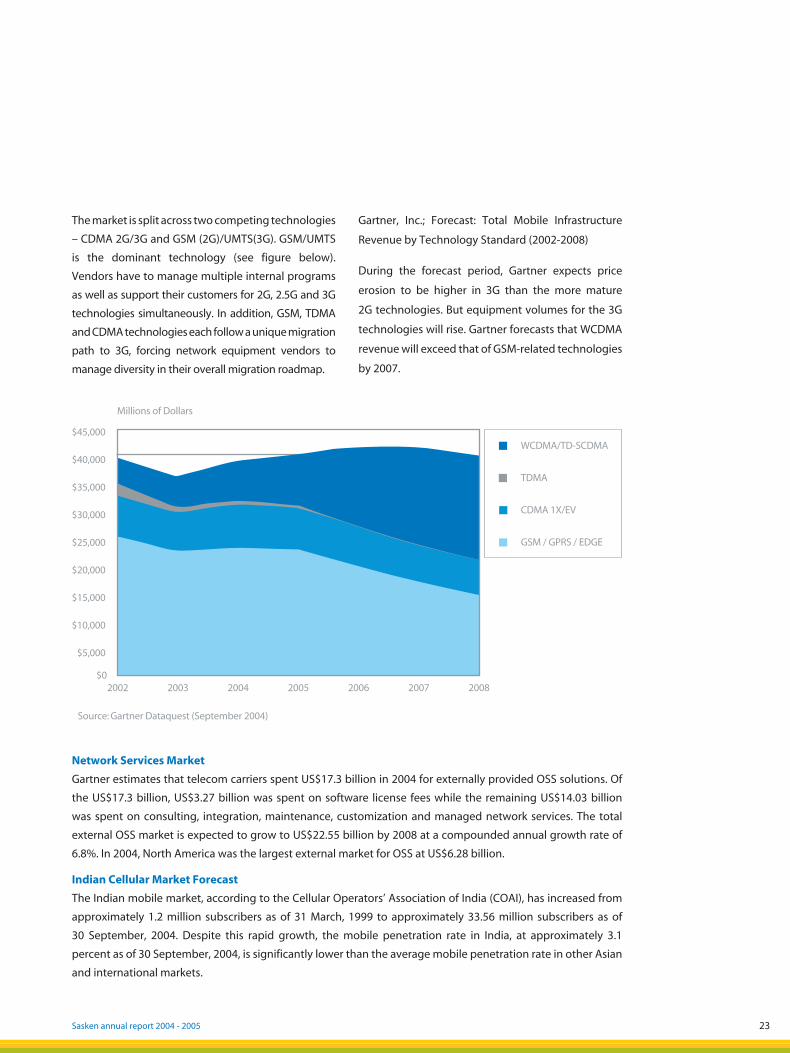
The market is split across two competing technologies
– CDMA 2G/3G and GSM (2G)/UMTS(3G). GSM/UMTS
is the dominant technology (see figure below).
Vendors have to manage multiple internal programs
as well as support their customers for 2G, 2.5G and 3G
technologies simultaneously. In addition, GSM, TDMA
and CDMA technologies each follow a unique migration
path to 3G, forcing network equipment vendors to
manage diversity in their overall migration roadmap.
Gartner, Inc.; Forecast: Total Mobile Infrastructure
Revenue by Technology Standard (2002-2008)
During the forecast period, Gartner expects price
erosion to be higher in 3G than the more mature
2G technologies. But equipment volumes for the 3G
technologies will rise. Gartner forecasts that WCDMA
revenue will exceed that of GSM-related technologies
by 2007.
Network Services Market
Gartner estimates that telecom carriers spent US$17.3 billion in 2004 for externally provided OSS solutions. Of
the US$17.3 billion, US$3.27 billion was spent on software license fees while the remaining US$14.03 billion
was spent on consulting, integration, maintenance, customization and managed network services. The total
external OSS market is expected to grow to US$22.55 billion by 2008 at a compounded annual growth rate of
6.8%. In 2004, North America was the largest external market for OSS at US$6.28 billion.
Indian Cellular Market Forecast
The Indian mobile market, according to the Cellular Operators’ Association of India (COAI), has increased from
approximately 1.2 million subscribers as of 31 March, 1999 to approximately 33.56 million subscribers as of
30 September, 2004. Despite this rapid growth, the mobile penetration rate in India, at approximately 3.1
percent as of 30 September, 2004, is significantly lower than the average mobile penetration rate in other Asian
and international markets.
Millions of Dollars
2002 2003 2004 2005 20072006 2008
WCDMA/TD-SCDMA
TDMA
CDMA 1X/EV
GSM / GPRS / EDGE
$45,000
$40,000
$35,000
$30,000
$25,000
$20,000
$15,000
$10,000
$5,000
$0
Source: Gartner Dataquest (September 2004)
05050449_003_138.indd 2305050449_003_138.indd 23 5/19/05 4:28:57 PM5/19/05 4:28:57 PM
24
2004 2005 2006 2007 2008
Mobile Connections (K) 56,500.0 90,000.0 119,000.0 145,180.0 165,490.7
Annual Growth 98.7% 59.3% 32.2% 22.0% 14.0%
Source: Gartner Dataquest, 2004
India is one of the fastest growing cellular industries
in the world witnessing high competition, steep price
reductions and higher fixed-to-mobile substitution.
As the subscriber numbers in India ramp up, Indian
service providers are looking to aggressively roll out
networks and enhance coverage. Hence the Indian
market is a critical market for NEMs. Given the price
sensitive nature of the Indian market, NEMs are
looking to reduce the network roll out costs using
local vendors.
Segment Market Overview
The overall semiconductor market worldwide is
estimated to have been around US$ 220 million by
the end of 2004. The semiconductor market will post
little revenue growth for the next two years, as the
factors that drove strong revenue growth in 2004 will
dissipate. However, this next downcycle will not be as
traumatic as the last and, as it plays out, will go some
way to continue the industry’s recovery from its 2001
hangover.
Market Share by Device
The total market size of the semiconductor market
in 2003 was US$ 178 billion. We segment the
semiconductor market in two ways – by device
category and by end applications. In terms of device
category, Sasken targets the ASIC/ASSP segments.
ASSP segment was 24% of the worldwide market and
we expect it to grow by 2.7% in 2005. ASIC segment
was 8% of the worldwide market and we expect it to
grow by 0.9% in 2005. In terms of end applications,
we target the wireless semiconductor space. This
segment of the worldwide semiconductor market
was US$ 35.7 billion in 2004. This segment was about
16% of the world markets in 2004, and we expect it to
grow by 5.1% in 2005.
2004 was a strong growth year for semiconductors
used in mobile handsets and mobile infrastructure.
Handset semiconductor revenue growth will be
US$ 33.4 billion, with growth of 46 percent compared
with 2003. Long term, no growth is expected in 2006
and modest growth in 2007 and 2008. If this scenario
plays out, industry consolidation will increase after
2005 because of greater competition and relatively
high development costs.
On the infrastructure side, operators are investing in
upgrading their 2G and 2.5G networks to improve
the quality of service they provide to their customers.
Coupled with ongoing investment in their 3G
networks, the upgrades provide welcome growth for
semiconductor suppliers.
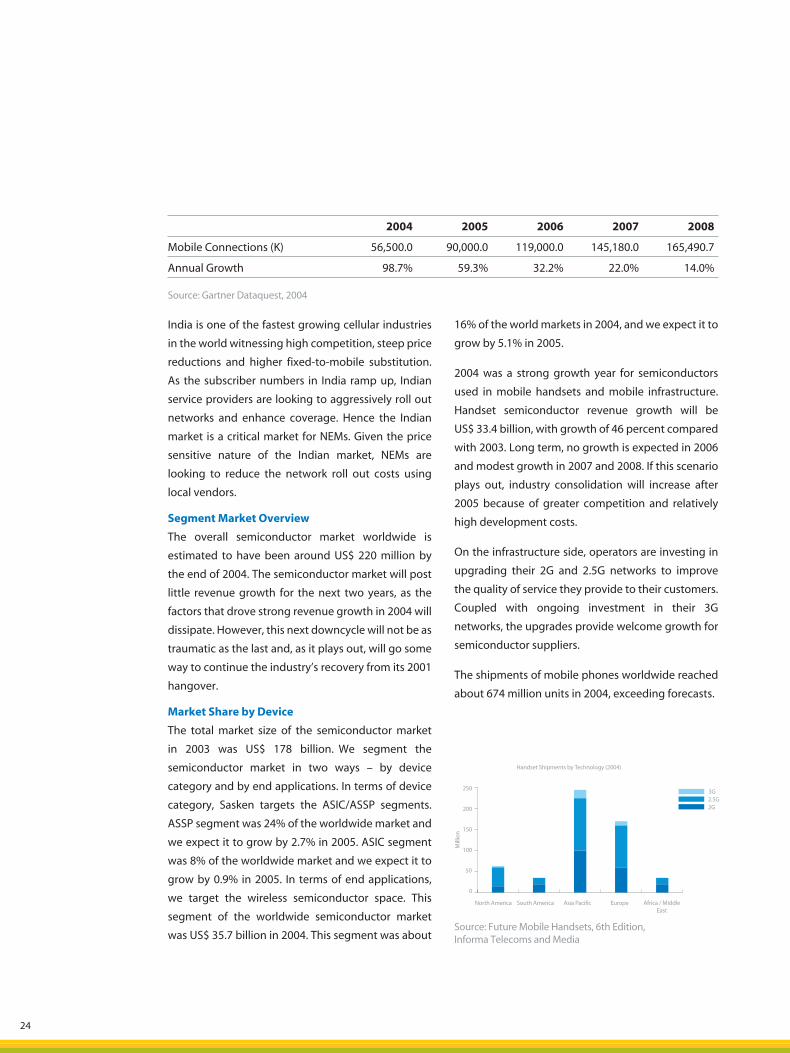
The shipments of mobile phones worldwide reached
about 674 million units in 2004, exceeding forecasts.
Handset Shipments by Technology (2004)
North America South America Asia Pacific Europe Africa / MiddleEast
3G
Mill
ion
250
200
150
100
50
0
2.5G2G
Source: Future Mobile Handsets, 6th Edition,Informa Telecoms and Media
05050449_003_138.indd 2405050449_003_138.indd 24 5/19/05 4:28:57 PM5/19/05 4:28:57 PM
Sasken annual report 2004 - 2005 25
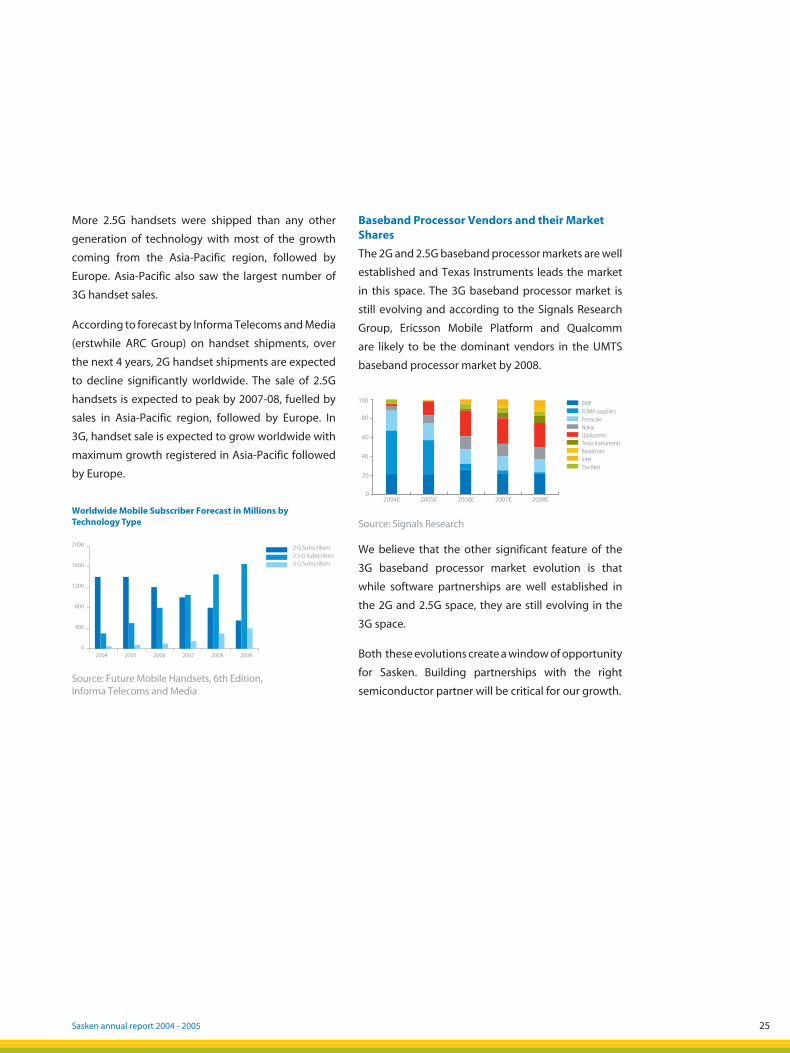
More 2.5G handsets were shipped than any other
generation of technology with most of the growth
coming from the Asia-Pacific region, followed by
Europe. Asia-Pacific also saw the largest number of
3G handset sales.
According to forecast by Informa Telecoms and Media
(erstwhile ARC Group) on handset shipments, over
the next 4 years, 2G handset shipments are expected
to decline significantly worldwide. The sale of 2.5G
handsets is expected to peak by 2007-08, fuelled by
sales in Asia-Pacific region, followed by Europe. In
3G, handset sale is expected to grow worldwide with
maximum growth registered in Asia-Pacific followed
by Europe.
Baseband Processor Vendors and their Market Shares
The 2G and 2.5G baseband processor markets are well
established and Texas Instruments leads the market
in this space. The 3G baseband processor market is
still evolving and according to the Signals Research
Group, Ericsson Mobile Platform and Qualcomm
are likely to be the dominant vendors in the UMTS
baseband processor market by 2008.
2 G Subscribers2000
1600
1200
800
400
0
2.5 G Subscribers3 G Subscribers
2004 2005 2006 2007 2008 2009
100
80
60
40
20
02004E 2005E 2006E 2007E 2008E
EMPFOMA suppliersFreescaleNokiaQualcommTexas InstrumentsBroadcomIntelThe Rest
We believe that the other significant feature of the
3G baseband processor market evolution is that
while software partnerships are well established in
the 2G and 2.5G space, they are still evolving in the
3G space.
Both these evolutions create a window of opportunity
for Sasken. Building partnerships with the right
semiconductor partner will be critical for our growth.
Worldwide Mobile Subscriber Forecast in Millions byTechnology Type
Source: Future Mobile Handsets, 6th Edition,Informa Telecoms and Media
Source: Signals Research
05050449_003_138.indd 2505050449_003_138.indd 25 5/19/05 4:28:58 PM5/19/05 4:28:58 PM

05050449_003_138.indd 2605050449_003_138.indd 26 5/19/05 4:28:58 PM5/19/05 4:28:58 PM

he last seven years at a glance. There arecompanies who grow. And then there are those who grow,but forever retain the entrepreneurship and zeal of ayoung start-up. At Sasken, our energy and innovationremains that of a pioneer, but that’s backed by maturebusiness acumen and the experience of some of the best intellectual capital.
T
05050449_003_138.indd 2705050449_003_138.indd 27 5/19/05 4:29:00 PM5/19/05 4:29:00 PM
28
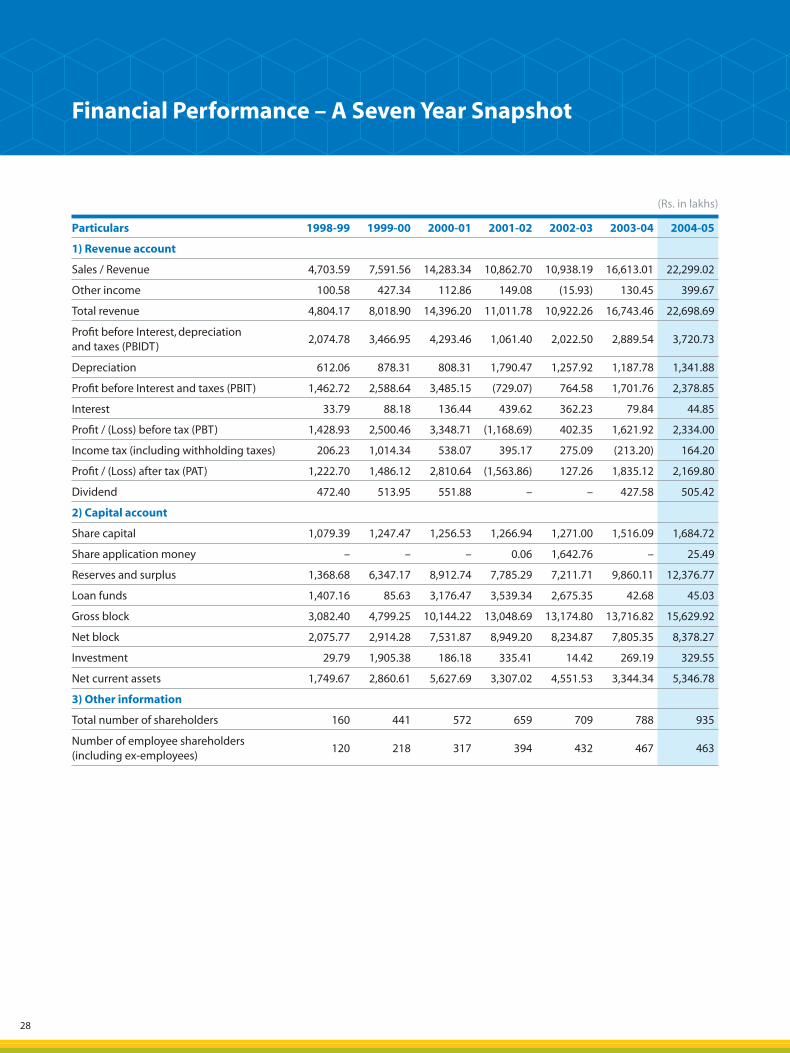
Particulars 1998-99 1999-00 2000-01 2001-02 2002-03 2003-04 2004-05
1) Revenue account
Sales / Revenue 4,703.59 7,591.56 14,283.34 10,862.70 10,938.19 16,613.01 22,299.02
Other income 100.58 427.34 112.86 149.08 (15.93) 130.45 399.67
Total revenue 4,804.17 8,018.90 14,396.20 11,011.78 10,922.26 16,743.46 22,698.69
Profi t before Interest, depreciationand taxes (PBIDT)
2,074.78 3,466.95 4,293.46 1,061.40 2,022.50 2,889.54 3,720.73
Depreciation 612.06 878.31 808.31 1,790.47 1,257.92 1,187.78 1,341.88
Profi t before Interest and taxes (PBIT) 1,462.72 2,588.64 3,485.15 (729.07) 764.58 1,701.76 2,378.85
Interest 33.79 88.18 136.44 439.62 362.23 79.84 44.85
Profi t / (Loss) before tax (PBT) 1,428.93 2,500.46 3,348.71 (1,168.69) 402.35 1,621.92 2,334.00
Income tax (including withholding taxes) 206.23 1,014.34 538.07 395.17 275.09 (213.20) 164.20
Profi t / (Loss) after tax (PAT) 1,222.70 1,486.12 2,810.64 (1,563.86) 127.26 1,835.12 2,169.80
Dividend 472.40 513.95 551.88 – – 427.58 505.42
2) Capital account
Share capital 1,079.39 1,247.47 1,256.53 1,266.94 1,271.00 1,516.09 1,684.72
Share application money – – – 0.06 1,642.76 – 25.49
Reserves and surplus 1,368.68 6,347.17 8,912.74 7,785.29 7,211.71 9,860.11 12,376.77
Loan funds 1,407.16 85.63 3,176.47 3,539.34 2,675.35 42.68 45.03
Gross block 3,082.40 4,799.25 10,144.22 13,048.69 13,174.80 13,716.82 15,629.92
Net block 2,075.77 2,914.28 7,531.87 8,949.20 8,234.87 7,805.35 8,378.27
Investment 29.79 1,905.38 186.18 335.41 14.42 269.19 329.55
Net current assets 1,749.67 2,860.61 5,627.69 3,307.02 4,551.53 3,344.34 5,346.78
3) Other information
Total number of shareholders 160 441 572 659 709 788 935
Number of employee shareholders (including ex-employees)
120 218 317 394 432 467 463
Financial Performance – A Seven Year Snapshot
(Rs. in lakhs)
05050449_003_138.indd 2805050449_003_138.indd 28 5/19/05 4:29:01 PM5/19/05 4:29:01 PM

29Sasken annual report 2004 - 2005
Financial Performance – A Seven Year Snapshot (contd.)
Particulars 1998-99 1999-00 2000-01 2001-02 2002-03 2003-04 2004-05
4) Ratios
a) Profi tability / Efficiency
Operating turnover/Total turnover (%) 97.9% 94.7% 99.2% 98.6% 100.1% 99.2% 98.2%
Other income/Total turnover (%) 2.1% 5.3% 0.8% 1.4% -0.1% 0.8% 1.8%
PBIDT/Total turnover (%) 43% 43% 30% 10% 19% 17% 16%
PBIT/Total turnover (%) 30% 32% 24% -7% 7% 10% 10%
PBT/Total turnover (%) 30% 31% 23% -11% 4% 10% 10%
PAT/Total turnover (%) 25% 19% 20% -14% 1% 11% 10%
Return on average net worth (%)
(PAT/average net worth)(%)
60% 30% 32% -16% 1% 17% 17%
Return on average capital employed (pre-tax)
(PBT+ Interest)/(average capital employed)(%)
50% 45% 33% -6% 6% 14% 19%
Return on average capital employed (post-tax)
(PAT+ Interest)/(average capital employed)(%)
43% 27% 28% -9% 4% 16% 17%
Sales to average net working capital 3.6 3.3 3.4 2.4 2.8 4.2 5.1
Total Revenues to average total assets 1.6 1.4 1.4 0.9 0.9 1.4 1.8
Fixed Assets turnover 1.5 1.6 1.4 0.8 0.8 1.2 1.4
b) Liquidity
Net working capital to total assets 0.5 0.4 0.4 0.3 0.4 0.3 0.4
Average collection period ( days ) 187 126 127 98 104 74 74
Current ratio 2.3 3.2 3.5 2.9 3.9 2.6 2.8
c) Leverage
Debt-Equity ratio 0.6 0.0 0.3 0.4 0.3 0.0 0.0
Interest cover 37.2 17.9 21.6 (2.6) 1.4 24.0 49.4
Total assets / net worth 1.6 1.0 1.3 1.4 1.3 1.0 1.0
d) Growth
Growth in operational turnover (%) 66% 61% 88% -24% 1% 52% 34%
Growth in total turnover (%) 65% 67% 80% -24% -1% 53% 36%
Net profi t growth (%) 55% 22% 89% -156% 108% 1,342% 18%
05050449_003_138.indd 2905050449_003_138.indd 29 5/19/05 4:29:02 PM5/19/05 4:29:02 PM
30
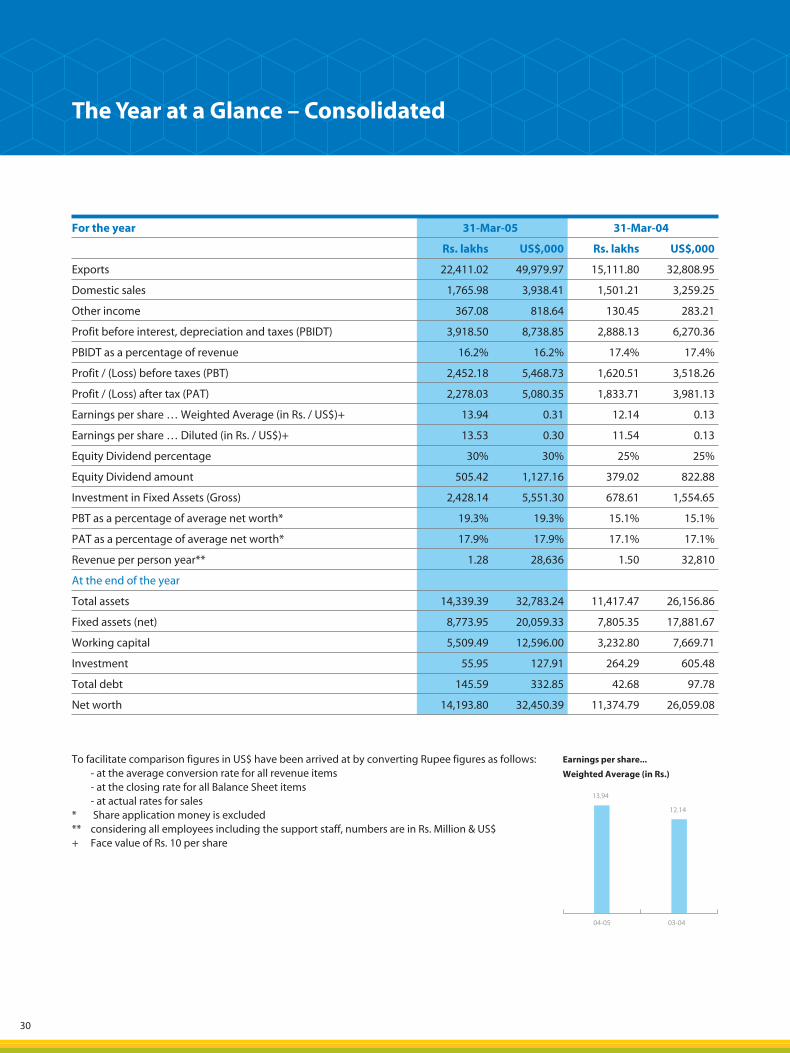
The Year at a Glance – Consolidated
For the year 31-Mar-05 31-Mar-04
Rs. lakhs US$,000 Rs. lakhs US$,000
Exports 22,411.02 49,979.97 15,111.80 32,808.95
Domestic sales 1,765.98 3,938.41 1,501.21 3,259.25
Other income 367.08 818.64 130.45 283.21
Profit before interest, depreciation and taxes (PBIDT) 3,918.50 8,738.85 2,888.13 6,270.36
PBIDT as a percentage of revenue 16.2% 16.2% 17.4% 17.4%
Profit / (Loss) before taxes (PBT) 2,452.18 5,468.73 1,620.51 3,518.26
Profit / (Loss) after tax (PAT) 2,278.03 5,080.35 1,833.71 3,981.13
Earnings per share … Weighted Average (in Rs. / US$)+ 13.94 0.31 12.14 0.13
Earnings per share … Diluted (in Rs. / US$)+ 13.53 0.30 11.54 0.13
Equity Dividend percentage 30% 30% 25% 25%
Equity Dividend amount 505.42 1,127.16 379.02 822.88
Investment in Fixed Assets (Gross) 2,428.14 5,551.30 678.61 1,554.65
PBT as a percentage of average net worth* 19.3% 19.3% 15.1% 15.1%
PAT as a percentage of average net worth* 17.9% 17.9% 17.1% 17.1%
Revenue per person year** 1.28 28,636 1.50 32,810
At the end of the year
Total assets 14,339.39 32,783.24 11,417.47 26,156.86
Fixed assets (net) 8,773.95 20,059.33 7,805.35 17,881.67
Working capital 5,509.49 12,596.00 3,232.80 7,669.71
Investment 55.95 127.91 264.29 605.48
Total debt 145.59 332.85 42.68 97.78
Net worth 14,193.80 32,450.39 11,374.79 26,059.08
To facilitate comparison figures in US$ have been arrived at by converting Rupee figures as follows:- at the average conversion rate for all revenue items- at the closing rate for all Balance Sheet items- at actual rates for sales
* Share application money is excluded** considering all employees including the support staff, numbers are in Rs. Million & US$+ Face value of Rs. 10 per share
04-05
13.94
12.14
03-04
Earnings per share...
Weighted Average (in Rs.)
05050449_003_138.indd 3005050449_003_138.indd 30 5/19/05 4:29:02 PM5/19/05 4:29:02 PM

31Sasken annual report 2004 - 2005
05050449_003_138.indd 3105050449_003_138.indd 31 5/19/05 4:29:03 PM5/19/05 4:29:03 PM

05050449_003_138.indd 3205050449_003_138.indd 32 5/19/05 4:29:03 PM5/19/05 4:29:03 PM

inancials. When one has people who are leaders,technology that’s relevant, yet ahead of it’s times, constant growth, and clients who come back, one is bound to know the secret to unlocking value.
F
05050449_003_138.indd 3305050449_003_138.indd 33 5/19/05 4:29:06 PM5/19/05 4:29:06 PM
34
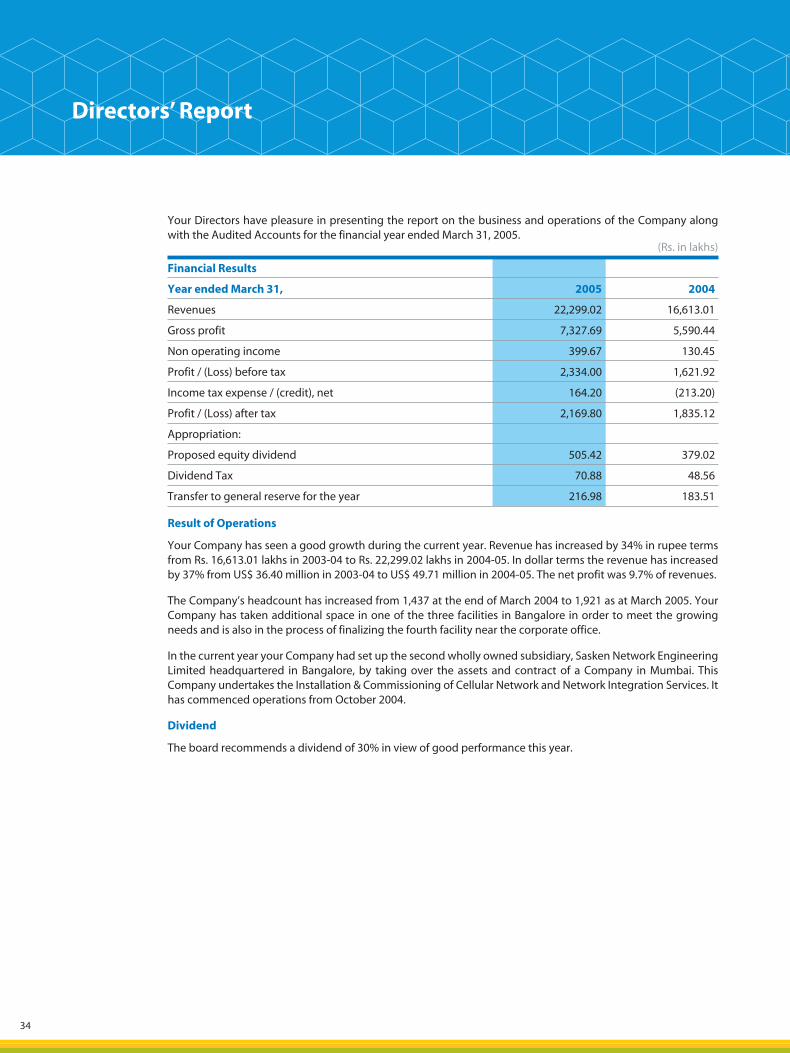
Directors’ Report
Your Directors have pleasure in presenting the report on the business and operations of the Company alongwith the Audited Accounts for the financial year ended March 31, 2005.
Financial Results
Year ended March 31, 2005 2004
Revenues 22,299.02 16,613.01
Gross profit 7,327.69 5,590.44
Non operating income 399.67 130.45
Profit / (Loss) before tax 2,334.00 1,621.92
Income tax expense / (credit), net 164.20 (213.20)
Profit / (Loss) after tax 2,169.80 1,835.12
Appropriation:
Proposed equity dividend 505.42 379.02
Dividend Tax 70.88 48.56
Transfer to general reserve for the year 216.98 183.51
Result of Operations
Your Company has seen a good growth during the current year. Revenue has increased by 34% in rupee terms from Rs. 16,613.01 lakhs in 2003-04 to Rs. 22,299.02 lakhs in 2004-05. In dollar terms the revenue has increasedby 37% from US$ 36.40 million in 2003-04 to US$ 49.71 million in 2004-05. The net profit was 9.7% of revenues.
The Company’s headcount has increased from 1,437 at the end of March 2004 to 1,921 as at March 2005. Your Company has taken additional space in one of the three facilities in Bangalore in order to meet the growingneeds and is also in the process of finalizing the fourth facility near the corporate office.
In the current year your Company had set up the second wholly owned subsidiary, Sasken Network EngineeringLimited headquartered in Bangalore, by taking over the assets and contract of a Company in Mumbai. This Company undertakes the Installation & Commissioning of Cellular Network and Network Integration Services. It has commenced operations from October 2004.
Dividend
The board recommends a dividend of 30% in view of good performance this year.
(Rs. in lakhs)
05050449_003_138.indd 3405050449_003_138.indd 34 5/19/05 4:29:07 PM5/19/05 4:29:07 PM
Sasken annual report 2004 - 2005 35
Further issue of equity
The following shares were issued during the year:
Particulars Date ofAllotment
No. ofshares
Details
Issued to strategic investor 16.07.2004 3,266,667 Shares of Rs. 5/- each were issuedon conversion of warrants issue earlier
Issued for consolidation 16.07.2004 120 Shares of Rs. 5/- each were issued for consolidation of Shares of
Rs. 5/- into Shares of Rs. 10/- each
Issued on exercise of ESOP vested inOctober 2004
19.10.2004 34,570 Share of Rs. 10/- each were issued to theemployees who have exercised their ESOPs
vested on 1st October 2004
Issued on exercise of ESOP vested inOctober 2004
25.01.2005 18,440 Share of Rs. 10/- each were issued to theemployees who have exercised their ESOPs
vested on 1st October 2004
Borrowings
Currently the Company enjoys no other credit facility from banks/institutions except working capital credit.
Sasken Employee Stock Option Plan
In addition to the options issued in April 2004 to all the employees who were in rolls of the Company as onMarch 31, 2004, the Company has extended ESOP to some of its employees on Potential and Performance basis in June 2004. The total number of ESOPs issued under the scheme is 971,533 options of Rs. 10 each (1,943,066options of Rs. 5/- each at the time of issue).
In January 2005, Company has extended ESOP to the employees of its subsidiary Company, viz. Sasken NetworkSystems Limited. The total number of ESOPs issued under this category is 42,530 of Rs.10/- each.
In January 2005, Company had also issued 2,735 options of Rs. 10/- each to some employees of Sasken who weremissed out earlier.
The details required under SEBI (Employee Stock Option Scheme & Employee Stock Purchase Scheme), Guidelines 1999, as on 31st March 2005 are annexed to this Report.
The Company believes in philosophy of sharing wealth with its employees and encourages the employees to bepartners in the growth of the organization.
Patents
The Company encourages the employees to file for Patent, so that the R&D investment translates into economicbenefit for the organization. The Company as on date has filed a total of 32 Patent applications out of which 5patents have been granted by the US Patent and Trademark Office for the inventions.
Directors’ Report (contd.)
3
05050449_003_138.indd 3505050449_003_138.indd 35 5/19/05 4:29:07 PM5/19/05 4:29:07 PM
36
Award
The Board is pleased to inform you that your Company has been rated by the Business Today-Mercer survey“The Best Companies to work for in India” and the results were published in the Business Today issue dated 21st
November 2004. The Business Today has ranked Sasken as the #1 Company to work for in India.
Certification
During the year under report, your Company has become the first Indian organisation in the telecom softwaresector to be certified to the BS 7799 standard. This assures your Company’s customers and partners of informationand data protection through controlled procedures, policies and best practices and is a comprehensivespecification that defines the requirements for establishing, implementing and documenting an effectiveinformation security management system.
Conservation of Energy, Technology Absorption and Foreign Exchange Outgo
Information in accordance with the provisions of Section 217(1)(e) of the Companies Act, 1956, read withCompanies (Disclosure of Particulars in the Report of Board of Directors) Rules, 1988, regarding conservationof energy, technology absorption and foreign exchange earnings and outgo, is given in the Annexure formingpart of this Report.
Particulars of Employees
As required by the provisions of Section 217(2A) of the Companies Act, 1956, read with the Companies (Particulars of Employees) Rules, 1975, as amended, the names and other particulars of the employees are set out in the annexure to this report.
Corporate Governance
The detailed report on Corporate Governance at Sasken is provided separately in this Annual Report.
Directors’ Responsibility Statement
Directors’ Responsibility Statement as required under Section 217 (2AA) of the Companies Act, 1956, is given inthe Annexure forming part of this report.
Directors
Prof. J Ramachandran and Mr. Vinod Dham retire by rotation at the ensuing Annual General Meeting and beingeligible offer themselves for re-appointment.
During the year, Mr. Shirish B Mody and Mr. Suresh Dholakia resigned from the Board. Consequent to resignationof Mr. Shirish B Mody, the office of Mr. Bansi S Mehta who was an alternate director to Mr. Shirish B Mody has got vacated and Mr. Bansi S Mehta was subsequently appointed as an Additional Director effective 19th October 2004. Consequent to the resignation of Mr. Suresh Dholakia the office of Mr. Mahendra J Jhaveri an alternatedirector to Mr. Suresh Dholakia also got vacated.
The Directors place on record their appreciation of services provided by Mr. Shirish B. Mody and Mr. SureshDholakia during their tenure.
Directors’ Report (contd.)
05050449_003_138.indd 3605050449_003_138.indd 36 5/19/05 4:29:07 PM5/19/05 4:29:07 PM
Sasken annual report 2004 - 2005 37
Effective 1st April 2005 Mr. Pranabh D Mody stepped down from the position of Whole-time Director. However,he continues to be a Director on the Board of the Company.
On 25th January 2005, Dr. G. Venkatesh was appointed as an additional Director of the Company and was appointed as Whole-time Director of the Company.
At the Annual General Meeting held on 24th May 2000, Mr. Rajiv C. Mody and Mr. Krishna J. Jhaveri were appointedas Chairman & Managing Director and Whole-time Director respectively for a period of five years and their termexpired on 31st March 2005. The Board at its meeting held on 19th April 2005 reappointed them for a further period of five years with effective from 1st April 2005. The terms of appointment are detailed in the Noticeconvening the Annual General Meeting.
Contribution to society
In line with the Company’s belief of being a responsible corporate citizen, the Company contributes to various social and educational causes that bring out excellence & well being of the society. Accordingly the Companycontributed Rs. 22.40 lakhs to various organizations in the current year.
Dematerialization of equity shares
One of the good measures that the Company has initiated as an investor friendly move was dematerializationof shares, which was well appreciated by our shareholders. At present the shares of the Company can bedematerialized with National Securities Depositories Limited (NSDL). As on 31st March 2005, more than 38 % ofthe shares have been dematerialized.
Deposits
The Company has neither accepted nor renewed any deposits during the year under review. As such, no amount of principal and/or interest is outstanding as on the balance sheet date.
Auditors
M/s S R Batliboi & Co., auditors of the Company, retire at the forthcoming Annual General Meeting and haveconfirmed their eligibility and willingness to accept the office, if reappointed.
Acknowledgement
Your directors would like to place on record, their appreciation to customers, shareholders, vendors, UnionBank of India, HDFC Bank, Citibank N.A., Dena Bank, the STPI Bangalore, RBI and all Governmental and statutoryagencies for their cooperation and invaluable support. Your directors would also like to thank the employees for their valuable contribution and also seeing that the Company is back into growth path.
For and on behalf of the Board of Directors
Place: Bangalore Rajiv C ModyDate : April 19, 2005 Chairman & Managing Director
Directors’ Report (contd.)
05050449_003_138.indd 3705050449_003_138.indd 37 5/19/05 4:29:07 PM5/19/05 4:29:07 PM
38
Annexure to the Directors’ Report
Particulars pursuant to the provisions of Section 217(1)(e) of the Companies Act, 1956, read with Companies (Disclosure of Particulars in the Report of Board of Directors) Rules, 1988.
A) Conservation of Energy
Though the Company does not have energy intensive operations, it continues to adopt energy conservationmeasures.
Energy conservation programs adopted by the Company are (i) Continuous monitoring of energy consumption(ii) Bi-weekly “Cost review” with action plans on effective utilization of Power (iii) Optimizing HVAC and other plant & machinery system performance to reduce cost.
Further the Company is implementing the learnings from other industries through benchmarking and alsoencouraging our maintenance engineers to go in for Energy Audit Certification.
B) Research and Development and Technology Absorption
Emphasis was placed during the year on improving the performance of existing products and we also undertookR&D in the areas of DSL, multimedia codecs and applications and mobile protocol stacks. The above products have reached considerable maturity and also have been deployed in the field.
The following is a description of the Research and Development efforts during the financial year:
Patents:
The Company began to develop intellectual property in 1997.
Filing of patents continues to be a significant aspect of the Company’s business strategy. Patents help inincreasing the value of the licensed IP and it also helps in defending against IP infringement claims. Till the endof the last financial year, the Company had filed a total of 32 applications for patents of which 5 patents havebeen granted and 6 Patent Co-operation Treaty applications has also been filed.
Five of our patent applications were granted by the USPTO during the year.
These are:
(a) Peak Power to average power ratio reduction in multi carrier communication systems using error correctingcode.
(b) A Technique for peak power to average power ratio reduction in multi carrier communication systems.
(c) Data decompression technique for image processing.
(d) Memory architecture for parallel data access along any given dimension of an n-dimensional rectangular data array.
(e) Clock recovery in multi-carrier transmission systems.
C) Foreign Exchange Earnings and Outgo (Rs. in Lakhs)
Foreign exchange earnings 21,798.71
Foreign exchange outgo(Including capital goods purchased, recovery of travel expenses and dividendpaid in foreign currency)
5,677.70
05050449_003_138.indd 3805050449_003_138.indd 38 5/19/05 4:29:08 PM5/19/05 4:29:08 PM
Sasken annual report 2004 - 2005 39
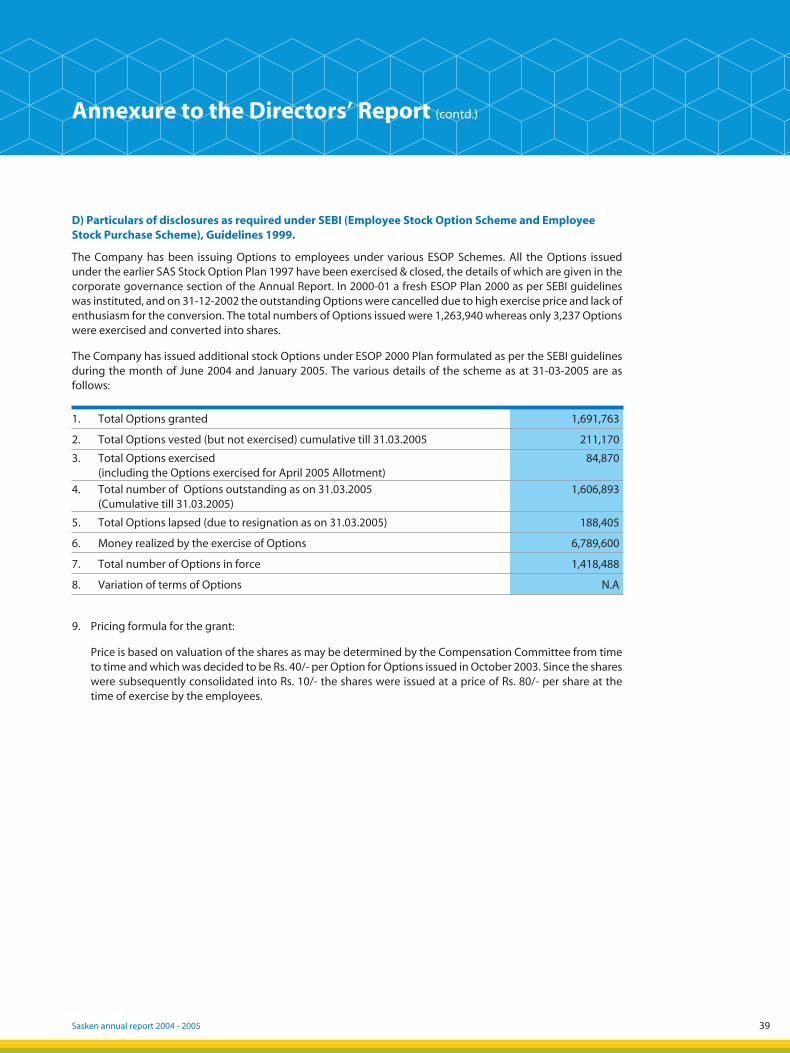
D) Particulars of disclosures as required under SEBI (Employee Stock Option Scheme and EmployeeStock Purchase Scheme), Guidelines 1999.
The Company has been issuing Options to employees under various ESOP Schemes. All the Options issuedunder the earlier SAS Stock Option Plan 1997 have been exercised & closed, the details of which are given in thecorporate governance section of the Annual Report. In 2000-01 a fresh ESOP Plan 2000 as per SEBI guidelines was instituted, and on 31-12-2002 the outstanding Options were cancelled due to high exercise price and lack ofenthusiasm for the conversion. The total numbers of Options issued were 1,263,940 whereas only 3,237 Options were exercised and converted into shares.
The Company has issued additional stock Options under ESOP 2000 Plan formulated as per the SEBI guidelines during the month of June 2004 and January 2005. The various details of the scheme as at 31-03-2005 are as follows:
1. Total Options granted 1,691,763
2. Total Options vested (but not exercised) cumulative till 31.03.2005 211,170
3. Total Options exercised(including the Options exercised for April 2005 Allotment)
84,870
4. Total number of Options outstanding as on 31.03.2005(Cumulative till 31.03.2005)
1,606,893
5. Total Options lapsed (due to resignation as on 31.03.2005) 188,405
6. Money realized by the exercise of Options 6,789,600
7. Total number of Options in force 1,418,488
8. Variation of terms of Options N.A
9. Pricing formula for the grant:
Price is based on valuation of the shares as may be determined by the Compensation Committee from timeto time and which was decided to be Rs. 40/- per Option for Options issued in October 2003. Since the shares were subsequently consolidated into Rs. 10/- the shares were issued at a price of Rs. 80/- per share at thetime of exercise by the employees.
Annexure to the Directors’ Report (contd.)
05050449_003_138.indd 3905050449_003_138.indd 39 5/19/05 4:29:08 PM5/19/05 4:29:08 PM
40
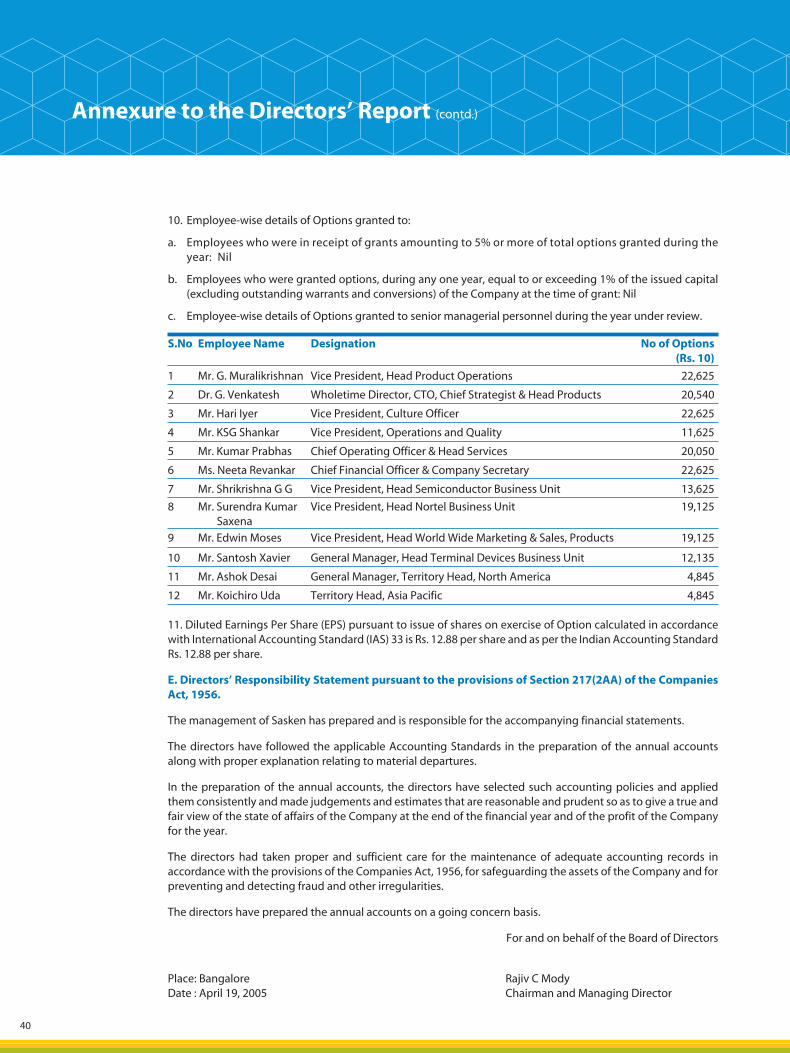
10. Employee-wise details of Options granted to:
a. Employees who were in receipt of grants amounting to 5% or more of total options granted during theyear: Nil
b. Employees who were granted options, during any one year, equal to or exceeding 1% of the issued capital(excluding outstanding warrants and conversions) of the Company at the time of grant: Nil
c. Employee-wise details of Options granted to senior managerial personnel during the year under review.
S.No Employee Name Designation No of Options (Rs. 10)
1 Mr. G. Muralikrishnan Vice President, Head Product Operations 22,625
2 Dr. G. Venkatesh Wholetime Director, CTO, Chief Strategist & Head Products 20,540
3 Mr. Hari Iyer Vice President, Culture Officer 22,625
4 Mr. KSG Shankar Vice President, Operations and Quality 11,625
5 Mr. Kumar Prabhas Chief Operating Officer & Head Services 20,050
6 Ms. Neeta Revankar Chief Financial Officer & Company Secretary 22,625
7 Mr. Shrikrishna G G Vice President, Head Semiconductor Business Unit 13,625
8 Mr. Surendra Kumar Saxena
Vice President, Head Nortel Business Unit 19,125
9 Mr. Edwin Moses Vice President, Head World Wide Marketing & Sales, Products 19,125
10 Mr. Santosh Xavier General Manager, Head Terminal Devices Business Unit 12,135
11 Mr. Ashok Desai General Manager, Territory Head, North America 4,845
12 Mr. Koichiro Uda Territory Head, Asia Pacific 4,845
11. Diluted Earnings Per Share (EPS) pursuant to issue of shares on exercise of Option calculated in accordancewith International Accounting Standard (IAS) 33 is Rs. 12.88 per share and as per the Indian Accounting StandardRs. 12.88 per share.
E. Directors’ Responsibility Statement pursuant to the provisions of Section 217(2AA) of the Companies Act, 1956.
The management of Sasken has prepared and is responsible for the accompanying financial statements.
The directors have followed the applicable Accounting Standards in the preparation of the annual accounts along with proper explanation relating to material departures.
In the preparation of the annual accounts, the directors have selected such accounting policies and appliedthem consistently and made judgements and estimates that are reasonable and prudent so as to give a true andfair view of the state of affairs of the Company at the end of the financial year and of the profit of the Companyfor the year.
The directors had taken proper and sufficient care for the maintenance of adequate accounting records inaccordance with the provisions of the Companies Act, 1956, for safeguarding the assets of the Company and for preventing and detecting fraud and other irregularities.
The directors have prepared the annual accounts on a going concern basis.
For and on behalf of the Board of Directors
Place: Bangalore Rajiv C ModyDate : April 19, 2005 Chairman and Managing Director
Annexure to the Directors’ Report (contd.)
05050449_003_138.indd 4005050449_003_138.indd 40 5/19/05 4:29:08 PM5/19/05 4:29:08 PM
Sasken annual report 2004 - 2005 41
Corporate Governance
Sasken is committed to long-term shareholder value creation, on the foundation of good governance.
Authority and responsibilities are allocated among Shareholder’s of the Company, Board of Directors andmanagement by Corporate Governance. The shareholders form the supreme body and they decide matters of importance which by law are to be decided by them. They appoint the members of Board of Directors.The Board governs the affairs of the Company and is responsible for appointing, overseeing and evaluatingthe management of the Company and is responsible to the shareholders. The management runs the day-to-day operations of the Company subject to the guidance and authority of the Board and is responsible to theBoard and Shareholders. There are Committees of the Board which evaluate and guide on matters like audit and accounts, compensation etc The system should enhance goal setting, decision making and appropriatemonitoring of compliance and performance within a framework of strong corporate values.
Effective governance requires a proactive, focused state of mind on the part of directors, the CEO and senior management, all of whom must be committed to success by carrying out their responsibilities with the highest standard of ownership and ethics.
Corporate values
Corporate values shape the governance of a Company. The following are the key values that serve as thefoundation on which Sasken is governed.
a) Integrityb) Respectc) Innovationd) Customer Intimacye) Excellence
Role of the board
The responsibility of governing the Company and directing the management of the Company in the day to dayoperations rests with the Board. Accepting and understanding this, the members of the Board maintain a highdegree of character and competence both as individuals and as a team. It demonstrates through its operations the uncompromising integrity and professionalism in the conduct of our business.
The constitution of the board and the committees and the contribution to the corporate governance arediscussed in detail in the following paragraphs.
1. Board Composition and membership
Board members are expected to possess the requisite expertise and experience to be able to guide your Company. Expertise and depth of experience in one or more of strategy, finance, technology, marketing andhuman resource matters is essential. Another requirement for Board membership is independence, based uponthe absence of relationships and interests that could compromise, or could be perceived as compromising theability of a director to exercise judgment in the best interests of the Company. Subject to Board review andmodification in specific instances, criteria that could vitiate such independence would include:
• Current or previous (within five years before) employment with the Company or any of its affiliates. This criterion will not apply to Executive directors.
• Member of the immediate family of an Executive Officer or Director of the Company.
• Any business relationship with the Company or interest in any significant transactions involving the Company,except as a director or shareholder or as a supplier or customer in the ordinary course of business.
05050449_003_138.indd 4105050449_003_138.indd 41 5/19/05 4:29:09 PM5/19/05 4:29:09 PM
42
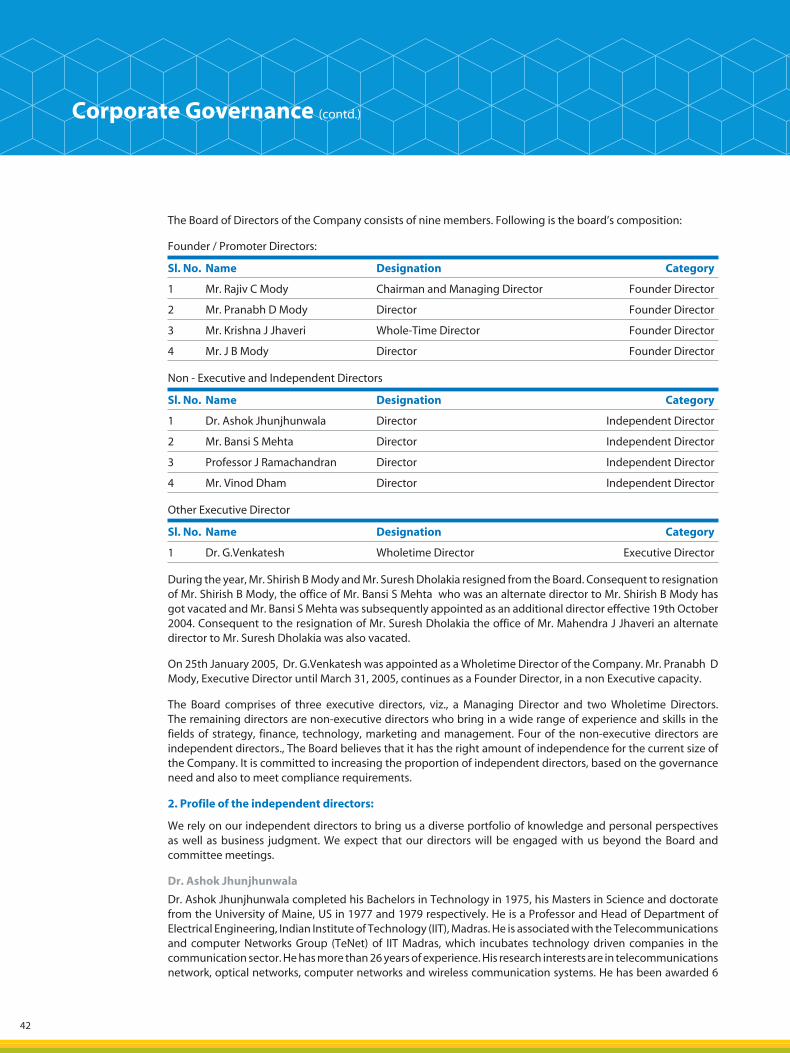
The Board of Directors of the Company consists of nine members. Following is the board’s composition:
Founder / Promoter Directors:
Sl. No. Name Designation Category
1 Mr. Rajiv C Mody Chairman and Managing Director Founder Director
2 Mr. Pranabh D Mody Director Founder Director
3 Mr. Krishna J Jhaveri Whole-Time Director Founder Director
4 Mr. J B Mody Director Founder Director
Non - Executive and Independent Directors
Sl. No. Name Designation Category
1 Dr. Ashok Jhunjhunwala Director Independent Director
2 Mr. Bansi S Mehta Director Independent Director
3 Professor J Ramachandran Director Independent Director
4 Mr. Vinod Dham Director Independent Director
Other Executive Director
Sl. No. Name Designation Category
1 Dr. G.Venkatesh Wholetime Director Executive Director
During the year, Mr. Shirish B Mody and Mr. Suresh Dholakia resigned from the Board. Consequent to resignationof Mr. Shirish B Mody, the office of Mr. Bansi S Mehta who was an alternate director to Mr. Shirish B Mody has got vacated and Mr. Bansi S Mehta was subsequently appointed as an additional director effective 19th October 2004. Consequent to the resignation of Mr. Suresh Dholakia the office of Mr. Mahendra J Jhaveri an alternatedirector to Mr. Suresh Dholakia was also vacated.
On 25th January 2005, Dr. G.Venkatesh was appointed as a Wholetime Director of the Company. Mr. Pranabh DMody, Executive Director until March 31, 2005, continues as a Founder Director, in a non Executive capacity.
The Board comprises of three executive directors, viz., a Managing Director and two Wholetime Directors.The remaining directors are non-executive directors who bring in a wide range of experience and skills in thefields of strategy, finance, technology, marketing and management. Four of the non-executive directors areindependent directors., The Board believes that it has the right amount of independence for the current size ofthe Company. It is committed to increasing the proportion of independent directors, based on the governanceneed and also to meet compliance requirements.
2. Profile of the independent directors:
We rely on our independent directors to bring us a diverse portfolio of knowledge and personal perspectives as well as business judgment. We expect that our directors will be engaged with us beyond the Board andcommittee meetings.
Dr. Ashok Jhunjhunwala
Dr. Ashok Jhunjhunwala completed his Bachelors in Technology in 1975, his Masters in Science and doctoratefrom the University of Maine, US in 1977 and 1979 respectively. He is a Professor and Head of Department ofElectrical Engineering, Indian Institute of Technology (IIT), Madras. He is associated with the Telecommunications and computer Networks Group (TeNet) of IIT Madras, which incubates technology driven companies in thecommunication sector. He has more than 26 years of experience. His research interests are in telecommunications network, optical networks, computer networks and wireless communication systems. He has been awarded 6
Corporate Governance (contd.)
05050449_003_138.indd 4205050449_003_138.indd 42 5/19/05 4:29:09 PM5/19/05 4:29:09 PM
Sasken annual report 2004 - 2005 43
patents and has 2 pending patent applications. Dr. Jhunjhunwala is an authority on telecommunications andis associated with the telecom task force under the Ministry of Communications and Information Technology,Government of India. He has made significant contributions in the area of academic-industry interaction and is avisionary on telecom policy matters. He is the recipient of several awards, including the Shanti Swarup Bhatnagar award in 1998 and the Padma Shri in 2002. He is on the board of directors of several companies, including VideshSanchar Nigam Limited (VSNL) and Bharat Sanchar Nigam Limited (BSNL).
Mr. Bansi S Mehta
Mr. Bansi S Mehta is managing partner of Bansi S. Mehta & Co., Chartered Accountants. He has been the President of the Institute of Chartered Accountants of India from 1981 to 1982 and a member of various committees ofinternational accounting bodies. He is an authority on financial management and taxation issues. He is on theboard of directors of several companies and statutory bodies.
Professor J Ramachandran
Professor J Ramachandran is BOC chair professor of business policy at the Indian Institute of Management (IIM),Bangalore. He is a qualified chartered accountant and a cost accountant, and obtained his doctorate from IIM,Ahmedabad. His major research interests are in the areas of corporate transformation and competitive strategy.An award winning teacher and case writer, Prof. Ramachandran is currently engaged in studying the globalcompetitiveness of Indian firms in the pharmaceutical, software and auto component industries. He has beenthe Harry Reynolds Visiting International Professor at the Wharton School of the University of Pennsylvania;and a Visiting Professor at INSEAD, Fontainebleau, France and the Carlson School of Management, Universityof Minnesota, USA. He has also been a member of the Sub Committee on Strategy in Non-US Settings, Business Policy & Strategy Division of the Academy of Management, USA. He is currently the Chairperson of ExecutiveEducation at the IIM. Prior to joining the faculty at IIM, Bangalore, he was Vice President (Management Services)at Reliance Industries Limited. In addition to his teaching and publishing credits, Professor J Ramachandranhas served as a consultant to various Indian and multinational companies, including Daimler Chrysler, Hewlett Packard, Philips, ITC, Colgate Palmolive, Hoechst, Siemens, Wipro, Infosys, Wockhardt, United Breweries, Eicher,Madras Refineries and LIC. He is also a member of the Board of Directors of a number of technology and start up firms.
Mr. Vinod Dham
Mr. Vinod Dham has done his bachelors in Electrical Engineering from the Delhi College of Engineering andMasters in Electrical Engineering from University of Cincinnati, US. He worked in various capacities for 16 years at Intel and rose to the designation of Vice President. He was the leader of Intel’s Pentium chip development teamin the early 1990s and is referred to in popular press as the “Father of the Pentium”. He later moved to NexGen,US (later known as Advanced Micro Devices) and worked on development of a competitor to the Pentiumprocessor. He also started Silicon Spice, to develop a VOIP chip, which Company was later sold to Broadcom.Mr. Dham is the co-founder and managing member of New Path Ventures LLC. He is also on the board of severalcompanies worldwide and has several years of technology, business and entrepreneurial experience.
3. Membership term
In accordance with the Companies Act, 1956, and the Articles of Association of the Company, two thirds of theBoard is liable for retirement by rotation of which one third shall retire by rotation at the annual general meetingevery year. The person holding the office for the longest period shall be the one to retire. The Executive directors are appointed for a maximum term of five years at a time.
4. Board processes
Board Meeting & Deliberations
The Chairman of the Board establishes the agenda for each Board Meeting. Members of Board are free to suggest inclusion of items on the agenda, in addition to their right to bring up matters for discussion at the meeting withthe permission of the Chairman.
Corporate Governance (contd.)
05050449_003_138.indd 4305050449_003_138.indd 43 5/19/05 4:29:09 PM5/19/05 4:29:09 PM
44
Information and data that are important to the Board’s understanding of the business in general, and relating tomatters tabled for discussion at a meeting in particular are distributed in writing to the members of the Boardsufficiently in advance of the meeting. Sensitive material, however, is presented for discussions at the meetingonly.
Board Meetings and Procedures
The Board meets at least four times in a year at quarterly intervals and more frequently if deemed necessary totransact its business. Board members normally resident overseas attend as many meetings as they convenientlycan, but agree if so required and arranged for, to participate in Board deliberations through audio / videoconferencing and/or by written submissions to the Chairman. The Management Council attends board meetings during operational reviews.
The Board at its discretion invites any Executive Officer of the Company and/or outside advisors to their meeting.
5. Chairman of the Board and the Chief Executive Officer
The chairman of the board, Mr. Rajiv C Mody is a founder director and is also the Chief Executive Officer of theCompany. The Company believes that, considering its current size of operations, there is no need for a non-executive chairman currently.
During the year the Company restructured around two divisions viz. services division and product division. This re-structuring allows Sasken to have a sharper focus on both the Products and the Services businesses. Thenature of the two business demands differing kinds of focus. The time frames for business maturity and drivers for success in the products business differ significantly from the cycles that a services business goes through. Therestructuring allows Sasken to maximize the opportunity markets are presenting today. The Services Divisionis headed by Prabhas Kumar who also continues as the Chief Operating Officer of the Company. The Products Division is headed by Dr. G.Venkatesh who also continues to play the role of Sasken’s Chief Technology andStrategy Officer.
The Chairman & Managing Director and CEO is responsible for all board matters. He is also responsible for corporate strategy, enhancing the brand value of Sasken, meeting customers and investors and maintainingthese relationships, fostering a good work culture in the organization, and ensuring quality of our offerings.
The COO and CSO, in their capacity as head of the respective divisions are responsible for all operational matters,which include achievement of the annual business plan.
6. Relationship with the management
The management of the business of Sasken is conducted under the supervision of the Chairman and ManagingDirector (CMD) and by Management Council to whom the management function is properly delegated by theCMD. CMD functions under the direction, control and supervision of the board.
Communication between the directors and management is normally through the office of the CMD. Apart fromthe regular communication before each of the board/ committee meetings, views of the members of the board/committee are taken from time to time on all-important matters.
Corporate Governance (contd.)
05050449_003_138.indd 4405050449_003_138.indd 44 5/19/05 4:29:10 PM5/19/05 4:29:10 PM
Sasken annual report 2004 - 2005 45
7. Remuneration of the Board Members
The compensation committee approved the compensation payable to all the Executive directors, within theoverall limits approved by the shareholders and in accordance with the provisions of the Companies Act, 1956.
The following table shows the amounts paid to the executive directors during the year:
Name Designation Salary(Rs.)
QPIC(Rs.)
Mr. Rajiv C Mody Chairman & Managing Director, CEO 4,000,000 1,816,277
Mr. Pranabh D Mody Wholetime Director 2,945,714 867,051
Mr. Krishna J Jhaveri Wholetime Director 9,407,980 1,750,000
Dr. G.Venkatesh * Wholetime Director 361,111 216,667
* For part of the year
The following paragraphs provide the details about the remuneration for the year ended 31st March 2005.The remuneration proposed from 1st April 2005 is as per the notice sent to shareholders which is to be read inconjunction with the following details, to the extent applicable.
(i) All elements of remuneration package such as salary, benefits, bonuses, stock options, pensions etc of all thedirectors:
The remuneration payable to the executive directors is broken into two parts viz., fixed pay, and QPIC. QPIC, theQuarterly Performance Indexed Compensation is paid on the basis of performance parameters set for each ofthe Executive directors, at the beginning of the year, in consultation with the CEO. The compensation committeeperiodically reviews the performance of the executive directors. Fixed pay is determined by the compensationcommittee within the limits set by the shareholders. QPIC payable to the executive directors for the year is determined by the compensation committee on the performance of the directors and also of the Company. Thedetails of the fixed pay and QPIC paid/payable for the year 2004-05 are given in the succeeding paragraphs.
Contribution towards provident and superannuation funds is as per the Company’s policy and forms part of thefixed pay.
The Company compensates the independent directors who have been co-opted to various committees of theboard for the quality time and professional advice these eminent personalities bring to the organization. Thenon- executive directors are presently paid sitting fees for attending the board meetings. Remuneration paid/payable to independent directors is as under:
Sl.No. Name of the independent director Amount
1 Mr. Bansi S Mehta Rs. 6 lakhs
2 Professor J Ramachandran Rs. 6 lakhs
3 Dr. Ashok Jhunjhunwala Rs. 6 lakhs
4 Mr. Vinod Dham US$ 20,000
Corporate Governance (contd.)
05050449_003_138.indd 4505050449_003_138.indd 45 5/19/05 4:29:10 PM5/19/05 4:29:10 PM
46
(ii) Details of fixed component and performance-linked incentive for the year ended 31st March 2005 are as follows:
Particulars Rajiv C Mody(Rs. lakhs)
Pranabh D Mody(Rs. lakhs)
Krishna J Jhaveri(US$)
G.Venkatesh(Rs. lakhs)
Fixed Pay – proposed** 40.00 30.00 200,000 3.62
Fixed Pay – Paid 40.00 29.45 200,000 3.61
QPIC – proposed ** 50.00 14.00 40,000 2.17
QPIC – Paid / Payable 18.16 8.67 40,000 2.17
Total remuneration paid 58.16 38.13 240,000 5.78
** Approved by shareholders. For Dr. G.Venkatesh it is subject to the approval of the shareholders in the ensuingAnnual General Meeting of the Company.
(iii) Service Contracts, notice period, severance fees
As applicable to other employees of the Company. The managerial personnel are appointed for a period of5 years at a time. No severance fee is payable to any of them, and each of them will provide a three monthnotice period.
(iv) Stock Option details, if any, and whether the same has been issued to directors at a discount as well as theperiod over which accrued and over which exercisable: -
Dr. G.Venkatesh who has been inducted into the Board on 25th January 2005 as Executive Director has beenallotted 20,540 options under the ESOP scheme during the current year. None of the other directors havebeen granted any options.
7. Board meetings
The board normally meets once in a quarter. Additional meetings are held as and when required to discuss matters which are urgent. For the financial year ended 31st March 2005, the Board met 5 times viz., April 20, 2004,June 11, 2004, July 16, 2004, October 19, 2004 and January 25, 2005.
8. Committees of the Board
Board of Directors have established the committees to look into specific areas and give their valuable inputs in certain decision making by the board. Committees of the board have been consisting of Non- ExecutiveDirectors to the extent practicable.
1. Audit Committee2. Compensation Committee and3. Share Transfers and Investor Grievance Committee.
The audit committee, and the compensation committee consist entirely of non-executive, independent directors. The Share Transfers and Investor Grievance Committee consist of Executive directors.
Corporate Governance (contd.)
05050449_003_138.indd 4605050449_003_138.indd 46 5/19/05 4:29:10 PM5/19/05 4:29:10 PM
Sasken annual report 2004 - 2005 47
Audit Committee
The purpose of the audit committee is to ensure the objectivity, credibility and correctness of the Company’s financial reporting and disclosure processes, internal controls, risk management policies and processes, taxpolicies, compliance and legal requirements and associated matters.
Sl. No. Name Title Financial expertise / literacy Status
1 Mr. Bansi S MehtaChairman of Audit Committee
ExpertiseIndependent,
Non-executive director
2 Dr. Ashok Jhunjhunwala Member LiteracyIndependent,
Non-executive director
3Professor JRamachandran
Member ExpertiseIndependent,
Non-executive director
The terms of reference of the audit committee are as follows:
1. Regular review of accounts, accounting policies, disclosures etc.
2. Review of the major accounting entries based on exercise of judgment by management and review ofsignificant adjustments arising out of audit .
3. Qualifications in the draft audit report.
4. Establishing and reviewing the scope of the independent audit including the observations of the auditors and review of the quarterly, half- yearly and annual financial statements before submission to the Board.
5. The Committee shall have post audit discussions with the independent auditors to ascertain any area ofconcern.
6. Establishing the scope and frequency of internal audit, reviewing the findings of the internal auditors andensuring the adequacy of internal control systems.
7. To look into reasons for substantial defaults in the payment to depositors, debenture holders, shareholders and creditors.
8. To look into the matters pertaining to the Director’s Responsibility Statement with respect to compliancewith Accounting Standards and accounting policies.
9. Compliance with legal requirements of the Stock Exchange concerning financial statements, to the extent applicable.
10. The Committee shall look into any related party transactions i.e., transactions of the Company of materialnature, with promoters or management, their subsidiaries or relatives etc. that may have potential conflict with the interests of Company at large.
11. Appointment and remuneration of statutory and internal auditors.
12. Such other matters as may from time to time be required by any statutory, contractual or other regulatoryrequirements to be attended to by the Audit Committee.
The audit committee met 4 times during the year on April 19, 2004, July 16, 2004, October 19, 2004 and January24, 2005.
The attendance at audit committee meetings during the year is as follows:
Name of director April 19, 2004 July 16, 2004 October 19, 2004 January 24, 2005
Mr. Bansi S Mehta Yes Yes Yes No
Dr. Ashok Jhunjhunwala Yes Yes Yes Yes
Professor J Ramachandran Yes Yes No Yes
Corporate Governance (contd.)
05050449_003_138.indd 4705050449_003_138.indd 47 5/19/05 4:29:11 PM5/19/05 4:29:11 PM
48
During each meeting, the Audit Committee met with the statutory auditors and the internal auditors.The ChiefFinancial Officer was present at the audit committee meetings. The minutes of the Audit Committee meetings are placed before the Board at the succeeding Board meeting for information. The management representedto the Committee that the Company’s financial statements were prepared in accordance with generallyaccepted accounting principles. The committee discussed with the auditors the companies audited financialstatements, including the reasonableness of significant judgements and the extent of disclosures in the financialstatements.
The committee also reviewed with the internal auditors and the management, the internal controls prevalent in the Company, and the areas of improvement. In conducting such reviews, the committee found no materialdiscrepancy or weakness in the internal control systems of the Company.
The committee recommended to the Board, the appointment of M/s. S R Batliboi & Co Chartered Accountants,as the statutory auditors of the Company for the fiscal year ending March 31, 2006. The appointment ofM/s. Ernst and Young has been recommended for carrying out the audit under US GAAP. The committee alsorecommended the appointment of M/s. S B Billimoria and Co. as the internal auditors of the Company for thefiscal year ending March 31, 2006.
Compensation Committee
The committee’s goal is to ensure that the Company attracts and retains highly qualified employees in accordancewith its business plans, that the Company fulfils its ethical and legal responsibilities to its employees, and that management compensation is appropriate.
Professor J Ramachandran chairs the Compensation Committee. The other members of the committee areDr. Ashok Jhunjhunwala and Mr. Vinod Dham.
The terms of reference of the Compensation Committee is given below.
1. To determine the remuneration, review performance and decide on QPIC and variable pay of executivedirectors.
2. To determine the number of stock options to be granted under the Company’s Employees stock OptionSchemes and administration of the stock option plan.
3. Such other matters as may from time to time be required by any statutory, contractual or other regulatoryrequirements to be attended to by the Compensation Committee.
4. Establishment and administration of employee compensation and benefit plans.
The compensation committee met four times on 20th April 2004, 16th July 2004, 16th November 2004 (throughconference call) and 25th January 2005. The minutes of the Compensation Committee meetings are placedbefore the Board at the succeeding Board meeting for information. Attendance of compensation committeemeetings is as follows:
Name of director 20th April 2004 16th July 2004 16th November 2004(Audio Conference)
25th January 2005
Dr. AshokJhunjhunwala
Yes Yes Yes Yes
Professor JRamachandran
Yes Yes Yes Yes
Mr. Vinod Dham Yes Yes Yes Yes
Corporate Governance (contd.)
05050449_003_138.indd 4805050449_003_138.indd 48 5/19/05 4:29:11 PM5/19/05 4:29:11 PM
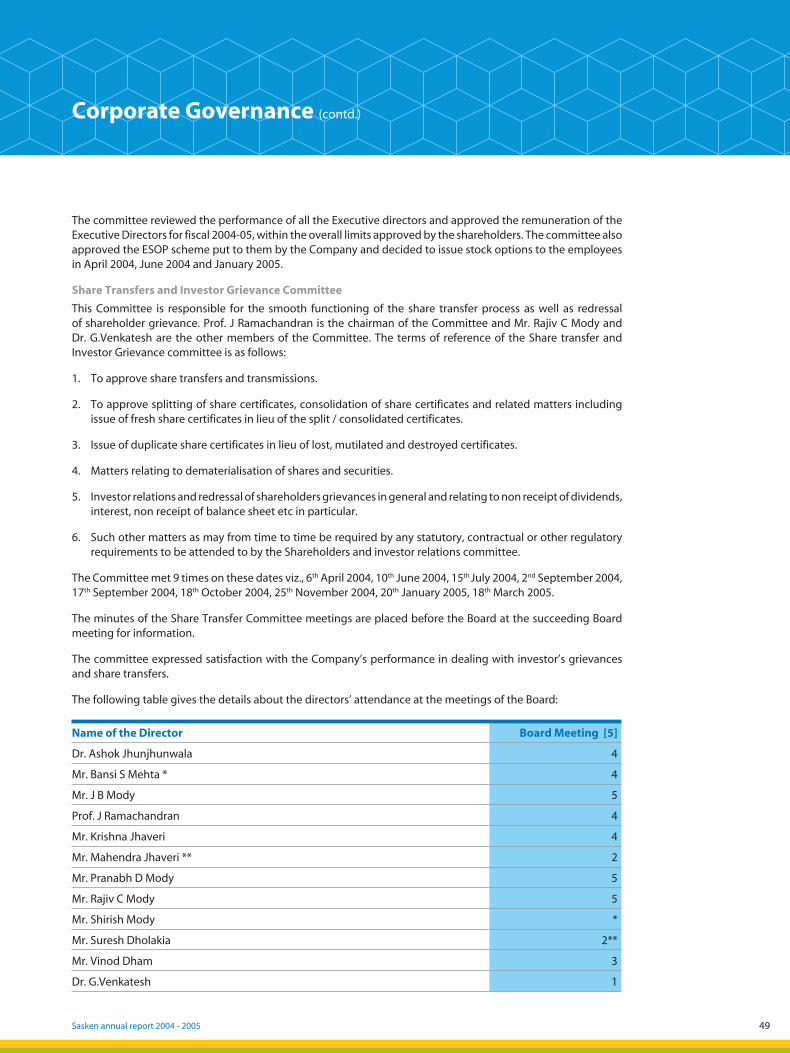
Sasken annual report 2004 - 2005 49
The committee reviewed the performance of all the Executive directors and approved the remuneration of theExecutive Directors for fiscal 2004-05, within the overall limits approved by the shareholders. The committee alsoapproved the ESOP scheme put to them by the Company and decided to issue stock options to the employees in April 2004, June 2004 and January 2005.
Share Transfers and Investor Grievance Committee
This Committee is responsible for the smooth functioning of the share transfer process as well as redressalof shareholder grievance. Prof. J Ramachandran is the chairman of the Committee and Mr. Rajiv C Mody andDr. G.Venkatesh are the other members of the Committee. The terms of reference of the Share transfer andInvestor Grievance committee is as follows:
1. To approve share transfers and transmissions.
2. To approve splitting of share certificates, consolidation of share certificates and related matters includingissue of fresh share certificates in lieu of the split / consolidated certificates.
3. Issue of duplicate share certificates in lieu of lost, mutilated and destroyed certificates.
4. Matters relating to dematerialisation of shares and securities.
5. Investor relations and redressal of shareholders grievances in general and relating to non receipt of dividends,interest, non receipt of balance sheet etc in particular.
6. Such other matters as may from time to time be required by any statutory, contractual or other regulatoryrequirements to be attended to by the Shareholders and investor relations committee.
The Committee met 9 times on these dates viz., 6th April 2004, 10th June 2004, 15th July 2004, 2nd September 2004,17th September 2004, 18th October 2004, 25th November 2004, 20th January 2005, 18th March 2005.
The minutes of the Share Transfer Committee meetings are placed before the Board at the succeeding Boardmeeting for information.
The committee expressed satisfaction with the Company’s performance in dealing with investor’s grievances and share transfers.
The following table gives the details about the directors’ attendance at the meetings of the Board:
Name of the Director Board Meeting [5]
Dr. Ashok Jhunjhunwala 4
Mr. Bansi S Mehta * 4
Mr. J B Mody 5
Prof. J Ramachandran 4
Mr. Krishna Jhaveri 4
Mr. Mahendra Jhaveri ** 2
Mr. Pranabh D Mody 5
Mr. Rajiv C Mody 5
Mr. Shirish Mody *
Mr. Suresh Dholakia 2**
Mr. Vinod Dham 3
Dr. G.Venkatesh 1
Corporate Governance (contd.)
05050449_003_138.indd 4905050449_003_138.indd 49 5/19/05 4:29:11 PM5/19/05 4:29:11 PM

50
* Shri Bansi S Mehta was the alternate director for Mr. Shirish Mody and attended on his behalf till July 16, 2004meeting.
** Mr. Mahendra Jhaveri is the alternate director to Mr. Suresh Dholakia and attended on his behalf.
Overall, we believe that our Board has a good record with respect to corporate governance and corporateresponsibility. However, there is always room for improvement. There is clearly a need for greater openness andtransparency at a time when boards are being examined for their independence, integrity and effectiveness.We will continue to review guidelines and practices, as well as proposed governance reforms, not just to ensurecompliance, but also in order to implement what we believe are the most effective governance policies andpractices for the Company.
On behalf of the Board, I would like to assure everyone with a stake in our future, that the directors wouldcontinue to diligently oversee the business affairs of the Company and restore good profits and confidence inour Company, in the years ahead.
Rajiv C ModyChairman and Managing Director
9. Related parties disclosures
During the period under review, the Company did not have any related party transactions that are material innature, with its promoters, the directors or the management, relatives etc., which may have potential conflict with the larger interests of the Company.
10. General Body Meetings
The last three annual general meetings of the Company were held as per the following details:
Year Venue Date Time
2002 Registered Office of the Company at Domlur, Bangalore 21 Jun, 2002 4.30 p.m.
2003 Registered Office of the Company at Domlur, Bangalore 14 Jul, 2003 4.30 p.m.
2004 Registered Office of the Company at Domlur, Bangalore 11 Jun, 2004 4.30 p.m.
The last three Extra-ordinary General Meetings of the Company were held as per the following details:
Year Venue Date Time
2003 Registered Office of the Company at Domlur, Bangalore 21 Feb, 2003 4.30 p.m.
2004 Registered Office of the Company at Domlur, Bangalore 16 Jul, 2004 4.30 p.m.
2005 Registered Office of the Company at Domlur, Bangalore 28 Feb, 2005 4.30 p.m.
Corporate Governance (contd.)
05050449_003_138.indd 5005050449_003_138.indd 50 5/19/05 4:29:12 PM5/19/05 4:29:12 PM
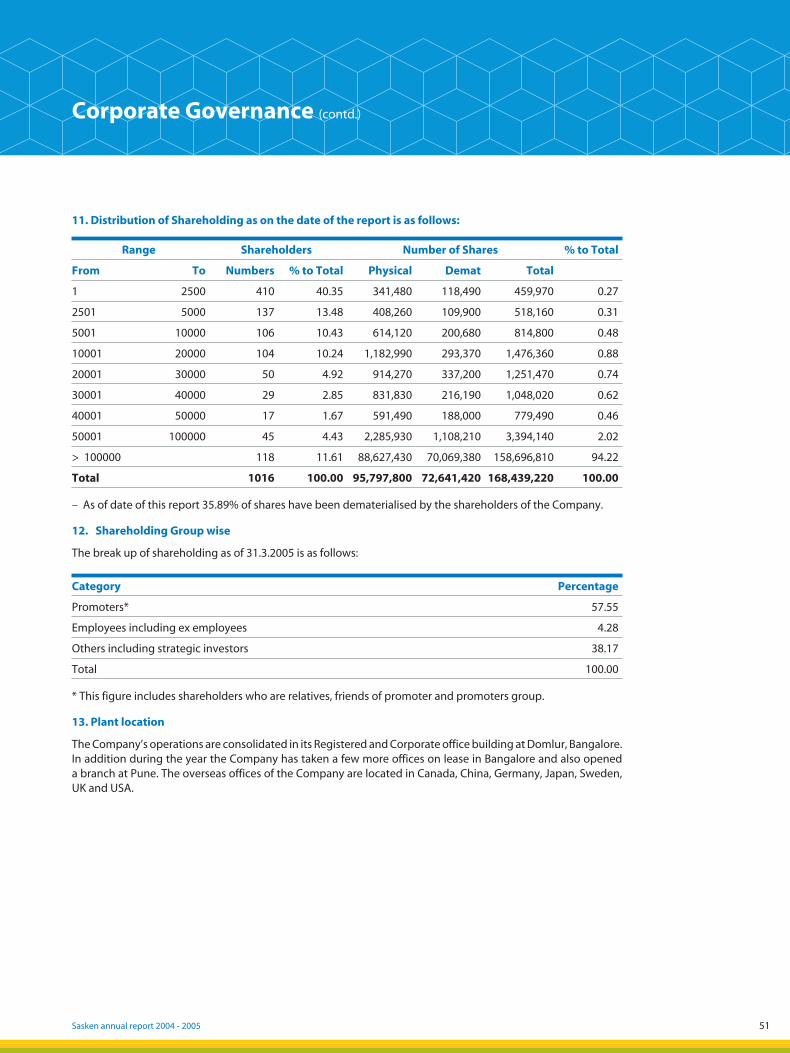
Sasken annual report 2004 - 2005 51
11. Distribution of Shareholding as on the date of the report is as follows:
Range Shareholders Number of Shares % to Total
From To Numbers % to Total Physical Demat Total
1 2500 410 40.35 341,480 118,490 459,970 0.27
2501 5000 137 13.48 408,260 109,900 518,160 0.31
5001 10000 106 10.43 614,120 200,680 814,800 0.48
10001 20000 104 10.24 1,182,990 293,370 1,476,360 0.88
20001 30000 50 4.92 914,270 337,200 1,251,470 0.74
30001 40000 29 2.85 831,830 216,190 1,048,020 0.62
40001 50000 17 1.67 591,490 188,000 779,490 0.46
50001 100000 45 4.43 2,285,930 1,108,210 3,394,140 2.02
> 100000 118 11.61 88,627,430 70,069,380 158,696,810 94.22
Total 1016 100.00 95,797,800 72,641,420 168,439,220 100.00
– As of date of this report 35.89% of shares have been dematerialised by the shareholders of the Company.
12. Shareholding Group wise
The break up of shareholding as of 31.3.2005 is as follows:
Category Percentage
Promoters* 57.55
Employees including ex employees 4.28
Others including strategic investors 38.17
Total 100.00
* This figure includes shareholders who are relatives, friends of promoter and promoters group.
13. Plant location
The Company’s operations are consolidated in its Registered and Corporate office building at Domlur, Bangalore. In addition during the year the Company has taken a few more offices on lease in Bangalore and also opened a branch at Pune. The overseas offices of the Company are located in Canada, China, Germany, Japan, Sweden, UK and USA.
Corporate Governance (contd.)
4
05050449_003_138.indd 5105050449_003_138.indd 51 5/19/05 4:27:35 PM5/19/05 4:27:35 PM
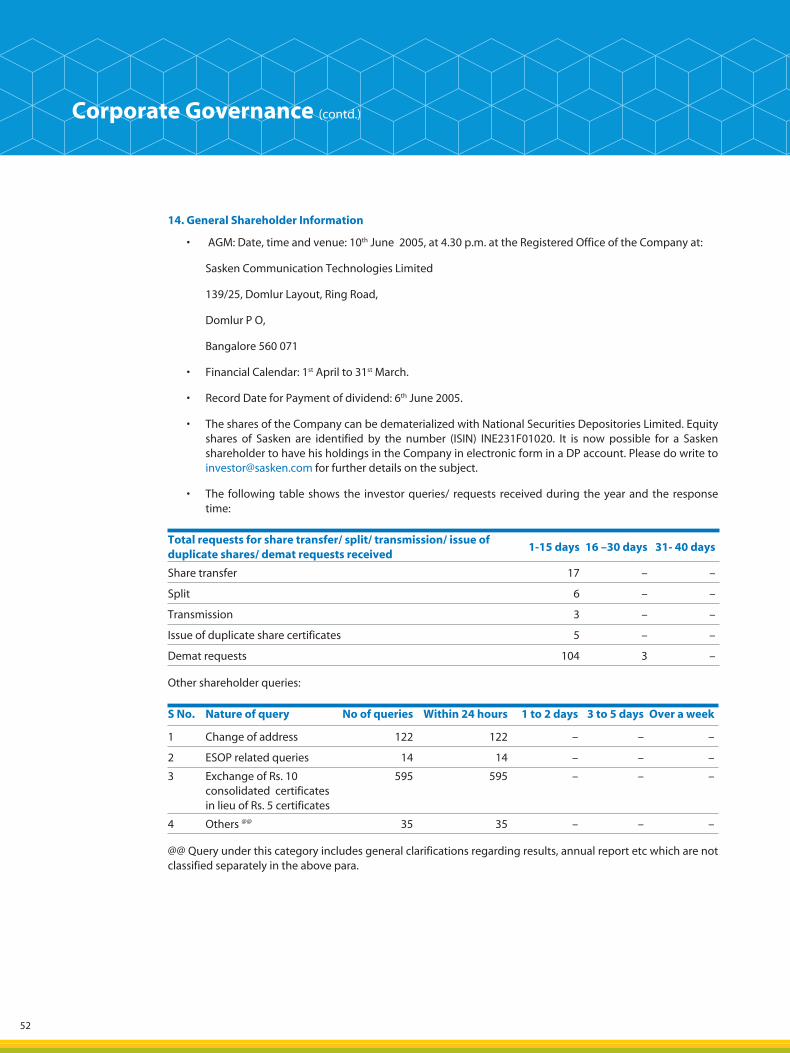
52
14. General Shareholder Information
• AGM: Date, time and venue: 10th June 2005, at 4.30 p.m. at the Registered Office of the Company at:
Sasken Communication Technologies Limited
139/25, Domlur Layout, Ring Road,
Domlur P O,
Bangalore 560 071
• Financial Calendar: 1st April to 31st March.
• Record Date for Payment of dividend: 6th June 2005.
• The shares of the Company can be dematerialized with National Securities Depositories Limited. Equity shares of Sasken are identified by the number (ISIN) INE231F01020. It is now possible for a Sasken shareholder to have his holdings in the Company in electronic form in a DP account. Please do write to [email protected] for further details on the subject.
• The following table shows the investor queries/ requests received during the year and the response time:
Total requests for share transfer/ split/ transmission/ issue of duplicate shares/ demat requests received
1-15 days 16 –30 days 31- 40 days
Share transfer 17 – –
Split 6 – –
Transmission 3 – –
Issue of duplicate share certificates 5 – –
Demat requests 104 3 –
Other shareholder queries:
S No. Nature of query No of queries Within 24 hours 1 to 2 days 3 to 5 days Over a week
1 Change of address 122 122 – – –
2 ESOP related queries 14 14 – – –
3 Exchange of Rs. 10 consolidated certificates in lieu of Rs. 5 certificates
595 595 – – –
4 Others @@ 35 35 – – –
@@ Query under this category includes general clarifications regarding results, annual report etc which are not classified separately in the above para.
Corporate Governance (contd.)
05050449_003_138.indd 5205050449_003_138.indd 52 5/19/05 4:27:36 PM5/19/05 4:27:36 PM
Sasken annual report 2004 - 2005 53
• Share Transfer System:
The share transfer and investor grievance committee meets periodically depending on requests for transfers, issue of duplicate shares, requests for split of certificates, approval of demat requests received from the shareholders etc. Shareholders willing to transfer the shares should send the duly completed transfer deed together with the share certificates to the Company at the address given at the end of this section. Similarly shareholders intending to hold shares in the demat mode are advised to get in touch with the Depository Participants (DPs) with whom the shareholders are required to have an account.
Apart from Annual report, notices and specific issues like calling of a general meeting, issue of rights shares etc, yearly results are put up on the website of the Company. A shareholder can access and download the Annual Report as well as the official news releases at www.sasken.com
Address for postal correspondence:
The Company SecretarySasken Communication Technologies Limited139/ 25, Domlur LayoutRing Road, Domlur P. O.Bangalore 560 071Ph: +91 (80) 25355501, 25355503Fax: +91 (80) 25351309, 25351156Email: [email protected]
Corporate Governance (contd.)
05050449_003_138.indd 5305050449_003_138.indd 53 5/19/05 4:27:36 PM5/19/05 4:27:36 PM

05050449_003_138.indd 5405050449_003_138.indd 54 5/19/05 4:27:36 PM5/19/05 4:27:36 PM

Financial Statements in Compliancewith Indian GAAP
05050449_003_138.indd 5505050449_003_138.indd 55 5/19/05 4:27:39 PM5/19/05 4:27:39 PM
56
Auditors’ Report
To
The Members of Sasken Communication Technologies Limited
1. We have audited the attached Balance Sheet of Sasken Communication Technologies Limited (“the Company”) as at March 31, 2005 and also the Profit and Loss account and the cash flow statement for the year ended on that date annexed thereto. These financial statements are the responsibility of the Company’s management. Our responsibility is to express an opinion on these financial statements based on our audit.
2. We conducted our audit in accordance with auditing standards generally accepted in India. Those Standards require that we plan and perform the audit to obtain reasonable assurance about whether the financial statements are free of material misstatement. An audit includes examining, on a test basis, evidence supporting the amounts and disclosures in the financial statements. An audit also includes assessing the accounting principles used and significant estimates made by management, as well as evaluating the overall financial statement presentation. We believe that our audit provides a reasonable basis for our opinion.
3. As required by the Companies (Auditor’s Report) Order, 2003 (as amended) issued by the Central Government of India in terms of sub-section (4A) of Section 227 of the Companies Act, 1956, we enclose in the Annexure a statement on the matters specified in paragraphs 4 and 5 of the said Order.
4. Further to our comments in the Annexure referred to above, we report that:
i. We have obtained all the information and explanations, which to the best of our knowledge and belief were necessary for the purposes of our audit;
ii. In our opinion, proper books of account as required by law have been kept by the Company so far as appears from our examination of those books;
iii. The balance sheet, profit and loss account and cash flow statement dealt with by this report are in agreement with the books of account;
iv. In our opinion, the balance sheet, profit and loss account and cash flow statement dealt with by this report comply with the accounting standards referred to in sub-section (3C) of section 211 of the Companies Act, 1956;
v. On the basis of the written representations received from the directors, as on March 31, 2005, and taken on record by the Board of Directors, we report that none of the directors is disqualified as on March 31, 2005 from being appointed as a director in terms of clause (g) of sub-section (1) of section 274 of the Companies Act, 1956.
vi. In our opinion and to the best of our information and according to the explanations given to us, the said accounts give the information required by the Companies Act, 1956, in the manner so required and give a true and fair view in conformity with the accounting principles generally accepted in India;
a. in the case of the balance sheet, of the state of affairs of the Company as at March 31, 2005;
b. in the case of the profit and loss account, of the profit for the year ended on that date; and
c. in the case of cash flow statement, of the cash flows for the year ended on that date.
For S. R. BATLIBOI & COMPANY Chartered Accountants
per Sunil BhumralkarPartner Membership No.: 35141
BangaloreApril 19, 2005
05050449_003_138.indd 5605050449_003_138.indd 56 5/19/05 4:27:40 PM5/19/05 4:27:40 PM
Sasken annual report 2004 - 2005 57
Annexure to the Auditors’ Report
Annexure referred to in paragraph 3 of our report of even date
Re: Sasken Communication Technologies Limited
(i) (a) The Company has maintained proper records showing full particulars, including quantitative details and situation of fixed assets.
(b) All fixed assets have not been physically verified by the management during the year but there is a regular programme of verification which, in our opinion, is reasonable having regard to the size of the Company and the nature of its assets. As informed, no material discrepancies were noticed on such verification.
(c) There was no substantial disposal of fixed assets during the year.
(ii) In our opinion and according to the information and explanations given to us, in view of the nature of activities of the Company, the provisions of Clause 4(ii) relating to inventory is not applicable to the Company.
(iii) (a) As informed, the Company has not granted any loans, secured or unsecured to companies, firms or other parties covered in the register maintained under section 301 of the Companies Act, 1956.
(b) As informed, the Company has not taken any loans, secured or unsecured from companies, firms or other parties covered in the register maintained under section 301 of the Companies Act, 1956.
(iv) In our opinion and according to the information and explanations given to us, as represented by the management that some items are of a special nature for which alternative quotations cannot be obtained, there is an adequate internal control system commensurate with the size of the Company and the nature of its business, for the purchase of fixed assets and for the sale of services. During the course of our audit, no major weakness has been noticed in the internal control system in respect of these areas.
(v) (a) According to the information and explanations provided by the management, we are of the opinion that the particulars of contracts or arrangements referred to in section 301 of the Act that need to be entered into the register maintained under section 301 have been so entered.
(b) According to the information and explanations provided by the management, none of the transactions made in pursuance of such contracts or arrangements exceed the value of Rupees five lakh in respect of any one such party in the financial year.
(vi) The Company has not accepted any deposits from the public.
(vii) In our opinion, the Company has an internal audit system commensurate with the size and nature of its business.
(viii) To the best of our knowledge and as explained, the Central Government has not prescribed maintenance of cost records under clause (d) of sub-section (1) of section 209 of the Companies Act, 1956 for the products of the Company.
(ix) (a) According to the records of the Company, the Company is regular in depositing with appropriate authorities undisputed statutory dues including provident fund, investor education and protection fund, employees’ state insurance, income-tax, sales-tax, wealth-tax, service tax, custom duty, excise duty, cess and other material statutory dues applicable to it with the appropriate authorities.
(b) According to the information and explanations given to us, no undisputed amounts payable in respect of provident fund, investor education and protection fund, employees’ state insurance, income-tax, wealth-tax, service tax, sales-tax, customs duty, excise duty, cess and other undisputed
05050449_003_138.indd 5705050449_003_138.indd 57 5/19/05 4:27:40 PM5/19/05 4:27:40 PM
58
statutory dues were outstanding, at the year end, for a period of more than six months from the date they became payable.
(c) According to the information and explanations given to us, there are no dues of income tax, sales- tax, wealth tax, service tax, custom duty, excise duty and cess which have not been deposited on account of any dispute.
(x) The Company has no accumulated losses at the end of the financial year and it has not incurred cash losses in the current and immediately preceding financial year.
(xi) Based on our audit procedures and as per the information and explanations given by the management, we are of the opinion that the Company has not defaulted in repayment of dues to a financial institution, bank or debenture holders.
(xii) Based on our examination of documents and records, we are of the opinion that the Company has maintained adequate records where the Company has granted loans and advances on the basis of security by way of pledge of shares, debentures and other securities.
(xiii) In our opinion, the Company is not a chit fund or a nidhi / mutual benefit fund / society. Therefore, the provisions of clause 4(xiii) of the Companies (Auditor’s Report) Order, 2003 (as amended) are not applicable to the Company.
(xiv) In our opinion, the Company is not dealing in or trading in shares, securities, debentures and other investments. Accordingly, the provisions of clause 4(xiv) of the Companies (Auditor’s Report) Order, 2003 (as amended) are not applicable to the Company.
(xv) According to the information and explanations given to us, the Company has not given any guarantee for loans taken by others from bank or financial institutions.
(xvi) The Company did not have any term loans outstanding during the year.
(xvii) According to the information and explanations given to us and on an overall examination of the balance sheet and cash flow statement of the Company, we report that no funds raised on short-term basis have been used for long-term investment.
(xviii) The Company has not made any preferential allotment of shares to parties or companies covered in the register maintained under section 301 of the Companies Act, 1956.
(xix) The Company did not have any outstanding debentures during the year.
(xx) The Company has not raised any money through a public issue during the year.
(xxi) Based upon the audit procedures performed for the purpose of reporting the true and fair view of the financial statements and as per the information and explanations given by the management, we report that no fraud on or by the Company has been noticed or reported during the course of our audit.
For S. R. BATLIBOI & COMPANY Chartered Accountants
per Sunil BhumralkarPartner Membership No.: 35141
BangaloreApril 19, 2005
Annexure to the Auditors’ Report (contd.)
05050449_003_138.indd 5805050449_003_138.indd 58 5/19/05 4:27:40 PM5/19/05 4:27:40 PM
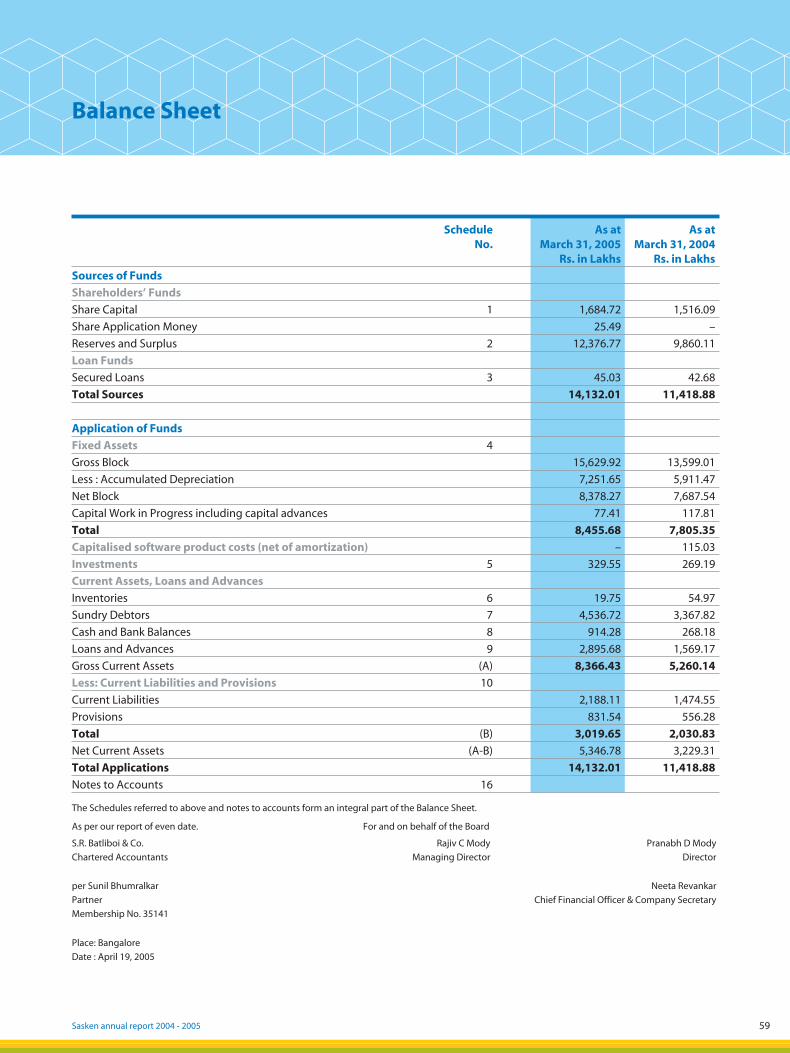
Sasken annual report 2004 - 2005 59
Schedule No.
As at March 31, 2005
Rs. in Lakhs
As at March 31, 2004
Rs. in Lakhs
Sources of Funds
Shareholders’ Funds
Share Capital 1 1,684.72 1,516.09
Share Application Money 25.49 –
Reserves and Surplus 2 12,376.77 9,860.11
Loan Funds
Secured Loans 3 45.03 42.68
Total Sources 14,132.01 11,418.88
Application of Funds
Fixed Assets 4
Gross Block 15,629.92 13,599.01
Less : Accumulated Depreciation 7,251.65 5,911.47
Net Block 8,378.27 7,687.54
Capital Work in Progress including capital advances 77.41 117.81
Total 8,455.68 7,805.35
Capitalised software product costs (net of amortization) – 115.03
Investments 5 329.55 269.19
Current Assets, Loans and Advances
Inventories 6 19.75 54.97
Sundry Debtors 7 4,536.72 3,367.82
Cash and Bank Balances 8 914.28 268.18
Loans and Advances 9 2,895.68 1,569.17
Gross Current Assets (A) 8,366.43 5,260.14
Less: Current Liabilities and Provisions 10
Current Liabilities 2,188.11 1,474.55
Provisions 831.54 556.28
Total (B) 3,019.65 2,030.83
Net Current Assets (A-B) 5,346.78 3,229.31
Total Applications 14,132.01 11,418.88
Notes to Accounts 16
Balance Sheet
The Schedules referred to above and notes to accounts form an integral part of the Balance Sheet.
As per our report of even date. For and on behalf of the Board
S.R. Batliboi & Co.
Chartered Accountants
Rajiv C Mody
Managing Director
Pranabh D Mody
Director
per Sunil Bhumralkar
Partner
Membership No. 35141
Neeta Revankar
Chief Financial Officer & Company Secretary
Place: Bangalore
Date : April 19, 2005
05050449_003_138.indd 5905050449_003_138.indd 59 5/19/05 4:27:41 PM5/19/05 4:27:41 PM
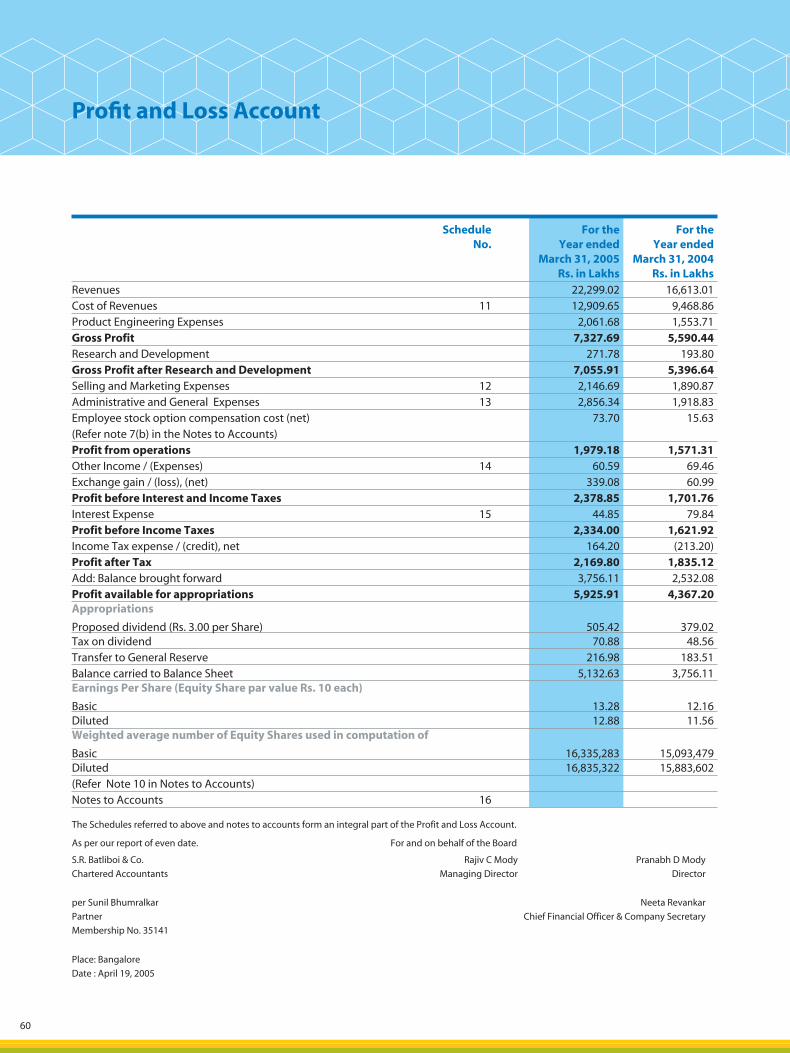
60
Schedule No.
For the Year ended
March 31, 2005 Rs. in Lakhs
For the Year ended
March 31, 2004 Rs. in Lakhs
Revenues 22,299.02 16,613.01 Cost of Revenues 11 12,909.65 9,468.86 Product Engineering Expenses 2,061.68 1,553.71 Gross Profit 7,327.69 5,590.44 Research and Development 271.78 193.80 Gross Profit after Research and Development 7,055.91 5,396.64 Selling and Marketing Expenses 12 2,146.69 1,890.87 Administrative and General Expenses 13 2,856.34 1,918.83 Employee stock option compensation cost (net) 73.70 15.63 (Refer note 7(b) in the Notes to Accounts) Profit from operations 1,979.18 1,571.31 Other Income / (Expenses) 14 60.59 69.46 Exchange gain / (loss), (net) 339.08 60.99 Profit before Interest and Income Taxes 2,378.85 1,701.76 Interest Expense 15 44.85 79.84 Profit before Income Taxes 2,334.00 1,621.92 Income Tax expense / (credit), net 164.20 (213.20)Profit after Tax 2,169.80 1,835.12 Add: Balance brought forward 3,756.11 2,532.08 Profit available for appropriations 5,925.91 4,367.20 Appropriations
Proposed dividend (Rs. 3.00 per Share) 505.42 379.02 Tax on dividend 70.88 48.56 Transfer to General Reserve 216.98 183.51 Balance carried to Balance Sheet 5,132.63 3,756.11 Earnings Per Share (Equity Share par value Rs. 10 each)
Basic 13.28 12.16 Diluted 12.88 11.56 Weighted average number of Equity Shares used in computation of
Basic 16,335,283 15,093,479 Diluted 16,835,322 15,883,602 (Refer Note 10 in Notes to Accounts) Notes to Accounts 16
Profi t and Loss Account
The Schedules referred to above and notes to accounts form an integral part of the Profit and Loss Account.
As per our report of even date. For and on behalf of the Board
S.R. Batliboi & Co.
Chartered Accountants
Rajiv C Mody
Managing Director
Pranabh D Mody
Director
per Sunil Bhumralkar
Partner
Membership No. 35141
Neeta Revankar
Chief Financial Officer & Company Secretary
Place: Bangalore
Date : April 19, 2005
05050449_003_138.indd 6005050449_003_138.indd 60 5/19/05 4:27:41 PM5/19/05 4:27:41 PM
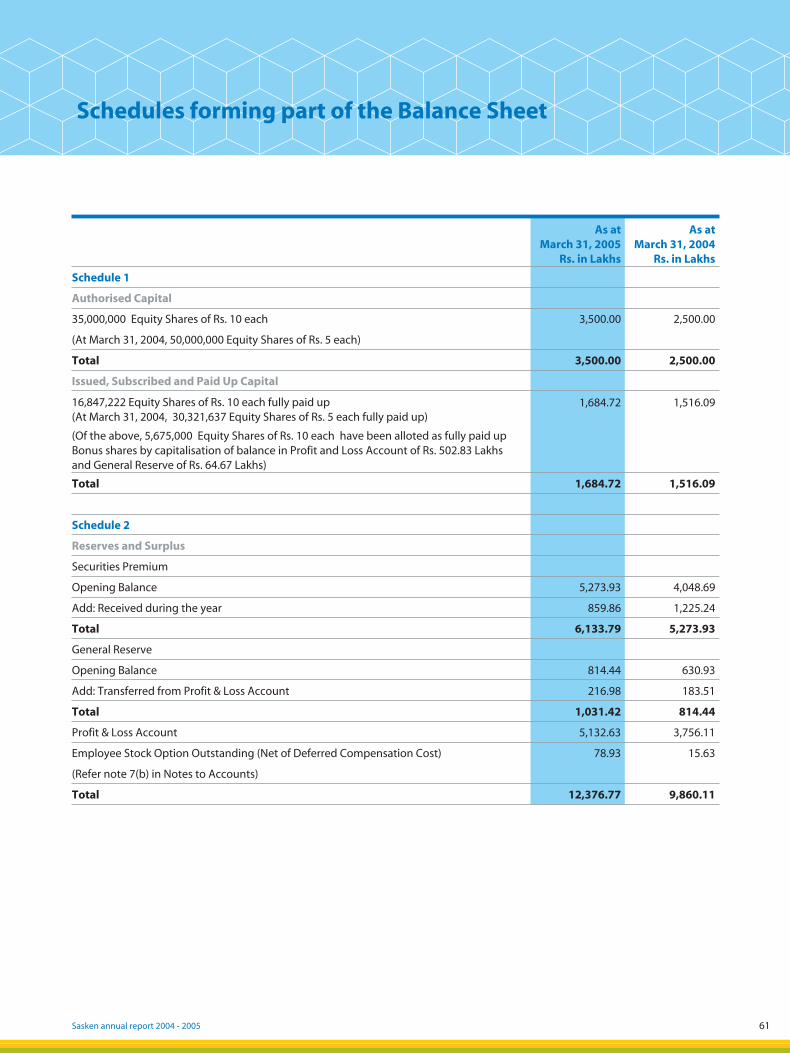
Sasken annual report 2004 - 2005 61
Schedules forming part of the Balance Sheet
As at March 31, 2005
Rs. in Lakhs
As at March 31, 2004
Rs. in Lakhs
Schedule 1
Authorised Capital
35,000,000 Equity Shares of Rs. 10 each 3,500.00 2,500.00
(At March 31, 2004, 50,000,000 Equity Shares of Rs. 5 each)
Total 3,500.00 2,500.00
Issued, Subscribed and Paid Up Capital
16,847,222 Equity Shares of Rs. 10 each fully paid up (At March 31, 2004, 30,321,637 Equity Shares of Rs. 5 each fully paid up)
1,684.72 1,516.09
(Of the above, 5,675,000 Equity Shares of Rs. 10 each have been alloted as fully paid up Bonus shares by capitalisation of balance in Profit and Loss Account of Rs. 502.83 Lakhs and General Reserve of Rs. 64.67 Lakhs)
Total 1,684.72 1,516.09
Schedule 2
Reserves and Surplus
Securities Premium
Opening Balance 5,273.93 4,048.69
Add: Received during the year 859.86 1,225.24
Total 6,133.79 5,273.93
General Reserve
Opening Balance 814.44 630.93
Add: Transferred from Profit & Loss Account 216.98 183.51
Total 1,031.42 814.44
Profit & Loss Account 5,132.63 3,756.11
Employee Stock Option Outstanding (Net of Deferred Compensation Cost) 78.93 15.63
(Refer note 7(b) in Notes to Accounts)
Total 12,376.77 9,860.11
05050449_003_138.indd 6105050449_003_138.indd 61 5/19/05 4:27:42 PM5/19/05 4:27:42 PM
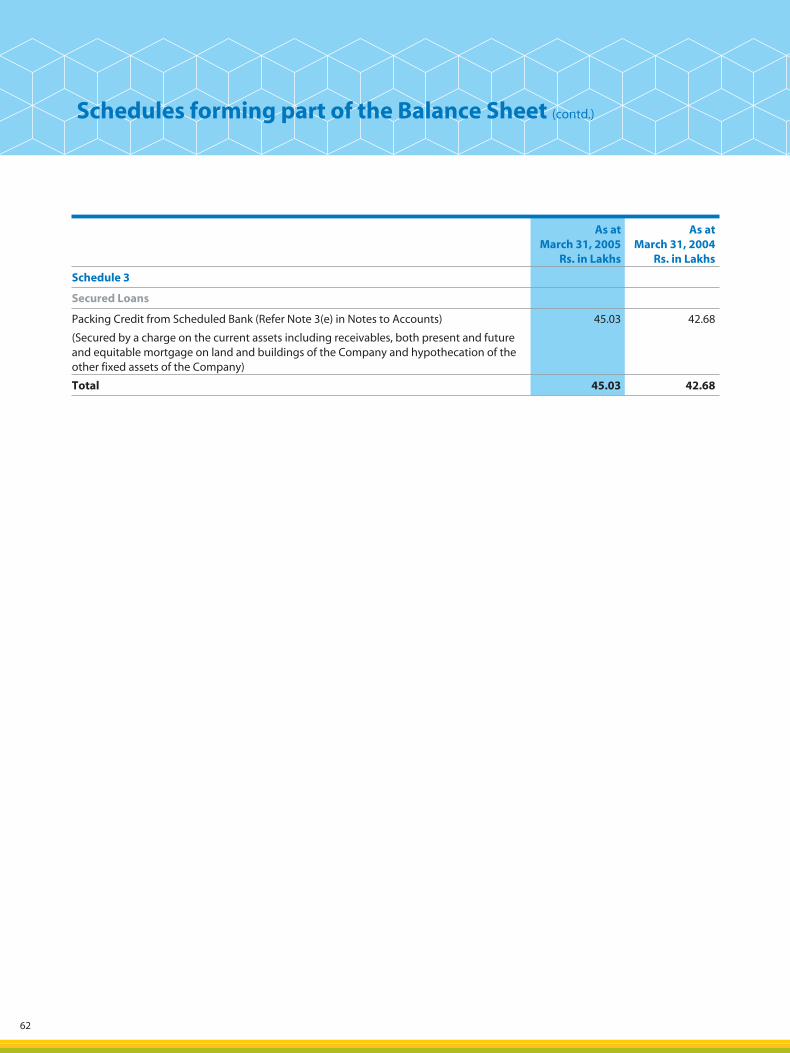
62
As at March 31, 2005
Rs. in Lakhs
As at March 31, 2004
Rs. in Lakhs
Schedule 3
Secured Loans
Packing Credit from Scheduled Bank (Refer Note 3(e) in Notes to Accounts) 45.03 42.68
(Secured by a charge on the current assets including receivables, both present and future and equitable mortgage on land and buildings of the Company and hypothecation of the other fixed assets of the Company)
Total 45.03 42.68
Schedules forming part of the Balance Sheet (contd.)
05050449_003_138.indd 6205050449_003_138.indd 62 5/19/05 4:27:42 PM5/19/05 4:27:42 PM
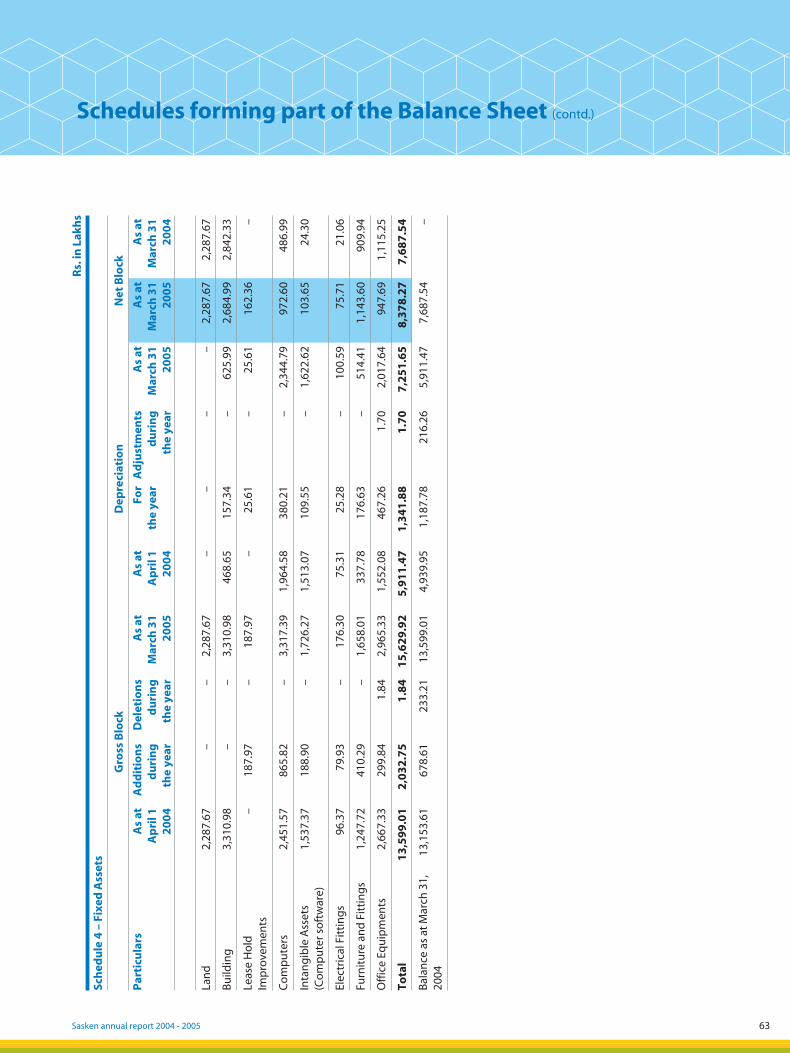
Sasken annual report 2004 - 2005 63
Schedules forming part of the Balance Sheet (contd.)Sc
hed
ule
4 –
Fix
ed A
sset
s
Gro
ss B
lock
Dep
reci
atio
nN
et B
lock
Par
ticu
lars
As
atA
pri
l 1
20
04
Ad
dit
ion
s d
uri
ng
the
year
Del
etio
ns
du
rin
gth
e ye
ar
As
atM
arch
31
2
00
5
As
atA
pri
l 1
20
04
For
the
year
Ad
just
men
tsd
uri
ng
th
e ye
ar
As
at
Mar
ch 3
1
20
05
As
at
Mar
ch 3
1
20
05
As
at
Mar
ch 3
12
00
4
Lan
d 2
,287
.67
–
–
2,2
87.6
7 –
–
–
–
2
,287
.67
2,2
87.6
7
Bu
ildin
g 3
,310
.98
–
–
3,3
10.9
8 4
68.6
5 1
57.3
4 –
6
25.9
9 2
,684
.99
2,8
42.3
3
Leas
e H
old
Im
pro
vem
ents
–
187
.97
–
187
.97
–
25.
61
–
25.
61
162
.36
–
Co
mp
ute
rs 2
,451
.57
865
.82
–
3,3
17.3
9 1
,964
.58
380
.21
–
2,3
44.7
9 9
72.6
0 4
86.9
9
Inta
ng
ible
Ass
ets
(Co
mp
ute
r so
ftw
are)
1,5
37.3
7 1
88.9
0 –
1
,726
.27
1,5
13.0
7 1
09.5
5 –
1
,622
.62
103
.65
24.
30
Elec
tric
al F
itti
ng
s 9
6.37
7
9.93
–
1
76.3
0 7
5.31
2
5.28
–
1
00.5
9 7
5.71
2
1.06
Furn
itu
re a
nd
Fit
tin
gs
1,2
47.7
2 4
10.2
9 –
1
,658
.01
337
.78
176
.63
–
514
.41
1,1
43.6
0 9
09.9
4
Off
ice
Equ
ipm
ents
2,6
67.3
3 2
99.8
4 1
.84
2,9
65.3
3 1
,552
.08
467
.26
1.7
0 2
,017
.64
947
.69
1,1
15.2
5
Tota
l 1
3,5
99
.01
2
,03
2.7
5
1.8
4
15
,62
9.9
2
5,9
11
.47
1
,34
1.8
8
1.7
0
7,2
51
.65
8
,37
8.2
7
7,6
87
.54
Bal
ance
as
at M
arch
31,
20
04 1
3,15
3.61
6
78.6
1 2
33.2
1 1
3,59
9.01
4
,939
.95
1,1
87.7
8 2
16.2
6 5
,911
.47
7,6
87.5
4 –
Rs.
in L
akh
s
05050449_003_138.indd 6305050449_003_138.indd 63 5/19/05 4:27:42 PM5/19/05 4:27:42 PM
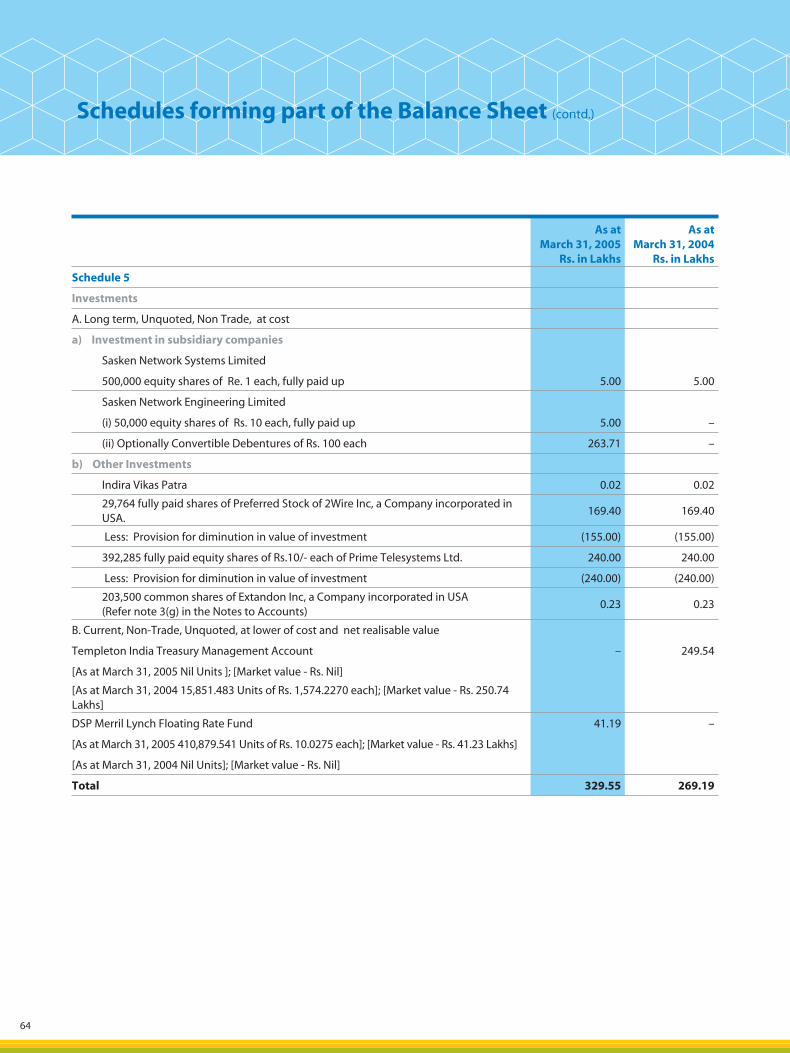
64
As at March 31, 2005
Rs. in Lakhs
As at March 31, 2004
Rs. in Lakhs
Schedule 5
Investments
A. Long term, Unquoted, Non Trade, at cost
a) Investment in subsidiary companies
Sasken Network Systems Limited
500,000 equity shares of Re. 1 each, fully paid up 5.00 5.00
Sasken Network Engineering Limited
(i) 50,000 equity shares of Rs. 10 each, fully paid up 5.00 –
(ii) Optionally Convertible Debentures of Rs. 100 each 263.71 –
b) Other Investments
Indira Vikas Patra 0.02 0.02
29,764 fully paid shares of Preferred Stock of 2Wire Inc, a Company incorporated in USA.
169.40 169.40
Less: Provision for diminution in value of investment (155.00) (155.00)
392,285 fully paid equity shares of Rs.10/- each of Prime Telesystems Ltd. 240.00 240.00
Less: Provision for diminution in value of investment (240.00) (240.00)
203,500 common shares of Extandon Inc, a Company incorporated in USA (Refer note 3(g) in the Notes to Accounts)
0.23 0.23
B. Current, Non-Trade, Unquoted, at lower of cost and net realisable value
Templeton India Treasury Management Account – 249.54
[As at March 31, 2005 Nil Units ]; [Market value - Rs. Nil]
[As at March 31, 2004 15,851.483 Units of Rs. 1,574.2270 each]; [Market value - Rs. 250.74 Lakhs]
DSP Merril Lynch Floating Rate Fund 41.19 –
[As at March 31, 2005 410,879.541 Units of Rs. 10.0275 each]; [Market value - Rs. 41.23 Lakhs]
[As at March 31, 2004 Nil Units]; [Market value - Rs. Nil]
Total 329.55 269.19
Schedules forming part of the Balance Sheet (contd.)
05050449_003_138.indd 6405050449_003_138.indd 64 5/19/05 4:27:43 PM5/19/05 4:27:43 PM
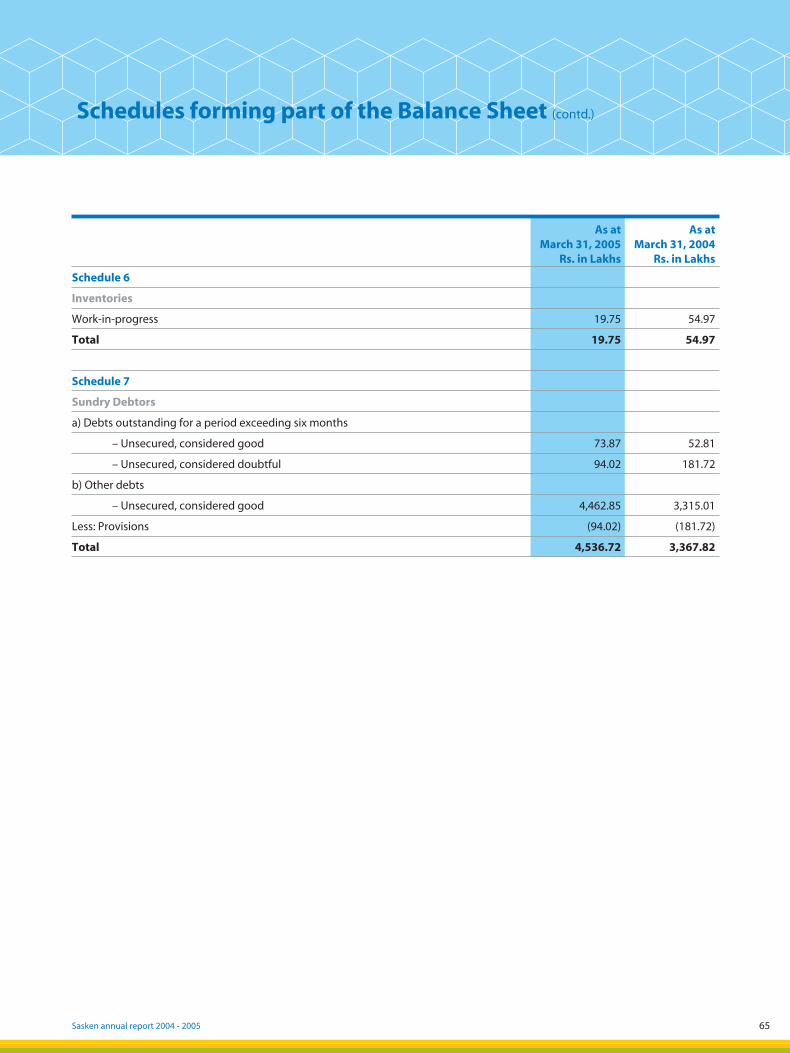
Sasken annual report 2004 - 2005 65
As at March 31, 2005
Rs. in Lakhs
As at March 31, 2004
Rs. in Lakhs
Schedule 6
Inventories
Work-in-progress 19.75 54.97
Total 19.75 54.97
Schedule 7
Sundry Debtors
a) Debts outstanding for a period exceeding six months
– Unsecured, considered good 73.87 52.81
– Unsecured, considered doubtful 94.02 181.72
b) Other debts
– Unsecured, considered good 4,462.85 3,315.01
Less: Provisions (94.02) (181.72)
Total 4,536.72 3,367.82
Schedules forming part of the Balance Sheet (contd.)
05050449_003_138.indd 6505050449_003_138.indd 65 5/19/05 4:27:43 PM5/19/05 4:27:43 PM
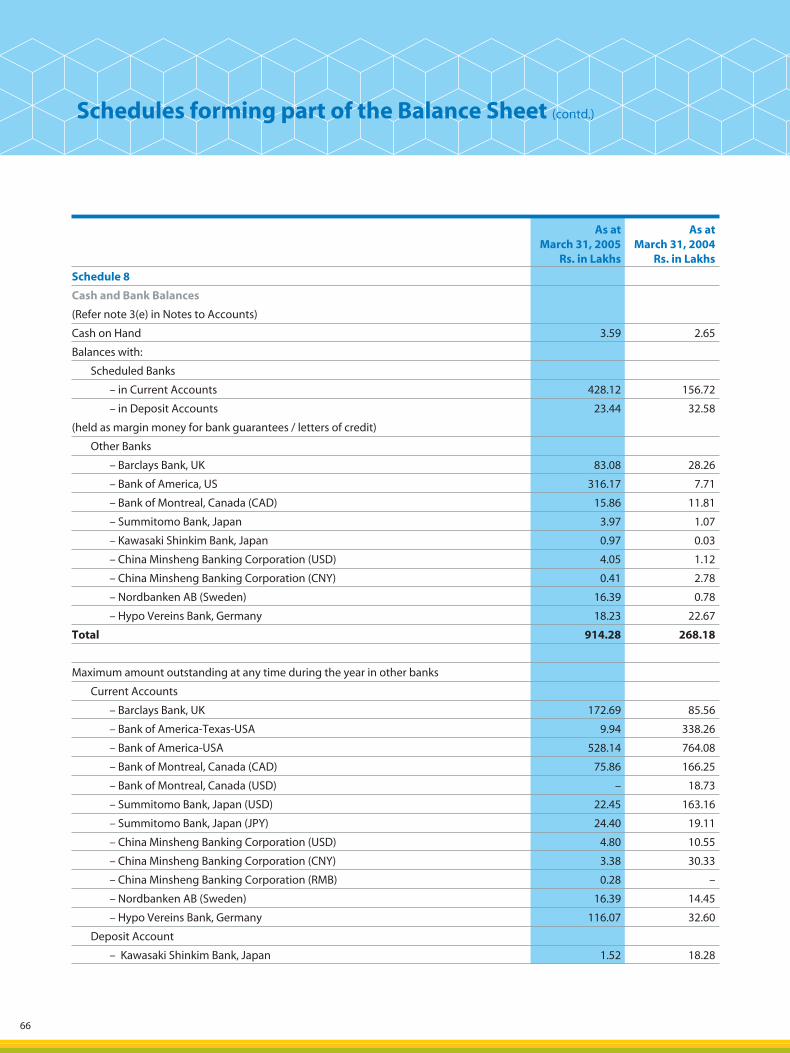
66
As at March 31, 2005
Rs. in Lakhs
As at March 31, 2004
Rs. in Lakhs
Schedule 8
Cash and Bank Balances
(Refer note 3(e) in Notes to Accounts)
Cash on Hand 3.59 2.65
Balances with:
Scheduled Banks
– in Current Accounts 428.12 156.72
– in Deposit Accounts 23.44 32.58
(held as margin money for bank guarantees / letters of credit)
Other Banks
– Barclays Bank, UK 83.08 28.26
– Bank of America, US 316.17 7.71
– Bank of Montreal, Canada (CAD) 15.86 11.81
– Summitomo Bank, Japan 3.97 1.07
– Kawasaki Shinkim Bank, Japan 0.97 0.03
– China Minsheng Banking Corporation (USD) 4.05 1.12
– China Minsheng Banking Corporation (CNY) 0.41 2.78
– Nordbanken AB (Sweden) 16.39 0.78
– Hypo Vereins Bank, Germany 18.23 22.67
Total 914.28 268.18
Maximum amount outstanding at any time during the year in other banks
Current Accounts
– Barclays Bank, UK 172.69 85.56
– Bank of America-Texas-USA 9.94 338.26
– Bank of America-USA 528.14 764.08
– Bank of Montreal, Canada (CAD) 75.86 166.25
– Bank of Montreal, Canada (USD) – 18.73
– Summitomo Bank, Japan (USD) 22.45 163.16
– Summitomo Bank, Japan (JPY) 24.40 19.11
– China Minsheng Banking Corporation (USD) 4.80 10.55
– China Minsheng Banking Corporation (CNY) 3.38 30.33
– China Minsheng Banking Corporation (RMB) 0.28 –
– Nordbanken AB (Sweden) 16.39 14.45
– Hypo Vereins Bank, Germany 116.07 32.60
Deposit Account
– Kawasaki Shinkim Bank, Japan 1.52 18.28
Schedules forming part of the Balance Sheet (contd.)
05050449_003_138.indd 6605050449_003_138.indd 66 5/19/05 4:27:43 PM5/19/05 4:27:43 PM
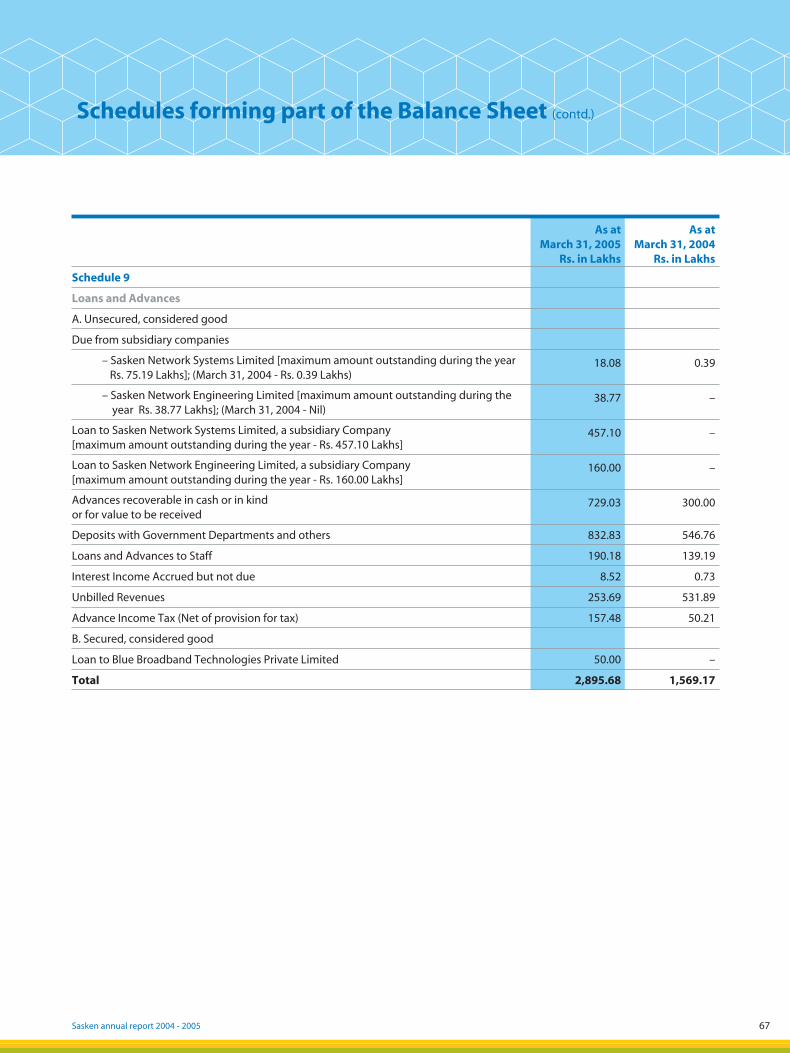
Sasken annual report 2004 - 2005 67
As at March 31, 2005
Rs. in Lakhs
As at March 31, 2004
Rs. in Lakhs
Schedule 9
Loans and Advances
A. Unsecured, considered good
Due from subsidiary companies
– Sasken Network Systems Limited [maximum amount outstanding during the year Rs. 75.19 Lakhs]; (March 31, 2004 - Rs. 0.39 Lakhs)
18.08 0.39
– Sasken Network Engineering Limited [maximum amount outstanding during the year Rs. 38.77 Lakhs]; (March 31, 2004 - Nil)
38.77 –
Loan to Sasken Network Systems Limited, a subsidiary Company [maximum amount outstanding during the year - Rs. 457.10 Lakhs]
457.10 –
Loan to Sasken Network Engineering Limited, a subsidiary Company [maximum amount outstanding during the year - Rs. 160.00 Lakhs]
160.00 –
Advances recoverable in cash or in kind or for value to be received
729.03 300.00
Deposits with Government Departments and others 832.83 546.76
Loans and Advances to Staff 190.18 139.19
Interest Income Accrued but not due 8.52 0.73
Unbilled Revenues 253.69 531.89
Advance Income Tax (Net of provision for tax) 157.48 50.21
B. Secured, considered good
Loan to Blue Broadband Technologies Private Limited 50.00 –
Total 2,895.68 1,569.17
Schedules forming part of the Balance Sheet (contd.)
5
05050449_003_138.indd 6705050449_003_138.indd 67 5/19/05 4:27:44 PM5/19/05 4:27:44 PM
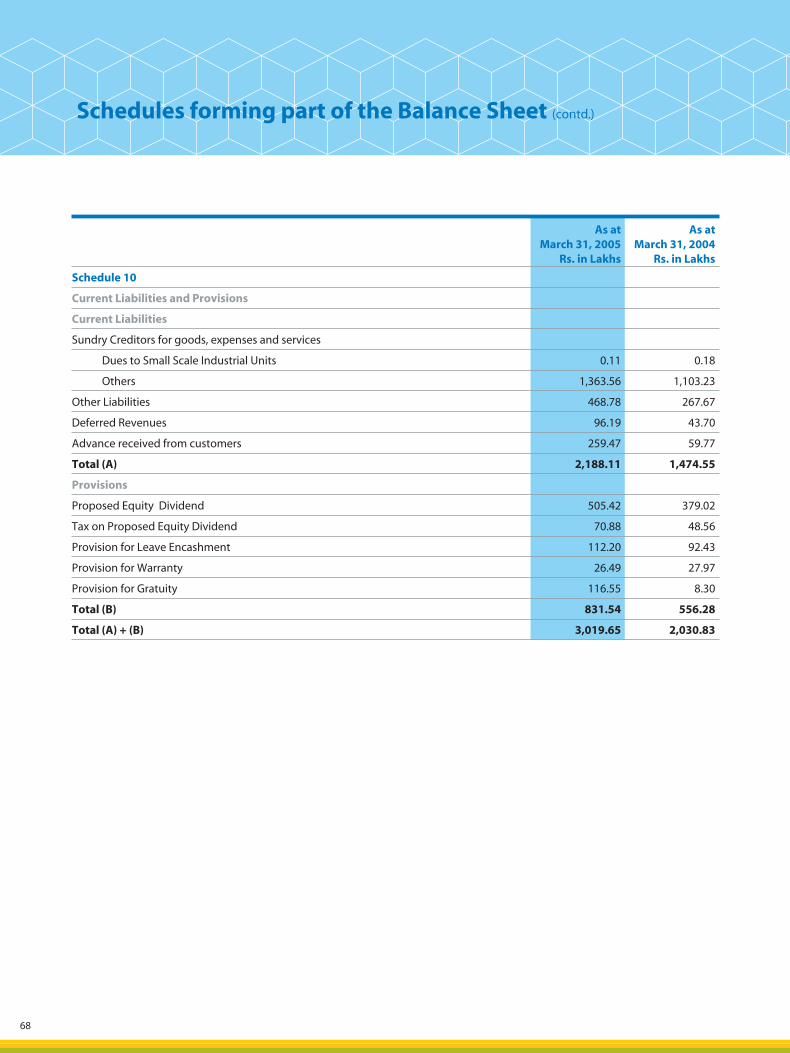
68
As at March 31, 2005
Rs. in Lakhs
As at March 31, 2004
Rs. in Lakhs
Schedule 10
Current Liabilities and Provisions
Current Liabilities
Sundry Creditors for goods, expenses and services
Dues to Small Scale Industrial Units 0.11 0.18
Others 1,363.56 1,103.23
Other Liabilities 468.78 267.67
Deferred Revenues 96.19 43.70
Advance received from customers 259.47 59.77
Total (A) 2,188.11 1,474.55
Provisions
Proposed Equity Dividend 505.42 379.02
Tax on Proposed Equity Dividend 70.88 48.56
Provision for Leave Encashment 112.20 92.43
Provision for Warranty 26.49 27.97
Provision for Gratuity 116.55 8.30
Total (B) 831.54 556.28
Total (A) + (B) 3,019.65 2,030.83
Schedules forming part of the Balance Sheet (contd.)
05050449_003_138.indd 6805050449_003_138.indd 68 5/19/05 4:27:44 PM5/19/05 4:27:44 PM
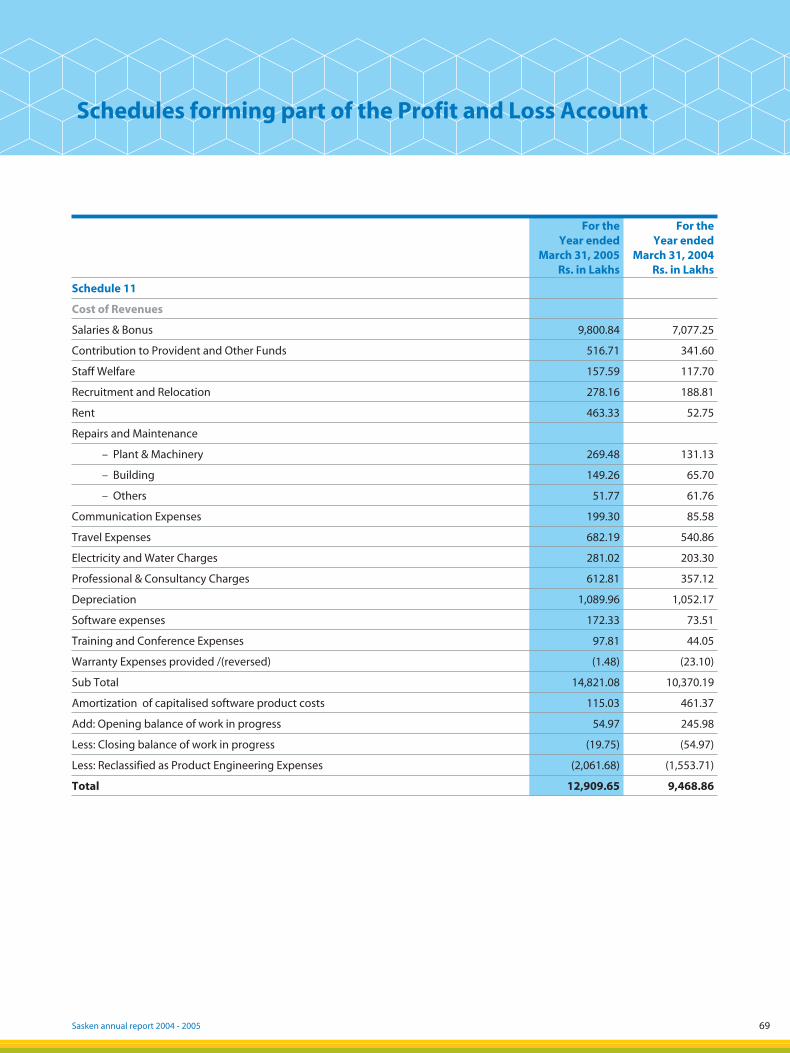
Sasken annual report 2004 - 2005 69
Schedules forming part of the Profit and Loss Account
For the Year ended
March 31, 2005 Rs. in Lakhs
For the Year ended
March 31, 2004 Rs. in Lakhs
Schedule 11
Cost of Revenues
Salaries & Bonus 9,800.84 7,077.25
Contribution to Provident and Other Funds 516.71 341.60
Staff Welfare 157.59 117.70
Recruitment and Relocation 278.16 188.81
Rent 463.33 52.75
Repairs and Maintenance
– Plant & Machinery 269.48 131.13
– Building 149.26 65.70
– Others 51.77 61.76
Communication Expenses 199.30 85.58
Travel Expenses 682.19 540.86
Electricity and Water Charges 281.02 203.30
Professional & Consultancy Charges 612.81 357.12
Depreciation 1,089.96 1,052.17
Software expenses 172.33 73.51
Training and Conference Expenses 97.81 44.05
Warranty Expenses provided /(reversed) (1.48) (23.10)
Sub Total 14,821.08 10,370.19
Amortization of capitalised software product costs 115.03 461.37
Add: Opening balance of work in progress 54.97 245.98
Less: Closing balance of work in progress (19.75) (54.97)
Less: Reclassified as Product Engineering Expenses (2,061.68) (1,553.71)
Total 12,909.65 9,468.86
05050449_003_138.indd 6905050449_003_138.indd 69 5/19/05 4:27:44 PM5/19/05 4:27:44 PM
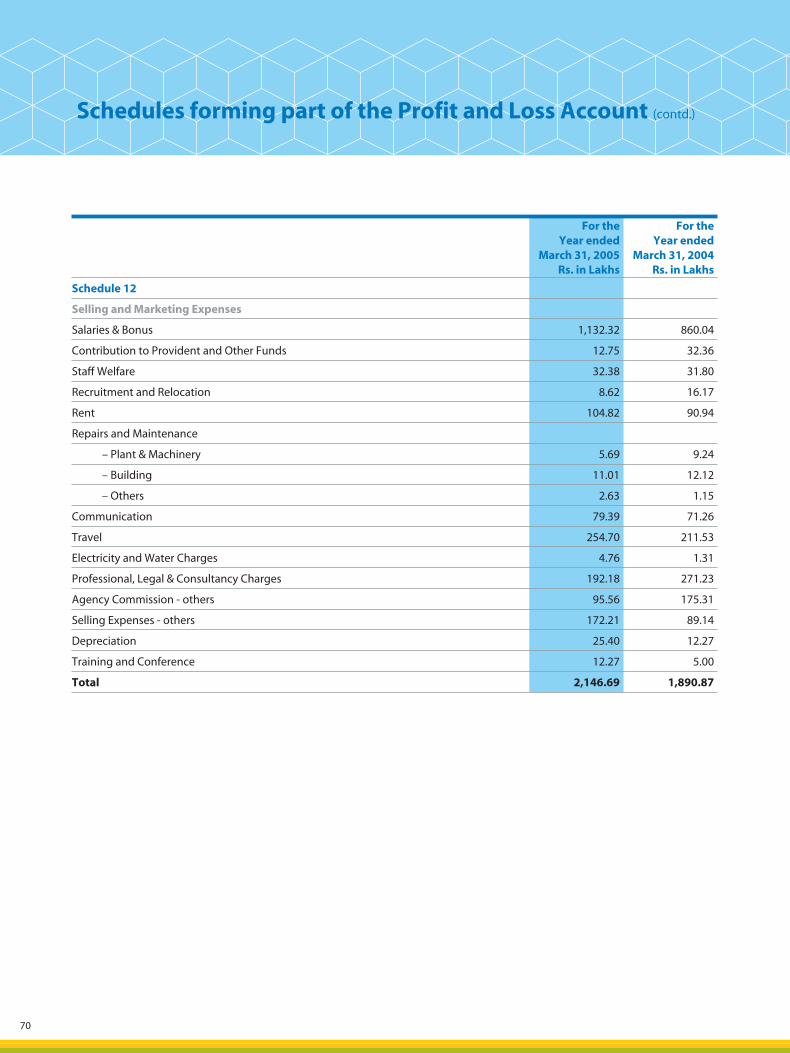
70
For the Year ended
March 31, 2005 Rs. in Lakhs
For the Year ended
March 31, 2004 Rs. in Lakhs
Schedule 12
Selling and Marketing Expenses
Salaries & Bonus 1,132.32 860.04
Contribution to Provident and Other Funds 12.75 32.36
Staff Welfare 32.38 31.80
Recruitment and Relocation 8.62 16.17
Rent 104.82 90.94
Repairs and Maintenance
– Plant & Machinery 5.69 9.24
– Building 11.01 12.12
– Others 2.63 1.15
Communication 79.39 71.26
Travel 254.70 211.53
Electricity and Water Charges 4.76 1.31
Professional, Legal & Consultancy Charges 192.18 271.23
Agency Commission - others 95.56 175.31
Selling Expenses - others 172.21 89.14
Depreciation 25.40 12.27
Training and Conference 12.27 5.00
Total 2,146.69 1,890.87
Schedules forming part of the Profit and Loss Account (contd.)
05050449_003_138.indd 7005050449_003_138.indd 70 5/19/05 4:27:44 PM5/19/05 4:27:44 PM

Sasken annual report 2004 - 2005 71
For the Year ended
March 31, 2005 Rs. in Lakhs
For the Year ended
March 31, 2004 Rs. in Lakhs
Schedule 13
Administrative and General Expenses
Salaries & Bonus 1,005.59 797.06
Contribution to Provident and Other Funds 92.83 60.28
Staff Welfare 37.40 14.43
Recruitment and Relocation 83.49 40.77
Rent 173.18 26.97
Rates and Taxes 201.44 55.57
Repairs and Maintenance
– Plant & Machinery 46.60 12.27
– Building 49.96 24.55
– Others 12.23 7.07
Communication 50.48 23.61
Travel 117.00 66.83
Electricity and Water Charges 86.26 32.71
Depreciation 215.39 116.51
Professional, Legal & Consultancy Charges 296.11 154.47
Software Charges 3.27 0.11
Auditors’ Remuneration
– Statutory Audit 7.75 6.20
– Other Services 4.45 0.15
– Out of Pocket Expenses (including service tax) 1.08 1.01
Training and Conference Expenses 46.91 56.24
Directors’ sitting fees 0.48 0.44
Insurance 72.66 76.16
Miscellaneous 468.07 301.75
Net loss on sale of current investments – 10.19
Loss on sale of fixed assets, (net) 0.13 5.21
Provision for doubtful debts, net of reversals (87.70) 28.27
Less: Recovery of common costs from subsidiary companies (128.72) –
Total 2,856.34 1,918.83
Schedules forming part of the Profit and Loss Account (contd.)
05050449_003_138.indd 7105050449_003_138.indd 71 5/19/05 4:27:45 PM5/19/05 4:27:45 PM

72
For the Year ended
March 31, 2005 Rs. in Lakhs
For the Year ended
March 31, 2004 Rs. in Lakhs
Schedule 14
Other Income / (Expenses)
Miscellaneous income 0.02 7.99
Dividend received on current investments (non-trade) 14.09 55.47
Net gain on sale of current investments (non-trade) 11.39 –
Interest income on Bank Deposits (Gross)* 3.46 4.30
Other interest income 4.25 1.70
Interest on Loan / Optionally Convertible Debentures to subsidiary companies 27.38 –
Total 60.59 69.46
* Tax deducted at source 0.76 0.84
Schedule 15
Interest Expense
– On Term Loans – 8.25
– On Fully Convertible Debentures – 0.02
– Others 44.85 71.57
Total 44.85 79.84
Schedules forming part of the Profit and Loss Account (contd.)
05050449_003_138.indd 7205050449_003_138.indd 72 5/19/05 4:27:45 PM5/19/05 4:27:45 PM
Sasken annual report 2004 - 2005 73
Schedules forming part of the accounts for the year ended March 31, 2005.
Schedule 16
1. Description of Business
Sasken Communication Technologies Limited (“Sasken” or “the Company”) is a provider of telecommunication software services and solutions to network equipment manufacturers, mobile terminal vendors and semiconductor companies around the world. Sasken delivers end-to-end solutions that enable richer content delivery on next generation networks.
Sasken has its headquarters in Bangalore, India with offices in Pune, Canada, China, Germany, Japan, Sweden, United Kingdom (UK) and the United States of America (USA).
2. Significant Accounting Policies
Basis for preparation of financial statements
The financial statements have been prepared to comply in all material respects with the mandatory Accounting Standards issued by the Institute of Chartered Accountants of India and the relevant provisions of the Companies Act, 1956. The financial statements have been prepared under the historical cost convention on an accrual basis. The accounting policies have been consistently applied by the Company and are consistent with those used in the year ended March 31, 2004, except for change in accounting policy and change in estimate as stated below.
The presentation of financial statements in conformity with generally accepted accounting principles requires management to make estimates and assumptions that affect the amounts reported in the financial statements and accompanying notes. Although these estimates are based on management’s best knowledge of current events and actions the Company may undertake in future, actual results ultimately may differ from the estimates.
Change in accounting policy
In order to comply with Accounting Standard – 11 (Revised) – The Effects of Changes in Foreign Exchange Rates, which is effective April 1, 2004, during the reporting periods subsequent to March 31, 2004, the Company changed its accounting policy in respect of accounting for forward contracts entered into to hedge the foreign currency risk of the underlying assets and liabilities at the balance sheet date. Consequently, in respect of foreign currency monetary assets or liabilities in respect of which forward exchange contract is taken, exchange differences on such contracts are recognized in the statement of profit and loss of the relevant period. On account of such change in the accounting policy, exchange gain for the year ended March 31, 2005 is higher by Rs. 136.47 lakhs with a consequential impact on the profit after tax for the year ended March 31, 2005.
Change in estimate
During the year ended March 31, 2005 the Company revised its estimate of useful life of generic computer software to one year, prospectively. Hitherto, generic computer software was charged 100% depreciation in the year of purchase. Due to this change, depreciation on fixed assets for the year ended March 31, 2005 is lower by Rs. 51.86 lakhs and profits after tax are higher to the same extent.
Revenue Recognition
The Company derives its revenues from product and technology licensing and software services.
Licensing revenue is recognized when the product or technology is delivered and accepted. Revenue related to customized products or technology development agreements is recognized using the proportionate completion method, determined based on the achievement and acceptance of the milestone. In all cases
Notes forming part of accounts
05050449_003_138.indd 7305050449_003_138.indd 73 5/19/05 4:27:45 PM5/19/05 4:27:45 PM
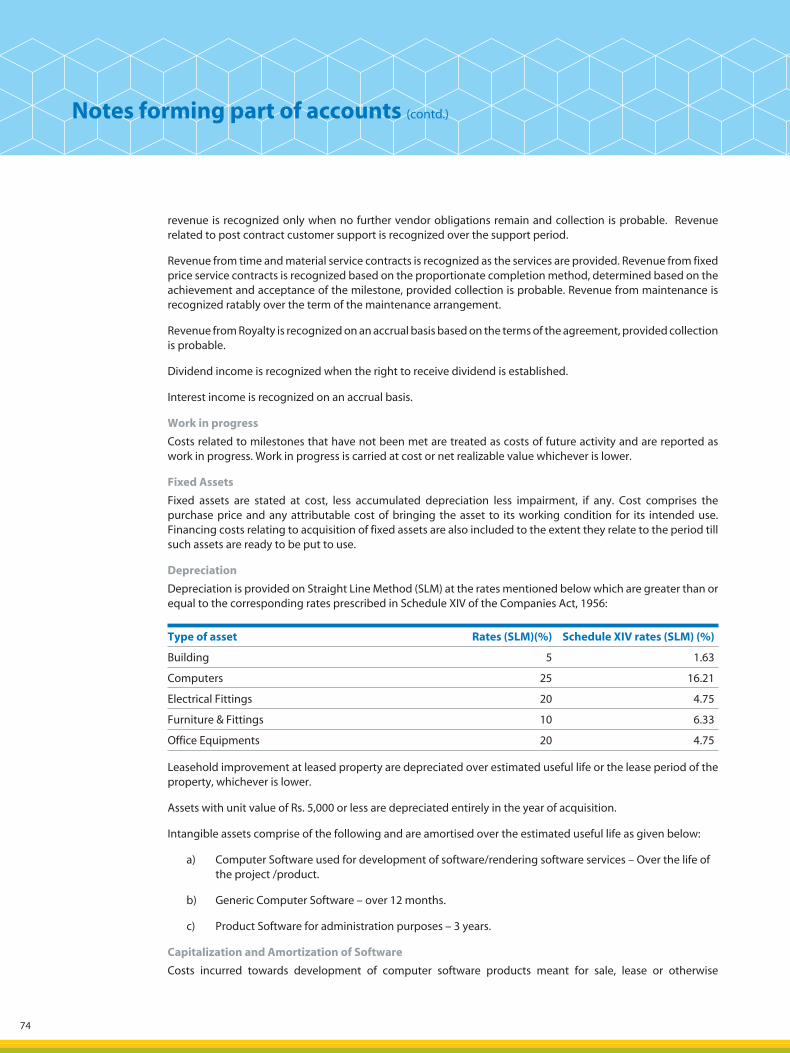
74
revenue is recognized only when no further vendor obligations remain and collection is probable. Revenue related to post contract customer support is recognized over the support period.
Revenue from time and material service contracts is recognized as the services are provided. Revenue from fixed price service contracts is recognized based on the proportionate completion method, determined based on the achievement and acceptance of the milestone, provided collection is probable. Revenue from maintenance is recognized ratably over the term of the maintenance arrangement.
Revenue from Royalty is recognized on an accrual basis based on the terms of the agreement, provided collection is probable.
Dividend income is recognized when the right to receive dividend is established.
Interest income is recognized on an accrual basis.
Work in progress
Costs related to milestones that have not been met are treated as costs of future activity and are reported as work in progress. Work in progress is carried at cost or net realizable value whichever is lower.
Fixed Assets
Fixed assets are stated at cost, less accumulated depreciation less impairment, if any. Cost comprises the purchase price and any attributable cost of bringing the asset to its working condition for its intended use. Financing costs relating to acquisition of fixed assets are also included to the extent they relate to the period till such assets are ready to be put to use.
Depreciation
Depreciation is provided on Straight Line Method (SLM) at the rates mentioned below which are greater than or equal to the corresponding rates prescribed in Schedule XIV of the Companies Act, 1956:
Type of asset Rates (SLM)(%) Schedule XIV rates (SLM) (%)
Building 5 1.63
Computers 25 16.21
Electrical Fittings 20 4.75
Furniture & Fittings 10 6.33
Office Equipments 20 4.75
Leasehold improvement at leased property are depreciated over estimated useful life or the lease period of the property, whichever is lower.
Assets with unit value of Rs. 5,000 or less are depreciated entirely in the year of acquisition.
Intangible assets comprise of the following and are amortised over the estimated useful life as given below:
a) Computer Software used for development of software/rendering software services – Over the life of the project /product.
b) Generic Computer Software – over 12 months.
c) Product Software for administration purposes – 3 years.
Capitalization and Amortization of Software
Costs incurred towards development of computer software products meant for sale, lease or otherwise
Notes forming part of accounts (contd.)
05050449_003_138.indd 7405050449_003_138.indd 74 5/19/05 4:27:46 PM5/19/05 4:27:46 PM
Sasken annual report 2004 - 2005 75
marketed, are capitalised subsequent to establishing technological feasibility. Capitalisation ceases when the product is available for general release to customers. Capitalised software costs are amortised on a product-by-product basis. The amortization shall be greater of the amount computed using (a) the ratio that current gross revenue for a product bears to the total of current and anticipated future gross revenues for that product or (b) the straight-line method over the remaining estimated economic life of the product. The unamortised cost of capitalized software products is carried at cost or net realisable value whichever is lower.
Investments
Investments that are readily realisable and intended to be held for not more than a year are classified as current investments. All other investments are classified as long-term investments. Current investments are carried at lower of cost and fair value determined on an individual investment basis. Long-term investments are carried at cost. However, provision for diminution in value is made to recognise a decline other than temporary in the value of the investments.
Foreign currency transactions
(i) Initial Recognition – Foreign currency transactions are recorded in the reporting currency, by applying to the foreign currency amount the exchange rate between the reporting currency and the foreign currency approximately at the date of the transaction.
(ii) Conversion – Foreign currency monetary items are reported using the closing rate. Non-monetary items, which are carried in terms of historical cost denominated in a foreign currency, are reported using the exchange rate at the date of the transaction.
(iii) Exchange Differences – Exchange differences arising on the settlement or conversion of monetary items, are recognised as income or as expenses in the year in which they arise except those arising on liabilities pertaining to fixed assets, which are adjusted with the cost of the fixed assets.
(iv) Forward Exchange Contracts – The Company uses forward exchange contracts to hedge its exposure to movements in foreign exchange rates. The Company does not use the forward exchange contracts for trading or speculation purposes. In respect of foreign currency monetary assets or liabilities in respect of which forward exchange contract is taken, the premium or discount arising at the inception of forward exchange contracts is amortised as expense or income over the life of the contract, except where it relates to fixed assets in which case it is adjusted to the cost of the corresponding asset. Exchange differences on such contracts are recognised in the statement of profit and loss of the relevant year. Any profit or loss arising on cancellation or renewal of forward exchange contract is recognised as income or as expense for the year.
(vi) Foreign branches – The financial statements of an integral foreign operation are translated as if the transactions of the foreign operation have been those of the Company itself.
Retirement benefits to employees
The Company contributes to a Group Gratuity Scheme, administered by a private insurance Company. The contributions are charged to the Profit and Loss account. Provision is made for the difference between the actuarial valuation (determined as at the balance sheet date) and the funded balance.
Provision for leave encashment benefits is made based on actuarial valuation as at the balance sheet date.
The Company has established a Provident Fund Trust to which contributions towards provident fund are made each month. The contributions towards the pension fund are remitted to the Regional Provident Fund. Contributions towards Provident Fund and Pension Fund are charged to the Profit and Loss Account on an accrual basis. The Trust guarantees a specified rate of return on such contributions of employee and employer on a yearly basis. The Company will meet the shortfall in the return, if any, and the same is charged to the profit and loss account on an accrual basis.
Notes forming part of accounts (contd.)
05050449_003_138.indd 7505050449_003_138.indd 75 5/19/05 4:27:46 PM5/19/05 4:27:46 PM
76
The Company established a Super Annuation Scheme administered by a private insurance Company. As per the Scheme, for employees claiming the benefit, the Company makes monthly contributions, which are charged to the Profit and Loss Account on an accrual basis. The Company has no other obligations under the Scheme.
Impairment of assets
The Company assesses at each balance sheet date whether there is any indication that an asset may be impaired. If any such indication exists, the Company estimates the recoverable amount of the asset. If such recoverable amount of the asset or recoverable amount of the cash-generating unit to which the asset belongs is less than its carrying amount, the carrying amount is reduced to its recoverable amount. The reduction is treated as an impairment loss and is recognized in the profit and loss account. If at the balance sheet date there is an indication that if a previously assessed impairment loss no longer exists, the recoverable amount is reassessed and the asset is reflected at the recoverable amount.
Warranty expenses
The Company provides for the estimated costs based on trend of past analysis and nature of services rendered, that may be incurred under free warranties, as provided in licensing and service contracts.
Research and Development
All research and development costs are charged to Profit and Loss account when incurred. Equipment or facilities that are acquired or constructed for research and development activities, which have alternative future uses are capitalized as tangible assets. Depreciation on such assets is charged to expense as research and development costs.
Income Taxes
Tax expense comprises both current and deferred taxes. Current income tax is measured at the amount expected to be paid to the tax authorities in accordance with the Indian Income Tax Act, 1961 and tax laws applicable to the overseas branches under the respective jurisdictions. Deferred income taxes reflect the impact of current year timing differences between taxable income and accounting income for the year and reversal of timing differences of earlier years. Deferred tax is measured based on the tax rates and the tax laws enacted or substantively enacted at the balance sheet date. Deferred tax assets and deferred tax liabilities across various countries of operation are not set off against each other as the Company does not have a legal right to do so. Deferred tax assets are recognised only to the extent that there is reasonable certainty that sufficient future taxable income will be available against which such deferred tax assets can be realised. Deferred tax assets are recognised on carry forward of unabsorbed depreciation and tax losses only if there is virtual certainty that such deferred tax assets can be realised against future taxable profits. Unrecognised deferred tax assets of earlier years are re-assessed and recognised to the extent that it has become reasonably certain that future taxable income will be available against which such deferred tax assets can be realised.
Stock Compensation Expense
The Company accounts for stock compensation expense based on the fair value of the options granted on the date of grant. Compensation expense is amortized over the vesting period of the option on a straight-line basis. The accounting value of the options net of the Deferred Compensation Expense is reflected as Employee Stock Options Outstanding under Reserves and Surplus.
Earnings per share
Basic earnings per share are calculated by dividing the net profit or loss for the year attributable to equity shareholders by the weighted average number of equity shares outstanding during the year. Partly paid equity shares are treated as a fraction of an equity share to the extent that they were entitled to participate in dividends relative to a fully paid equity share during the reporting year. The weighted average number of equity shares outstanding during the year are adjusted for events of bonus issue; bonus element in a rights issue to existing shareholders; share split and reverse share split (consolidation of shares).
Notes forming part of accounts (contd.)
05050449_003_138.indd 7605050449_003_138.indd 76 5/19/05 4:27:47 PM5/19/05 4:27:47 PM
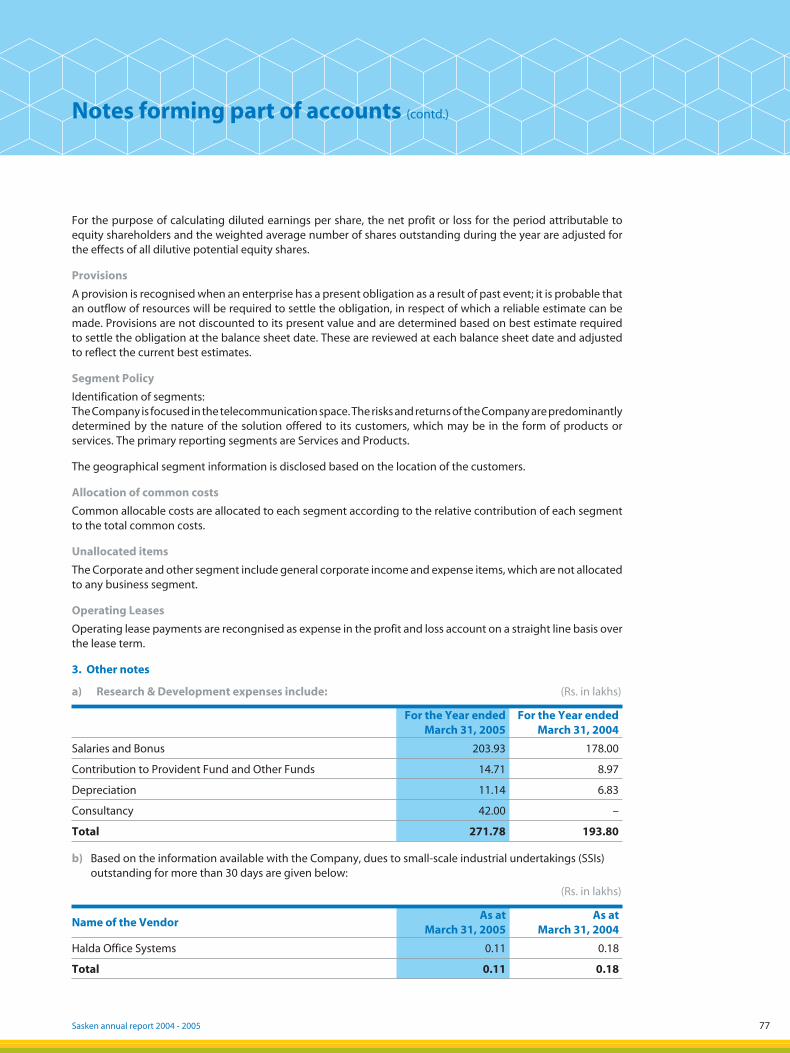
Sasken annual report 2004 - 2005 77
For the purpose of calculating diluted earnings per share, the net profit or loss for the period attributable to equity shareholders and the weighted average number of shares outstanding during the year are adjusted for the effects of all dilutive potential equity shares.
Provisions
A provision is recognised when an enterprise has a present obligation as a result of past event; it is probable that an outflow of resources will be required to settle the obligation, in respect of which a reliable estimate can be made. Provisions are not discounted to its present value and are determined based on best estimate required to settle the obligation at the balance sheet date. These are reviewed at each balance sheet date and adjusted to reflect the current best estimates.
Segment Policy
Identification of segments:The Company is focused in the telecommunication space. The risks and returns of the Company are predominantly determined by the nature of the solution offered to its customers, which may be in the form of products or services. The primary reporting segments are Services and Products.
The geographical segment information is disclosed based on the location of the customers.
Allocation of common costs
Common allocable costs are allocated to each segment according to the relative contribution of each segment to the total common costs.
Unallocated items
The Corporate and other segment include general corporate income and expense items, which are not allocated to any business segment.
Operating Leases
Operating lease payments are recongnised as expense in the profit and loss account on a straight line basis over the lease term.
3. Other notes
a) Research & Development expenses include: (Rs. in lakhs)
For the Year endedMarch 31, 2005
For the Year endedMarch 31, 2004
Salaries and Bonus 203.93 178.00
Contribution to Provident Fund and Other Funds 14.71 8.97
Depreciation 11.14 6.83
Consultancy 42.00 –
Total 271.78 193.80
b) Based on the information available with the Company, dues to small-scale industrial undertakings (SSIs) outstanding for more than 30 days are given below:
(Rs. in lakhs)
Name of the VendorAs at
March 31, 2005As at
March 31, 2004
Halda Office Systems 0.11 0.18
Total 0.11 0.18
Notes forming part of accounts (contd.)
05050449_003_138.indd 7705050449_003_138.indd 77 5/19/05 4:27:47 PM5/19/05 4:27:47 PM
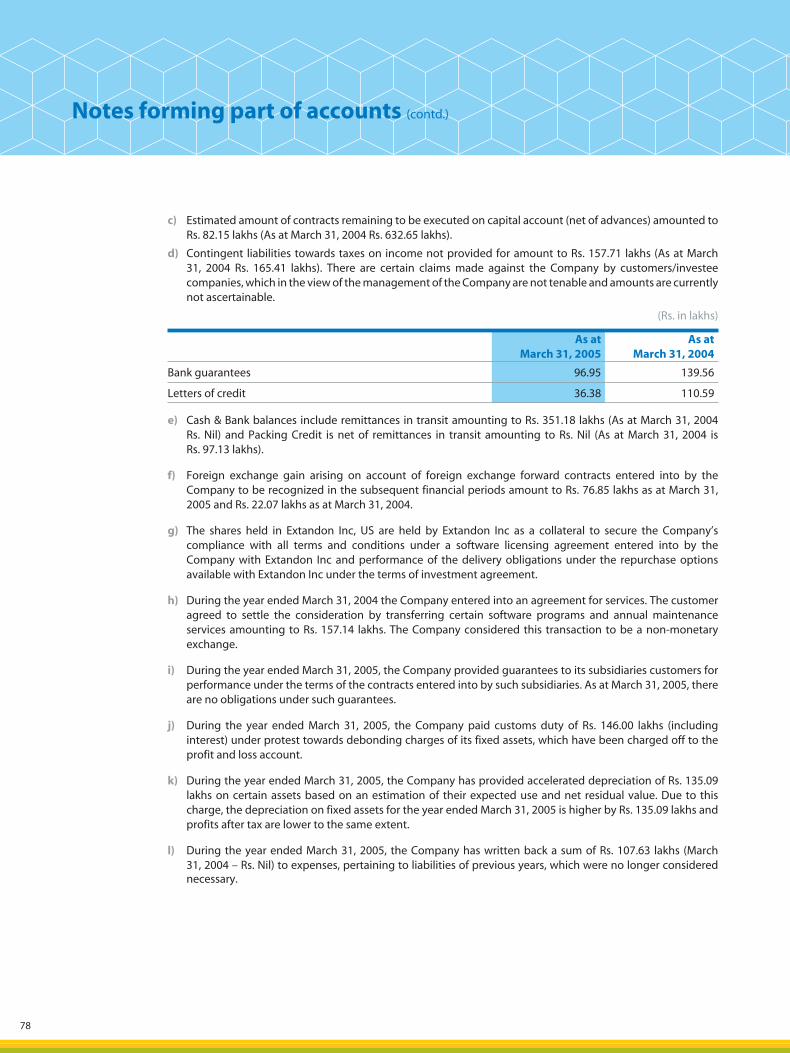
78
c) Estimated amount of contracts remaining to be executed on capital account (net of advances) amounted to Rs. 82.15 lakhs (As at March 31, 2004 Rs. 632.65 lakhs).
d) Contingent liabilities towards taxes on income not provided for amount to Rs. 157.71 lakhs (As at March 31, 2004 Rs. 165.41 lakhs). There are certain claims made against the Company by customers/investee companies, which in the view of the management of the Company are not tenable and amounts are currently not ascertainable.
(Rs. in lakhs)
As at March 31, 2005
As at March 31, 2004
Bank guarantees 96.95 139.56
Letters of credit 36.38 110.59
e) Cash & Bank balances include remittances in transit amounting to Rs. 351.18 lakhs (As at March 31, 2004Rs. Nil) and Packing Credit is net of remittances in transit amounting to Rs. Nil (As at March 31, 2004 isRs. 97.13 lakhs).
f) Foreign exchange gain arising on account of foreign exchange forward contracts entered into by the Company to be recognized in the subsequent financial periods amount to Rs. 76.85 lakhs as at March 31, 2005 and Rs. 22.07 lakhs as at March 31, 2004.
g) The shares held in Extandon Inc, US are held by Extandon Inc as a collateral to secure the Company’s compliance with all terms and conditions under a software licensing agreement entered into by the Company with Extandon Inc and performance of the delivery obligations under the repurchase options available with Extandon Inc under the terms of investment agreement.
h) During the year ended March 31, 2004 the Company entered into an agreement for services. The customer agreed to settle the consideration by transferring certain software programs and annual maintenance services amounting to Rs. 157.14 lakhs. The Company considered this transaction to be a non-monetary exchange.
i) During the year ended March 31, 2005, the Company provided guarantees to its subsidiaries customers for performance under the terms of the contracts entered into by such subsidiaries. As at March 31, 2005, there are no obligations under such guarantees.
j) During the year ended March 31, 2005, the Company paid customs duty of Rs. 146.00 lakhs (including interest) under protest towards debonding charges of its fixed assets, which have been charged off to the profit and loss account.
k) During the year ended March 31, 2005, the Company has provided accelerated depreciation of Rs. 135.09 lakhs on certain assets based on an estimation of their expected use and net residual value. Due to this charge, the depreciation on fixed assets for the year ended March 31, 2005 is higher by Rs. 135.09 lakhs and profits after tax are lower to the same extent.
l) During the year ended March 31, 2005, the Company has written back a sum of Rs. 107.63 lakhs (March 31, 2004 – Rs. Nil) to expenses, pertaining to liabilities of previous years, which were no longer considered necessary.
Notes forming part of accounts (contd.)
05050449_003_138.indd 7805050449_003_138.indd 78 5/19/05 4:27:47 PM5/19/05 4:27:47 PM

Sasken annual report 2004 - 2005 79
m) Earnings and Expenditure in Foreign Currency
(Rs. in lakhs)
For the Year endedMarch 31, 2005
For the Year endedMarch 31, 2004
Earnings in Foreign Currency
Income from Licensing and Software development 21,393.43 16,381.50
Royalty 216.61 95.72
Others 188.67 –
Expenditure in Foreign Currency, (on payment basis)
Travel 855.71 584.43
Less: Recovered from customers (775.75) (531.16)
Selling Expenses 154.98 158.65
Professional, Legal & Consultancy Charges 203.40 132.97
Software Expenses 273.04 27.99
Expenses at Branch Offices 4,182.22 3,824.40
Others 196.52 94.42
Value of Imports on CIF Basis – Capital Goods 587.60 254.74
Remittance in foreign currency on account of dividends
No. of Shareholders 20 –
No. of shares of Rs. 5 (par value per share) 7,416,868 –
Amount of Dividend paid 92.71 –
Year to which dividends relate 2003-04 –
4. Managerial Remuneration
a) Managerial remuneration paid to Directors
(Rs. in lakhs)
For the Year endedMarch 31, 2005
For the Year endedMarch 31, 2004
Whole Time Directors
Salaries and bonus 203.34 196.69
Contribution to Provident Fund and other Funds # 10.31 8.99
Non Whole Time Directors 26.96 16.83
Total 240.61 222.51
# The above does not include provisions for/contributions to employee retirement and other employee benefit schemes determined on actuarial basis.
Notes forming part of accounts (contd.)
05050449_003_138.indd 7905050449_003_138.indd 79 5/19/05 4:27:48 PM5/19/05 4:27:48 PM
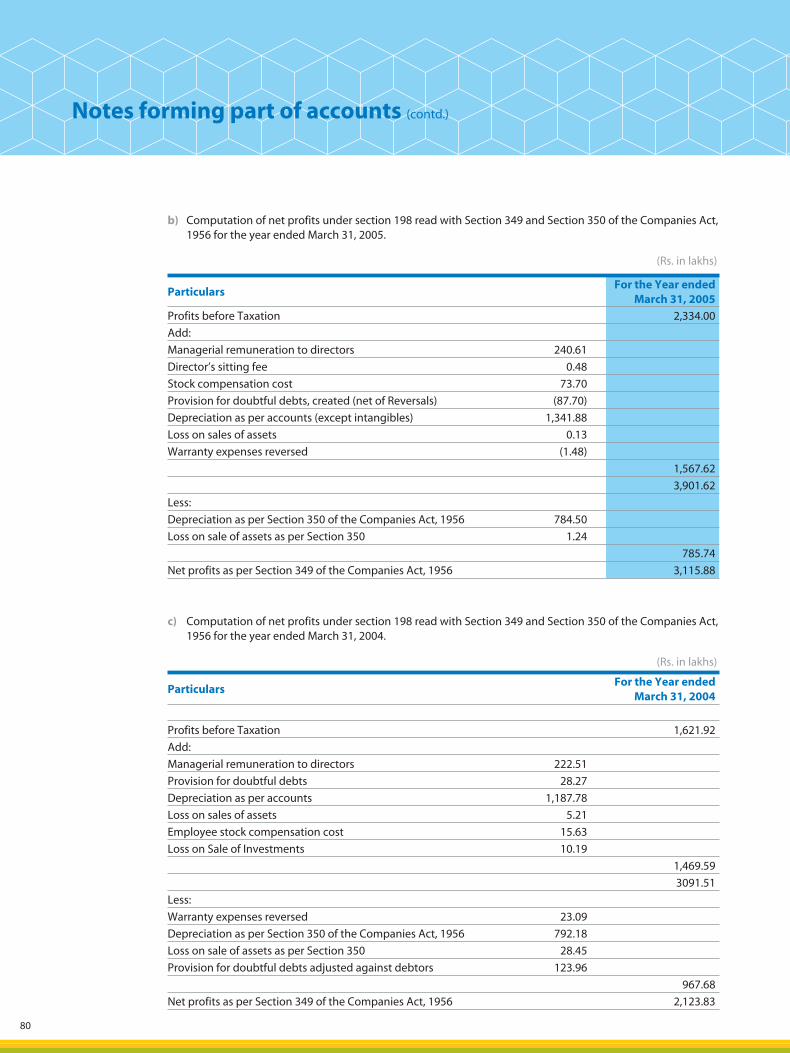
80
b) Computation of net profits under section 198 read with Section 349 and Section 350 of the Companies Act, 1956 for the year ended March 31, 2005.
(Rs. in lakhs)
ParticularsFor the Year ended
March 31, 2005
Profits before Taxation 2,334.00
Add:
Managerial remuneration to directors 240.61
Director’s sitting fee 0.48
Stock compensation cost 73.70
Provision for doubtful debts, created (net of Reversals) (87.70)
Depreciation as per accounts (except intangibles) 1,341.88
Loss on sales of assets 0.13
Warranty expenses reversed (1.48)
1,567.62
3,901.62
Less:
Depreciation as per Section 350 of the Companies Act, 1956 784.50
Loss on sale of assets as per Section 350 1.24
785.74
Net profits as per Section 349 of the Companies Act, 1956 3,115.88
c) Computation of net profits under section 198 read with Section 349 and Section 350 of the Companies Act, 1956 for the year ended March 31, 2004.
(Rs. in lakhs)
ParticularsFor the Year ended
March 31, 2004
Profits before Taxation 1,621.92
Add:
Managerial remuneration to directors 222.51
Provision for doubtful debts 28.27
Depreciation as per accounts 1,187.78
Loss on sales of assets 5.21
Employee stock compensation cost 15.63
Loss on Sale of Investments 10.19
1,469.59
3091.51
Less:
Warranty expenses reversed 23.09
Depreciation as per Section 350 of the Companies Act, 1956 792.18
Loss on sale of assets as per Section 350 28.45
Provision for doubtful debts adjusted against debtors 123.96
967.68
Net profits as per Section 349 of the Companies Act, 1956 2,123.83
Notes forming part of accounts (contd.)
05050449_003_138.indd 8005050449_003_138.indd 80 5/19/05 4:27:48 PM5/19/05 4:27:48 PM
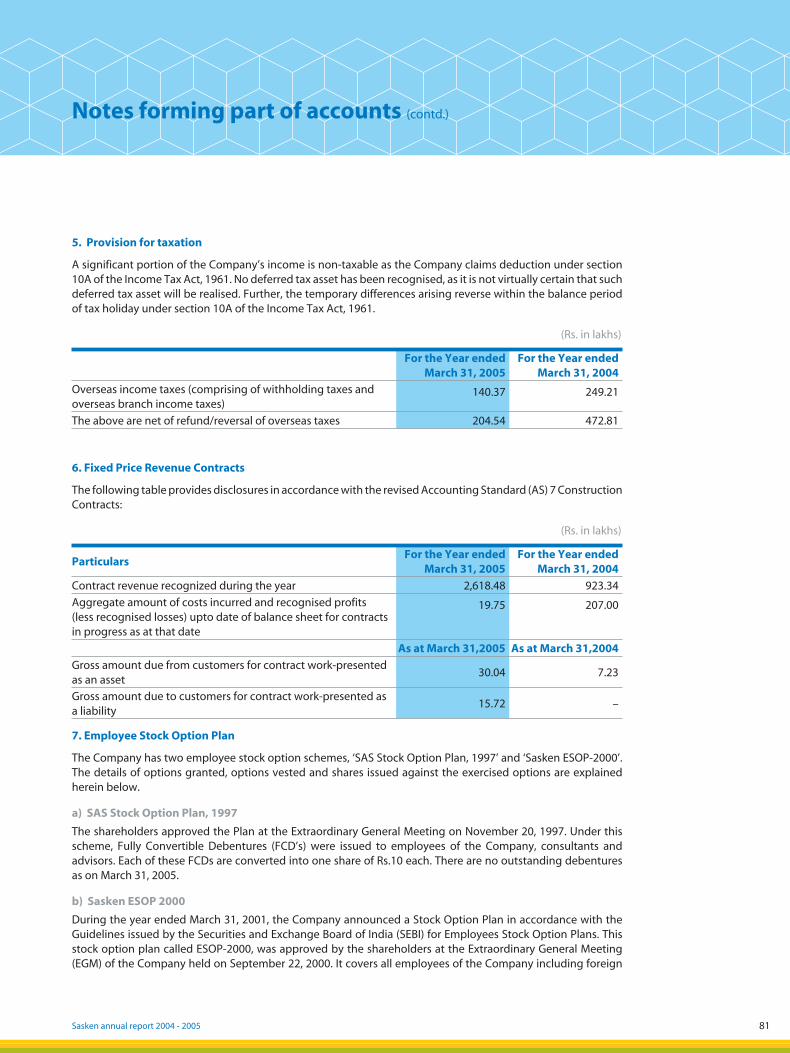
Sasken annual report 2004 - 2005 81
5. Provision for taxation
A significant portion of the Company’s income is non-taxable as the Company claims deduction under section 10A of the Income Tax Act, 1961. No deferred tax asset has been recognised, as it is not virtually certain that such deferred tax asset will be realised. Further, the temporary differences arising reverse within the balance period of tax holiday under section 10A of the Income Tax Act, 1961.
(Rs. in lakhs)
For the Year endedMarch 31, 2005
For the Year endedMarch 31, 2004
Overseas income taxes (comprising of withholding taxes and overseas branch income taxes)
140.37 249.21
The above are net of refund/reversal of overseas taxes 204.54 472.81
6. Fixed Price Revenue Contracts
The following table provides disclosures in accordance with the revised Accounting Standard (AS) 7 Construction Contracts:
(Rs. in lakhs)
ParticularsFor the Year ended
March 31, 2005For the Year ended
March 31, 2004
Contract revenue recognized during the year 2,618.48 923.34
Aggregate amount of costs incurred and recognised profits (less recognised losses) upto date of balance sheet for contracts in progress as at that date
19.75 207.00
As at March 31,2005 As at March 31,2004
Gross amount due from customers for contract work-presented as an asset
30.04 7.23
Gross amount due to customers for contract work-presented as a liability
15.72 –
7. Employee Stock Option Plan
The Company has two employee stock option schemes, ‘SAS Stock Option Plan, 1997’ and ‘Sasken ESOP-2000’. The details of options granted, options vested and shares issued against the exercised options are explained herein below.
a) SAS Stock Option Plan, 1997
The shareholders approved the Plan at the Extraordinary General Meeting on November 20, 1997. Under this scheme, Fully Convertible Debentures (FCD’s) were issued to employees of the Company, consultants and advisors. Each of these FCDs are converted into one share of Rs.10 each. There are no outstanding debentures as on March 31, 2005.
b) Sasken ESOP 2000
During the year ended March 31, 2001, the Company announced a Stock Option Plan in accordance with the Guidelines issued by the Securities and Exchange Board of India (SEBI) for Employees Stock Option Plans. This stock option plan called ESOP-2000, was approved by the shareholders at the Extraordinary General Meeting (EGM) of the Company held on September 22, 2000. It covers all employees of the Company including foreign
Notes forming part of accounts (contd.)
05050449_003_138.indd 8105050449_003_138.indd 81 5/19/05 4:27:49 PM5/19/05 4:27:49 PM

82
branches, employees of the subsidiaries including its part time/ full time Directors other than the promoter directors. The Plan provides for the issue of 30 lakh shares (including the shares issued under the FCD’s as per the SAS Stock Option plan, 1997 and the shares to be issued consequent to the exercise of the options granted under the current plan) of Rs. 10 each duly adjusted for any bonus, splits, etc. A Compensation Committee comprising of three independent directors on the Board administers the scheme.
A decision to consolidate the face value of the shares from Rs. 5 to Rs. 10 was taken by the board at the meeting held on June 11, 2004 and an EGM was held on July 16, 2004. The EGM approved the consolidation of the shares and consequently the options also have been adjusted to reflect the consolidation. The options have now been converted to 1 option for every 2 options held earlier and fractional options have been adjusted to the next whole number.
The Company cancelled stock options granted under Sasken ESOP 2000 and remaining unexercised as at December 31, 2002. Consequent to the cancellation of the stock options, the Company reversed the compensation cost of Rs. 714.62 lakhs recognized by it in the prior years.
In October 2003 and thereafter, the Company issued 592,080 options to employees, convertible into 592,080 equity shares, with a vesting period of one year at an exercise price of Rs. 40 per share being the fair value of the Company’s share as determined by the Company as at the date of grant. The above options have been consolidated to reflect the above as 296,040 options at a revised fair value price of Rs. 80 per share.
On April 2, 2004 and June 1, 2004, the Company issued 757,850 options to 1372 employees and 1,943,065 options to 347 employees, respectively. The effective options after consolidation translates to 378,925 Options to 1372 employees and 971,533 options to 347 employees respectively. These options carry a vesting period ranging one to four years at an exercise price ranging from Rs. 80 to Rs. 128 per share depending upon the exercise period being the fair value of the Company’s share as determined by the Company as at the date of grant. The exercise price translates to Rs. 160 to Rs. 256 per share after the consolidation of the options.
On February 23, 2005, the Company issued 42,530 options to 41 employees of Sasken Network Systems Ltd. and 2,735 options to 3 employees of the Company. These options carry a vesting period ranging one to four years at an exercise price ranging from Rs. 184 to Rs. 256 per share depending upon the exercise period, being the fair value of the Company’s share as determined by the Company as at the date of grant.
The movement in options is given below:
For the Year endedMarch 31, 2005
For the Year endedMarch 31, 2004
Options outstanding as at the beginning of the year 274,110 Nil
Options issued during the year 1,395,723 296,040
Options forfeited during the year 166,475 21,930
Options exercised during the year 84,870 Nil
Options outstanding as at the closing of the year 1,418,488 274,110
The total accounting value of options outstanding as on March 31, 2005 is Rs. 115.02 lakhs (as at March 31, 2004 Rs. 31.30 lakhs) of which Rs. 83.28 lakhs (net of reversal) (2004 – Rs. 15.63 lakhs) has been recognized as compensation cost based on the vesting period of the options. The accounting value of the options outstanding at March 31, 2005, net of the Deferred Compensation Cost of Rs. 31.74 lakhs (as at March 31, 2004 Rs. 15.67 lakhs) has been reflected as Employee stock options outstanding under Reserves and Surplus.
Notes forming part of accounts (contd.)
05050449_003_138.indd 8205050449_003_138.indd 82 5/19/05 4:27:49 PM5/19/05 4:27:49 PM
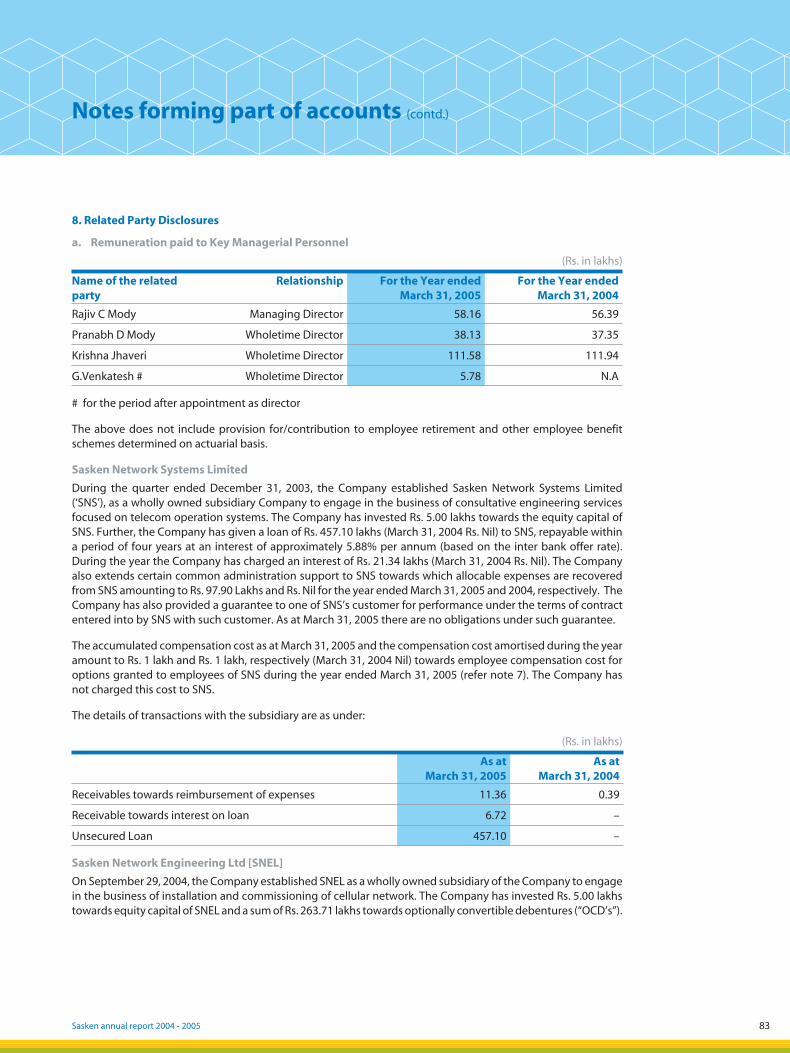
Sasken annual report 2004 - 2005 83
8. Related Party Disclosures
a. Remuneration paid to Key Managerial Personnel
(Rs. in lakhs)
Name of the related party
Relationship For the Year ended March 31, 2005
For the Year ended March 31, 2004
Rajiv C Mody Managing Director 58.16 56.39
Pranabh D Mody Wholetime Director 38.13 37.35
Krishna Jhaveri Wholetime Director 111.58 111.94
G.Venkatesh # Wholetime Director 5.78 N.A
# for the period after appointment as director
The above does not include provision for/contribution to employee retirement and other employee benefit schemes determined on actuarial basis.
Sasken Network Systems Limited
During the quarter ended December 31, 2003, the Company established Sasken Network Systems Limited (‘SNS’), as a wholly owned subsidiary Company to engage in the business of consultative engineering services focused on telecom operation systems. The Company has invested Rs. 5.00 lakhs towards the equity capital of SNS. Further, the Company has given a loan of Rs. 457.10 lakhs (March 31, 2004 Rs. Nil) to SNS, repayable within a period of four years at an interest of approximately 5.88% per annum (based on the inter bank offer rate). During the year the Company has charged an interest of Rs. 21.34 lakhs (March 31, 2004 Rs. Nil). The Company also extends certain common administration support to SNS towards which allocable expenses are recovered from SNS amounting to Rs. 97.90 Lakhs and Rs. Nil for the year ended March 31, 2005 and 2004, respectively. The Company has also provided a guarantee to one of SNS’s customer for performance under the terms of contract entered into by SNS with such customer. As at March 31, 2005 there are no obligations under such guarantee.
The accumulated compensation cost as at March 31, 2005 and the compensation cost amortised during the year amount to Rs. 1 lakh and Rs. 1 lakh, respectively (March 31, 2004 Nil) towards employee compensation cost for options granted to employees of SNS during the year ended March 31, 2005 (refer note 7). The Company has not charged this cost to SNS.
The details of transactions with the subsidiary are as under:
(Rs. in lakhs)
As at March 31, 2005
As at March 31, 2004
Receivables towards reimbursement of expenses 11.36 0.39
Receivable towards interest on loan 6.72 –
Unsecured Loan 457.10 –
Sasken Network Engineering Ltd [SNEL]
On September 29, 2004, the Company established SNEL as a wholly owned subsidiary of the Company to engage in the business of installation and commissioning of cellular network. The Company has invested Rs. 5.00 lakhs towards equity capital of SNEL and a sum of Rs. 263.71 lakhs towards optionally convertible debentures (“OCD’s”).
Notes forming part of accounts (contd.)
6
05050449_003_138.indd 8305050449_003_138.indd 83 5/19/05 4:27:50 PM5/19/05 4:27:50 PM
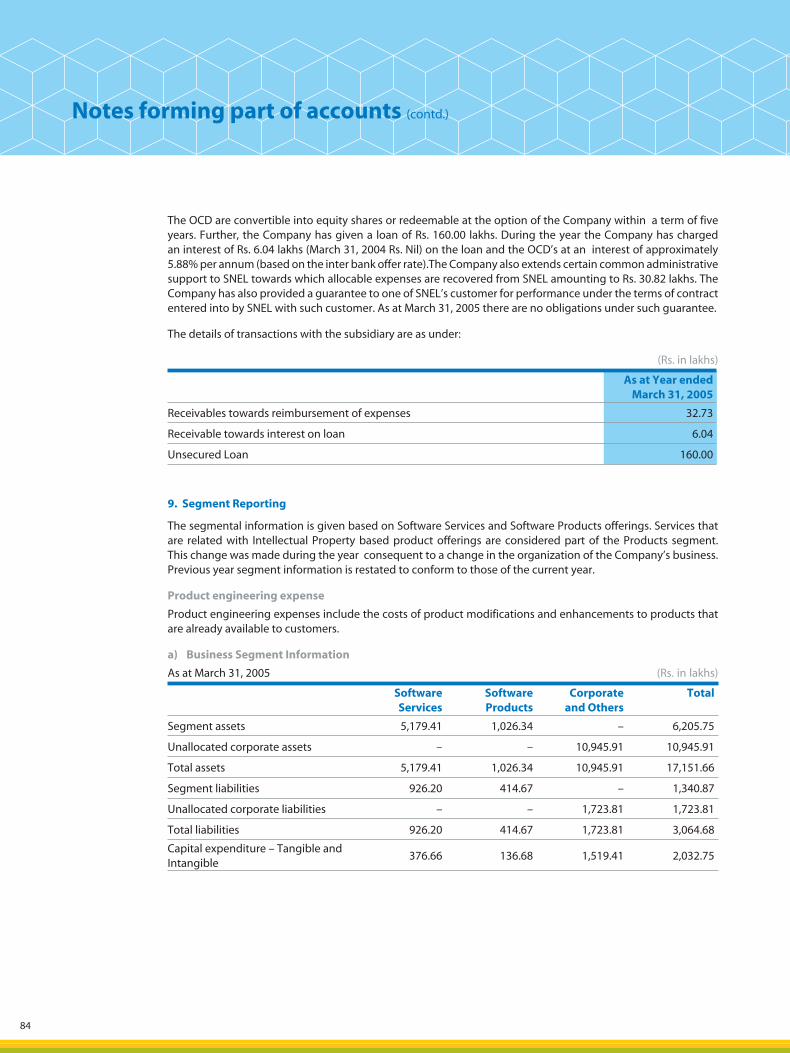
84
The OCD are convertible into equity shares or redeemable at the option of the Company within a term of five years. Further, the Company has given a loan of Rs. 160.00 lakhs. During the year the Company has charged an interest of Rs. 6.04 lakhs (March 31, 2004 Rs. Nil) on the loan and the OCD’s at an interest of approximately 5.88% per annum (based on the inter bank offer rate).The Company also extends certain common administrative support to SNEL towards which allocable expenses are recovered from SNEL amounting to Rs. 30.82 lakhs. The Company has also provided a guarantee to one of SNEL’s customer for performance under the terms of contract entered into by SNEL with such customer. As at March 31, 2005 there are no obligations under such guarantee.
The details of transactions with the subsidiary are as under:
(Rs. in lakhs)
As at Year ended March 31, 2005
Receivables towards reimbursement of expenses 32.73
Receivable towards interest on loan 6.04
Unsecured Loan 160.00
9. Segment Reporting
The segmental information is given based on Software Services and Software Products offerings. Services that are related with Intellectual Property based product offerings are considered part of the Products segment. This change was made during the year consequent to a change in the organization of the Company’s business. Previous year segment information is restated to conform to those of the current year.
Product engineering expense
Product engineering expenses include the costs of product modifications and enhancements to products that are already available to customers.
a) Business Segment Information
As at March 31, 2005 (Rs. in lakhs)
Software Services
Software Products
Corporate and Others
Total
Segment assets 5,179.41 1,026.34 – 6,205.75
Unallocated corporate assets – – 10,945.91 10,945.91
Total assets 5,179.41 1,026.34 10,945.91 17,151.66
Segment liabilities 926.20 414.67 – 1,340.87
Unallocated corporate liabilities – – 1,723.81 1,723.81
Total liabilities 926.20 414.67 1,723.81 3,064.68
Capital expenditure – Tangible and Intangible
376.66 136.68 1,519.41 2,032.75
Notes forming part of accounts (contd.)
05050449_003_138.indd 8405050449_003_138.indd 84 5/19/05 4:27:50 PM5/19/05 4:27:50 PM
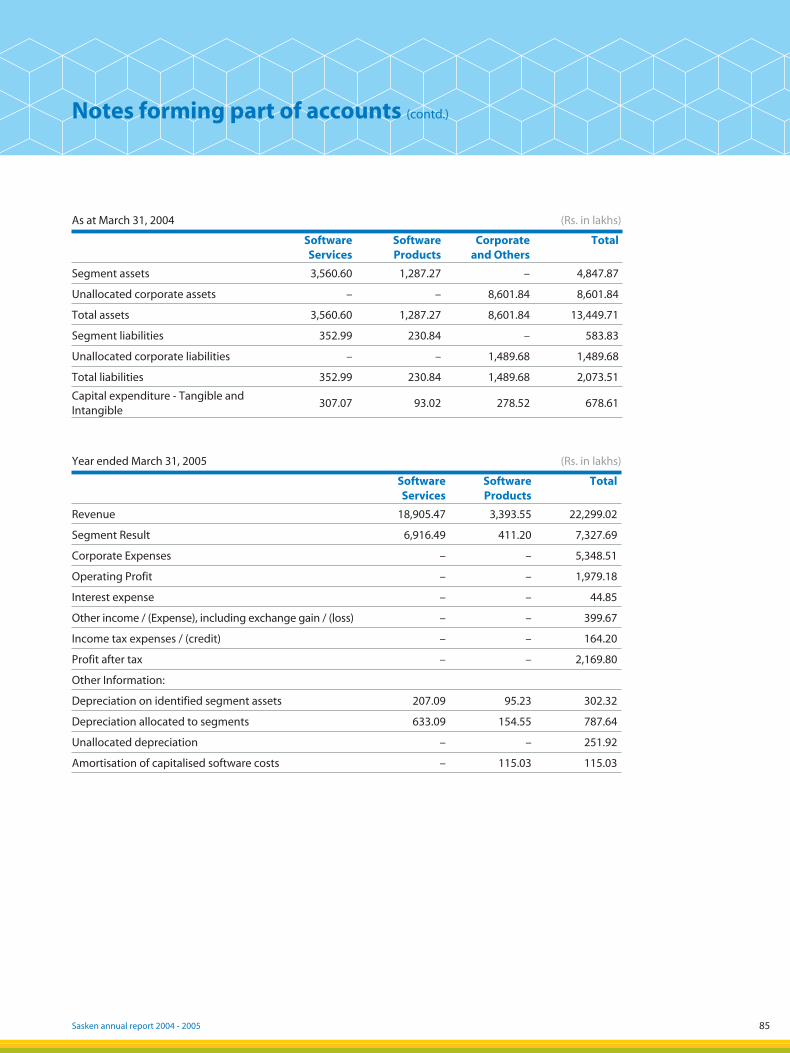
Sasken annual report 2004 - 2005 85
As at March 31, 2004 (Rs. in lakhs)
Software Services
Software Products
Corporate and Others
Total
Segment assets 3,560.60 1,287.27 – 4,847.87
Unallocated corporate assets – – 8,601.84 8,601.84
Total assets 3,560.60 1,287.27 8,601.84 13,449.71
Segment liabilities 352.99 230.84 – 583.83
Unallocated corporate liabilities – – 1,489.68 1,489.68
Total liabilities 352.99 230.84 1,489.68 2,073.51
Capital expenditure - Tangible and Intangible
307.07 93.02 278.52 678.61
Year ended March 31, 2005 (Rs. in lakhs)
Software Services
Software Products
Total
Revenue 18,905.47 3,393.55 22,299.02
Segment Result 6,916.49 411.20 7,327.69
Corporate Expenses – – 5,348.51
Operating Profit – – 1,979.18
Interest expense – – 44.85
Other income / (Expense), including exchange gain / (loss) – – 399.67
Income tax expenses / (credit) – – 164.20
Profit after tax – – 2,169.80
Other Information:
Depreciation on identified segment assets 207.09 95.23 302.32
Depreciation allocated to segments 633.09 154.55 787.64
Unallocated depreciation – – 251.92
Amortisation of capitalised software costs – 115.03 115.03
Notes forming part of accounts (contd.)
05050449_003_138.indd 8505050449_003_138.indd 85 5/19/05 4:27:50 PM5/19/05 4:27:50 PM
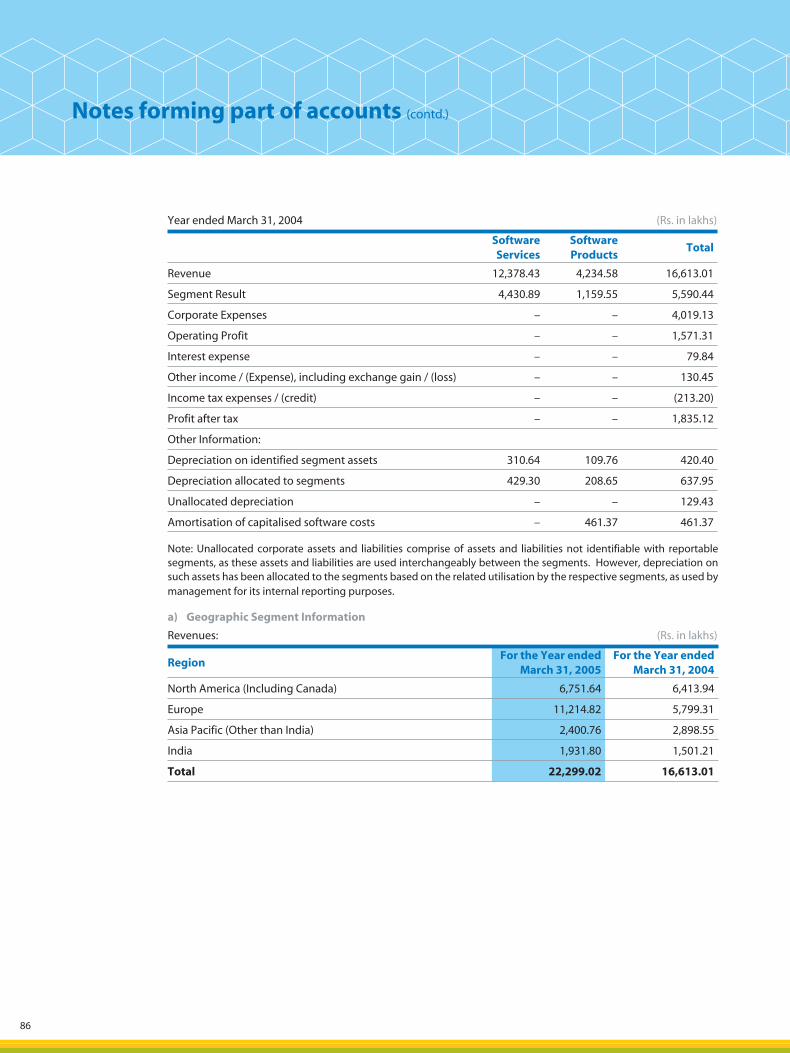
86
Year ended March 31, 2004 (Rs. in lakhs)
Software Services
Software Products
Total
Revenue 12,378.43 4,234.58 16,613.01
Segment Result 4,430.89 1,159.55 5,590.44
Corporate Expenses – – 4,019.13
Operating Profit – – 1,571.31
Interest expense – – 79.84
Other income / (Expense), including exchange gain / (loss) – – 130.45
Income tax expenses / (credit) – – (213.20)
Profit after tax – – 1,835.12
Other Information:
Depreciation on identified segment assets 310.64 109.76 420.40
Depreciation allocated to segments 429.30 208.65 637.95
Unallocated depreciation – – 129.43
Amortisation of capitalised software costs – 461.37 461.37
Note: Unallocated corporate assets and liabilities comprise of assets and liabilities not identifiable with reportable segments, as these assets and liabilities are used interchangeably between the segments. However, depreciation on such assets has been allocated to the segments based on the related utilisation by the respective segments, as used by management for its internal reporting purposes.
a) Geographic Segment Information
Revenues: (Rs. in lakhs)
RegionFor the Year ended
March 31, 2005For the Year ended
March 31, 2004
North America (Including Canada) 6,751.64 6,413.94
Europe 11,214.82 5,799.31
Asia Pacific (Other than India) 2,400.76 2,898.55
India 1,931.80 1,501.21
Total 22,299.02 16,613.01
Notes forming part of accounts (contd.)
05050449_003_138.indd 8605050449_003_138.indd 86 5/19/05 4:27:51 PM5/19/05 4:27:51 PM
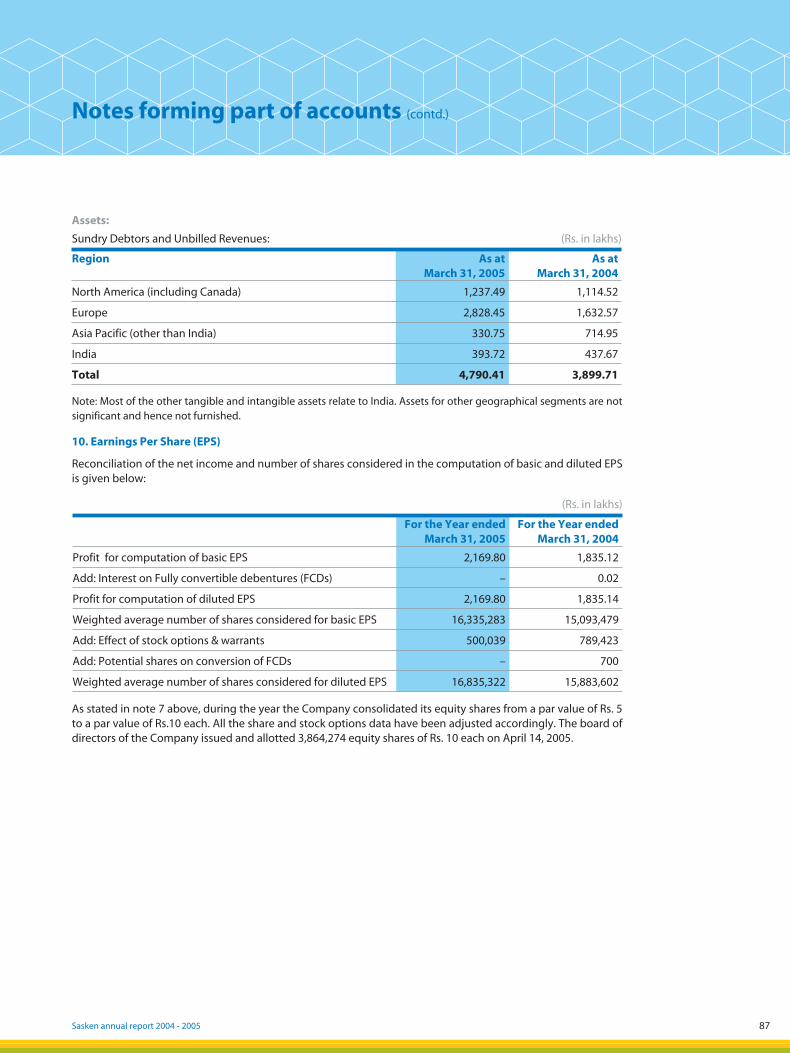
Sasken annual report 2004 - 2005 87
Assets:
Sundry Debtors and Unbilled Revenues: (Rs. in lakhs)
Region As at March 31, 2005
As at March 31, 2004
North America (including Canada) 1,237.49 1,114.52
Europe 2,828.45 1,632.57
Asia Pacific (other than India) 330.75 714.95
India 393.72 437.67
Total 4,790.41 3,899.71
Note: Most of the other tangible and intangible assets relate to India. Assets for other geographical segments are not significant and hence not furnished.
10. Earnings Per Share (EPS)
Reconciliation of the net income and number of shares considered in the computation of basic and diluted EPS is given below:
(Rs. in lakhs)
For the Year endedMarch 31, 2005
For the Year endedMarch 31, 2004
Profit for computation of basic EPS 2,169.80 1,835.12
Add: Interest on Fully convertible debentures (FCDs) – 0.02
Profit for computation of diluted EPS 2,169.80 1,835.14
Weighted average number of shares considered for basic EPS 16,335,283 15,093,479
Add: Effect of stock options & warrants 500,039 789,423
Add: Potential shares on conversion of FCDs – 700
Weighted average number of shares considered for diluted EPS 16,835,322 15,883,602
As stated in note 7 above, during the year the Company consolidated its equity shares from a par value of Rs. 5 to a par value of Rs.10 each. All the share and stock options data have been adjusted accordingly. The board of directors of the Company issued and allotted 3,864,274 equity shares of Rs. 10 each on April 14, 2005.
Notes forming part of accounts (contd.)
05050449_003_138.indd 8705050449_003_138.indd 87 5/19/05 4:27:51 PM5/19/05 4:27:51 PM
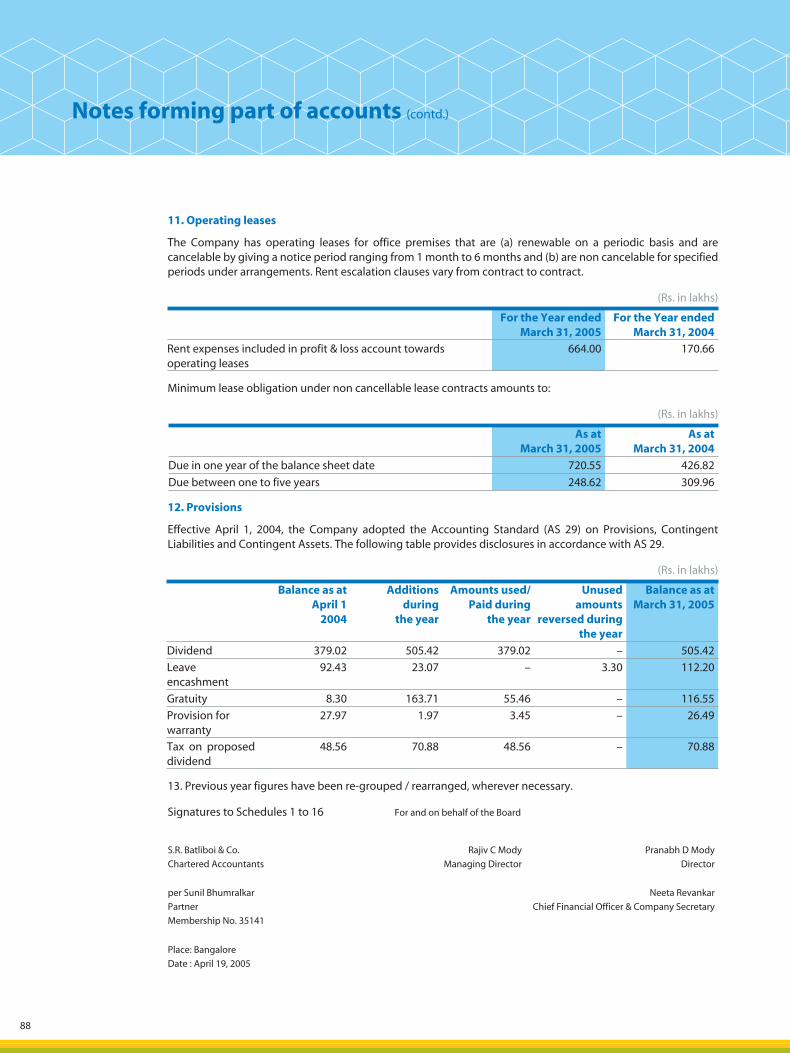
88
11. Operating leases
The Company has operating leases for office premises that are (a) renewable on a periodic basis and are cancelable by giving a notice period ranging from 1 month to 6 months and (b) are non cancelable for specified periods under arrangements. Rent escalation clauses vary from contract to contract.
(Rs. in lakhs)
For the Year endedMarch 31, 2005
For the Year endedMarch 31, 2004
Rent expenses included in profit & loss account towards operating leases
664.00 170.66
Minimum lease obligation under non cancellable lease contracts amounts to:
(Rs. in lakhs)
As atMarch 31, 2005
As atMarch 31, 2004
Due in one year of the balance sheet date 720.55 426.82
Due between one to five years 248.62 309.96
12. Provisions
Effective April 1, 2004, the Company adopted the Accounting Standard (AS 29) on Provisions, Contingent Liabilities and Contingent Assets. The following table provides disclosures in accordance with AS 29.
(Rs. in lakhs)
Balance as at April 1
2004
Additions during
the year
Amounts used/Paid during
the year
Unused amounts
reversed during the year
Balance as at March 31, 2005
Dividend 379.02 505.42 379.02 – 505.42
Leave encashment
92.43 23.07 – 3.30 112.20
Gratuity 8.30 163.71 55.46 – 116.55
Provision for warranty
27.97 1.97 3.45 – 26.49
Tax on proposed dividend
48.56 70.88 48.56 – 70.88
13. Previous year figures have been re-grouped / rearranged, wherever necessary.
Signatures to Schedules 1 to 16 For and on behalf of the Board
S.R. Batliboi & Co.
Chartered Accountants
Rajiv C Mody
Managing Director
Pranabh D Mody
Director
per Sunil Bhumralkar
Partner
Membership No. 35141
Neeta Revankar
Chief Financial Officer & Company Secretary
Place: Bangalore
Date : April 19, 2005
Notes forming part of accounts (contd.)
05050449_003_138.indd 8805050449_003_138.indd 88 5/19/05 4:27:51 PM5/19/05 4:27:51 PM
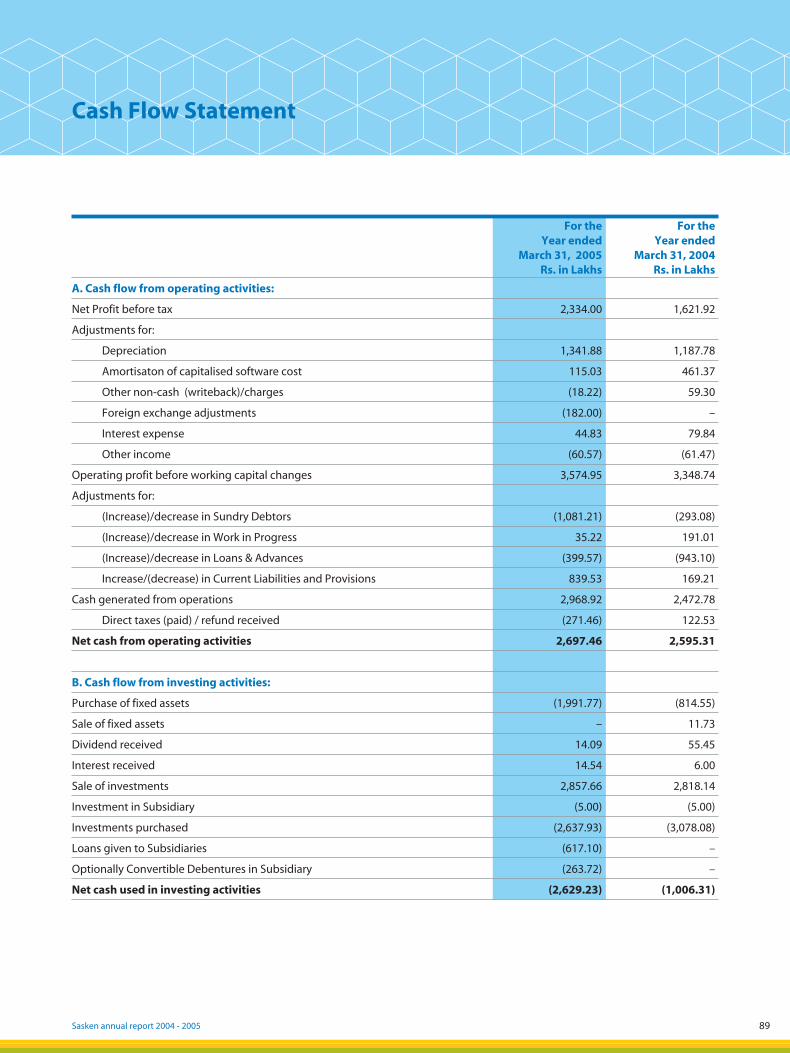
Sasken annual report 2004 - 2005 89
Cash Flow Statement
For the Year ended
March 31, 2005 Rs. in Lakhs
For the Year ended
March 31, 2004 Rs. in Lakhs
A. Cash flow from operating activities:
Net Profit before tax 2,334.00 1,621.92
Adjustments for:
Depreciation 1,341.88 1,187.78
Amortisaton of capitalised software cost 115.03 461.37
Other non-cash (writeback)/charges (18.22) 59.30
Foreign exchange adjustments (182.00) –
Interest expense 44.83 79.84
Other income (60.57) (61.47)
Operating profit before working capital changes 3,574.95 3,348.74
Adjustments for:
(Increase)/decrease in Sundry Debtors (1,081.21) (293.08)
(Increase)/decrease in Work in Progress 35.22 191.01
(Increase)/decrease in Loans & Advances (399.57) (943.10)
Increase/(decrease) in Current Liabilities and Provisions 839.53 169.21
Cash generated from operations 2,968.92 2,472.78
Direct taxes (paid) / refund received (271.46) 122.53
Net cash from operating activities 2,697.46 2,595.31
B. Cash flow from investing activities:
Purchase of fixed assets (1,991.77) (814.55)
Sale of fixed assets – 11.73
Dividend received 14.09 55.45
Interest received 14.54 6.00
Sale of investments 2,857.66 2,818.14
Investment in Subsidiary (5.00) (5.00)
Investments purchased (2,637.93) (3,078.08)
Loans given to Subsidiaries (617.10) –
Optionally Convertible Debentures in Subsidiary (263.72) –
Net cash used in investing activities (2,629.23) (1,006.31)
05050449_003_138.indd 8905050449_003_138.indd 89 5/19/05 4:27:52 PM5/19/05 4:27:52 PM
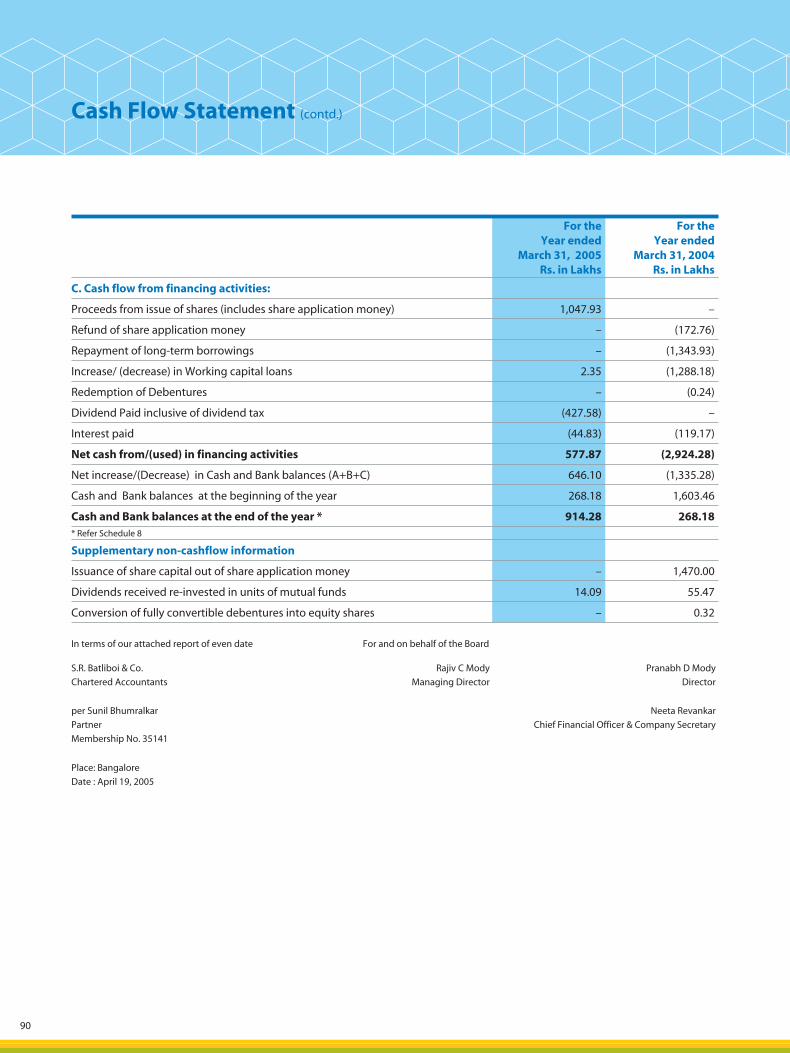
90
For the Year ended
March 31, 2005 Rs. in Lakhs
For the Year ended
March 31, 2004 Rs. in Lakhs
C. Cash flow from financing activities:
Proceeds from issue of shares (includes share application money) 1,047.93 –
Refund of share application money – (172.76)
Repayment of long-term borrowings – (1,343.93)
Increase/ (decrease) in Working capital loans 2.35 (1,288.18)
Redemption of Debentures – (0.24)
Dividend Paid inclusive of dividend tax (427.58) –
Interest paid (44.83) (119.17)
Net cash from/(used) in financing activities 577.87 (2,924.28)
Net increase/(Decrease) in Cash and Bank balances (A+B+C) 646.10 (1,335.28)
Cash and Bank balances at the beginning of the year 268.18 1,603.46
Cash and Bank balances at the end of the year * 914.28 268.18 * Refer Schedule 8
Supplementary non-cashflow information
Issuance of share capital out of share application money – 1,470.00
Dividends received re-invested in units of mutual funds 14.09 55.47
Conversion of fully convertible debentures into equity shares – 0.32
Cash Flow Statement (contd.)
In terms of our attached report of even date For and on behalf of the Board
S.R. Batliboi & Co.
Chartered Accountants
Rajiv C Mody
Managing Director
Pranabh D Mody
Director
per Sunil Bhumralkar
Partner
Membership No. 35141
Neeta Revankar
Chief Financial Officer & Company Secretary
Place: Bangalore
Date : April 19, 2005
05050449_003_138.indd 9005050449_003_138.indd 90 5/19/05 4:27:52 PM5/19/05 4:27:52 PM
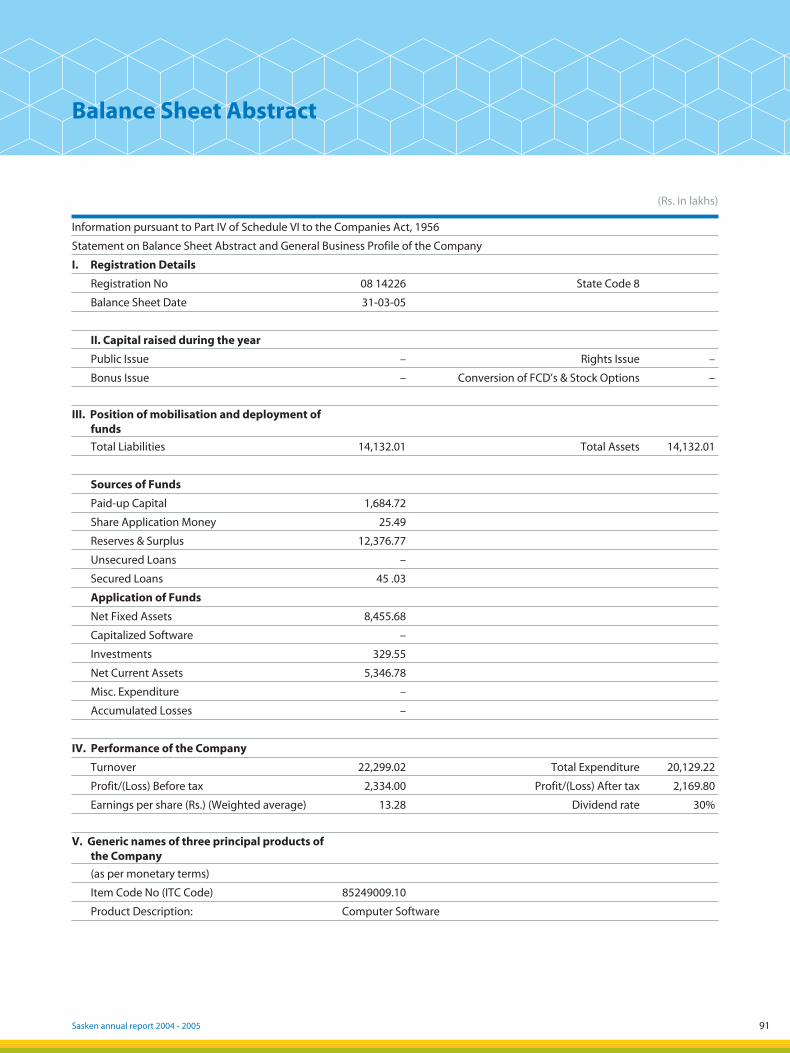
Sasken annual report 2004 - 2005 91
Information pursuant to Part IV of Schedule VI to the Companies Act, 1956
Statement on Balance Sheet Abstract and General Business Profile of the Company
I. Registration Details
Registration No 08 14226 State Code 8
Balance Sheet Date 31-03-05
II. Capital raised during the year
Public Issue – Rights Issue –
Bonus Issue – Conversion of FCD’s & Stock Options –
III. Position of mobilisation and deployment of funds
Total Liabilities 14,132.01 Total Assets 14,132.01
Sources of Funds
Paid-up Capital 1,684.72
Share Application Money 25.49
Reserves & Surplus 12,376.77
Unsecured Loans –
Secured Loans 45 .03
Application of Funds
Net Fixed Assets 8,455.68
Capitalized Software –
Investments 329.55
Net Current Assets 5,346.78
Misc. Expenditure –
Accumulated Losses –
IV. Performance of the Company
Turnover 22,299.02 Total Expenditure 20,129.22
Profit/(Loss) Before tax 2,334.00 Profit/(Loss) After tax 2,169.80
Earnings per share (Rs.) (Weighted average) 13.28 Dividend rate 30%
V. Generic names of three principal products of the Company
(as per monetary terms)
Item Code No (ITC Code) 85249009.10
Product Description: Computer Software
Balance Sheet Abstract
(Rs. in lakhs)
05050449_003_138.indd 9105050449_003_138.indd 91 5/19/05 4:27:52 PM5/19/05 4:27:52 PM
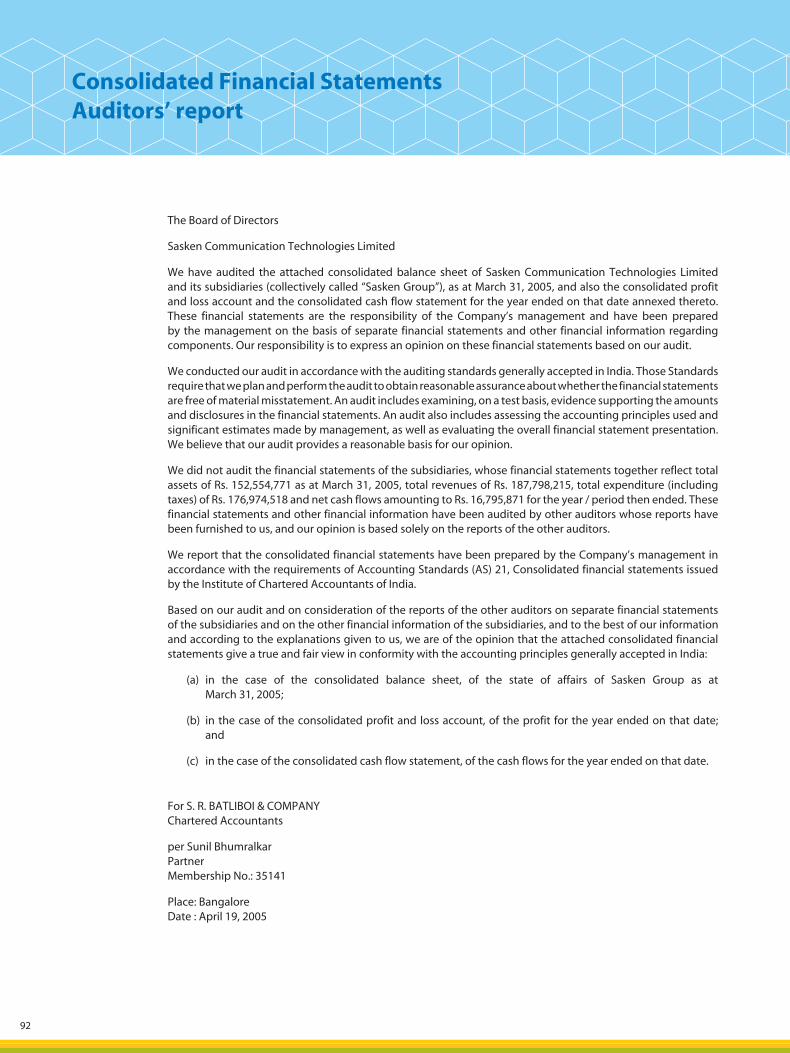
92
Consolidated Financial StatementsAuditors’ report
The Board of Directors
Sasken Communication Technologies Limited
We have audited the attached consolidated balance sheet of Sasken Communication Technologies Limited and its subsidiaries (collectively called “Sasken Group”), as at March 31, 2005, and also the consolidated profit and loss account and the consolidated cash flow statement for the year ended on that date annexed thereto. These financial statements are the responsibility of the Company’s management and have been prepared by the management on the basis of separate financial statements and other financial information regarding components. Our responsibility is to express an opinion on these financial statements based on our audit.
We conducted our audit in accordance with the auditing standards generally accepted in India. Those Standards require that we plan and perform the audit to obtain reasonable assurance about whether the financial statements are free of material misstatement. An audit includes examining, on a test basis, evidence supporting the amounts and disclosures in the financial statements. An audit also includes assessing the accounting principles used and significant estimates made by management, as well as evaluating the overall financial statement presentation. We believe that our audit provides a reasonable basis for our opinion.
We did not audit the financial statements of the subsidiaries, whose financial statements together reflect total assets of Rs. 152,554,771 as at March 31, 2005, total revenues of Rs. 187,798,215, total expenditure (including taxes) of Rs. 176,974,518 and net cash flows amounting to Rs. 16,795,871 for the year / period then ended. These financial statements and other financial information have been audited by other auditors whose reports have been furnished to us, and our opinion is based solely on the reports of the other auditors.
We report that the consolidated financial statements have been prepared by the Company’s management in accordance with the requirements of Accounting Standards (AS) 21, Consolidated financial statements issued by the Institute of Chartered Accountants of India.
Based on our audit and on consideration of the reports of the other auditors on separate financial statements of the subsidiaries and on the other financial information of the subsidiaries, and to the best of our information and according to the explanations given to us, we are of the opinion that the attached consolidated financial statements give a true and fair view in con formity with the accounting principles generally accepted in India:
(a) in the case of the consolidated balance sheet, of the state of affairs of Sasken Group as at March 31, 2005;
(b) in the case of the consolidated profit and loss account, of the profit for the year ended on that date; and
(c) in the case of the consolidated cash flow statement, of the cash flows for the year ended on that date.
For S. R. BATLIBOI & COMPANY Chartered Accountants
per Sunil Bhumralkar Partner Membership No.: 35141
Place: BangaloreDate : April 19, 2005
05050449_003_138.indd 9205050449_003_138.indd 92 5/19/05 4:27:53 PM5/19/05 4:27:53 PM
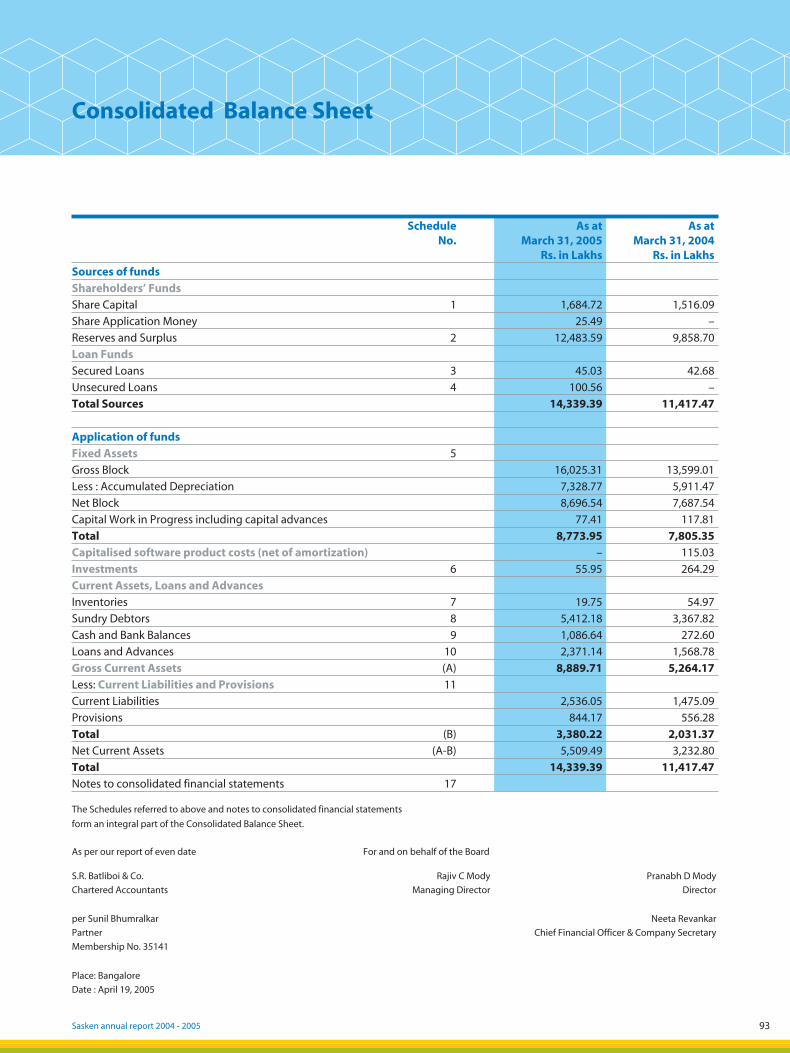
Sasken annual report 2004 - 2005 93
Consolidated Balance Sheet
ScheduleNo.
As at March 31, 2005
Rs. in Lakhs
As at March 31, 2004
Rs. in Lakhs
Sources of funds
Shareholders’ Funds
Share Capital 1 1,684.72 1,516.09
Share Application Money 25.49 –
Reserves and Surplus 2 12,483.59 9,858.70
Loan Funds
Secured Loans 3 45.03 42.68
Unsecured Loans 4 100.56 –
Total Sources 14,339.39 11,417.47
Application of funds
Fixed Assets 5
Gross Block 16,025.31 13,599.01
Less : Accumulated Depreciation 7,328.77 5,911.47
Net Block 8,696.54 7,687.54
Capital Work in Progress including capital advances 77.41 117.81
Total 8,773.95 7,805.35
Capitalised software product costs (net of amortization) – 115.03
Investments 6 55.95 264.29
Current Assets, Loans and Advances
Inventories 7 19.75 54.97
Sundry Debtors 8 5,412.18 3,367.82
Cash and Bank Balances 9 1,086.64 272.60
Loans and Advances 10 2,371.14 1,568.78
Gross Current Assets (A) 8,889.71 5,264.17
Less: Current Liabilities and Provisions 11
Current Liabilities 2,536.05 1,475.09
Provisions 844.17 556.28
Total (B) 3,380.22 2,031.37
Net Current Assets (A-B) 5,509.49 3,232.80
Total 14,339.39 11,417.47
Notes to consolidated financial statements 17
The Schedules referred to above and notes to consolidated financial statements
form an integral part of the Consolidated Balance Sheet.
As per our report of even date For and on behalf of the Board
S.R. Batliboi & Co.
Chartered Accountants
Rajiv C Mody
Managing Director
Pranabh D Mody
Director
per Sunil Bhumralkar
Partner
Membership No. 35141
Neeta Revankar
Chief Financial Officer & Company Secretary
Place: Bangalore
Date : April 19, 2005
05050449_003_138.indd 9305050449_003_138.indd 93 5/19/05 4:27:53 PM5/19/05 4:27:53 PM
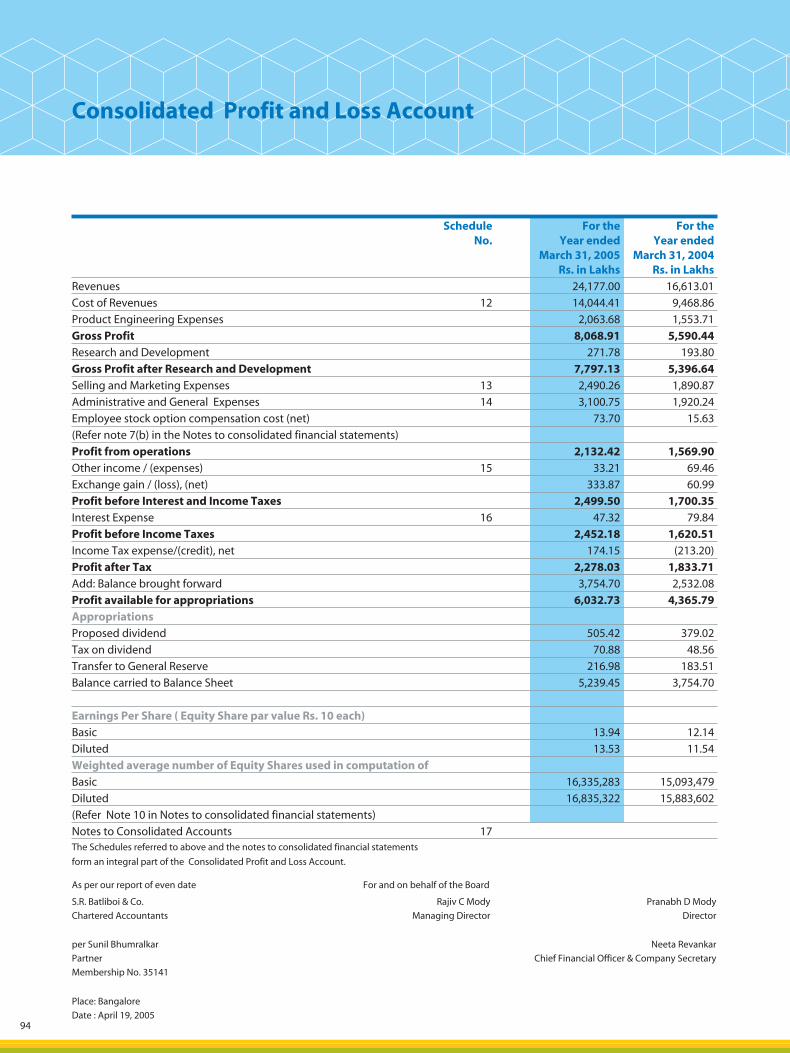
94
Consolidated Profit and Loss Account
Schedule No.
For the Year ended
March 31, 2005 Rs. in Lakhs
For the Year ended
March 31, 2004 Rs. in Lakhs
Revenues 24,177.00 16,613.01
Cost of Revenues 12 14,044.41 9,468.86
Product Engineering Expenses 2,063.68 1,553.71
Gross Profit 8,068.91 5,590.44
Research and Development 271.78 193.80
Gross Profit after Research and Development 7,797.13 5,396.64
Selling and Marketing Expenses 13 2,490.26 1,890.87
Administrative and General Expenses 14 3,100.75 1,920.24
Employee stock option compensation cost (net) 73.70 15.63
(Refer note 7(b) in the Notes to consolidated financial statements)
Profit from operations 2,132.42 1,569.90
Other income / (expenses) 15 33.21 69.46
Exchange gain / (loss), (net) 333.87 60.99
Profit before Interest and Income Taxes 2,499.50 1,700.35
Interest Expense 16 47.32 79.84
Profit before Income Taxes 2,452.18 1,620.51
Income Tax expense/(credit), net 174.15 (213.20)
Profit after Tax 2,278.03 1,833.71
Add: Balance brought forward 3,754.70 2,532.08
Profit available for appropriations 6,032.73 4,365.79
Appropriations
Proposed dividend 505.42 379.02
Tax on dividend 70.88 48.56
Transfer to General Reserve 216.98 183.51
Balance carried to Balance Sheet 5,239.45 3,754.70
Earnings Per Share ( Equity Share par value Rs. 10 each)
Basic 13.94 12.14
Diluted 13.53 11.54
Weighted average number of Equity Shares used in computation of
Basic 16,335,283 15,093,479
Diluted 16,835,322 15,883,602
(Refer Note 10 in Notes to consolidated financial statements)
Notes to Consolidated Accounts 17The Schedules referred to above and the notes to consolidated financial statements
form an integral part of the Consolidated Profit and Loss Account.
As per our report of even date For and on behalf of the Board
S.R. Batliboi & Co.
Chartered Accountants
Rajiv C Mody
Managing Director
Pranabh D Mody
Director
per Sunil Bhumralkar
Partner
Membership No. 35141
Neeta Revankar
Chief Financial Officer & Company Secretary
Place: Bangalore
Date : April 19, 2005
05050449_003_138.indd 9405050449_003_138.indd 94 5/19/05 4:27:54 PM5/19/05 4:27:54 PM
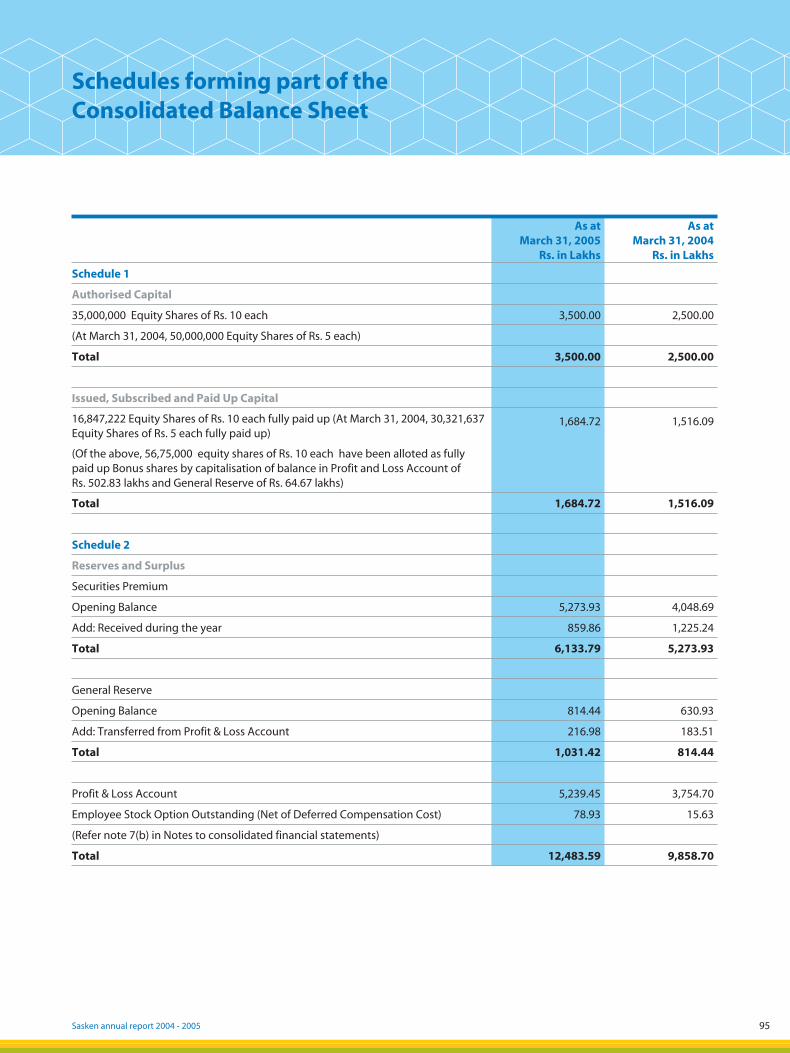
Sasken annual report 2004 - 2005 95
Schedules forming part of the Consolidated Balance Sheet
As at March 31, 2005
Rs. in Lakhs
As at March 31, 2004
Rs. in Lakhs
Schedule 1
Authorised Capital
35,000,000 Equity Shares of Rs. 10 each 3,500.00 2,500.00
(At March 31, 2004, 50,000,000 Equity Shares of Rs. 5 each)
Total 3,500.00 2,500.00
Issued, Subscribed and Paid Up Capital
16,847,222 Equity Shares of Rs. 10 each fully paid up (At March 31, 2004, 30,321,637 Equity Shares of Rs. 5 each fully paid up)
1,684.72 1,516.09
(Of the above, 56,75,000 equity shares of Rs. 10 each have been alloted as fully paid up Bonus shares by capitalisation of balance in Profit and Loss Account of Rs. 502.83 lakhs and General Reserve of Rs. 64.67 lakhs)
Total 1,684.72 1,516.09
Schedule 2
Reserves and Surplus
Securities Premium
Opening Balance 5,273.93 4,048.69
Add: Received during the year 859.86 1,225.24
Total 6,133.79 5,273.93
General Reserve
Opening Balance 814.44 630.93
Add: Transferred from Profit & Loss Account 216.98 183.51
Total 1,031.42 814.44
Profit & Loss Account 5,239.45 3,754.70
Employee Stock Option Outstanding (Net of Deferred Compensation Cost) 78.93 15.63
(Refer note 7(b) in Notes to consolidated financial statements)
Total 12,483.59 9,858.70
05050449_003_138.indd 9505050449_003_138.indd 95 5/19/05 4:27:54 PM5/19/05 4:27:54 PM
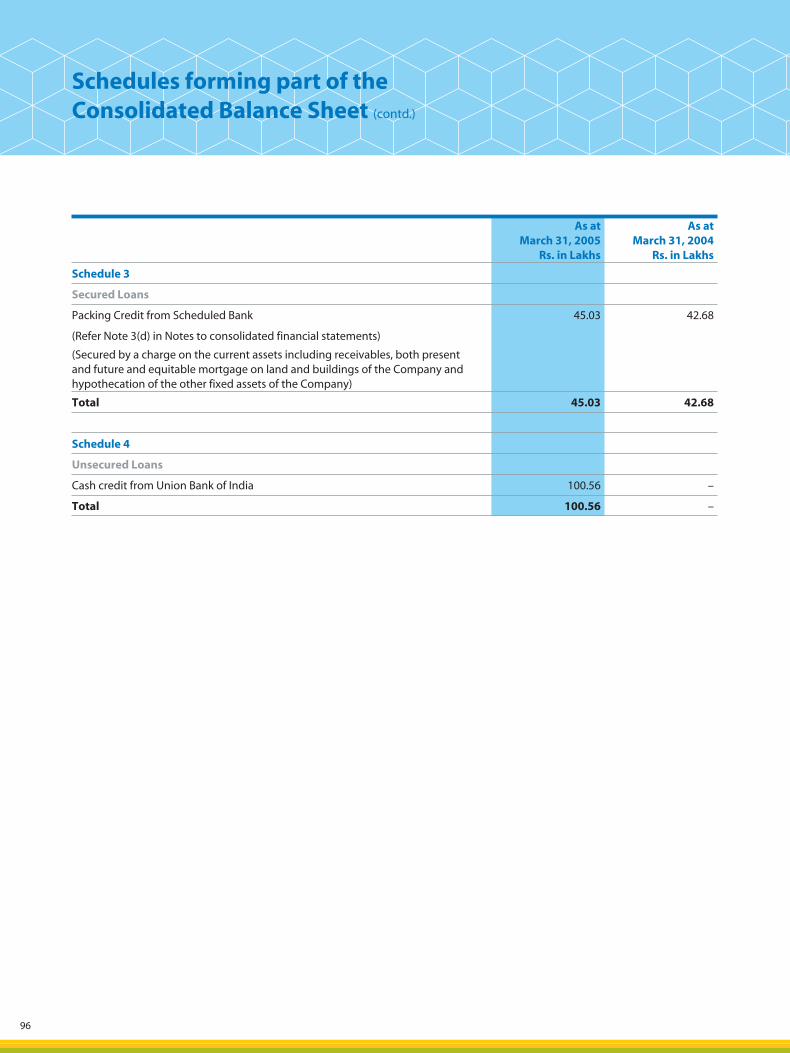
96
Schedules forming part of theConsolidated Balance Sheet (contd.)
As at March 31, 2005
Rs. in Lakhs
As at March 31, 2004
Rs. in Lakhs
Schedule 3
Secured Loans
Packing Credit from Scheduled Bank 45.03 42.68
(Refer Note 3(d) in Notes to consolidated financial statements)
(Secured by a charge on the current assets including receivables, both present and future and equitable mortgage on land and buildings of the Company and hypothecation of the other fixed assets of the Company)
Total 45.03 42.68
Schedule 4
Unsecured Loans
Cash credit from Union Bank of India 100.56 –
Total 100.56 –
05050449_003_138.indd 9605050449_003_138.indd 96 5/19/05 4:27:54 PM5/19/05 4:27:54 PM

Sasken annual report 2004 - 2005 97
Sch
edu
le 5
- Fi
xed
Ass
ets
Gro
ss B
lock
Dep
reci
atio
n B
lock
Net
Blo
ck
Par
ticu
lars
As
at A
pri
l 12
00
4
Ad
dit
ion
s d
uri
ng
t
he
year
Del
etio
ns
du
rin
g
the
year
As
atM
arch
31
2
00
5
As
at
Ap
ril 1
20
04
For
the
year
Ad
just
men
ts
du
rin
g
the
year
As
at
Mar
ch 3
1
20
05
As
at
Mar
ch 3
1
20
05
As
at
M
arch
3
1 2
00
4
Lan
d 2
,287
.67
–
–
2,2
87.6
7 –
–
–
–
2
,287
.67
2,2
87.6
7
Bu
ildin
g 3
,310
.98
–
–
3,3
10.9
8 4
68.6
5 1
57.3
4 –
6
25.9
9 2
,684
.99
2,8
42.3
3
Leas
e H
old
Imp
rove
men
ts –
1
94.5
0 –
1
94.5
0 –
2
6.00
–
2
6.00
1
68.5
0 –
Plan
t &
Mac
hin
ery
–
79.
74
–
79.
74
–
10.
45
–
10.
45
69.
29
–
Co
mp
ute
rs 2
,451
.57
931
.79
–
3,3
83.3
6 1
,964
.58
392
.49
–
2,3
57.0
7 1
,026
.29
486
.99
Elec
tric
al F
itti
ng
s 9
6.37
8
2.22
–
1
78.5
9 7
5.31
2
5.36
–
1
00.6
7 7
7.92
2
1.06
Furn
itu
re a
nd
Fit
tin
gs
1,2
47.7
2 4
64.0
8 –
1
,711
.80
337
.78
189
.54
–
527
.32
1,1
84.4
8 9
09.9
4
Off
ice
Equ
ipm
ents
2,6
67.3
3 3
22.4
9 1
.84
2,9
87.9
8 1
,552
.08
480
.41
1.7
0 2
,030
.79
957
.19
1,1
15.2
5
Veh
icle
s –
1
2.71
–
1
2.71
–
1
.31
–
1.3
1 1
1.40
–
Inta
ng
ible
Ass
ets
– C
om
pu
ter S
oft
war
e 1
,537
.37
192
.57
–
1,7
29.9
4 1
,513
.07
111
.50
–
1,6
24.5
7 1
05.3
7 2
4.30
– C
on
trac
t Ri
gh
ts –
1
48.0
4 –
1
48.0
4 –
2
4.60
–
2
4.60
1
23.4
4 –
Tota
l 1
3,5
99
.01
2
,42
8.1
4
1.8
4
16
,02
5.3
1
5,9
11
.47
1
,41
9.0
0
1.7
0
7,3
28
.77
8
,69
6.5
4
7,6
87
.54
Bal
ance
as
at M
arch
31,
20
04 1
3,15
3.61
6
78.6
1 2
33.2
1 1
3,59
9.01
4
,939
.95
1,1
87.7
8 2
16.2
6 5
,911
.47
7,6
87.5
4 –
Schedules forming part of theConsolidated Balance Sheet (contd.)
Rs.
in L
akh
s
05050449_003_138.indd 9705050449_003_138.indd 97 5/19/05 4:27:55 PM5/19/05 4:27:55 PM
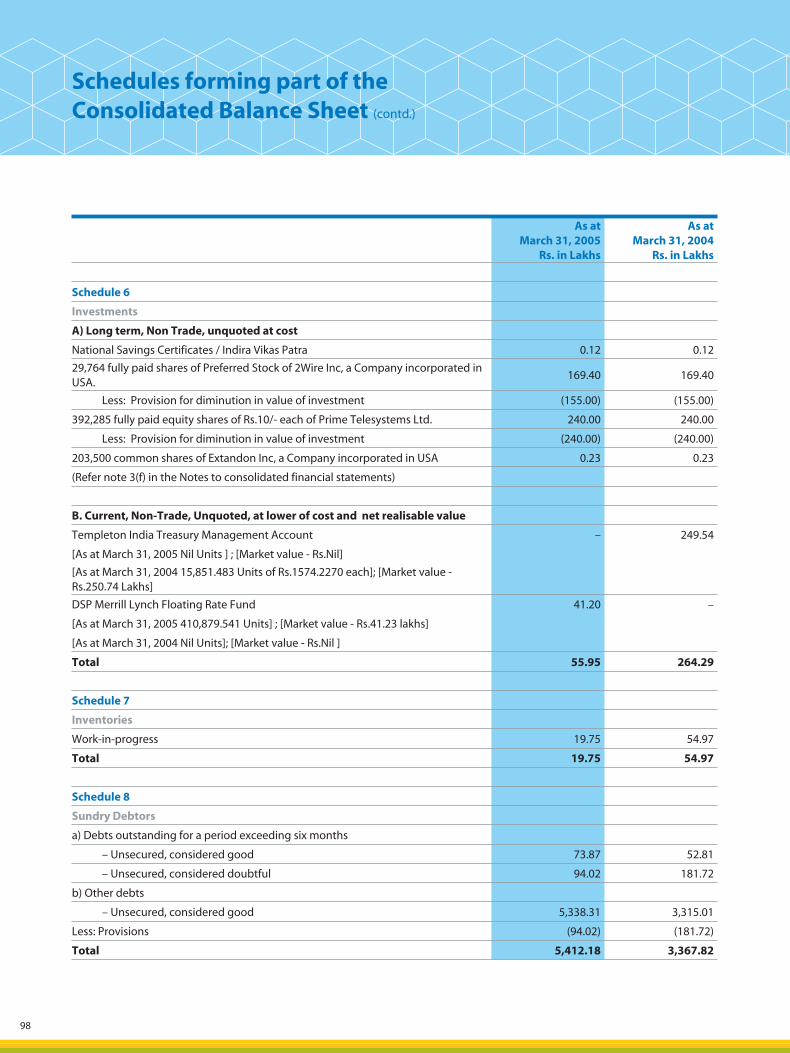
98
As at March 31, 2005
Rs. in Lakhs
As at March 31, 2004
Rs. in Lakhs
Schedule 6
Investments
A) Long term, Non Trade, unquoted at cost
National Savings Certificates / Indira Vikas Patra 0.12 0.12
29,764 fully paid shares of Preferred Stock of 2Wire Inc, a Company incorporated in USA.
169.40 169.40
Less: Provision for diminution in value of investment (155.00) (155.00)
392,285 fully paid equity shares of Rs.10/- each of Prime Telesystems Ltd. 240.00 240.00
Less: Provision for diminution in value of investment (240.00) (240.00)
203,500 common shares of Extandon Inc, a Company incorporated in USA 0.23 0.23
(Refer note 3(f) in the Notes to consolidated financial statements)
B. Current, Non-Trade, Unquoted, at lower of cost and net realisable value
Templeton India Treasury Management Account – 249.54
[As at March 31, 2005 Nil Units ] ; [Market value - Rs.Nil]
[As at March 31, 2004 15,851.483 Units of Rs.1574.2270 each]; [Market value - Rs.250.74 Lakhs]
DSP Merrill Lynch Floating Rate Fund 41.20 –
[As at March 31, 2005 410,879.541 Units] ; [Market value - Rs.41.23 lakhs]
[As at March 31, 2004 Nil Units]; [Market value - Rs.Nil ]
Total 55.95 264.29
Schedule 7
Inventories
Work-in-progress 19.75 54.97
Total 19.75 54.97
Schedule 8
Sundry Debtors
a) Debts outstanding for a period exceeding six months
– Unsecured, considered good 73.87 52.81
– Unsecured, considered doubtful 94.02 181.72
b) Other debts
– Unsecured, considered good 5,338.31 3,315.01
Less: Provisions (94.02) (181.72)
Total 5,412.18 3,367.82
Schedules forming part of theConsolidated Balance Sheet (contd.)
05050449_003_138.indd 9805050449_003_138.indd 98 5/19/05 4:27:55 PM5/19/05 4:27:55 PM
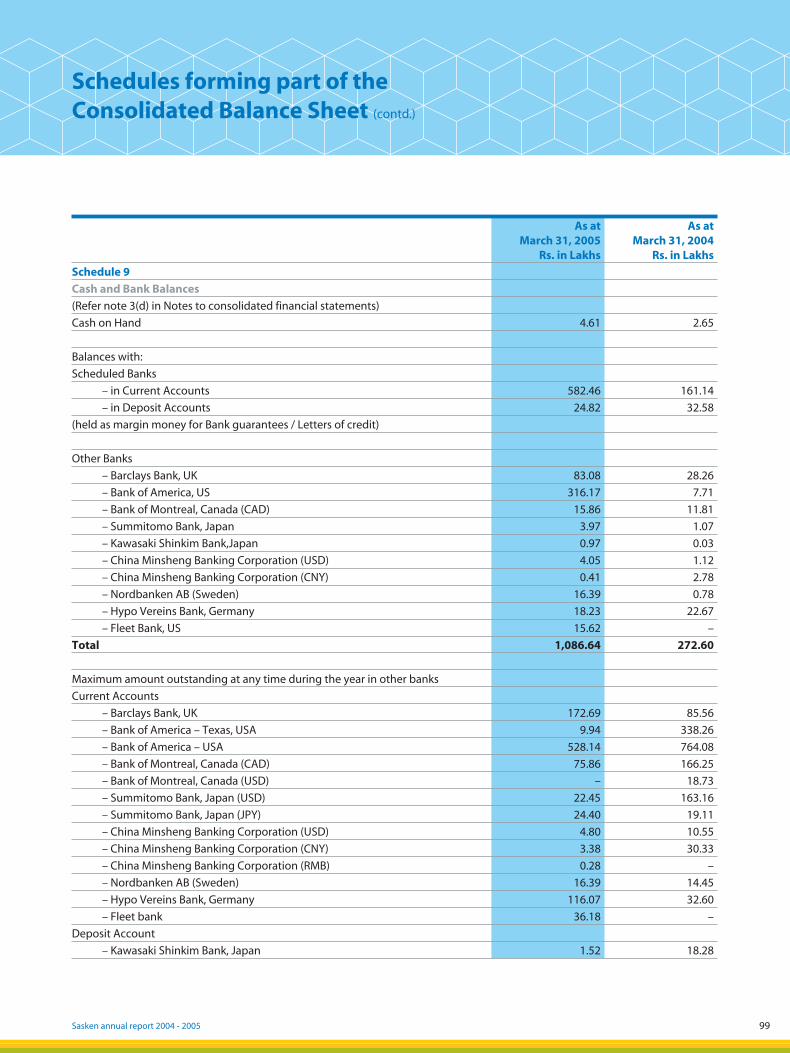
Sasken annual report 2004 - 2005 99
As at March 31, 2005
Rs. in Lakhs
As at March 31, 2004
Rs. in Lakhs
Schedule 9
Cash and Bank Balances
(Refer note 3(d) in Notes to consolidated financial statements)
Cash on Hand 4.61 2.65
Balances with:
Scheduled Banks
– in Current Accounts 582.46 161.14
– in Deposit Accounts 24.82 32.58
(held as margin money for Bank guarantees / Letters of credit)
Other Banks
– Barclays Bank, UK 83.08 28.26
– Bank of America, US 316.17 7.71
– Bank of Montreal, Canada (CAD) 15.86 11.81
– Summitomo Bank, Japan 3.97 1.07
– Kawasaki Shinkim Bank,Japan 0.97 0.03
– China Minsheng Banking Corporation (USD) 4.05 1.12
– China Minsheng Banking Corporation (CNY) 0.41 2.78
– Nordbanken AB (Sweden) 16.39 0.78
– Hypo Vereins Bank, Germany 18.23 22.67
– Fleet Bank, US 15.62 –
Total 1,086.64 272.60
Maximum amount outstanding at any time during the year in other banks
Current Accounts
– Barclays Bank, UK 172.69 85.56
– Bank of America – Texas, USA 9.94 338.26
– Bank of America – USA 528.14 764.08
– Bank of Montreal, Canada (CAD) 75.86 166.25
– Bank of Montreal, Canada (USD) – 18.73
– Summitomo Bank, Japan (USD) 22.45 163.16
– Summitomo Bank, Japan (JPY) 24.40 19.11
– China Minsheng Banking Corporation (USD) 4.80 10.55
– China Minsheng Banking Corporation (CNY) 3.38 30.33
– China Minsheng Banking Corporation (RMB) 0.28 –
– Nordbanken AB (Sweden) 16.39 14.45
– Hypo Vereins Bank, Germany 116.07 32.60
– Fleet bank 36.18 –
Deposit Account
– Kawasaki Shinkim Bank, Japan 1.52 18.28
Schedules forming part of theConsolidated Balance Sheet (contd.)
7
05050449_003_138.indd 9905050449_003_138.indd 99 5/19/05 10:44:34 PM5/19/05 10:44:34 PM
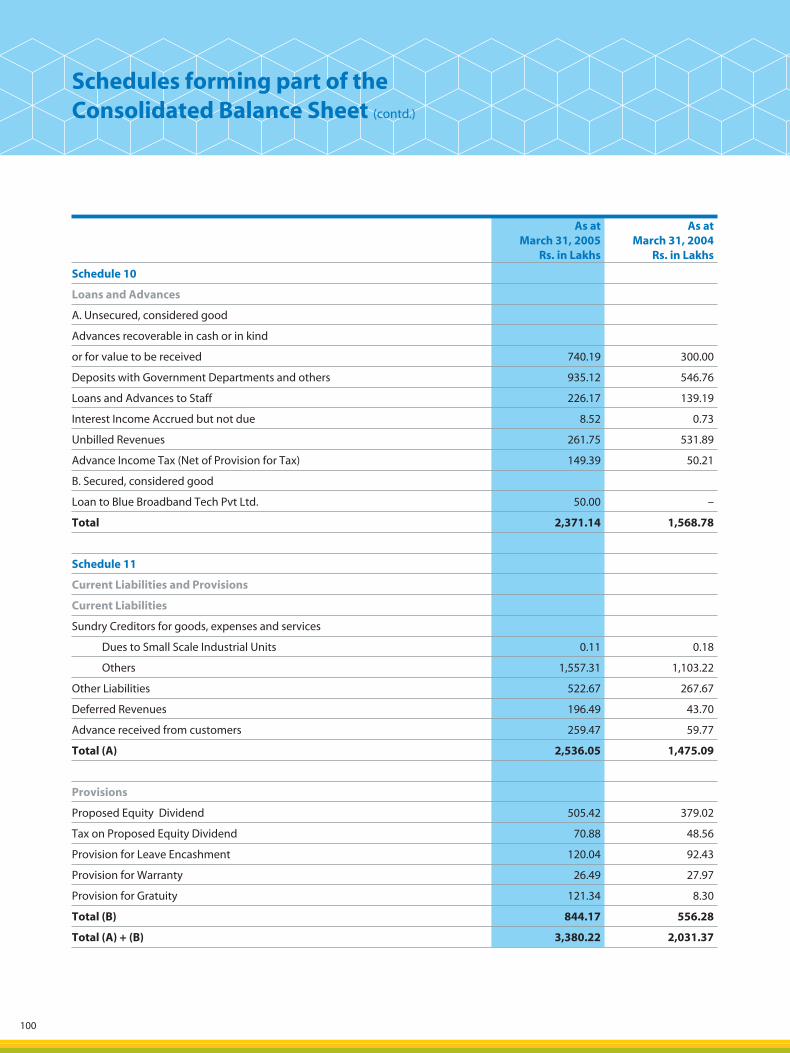
100
As at March 31, 2005
Rs. in Lakhs
As at March 31, 2004
Rs. in Lakhs
Schedule 10
Loans and Advances
A. Unsecured, considered good
Advances recoverable in cash or in kind
or for value to be received 740.19 300.00
Deposits with Government Departments and others 935.12 546.76
Loans and Advances to Staff 226.17 139.19
Interest Income Accrued but not due 8.52 0.73
Unbilled Revenues 261.75 531.89
Advance Income Tax (Net of Provision for Tax) 149.39 50.21
B. Secured, considered good
Loan to Blue Broadband Tech Pvt Ltd. 50.00 –
Total 2,371.14 1,568.78
Schedule 11
Current Liabilities and Provisions
Current Liabilities
Sundry Creditors for goods, expenses and services
Dues to Small Scale Industrial Units 0.11 0.18
Others 1,557.31 1,103.22
Other Liabilities 522.67 267.67
Deferred Revenues 196.49 43.70
Advance received from customers 259.47 59.77
Total (A) 2,536.05 1,475.09
Provisions
Proposed Equity Dividend 505.42 379.02
Tax on Proposed Equity Dividend 70.88 48.56
Provision for Leave Encashment 120.04 92.43
Provision for Warranty 26.49 27.97
Provision for Gratuity 121.34 8.30
Total (B) 844.17 556.28
Total (A) + (B) 3,380.22 2,031.37
Schedules forming part of theConsolidated Balance Sheet (contd.)
05050449_003_138.indd 10005050449_003_138.indd 100 5/19/05 10:44:35 PM5/19/05 10:44:35 PM
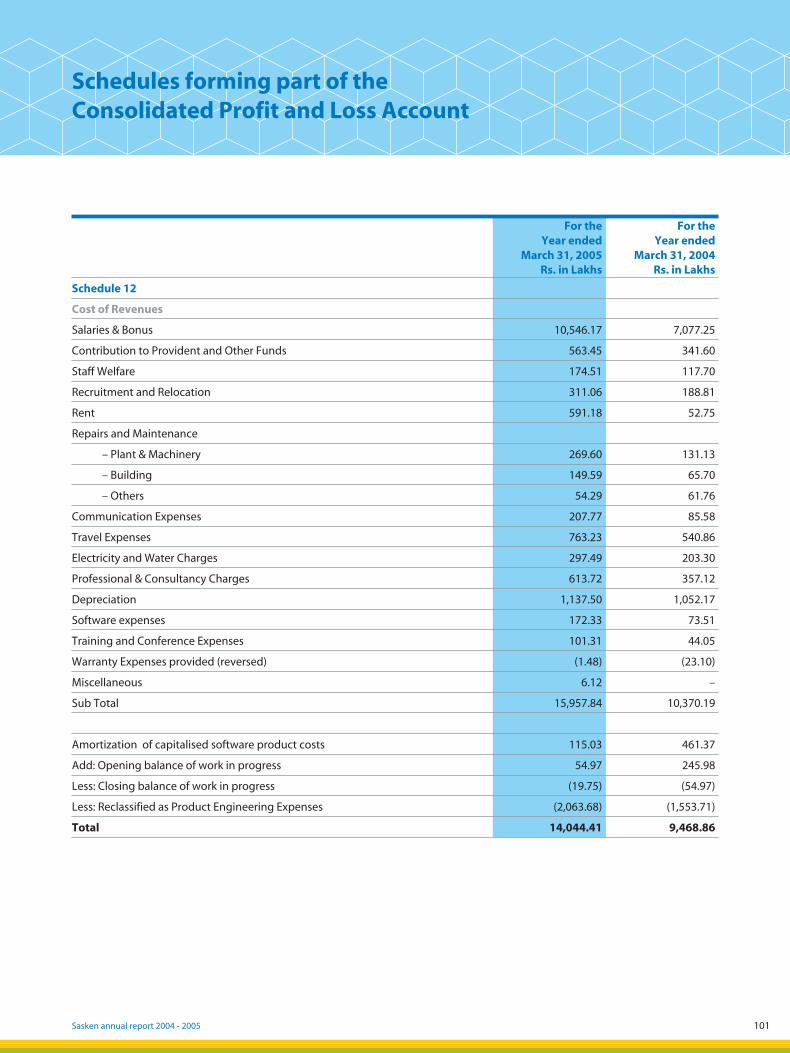
Sasken annual report 2004 - 2005 101
Schedules forming part of theConsolidated Profit and Loss Account
For the Year ended
March 31, 2005 Rs. in Lakhs
For the Year ended
March 31, 2004 Rs. in Lakhs
Schedule 12
Cost of Revenues
Salaries & Bonus 10,546.17 7,077.25
Contribution to Provident and Other Funds 563.45 341.60
Staff Welfare 174.51 117.70
Recruitment and Relocation 311.06 188.81
Rent 591.18 52.75
Repairs and Maintenance
– Plant & Machinery 269.60 131.13
– Building 149.59 65.70
– Others 54.29 61.76
Communication Expenses 207.77 85.58
Travel Expenses 763.23 540.86
Electricity and Water Charges 297.49 203.30
Professional & Consultancy Charges 613.72 357.12
Depreciation 1,137.50 1,052.17
Software expenses 172.33 73.51
Training and Conference Expenses 101.31 44.05
Warranty Expenses provided (reversed) (1.48) (23.10)
Miscellaneous 6.12 –
Sub Total 15,957.84 10,370.19
Amortization of capitalised software product costs 115.03 461.37
Add: Opening balance of work in progress 54.97 245.98
Less: Closing balance of work in progress (19.75) (54.97)
Less: Reclassified as Product Engineering Expenses (2,063.68) (1,553.71)
Total 14,044.41 9,468.86
05050449_003_138.indd 10105050449_003_138.indd 101 5/19/05 10:44:35 PM5/19/05 10:44:35 PM

102
For the Year ended
March 31, 2005 Rs. in Lakhs
For the Year ended
March 31, 2004 Rs. in Lakhs
Schedule 13
Selling and Marketing Expenses
Salaries & Bonus 1,399.50 860.04
Contribution to Provident and Other Funds 32.65 32.36
Staff Welfare 32.38 31.80
Recruitment and Relocation 8.62 16.17
Rent 109.13 90.94
Repairs and Maintenance
– Plant & Machinery 5.69 9.24
– Building 11.01 12.12
– Others 2.71 1.15
Communication 85.15 71.26
Travel 300.38 211.53
Electricity and Water Charges 4.76 1.31
Professional, Legal & Consultancy Charges 192.24 271.23
Agency Commission – others 95.56 175.31
Selling Expenses – others 172.68 89.14
Depreciation 25.51 12.27
Training and Conference 12.29 5.00
Total 2,490.26 1,890.87
Schedules forming part of theConsolidated Profit and Loss Account (contd.)
05050449_003_138.indd 10205050449_003_138.indd 102 5/19/05 10:44:35 PM5/19/05 10:44:35 PM
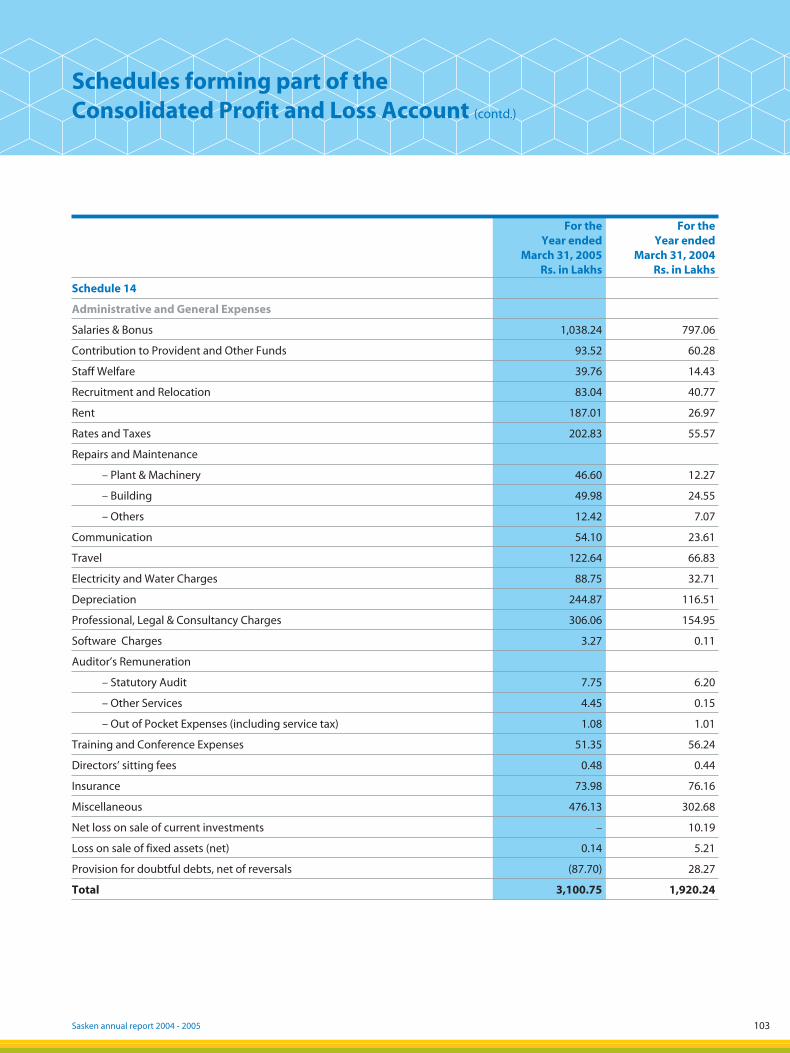
Sasken annual report 2004 - 2005 103
For the Year ended
March 31, 2005 Rs. in Lakhs
For the Year ended
March 31, 2004 Rs. in Lakhs
Schedule 14
Administrative and General Expenses
Salaries & Bonus 1,038.24 797.06
Contribution to Provident and Other Funds 93.52 60.28
Staff Welfare 39.76 14.43
Recruitment and Relocation 83.04 40.77
Rent 187.01 26.97
Rates and Taxes 202.83 55.57
Repairs and Maintenance
– Plant & Machinery 46.60 12.27
– Building 49.98 24.55
– Others 12.42 7.07
Communication 54.10 23.61
Travel 122.64 66.83
Electricity and Water Charges 88.75 32.71
Depreciation 244.87 116.51
Professional, Legal & Consultancy Charges 306.06 154.95
Software Charges 3.27 0.11
Auditor’s Remuneration
– Statutory Audit 7.75 6.20
– Other Services 4.45 0.15
– Out of Pocket Expenses (including service tax) 1.08 1.01
Training and Conference Expenses 51.35 56.24
Directors’ sitting fees 0.48 0.44
Insurance 73.98 76.16
Miscellaneous 476.13 302.68
Net loss on sale of current investments – 10.19
Loss on sale of fixed assets (net) 0.14 5.21
Provision for doubtful debts, net of reversals (87.70) 28.27
Total 3,100.75 1,920.24
Schedules forming part of theConsolidated Profit and Loss Account (contd.)
05050449_003_138.indd 10305050449_003_138.indd 103 5/19/05 10:44:36 PM5/19/05 10:44:36 PM
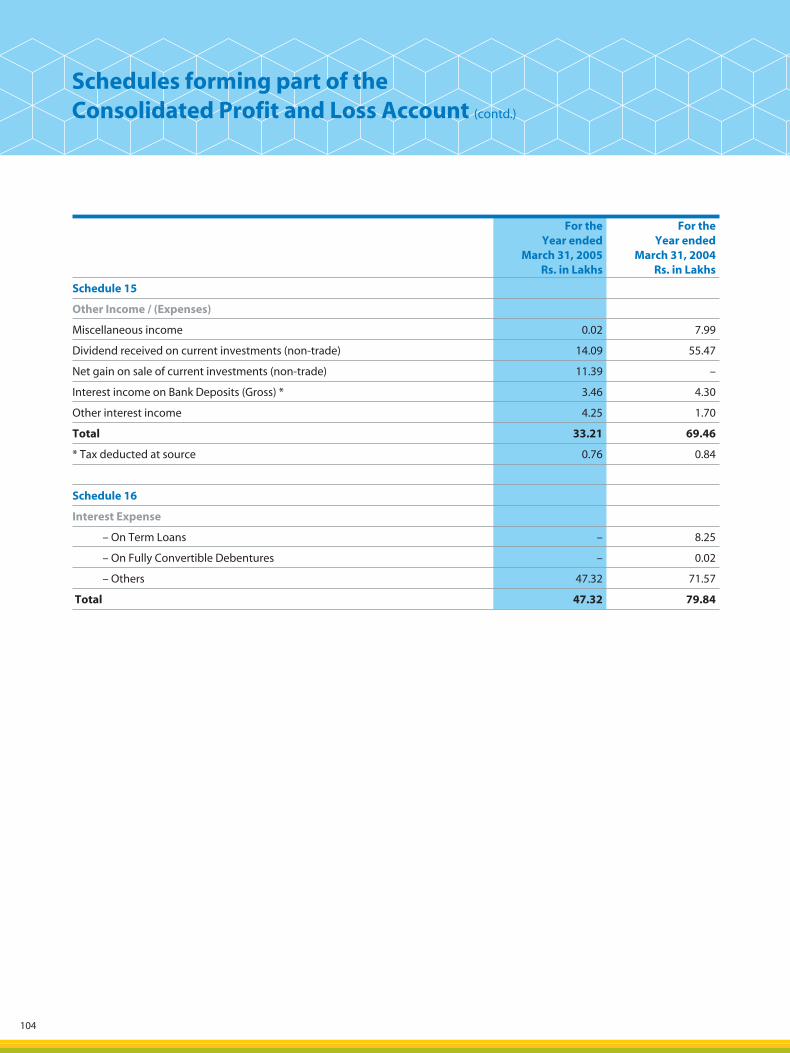
104
For the Year ended
March 31, 2005 Rs. in Lakhs
For the Year ended
March 31, 2004 Rs. in Lakhs
Schedule 15
Other Income / (Expenses)
Miscellaneous income 0.02 7.99
Dividend received on current investments (non-trade) 14.09 55.47
Net gain on sale of current investments (non-trade) 11.39 –
Interest income on Bank Deposits (Gross) * 3.46 4.30
Other interest income 4.25 1.70
Total 33.21 69.46
* Tax deducted at source 0.76 0.84
Schedule 16
Interest Expense
– On Term Loans – 8.25
– On Fully Convertible Debentures – 0.02
– Others 47.32 71.57
Total 47.32 79.84
Schedules forming part of theConsolidated Profit and Loss Account (contd.)
05050449_003_138.indd 10405050449_003_138.indd 104 5/19/05 10:44:36 PM5/19/05 10:44:36 PM
Sasken annual report 2004 - 2005 105
Schedule 17
1. Description of Business
Sasken Communication Technologies Limited (“Sasken” or “the Company”) is a provider of telecommunications software services and solutions to network equipment manufacturers, mobile terminal vendors and semiconductor companies around the world. Sasken delivers end-to-end solutions that enable richer content delivery on next generation networks.
Sasken has its headquarters in Bangalore, India with offices in Pune, Canada, China, Germany, Japan, Sweden, United Kingdom and the United States of America.
During the year ended March 31, 2004, the Company promoted Sasken Network Systems Limited (“SNS”) a wholly owned subsidiary in India. SNS was incorporated on October 20, 2003 and obtained its certificate to commence business on November 21, 2003, from the Registrar of Companies, Karnataka. SNS provides consultative engineering services focused on telecom operation systems. As at March 31, 2005, SNS is a wholly owned subsidiary of the Company.
During the year, the Company promoted Sasken Network Engineering Limited (“SNEL”), a wholly owned subsidiary in India. SNEL was incorporated on September 29, 2004 and obtained its certificate to commence business on October 11, 2004 from the Registrar of Companies, Karnataka. SNEL provides installation and commissioning of and project management services in cellular network. As at March 31, 2005, SNEL is a wholly owned subsidiary of the Company.
2. Significant Accounting Policies
Basis for preparation of financial statements
The accompanying consolidated financial statements include the accounts of Sasken, SNS and SNEL (hereinafter collectively referred to as “the Group”). The financial year-end of the subsidiaries is March 31.
The consolidated financial statements have been prepared to comply in all material respects with the mandatory Accounting Standards issued by the Institute of Chartered Accountants of India and the relevant provisions of the Companies Act, 1956. The financial statements have been prepared under the historical cost convention on an accrual basis. The accounting policies have been consistently applied by the Group and are consistent with those used in the year ended March 31, 2004, except for change in accounting policy and change in estimate as stated below.
The presentation of financial statements in conformity with generally accepted accounting principles requires management to make estimates and assumptions that affect the amounts reported in the financial statements and accompanying notes. Although these estimates are based on management’s best knowledge of current events and actions the Group may undertake in future, actual results ultimately may differ from the estimates.
All significant inter Company balances and transactions between the Company and its subsidiaries have been eliminated in consolidation.
Change in accounting policy
In order to comply with Accounting Standard – 11 (Revised) – The Effects of Changes in Foreign Exchange Rates, which is effective from April 1, 2004, for the reporting periods subsequent to March 31, 2004, the Company changed its accounting policy in respect of accounting for forward contracts entered into to hedge the foreign currency risk of the underlying assets and liabilities at the balance sheet date. Consequently, in respect of foreign currency monetary assets or liabilities in respect of which forward exchange contract is taken, exchange differences on such contracts are recognized in the statement of profit and loss in the period in which the exchange rates change. On account of such change in the accounting policy, exchange gain for the year ended March 31, 2005 is higher by Rs. 136.47 lakhs, with a consequential impact on the profit after tax for the year ended March 31, 2005.
Notes forming part of Consolidated Accounts
05050449_003_138.indd 10505050449_003_138.indd 105 5/19/05 10:44:36 PM5/19/05 10:44:36 PM
106
Change in estimate
During the year ended March 31, 2005 the Company revised its estimate of useful life of generic computer software to one year, prospectively. Hitherto, generic computer software was charged 100% depreciation in the period of purchase. Due to this change, depreciation on fixed assets for the year ended March 31, 2005 is lower by Rs.51.86 lakhs and profits after tax are higher to the same extent.
Revenue Recognition
The Group derives its revenues from product and technology licensing, software services and installation and commissioning services.
Licensing revenue is recognized when the product or technology is delivered and accepted. Revenue related to customized products or technology development agreements is recognized using the proportionate completion method, determined based on the achievement and acceptance of the milestone. In all cases revenue is recognized only when no further vendor obligations remain and collection is probable. Revenue related to post contract customer support is recognized over the support period.
Revenue from time and material service contracts is recognized as the services are provided. Revenue from fixed price service contracts is recognized based on the proportionate completion method, determined based on the achievement and acceptance of the milestone, provided collection is probable. Revenue from maintenance is recognized ratably over the term of the maintenance arrangement.
Revenue from royalty is recognized on an accrual basis based on the terms of the agreement, provided collection is probable.
Dividend income is recognized when the right to receive dividend is established.
Interest income is recognized on an accrual basis.
Work in progress
Costs related to milestones that have not been met are treated as costs of future activity and are reported as work in progress. Work in progress is carried at cost or net realizable value whichever is lower.
Fixed Assets
Fixed assets are stated at cost, less accumulated depreciation less impairment, if any. Cost comprises the purchase price and any attributable cost of bringing the asset to its working condition for its intended use. Financing costs relating to acquisition of fixed assets are also included to the extent they relate to the period till such assets are ready to be put to use.
Notes forming part of Consolidated Accounts (contd.)
05050449_003_138.indd 10605050449_003_138.indd 106 5/19/05 10:44:36 PM5/19/05 10:44:36 PM

Sasken annual report 2004 - 2005 107
Depreciation
Depreciation is provided on Straight Line Method (SLM) at the rates mentioned below which are greater than or equal to the corresponding rates prescribed in Schedule XIV of the Companies Act, 1956:
Type of asset Rates (SLM)(%)
Schedule XIV rates (SLM) (%)
Building 5 1.63
Computers 25 16.21
Electrical Fittings 20 4.75
Furniture & Fittings 10 6.33
Plant & Machinery 25 4.75
Office Equipment 20 4.75
Vehicles 20 9.50
Leasehold improvements at leased property are depreciated over estimated useful life or the lease period of the property, whichever is lower.
Assets with unit value Rs. 5,000 or less are depreciated entirely in the year of acquisition.
Intangible assets comprise of the following and are depreciated over the estimated useful life as given below:
a) Computer Software used for development of software/rendering software services – Over the life of the project/product.
b) Generic Computer Software – over 12 months.
c) Product Software for administration purposes – 3 years.
d) Contract rights – 3 years.
Capitalisation and Amortization of Software
Costs incurred towards development of computer software products meant for sale, lease or otherwise marketed, are capitalised subsequent to establishing technological feasibility. Capitalisation ceases when the product is available for general release to customers. Capitalised software costs are amortised on a product-by-product basis. The amortization shall be greater of the amount computed using (a) the ratio that current gross revenue for a product bears to the total of current and anticipated future gross revenues for that product or (b) the straight-line method over the remaining estimated economic life of the product. The unamortised cost of capitalized software products is carried at cost or net realisable value whichever is lower.
Investments
Investments that are readily realisable and intended to be held for not more than a year are classified as current investments. All other investments are classified as long-term investments. Current investments are carried at lower of cost and fair value determined on an individual investment basis. Long-term investments are carried at cost. However, provision for diminution in value is made to recognise a decline other than temporary in the value of the investments.
Notes forming part of Consolidated Accounts (contd.)
05050449_003_138.indd 10705050449_003_138.indd 107 5/19/05 10:44:36 PM5/19/05 10:44:36 PM

108
Foreign currency transactions
(i) Initial Recognition – Foreign currency transactions are recorded in the reporting currency, by applying to the foreign currency amount the exchange rate between the reporting currency and the foreign currency approximately at the date of the transaction.
(ii) Conversion – Foreign currency monetary items are reported using the closing rate. Non-monetary items, which are carried in terms of historical cost denominated in a foreign currency, are reported using the exchange rate at the date of the transaction.
(iii) Exchange Differences – Exchange differences arising on the settlement or conversion of monetary items, are recognised as income or as expenses in the period in which they arise except those arising on liabilities pertaining to fixed assets, which are adjusted with the cost of the fixed assets.
(iv) Forward Exchange Contracts – The Group uses forward exchange contracts to hedge its exposure to movements in foreign exchange rates. The Group does not use the forward exchange contracts for trading or speculation purposes. In respect of foreign currency monetary assets or liabilities in respect of which forward exchange contract is taken, the premium or discount arising at the inception of forward exchange contracts is amortised as expense or income over the life of the contract, except where it relates to fixed assets in which case it is adjusted to the cost of the corresponding asset. Exchange differences on such contracts are recognised in the statement of profit and loss in the period in which the exchange rates change. Any profit or loss arising on cancellation or renewal of forward exchange contract is recognised as income or as expense for the period.
(v) Foreign branches – The financial statements of an integral foreign operation are translated as if the transactions of the foreign operation have been those of the Group itself.
Retirement benefits to employees
The Group contributes to a Group Gratuity Scheme, administered by a private insurance group. The contributions are charged to the Profit and Loss account. Provision is made for the difference between the actuarial valuation (determined approximately as at the balance sheet date) and the funded balance.
Provision for leave encashment benefits is made based on actuarial valuation as at every balance sheet date.
The Company has established a Provident Fund Trust to which contributions towards provident fund are made each month. The Trust guarantees a specified rate of return on such contributions of employees and employer contributions on a yearly basis. The Company will meet the shortfall in the return, if any, and the same is charged to the profit and loss account on an accrual basis. The contributions towards the pension fund are remitted to the Regional Provident Fund. The contributions towards Provident Fund and Pension Fund of SNS and SNEL are remitted to the Regional Provident Fund. Contributions towards Provident Fund and Pension Fund are charged to the Profit and Loss Account on an accrual basis.
The Company and SNS established a Super Annuation Scheme administered by a private insurance group. As per the Scheme, for employees claiming the benefit, the employer makes monthly contributions, which are charged to the Profit and Loss Account on an accrual basis. The employer has no other obligations under the Scheme.
Impairment of assets
The Group assesses at each balance sheet date whether there is any indication that an asset may be impaired. If any such indication exists, the Group estimates the recoverable amount of the asset. If such recoverable amount of the asset or recoverable amount of the cash-generating unit to which the asset belongs is less than its carrying amount, the carrying amount is reduced to its recoverable amount. The reduction is treated as an impairment loss and is recognized in the profit and loss account. If at the balance sheet date there is an indication that if a previously assessed impairment loss no longer exists, the recoverable amount is reassessed and the asset is reflected at the recoverable amount.
Notes forming part of Consolidated Accounts (contd.)
05050449_003_138.indd 10805050449_003_138.indd 108 5/19/05 10:44:37 PM5/19/05 10:44:37 PM
Sasken annual report 2004 - 2005 109
Warranty expenses
The Company provides for the estimated costs based on trend of past analysis and nature of services rendered, that may be incurred under free warranties, as provided in licensing and service contracts.
Research and Development
All research and development costs are charged to Profit and Loss account when incurred. Equipment or facilities that are acquired or constructed for research and development activities, which have alternative future uses are capitalized as tangible assets. Depreciation on such assets is charged to expense as research and development costs.
Income Taxes
Tax expense comprises both current and deferred taxes. Current income tax is measured at the amount expected to be paid to the tax authorities in accordance with the Indian Income Tax Act, 1961 and tax laws applicable to the overseas branches under the respective jurisdiction. Deferred income taxes reflect the impact of current year timing differences between taxable income and accounting income for the period and reversal of timing differences of earlier years. Deferred tax is measured based on the tax rates and the tax laws enacted or substantively enacted at the balance sheet date. Deferred tax assets and deferred tax liabilities across various countries of operation are not set off against each other as the Group does not have a legal right to do so. Deferred tax assets are recognised only to the extent that there is reasonable certainty that sufficient future taxable income will be available against which such deferred tax assets can be realised. Deferred tax assets are recognised on carry forward of unabsorbed depreciation and tax losses only if there is virtual certainty that such deferred tax assets can be realised against future taxable profits. Unrecognised deferred tax assets of earlier years are re-assessed and recognised to the extent that it has become reasonably certain that future taxable income will be available against which such deferred tax assets can be realised.
Stock Compensation Expense
The Group accounts for stock compensation expense based on the fair value of the options granted on the date of grant. Compensation expense is amortized over the vesting period of the option on a straight-line basis. The accounting value of the options net of the Deferred Compensation Expense is reflected as Employee Stock Options Outstanding under Reserves and Surplus.
Earnings per share
Basic earnings per share are calculated by dividing the net profit or loss for the period attributable to equity shareholders by the weighted average number of equity shares outstanding during the period. Partly paid equity shares are treated as a fraction of an equity share to the extent that they were entitled to participate in dividends relative to a fully paid equity share during the reporting period. The weighted average number of equity shares outstanding during the period are adjusted for events of bonus issue; bonus element in a rights issue to existing shareholders; share split; and reverse share split (consolidation of shares).
For the purpose of calculating diluted earnings per share, the net profit or loss for the period attributable to equity shareholders and the weighted average number of shares outstanding during the period are adjusted for the effects of all dilutive potential equity shares.
Provisions
A provision is recognised when an enterprise has a present obligation as a result of past event; it is probable that an outflow of resources will be required to settle the obligation, in respect of which a reliable estimate can be made. Provisions are not discounted to its present value and are determined based on best estimate required to settle the obligation at the balance sheet date. These are reviewed at each balance sheet date and adjusted to reflect the current best estimates.
Notes forming part of Consolidated Accounts (contd.)
05050449_003_138.indd 10905050449_003_138.indd 109 5/19/05 10:44:37 PM5/19/05 10:44:37 PM
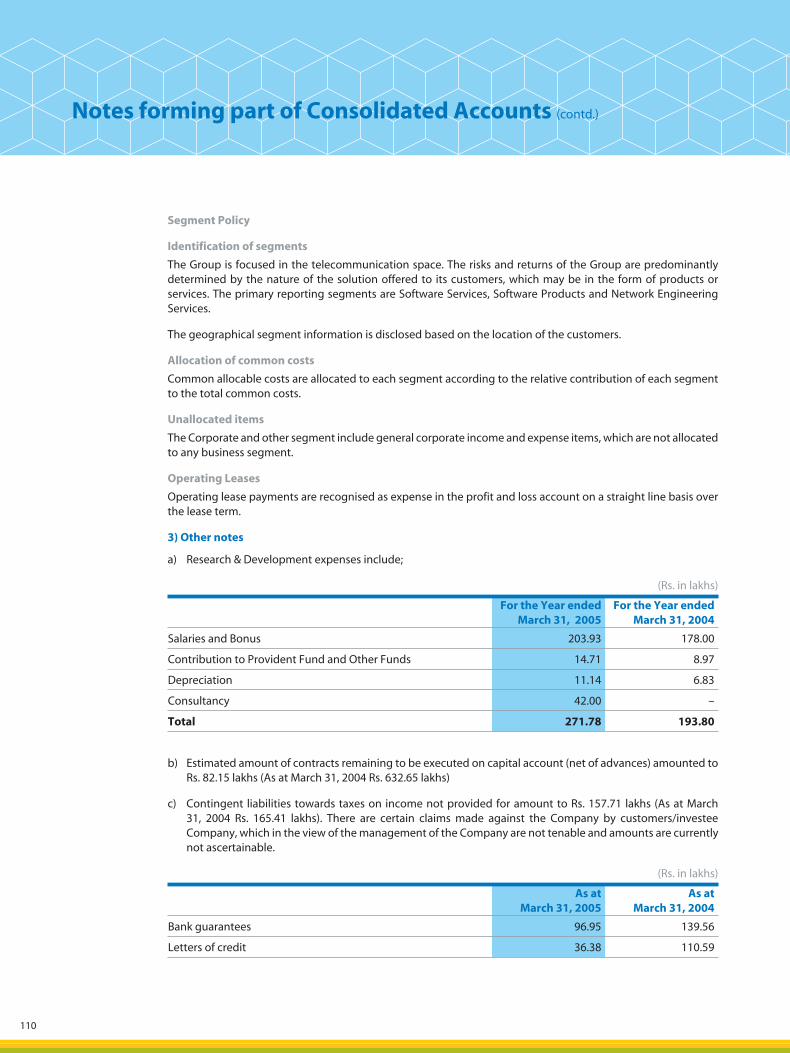
110
Segment Policy
Identification of segments
The Group is focused in the telecommunication space. The risks and returns of the Group are predominantly determined by the nature of the solution offered to its customers, which may be in the form of products or services. The primary reporting segments are Software Services, Software Products and Network Engineering Services.
The geographical segment information is disclosed based on the location of the customers.
Allocation of common costs
Common allocable costs are allocated to each segment according to the relative contribution of each segment to the total common costs.
Unallocated items
The Corporate and other segment include general corporate income and expense items, which are not allocated to any business segment.
Operating Leases
Operating lease payments are recognised as expense in the profit and loss account on a straight line basis over the lease term.
3) Other notes
a) Research & Development expenses include;
(Rs. in lakhs)
For the Year ended
March 31, 2005For the Year ended
March 31, 2004
Salaries and Bonus 203.93 178.00
Contribution to Provident Fund and Other Funds 14.71 8.97
Depreciation 11.14 6.83
Consultancy 42.00 –
Total 271.78 193.80
b) Estimated amount of contracts remaining to be executed on capital account (net of advances) amounted to Rs. 82.15 lakhs (As at March 31, 2004 Rs. 632.65 lakhs)
c) Contingent liabilities towards taxes on income not provided for amount to Rs. 157.71 lakhs (As at March 31, 2004 Rs. 165.41 lakhs). There are certain claims made against the Company by customers/investee Company, which in the view of the management of the Company are not tenable and amounts are currently not ascertainable.
(Rs. in lakhs)
As at
March 31, 2005As at
March 31, 2004
Bank guarantees 96.95 139.56
Letters of credit 36.38 110.59
Notes forming part of Consolidated Accounts (contd.)
05050449_003_138.indd 11005050449_003_138.indd 110 5/19/05 10:44:37 PM5/19/05 10:44:37 PM
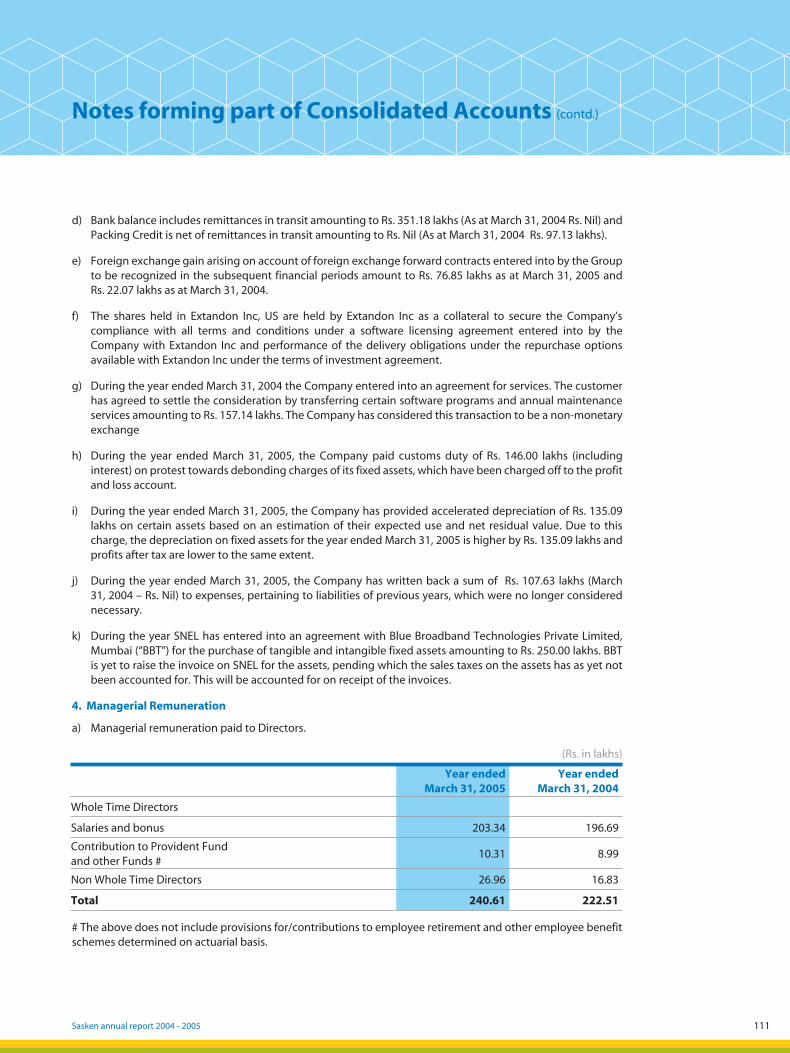
Sasken annual report 2004 - 2005 111
d) Bank balance includes remittances in transit amounting to Rs. 351.18 lakhs (As at March 31, 2004 Rs. Nil) and Packing Credit is net of remittances in transit amounting to Rs. Nil (As at March 31, 2004 Rs. 97.13 lakhs).
e) Foreign exchange gain arising on account of foreign exchange forward contracts entered into by the Group to be recognized in the subsequent financial periods amount to Rs. 76.85 lakhs as at March 31, 2005 andRs. 22.07 lakhs as at March 31, 2004.
f) The shares held in Extandon Inc, US are held by Extandon Inc as a collateral to secure the Company’s compliance with all terms and conditions under a software licensing agreement entered into by the Company with Extandon Inc and performance of the delivery obligations under the repurchase options available with Extandon Inc under the terms of investment agreement.
g) During the year ended March 31, 2004 the Company entered into an agreement for services. The customer has agreed to settle the consideration by transferring certain software programs and annual maintenance services amounting to Rs. 157.14 lakhs. The Company has considered this transaction to be a non-monetary exchange
h) During the year ended March 31, 2005, the Company paid customs duty of Rs. 146.00 lakhs (including interest) on protest towards debonding charges of its fixed assets, which have been charged off to the profit and loss account.
i) During the year ended March 31, 2005, the Company has provided accelerated depreciation of Rs. 135.09 lakhs on certain assets based on an estimation of their expected use and net residual value. Due to this charge, the depreciation on fixed assets for the year ended March 31, 2005 is higher by Rs. 135.09 lakhs and profits after tax are lower to the same extent.
j) During the year ended March 31, 2005, the Company has written back a sum of Rs. 107.63 lakhs (March 31, 2004 – Rs. Nil) to expenses, pertaining to liabilities of previous years, which were no longer considered necessary.
k) During the year SNEL has entered into an agreement with Blue Broadband Technologies Private Limited, Mumbai (“BBT”) for the purchase of tangible and intangible fixed assets amounting to Rs. 250.00 lakhs. BBT is yet to raise the invoice on SNEL for the assets, pending which the sales taxes on the assets has as yet not been accounted for. This will be accounted for on receipt of the invoices.
4. Managerial Remuneration
a) Managerial remuneration paid to Directors.
(Rs. in lakhs)
Year ended
March 31, 2005Year ended
March 31, 2004
Whole Time Directors
Salaries and bonus 203.34 196.69
Contribution to Provident Fund and other Funds #
10.31 8.99
Non Whole Time Directors 26.96 16.83
Total 240.61 222.51
# The above does not include provisions for/contributions to employee retirement and other employee benefit schemes determined on actuarial basis.
Notes forming part of Consolidated Accounts (contd.)
05050449_003_138.indd 11105050449_003_138.indd 111 5/19/05 10:44:37 PM5/19/05 10:44:37 PM

112
5. Provision for taxation
A significant portion of the Company and SNS income is non-taxable as the companies claim deduction under section 10A of the Income Tax Act, 1961. No deferred tax asset has been recognised on carry forward losses, as it is not virtually certain that such deferred tax asset will be realised. Further, the temporary differences arising reverse within the balance period of tax holiday under section 10A of the Income Tax Act, 1961.
Income tax expense/(credit) comprises of:
(Rs. in lakhs)
For the Year ended
March 31, 2005For the Year ended
March 31, 2004
Overseas income taxes (comprising of withholding taxes and overseas branch income taxes)
150.31 249.21
The above are net of refund/reversal of overseas taxes 204.54 472.81
6. Fixed Price Revenue Contracts
The following table provides disclosures in accordance with the revised Accounting Standard (AS) 7 – Construction Contracts:
(Rs. in lakhs)
For the Year ended
March 31, 2005For the Year ended
March 31, 2004
Contract revenue recognized during the year 2,844.94 923.34
Aggregate amount of costs incurred and recognised profits (less recognised losses) upto date of balance sheet for contracts in progress as at that date
19.75 207.00
As at March 31, 2005
As at March 31, 2004
Gross amount due from customers for contract work- presented as an asset
30.04 7.23
Gross amount due to customers for contract work- presented as a liability
15.72 –
7. Employee Stock Option Plan
The Company has two employee stock option schemes, ‘SAS Stock Option Plan, 1997’ and ‘Sasken ESOP-2000’. The details of options granted, options vested and shares issued against the exercised options are explained herein below.
a) SAS Stock Option Plan, 1997
The shareholders approved the Plan at the Extraordinary General meeting on November 20, 1997. Under this scheme, Fully Convertible Debentures (FCD’s) were issued to employees of the Company, consultants and advisors. Each of these FCDs are converted into one share of Rs.10 each. There are no outstanding debentures as on March 31, 2005.
b) Sasken ESOP-2000
During the year ended March 31, 2001, the Company announced a Stock Option Plan in accordance with the Guidelines issued by the Securities and Exchange Board of India (SEBI) for Employees Stock Option Plans. This stock option plan called ESOP-2000, was approved by the shareholders at the Extraordinary General Meeting
Notes forming part of Consolidated Accounts (contd.)
05050449_003_138.indd 11205050449_003_138.indd 112 5/19/05 10:44:38 PM5/19/05 10:44:38 PM
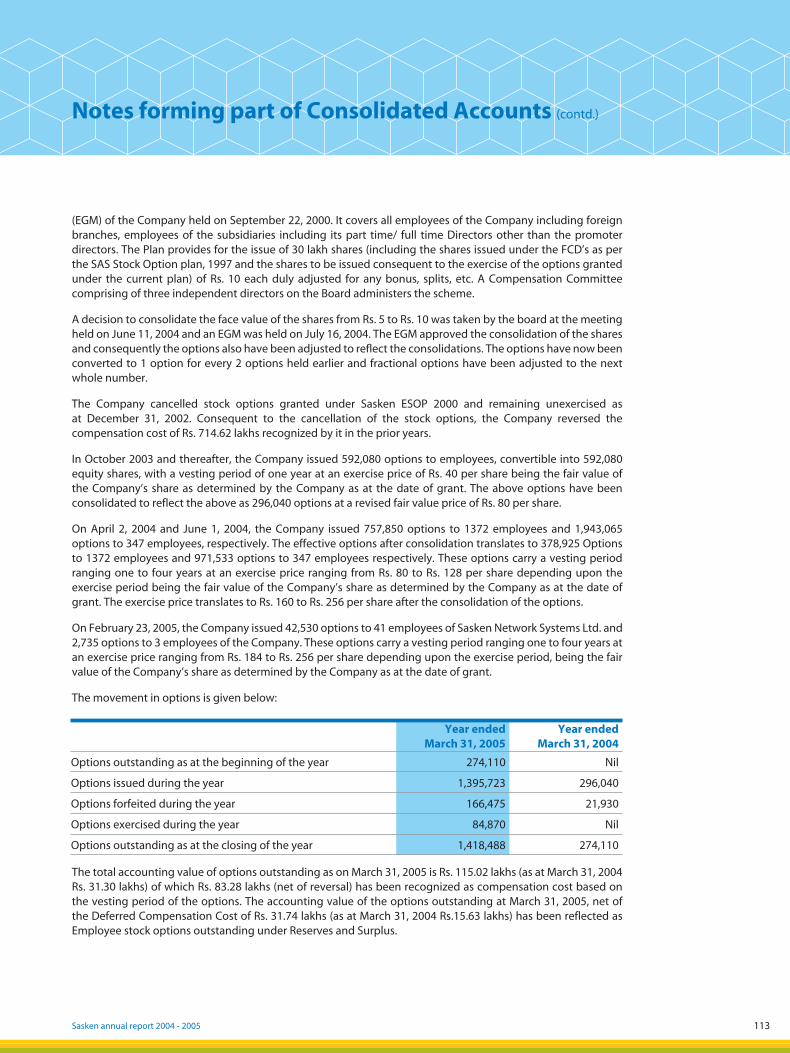
Sasken annual report 2004 - 2005 113
(EGM) of the Company held on September 22, 2000. It covers all employees of the Company including foreign branches, employees of the subsidiaries including its part time/ full time Directors other than the promoter directors. The Plan provides for the issue of 30 lakh shares (including the shares issued under the FCD’s as per the SAS Stock Option plan, 1997 and the shares to be issued consequent to the exercise of the options granted under the current plan) of Rs. 10 each duly adjusted for any bonus, splits, etc. A Compensation Committee comprising of three independent directors on the Board administers the scheme.
A decision to consolidate the face value of the shares from Rs. 5 to Rs. 10 was taken by the board at the meeting held on June 11, 2004 and an EGM was held on July 16, 2004. The EGM approved the consolidation of the shares and consequently the options also have been adjusted to reflect the consolidations. The options have now been converted to 1 option for every 2 options held earlier and fractional options have been adjusted to the next whole number.
The Company cancelled stock options granted under Sasken ESOP 2000 and remaining unexercised as at December 31, 2002. Consequent to the cancellation of the stock options, the Company reversed the compensation cost of Rs. 714.62 lakhs recognized by it in the prior years.
In October 2003 and thereafter, the Company issued 592,080 options to employees, convertible into 592,080 equity shares, with a vesting period of one year at an exercise price of Rs. 40 per share being the fair value of the Company’s share as determined by the Company as at the date of grant. The above options have been consolidated to reflect the above as 296,040 options at a revised fair value price of Rs. 80 per share.
On April 2, 2004 and June 1, 2004, the Company issued 757,850 options to 1372 employees and 1,943,065 options to 347 employees, respectively. The effective options after consolidation translates to 378,925 Options to 1372 employees and 971,533 options to 347 employees respectively. These options carry a vesting period ranging one to four years at an exercise price ranging from Rs. 80 to Rs. 128 per share depending upon the exercise period being the fair value of the Company’s share as determined by the Company as at the date of grant. The exercise price translates to Rs. 160 to Rs. 256 per share after the consolidation of the options.
On February 23, 2005, the Company issued 42,530 options to 41 employees of Sasken Network Systems Ltd. and 2,735 options to 3 employees of the Company. These options carry a vesting period ranging one to four years at an exercise price ranging from Rs. 184 to Rs. 256 per share depending upon the exercise period, being the fair value of the Company’s share as determined by the Company as at the date of grant.
The movement in options is given below:
Year endedMarch 31, 2005
Year endedMarch 31, 2004
Options outstanding as at the beginning of the year 274,110 Nil
Options issued during the year 1,395,723 296,040
Options forfeited during the year 166,475 21,930
Options exercised during the year 84,870 Nil
Options outstanding as at the closing of the year 1,418,488 274,110
The total accounting value of options outstanding as on March 31, 2005 is Rs. 115.02 lakhs (as at March 31, 2004 Rs. 31.30 lakhs) of which Rs. 83.28 lakhs (net of reversal) has been recognized as compensation cost based on the vesting period of the options. The accounting value of the options outstanding at March 31, 2005, net of the Deferred Compensation Cost of Rs. 31.74 lakhs (as at March 31, 2004 Rs.15.63 lakhs) has been reflected as Employee stock options outstanding under Reserves and Surplus.
Notes forming part of Consolidated Accounts (contd.)
05050449_003_138.indd 11305050449_003_138.indd 113 5/19/05 10:44:38 PM5/19/05 10:44:38 PM
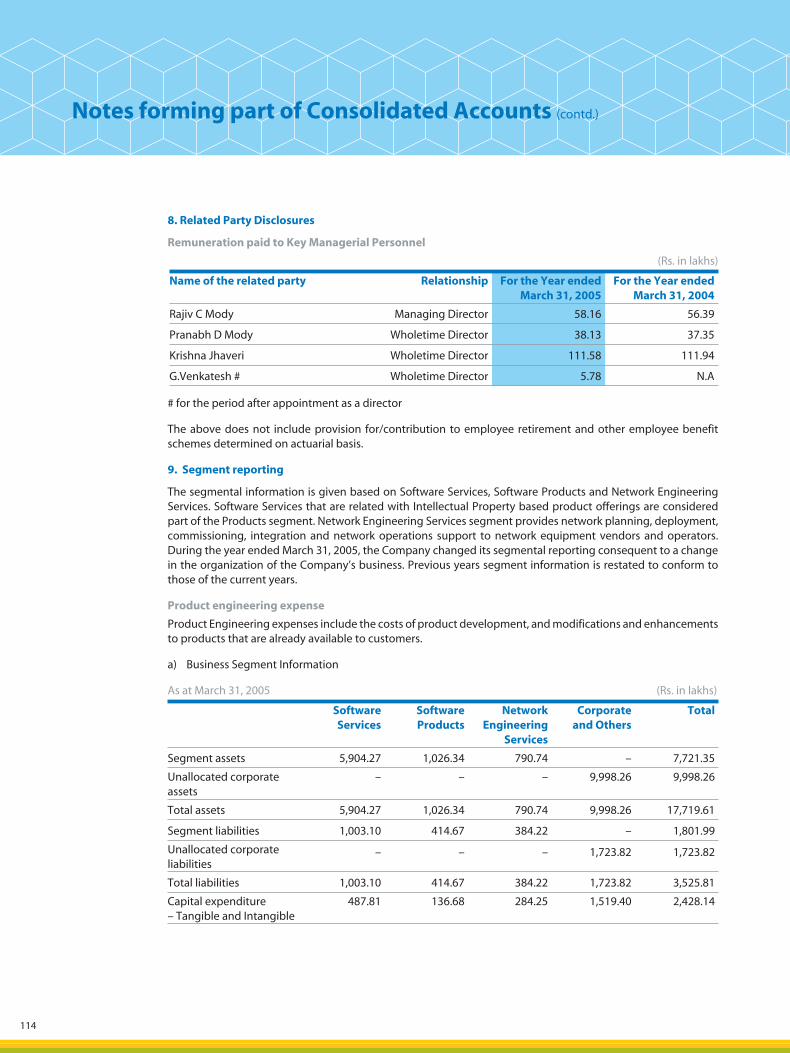
114
8. Related Party Disclosures
Remuneration paid to Key Managerial Personnel
(Rs. in lakhs)
Name of the related party Relationship For the Year endedMarch 31, 2005
For the Year endedMarch 31, 2004
Rajiv C Mody Managing Director 58.16 56.39
Pranabh D Mody Wholetime Director 38.13 37.35
Krishna Jhaveri Wholetime Director 111.58 111.94
G.Venkatesh # Wholetime Director 5.78 N.A
# for the period after appointment as a director
The above does not include provision for/contribution to employee retirement and other employee benefit schemes determined on actuarial basis.
9. Segment reporting
The segmental information is given based on Software Services, Software Products and Network Engineering Services. Software Services that are related with Intellectual Property based product offerings are considered part of the Products segment. Network Engineering Services segment provides network planning, deployment, commissioning, integration and network operations support to network equipment vendors and operators. During the year ended March 31, 2005, the Company changed its segmental reporting consequent to a change in the organization of the Company’s business. Previous years segment information is restated to conform to those of the current years.
Product engineering expense
Product Engineering expenses include the costs of product development, and modifications and enhancements to products that are already available to customers.
a) Business Segment Information
As at March 31, 2005 (Rs. in lakhs)
Software Services
Software Products
Network Engineering
Services
Corporate and Others
Total
Segment assets 5,904.27 1,026.34 790.74 – 7,721.35
Unallocated corporate assets
– – – 9,998.26 9,998.26
Total assets 5,904.27 1,026.34 790.74 9,998.26 17,719.61
Segment liabilities 1,003.10 414.67 384.22 – 1,801.99
Unallocated corporate liabilities
– – – 1,723.82 1,723.82
Total liabilities 1,003.10 414.67 384.22 1,723.82 3,525.81
Capital expenditure – Tangible and Intangible
487.81 136.68 284.25 1,519.40 2,428.14
Notes forming part of Consolidated Accounts (contd.)
05050449_003_138.indd 11405050449_003_138.indd 114 5/19/05 10:44:38 PM5/19/05 10:44:38 PM
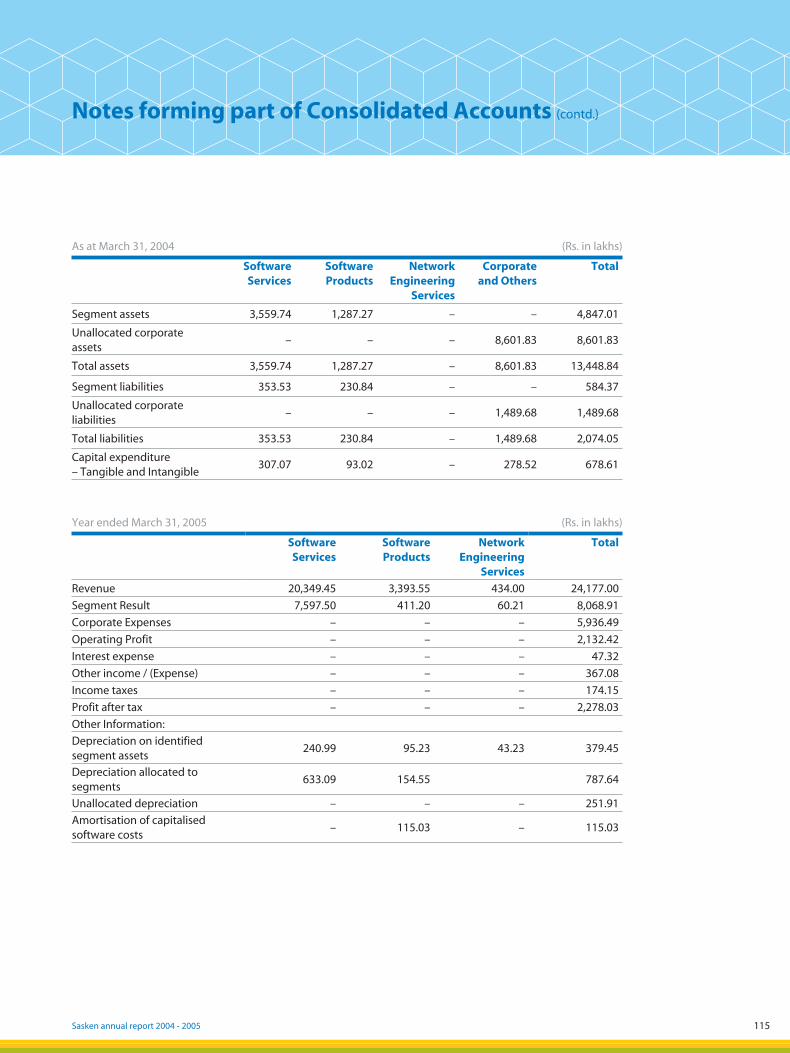
Sasken annual report 2004 - 2005 115
As at March 31, 2004 (Rs. in lakhs)
Software Services
Software Products
Network Engineering
Services
Corporate and Others
Total
Segment assets 3,559.74 1,287.27 – – 4,847.01
Unallocated corporate assets
– – – 8,601.83 8,601.83
Total assets 3,559.74 1,287.27 – 8,601.83 13,448.84
Segment liabilities 353.53 230.84 – – 584.37
Unallocated corporate liabilities
– – – 1,489.68 1,489.68
Total liabilities 353.53 230.84 – 1,489.68 2,074.05
Capital expenditure – Tangible and Intangible
307.07 93.02 – 278.52 678.61
Year ended March 31, 2005 (Rs. in lakhs)
Software Services
Software Products
Network Engineering
Services
Total
Revenue 20,349.45 3,393.55 434.00 24,177.00
Segment Result 7,597.50 411.20 60.21 8,068.91
Corporate Expenses – – – 5,936.49
Operating Profit – – – 2,132.42
Interest expense – – – 47.32
Other income / (Expense) – – – 367.08
Income taxes – – – 174.15
Profit after tax – – – 2,278.03
Other Information:
Depreciation on identified segment assets
240.99 95.23 43.23 379.45
Depreciation allocated to segments
633.09 154.55 787.64
Unallocated depreciation – – – 251.91
Amortisation of capitalised software costs
– 115.03 – 115.03
Notes forming part of Consolidated Accounts (contd.)
8
05050449_003_138.indd 11505050449_003_138.indd 115 5/19/05 10:44:38 PM5/19/05 10:44:38 PM
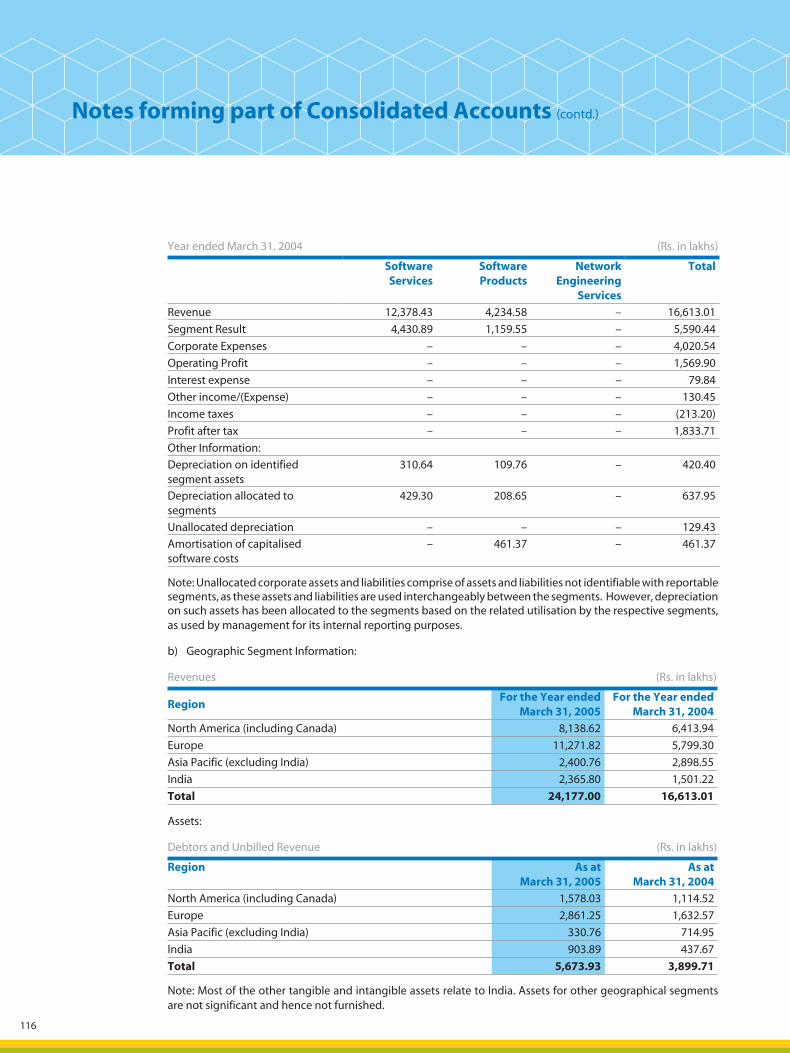
116
Year ended March 31, 2004 (Rs. in lakhs)
Software Services
Software Products
Network Engineering
Services
Total
Revenue 12,378.43 4,234.58 – 16,613.01
Segment Result 4,430.89 1,159.55 – 5,590.44
Corporate Expenses – – – 4,020.54
Operating Profit – – – 1,569.90
Interest expense – – – 79.84
Other income/(Expense) – – – 130.45
Income taxes – – – (213.20)
Profit after tax – – – 1,833.71
Other Information:
Depreciation on identified segment assets
310.64 109.76 – 420.40
Depreciation allocated to segments
429.30 208.65 – 637.95
Unallocated depreciation – – – 129.43
Amortisation of capitalised software costs
– 461.37 – 461.37
Note: Unallocated corporate assets and liabilities comprise of assets and liabilities not identifiable with reportable segments, as these assets and liabilities are used interchangeably between the segments. However, depreciation on such assets has been allocated to the segments based on the related utilisation by the respective segments, as used by management for its internal reporting purposes.
b) Geographic Segment Information:
Revenues (Rs. in lakhs)
RegionFor the Year ended
March 31, 2005For the Year ended
March 31, 2004
North America (including Canada) 8,138.62 6,413.94
Europe 11,271.82 5,799.30
Asia Pacific (excluding India) 2,400.76 2,898.55
India 2,365.80 1,501.22
Total 24,177.00 16,613.01
Assets:
Debtors and Unbilled Revenue (Rs. in lakhs)
Region As at March 31, 2005
As at March 31, 2004
North America (including Canada) 1,578.03 1,114.52
Europe 2,861.25 1,632.57
Asia Pacific (excluding India) 330.76 714.95
India 903.89 437.67
Total 5,673.93 3,899.71
Note: Most of the other tangible and intangible assets relate to India. Assets for other geographical segments are not significant and hence not furnished.
Notes forming part of Consolidated Accounts (contd.)
05050449_003_138.indd 11605050449_003_138.indd 116 5/19/05 10:44:39 PM5/19/05 10:44:39 PM
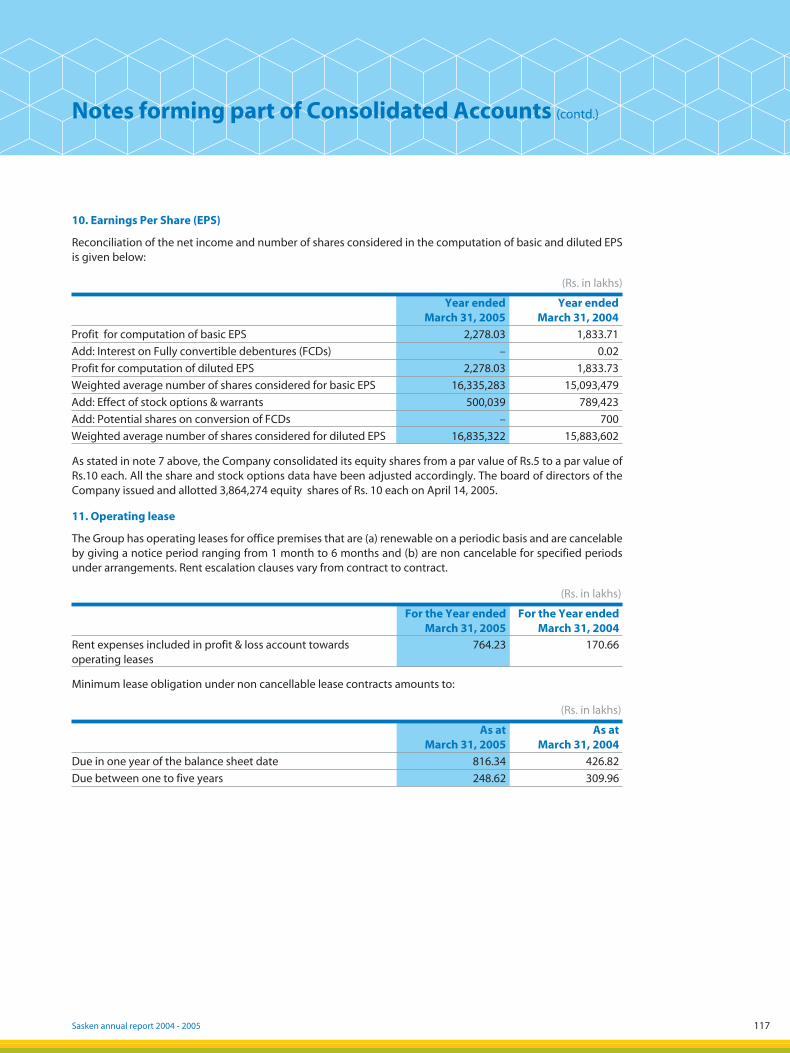
Sasken annual report 2004 - 2005 117
10. Earnings Per Share (EPS)
Reconciliation of the net income and number of shares considered in the computation of basic and diluted EPS is given below:
(Rs. in lakhs)
Year endedMarch 31, 2005
Year endedMarch 31, 2004
Profit for computation of basic EPS 2,278.03 1,833.71
Add: Interest on Fully convertible debentures (FCDs) – 0.02
Profit for computation of diluted EPS 2,278.03 1,833.73
Weighted average number of shares considered for basic EPS 16,335,283 15,093,479
Add: Effect of stock options & warrants 500,039 789,423
Add: Potential shares on conversion of FCDs – 700
Weighted average number of shares considered for diluted EPS 16,835,322 15,883,602
As stated in note 7 above, the Company consolidated its equity shares from a par value of Rs.5 to a par value of Rs.10 each. All the share and stock options data have been adjusted accordingly. The board of directors of the Company issued and allotted 3,864,274 equity shares of Rs. 10 each on April 14, 2005.
11. Operating lease
The Group has operating leases for office premises that are (a) renewable on a periodic basis and are cancelable by giving a notice period ranging from 1 month to 6 months and (b) are non cancelable for specified periods under arrangements. Rent escalation clauses vary from contract to contract.
(Rs. in lakhs)
For the Year ended
March 31, 2005For the Year ended
March 31, 2004
Rent expenses included in profit & loss account towards operating leases
764.23 170.66
Minimum lease obligation under non cancellable lease contracts amounts to:
(Rs. in lakhs)
As at
March 31, 2005As at
March 31, 2004
Due in one year of the balance sheet date 816.34 426.82
Due between one to five years 248.62 309.96
Notes forming part of Consolidated Accounts (contd.)
05050449_003_138.indd 11705050449_003_138.indd 117 5/19/05 10:44:39 PM5/19/05 10:44:39 PM
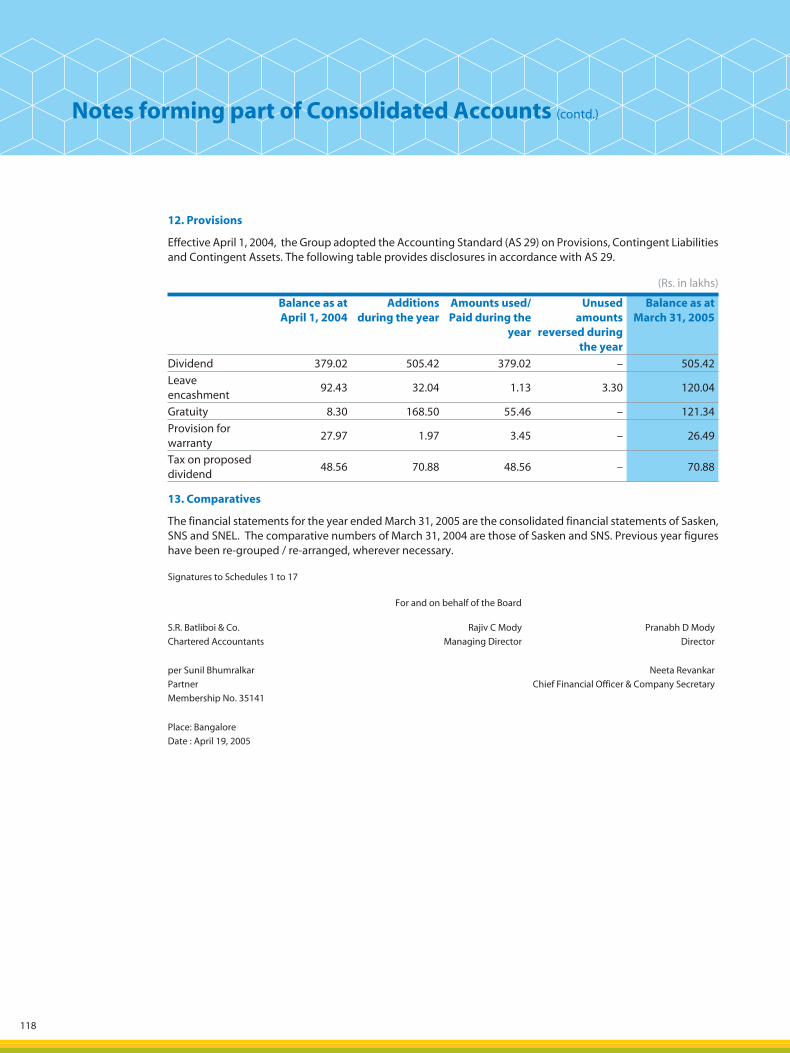
118
12. Provisions
Effective April 1, 2004, the Group adopted the Accounting Standard (AS 29) on Provisions, Contingent Liabilities and Contingent Assets. The following table provides disclosures in accordance with AS 29.
(Rs. in lakhs)
Balance as at April 1, 2004
Additions during the year
Amounts used/Paid during the
year
Unused amounts
reversed during the year
Balance as at March 31, 2005
Dividend 379.02 505.42 379.02 – 505.42
Leave encashment
92.43 32.04 1.13 3.30 120.04
Gratuity 8.30 168.50 55.46 – 121.34
Provision for warranty
27.97 1.97 3.45 – 26.49
Tax on proposed dividend
48.56 70.88 48.56 – 70.88
13. Comparatives
The financial statements for the year ended March 31, 2005 are the consolidated financial statements of Sasken, SNS and SNEL. The comparative numbers of March 31, 2004 are those of Sasken and SNS. Previous year figures have been re-grouped / re-arranged, wherever necessary.
Signatures to Schedules 1 to 17
For and on behalf of the Board
S.R. Batliboi & Co.
Chartered Accountants
Rajiv C Mody
Managing Director
Pranabh D Mody
Director
per Sunil Bhumralkar
Partner
Membership No. 35141
Neeta Revankar
Chief Financial Officer & Company Secretary
Place: Bangalore
Date : April 19, 2005
Notes forming part of Consolidated Accounts (contd.)
05050449_003_138.indd 11805050449_003_138.indd 118 5/19/05 10:44:39 PM5/19/05 10:44:39 PM
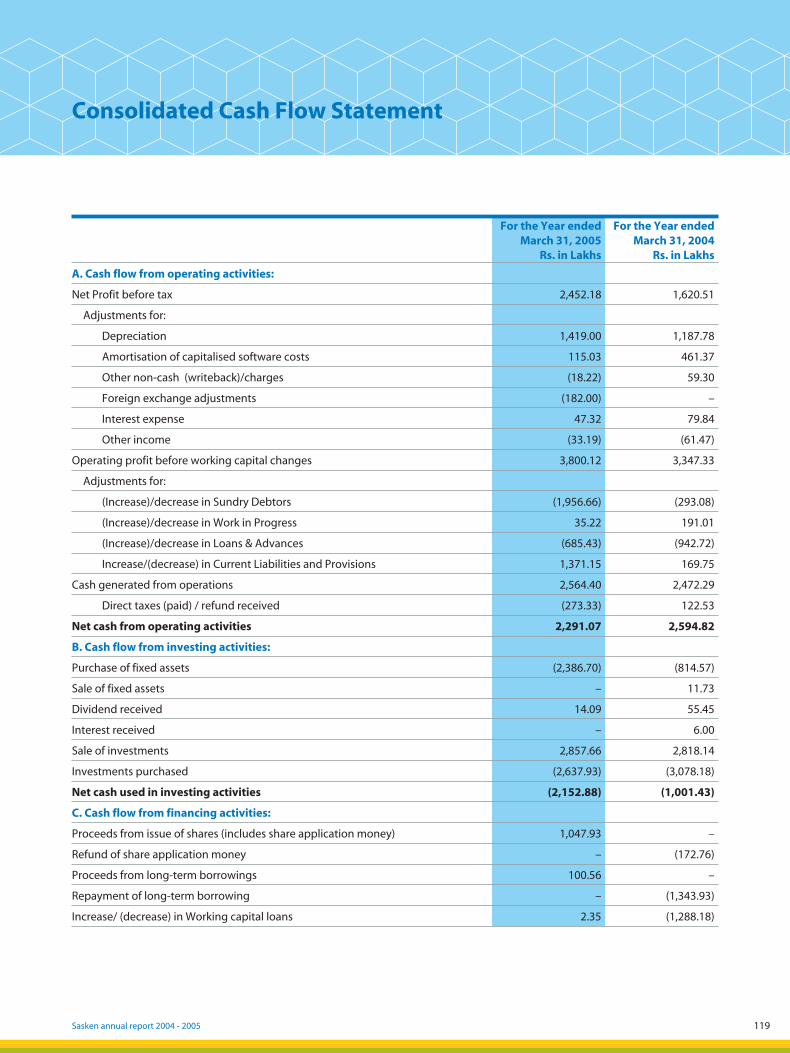
Sasken annual report 2004 - 2005 119
For the Year ended March 31, 2005
Rs. in Lakhs
For the Year ended March 31, 2004
Rs. in Lakhs
A. Cash flow from operating activities:
Net Profit before tax 2,452.18 1,620.51
Adjustments for:
Depreciation 1,419.00 1,187.78
Amortisation of capitalised software costs 115.03 461.37
Other non-cash (writeback)/charges (18.22) 59.30
Foreign exchange adjustments (182.00) –
Interest expense 47.32 79.84
Other income (33.19) (61.47)
Operating profit before working capital changes 3,800.12 3,347.33
Adjustments for:
(Increase)/decrease in Sundry Debtors (1,956.66) (293.08)
(Increase)/decrease in Work in Progress 35.22 191.01
(Increase)/decrease in Loans & Advances (685.43) (942.72)
Increase/(decrease) in Current Liabilities and Provisions 1,371.15 169.75
Cash generated from operations 2,564.40 2,472.29
Direct taxes (paid) / refund received (273.33) 122.53
Net cash from operating activities 2,291.07 2,594.82
B. Cash flow from investing activities:
Purchase of fixed assets (2,386.70) (814.57)
Sale of fixed assets – 11.73
Dividend received 14.09 55.45
Interest received – 6.00
Sale of investments 2,857.66 2,818.14
Investments purchased (2,637.93) (3,078.18)
Net cash used in investing activities (2,152.88) (1,001.43)
C. Cash flow from financing activities:
Proceeds from issue of shares (includes share application money) 1,047.93 –
Refund of share application money – (172.76)
Proceeds from long-term borrowings 100.56 –
Repayment of long-term borrowing – (1,343.93)
Increase/ (decrease) in Working capital loans 2.35 (1,288.18)
Consolidated Cash Flow Statement
05050449_003_138.indd 11905050449_003_138.indd 119 5/19/05 10:44:39 PM5/19/05 10:44:39 PM
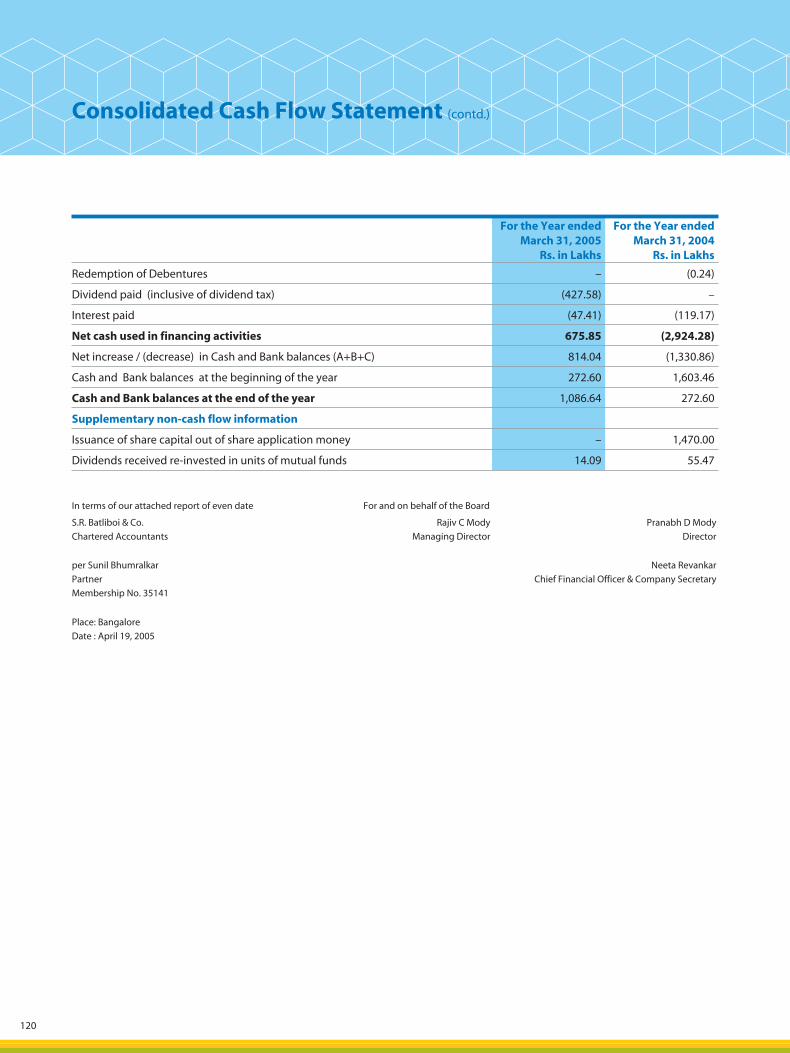
120
Consolidated Cash Flow Statement (contd.)
In terms of our attached report of even date For and on behalf of the Board
S.R. Batliboi & Co.
Chartered Accountants
Rajiv C Mody
Managing Director
Pranabh D Mody
Director
per Sunil Bhumralkar
Partner
Membership No. 35141
Neeta Revankar
Chief Financial Officer & Company Secretary
Place: Bangalore
Date : April 19, 2005
For the Year ended March 31, 2005
Rs. in Lakhs
For the Year ended March 31, 2004
Rs. in Lakhs
Redemption of Debentures – (0.24)
Dividend paid (inclusive of dividend tax) (427.58) –
Interest paid (47.41) (119.17)
Net cash used in financing activities 675.85 (2,924.28)
Net increase / (decrease) in Cash and Bank balances (A+B+C) 814.04 (1,330.86)
Cash and Bank balances at the beginning of the year 272.60 1,603.46
Cash and Bank balances at the end of the year 1,086.64 272.60
Supplementary non-cash flow information
Issuance of share capital out of share application money – 1,470.00
Dividends received re-invested in units of mutual funds 14.09 55.47
05050449_003_138.indd 12005050449_003_138.indd 120 5/19/05 10:44:40 PM5/19/05 10:44:40 PM
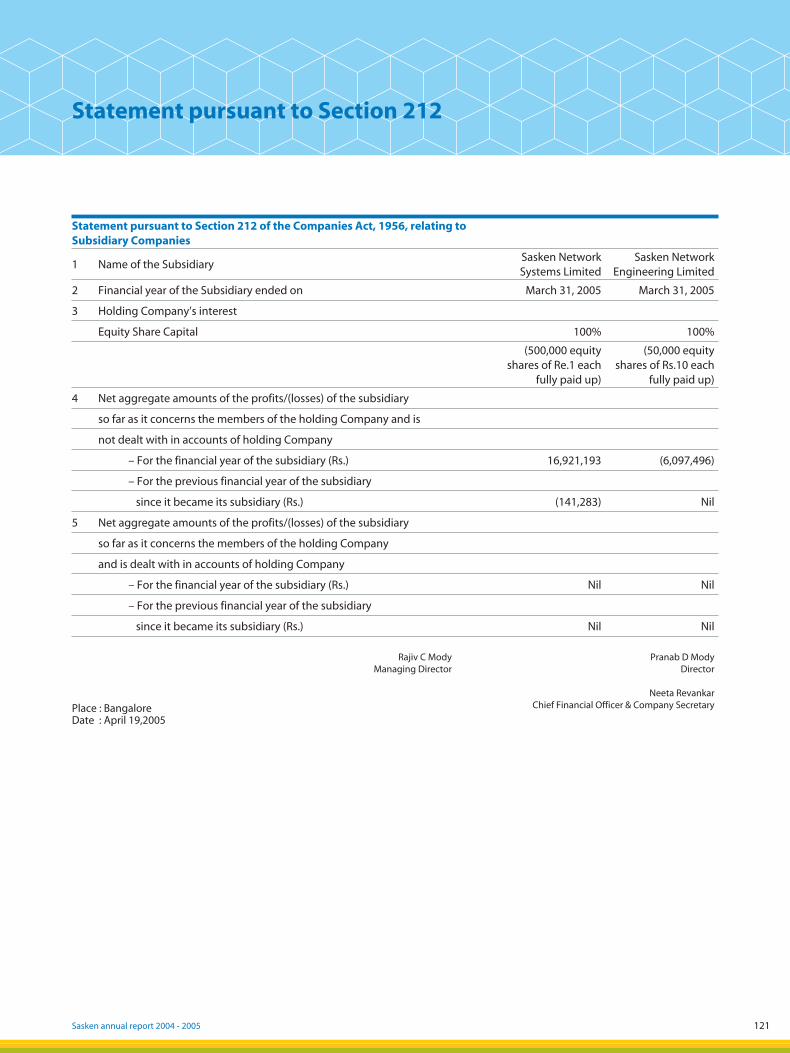
Sasken annual report 2004 - 2005 121
Statement pursuant to Section 212 of the Companies Act, 1956, relating to Subsidiary Companies
1 Name of the SubsidiarySasken Network Systems Limited
Sasken Network Engineering Limited
2 Financial year of the Subsidiary ended on March 31, 2005 March 31, 2005
3 Holding Company’s interest
Equity Share Capital 100% 100%
(500,000 equity shares of Re.1 each
fully paid up)
(50,000 equity shares of Rs.10 each
fully paid up)
4 Net aggregate amounts of the profits/(losses) of the subsidiary
so far as it concerns the members of the holding Company and is
not dealt with in accounts of holding Company
– For the financial year of the subsidiary (Rs.) 16,921,193 (6,097,496)
– For the previous financial year of the subsidiary
since it became its subsidiary (Rs.) (141,283) Nil
5 Net aggregate amounts of the profits/(losses) of the subsidiary
so far as it concerns the members of the holding Company
and is dealt with in accounts of holding Company
– For the financial year of the subsidiary (Rs.) Nil Nil
– For the previous financial year of the subsidiary
since it became its subsidiary (Rs.) Nil Nil
Statement pursuant to Section 212
Place : Bangalore Date : April 19,2005
Rajiv C Mody Managing Director
Pranab D Mody Director
Neeta Revankar Chief Financial Officer & Company Secretary
05050449_003_138.indd 12105050449_003_138.indd 121 5/19/05 10:44:40 PM5/19/05 10:44:40 PM

122
Management’s Discussion and Analysis ofFinancial Performance
IN ADDITION TO HISTORICAL INFORMATION, THIS ANNUAL REPORT CONTAINS CERTAIN FORWARD-LOOKING STATEMENTS. THE FORWARD-LOOKING STATEMENTS CONTAINED HEREIN ARE SUBJECT TO CERTAIN RISKS AND UNCERTAINTIES THAT COULD CAUSE ACTUAL RESULTS TO DIFFER MATERIALLY FROM THOSE REFLECTED IN THE FORWARD-LOOKING STATEMENTS. FACTORS THAT MIGHT CAUSE SUCH A DIFFERENCE INCLUDE, BUT ARE NOT LIMITED TO, THOSE DISCUSSED IN THE “MANAGEMENT’S DISCUSSION AND ANALYSIS OF FINANCIAL PERFORMANCE ” AND ELSEWHERE IN THIS REPORT. READERS ARE CAUTIONED NOT TO PLACE UNDUE RELIANCE ON THESE FORWARD-LOOKING STATEMENTS, WHICH REFLECT MANAGEMENT’S ANALYSIS ONLY AS OF THE DATE HEREOF.
The consolidated financial statements have been prepared in compliance with the requirements of the Companies Act, 1956, and Generally Accepted Accounting Principles (GAAP) in India. The management accepts responsibility for the integrity and objectivity of these consolidated financial statements, as well as for various estimates and judgments used in preparing the financial statements. The management’s discussion and analysis is based on the consolidated financial statements.
1. Overview
Headquartered in Bangalore, India, Sasken is a global telecom software solutions provider offering a unique combination of complementary IP software components, research and development consultancy as well as software services to many of the leading semiconductor manufacturers, network equipment companies, and global wireless handset developers. Established in 1989, Sasken employs over 2100 people, operating from state of the art research and development centers in Bangalore and Pune in India and with offices in Canada, China, Germany, Japan, Sweden, UK and US.
Sasken is an embedded telecom solutions Company that helps businesses across the telecom value chain accelerate product development life cycles. Sasken helps clients’ speed product development through a unique combination of ready-to-use technology blocks and services. Sasken works with terminal device manufacturers, network equipment manufacturers, and semiconductor vendors to help them get to market ahead of the competition and stay focused on new product development and manufacturing. Products earn revenues in the form of one or more of licensing fees, customization fees, royalties, sub licensing fees, and fees for annual maintenance contracts. Services revenues are from fixed price contracts or contracts billed on time and material basis. Differential rates are charged for services provided from Sasken’s offices in India, vis-à-vis for services provided at customer’s site. Services provided from our own development centers being established closer to the customers are also priced differentially.
Key Highlights for the Year Ended March 31, 2005
• Sasken recommended a dividend of 30%.
• Consolidated revenues increased by 45.5%, from Rs. 16,613.01 lakhs in fiscal 2004 to Rs. 24,177.00 lakhs in fiscal 2005.
• Software Services revenue grew by 64.4%, Product revenues declined by 19.9% and the new segment Network engineering services recorded revenues of Rs. 434.00 lakhs.
• The revenue mix between Software Services, Software Products & Network Engineering Services was 84:14:2 in fiscal 2005 as against 75:25:0 in fiscal 2004.
• Royalties and sublicensing fees received from multiple product offerings.
• Consolidated Profit after Tax increased during the fiscal ended 2005 by 24.2%, from Rs. 1,833.71 lakhs to Rs. 2,278.03 lakhs.
• Net profit margins were at 9.4% in 2005 as against 11.0% in 2004.
• Consolidated basic earnings per share for fiscal 2005 was Rs. 13.94 (Rs. 12.14 – fiscal 2004) and diluted earnings per share was Rs. 13.53 (Rs. 11.54 – fiscal 2004).
• Investment in R & D increased by 40.2% to Rs. 271.78 lakhs during fiscal 2005 from Rs. 193.80 lakhs during fiscal 2004.
05050449_003_138.indd 12205050449_003_138.indd 122 5/19/05 10:44:40 PM5/19/05 10:44:40 PM
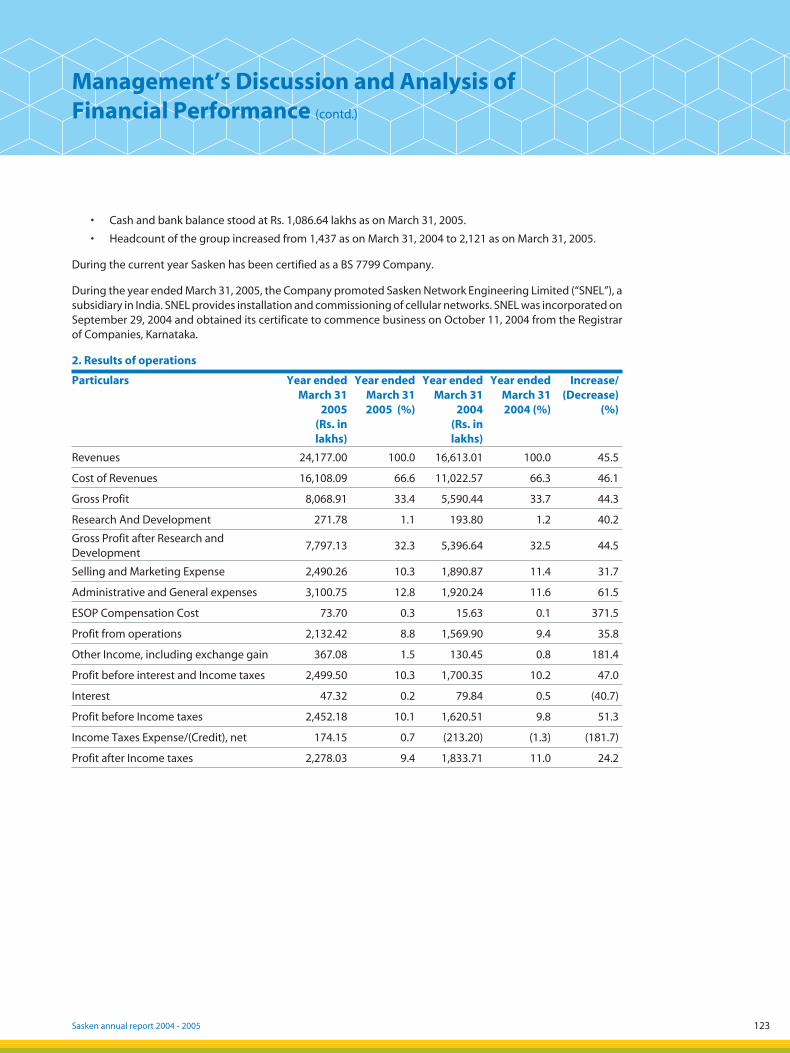
Sasken annual report 2004 - 2005 123
• Cash and bank balance stood at Rs. 1,086.64 lakhs as on March 31, 2005.
• Headcount of the group increased from 1,437 as on March 31, 2004 to 2,121 as on March 31, 2005.
During the current year Sasken has been certified as a BS 7799 Company.
During the year ended March 31, 2005, the Company promoted Sasken Network Engineering Limited (“SNEL”), a subsidiary in India. SNEL provides installation and commissioning of cellular networks. SNEL was incorporated on September 29, 2004 and obtained its certificate to commence business on October 11, 2004 from the Registrar of Companies, Karnataka.
2. Results of operations
Particulars Year ended March 31
2005(Rs. in lakhs)
Year ended March 31 2005 (%)
Year ended March 31
2004(Rs. in lakhs)
Year ended March 31 2004 (%)
Increase/(Decrease)
(%)
Revenues 24,177.00 100.0 16,613.01 100.0 45.5
Cost of Revenues 16,108.09 66.6 11,022.57 66.3 46.1
Gross Profit 8,068.91 33.4 5,590.44 33.7 44.3
Research And Development 271.78 1.1 193.80 1.2 40.2
Gross Profit after Research and Development
7,797.13 32.3 5,396.64 32.5 44.5
Selling and Marketing Expense 2,490.26 10.3 1,890.87 11.4 31.7
Administrative and General expenses 3,100.75 12.8 1,920.24 11.6 61.5
ESOP Compensation Cost 73.70 0.3 15.63 0.1 371.5
Profit from operations 2,132.42 8.8 1,569.90 9.4 35.8
Other Income, including exchange gain 367.08 1.5 130.45 0.8 181.4
Profit before interest and Income taxes 2,499.50 10.3 1,700.35 10.2 47.0
Interest 47.32 0.2 79.84 0.5 (40.7)
Profit before Income taxes 2,452.18 10.1 1,620.51 9.8 51.3
Income Taxes Expense/(Credit), net 174.15 0.7 (213.20) (1.3) (181.7)
Profit after Income taxes 2,278.03 9.4 1,833.71 11.0 24.2
Management’s Discussion and Analysis ofFinancial Performance (contd.)
05050449_003_138.indd 12305050449_003_138.indd 123 5/19/05 10:44:41 PM5/19/05 10:44:41 PM
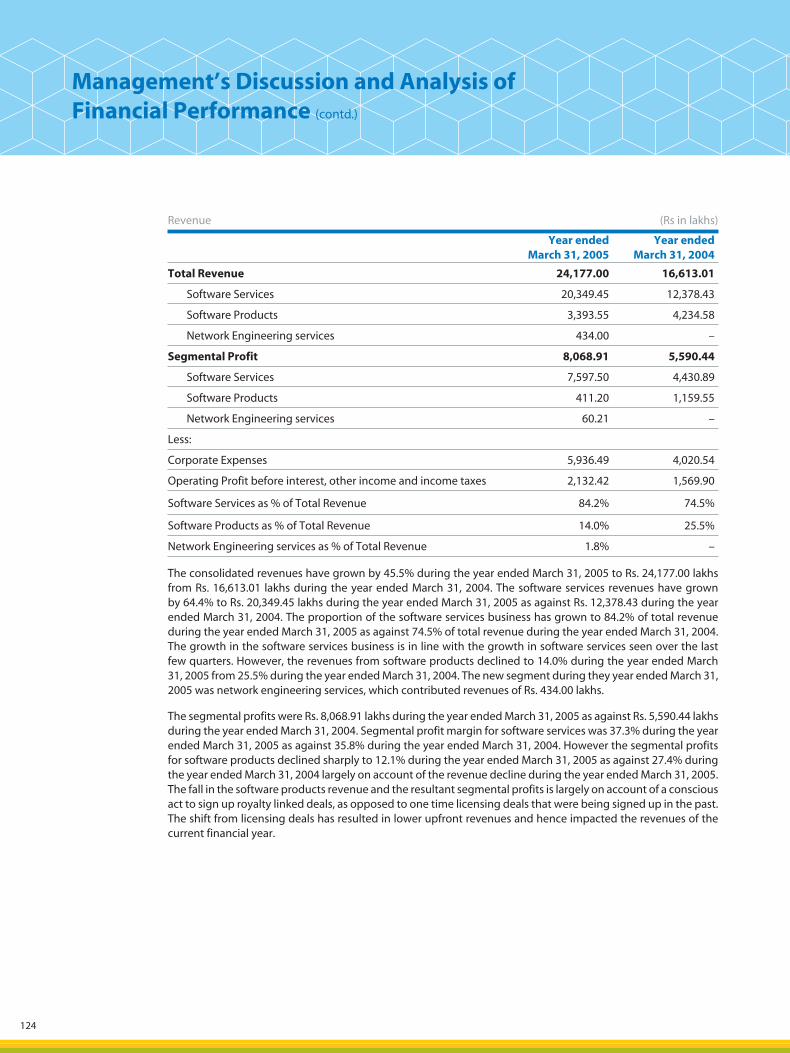
124
Revenue (Rs in lakhs)
Year ended
March 31, 2005Year ended
March 31, 2004
Total Revenue 24,177.00 16,613.01
Software Services 20,349.45 12,378.43
Software Products 3,393.55 4,234.58
Network Engineering services 434.00 –
Segmental Profit 8,068.91 5,590.44
Software Services 7,597.50 4,430.89
Software Products 411.20 1,159.55
Network Engineering services 60.21 –
Less:
Corporate Expenses 5,936.49 4,020.54
Operating Profit before interest, other income and income taxes 2,132.42 1,569.90
Software Services as % of Total Revenue 84.2% 74.5%
Software Products as % of Total Revenue 14.0% 25.5%
Network Engineering services as % of Total Revenue 1.8% –
The consolidated revenues have grown by 45.5% during the year ended March 31, 2005 to Rs. 24,177.00 lakhs from Rs. 16,613.01 lakhs during the year ended March 31, 2004. The software services revenues have grown by 64.4% to Rs. 20,349.45 lakhs during the year ended March 31, 2005 as against Rs. 12,378.43 during the year ended March 31, 2004. The proportion of the software services business has grown to 84.2% of total revenue during the year ended March 31, 2005 as against 74.5% of total revenue during the year ended March 31, 2004. The growth in the software services business is in line with the growth in software services seen over the last few quarters. However, the revenues from software products declined to 14.0% during the year ended March 31, 2005 from 25.5% during the year ended March 31, 2004. The new segment during they year ended March 31, 2005 was network engineering services, which contributed revenues of Rs. 434.00 lakhs.
The segmental profits were Rs. 8,068.91 lakhs during the year ended March 31, 2005 as against Rs. 5,590.44 lakhs during the year ended March 31, 2004. Segmental profit margin for software services was 37.3% during the year ended March 31, 2005 as against 35.8% during the year ended March 31, 2004. However the segmental profits for software products declined sharply to 12.1% during the year ended March 31, 2005 as against 27.4% during the year ended March 31, 2004 largely on account of the revenue decline during the year ended March 31, 2005. The fall in the software products revenue and the resultant segmental profits is largely on account of a conscious act to sign up royalty linked deals, as opposed to one time licensing deals that were being signed up in the past. The shift from licensing deals has resulted in lower upfront revenues and hence impacted the revenues of the current financial year.
Management’s Discussion and Analysis ofFinancial Performance (contd.)
05050449_003_138.indd 12405050449_003_138.indd 124 5/19/05 10:44:41 PM5/19/05 10:44:41 PM
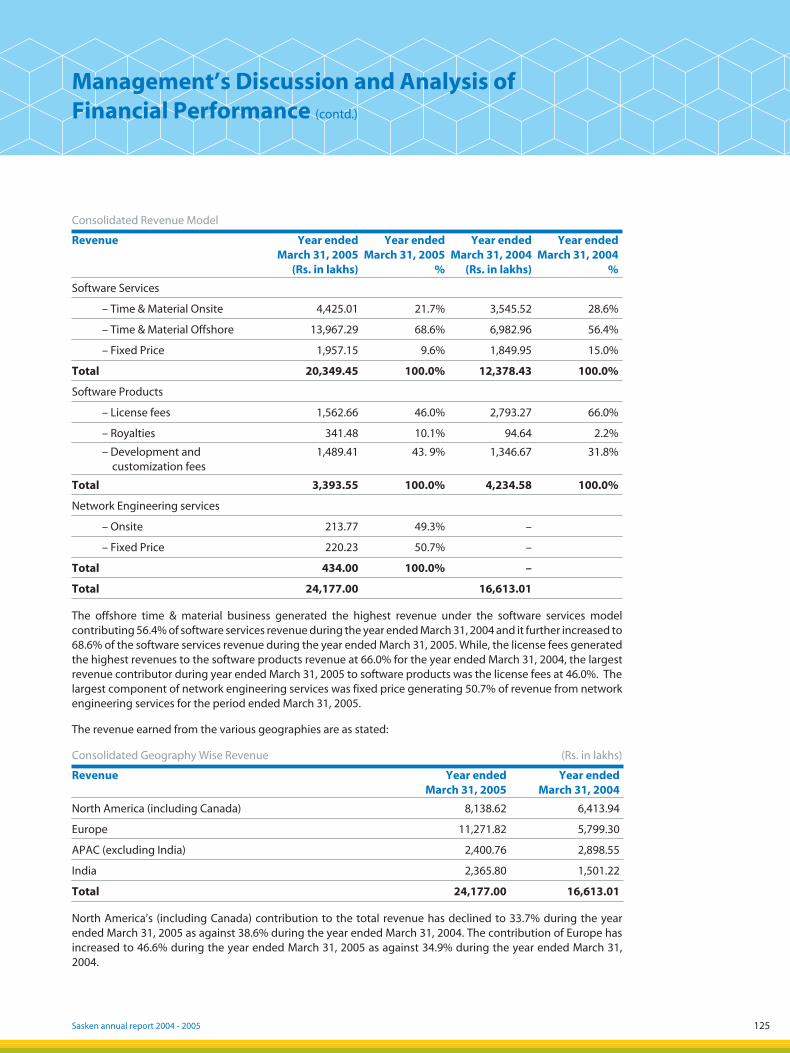
Sasken annual report 2004 - 2005 125
Consolidated Revenue Model
Revenue Year ended March 31, 2005
(Rs. in lakhs)
Year ended March 31, 2005
%
Year ended March 31, 2004
(Rs. in lakhs)
Year ended March 31, 2004
%
Software Services
– Time & Material Onsite 4,425.01 21.7% 3,545.52 28.6%
– Time & Material Offshore 13,967.29 68.6% 6,982.96 56.4%
– Fixed Price 1,957.15 9.6% 1,849.95 15.0%
Total 20,349.45 100.0% 12,378.43 100.0%
Software Products
– License fees 1,562.66 46.0% 2,793.27 66.0%
– Royalties 341.48 10.1% 94.64 2.2%
– Development and customization fees
1,489.41 43. 9% 1,346.67 31.8%
Total 3,393.55 100.0% 4,234.58 100.0%
Network Engineering services
– Onsite 213.77 49.3% –
– Fixed Price 220.23 50.7% –
Total 434.00 100.0% –
Total 24,177.00 16,613.01
The offshore time & material business generated the highest revenue under the software services model contributing 56.4% of software services revenue during the year ended March 31, 2004 and it further increased to 68.6% of the software services revenue during the year ended March 31, 2005. While, the license fees generated the highest revenues to the software products revenue at 66.0% for the year ended March 31, 2004, the largest revenue contributor during year ended March 31, 2005 to software products was the license fees at 46.0%. The largest component of network engineering services was fixed price generating 50.7% of revenue from network engineering services for the period ended March 31, 2005.
The revenue earned from the various geographies are as stated:
Consolidated Geography Wise Revenue (Rs. in lakhs)
Revenue Year ended March 31, 2005
Year ended March 31, 2004
North America (including Canada) 8,138.62 6,413.94
Europe 11,271.82 5,799.30
APAC (excluding India) 2,400.76 2,898.55
India 2,365.80 1,501.22
Total 24,177.00 16,613.01
North America’s (including Canada) contribution to the total revenue has declined to 33.7% during the year ended March 31, 2005 as against 38.6% during the year ended March 31, 2004. The contribution of Europe has increased to 46.6% during the year ended March 31, 2005 as against 34.9% during the year ended March 31, 2004.
Management’s Discussion and Analysis ofFinancial Performance (contd.)
05050449_003_138.indd 12505050449_003_138.indd 125 5/19/05 10:44:41 PM5/19/05 10:44:41 PM
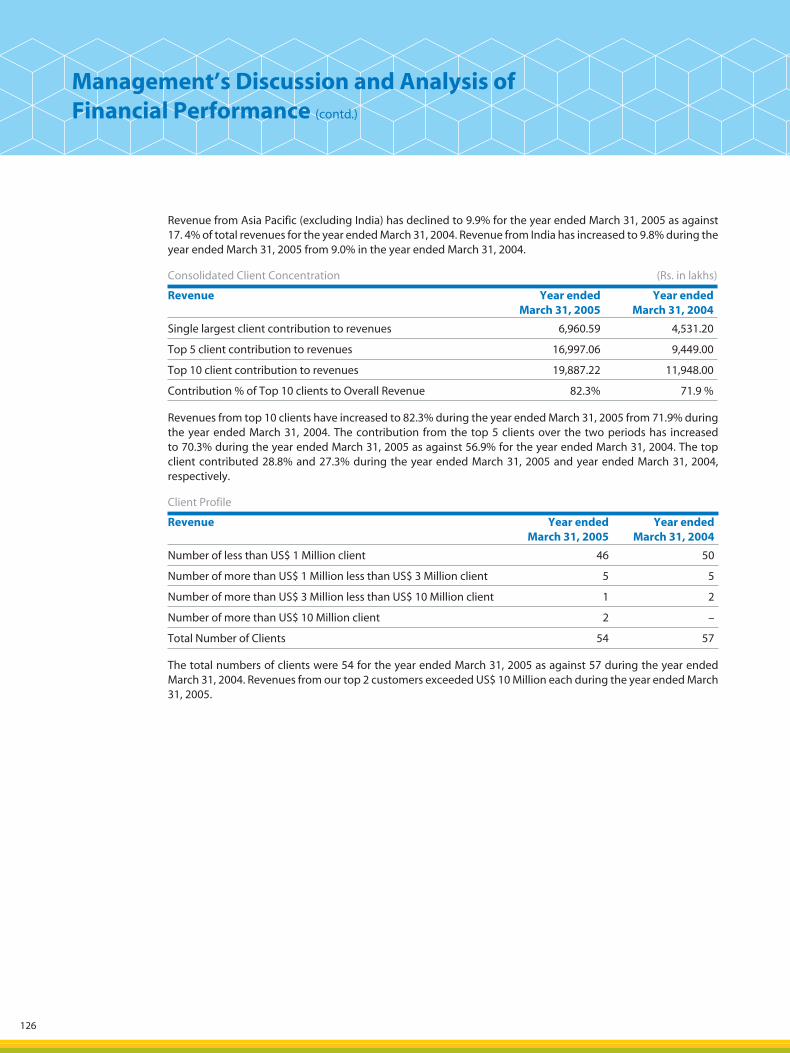
126
Revenue from Asia Pacific (excluding India) has declined to 9.9% for the year ended March 31, 2005 as against 17. 4% of total revenues for the year ended March 31, 2004. Revenue from India has increased to 9.8% during the year ended March 31, 2005 from 9.0% in the year ended March 31, 2004.
Consolidated Client Concentration (Rs. in lakhs)
Revenue Year ended March 31, 2005
Year ended March 31, 2004
Single largest client contribution to revenues 6,960.59 4,531.20
Top 5 client contribution to revenues 16,997.06 9,449.00
Top 10 client contribution to revenues 19,887.22 11,948.00
Contribution % of Top 10 clients to Overall Revenue 82.3% 71.9 %
Revenues from top 10 clients have increased to 82.3% during the year ended March 31, 2005 from 71.9% during the year ended March 31, 2004. The contribution from the top 5 clients over the two periods has increased to 70.3% during the year ended March 31, 2005 as against 56.9% for the year ended March 31, 2004. The top client contributed 28.8% and 27.3% during the year ended March 31, 2005 and year ended March 31, 2004, respectively.
Client Profile
Revenue Year endedMarch 31, 2005
Year ended March 31, 2004
Number of less than US$ 1 Million client 46 50
Number of more than US$ 1 Million less than US$ 3 Million client 5 5
Number of more than US$ 3 Million less than US$ 10 Million client 1 2
Number of more than US$ 10 Million client 2 –
Total Number of Clients 54 57
The total numbers of clients were 54 for the year ended March 31, 2005 as against 57 during the year ended March 31, 2004. Revenues from our top 2 customers exceeded US$ 10 Million each during the year ended March 31, 2005.
Management’s Discussion and Analysis ofFinancial Performance (contd.)
05050449_003_138.indd 12605050449_003_138.indd 126 5/19/05 10:44:41 PM5/19/05 10:44:41 PM

Sasken annual report 2004 - 2005 127
2.2 Cost of Revenues
Cost of revenues comprise of costs incurred by the business units and operating costs allocated to the business unit, based on the related utilization by each of the segments.
Particulars Year ended March 31
2005(Rs. in lakhs)
Year endedMarch 312005 (% of Total
Revenue)
Year ended March 31
2004(Rs. in lakhs)
Year ended March 31
2004 (% of Total
Revenue)
Increase/(Decrease)
(%)
Cost of Revenues 16,108.09 66.6 11,022.57 66.3 46.1
Employment Costs 11,109.62 46.0 7,418.85 44.7 49.7
Staff Welfare 174.51 0.7 117.70 0.7 48.3
Recruitment and Relocation 311.06 1.3 188.81 1.1 64.7
Rent 591.18 2.4 52.75 0.3 1,020.7
Repairs and Maintenance 473.48 2.0 258.59 1.6 83.1
Communication Expenses 207.77 0.9 85.58 0.5 142.8
Travel Expenses 763.23 3.2 540.86 3.3 41.1
Electricity and Water Charges 297.49 1.2 203.30 1.2 46.3
Professional, Legal & Consultancy Charges
613.72 2.5 357.12 2.1 71.9
Depreciation 1,137.5 4.7 1,052.17 6.3 8.1
Software Charges 172.33 0.7 73.51 0.4 134.4
Training and Conference 101.31 0.4 44.05 0.3 130.0
Warranty Expenses (1.48) (0.0) (23.10) (0.1) (93.6)
Miscellaneous 6.12 0.0 – – 100.0
Amortization (Net of capitalization)
115.03 0.5 461.37 2.8 (75.1)
Movement in Work In progress 35.22 0.1 191.01 1.1 (81.6)
Cost of revenues increased to Rs. 16,108.09 lakhs during the year ended March 31, 2005 from Rs. 11,022.57 lakhs during the year ended March 31, 2004, an increase of 46.1%, and Rs. 5,085.52 lakhs in absolute terms.
Employments costs have increased by Rs. 3,690.77 lakhs during the year ended March 31, 2005, the increase of 49.7% in fiscal 2005 over fiscal 2004 was on account of increase in headcount, annual increments & increase in the quantum of on-site work.
The increase in recruitment and relocation by Rs. 122.25 lakhs was due to increased recruitments during the year.
The increase in rent by Rs. 538.43 lakhs was mainly on account of additional facilities taken on lease in Bangalore and new facility taken in Pune during fiscal 2005, as compared with fiscal 2004, when a large part of the operations were carried out from owned facilities.
Staff welfare increased due to increase in headcount during the year.
Management’s Discussion and Analysis ofFinancial Performance (contd.)
05050449_003_138.indd 12705050449_003_138.indd 127 5/19/05 10:44:42 PM5/19/05 10:44:42 PM
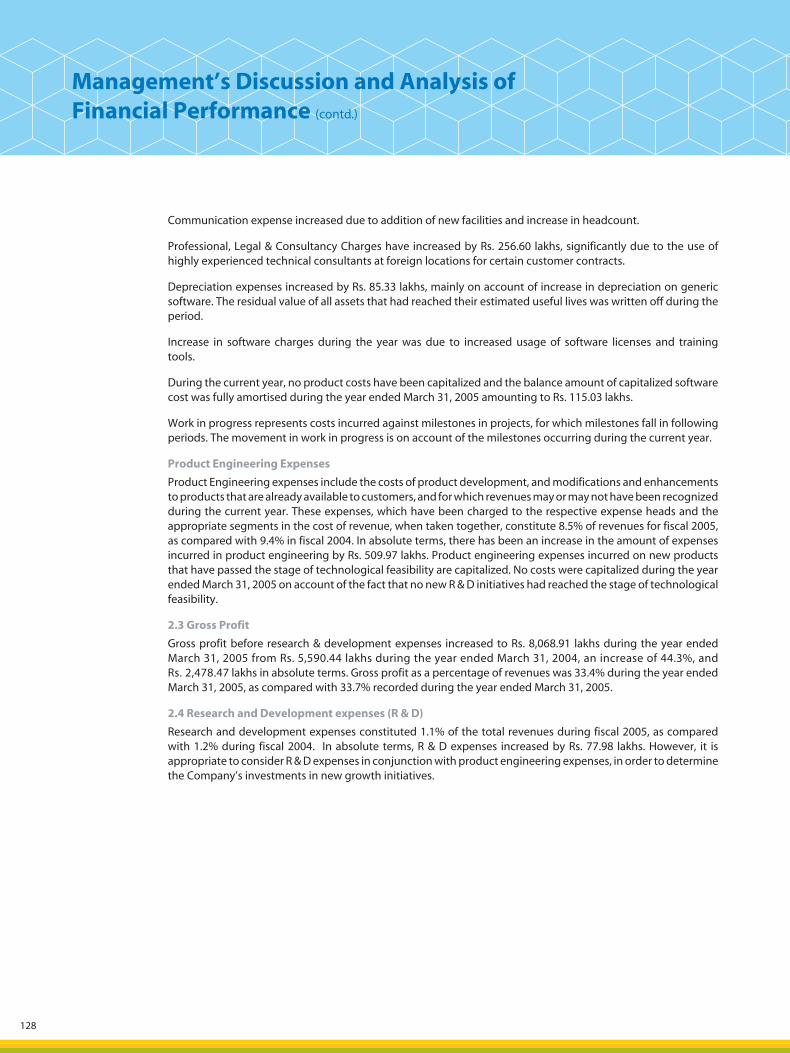
128
Communication expense increased due to addition of new facilities and increase in headcount.
Professional, Legal & Consultancy Charges have increased by Rs. 256.60 lakhs, significantly due to the use of highly experienced technical consultants at foreign locations for certain customer contracts.
Depreciation expenses increased by Rs. 85.33 lakhs, mainly on account of increase in depreciation on generic software. The residual value of all assets that had reached their estimated useful lives was written off during the period.
Increase in software charges during the year was due to increased usage of software licenses and training tools.
During the current year, no product costs have been capitalized and the balance amount of capitalized software cost was fully amortised during the year ended March 31, 2005 amounting to Rs. 115.03 lakhs.
Work in progress represents costs incurred against milestones in projects, for which milestones fall in following periods. The movement in work in progress is on account of the milestones occurring during the current year.
Product Engineering Expenses
Product Engineering expenses include the costs of product development, and modifications and enhancements to products that are already available to customers, and for which revenues may or may not have been recognized during the current year. These expenses, which have been charged to the respective expense heads and the appropriate segments in the cost of revenue, when taken together, constitute 8.5% of revenues for fiscal 2005, as compared with 9.4% in fiscal 2004. In absolute terms, there has been an increase in the amount of expenses incurred in product engineering by Rs. 509.97 lakhs. Product engineering expenses incurred on new products that have passed the stage of technological feasibility are capitalized. No costs were capitalized during the year ended March 31, 2005 on account of the fact that no new R & D initiatives had reached the stage of technological feasibility.
2.3 Gross Profit
Gross profit before research & development expenses increased to Rs. 8,068.91 lakhs during the year ended March 31, 2005 from Rs. 5,590.44 lakhs during the year ended March 31, 2004, an increase of 44.3%, and Rs. 2,478.47 lakhs in absolute terms. Gross profit as a percentage of revenues was 33.4% during the year ended March 31, 2005, as compared with 33.7% recorded during the year ended March 31, 2005.
2.4 Research and Development expenses (R & D)
Research and development expenses constituted 1.1% of the total revenues during fiscal 2005, as compared with 1.2% during fiscal 2004. In absolute terms, R & D expenses increased by Rs. 77.98 lakhs. However, it is appropriate to consider R & D expenses in conjunction with product engineering expenses, in order to determine the Company’s investments in new growth initiatives.
Management’s Discussion and Analysis ofFinancial Performance (contd.)
05050449_003_138.indd 12805050449_003_138.indd 128 5/19/05 10:44:42 PM5/19/05 10:44:42 PM
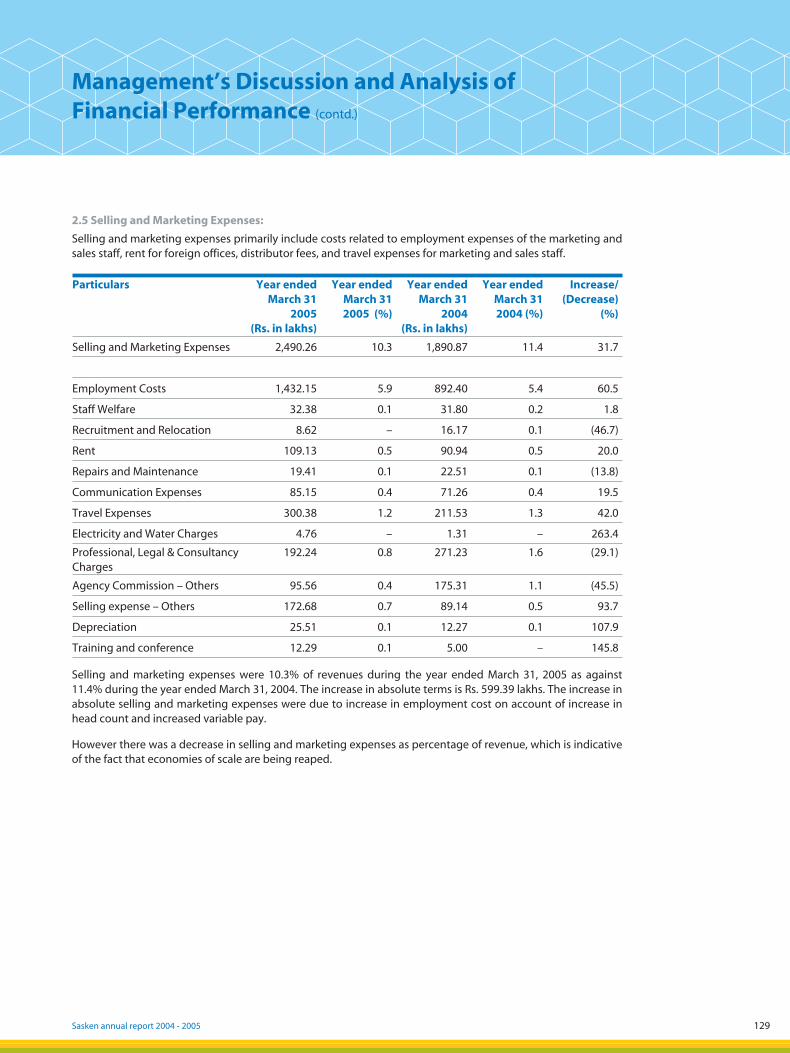
Sasken annual report 2004 - 2005 129
2.5 Selling and Marketing Expenses:
Selling and marketing expenses primarily include costs related to employment expenses of the marketing and sales staff, rent for foreign offices, distributor fees, and travel expenses for marketing and sales staff.
Particulars Year ended March 31
2005(Rs. in lakhs)
Year ended March 31 2005 (%)
Year ended March 31
2004(Rs. in lakhs)
Year ended March 31 2004 (%)
Increase/(Decrease)
(%)
Selling and Marketing Expenses 2,490.26 10.3 1,890.87 11.4 31.7
Employment Costs 1,432.15 5.9 892.40 5.4 60.5
Staff Welfare 32.38 0.1 31.80 0.2 1.8
Recruitment and Relocation 8.62 – 16.17 0.1 (46.7)
Rent 109.13 0.5 90.94 0.5 20.0
Repairs and Maintenance 19.41 0.1 22.51 0.1 (13.8)
Communication Expenses 85.15 0.4 71.26 0.4 19.5
Travel Expenses 300.38 1.2 211.53 1.3 42.0
Electricity and Water Charges 4.76 – 1.31 – 263.4
Professional, Legal & Consultancy Charges
192.24 0.8 271.23 1.6 (29.1)
Agency Commission – Others 95.56 0.4 175.31 1.1 (45.5)
Selling expense – Others 172.68 0.7 89.14 0.5 93.7
Depreciation 25.51 0.1 12.27 0.1 107.9
Training and conference 12.29 0.1 5.00 – 145.8
Selling and marketing expenses were 10.3% of revenues during the year ended March 31, 2005 as against 11.4% during the year ended March 31, 2004. The increase in absolute terms is Rs. 599.39 lakhs. The increase in absolute selling and marketing expenses were due to increase in employment cost on account of increase in head count and increased variable pay.
However there was a decrease in selling and marketing expenses as percentage of revenue, which is indicative of the fact that economies of scale are being reaped.
Management’s Discussion and Analysis ofFinancial Performance (contd.)
05050449_003_138.indd 12905050449_003_138.indd 129 5/19/05 10:44:42 PM5/19/05 10:44:42 PM
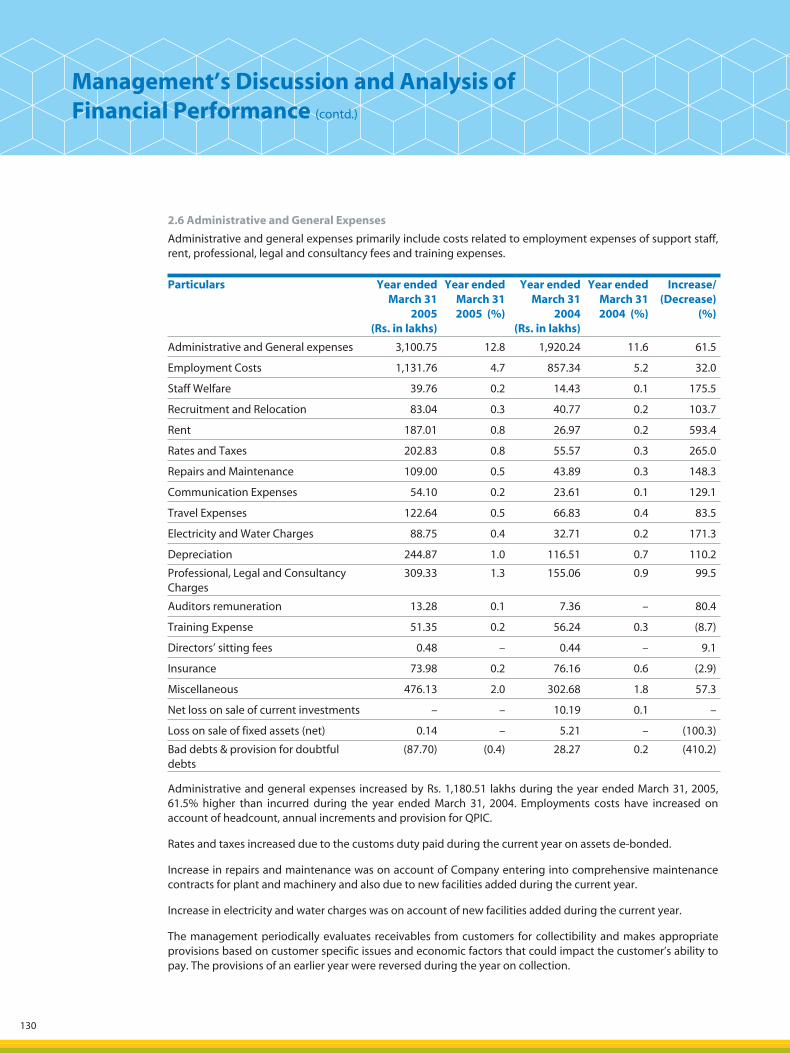
130
2.6 Administrative and General Expenses
Administrative and general expenses primarily include costs related to employment expenses of support staff, rent, professional, legal and consultancy fees and training expenses.
Particulars Year ended March 31
2005(Rs. in lakhs)
Year ended March 31 2005 (%)
Year ended March 31
2004(Rs. in lakhs)
Year ended March 31 2004 (%)
Increase/(Decrease)
(%)
Administrative and General expenses 3,100.75 12.8 1,920.24 11.6 61.5
Employment Costs 1,131.76 4.7 857.34 5.2 32.0
Staff Welfare 39.76 0.2 14.43 0.1 175.5
Recruitment and Relocation 83.04 0.3 40.77 0.2 103.7
Rent 187.01 0.8 26.97 0.2 593.4
Rates and Taxes 202.83 0.8 55.57 0.3 265.0
Repairs and Maintenance 109.00 0.5 43.89 0.3 148.3
Communication Expenses 54.10 0.2 23.61 0.1 129.1
Travel Expenses 122.64 0.5 66.83 0.4 83.5
Electricity and Water Charges 88.75 0.4 32.71 0.2 171.3
Depreciation 244.87 1.0 116.51 0.7 110.2
Professional, Legal and Consultancy Charges
309.33 1.3 155.06 0.9 99.5
Auditors remuneration 13.28 0.1 7.36 – 80.4
Training Expense 51.35 0.2 56.24 0.3 (8.7)
Directors’ sitting fees 0.48 – 0.44 – 9.1
Insurance 73.98 0.2 76.16 0.6 (2.9)
Miscellaneous 476.13 2.0 302.68 1.8 57.3
Net loss on sale of current investments – – 10.19 0.1 –
Loss on sale of fixed assets (net) 0.14 – 5.21 – (100.3)
Bad debts & provision for doubtful debts
(87.70) (0.4) 28.27 0.2 (410.2)
Administrative and general expenses increased by Rs. 1,180.51 lakhs during the year ended March 31, 2005, 61.5% higher than incurred during the year ended March 31, 2004. Employments costs have increased on account of headcount, annual increments and provision for QPIC.
Rates and taxes increased due to the customs duty paid during the current year on assets de-bonded.
Increase in repairs and maintenance was on account of Company entering into comprehensive maintenance contracts for plant and machinery and also due to new facilities added during the current year.
Increase in electricity and water charges was on account of new facilities added during the current year.
The management periodically evaluates receivables from customers for collectibility and makes appropriate provisions based on customer specific issues and economic factors that could impact the customer’s ability to pay. The provisions of an earlier year were reversed during the year on collection.
Management’s Discussion and Analysis ofFinancial Performance (contd.)
05050449_003_138.indd 13005050449_003_138.indd 130 5/19/05 10:44:43 PM5/19/05 10:44:43 PM
Sasken annual report 2004 - 2005 131
2.7 Employee Stock Compensation Cost
During the year the Company issued 1,395,723 stock options to employees at prices ranging between Rs. 160-256 per option. The Company accounts for stock compensation expenses based on the fair value of the options granted on the date of grant. Rs. 73.70 lakhs was the compensation cost charged to profits during the year ended March 31, 2005.
2. 8 Profit from Operations
Profit from operations for the year ended March 31, 2005 was Rs. 2,132.42 lakhs as compared with Rs. 1,569.90 lakhs earned during the year ended March 31, 2004. The profit from operations as percentage of revenue was 8.7% during fiscal 2005 as against 9.4% reported for fiscal 2004.
2.9 Other Income
Other income amounted to Rs. 367.08 lakhs and Rs. 130.45 lakhs, constituted 1.6% and 0.8%, of total revenues during the year ended March 31, 2005 and during the year ended March 31, 2004 respectively. The increase of Rs. 136.47 lakhs during the year ended March 31, 2005 was mainly on account of change in accounting policy for forward contracts entered into to hedge the foreign currency risk of the underlying assets at the balance sheet date, in order to comply with the provisions of the newly introduced Accounting Standard on the subject. There has also been a substantial increase in the gain on forward contract utilization.
2.10 Profit before interest and income taxes
Profit before interest and income taxes was at 10.3% of revenues, amounted to Rs. 2,499.50 lakhs during the year ended March 31, 2005, as against 10.2% of revenues amounting to Rs. 1,700.35 lakhs during the year ended March 31, 2004. The corresponding increase over the previous year was 47.0%.
2.11 Interest
Interest expenses charged to profits decreased by Rs. 32.52 lakhs to Rs. 47.32 lakhs during the year ended March 31, 2005 from Rs. 79.84 lakhs during the year ended March 31, 2004, a decrease of 40.7%. Interest represented 0.2% of revenues during fiscal 2005 and 0.5% of revenues during fiscal 2004. The decrease was on account of inflow from the equity issue on exercise of certain warrants and efficiencies in the use of bank credit for working capital purposes.
2.12 Income taxes
Income tax expense was 0.7% of revenues during fiscal 2005, while the income tax fiscal 2004 was a credit of 1.3%. The tax refunds received during the current year were much lower than those received during fiscal 2004. Additionally, the extent of business carried out in India for our customers saw an increase, leading to a higher domestic tax incidence.
2.13 Profit after tax
During the year ended March 31, 2005 the group posted a profit of Rs. 2,278.03 lakhs as against a profit of Rs. 1,833.71 lakhs during the year ended March 31, 2004 an increase of 24.2%. This represents 9.4% and 11.0% of revenues during fiscal 2005 and 2004 respectively.
3 Financial condition
3.1. Share capital
The issued capital increased to Rs. 1,684.72 lakhs during fiscal 2005 from Rs. 1,561.09 lakhs during fiscal 2004. During the fiscal 16.33 lakh shares (pre-consolidation 32.67 lakh shares of Rs. 5 each) of face value of Rs. 10 each were allotted to a strategic investor on exercise of the warrants held by them. Further 0.53 lakhs shares of Rs. 10 each at a premium of Rs. 70 were issued to the employees under the ESOP Scheme.
At present the Company has only one class of shares - equity shares of par value Rs. 10 each. A consolidation of shares was effected during July 2004 whereby one share of Rs. 10 was issued for every two shares of Rs. 5. During
Management’s Discussion and Analysis ofFinancial Performance (contd.)
9
05050449_003_138.indd 13105050449_003_138.indd 131 5/19/05 10:44:43 PM5/19/05 10:44:43 PM
132
the year ended March 31, 2005 the authorized share capital of the Company has been increased by Rs. 1,000.00 lakhs, which comprises of 100 lakhs equity shares of Rs. 10 each. The total authorized share capital of the Company as of March 31, 2005 is Rs. 3,500.00 lakhs divided into 350 lakhs equity shares of Rs. 10 each.
3.2 Reserves and Surplus
Reserves and Surplus as at March 31, 2005 was Rs. 12,483.59 lakhs, as compared with Rs. 9,858.70 lakhs as at March 31, 2004.
Share Premium
Share premium as at March 31, 2005 was Rs. 6,133.79 lakhs, as compared with Rs. 5,273.93 lakhs as at March 31, 2004.
The balance in the share premium increased by Rs. 859.86 lakhs, on account of allotment of 16.33 lakh shares of Rs. 10 each (pre-consolidation 32.67 lakhs shares at a premium of Rs. 25 per share) on exercise of warrants, at a premium at Rs. 50 per share and on account of the premium received on 0.53 lakh shares issued at a premium of Rs. 70 to employees on exercise of their options.
General reserve
During the year ended March 31, 2005 there was an addition of Rs. 216.98 lakhs due to the transfer of 10% of the profits after tax in line with the provisions of The Companies (Transfer of Profits To Reserves) Rules, 1975 for declaration of dividends in excess of 20%.
The Profit and Loss Account Balance has increased by Rs. 1,484.75 lakhs after appropriations on account of the profits generated during the year ended March 31, 2005.
The employee stock option outstanding (Net of Deferred Compensation Cost) represents the amount charged to the profit and loss account towards employee stock option compensation cost. The Company issued 1,395,723 options during the year to its employees under the ESOP 2000 scheme. The net increase in the employee stock option outstanding account was Rs. 63.30 lakhs for the year ended March 31, 2005.
3.3 Secured Loans
Secured Loans as at March 31, 2005 were Rs. 45.03 lakhs as against Rs. 42.68 lakhs as at March 31, 2004. The packing credit balance is down to Rs. 45.03 lakhs (against a sanctioned limit of Rs. 2,500 lakhs), the maximum amount utilized during the year was Rs. 1,805.14 lakhs. Further the Company has not borrowed any loans during the year, apart from continuing with the packing credit facility it has with its scheduled banks. The limit on non-fund based facilities is Rs. 500.00 lakhs against which the Company has utilized Rs. 133.33 lakhs during the year ended March 31, 2005.
3.4 Unsecured Loans
The unsecured Loans as at March 31, 2005 was Rs. 100.56 lakhs obtained through a cash credit facility from a scheduled bank by one of the subsidiaries.
3.5 Fixed Assets
Net Fixed Assets including capital work-in-progress represent 61.2% of the total assets as at March 31, 2005 as against 68.36% as at March 31 2004. Accumulated depreciation as a % of Gross block was 45.73% as at March 31 2005 as against 43.47% as at March 31, 2004.
During the year the Company invested Rs. 2,428.14 lakhs in assets as against Rs. 678.61 lakhs during the year ended March 31, 2004, with the significant increase being in computers, furniture and fixtures and office equipments. These additions were due to the setting up of new leased facilities and the increase in headcount over the fiscal 2005.
Management’s Discussion and Analysis ofFinancial Performance (contd.)
05050449_003_138.indd 13205050449_003_138.indd 132 5/19/05 10:44:43 PM5/19/05 10:44:43 PM
Sasken annual report 2004 - 2005 133
Deletions of fixed assets of Rs. 1.84 lakhs and Rs. 233.21 lakhs during fiscal 2005 and 2004 respectively, represent the assets that were sold, and those written off, since they were obsolete or those that have outlived their useful life.
The capital work in progress represents advances paid towards acquisition of fixed assets and the cost of assets not put to use. It reduced to Rs. 77.41 lakhs as at March 31 2005 as against Rs. 117.81 lakhs as at March 31 2004.
As on March 31 2005, the contracts remaining to be executed on capital account (net of advances) amounted to Rs. 82.15 lakhs as against Rs. 632.65 lakhs as at March 31, 2004. The decrease is due to the completion of the work undertaken at new leased facilities that were outstanding as of March 31, 2004.
3.6 Capitalized software product costs
The capitalized software costs amounting to Rs. 115.03 lakhs were fully amortized during the year ended March 31, 2005 in line with the consistent method of amortization based on the estimated life of the product line. During the year, no product development expenses were capitalized, since none of the initiatives reached technological feasibility during the year.
3.7 Investments
Investments represent 0.4% of the total assets as at March 31, 2005 as against 2.3% as at March 31, 2004.
The long-term non-trade investments have remained unchanged as of March 31, 2005 at Rs. 14.75 lakhs. An amount of Rs. 41.20 lakhs has been invested with a mutual fund.
The current non-trade portion of investments represents 73.64% of total investments during the year ended March 31, 2005 as against 94.42% during the year ended March 31, 2004. The reduction of Rs. 208.34 lakhs in current non-trade investments was largely on account of investments in fixed assets. The Company invests surplus funds in highly rated mutual fund papers, considering safety & liquidity as the key determinants for the investment in a fund.
3.8 Inventories
Inventories represent 0.1% of the total assets as on March 31, 2005 as against 0.5% as on March 31 2004. As a % of current assets inventories constitute 0.2% as at March 31, 2005 and 1.0% as at March 31, 2004.
Costs related to milestones that have not been met, are reported as Inventories. The decrease in absolute terms is Rs. 35.22 lakhs.
3.9 Sundry Debtors
Sundry Debtors (Net of provision for doubtful debts) represent 37.7% of the total assets as at March 31 2005 as against 29.5% as at March 31, 2004.
Management’s Discussion and Analysis ofFinancial Performance (contd.)
05050449_003_138.indd 13305050449_003_138.indd 133 5/19/05 10:44:43 PM5/19/05 10:44:43 PM
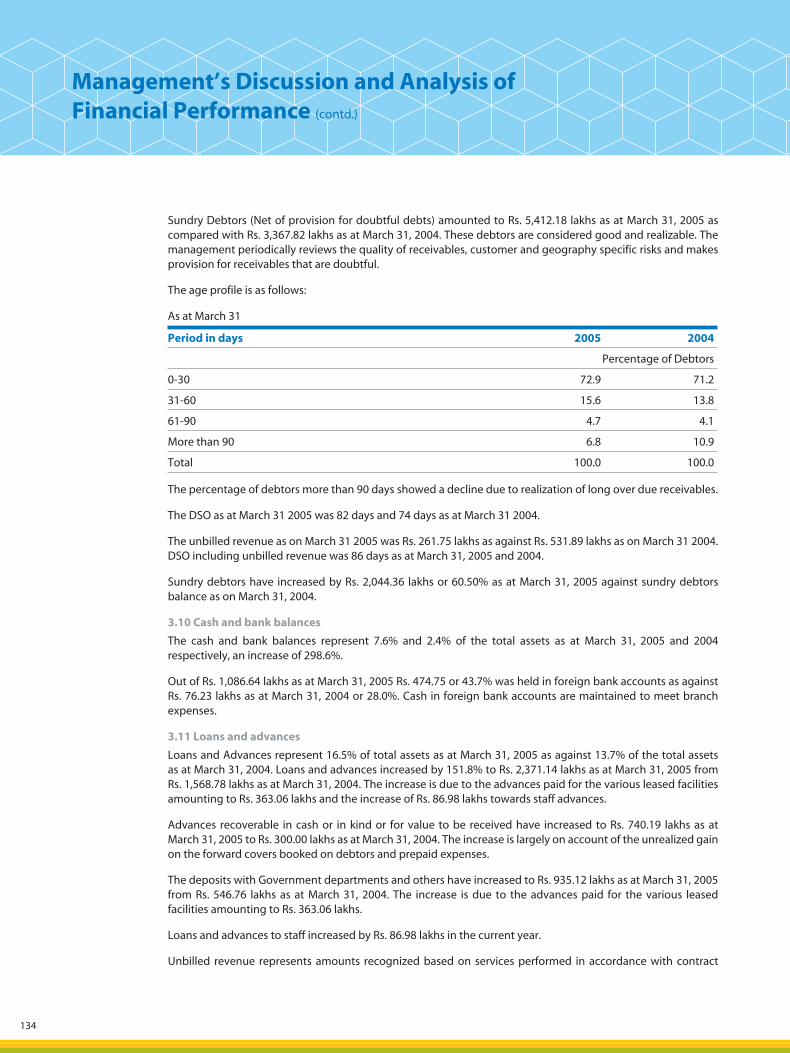
134
Sundry Debtors (Net of provision for doubtful debts) amounted to Rs. 5,412.18 lakhs as at March 31, 2005 as compared with Rs. 3,367.82 lakhs as at March 31, 2004. These debtors are considered good and realizable. The management periodically reviews the quality of receivables, customer and geography specific risks and makes provision for receivables that are doubtful.
The age profile is as follows:
As at March 31
Period in days 2005 2004
Percentage of Debtors
0-30 72.9 71.2
31-60 15.6 13.8
61-90 4.7 4.1
More than 90 6.8 10.9
Total 100.0 100.0
The percentage of debtors more than 90 days showed a decline due to realization of long over due receivables.
The DSO as at March 31 2005 was 82 days and 74 days as at March 31 2004.
The unbilled revenue as on March 31 2005 was Rs. 261.75 lakhs as against Rs. 531.89 lakhs as on March 31 2004. DSO including unbilled revenue was 86 days as at March 31, 2005 and 2004.
Sundry debtors have increased by Rs. 2,044.36 lakhs or 60.50% as at March 31, 2005 against sundry debtors balance as on March 31, 2004.
3.10 Cash and bank balances
The cash and bank balances represent 7.6% and 2.4% of the total assets as at March 31, 2005 and 2004 respectively, an increase of 298.6%.
Out of Rs. 1,086.64 lakhs as at March 31, 2005 Rs. 474.75 or 43.7% was held in foreign bank accounts as against Rs. 76.23 lakhs as at March 31, 2004 or 28.0%. Cash in foreign bank accounts are maintained to meet branch expenses.
3.11 Loans and advances
Loans and Advances represent 16.5% of total assets as at March 31, 2005 as against 13.7% of the total assets as at March 31, 2004. Loans and advances increased by 151.8% to Rs. 2,371.14 lakhs as at March 31, 2005 from Rs. 1,568.78 lakhs as at March 31, 2004. The increase is due to the advances paid for the various leased facilities amounting to Rs. 363.06 lakhs and the increase of Rs. 86.98 lakhs towards staff advances.
Advances recoverable in cash or in kind or for value to be received have increased to Rs. 740.19 lakhs as atMarch 31, 2005 to Rs. 300.00 lakhs as at March 31, 2004. The increase is largely on account of the unrealized gain on the forward covers booked on debtors and prepaid expenses.
The deposits with Government departments and others have increased to Rs. 935.12 lakhs as at March 31, 2005 from Rs. 546.76 lakhs as at March 31, 2004. The increase is due to the advances paid for the various leased facilities amounting to Rs. 363.06 lakhs.
Loans and advances to staff increased by Rs. 86.98 lakhs in the current year.
Unbilled revenue represents amounts recognized based on services performed in accordance with contract
Management’s Discussion and Analysis ofFinancial Performance (contd.)
05050449_003_138.indd 13405050449_003_138.indd 134 5/19/05 10:44:44 PM5/19/05 10:44:44 PM
Sasken annual report 2004 - 2005 135
terms and where billing is pending for any reason. Unbilled revenue reduced to Rs. 261.75 lakhs as at March 31, 2005 as against Rs. 531.89 lakhs as at March 31, 2004.
Advance tax of Rs. 109.13 lakhs was towards taxes deducted on domestic income and the withholding taxes for overseas revenue.
3.12 Current liabilities and provisions
Current Liabilities and provisions represent 23.6% and 17.8% of total assets as at March 31, 2005 and March 31, 2004 respectively, an increase of 66.9% or Rs. 1,348.85 lakhs. This increase is significantly due to creditors for goods and services, deferred revenue, advance received from customers, equity dividend and provision for gratuity.
Sundry creditors represent the amount payable to vendors/employees for the supply of goods or for services rendered. These dues constituted 10.9% and 9.7% of the total assets as at March 31, 2005 and March 31, 2004 respectively, which is an increase of 41.2%.
The other liabilities increased by Rs. 255.00 lakhs during the year ended March 31, 2005 over the year ended March 31, 2004. The other liabilities include statutory payments like TDS, PF and others, for the month of March 2005 which are payable on various dates in April 2005.
The deferred revenue constituted 1.4% and 0.4% of total assets as at March 31, 2005 and March 31, 2004 respectively. The increase of Rs. 152.79 lakhs was largely on account of revenues deferred based on possible schedule overruns
Advances received from customers denote monies received, for services yet to be rendered, such advances constitute 1.8% and 0.5% of the total assets as at March 31, 2005 and March 31, 2004 respectively, an increase of Rs. 199.70 lakhs. This was due to completion of milestones against which customers made advance payments.
A dividend of 30% on the paid up capital (Subject to shareholders approval at the AGM) along with the dividend distribution tax has been provided during the year ended March 31, 2005.
Leave encashment provision has been created based on actuarial valuation for fiscal 2005 and fiscal 2004.
The Company creates a warranty provision towards estimated expenses in servicing the contracted warranty obligations towards customers. The warranty provision is reviewed periodically and if the contractual warranty period expires or warranty efforts are expended, the provisions for the specific warranty is reversed.
The Company contributes to a Group Gratuity Scheme, administered by a private life insurance Company. The contributions are charged to the Profit and Loss account. Provision of Rs. 113.04 lakhs represents the difference between the actuarial valuation and the funded balance as at the year-end. The increase was on account of increased headcount and the removal of the ceiling on gratuity payable per employee.
4. Cash Flow
The net cash from operating activities was Rs. 2,291.07 lakhs during the year ended March 31, 2005 as againstRs. 2,594.82 lakhs during the year ended March 31, 2004. There was a reduction of Rs. 303.75 lakhs during the year ended March 31, 2005 as result of increase in debtors and taxes paid.
The inflow on account of operating profits before working capital changes was Rs. 3,800.12 lakhs during the year ended March 31, 2005 as against Rs. 3,347.33 lakhs during the year ended March 31, 2004 an increase of Rs. 452.79 lakhs. The increase was mainly on account of higher profits before taxes, lower amortization of software costs and unrealized foreign exchange component, compared with that of the previous year. The outflow on account of working capital was Rs. 1,235.72 lakhs for the year ended March 31, 2005 as against an outflow of Rs. 875.04 lakhs during the year ended March 31, 2004.
Management’s Discussion and Analysis ofFinancial Performance (contd.)
05050449_003_138.indd 13505050449_003_138.indd 135 5/19/05 10:44:44 PM5/19/05 10:44:44 PM
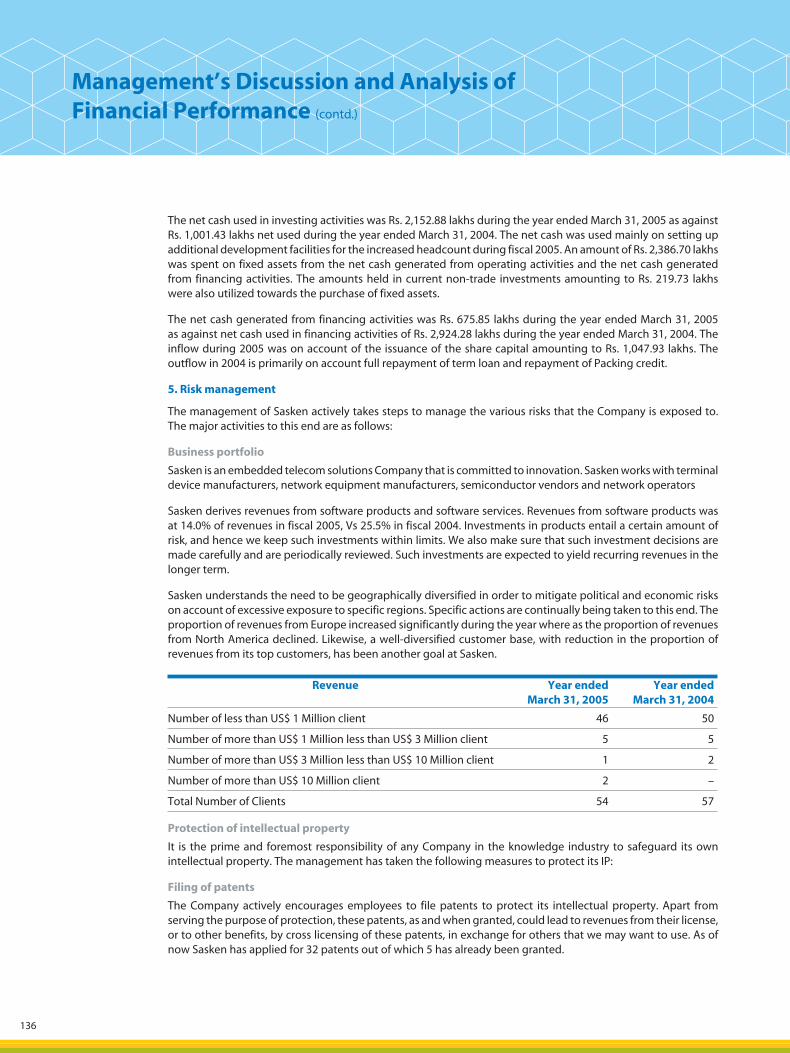
136
The net cash used in investing activities was Rs. 2,152.88 lakhs during the year ended March 31, 2005 as against Rs. 1,001.43 lakhs net used during the year ended March 31, 2004. The net cash was used mainly on setting up additional development facilities for the increased headcount during fiscal 2005. An amount of Rs. 2,386.70 lakhs was spent on fixed assets from the net cash generated from operating activities and the net cash generated from financing activities. The amounts held in current non-trade investments amounting to Rs. 219.73 lakhs were also utilized towards the purchase of fixed assets.
The net cash generated from financing activities was Rs. 675.85 lakhs during the year ended March 31, 2005 as against net cash used in financing activities of Rs. 2,924.28 lakhs during the year ended March 31, 2004. The inflow during 2005 was on account of the issuance of the share capital amounting to Rs. 1,047.93 lakhs. The outflow in 2004 is primarily on account full repayment of term loan and repayment of Packing credit.
5. Risk management
The management of Sasken actively takes steps to manage the various risks that the Company is exposed to. The major activities to this end are as follows:
Business portfolio
Sasken is an embedded telecom solutions Company that is committed to innovation. Sasken works with terminal device manufacturers, network equipment manufacturers, semiconductor vendors and network operators
Sasken derives revenues from software products and software services. Revenues from software products was at 14.0% of revenues in fiscal 2005, Vs 25.5% in fiscal 2004. Investments in products entail a certain amount of risk, and hence we keep such investments within limits. We also make sure that such investment decisions are made carefully and are periodically reviewed. Such investments are expected to yield recurring revenues in the longer term.
Sasken understands the need to be geographically diversified in order to mitigate political and economic risks on account of excessive exposure to specific regions. Specific actions are continually being taken to this end. The proportion of revenues from Europe increased significantly during the year where as the proportion of revenues from North America declined. Likewise, a well-diversified customer base, with reduction in the proportion of revenues from its top customers, has been another goal at Sasken.
Revenue Year ended March 31, 2005
Year ended March 31, 2004
Number of less than US$ 1 Million client 46 50
Number of more than US$ 1 Million less than US$ 3 Million client 5 5
Number of more than US$ 3 Million less than US$ 10 Million client 1 2
Number of more than US$ 10 Million client 2 –
Total Number of Clients 54 57
Protection of intellectual property
It is the prime and foremost responsibility of any Company in the knowledge industry to safeguard its own intellectual property. The management has taken the following measures to protect its IP:
Filing of patents
The Company actively encourages employees to file patents to protect its intellectual property. Apart from serving the purpose of protection, these patents, as and when granted, could lead to revenues from their license, or to other benefits, by cross licensing of these patents, in exchange for others that we may want to use. As of now Sasken has applied for 32 patents out of which 5 has already been granted.
Management’s Discussion and Analysis ofFinancial Performance (contd.)
05050449_003_138.indd 13605050449_003_138.indd 136 5/19/05 10:44:44 PM5/19/05 10:44:44 PM
Sasken annual report 2004 - 2005 137
Filing of trademarks
Trademarks have acquired much importance to Sasken with the software market focusing on branding of software products and services. We have also applied for registration of certain trademarks in USA, EU, Russia, Japan, China and India.
Protection of confidentiality
Sasken assigns much importance to the confidentiality of its software, trade secrets, internal data, systems and processes. Sasken ensures that the employees, clients, prospects, subcontractors, advisors, consultants, vendors, prospective investors who are exposed to any of the confidential information of Sasken, are contractually bound to keep it confidential.
Contracting process for limitation of liability
Each and every contract entered into by Sasken, including both customer and vendor contracts, undergoes a well-settled legal and commercial contract review process. The process ensures that, the clauses, which may be imposed by the customer / vendors that expose Sasken to risks, are proportionate with the benefits accruing from the contract. Sasken is also protected by insurance coverage.
Financial risks-
Foreign exchange fluctuation risk
Most of Sasken’ revenues are in US Dollars, while its expenses are in Indian Rupees. Operating profits are therefore subject to fluctuations in exchange rates. The exchange rate between the Rupee and the US Dollar has changes substantially in the recent years. During the year Rupee depreciated from Rs. 43.65 for a US Dollar as on April 1, 2004 to Rs. 43.74 for a US Dollar on March 31, 2005. The depreciation was insignificant, however during the year the Rupee had depreciated to Rs. 46.45 against a US Dollar. We expect that majority of our billings in future will be in US Dollar and a significant portion of our expense will be in Indian Rupee. This will result in our operations being significantly impacted on account of Rupee appreciation.
The following are the de-risking measures we adopt to minimize the impact of Rupee appreciation.
The Company periodically reviews its foreign exchange exposures and takes appropriate hedges regularly. The policy of the Company is to take hedges for risk mitigation and not for profit maximization. The Company has pre set loss limits and unhedged exposures are based on these loss limits.
Credit Risk
The Company’s ability to recover dues from customer is dependent on the agreed credit terms. With customers and operations all over the world, effective procedures and recovery mechanism have to be in place to avoid excessive bad debts. The Company constantly reviews credibility of existing customers and follows rigorous credit checks on prospective customers before fixing credit limits and credit periods.
Liquidity Risk
The Company has adequate working capital limits with its bankers, which it uses during periods where there are mismatches in the business inflows and outflows. As such, the extent of cash balance, taken together with the undrawn working capital limit, together determines the liquidity position of the Company. The Board reviews the liquidity position periodically and determines the need for infusion of equity capital into the business.
Management’s Discussion and Analysis ofFinancial Performance (contd.)
05050449_003_138.indd 13705050449_003_138.indd 137 5/19/05 10:44:44 PM5/19/05 10:44:44 PM

05050449_003_138.indd 13805050449_003_138.indd 138 5/19/05 10:44:44 PM5/19/05 10:44:44 PM

Sasken Network Systems Limited
05050449_139_216.indd 13905050449_139_216.indd 139 5/19/05 10:27:05 PM5/19/05 10:27:05 PM
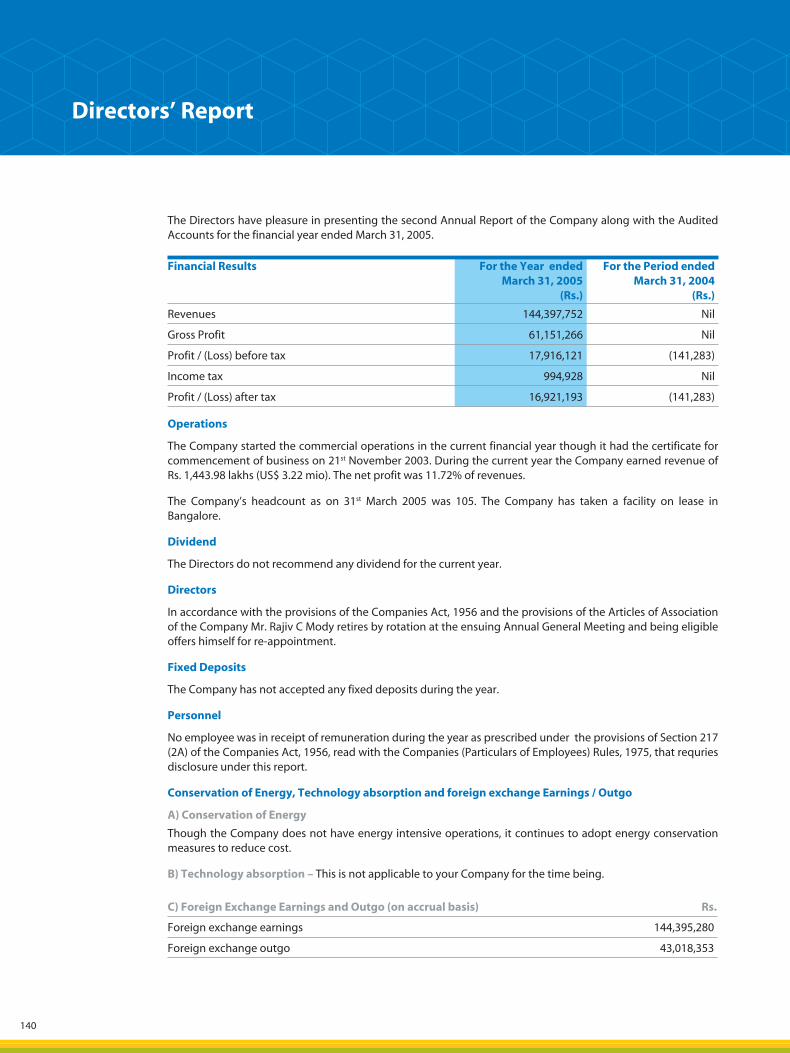
140
The Directors have pleasure in presenting the second Annual Report of the Company along with the Audited Accounts for the financial year ended March 31, 2005.
Financial Results For the Year endedMarch 31, 2005
(Rs.)
For the Period endedMarch 31, 2004
(Rs.)
Revenues 144,397,752 Nil
Gross Profit 61,151,266 Nil
Profit / (Loss) before tax 17,916,121 (141,283)
Income tax 994,928 Nil
Profit / (Loss) after tax 16,921,193 (141,283)
Operations
The Company started the commercial operations in the current financial year though it had the certificate for commencement of business on 21st November 2003. During the current year the Company earned revenue of Rs. 1,443.98 lakhs (US$ 3.22 mio). The net profit was 11.72% of revenues.
The Company’s headcount as on 31st March 2005 was 105. The Company has taken a facility on lease in Bangalore.
Dividend
The Directors do not recommend any dividend for the current year.
Directors
In accordance with the provisions of the Companies Act, 1956 and the provisions of the Articles of Association of the Company Mr. Rajiv C Mody retires by rotation at the ensuing Annual General Meeting and being eligible offers himself for re-appointment.
Fixed Deposits
The Company has not accepted any fixed deposits during the year.
Personnel
No employee was in receipt of remuneration during the year as prescribed under the provisions of Section 217 (2A) of the Companies Act, 1956, read with the Companies (Particulars of Employees) Rules, 1975, that requries disclosure under this report.
Conservation of Energy, Technology absorption and foreign exchange Earnings / Outgo
A) Conservation of Energy
Though the Company does not have energy intensive operations, it continues to adopt energy conservation measures to reduce cost.
B) Technology absorption – This is not applicable to your Company for the time being.
C) Foreign Exchange Earnings and Outgo (on accrual basis) Rs.
Foreign exchange earnings 144,395,280
Foreign exchange outgo 43,018,353
Directors’ Report
05050449_139_216.indd 14005050449_139_216.indd 140 5/19/05 10:27:06 PM5/19/05 10:27:06 PM
Sasken annual report 2004 - 2005 141
Auditors
M/s. Deloitte Haskins & Sells, Chartered Accountants, the Auditors of the Company retire at the forthcoming Annual General Meeting of the Company and have confirmed their eligibility and willingness to accept the office, if reappointed.
Directors’ Responsibility Statement
Pursuant to the requirement under Section 217 (2AA) of the Companies Act, 1956 with respect to Directors responsibilities statement, it is hereby confirmed that the management of Sasken Network Systems Limited has prepared and is responsible for the accompanying financial statements.
The Directors have followed the applicable Accounting Standards in the preparation of the annual accounts along with proper explanation relating to material departures.
In the preparation of the annual accounts, the Directors have selected such accounting policies and applied them consistently and made judgements and estimates that are reasonable and prudent so as to give a true and fair view of the state of affairs of the Company at the end of the financial year and of the profit of the Company for the year.
The Directors had taken proper and sufficient care for the maintenance of adequate accounting records in accordance with the provisions of the Companies Act, 1956, for safeguarding the assets of the Company and for preventing and detecting fraud and other irregularities.
The Directors have prepared the annual accounts on a going concern basis.
Acknowledgement
Your Directors would like to place on record, their appreciation to customers, shareholders, vendors, Union Bank of India, HDFC Bank and all Governmental and statutory agencies for their co-operation and invaluable support. Your Directors would also like to thank the employees for their valuable contribution during the year and look forward to their continued support.
For and on behalf of the Board of Directors
Place: Bangalore Rajiv C ModyDate : April 19, 2005 Chairman
Directors’ Report (contd.)
05050449_139_216.indd 14105050449_139_216.indd 141 5/19/05 10:27:07 PM5/19/05 10:27:07 PM
142
Auditors’ Report
To The Members of Sasken Network Systems Limited
We have audited the attached Balance Sheet of SASKEN NETWORK SYSTEMS LIMITED as at March 31, 2005, the Profit and Loss Account and the Cash Flow Statement of the Company for the year ended on that date, both annexed thereto. These financial statements are the responsibility of the Company’s management. Our responsibility is to express an opinion on these financial statements based on our audit.
We conducted our audit in accordance with generally accepted auditing standards in India. These Standards require that we plan and perform the audit to obtain reasonable assurance whether the financial statements are free of material misstatement. An audit includes, examining on a test basis, evidence supporting the amounts and disclosures in the financial statements. An audit also includes assessing the accounting principles used and significant estimates made by the Management as well as evaluating the overall financial statement presentation. We believe that our audit provides a reasonable basis for our opinion.
As required by the Companies (Auditor’s Report) Order, 2003 issued by the Government of India in terms of Section 227 (4A) of the Companies Act, 1956, we give in the Annexure, a statement on the matters specified in paragraphs 4 and 5 of the said Order to the extent applicable to the Company.
Further to our comments in the Annexure referred to above, we report that:
(a) we have obtained all the information and explanations, which to the best of our knowledge and belief were necessary for the purposes of our audit;
(b) in our opinion, proper books of account as required by law have been kept by the Company, so far as it appears from our examination of the books;
(c) the Balance Sheet, the Profit and Loss Account and the Cash Flow Statement dealt with by this report are in agreement with the books of account;
(d) in our opinion, the Balance Sheet, the Profit and Loss Account and the Cash Flow Statement dealt with by this report are in compliance with the Accounting Standards referred to in Section 211 (3C) of the Companies Act, 1956;
(e) on the basis of the written representations from the directors as on March 31, 2005 and taken on record by the Board of Directors, we report that none of the directors is disqualified as on March 31, 2005 from being appointed as a director under Section 274 (1)(g) of the Companies Act, 1956;
(f) in our opinion and to the best of our information and according to the explanations given to us, the said accounts read together with the Notes thereon, give the information required by the Companies Act, 1956, in the manner so required and give a true and fair view in conformity with the accounting principles generally accepted in India:
(i) in the case of the Balance Sheet, of the state of affairs of the Company as at March 31, 2005;
(ii) in the case of the Profit and Loss Account, of the profit for the year ended on that date; and
(iii) in the case of the Cash Flow Statement, of the cash flows for the year ended on that date.
For Deloitte Haskins & SellsChartered Accountants
V. SrikumarPlace: Bangalore PartnerDate : April 19, 2005 Membership No. 84494
05050449_139_216.indd 14205050449_139_216.indd 142 5/19/05 10:27:08 PM5/19/05 10:27:08 PM
Sasken annual report 2004 - 2005 143
Annexure to the Auditors’ Report(Referred to in our report of even date)
1. The provisions of clauses i (c), ii, iii (b) to (d), iii (f), iii (g), vi, vii, viii, x, xi, xii, xiii, xiv, xv, xviii, xix and xx of paragraph 4 and 5 of the Companies (Auditor’s Report) Order, 2003 are not applicable for the current year.
2. In respect of its fixed assets:
(a) The Company has maintained proper records showing full particulars including quantitative details and situation of fixed assets.
(b) Some of the fixed assets were physically verified during the year by the management in accordance with a programme of verification, which in our opinion provides for physical verification of all the fixed assets at reasonable intervals. According to the information and explanations given to us no material discrepancies were noticed on such verification.
3. The Company has neither accepted from nor granted any loans to companies, firms or other parties covered in the Register maintained under Section 301 of the Companies Act, 1956.
4. In our opinion and according to the information and explanations given to us, there are adequate internal control systems commensurate with the size of the Company and the nature of its business with regard to the purchase of fixed assets and sale of services and we have not observed any continuing failure to correct major weaknesses in such internal controls.
5. To the best of our knowledge and belief and according to the information and explanations given to us, there were no contracts or arrangements that were needed to be entered into the Register maintained in pursuance of Section 301 of the Companies Act, 1956.
6. According to the information and explanations given to us in respect of statutory and other dues:
a) According to the information and explanations given to us, the Company has been regular in depositing undisputed statutory dues including Provident Fund, Employees’ State Insurance, Investor Education and Protection Fund, Income Tax, Wealth Tax, Service Tax, Excise Duty, Customs Duty, Sales Tax, cess and any other material statutory dues with the appropriate authorities during the year and there are no undisputed statutory dues as noted above is outstanding for a period more than six months from the date they became payable.
b) According to the information and explanations given to us there are no disputed sales tax, income tax, customs duty, wealth tax, service tax, excise duty and cess which have not been deposited as on 31 March, 2005 on account of any dispute.
7. To the best of our knowledge and belief and according to the information and explanations given to us, term loans availed by the Company were, prima facie, applied by the Company during the year for the purposes for which the loans were obtained, other than temporary deployment pending application.
8. According to information and explanations given to us, and on an overall examination of the balance sheet of the Company, funds on a short-term basis have, prima facie not been used during the year for long term investment.
9. To the best of our knowledge and belief and according to the information and explanations given to us, no fraud on or by the Company was noticed or reported during the year.
For Deloitte Haskins & SellsChartered Accountants
V. SrikumarPlace: Bangalore PartnerDate : April 19, 2005 Membership No. 84494
05050449_139_216.indd 14305050449_139_216.indd 143 5/19/05 10:27:08 PM5/19/05 10:27:08 PM
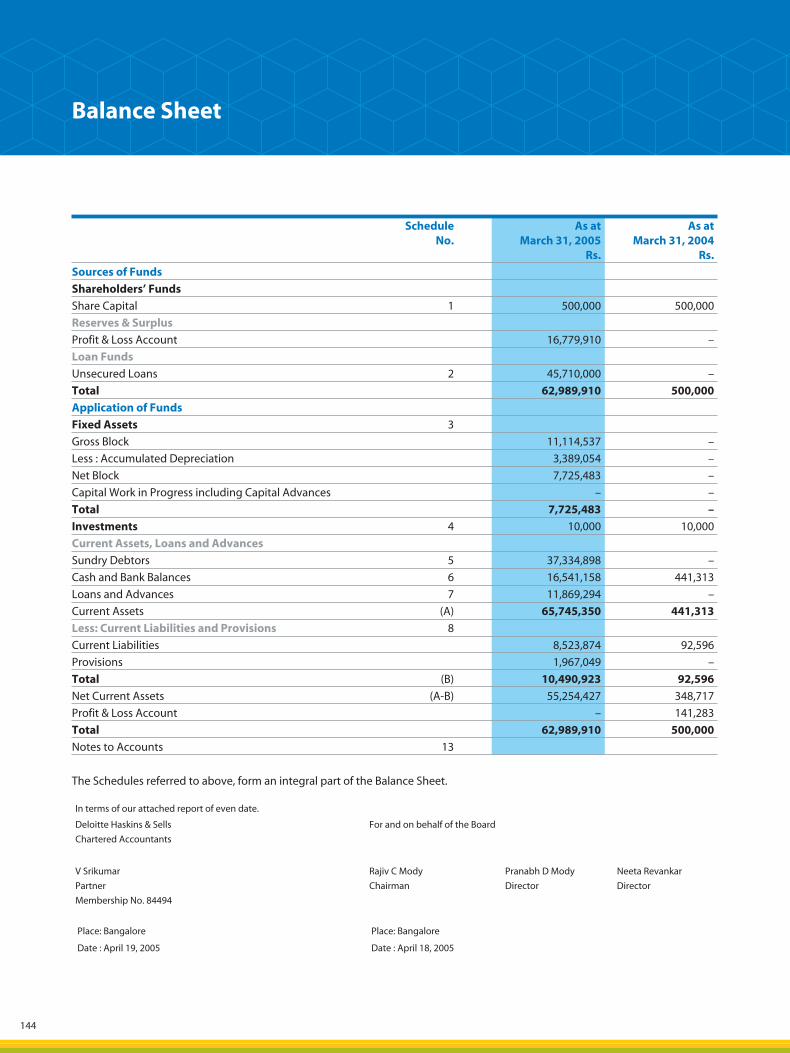
144
Schedule No.
As at March 31, 2005
Rs.
As at March 31, 2004
Rs.
Sources of Funds
Shareholders’ Funds
Share Capital 1 500,000 500,000
Reserves & Surplus
Profit & Loss Account 16,779,910 –
Loan Funds
Unsecured Loans 2 45,710,000 –
Total 62,989,910 500,000
Application of Funds
Fixed Assets 3
Gross Block 11,114,537 –
Less : Accumulated Depreciation 3,389,054 –
Net Block 7,725,483 –
Capital Work in Progress including Capital Advances – –
Total 7,725,483 –
Investments 4 10,000 10,000
Current Assets, Loans and Advances
Sundry Debtors 5 37,334,898 –
Cash and Bank Balances 6 16,541,158 441,313
Loans and Advances 7 11,869,294 –
Current Assets (A) 65,745,350 441,313
Less: Current Liabilities and Provisions 8
Current Liabilities 8,523,874 92,596
Provisions 1,967,049 –
Total (B) 10,490,923 92,596
Net Current Assets (A-B) 55,254,427 348,717
Profit & Loss Account – 141,283
Total 62,989,910 500,000
Notes to Accounts 13
The Schedules referred to above, form an integral part of the Balance Sheet.
Balance Sheet
In terms of our attached report of even date.
Deloitte Haskins & Sells
Chartered Accountants
For and on behalf of the Board
V Srikumar
Partner
Membership No. 84494
Rajiv C Mody
Chairman
Pranabh D Mody
Director
Neeta Revankar
Director
Place: Bangalore Place: Bangalore
Date : April 19, 2005 Date : April 18, 2005
05050449_139_216.indd 14405050449_139_216.indd 144 5/19/05 10:27:09 PM5/19/05 10:27:09 PM
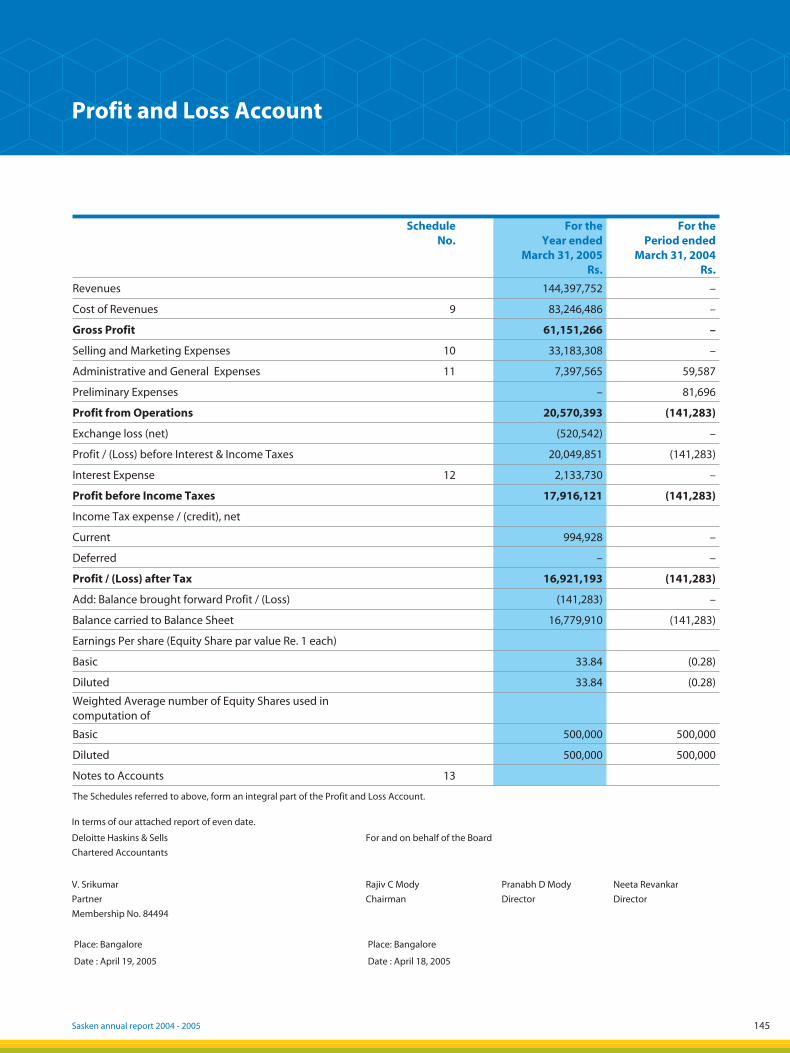
Sasken annual report 2004 - 2005 145
Schedule No.
For the Year ended
March 31, 2005 Rs.
For the Period ended
March 31, 2004 Rs.
Revenues 144,397,752 –
Cost of Revenues 9 83,246,486 –
Gross Profit 61,151,266 –
Selling and Marketing Expenses 10 33,183,308 –
Administrative and General Expenses 11 7,397,565 59,587
Preliminary Expenses – 81,696
Profit from Operations 20,570,393 (141,283)
Exchange loss (net) (520,542) –
Profit / (Loss) before Interest & Income Taxes 20,049,851 (141,283)
Interest Expense 12 2,133,730 –
Profit before Income Taxes 17,916,121 (141,283)
Income Tax expense / (credit), net
Current 994,928 –
Deferred – –
Profit / (Loss) after Tax 16,921,193 (141,283)
Add: Balance brought forward Profit / (Loss) (141,283) –
Balance carried to Balance Sheet 16,779,910 (141,283)
Earnings Per share (Equity Share par value Re. 1 each)
Basic 33.84 (0.28)
Diluted 33.84 (0.28)
Weighted Average number of Equity Shares used in computation of
Basic 500,000 500,000
Diluted 500,000 500,000
Notes to Accounts 13
The Schedules referred to above, form an integral part of the Profit and Loss Account.
Profit and Loss Account
In terms of our attached report of even date.
Deloitte Haskins & Sells
Chartered Accountants
For and on behalf of the Board
V. Srikumar
Partner
Membership No. 84494
Rajiv C Mody
Chairman
Pranabh D Mody
Director
Neeta Revankar
Director
Place: Bangalore Place: Bangalore
Date : April 19, 2005 Date : April 18, 2005
05050449_139_216.indd 14505050449_139_216.indd 145 5/19/05 10:27:10 PM5/19/05 10:27:10 PM
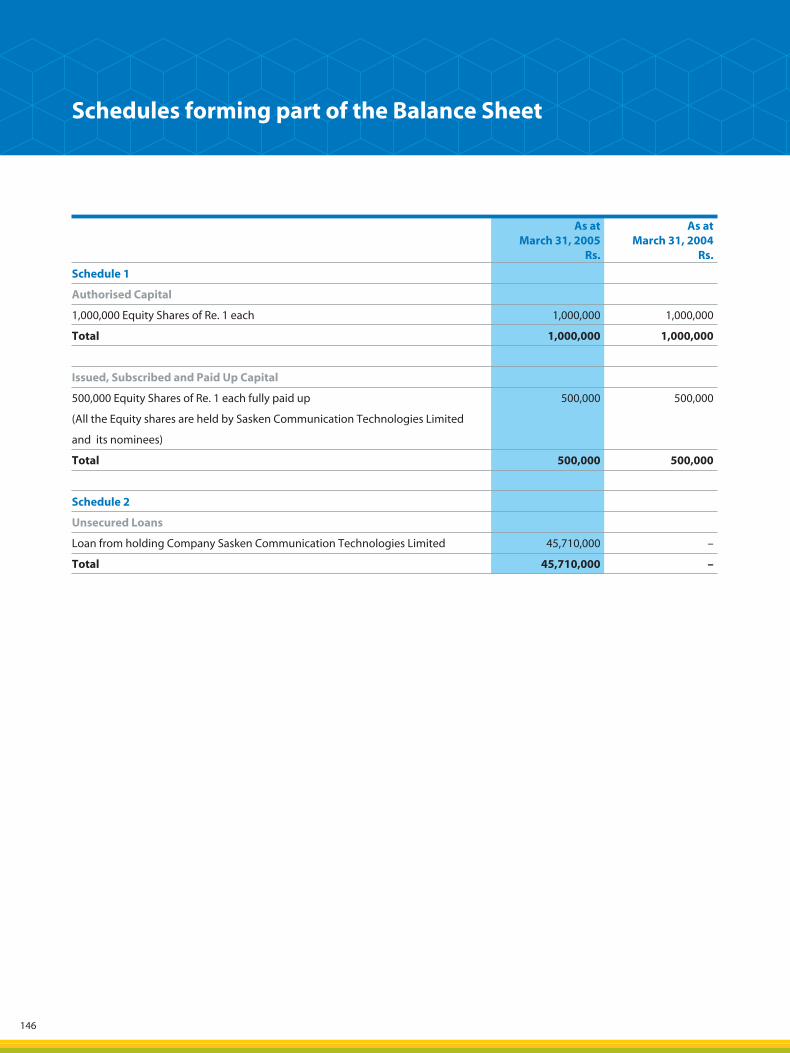
146
Schedules forming part of the Balance Sheet
As at March 31, 2005
Rs.
As at March 31, 2004
Rs.
Schedule 1
Authorised Capital
1,000,000 Equity Shares of Re. 1 each 1,000,000 1,000,000
Total 1,000,000 1,000,000
Issued, Subscribed and Paid Up Capital
500,000 Equity Shares of Re. 1 each fully paid up 500,000 500,000
(All the Equity shares are held by Sasken Communication Technologies Limited
and its nominees)
Total 500,000 500,000
Schedule 2
Unsecured Loans
Loan from holding Company Sasken Communication Technologies Limited 45,710,000 –
Total 45,710,000 –
05050449_139_216.indd 14605050449_139_216.indd 146 5/19/05 10:27:11 PM5/19/05 10:27:11 PM

Sasken annual report 2004 - 2005 147
Sch
edu
le 3
– F
ixed
Ass
ets
Gro
ss B
lock
Dep
reci
atio
nN
et B
lock
Par
ticu
lars
A
s at
Ap
ril 1
20
04
Ad
dit
ion
s d
uri
ng
the
year
As
atM
arch
31
20
05
As
atA
pri
l 12
00
4
For
the
year
As
atM
arch
31
20
05
As
atM
arch
31
20
05
As
atM
arch
31
20
04
Co
mp
ute
rs
–
4,3
74,3
99
4,3
74,3
99
–
872
,638
8
72,6
38
3,5
01,7
61
–
Furn
itu
re a
nd
Fit
tin
gs
–
4,9
05,3
03
4,9
05,3
03
–
1,1
18,0
28
1,1
18,0
28
3,7
87,2
75
–
Off
ice
Equ
ipm
ents
–
1
,467
,635
1
,467
,635
–
1
,203
,568
1
,203
,568
2
64,0
67
–
Inta
ng
ible
Ass
ets
–
367
,200
3
67,2
00
–
194
,820
1
94,8
20
172
,380
–
Tota
l –
1
1,1
14
,53
7
11
,11
4,5
37
–
3
,38
9,0
54
3
,38
9,0
54
7
,72
5,4
83
–
Bal
ance
as
at M
arch
31,
200
4 –
–
–
–
–
–
–
–
Schedules forming part of the Balance Sheet (contd.)
(Am
ou
nt
in R
s.)
10
05050449_139_216.indd 14705050449_139_216.indd 147 5/19/05 10:27:11 PM5/19/05 10:27:11 PM
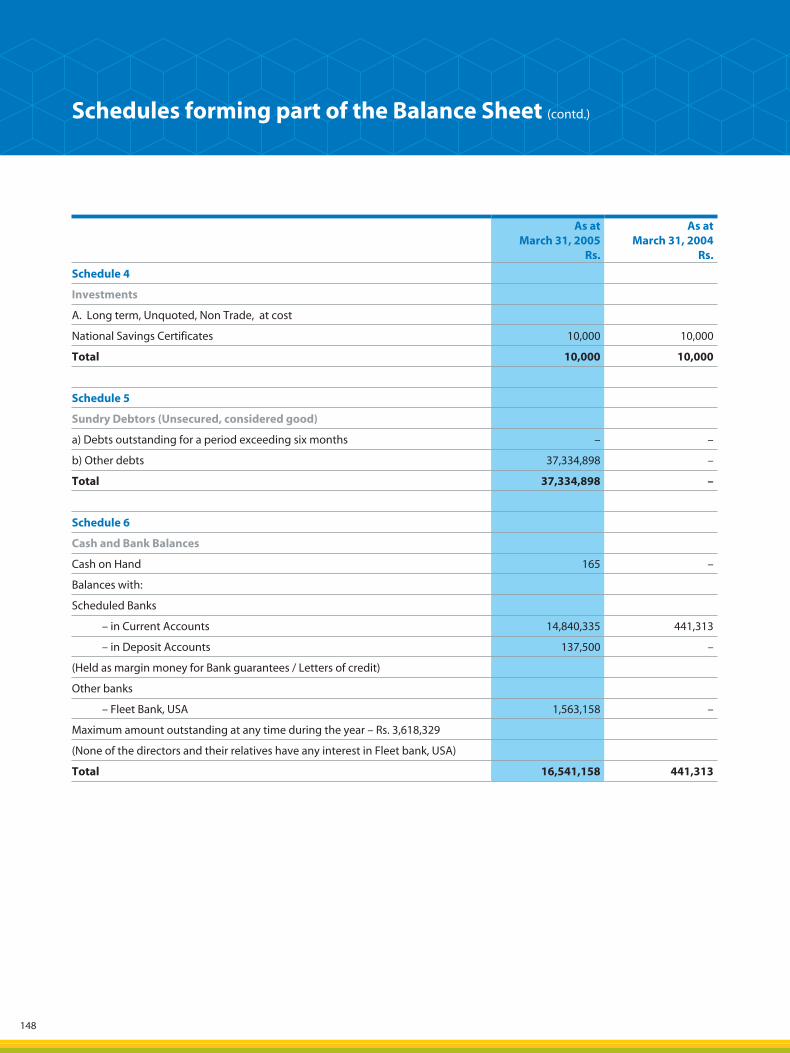
148
As at March 31, 2005
Rs.
As at March 31, 2004
Rs.
Schedule 4
Investments
A. Long term, Unquoted, Non Trade, at cost
National Savings Certificates 10,000 10,000
Total 10,000 10,000
Schedule 5
Sundry Debtors (Unsecured, considered good)
a) Debts outstanding for a period exceeding six months – –
b) Other debts 37,334,898 –
Total 37,334,898 –
Schedule 6
Cash and Bank Balances
Cash on Hand 165 –
Balances with:
Scheduled Banks
– in Current Accounts 14,840,335 441,313
– in Deposit Accounts 137,500 –
(Held as margin money for Bank guarantees / Letters of credit)
Other banks
– Fleet Bank, USA 1,563,158 –
Maximum amount outstanding at any time during the year – Rs. 3,618,329
(None of the directors and their relatives have any interest in Fleet bank, USA)
Total 16,541,158 441,313
Schedules forming part of the Balance Sheet (contd.)
05050449_139_216.indd 14805050449_139_216.indd 148 5/19/05 10:27:12 PM5/19/05 10:27:12 PM
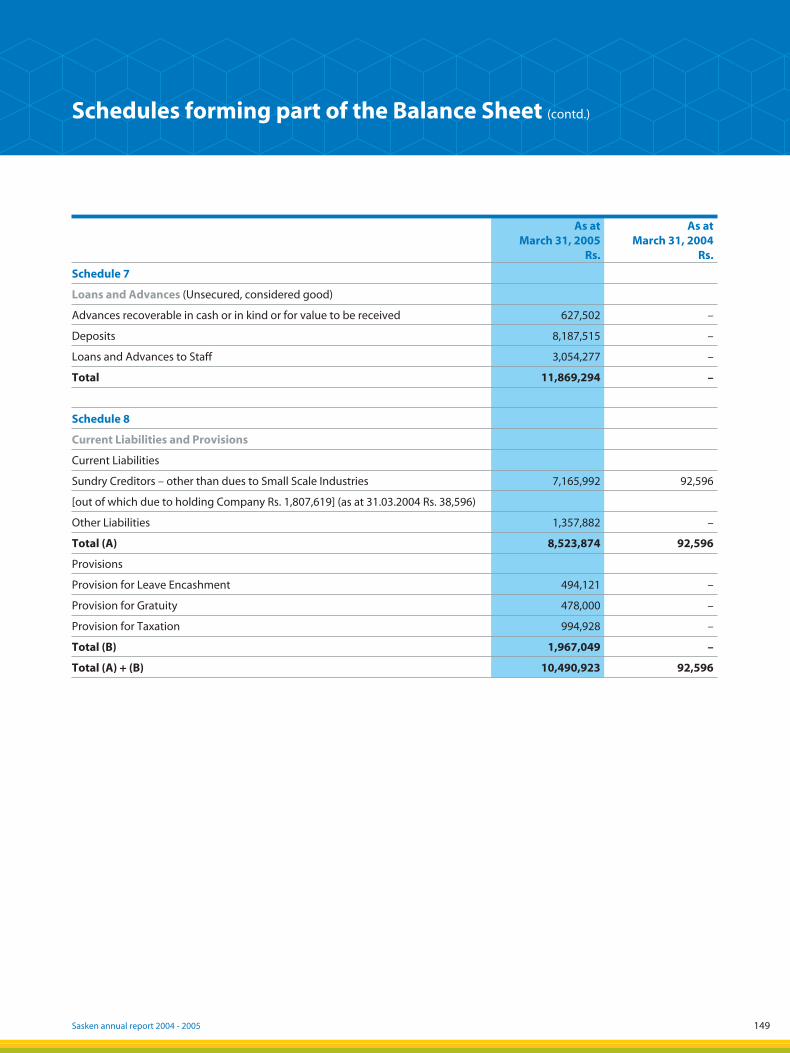
Sasken annual report 2004 - 2005 149
As at March 31, 2005
Rs.
As at March 31, 2004
Rs.
Schedule 7
Loans and Advances (Unsecured, considered good)
Advances recoverable in cash or in kind or for value to be received 627,502 –
Deposits 8,187,515 –
Loans and Advances to Staff 3,054,277 –
Total 11,869,294 –
Schedule 8
Current Liabilities and Provisions
Current Liabilities
Sundry Creditors – other than dues to Small Scale Industries 7,165,992 92,596
[out of which due to holding Company Rs. 1,807,619] (as at 31.03.2004 Rs. 38,596)
Other Liabilities 1,357,882 –
Total (A) 8,523,874 92,596
Provisions
Provision for Leave Encashment 494,121 –
Provision for Gratuity 478,000 –
Provision for Taxation 994,928 –
Total (B) 1,967,049 –
Total (A) + (B) 10,490,923 92,596
Schedules forming part of the Balance Sheet (contd.)
05050449_139_216.indd 14905050449_139_216.indd 149 5/19/05 10:27:13 PM5/19/05 10:27:13 PM
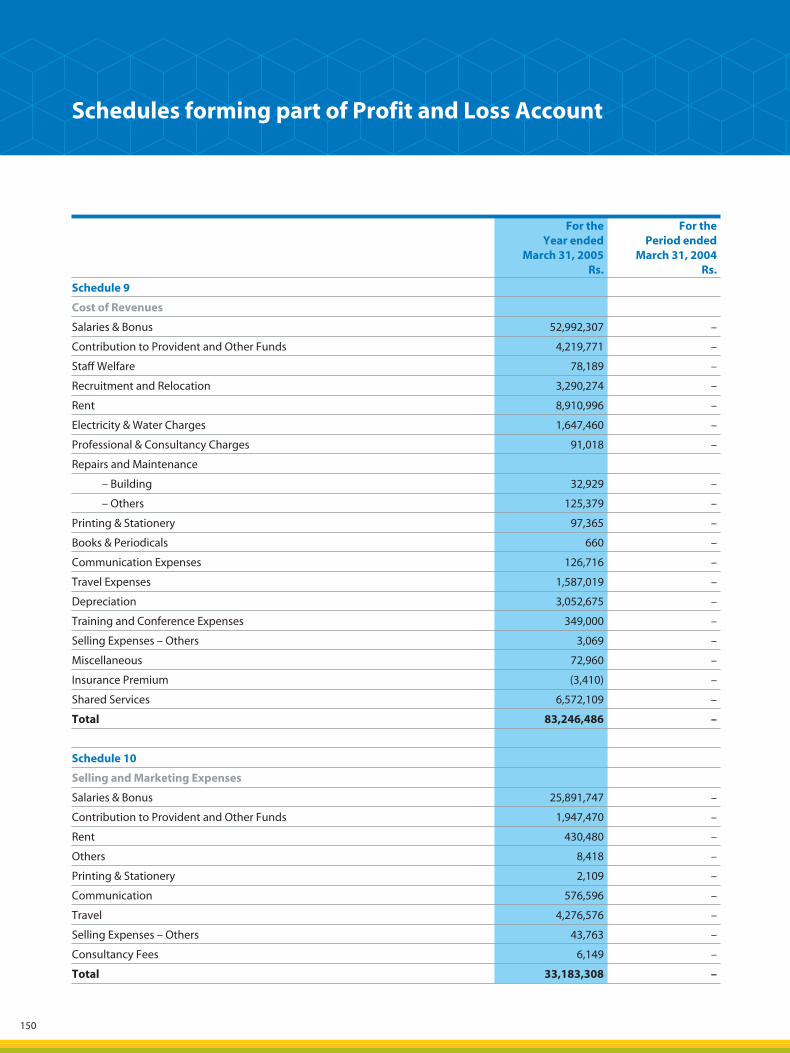
150
For the Year ended
March 31, 2005Rs.
For the Period ended
March 31, 2004Rs.
Schedule 9
Cost of Revenues
Salaries & Bonus 52,992,307 –
Contribution to Provident and Other Funds 4,219,771 –
Staff Welfare 78,189 –
Recruitment and Relocation 3,290,274 –
Rent 8,910,996 –
Electricity & Water Charges 1,647,460 –
Professional & Consultancy Charges 91,018 –
Repairs and Maintenance
– Building 32,929 –
– Others 125,379 –
Printing & Stationery 97,365 –
Books & Periodicals 660 –
Communication Expenses 126,716 –
Travel Expenses 1,587,019 –
Depreciation 3,052,675 –
Training and Conference Expenses 349,000 –
Selling Expenses – Others 3,069 –
Miscellaneous 72,960 –
Insurance Premium (3,410) –
Shared Services 6,572,109 –
Total 83,246,486 –
Schedule 10
Selling and Marketing Expenses
Salaries & Bonus 25,891,747 –
Contribution to Provident and Other Funds 1,947,470 –
Rent 430,480 –
Others 8,418 –
Printing & Stationery 2,109 –
Communication 576,596 –
Travel 4,276,576 –
Selling Expenses – Others 43,763 –
Consultancy Fees 6,149 –
Total 33,183,308 –
Schedules forming part of Profit and Loss Account
05050449_139_216.indd 15005050449_139_216.indd 150 5/19/05 10:27:13 PM5/19/05 10:27:13 PM
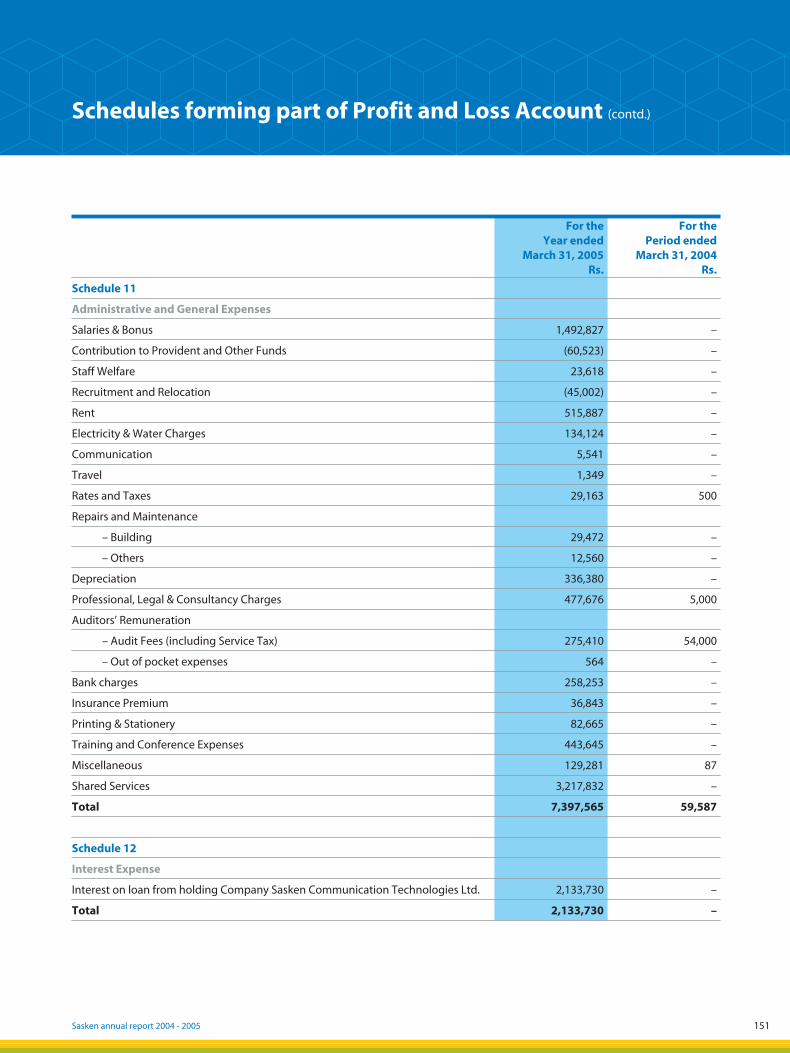
Sasken annual report 2004 - 2005 151
For the Year ended
March 31, 2005Rs.
For the Period ended
March 31, 2004Rs.
Schedule 11
Administrative and General Expenses
Salaries & Bonus 1,492,827 –
Contribution to Provident and Other Funds (60,523) –
Staff Welfare 23,618 –
Recruitment and Relocation (45,002) –
Rent 515,887 –
Electricity & Water Charges 134,124 –
Communication 5,541 –
Travel 1,349 –
Rates and Taxes 29,163 500
Repairs and Maintenance
– Building 29,472 –
– Others 12,560 –
Depreciation 336,380 –
Professional, Legal & Consultancy Charges 477,676 5,000
Auditors’ Remuneration
– Audit Fees (including Service Tax) 275,410 54,000
– Out of pocket expenses 564 –
Bank charges 258,253 –
Insurance Premium 36,843 –
Printing & Stationery 82,665 –
Training and Conference Expenses 443,645 –
Miscellaneous 129,281 87
Shared Services 3,217,832 –
Total 7,397,565 59,587
Schedule 12
Interest Expense
Interest on loan from holding Company Sasken Communication Technologies Ltd. 2,133,730 –
Total 2,133,730 –
Schedules forming part of Profit and Loss Account (contd.)
05050449_139_216.indd 15105050449_139_216.indd 151 5/19/05 10:27:14 PM5/19/05 10:27:14 PM

152
Schedules forming part of the Accounts for the year ended March 31, 2005.
Schedule 13
1. Significant Accounting Policies
Basis for preparation of financial statements
The financial statements have been prepared under the historical cost convention, on accrual basis, in conformity with the Accounting Standards issued by The Institute of Chartered Accountants of India, the provisions of The Companies Act, 1956 and other applicable statutes and guidelines.
The presentation of financial statements in conformity with generally accepted accounting principles requires management to make estimates and assumptions that affect the amounts reported in the financial statements and accompanying notes. Although these estimates are based on management’s best knowledge of current events and actions the Company may undertake in future, actual results ultimately may differ from the estimates.
Revenue Recognition
The Company derives its revenues from software services. Revenue from time and material service contracts is recognized as the services are provided. Revenue from fixed price service contracts is recognized based on the proportionate completion method, determined based on the achievement and acceptance of the milestone, provided collection is probable.
Interest income is recognized on an accrual basis.
Work in progress
Costs related to milestones that have not been met are treated as costs of future activity and are reported as work in progress. Work in progress is carried at cost or net realizable value whichever is lower.
Fixed Assets
Fixed assets are stated at cost, less accumulated depreciation. Cost comprises the purchase price and any attributable cost of bringing the asset to its working condition for its intended use. Financing costs relating to acquisition of fixed assets are also included to the extent they relate to the period till such assets are ready to be put to use.
Depreciation
Depreciation is provided on Straight Line Method (SLM) at the rates mentioned below which are greater than or equal to the corresponding rates prescribed in Schedule XIV of the Companies Act, 1956:
Type of asset Rates (SLM) (%)
Schedule XIV rates (SLM) (%)
Computers 25 16.21
Furniture & Fittings 10 6.33
Office Equipments 20 4.75
Assets with unit value Rs. 5,000 or less are depreciated entirely in the period of acquisition.
Intangible assets comprise of the following and are depreciated over the estimated useful life as given below:
Generic Computer Software is depreciated over a period of twelve months.
Investments
Investments that are readily realisable and intended to be held for not more than a year are classified as current
Notes forming part of Accounts
05050449_139_216.indd 15205050449_139_216.indd 152 5/19/05 10:27:15 PM5/19/05 10:27:15 PM

Sasken annual report 2004 - 2005 153
investments. All other investments are classified as long-term investments. Current investments are carried at lower of cost and fair value determined on an individual investment basis. Long-term investments are carried at cost. However, provision for diminution in value is made to recognise a decline other than temporary in the value of the investments.
Foreign Exchange Transactions
(i) Initial Recognition – Foreign currency transactions are recorded in the reporting currency, by applying to the foreign currency amount the exchange rate between the reporting currency and the foreign currency approximately at the date of the transaction.
(ii) Conversion – Foreign currency monetary items are reported using the closing rate. Non-monetary items, which are carried in terms of historical cost denominated in a foreign currency, are reported using the exchange rate at the date of the transaction.
(iii) Exchange Differences – Exchange differences arising on the settlement or conversion of monetary items, are recognised as income or as expenses in the period in which they arise except those arising on liabilities pertaining to fixed assets, which are adjusted with the cost of the fixed assets.
(iv) Forward Exchange Contracts – The Company uses forward exchange contracts to hedge its exposure to movements in foreign exchange rates. The Company does not use the forward exchange contracts for trading or speculation purposes. In respect of foreign currency monetary assets or liabilities in respect of which forward exchange contract is taken, the premium or discount arising at the inception of forward exchange contracts is amortised as expense or income over the life of the contract, except where it relates to fixed assets in which case it is adjusted to the cost of the corresponding asset. Exchange differences on such contracts are recognised in the statement of profit and loss in the period in which the exchange rates change. Any profit or loss arising on cancellation or renewal of forward exchange contract is recognised as income or as expense for the period.
(v) Foreign branches – The financial statement of an integral foreign operation are translated as if the transactions of the foreign operation have been those of the Company itself.
Retirement Benefits
The Company contributes to a Group Gratuity Scheme, administered by a private insurance Company. The contributions are charged to the Profit and Loss account. Provision is made as per the actuarial valuation determined as at the balance sheet date.
Provision for leave encashment benefits is made based on actuarial valuation as at the balance sheet date.
The contributions towards Provident Fund and Pension fund are remitted to the Regional Provident Fund. Contributions towards Provident Fund and Pension Fund are charged to the Profit and Loss Account on an accrual basis.
The Company established a Super Annuation Scheme administered by a private insurance Company. As per the Scheme, for employees claiming the benefit, the Company makes monthly contributions, which are charged to the Profit and Loss Account on an accrual basis. The Company has no other obligations under the Scheme.
Impairment of Assets
The Company assesses at each balance sheet date whether there is any indication that an asset may be impaired. If any such indication exists, the Company estimates the recoverable amount of the asset. If such recoverable amount of the asset or recoverable amount of the cash-generating unit to which the asset belongs is less than its carrying amount, the carrying amount is reduced to its recoverable amount. The reduction is treated as an impairment loss and is recognized in the profit and loss account. If at the balance sheet date there is an indication that if a previously assessed impairment loss no longer exists, the recoverable amount is reassessed and the asset is reflected at the recoverable amount.
Notes forming part of Accounts (contd.)
05050449_139_216.indd 15305050449_139_216.indd 153 5/19/05 10:27:16 PM5/19/05 10:27:16 PM
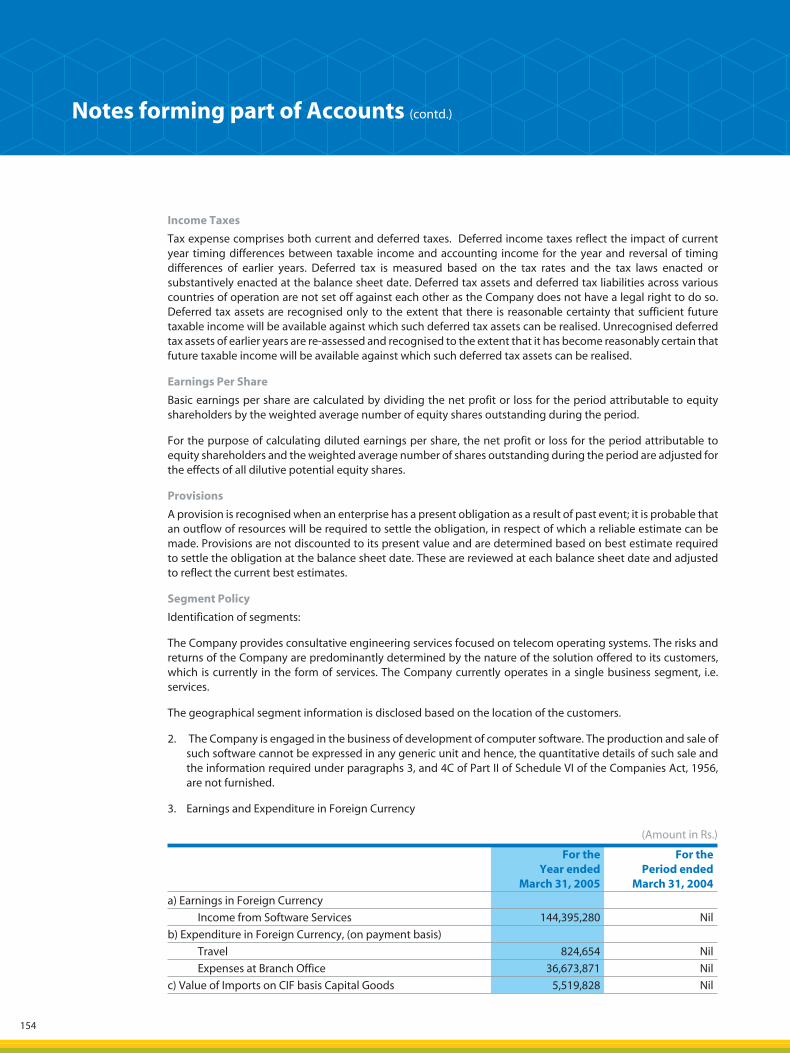
154
Income Taxes
Tax expense comprises both current and deferred taxes. Deferred income taxes reflect the impact of current year timing differences between taxable income and accounting income for the year and reversal of timing differences of earlier years. Deferred tax is measured based on the tax rates and the tax laws enacted or substantively enacted at the balance sheet date. Deferred tax assets and deferred tax liabilities across various countries of operation are not set off against each other as the Company does not have a legal right to do so. Deferred tax assets are recognised only to the extent that there is reasonable certainty that sufficient future taxable income will be available against which such deferred tax assets can be realised. Unrecognised deferred tax assets of earlier years are re-assessed and recognised to the extent that it has become reasonably certain that future taxable income will be available against which such deferred tax assets can be realised.
Earnings Per Share
Basic earnings per share are calculated by dividing the net profit or loss for the period attributable to equity shareholders by the weighted average number of equity shares outstanding during the period.
For the purpose of calculating diluted earnings per share, the net profit or loss for the period attributable to equity shareholders and the weighted average number of shares outstanding during the period are adjusted for the effects of all dilutive potential equity shares.
Provisions
A provision is recognised when an enterprise has a present obligation as a result of past event; it is probable that an outflow of resources will be required to settle the obligation, in respect of which a reliable estimate can be made. Provisions are not discounted to its present value and are determined based on best estimate required to settle the obligation at the balance sheet date. These are reviewed at each balance sheet date and adjusted to reflect the current best estimates.
Segment Policy
Identification of segments:
The Company provides consultative engineering services focused on telecom operating systems. The risks and returns of the Company are predominantly determined by the nature of the solution offered to its customers, which is currently in the form of services. The Company currently operates in a single business segment, i.e. services.
The geographical segment information is disclosed based on the location of the customers.
2. The Company is engaged in the business of development of computer software. The production and sale of such software cannot be expressed in any generic unit and hence, the quantitative details of such sale and the information required under paragraphs 3, and 4C of Part II of Schedule VI of the Companies Act, 1956, are not furnished.
3. Earnings and Expenditure in Foreign Currency
(Amount in Rs.)
For theYear ended
March 31, 2005
For thePeriod ended
March 31, 2004
a) Earnings in Foreign Currency
Income from Software Services 144,395,280 Nil
b) Expenditure in Foreign Currency, (on payment basis)
Travel 824,654 Nil
Expenses at Branch Office 36,673,871 Nil
c) Value of Imports on CIF basis Capital Goods 5,519,828 Nil
Notes forming part of Accounts (contd.)
05050449_139_216.indd 15405050449_139_216.indd 154 5/19/05 10:27:17 PM5/19/05 10:27:17 PM
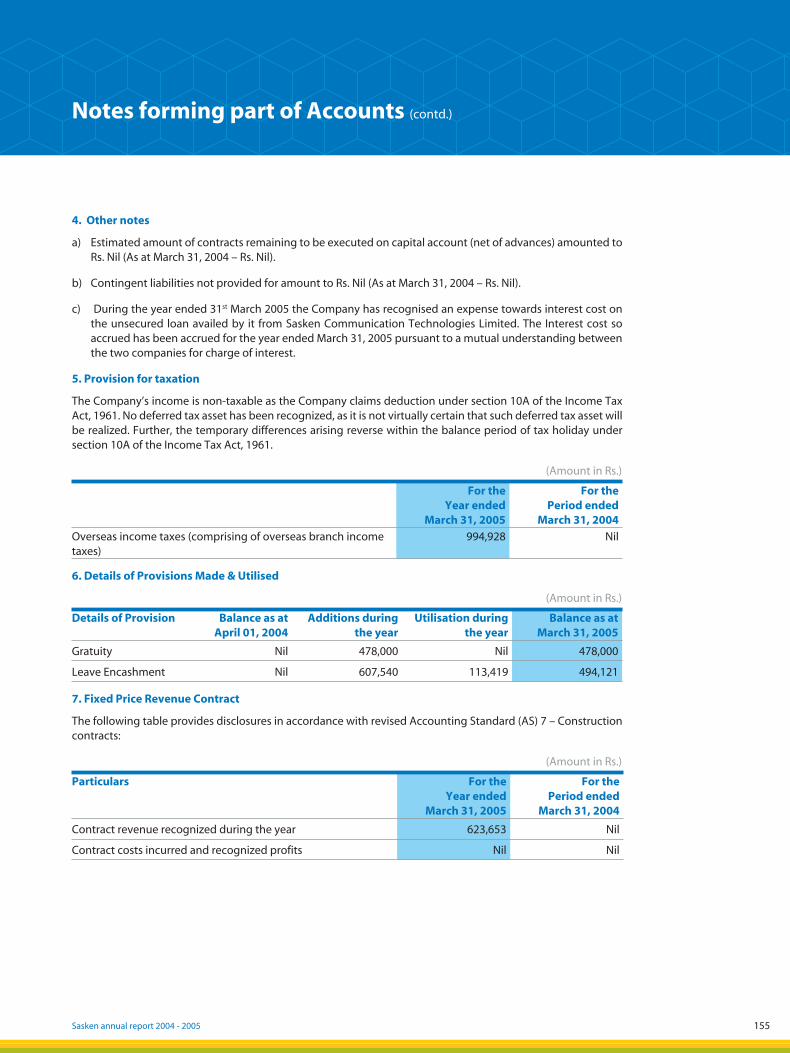
Sasken annual report 2004 - 2005 155
4. Other notes
a) Estimated amount of contracts remaining to be executed on capital account (net of advances) amounted to Rs. Nil (As at March 31, 2004 – Rs. Nil).
b) Contingent liabilities not provided for amount to Rs. Nil (As at March 31, 2004 – Rs. Nil).
c) During the year ended 31st March 2005 the Company has recognised an expense towards interest cost on the unsecured loan availed by it from Sasken Communication Technologies Limited. The Interest cost so accrued has been accrued for the year ended March 31, 2005 pursuant to a mutual understanding between the two companies for charge of interest.
5. Provision for taxation
The Company’s income is non-taxable as the Company claims deduction under section 10A of the Income Tax Act, 1961. No deferred tax asset has been recognized, as it is not virtually certain that such deferred tax asset will be realized. Further, the temporary differences arising reverse within the balance period of tax holiday under section 10A of the Income Tax Act, 1961.
(Amount in Rs.)
For theYear ended
March 31, 2005
For thePeriod ended
March 31, 2004
Overseas income taxes (comprising of overseas branch income taxes)
994,928 Nil
6. Details of Provisions Made & Utilised
(Amount in Rs.)
Details of Provision Balance as at April 01, 2004
Additions during the year
Utilisation during the year
Balance as at March 31, 2005
Gratuity Nil 478,000 Nil 478,000
Leave Encashment Nil 607,540 113,419 494,121
7. Fixed Price Revenue Contract
The following table provides disclosures in accordance with revised Accounting Standard (AS) 7 – Construction contracts:
(Amount in Rs.)
Particulars For the Year ended
March 31, 2005
For thePeriod ended
March 31, 2004
Contract revenue recognized during the year 623,653 Nil
Contract costs incurred and recognized profits Nil Nil
Notes forming part of Accounts (contd.)
05050449_139_216.indd 15505050449_139_216.indd 155 5/19/05 10:27:18 PM5/19/05 10:27:18 PM
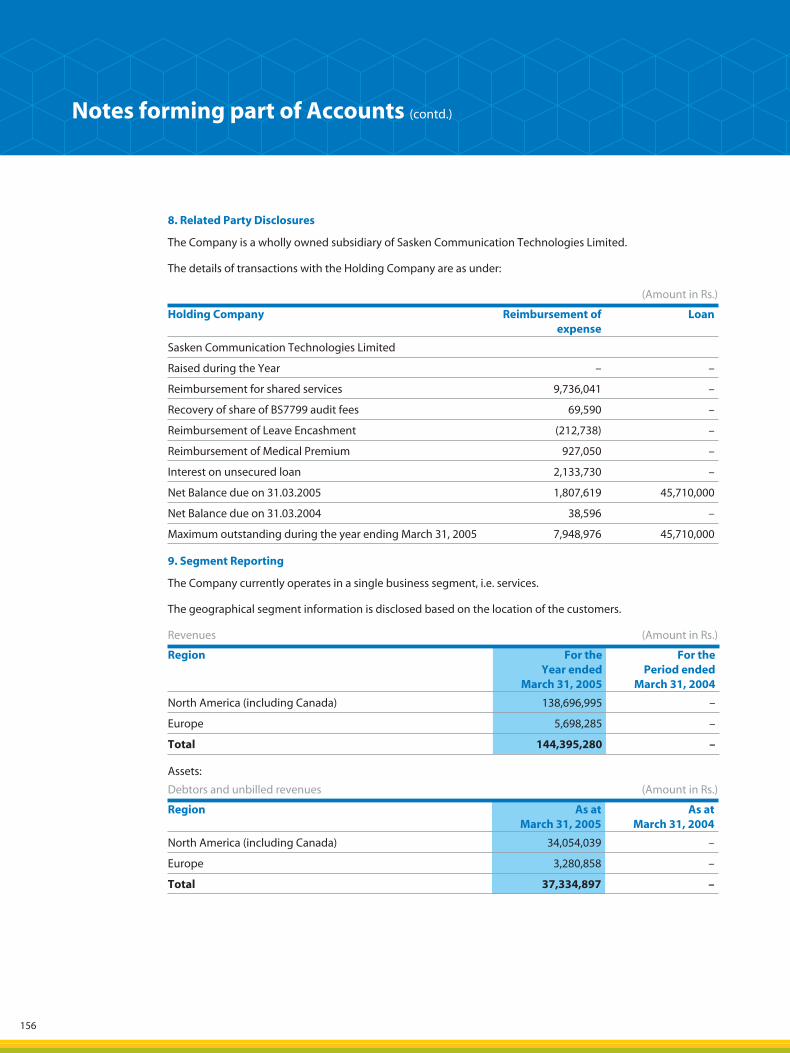
156
8. Related Party Disclosures
The Company is a wholly owned subsidiary of Sasken Communication Technologies Limited.
The details of transactions with the Holding Company are as under:
(Amount in Rs.)
Holding Company Reimbursement of expense
Loan
Sasken Communication Technologies Limited
Raised during the Year – –
Reimbursement for shared services 9,736,041 –
Recovery of share of BS7799 audit fees 69,590 –
Reimbursement of Leave Encashment (212,738) –
Reimbursement of Medical Premium 927,050 –
Interest on unsecured loan 2,133,730 –
Net Balance due on 31.03.2005 1,807,619 45,710,000
Net Balance due on 31.03.2004 38,596 –
Maximum outstanding during the year ending March 31, 2005 7,948,976 45,710,000
9. Segment Reporting
The Company currently operates in a single business segment, i.e. services.
The geographical segment information is disclosed based on the location of the customers.
Revenues (Amount in Rs.)
Region For the Year ended
March 31, 2005
For the Period ended
March 31, 2004
North America (including Canada) 138,696,995 –
Europe 5,698,285 –
Total 144,395,280 –
Assets:
Debtors and unbilled revenues (Amount in Rs.)
Region As at March 31, 2005
As at March 31, 2004
North America (including Canada) 34,054,039 –
Europe 3,280,858 –
Total 37,334,897 –
Notes forming part of Accounts (contd.)
05050449_139_216.indd 15605050449_139_216.indd 156 5/19/05 10:27:18 PM5/19/05 10:27:18 PM
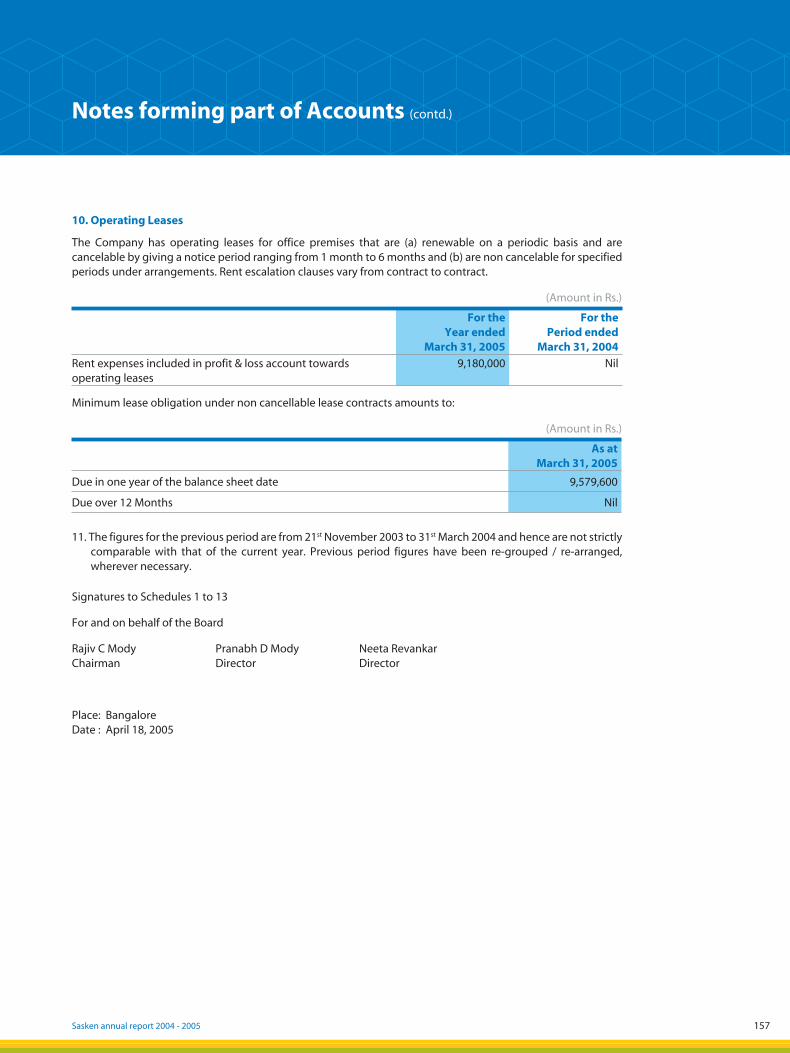
Sasken annual report 2004 - 2005 157
10. Operating Leases
The Company has operating leases for office premises that are (a) renewable on a periodic basis and are cancelable by giving a notice period ranging from 1 month to 6 months and (b) are non cancelable for specified periods under arrangements. Rent escalation clauses vary from contract to contract.
(Amount in Rs.)
For the Year ended
March 31, 2005
For the Period ended
March 31, 2004
Rent expenses included in profit & loss account towards operating leases
9,180,000 Nil
Minimum lease obligation under non cancellable lease contracts amounts to:
(Amount in Rs.)
As at March 31, 2005
Due in one year of the balance sheet date 9,579,600
Due over 12 Months Nil
11. The figures for the previous period are from 21st November 2003 to 31st March 2004 and hence are not strictly comparable with that of the current year. Previous period figures have been re-grouped / re-arranged, wherever necessary.
Signatures to Schedules 1 to 13
For and on behalf of the Board
Rajiv C Mody Pranabh D Mody Neeta RevankarChairman Director Director
Place: BangaloreDate : April 18, 2005
Notes forming part of Accounts (contd.)
05050449_139_216.indd 15705050449_139_216.indd 157 5/19/05 10:27:19 PM5/19/05 10:27:19 PM
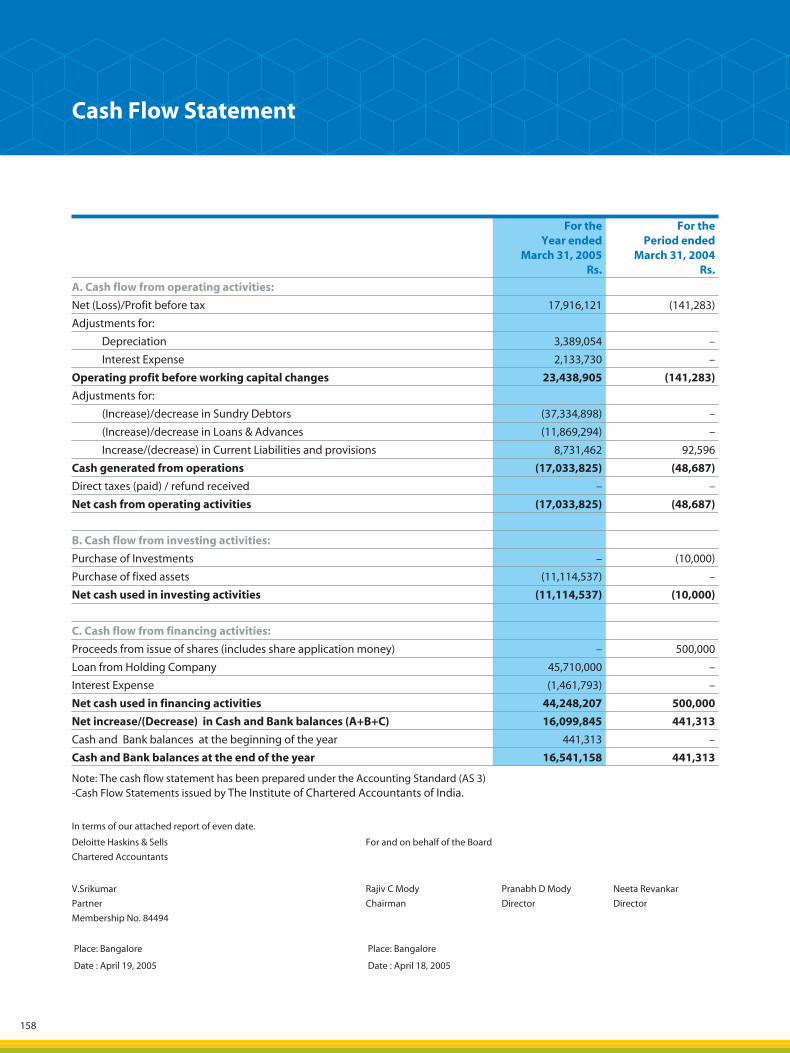
158
For the Year ended
March 31, 2005Rs.
For the Period ended
March 31, 2004Rs.
A. Cash flow from operating activities:
Net (Loss)/Profit before tax 17,916,121 (141,283)
Adjustments for:
Depreciation 3,389,054 –
Interest Expense 2,133,730 –
Operating profit before working capital changes 23,438,905 (141,283)
Adjustments for:
(Increase)/decrease in Sundry Debtors (37,334,898) –
(Increase)/decrease in Loans & Advances (11,869,294) –
Increase/(decrease) in Current Liabilities and provisions 8,731,462 92,596
Cash generated from operations (17,033,825) (48,687)
Direct taxes (paid) / refund received – –
Net cash from operating activities (17,033,825) (48,687)
B. Cash flow from investing activities:
Purchase of Investments – (10,000)
Purchase of fixed assets (11,114,537) –
Net cash used in investing activities (11,114,537) (10,000)
C. Cash flow from financing activities:
Proceeds from issue of shares (includes share application money) – 500,000
Loan from Holding Company 45,710,000 –
Interest Expense (1,461,793) –
Net cash used in financing activities 44,248,207 500,000
Net increase/(Decrease) in Cash and Bank balances (A+B+C) 16,099,845 441,313
Cash and Bank balances at the beginning of the year 441,313 –
Cash and Bank balances at the end of the year 16,541,158 441,313
Note: The cash flow statement has been prepared under the Accounting Standard (AS 3) -Cash Flow Statements issued by The Institute of Chartered Accountants of India.
Cash Flow Statement
In terms of our attached report of even date.
Deloitte Haskins & Sells
Chartered Accountants
For and on behalf of the Board
V.Srikumar
Partner
Membership No. 84494
Rajiv C Mody
Chairman
Pranabh D Mody
Director
Neeta Revankar
Director
Place: Bangalore Place: Bangalore
Date : April 19, 2005 Date : April 18, 2005
05050449_139_216.indd 15805050449_139_216.indd 158 5/19/05 10:27:20 PM5/19/05 10:27:20 PM

Sasken annual report 2004 - 2005 159
Information pursuant to Part IV of Schedule VI to the Companies Act, 1956
Statement on Balance Sheet Abstract and General Business Profile of the Company
I. Registration Details
Registration No 08/32760 State Code 8
Balance Sheet Date 31-03-05
II. Capital raised during the year
Public Issue – Rights Issue –
Bonus Issue – Conversion of FCD’s & Stock Options
–
III. Position of mobilisation and deployment of funds
Total Liabilities 629.90 Total Assets 629.90
Sources of Funds
Paid-up Capital 5.00
Reserves & Surplus 167.80
Unsecured Loans 457.10
Secured Loans –
Application of Funds
Net Fixed Assets 77.25
Capitalized Software –
Investments 0.10
Net Current Assets 552.55
Misc. Expenditure –
Accumulated Losses –
IV. Performance of the Company
Turnover 1,443.98 Total Expenditure 1,274.77
Profit/(Loss) before tax 179.16 Profit/(Loss) after tax 169.21
Earnings per share (Rs.) (Weighted average) 33.84 Dividend rate –
V. Generic names of three principal products of the Company
(as per monetary terms)
Item Code No (ITC Code) 85249009.10
Product Description: Computer Software
Balance Sheet Abstract
(Rs. in lakhs)
05050449_139_216.indd 15905050449_139_216.indd 159 5/19/05 10:27:20 PM5/19/05 10:27:20 PM

05050449_139_216.indd 16005050449_139_216.indd 160 5/19/05 10:27:21 PM5/19/05 10:27:21 PM

Sasken Network Engineering Limited
05050449_139_216.indd 16105050449_139_216.indd 161 5/19/05 10:27:26 PM5/19/05 10:27:26 PM
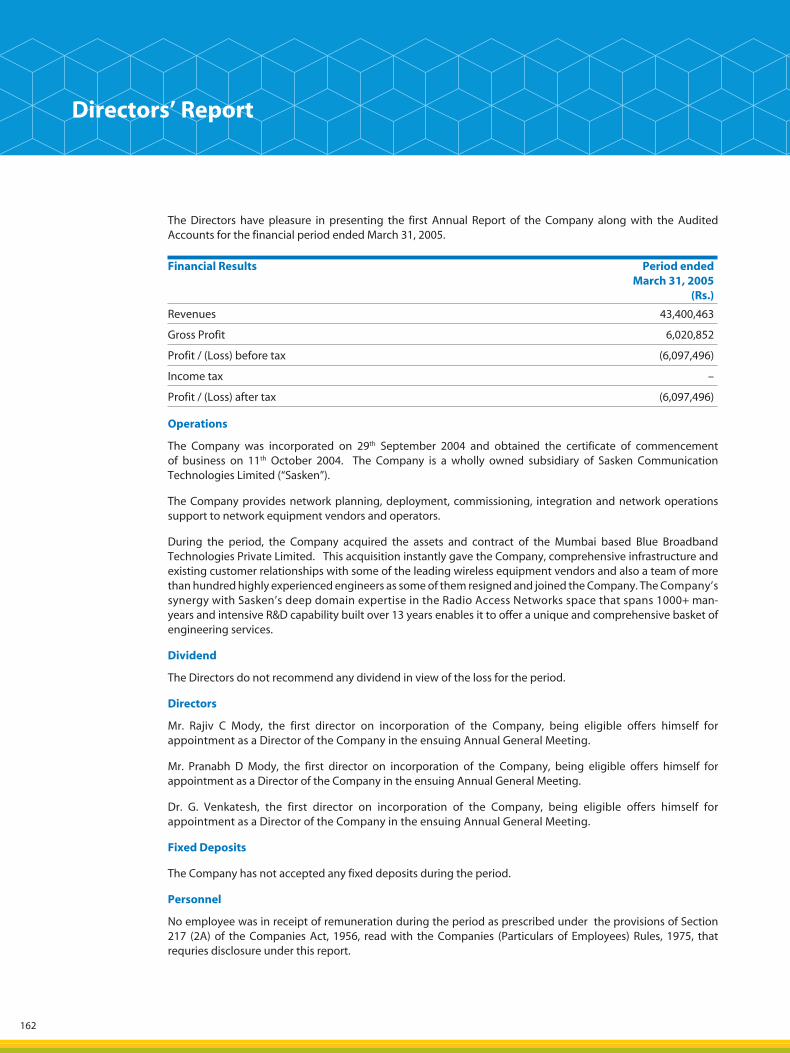
162
The Directors have pleasure in presenting the first Annual Report of the Company along with the Audited Accounts for the financial period ended March 31, 2005.
Financial Results Period ended March 31, 2005
(Rs.)
Revenues 43,400,463
Gross Profit 6,020,852
Profit / (Loss) before tax (6,097,496)
Income tax –
Profit / (Loss) after tax (6,097,496)
Operations
The Company was incorporated on 29th September 2004 and obtained the certificate of commencement of business on 11th October 2004. The Company is a wholly owned subsidiary of Sasken Communication Technologies Limited (“Sasken”).
The Company provides network planning, deployment, commissioning, integration and network operations support to network equipment vendors and operators.
During the period, the Company acquired the assets and contract of the Mumbai based Blue Broadband Technologies Private Limited. This acquisition instantly gave the Company, comprehensive infrastructure and existing customer relationships with some of the leading wireless equipment vendors and also a team of more than hundred highly experienced engineers as some of them resigned and joined the Company. The Company’s synergy with Sasken’s deep domain expertise in the Radio Access Networks space that spans 1000+ man-years and intensive R&D capability built over 13 years enables it to offer a unique and comprehensive basket of engineering services.
Dividend
The Directors do not recommend any dividend in view of the loss for the period.
Directors
Mr. Rajiv C Mody, the first director on incorporation of the Company, being eligible offers himself for appointment as a Director of the Company in the ensuing Annual General Meeting.
Mr. Pranabh D Mody, the first director on incorporation of the Company, being eligible offers himself for appointment as a Director of the Company in the ensuing Annual General Meeting.
Dr. G. Venkatesh, the first director on incorporation of the Company, being eligible offers himself for appointment as a Director of the Company in the ensuing Annual General Meeting.
Fixed Deposits
The Company has not accepted any fixed deposits during the period.
Personnel
No employee was in receipt of remuneration during the period as prescribed under the provisions of Section 217 (2A) of the Companies Act, 1956, read with the Companies (Particulars of Employees) Rules, 1975, that requries disclosure under this report.
Directors’ Report
05050449_139_216.indd 16205050449_139_216.indd 162 5/19/05 10:27:29 PM5/19/05 10:27:29 PM
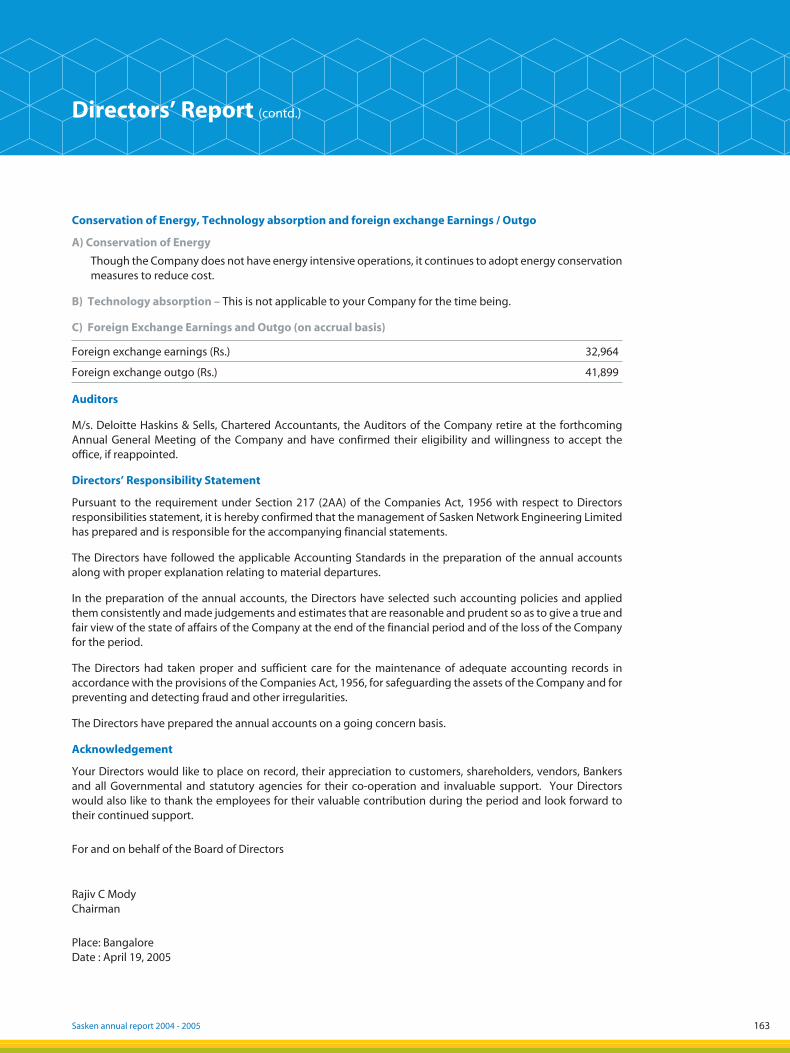
163Sasken annual report 2004 - 2005
Conservation of Energy, Technology absorption and foreign exchange Earnings / Outgo
A) Conservation of Energy
Though the Company does not have energy intensive operations, it continues to adopt energy conservation measures to reduce cost.
B) Technology absorption – This is not applicable to your Company for the time being.
C) Foreign Exchange Earnings and Outgo (on accrual basis)
Foreign exchange earnings (Rs.) 32,964
Foreign exchange outgo (Rs.) 41,899
Auditors
M/s. Deloitte Haskins & Sells, Chartered Accountants, the Auditors of the Company retire at the forthcoming Annual General Meeting of the Company and have confirmed their eligibility and willingness to accept the office, if reappointed.
Directors’ Responsibility Statement
Pursuant to the requirement under Section 217 (2AA) of the Companies Act, 1956 with respect to Directors responsibilities statement, it is hereby confirmed that the management of Sasken Network Engineering Limited has prepared and is responsible for the accompanying financial statements.
The Directors have followed the applicable Accounting Standards in the preparation of the annual accounts along with proper explanation relating to material departures.
In the preparation of the annual accounts, the Directors have selected such accounting policies and applied them consistently and made judgements and estimates that are reasonable and prudent so as to give a true and fair view of the state of affairs of the Company at the end of the financial period and of the loss of the Company for the period.
The Directors had taken proper and sufficient care for the maintenance of adequate accounting records in accordance with the provisions of the Companies Act, 1956, for safeguarding the assets of the Company and for preventing and detecting fraud and other irregularities.
The Directors have prepared the annual accounts on a going concern basis.
Acknowledgement
Your Directors would like to place on record, their appreciation to customers, shareholders, vendors, Bankers and all Governmental and statutory agencies for their co-operation and invaluable support. Your Directors would also like to thank the employees for their valuable contribution during the period and look forward to their continued support.
For and on behalf of the Board of Directors
Rajiv C Mody Chairman
Place: BangaloreDate : April 19, 2005
Directors’ Report (contd.)
11
05050449_139_216.indd 16305050449_139_216.indd 163 5/19/05 10:27:29 PM5/19/05 10:27:29 PM

164
Auditors’ Report
To The Members of Sasken Network Engineering Limited
We have audited the attached Balance Sheet of SASKEN NETWORK ENGINEERING LIMITED as at March 31, 2005, the Profit and Loss Account and the Cash Flow Statement of the Company for the period ended on that date, both annexed thereto. These financial statements are the responsibility of the Company’s management. Our responsibility is to express an opinion on these financial statements based on our audit.
We conducted our audit in accordance with generally accepted auditing standards in India. These Standards require that we plan and perform the audit to obtain reasonable assurance whether the financial statements are free of material misstatement. An audit includes, examining on a test basis, evidence supporting the amounts and disclosures in the financial statements. An audit also includes assessing the accounting principles used and significant estimates made by the Management as well as evaluating the overall financial statement presentation. We believe that our audit provides a reasonable basis for our opinion.
As required by the Companies (Auditor’s Report) Order, 2003 issued by the Government of India in terms of Section 227 (4A) of the Companies Act, 1956, we give in the Annexure, a statement on the matters specified in paragraphs 4 and 5 of the said Order to the extent applicable to the Company.
Further to our comments in the Annexure referred to above, we report that:
(a) we have obtained all the information and explanations, which to the best of our knowledge and belief were necessary for the purposes of our audit;
(b) in our opinion, proper books of account as required by law have been kept by the Company, so far as it appears from our examination of the books;
(c) the Balance Sheet, the Profit and Loss Account and the Cash Flow Statement dealt with by this report are in agreement with the books of account;
(d) in our opinion, the Balance Sheet, the Profit and Loss Account and the Cash Flow Statement dealt with by this report are in compliance with the Accounting Standards referred to in Section 211 (3C) of the Companies Act, 1956;
(e) on the basis of the written representations from the directors as on March 31, 2005 and taken on record by the Board of Directors, we report that none of the directors is disqualified as on March 31, 2005 from being appointed as a director under Section 274 (1)(g) of the Companies Act, 1956;
(f) in our opinion and to the best of our information and according to the explanations given to us, the said accounts read together with the Notes thereon, give the information required by the Companies Act, 1956, in the manner so required and give a true and fair view in conformity with the accounting principles generally accepted in India:
(i) in the case of the Balance Sheet, of the state of affairs of the Company as at March 31, 2005;
(ii) in the case of the Profit and Loss Account, of the loss for the period ended on that date; and
(iii) in the case of the Cash Flow Statement, of the cash flows for the period ended on that date.
For Deloitte Haskins & Sells Chartered Accountants
Place: Bangalore V.SrikumarDate : April 19, 2005 Partner Membership No. 84494
05050449_139_216.indd 16405050449_139_216.indd 164 5/19/05 10:27:30 PM5/19/05 10:27:30 PM
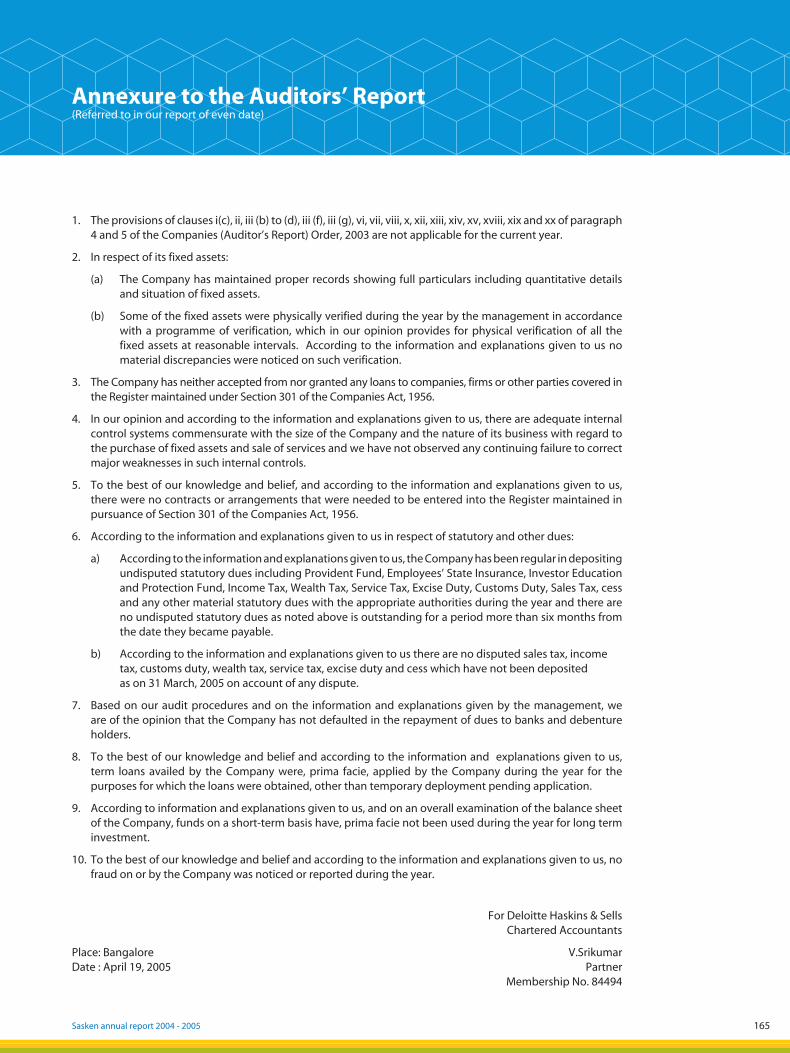
165Sasken annual report 2004 - 2005
Annexure to the Auditors’ Report(Referred to in our report of even date)
1. The provisions of clauses i(c), ii, iii (b) to (d), iii (f), iii (g), vi, vii, viii, x, xii, xiii, xiv, xv, xviii, xix and xx of paragraph 4 and 5 of the Companies (Auditor’s Report) Order, 2003 are not applicable for the current year.
2. In respect of its fixed assets:
(a) The Company has maintained proper records showing full particulars including quantitative details and situation of fixed assets.
(b) Some of the fixed assets were physically verified during the year by the management in accordance with a programme of verification, which in our opinion provides for physical verification of all the fixed assets at reasonable intervals. According to the information and explanations given to us no material discrepancies were noticed on such verification.
3. The Company has neither accepted from nor granted any loans to companies, firms or other parties covered in the Register maintained under Section 301 of the Companies Act, 1956.
4. In our opinion and according to the information and explanations given to us, there are adequate internal control systems commensurate with the size of the Company and the nature of its business with regard to the purchase of fixed assets and sale of services and we have not observed any continuing failure to correct major weaknesses in such internal controls.
5. To the best of our knowledge and belief, and according to the information and explanations given to us, there were no contracts or arrangements that were needed to be entered into the Register maintained in pursuance of Section 301 of the Companies Act, 1956.
6. According to the information and explanations given to us in respect of statutory and other dues:
a) According to the information and explanations given to us, the Company has been regular in depositing undisputed statutory dues including Provident Fund, Employees’ State Insurance, Investor Education and Protection Fund, Income Tax, Wealth Tax, Service Tax, Excise Duty, Customs Duty, Sales Tax, cess and any other material statutory dues with the appropriate authorities during the year and there are no undisputed statutory dues as noted above is outstanding for a period more than six months from the date they became payable.
b) According to the information and explanations given to us there are no disputed sales tax, income tax, customs duty, wealth tax, service tax, excise duty and cess which have not been deposited as on 31 March, 2005 on account of any dispute.
7. Based on our audit procedures and on the information and explanations given by the management, we are of the opinion that the Company has not defaulted in the repayment of dues to banks and debenture holders.
8. To the best of our knowledge and belief and according to the information and explanations given to us, term loans availed by the Company were, prima facie, applied by the Company during the year for the purposes for which the loans were obtained, other than temporary deployment pending application.
9. According to information and explanations given to us, and on an overall examination of the balance sheet of the Company, funds on a short-term basis have, prima facie not been used during the year for long term investment.
10. To the best of our knowledge and belief and according to the information and explanations given to us, no fraud on or by the Company was noticed or reported during the year.
For Deloitte Haskins & Sells Chartered Accountants
Place: Bangalore V.SrikumarDate : April 19, 2005 Partner Membership No. 84494
05050449_139_216.indd 16505050449_139_216.indd 165 5/19/05 10:27:31 PM5/19/05 10:27:31 PM
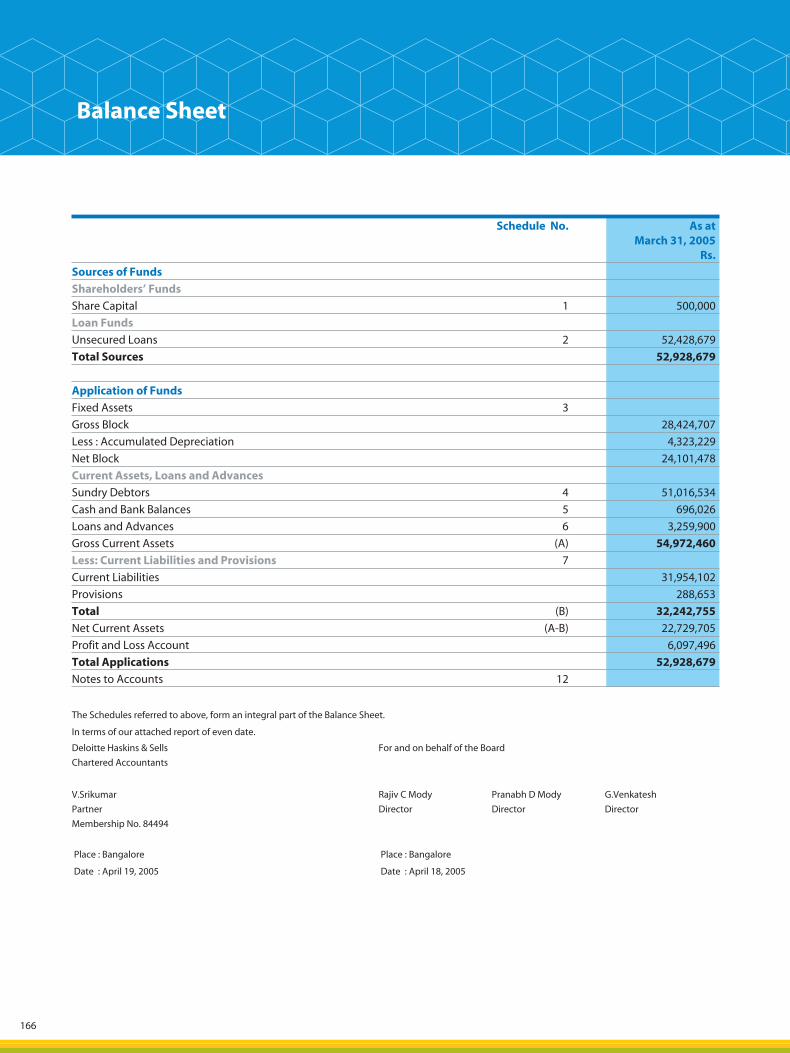
166
Schedule No. As at March 31, 2005
Rs.
Sources of Funds
Shareholders’ Funds
Share Capital 1 500,000
Loan Funds
Unsecured Loans 2 52,428,679
Total Sources 52,928,679
Application of Funds
Fixed Assets 3
Gross Block 28,424,707
Less : Accumulated Depreciation 4,323,229
Net Block 24,101,478
Current Assets, Loans and Advances
Sundry Debtors 4 51,016,534
Cash and Bank Balances 5 696,026
Loans and Advances 6 3,259,900
Gross Current Assets (A) 54,972,460
Less: Current Liabilities and Provisions 7
Current Liabilities 31,954,102
Provisions 288,653
Total (B) 32,242,755
Net Current Assets (A-B) 22,729,705
Profit and Loss Account 6,097,496
Total Applications 52,928,679
Notes to Accounts 12
Balance Sheet
The Schedules referred to above, form an integral part of the Balance Sheet.
In terms of our attached report of even date.
Deloitte Haskins & Sells
Chartered Accountants
For and on behalf of the Board
V.Srikumar
Partner
Membership No. 84494
Rajiv C Mody
Director
Pranabh D Mody
Director
G.Venkatesh
Director
Place : Bangalore Place : Bangalore
Date : April 19, 2005 Date : April 18, 2005
05050449_139_216.indd 16605050449_139_216.indd 166 5/19/05 10:27:32 PM5/19/05 10:27:32 PM
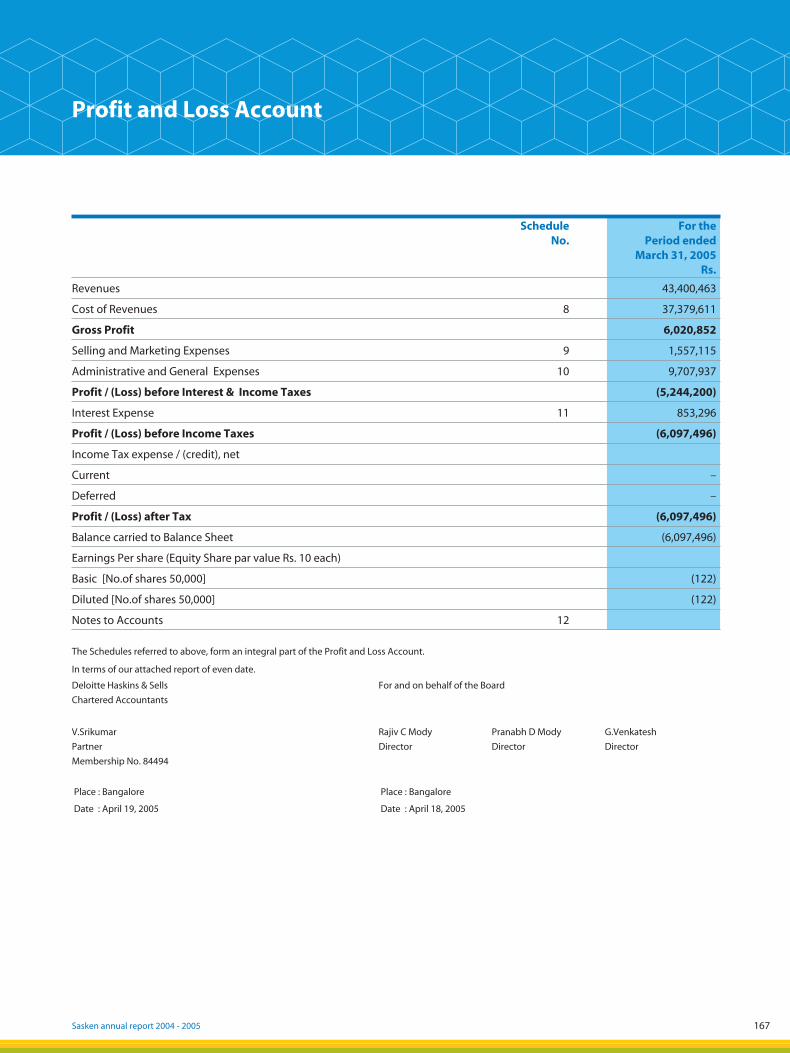
167Sasken annual report 2004 - 2005
Schedule No.
For the Period ended
March 31, 2005 Rs.
Revenues 43,400,463
Cost of Revenues 8 37,379,611
Gross Profit 6,020,852
Selling and Marketing Expenses 9 1,557,115
Administrative and General Expenses 10 9,707,937
Profit / (Loss) before Interest & Income Taxes (5,244,200)
Interest Expense 11 853,296
Profit / (Loss) before Income Taxes (6,097,496)
Income Tax expense / (credit), net
Current –
Deferred –
Profit / (Loss) after Tax (6,097,496)
Balance carried to Balance Sheet (6,097,496)
Earnings Per share (Equity Share par value Rs. 10 each)
Basic [No.of shares 50,000] (122)
Diluted [No.of shares 50,000] (122)
Notes to Accounts 12
Profit and Loss Account
The Schedules referred to above, form an integral part of the Profit and Loss Account.
In terms of our attached report of even date.
Deloitte Haskins & Sells
Chartered Accountants
For and on behalf of the Board
V.Srikumar
Partner
Membership No. 84494
Rajiv C Mody
Director
Pranabh D Mody
Director
G.Venkatesh
Director
Place : Bangalore Place : Bangalore
Date : April 19, 2005 Date : April 18, 2005
05050449_139_216.indd 16705050449_139_216.indd 167 5/19/05 10:27:33 PM5/19/05 10:27:33 PM
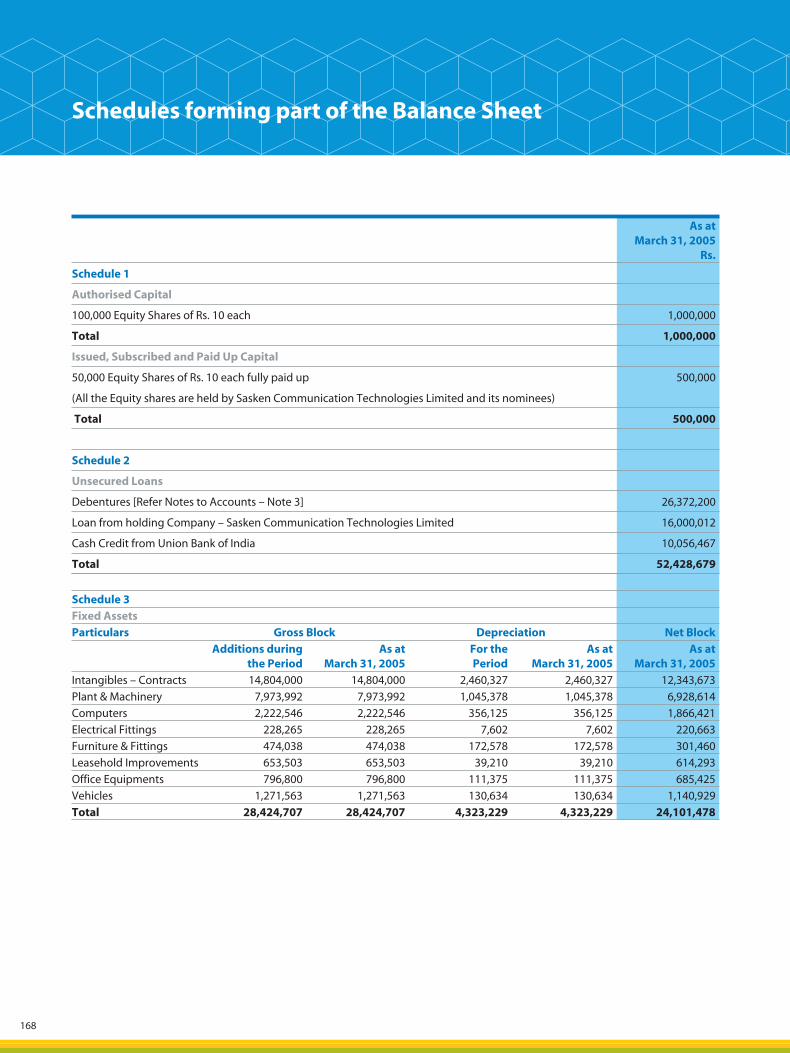
168
Schedules forming part of the Balance Sheet
As at March 31, 2005
Rs.
Schedule 1
Authorised Capital
100,000 Equity Shares of Rs. 10 each 1,000,000
Total 1,000,000
Issued, Subscribed and Paid Up Capital
50,000 Equity Shares of Rs. 10 each fully paid up 500,000
(All the Equity shares are held by Sasken Communication Technologies Limited and its nominees)
Total 500,000
Schedule 2
Unsecured Loans
Debentures [Refer Notes to Accounts – Note 3] 26,372,200
Loan from holding Company – Sasken Communication Technologies Limited 16,000,012
Cash Credit from Union Bank of India 10,056,467
Total 52,428,679
Schedule 3
Fixed Assets
Particulars Gross Block Depreciation Net Block
Additions during the Period
As atMarch 31, 2005
For thePeriod
As atMarch 31, 2005
As atMarch 31, 2005
Intangibles – Contracts 14,804,000 14,804,000 2,460,327 2,460,327 12,343,673
Plant & Machinery 7,973,992 7,973,992 1,045,378 1,045,378 6,928,614
Computers 2,222,546 2,222,546 356,125 356,125 1,866,421
Electrical Fittings 228,265 228,265 7,602 7,602 220,663
Furniture & Fittings 474,038 474,038 172,578 172,578 301,460
Leasehold Improvements 653,503 653,503 39,210 39,210 614,293
Office Equipments 796,800 796,800 111,375 111,375 685,425
Vehicles 1,271,563 1,271,563 130,634 130,634 1,140,929
Total 28,424,707 28,424,707 4,323,229 4,323,229 24,101,478
05050449_139_216.indd 16805050449_139_216.indd 168 5/19/05 10:27:34 PM5/19/05 10:27:34 PM
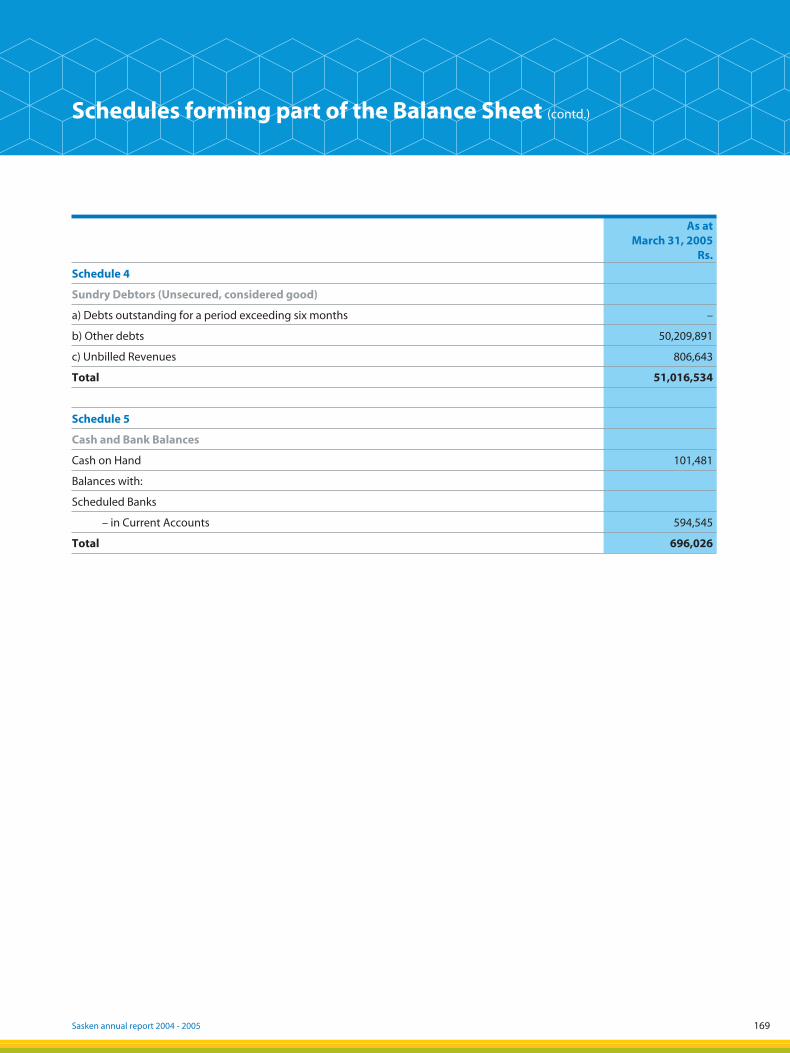
169Sasken annual report 2004 - 2005
As at March 31, 2005
Rs.
Schedule 4
Sundry Debtors (Unsecured, considered good)
a) Debts outstanding for a period exceeding six months –
b) Other debts 50,209,891
c) Unbilled Revenues 806,643
Total 51,016,534
Schedule 5
Cash and Bank Balances
Cash on Hand 101,481
Balances with:
Scheduled Banks
– in Current Accounts 594,545
Total 696,026
Schedules forming part of the Balance Sheet (contd.)
05050449_139_216.indd 16905050449_139_216.indd 169 5/19/05 10:27:35 PM5/19/05 10:27:35 PM
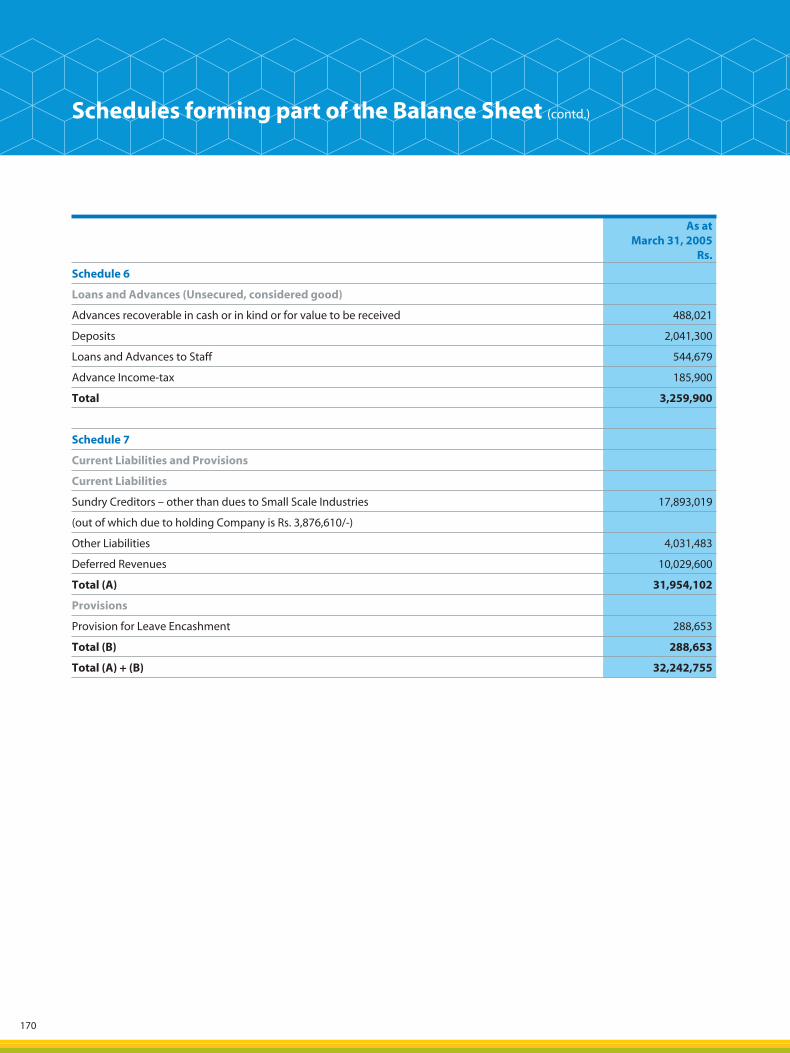
170
As at March 31, 2005
Rs.
Schedule 6
Loans and Advances (Unsecured, considered good)
Advances recoverable in cash or in kind or for value to be received 488,021
Deposits 2,041,300
Loans and Advances to Staff 544,679
Advance Income-tax 185,900
Total 3,259,900
Schedule 7
Current Liabilities and Provisions
Current Liabilities
Sundry Creditors – other than dues to Small Scale Industries 17,893,019
(out of which due to holding Company is Rs. 3,876,610/-)
Other Liabilities 4,031,483
Deferred Revenues 10,029,600
Total (A) 31,954,102
Provisions
Provision for Leave Encashment 288,653
Total (B) 288,653
Total (A) + (B) 32,242,755
Schedules forming part of the Balance Sheet (contd.)
05050449_139_216.indd 17005050449_139_216.indd 170 5/19/05 10:27:35 PM5/19/05 10:27:35 PM
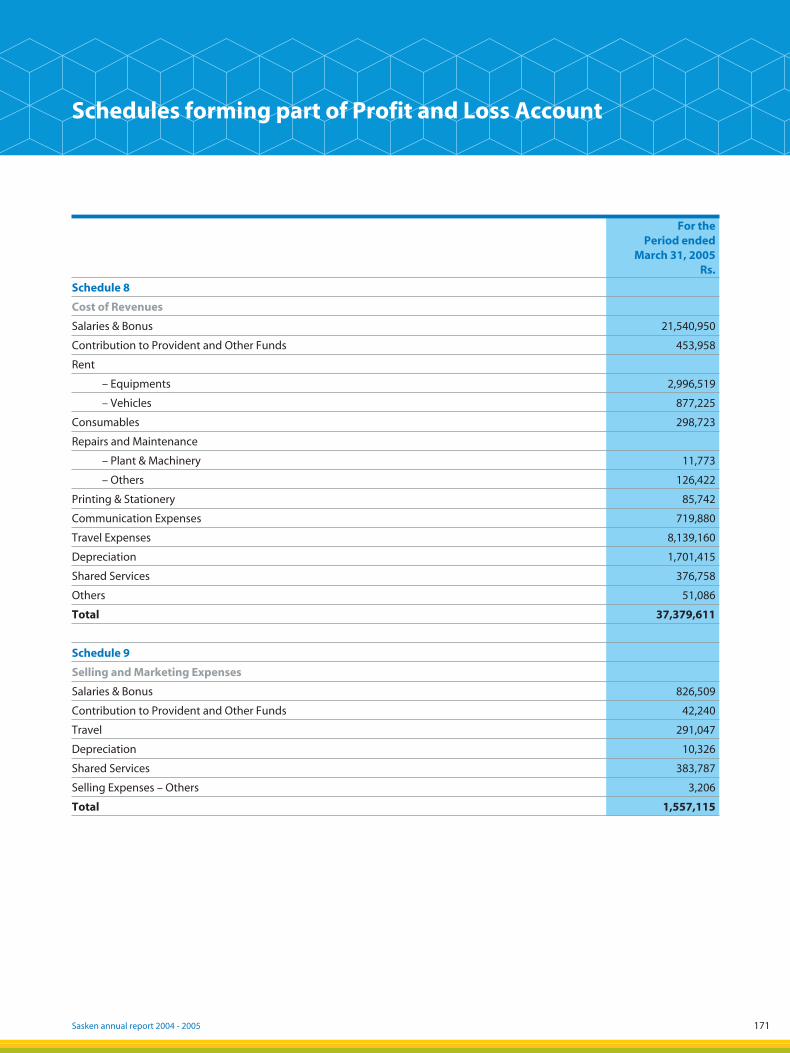
171Sasken annual report 2004 - 2005
For the Period ended
March 31, 2005 Rs.
Schedule 8
Cost of Revenues
Salaries & Bonus 21,540,950
Contribution to Provident and Other Funds 453,958
Rent
– Equipments 2,996,519
– Vehicles 877,225
Consumables 298,723
Repairs and Maintenance
– Plant & Machinery 11,773
– Others 126,422
Printing & Stationery 85,742
Communication Expenses 719,880
Travel Expenses 8,139,160
Depreciation 1,701,415
Shared Services 376,758
Others 51,086
Total 37,379,611
Schedule 9
Selling and Marketing Expenses
Salaries & Bonus 826,509
Contribution to Provident and Other Funds 42,240
Travel 291,047
Depreciation 10,326
Shared Services 383,787
Selling Expenses – Others 3,206
Total 1,557,115
Schedules forming part of Profit and Loss Account
05050449_139_216.indd 17105050449_139_216.indd 171 5/19/05 10:27:36 PM5/19/05 10:27:36 PM
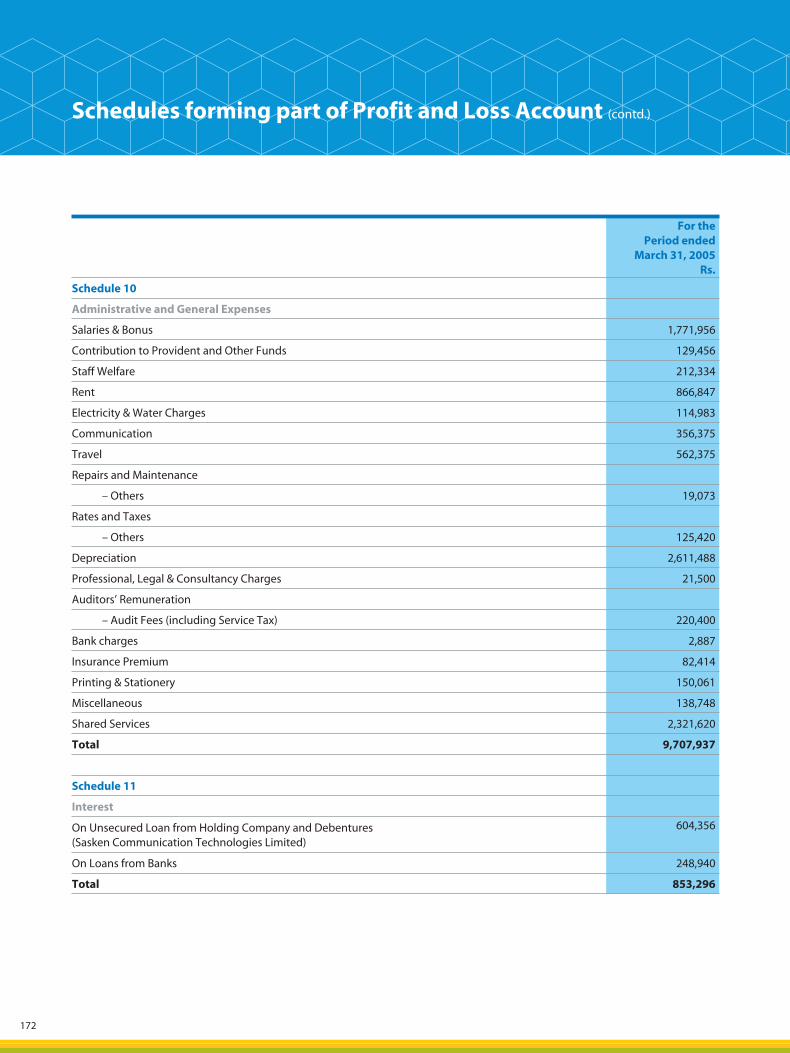
172
For the Period ended
March 31, 2005 Rs.
Schedule 10
Administrative and General Expenses
Salaries & Bonus 1,771,956
Contribution to Provident and Other Funds 129,456
Staff Welfare 212,334
Rent 866,847
Electricity & Water Charges 114,983
Communication 356,375
Travel 562,375
Repairs and Maintenance
– Others 19,073
Rates and Taxes
– Others 125,420
Depreciation 2,611,488
Professional, Legal & Consultancy Charges 21,500
Auditors’ Remuneration
– Audit Fees (including Service Tax) 220,400
Bank charges 2,887
Insurance Premium 82,414
Printing & Stationery 150,061
Miscellaneous 138,748
Shared Services 2,321,620
Total 9,707,937
Schedule 11
Interest
On Unsecured Loan from Holding Company and Debentures(Sasken Communication Technologies Limited)
604,356
On Loans from Banks 248,940
Total 853,296
Schedules forming part of Profit and Loss Account (contd.)
05050449_139_216.indd 17205050449_139_216.indd 172 5/19/05 10:27:37 PM5/19/05 10:27:37 PM
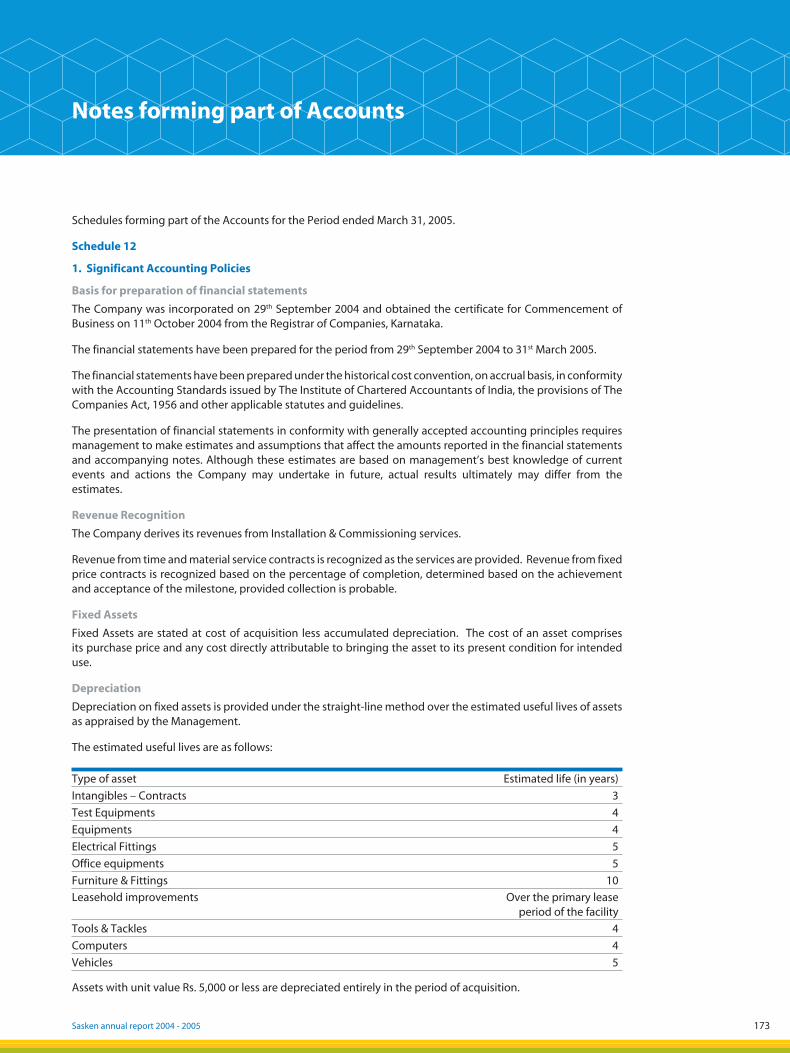
173Sasken annual report 2004 - 2005
Schedules forming part of the Accounts for the Period ended March 31, 2005.
Schedule 12
1. Significant Accounting Policies
Basis for preparation of financial statements
The Company was incorporated on 29th September 2004 and obtained the certificate for Commencement of Business on 11th October 2004 from the Registrar of Companies, Karnataka.
The financial statements have been prepared for the period from 29th September 2004 to 31st March 2005.
The financial statements have been prepared under the historical cost convention, on accrual basis, in conformity with the Accounting Standards issued by The Institute of Chartered Accountants of India, the provisions of The Companies Act, 1956 and other applicable statutes and guidelines.
The presentation of financial statements in conformity with generally accepted accounting principles requires management to make estimates and assumptions that affect the amounts reported in the financial statements and accompanying notes. Although these estimates are based on management’s best knowledge of current events and actions the Company may undertake in future, actual results ultimately may differ from the estimates.
Revenue Recognition
The Company derives its revenues from Installation & Commissioning services.
Revenue from time and material service contracts is recognized as the services are provided. Revenue from fixed price contracts is recognized based on the percentage of completion, determined based on the achievement and acceptance of the milestone, provided collection is probable.
Fixed Assets
Fixed Assets are stated at cost of acquisition less accumulated depreciation. The cost of an asset comprises its purchase price and any cost directly attributable to bringing the asset to its present condition for intended use.
Depreciation
Depreciation on fixed assets is provided under the straight-line method over the estimated useful lives of assets as appraised by the Management.
The estimated useful lives are as follows:
Type of asset Estimated life (in years)
Intangibles – Contracts 3
Test Equipments 4
Equipments 4
Electrical Fittings 5
Office equipments 5
Furniture & Fittings 10
Leasehold improvements Over the primary lease period of the facility
Tools & Tackles 4
Computers 4
Vehicles 5
Assets with unit value Rs. 5,000 or less are depreciated entirely in the period of acquisition.
Notes forming part of Accounts
05050449_139_216.indd 17305050449_139_216.indd 173 5/19/05 10:27:37 PM5/19/05 10:27:37 PM
174
Generic Computer Software is depreciated over a period of twelve months.
Foreign Exchange Transactions
Transactions arising in foreign currency are recorded at average rates closely approximating those ruling at the transaction dates. Assets and liabilities in foreign currency (other than those covered by forward contracts) as at the date of Balance Sheet are re-stated at year end exchange rate. All exchange differences arising from settlement / conversion are recognized in the Profit and Loss Account, except differences on liabilities for purchase of fixed assets, which are capitalized.
Retirement benefits to employees
The Company contributes to a Group Gratuity Scheme formulated by the Holding Company, Sasken Communication Technologies Limited and administered by a Private Insurance Company. No contributions or provision is made during the period based on the actuarial valuation received being Nil value, as at the end of the period.
Provision for leave encashment benefits is made based on actuarial valuation.
The contributions towards Provident Fund and Pension fund are remitted to the Office of the Regional Provident Fund Commissioner, Bangalore. Contributions towards Provident Fund and Pension Fund are charged to the Profit and Loss Account on an accrual basis.
Impairment of assets
The Company assesses at each balance sheet date whether there is any indication that an asset may be impaired. If any such indication exists, the Company estimates the recoverable amount of the asset. If such recoverable amount of the asset or recoverable amount of the cash-generating unit to which the asset belongs is less than its carrying amount, the carrying amount is reduced to its recoverable amount. The reduction is treated as an impairment loss and is recognized in the profit and loss account. If at the balance sheet date there is an indication that if a previously assessed impairment loss no longer exists, the recoverable amount is reassessed and the asset is reflected at the recoverable amount.
Income Taxes
Tax expense comprises both current and deferred taxes. Deferred income taxes reflect the impact of current year timing differences between taxable income and accounting income for the year and reversal of timing differences of earlier years. Deferred tax is measured based on the tax rates and the tax laws enacted or substantively enacted at the balance sheet date. Deferred tax assets are recognized only to the extent that there is reasonable certainty that sufficient future taxable income will be available against which such deferred tax assets can be realized. Deferred tax assets are recognized on carry forward of unabsorbed depreciation and tax losses only if there is virtual certainty that such deferred tax assets can be realized against future taxable profits.
Provisions
A provision is recognized when an enterprise has a present obligation as a result of past event; it is probable that an outflow of resources will be required to settle the obligation, in respect of which a reliable estimate can be made. Provisions are not discounted to its present value and are determined based on best estimate required to settle the obligation at the balance sheet date. These are reviewed at each balance sheet date and adjusted to reflect the current best estimates.
Segment Reporting
The Company provides installation and commissioning services in India to network equipment companies. The Company currently operates in a single business and geographical segment.
Notes forming part of Accounts (contd.)
05050449_139_216.indd 17405050449_139_216.indd 174 5/19/05 10:27:38 PM5/19/05 10:27:38 PM
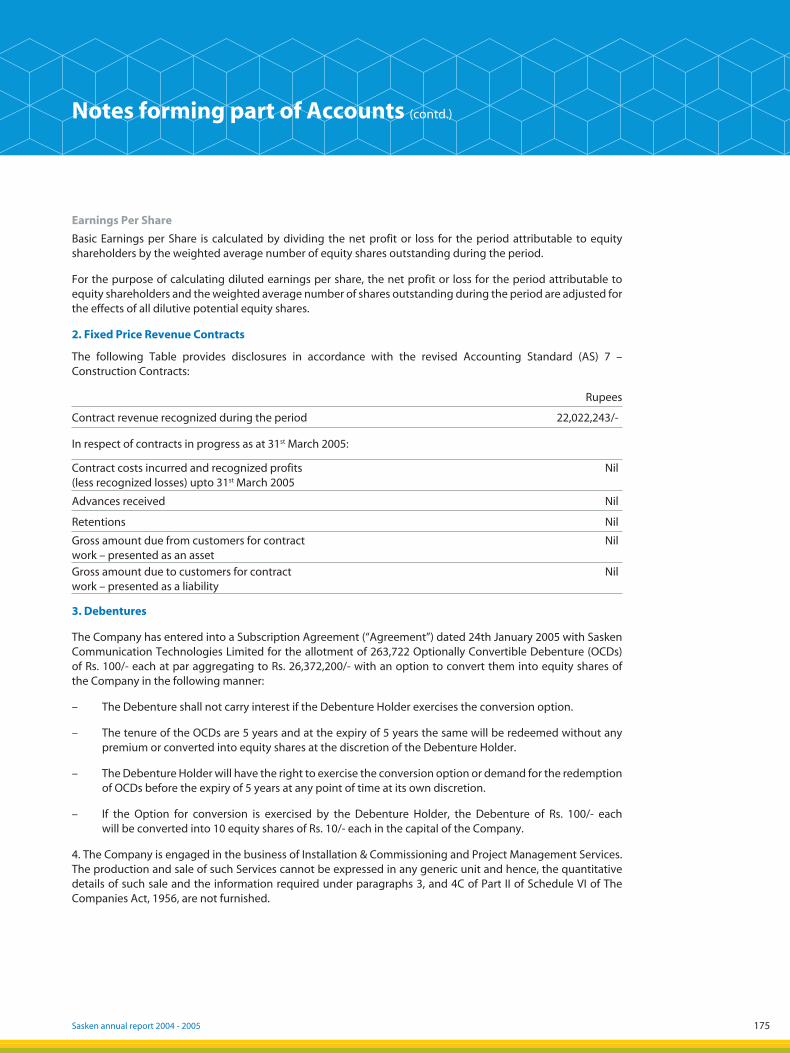
175Sasken annual report 2004 - 2005
Earnings Per Share
Basic Earnings per Share is calculated by dividing the net profit or loss for the period attributable to equity shareholders by the weighted average number of equity shares outstanding during the period.
For the purpose of calculating diluted earnings per share, the net profit or loss for the period attributable to equity shareholders and the weighted average number of shares outstanding during the period are adjusted for the effects of all dilutive potential equity shares.
2. Fixed Price Revenue Contracts
The following Table provides disclosures in accordance with the revised Accounting Standard (AS) 7 – Construction Contracts:
Rupees
Contract revenue recognized during the period 22,022,243/-
In respect of contracts in progress as at 31st March 2005:
Contract costs incurred and recognized profits (less recognized losses) upto 31st March 2005
Nil
Advances received Nil
Retentions Nil
Gross amount due from customers for contractwork – presented as an asset
Nil
Gross amount due to customers for contract work – presented as a liability
Nil
3. Debentures
The Company has entered into a Subscription Agreement (“Agreement”) dated 24th January 2005 with Sasken Communication Technologies Limited for the allotment of 263,722 Optionally Convertible Debenture (OCDs) of Rs. 100/- each at par aggregating to Rs. 26,372,200/- with an option to convert them into equity shares of the Company in the following manner:
– The Debenture shall not carry interest if the Debenture Holder exercises the conversion option.
– The tenure of the OCDs are 5 years and at the expiry of 5 years the same will be redeemed without any premium or converted into equity shares at the discretion of the Debenture Holder.
– The Debenture Holder will have the right to exercise the conversion option or demand for the redemption of OCDs before the expiry of 5 years at any point of time at its own discretion.
– If the Option for conversion is exercised by the Debenture Holder, the Debenture of Rs. 100/- each will be converted into 10 equity shares of Rs. 10/- each in the capital of the Company.
4. The Company is engaged in the business of Installation & Commissioning and Project Management Services. The production and sale of such Services cannot be expressed in any generic unit and hence, the quantitative details of such sale and the information required under paragraphs 3, and 4C of Part II of Schedule VI of The Companies Act, 1956, are not furnished.
Notes forming part of Accounts (contd.)
05050449_139_216.indd 17505050449_139_216.indd 175 5/19/05 10:27:39 PM5/19/05 10:27:39 PM
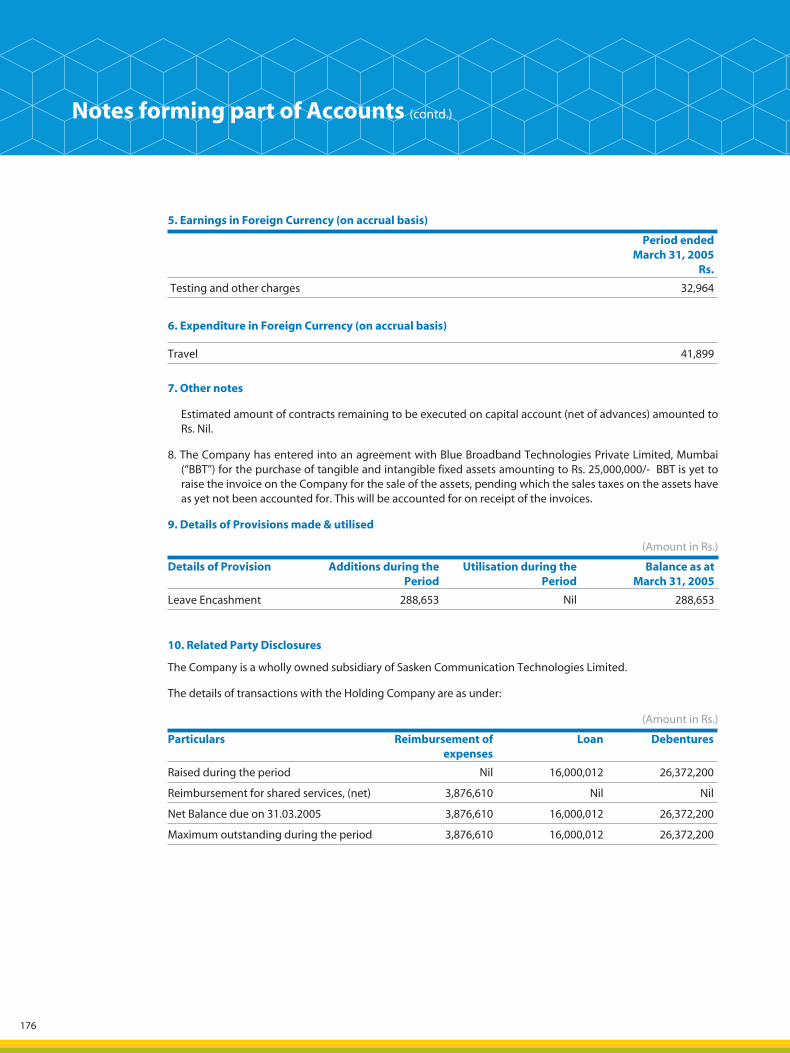
176
5. Earnings in Foreign Currency (on accrual basis)
Period ended March 31, 2005
Rs.
Testing and other charges 32,964
6. Expenditure in Foreign Currency (on accrual basis)
Travel 41,899
7. Other notes
Estimated amount of contracts remaining to be executed on capital account (net of advances) amounted to Rs. Nil.
8. The Company has entered into an agreement with Blue Broadband Technologies Private Limited, Mumbai (“BBT”) for the purchase of tangible and intangible fixed assets amounting to Rs. 25,000,000/- BBT is yet to raise the invoice on the Company for the sale of the assets, pending which the sales taxes on the assets have as yet not been accounted for. This will be accounted for on receipt of the invoices.
9. Details of Provisions made & utilised
(Amount in Rs.)
Details of Provision Additions during the Period
Utilisation during the Period
Balance as at March 31, 2005
Leave Encashment 288,653 Nil 288,653
10. Related Party Disclosures
The Company is a wholly owned subsidiary of Sasken Communication Technologies Limited.
The details of transactions with the Holding Company are as under:
(Amount in Rs.)
Particulars Reimbursement of expenses
Loan Debentures
Raised during the period Nil 16,000,012 26,372,200
Reimbursement for shared services, (net) 3,876,610 Nil Nil
Net Balance due on 31.03.2005 3,876,610 16,000,012 26,372,200
Maximum outstanding during the period 3,876,610 16,000,012 26,372,200
Notes forming part of Accounts (contd.)
05050449_139_216.indd 17605050449_139_216.indd 176 5/19/05 10:27:40 PM5/19/05 10:27:40 PM

177Sasken annual report 2004 - 2005
11. Operating Leases
The Company has operating leases for office/Guest House premises that are (a) renewable on a periodic basis and are cancelable by giving a notice period ranging from 1 month to 6 months and (b) are non cancelable for specified periods under arrangements. Rent escalation clauses vary from contract to contract.
(Amount in Rs.)
Period ended March 31, 2005
Rent expenses included in profit & loss account towards operating leases 843,382
Minimum lease obligation under non-cancelable lease contracts amounts to:
As at March 31, 2005
Due in one year of the balance sheet date Nil
Due between one to five years Nil
12. Prior period comparative figures are not available as this being the first year of operations of the Company.
Notes forming part of Accounts (contd.)
Signatures to Schedules 1 to 12
For and on behalf of the Board
Rajiv C Mody
Director
Pranabh D Mody
Director
G.Venkatesh
Director
Place : Bangalore
Date : April 18, 2005
05050449_139_216.indd 17705050449_139_216.indd 177 5/19/05 10:27:41 PM5/19/05 10:27:41 PM
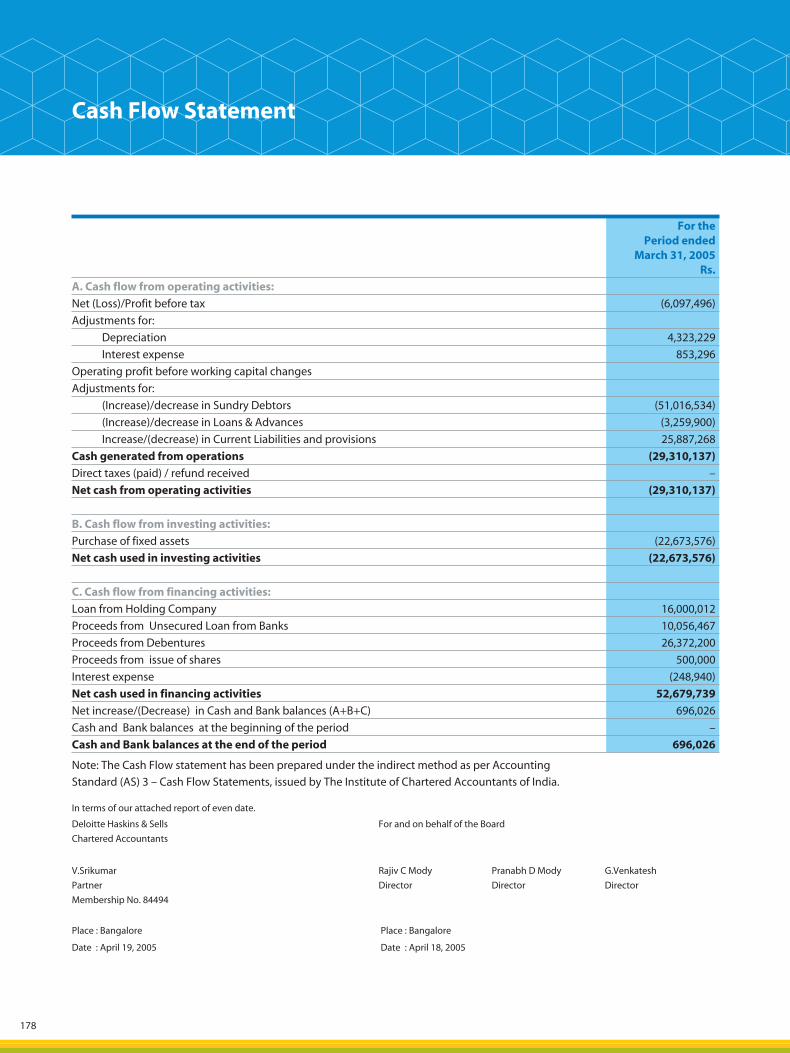
178
For the Period ended
March 31, 2005Rs.
A. Cash flow from operating activities:
Net (Loss)/Profit before tax (6,097,496)
Adjustments for:
Depreciation 4,323,229
Interest expense 853,296
Operating profit before working capital changes
Adjustments for:
(Increase)/decrease in Sundry Debtors (51,016,534)
(Increase)/decrease in Loans & Advances (3,259,900)
Increase/(decrease) in Current Liabilities and provisions 25,887,268
Cash generated from operations (29,310,137)
Direct taxes (paid) / refund received –
Net cash from operating activities (29,310,137)
B. Cash flow from investing activities:
Purchase of fixed assets (22,673,576)
Net cash used in investing activities (22,673,576)
C. Cash flow from financing activities:
Loan from Holding Company 16,000,012
Proceeds from Unsecured Loan from Banks 10,056,467
Proceeds from Debentures 26,372,200
Proceeds from issue of shares 500,000
Interest expense (248,940)
Net cash used in financing activities 52,679,739
Net increase/(Decrease) in Cash and Bank balances (A+B+C) 696,026
Cash and Bank balances at the beginning of the period –
Cash and Bank balances at the end of the period 696,026
Note: The Cash Flow statement has been prepared under the indirect method as per Accounting
Standard (AS) 3 – Cash Flow Statements, issued by The Institute of Chartered Accountants of India.
Cash Flow Statement
In terms of our attached report of even date.
Deloitte Haskins & Sells
Chartered Accountants
For and on behalf of the Board
V.Srikumar
Partner
Membership No. 84494
Rajiv C Mody
Director
Pranabh D Mody
Director
G.Venkatesh
Director
Place : Bangalore Place : Bangalore
Date : April 19, 2005 Date : April 18, 2005
05050449_139_216.indd 17805050449_139_216.indd 178 5/19/05 10:27:42 PM5/19/05 10:27:42 PM
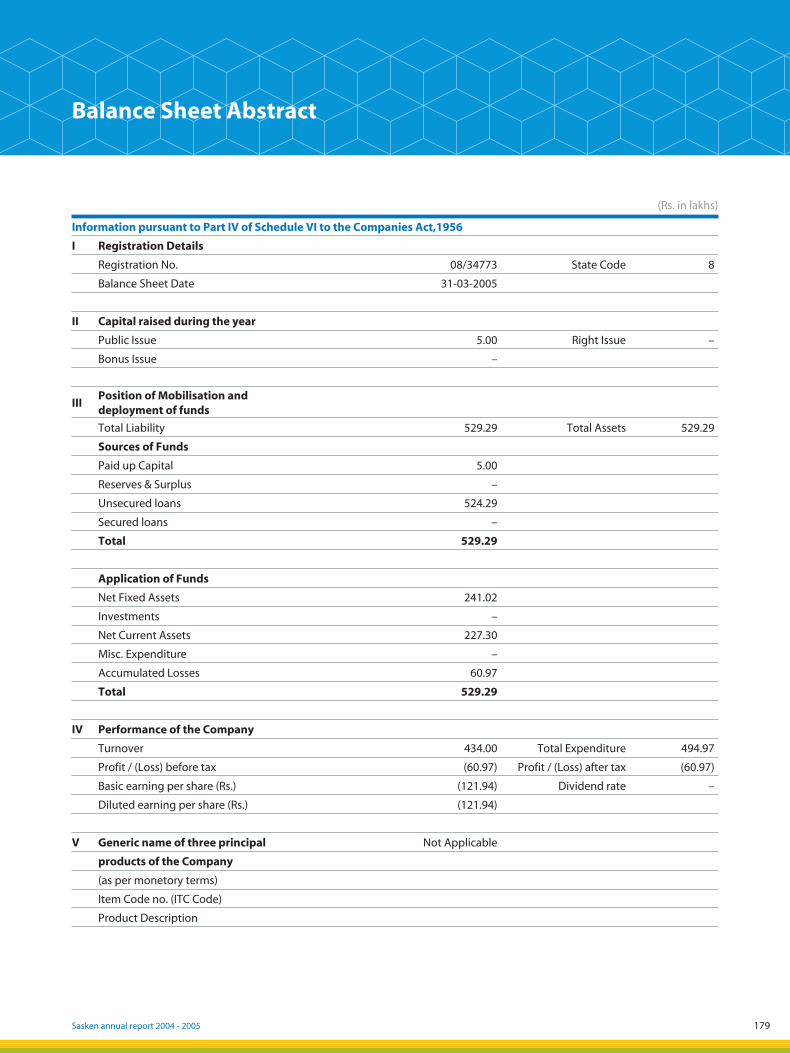
179Sasken annual report 2004 - 2005
Balance Sheet Abstract
Information pursuant to Part IV of Schedule VI to the Companies Act,1956
I Registration Details
Registration No. 08/34773 State Code 8
Balance Sheet Date 31-03-2005
II Capital raised during the year
Public Issue 5.00 Right Issue –
Bonus Issue –
IIIPosition of Mobilisation and deployment of funds
Total Liability 529.29 Total Assets 529.29
Sources of Funds
Paid up Capital 5.00
Reserves & Surplus –
Unsecured loans 524.29
Secured loans –
Total 529.29
Application of Funds
Net Fixed Assets 241.02
Investments –
Net Current Assets 227.30
Misc. Expenditure –
Accumulated Losses 60.97
Total 529.29
IV Performance of the Company
Turnover 434.00 Total Expenditure 494.97
Profit / (Loss) before tax (60.97) Profit / (Loss) after tax (60.97)
Basic earning per share (Rs.) (121.94) Dividend rate –
Diluted earning per share (Rs.) (121.94)
V Generic name of three principal Not Applicable
products of the Company
(as per monetory terms)
Item Code no. (ITC Code)
Product Description
(Rs. in lakhs)
12
05050449_139_216.indd 17905050449_139_216.indd 179 5/19/05 10:27:43 PM5/19/05 10:27:43 PM

05050449_139_216.indd 18005050449_139_216.indd 180 5/19/05 10:27:44 PM5/19/05 10:27:44 PM

Financial Statements in Compliance with US GAAP
05050449_139_216.indd 18105050449_139_216.indd 181 5/19/05 10:27:46 PM5/19/05 10:27:46 PM

182
The management is responsible for preparing the Company’s financial statements and other related information that appear in this report. The management believes that the financial statements fairly reflect the form and substance of transactions and reasonably present the Company’s financial condition and results of operations, in accordance with United States Generally Accepted Accounting Principles. The management has included in the Company’s financial statement’s amounts that are based on estimates and judgments, which it believes are reasonable under the circumstances.
The Company maintains a system of internal procedures and controls intended to provide reasonable assurance that transactions are executed in accordance with Company policies and limits and are properly recorded and reported in the financial statements, and that assets are adequately safeguarded.
Ernst & Young audits the Company’s financial statements in accordance with generally accepted auditing standards and provides an objective, independent review of the Company’s internal controls and the fairness of its reported financial condition and results of operations.
Place : Bangalore Rajiv C ModyDate : April 19, 2005 Managing Director
Management Report
05050449_139_216.indd 18205050449_139_216.indd 182 5/19/05 10:27:49 PM5/19/05 10:27:49 PM
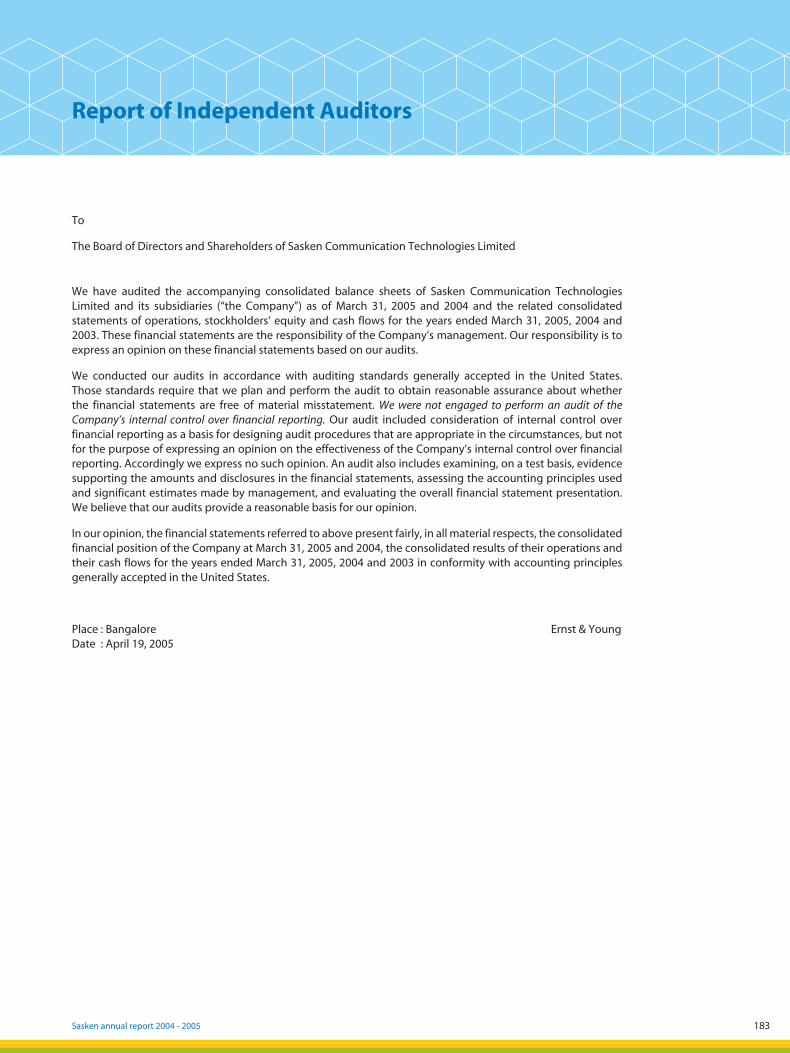
183Sasken annual report 2004 - 2005
To
The Board of Directors and Shareholders of Sasken Communication Technologies Limited
We have audited the accompanying consolidated balance sheets of Sasken Communication Technologies Limited and its subsidiaries (“the Company”) as of March 31, 2005 and 2004 and the related consolidated statements of operations, stockholders’ equity and cash flows for the years ended March 31, 2005, 2004 and 2003. These financial statements are the responsibility of the Company’s management. Our responsibility is to express an opinion on these financial statements based on our audits.
We conducted our audits in accordance with auditing standards generally accepted in the United States. Those standards require that we plan and perform the audit to obtain reasonable assurance about whether the financial statements are free of material misstatement. We were not engaged to perform an audit of the Company’s internal control over financial reporting. Our audit included consideration of internal control over financial reporting as a basis for designing audit procedures that are appropriate in the circumstances, but not for the purpose of expressing an opinion on the effectiveness of the Company’s internal control over financial reporting. Accordingly we express no such opinion. An audit also includes examining, on a test basis, evidence supporting the amounts and disclosures in the financial statements, assessing the accounting principles used and significant estimates made by management, and evaluating the overall financial statement presentation. We believe that our audits provide a reasonable basis for our opinion.
In our opinion, the financial statements referred to above present fairly, in all material respects, the consolidated financial position of the Company at March 31, 2005 and 2004, the consolidated results of their operations and their cash flows for the years ended March 31, 2005, 2004 and 2003 in conformity with accounting principles generally accepted in the United States.
Place : Bangalore Ernst & YoungDate : April 19, 2005
Report of Independent Auditors
05050449_139_216.indd 18305050449_139_216.indd 183 5/19/05 10:27:50 PM5/19/05 10:27:50 PM
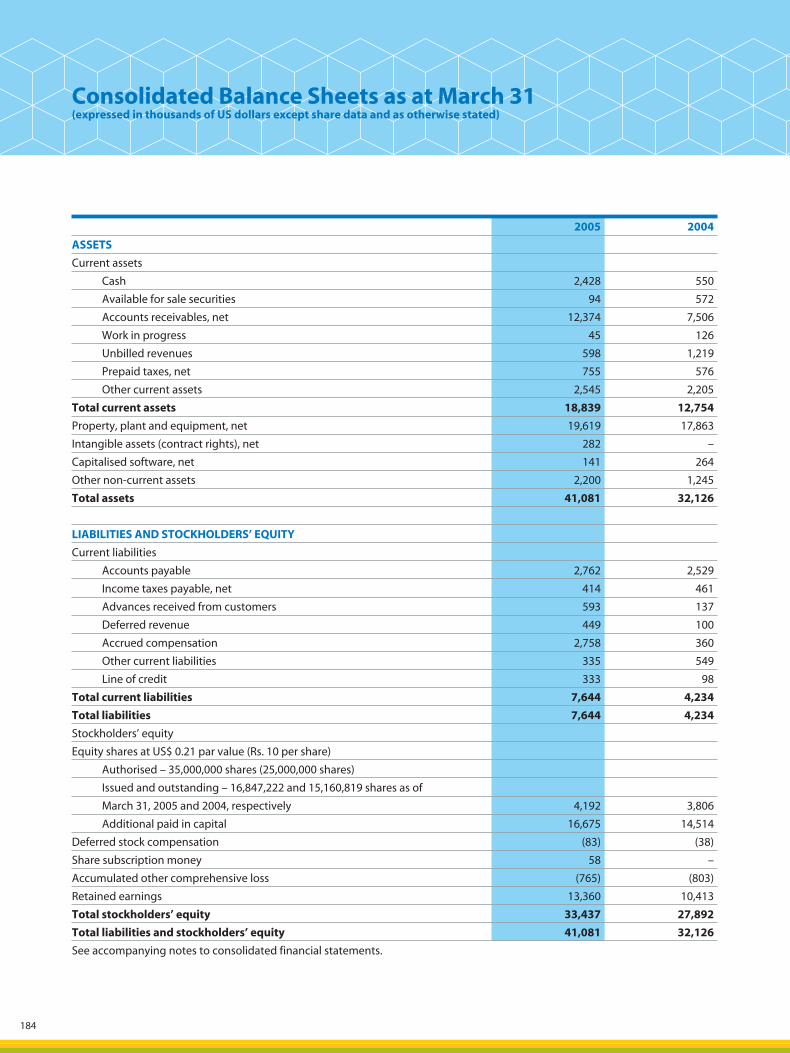
184
2005 2004
ASSETS
Current assets
Cash 2,428 550
Available for sale securities 94 572
Accounts receivables, net 12,374 7,506
Work in progress 45 126
Unbilled revenues 598 1,219
Prepaid taxes, net 755 576
Other current assets 2,545 2,205
Total current assets 18,839 12,754
Property, plant and equipment, net 19,619 17,863
Intangible assets (contract rights), net 282 –
Capitalised software, net 141 264
Other non-current assets 2,200 1,245
Total assets 41,081 32,126
LIABILITIES AND STOCKHOLDERS’ EQUITY
Current liabilities
Accounts payable 2,762 2,529
Income taxes payable, net 414 461
Advances received from customers 593 137
Deferred revenue 449 100
Accrued compensation 2,758 360
Other current liabilities 335 549
Line of credit 333 98
Total current liabilities 7,644 4,234
Total liabilities 7,644 4,234
Stockholders’ equity
Equity shares at US$ 0.21 par value (Rs. 10 per share)
Authorised – 35,000,000 shares (25,000,000 shares)
Issued and outstanding – 16,847,222 and 15,160,819 shares as of
March 31, 2005 and 2004, respectively 4,192 3,806
Additional paid in capital 16,675 14,514
Deferred stock compensation (83) (38)
Share subscription money 58 –
Accumulated other comprehensive loss (765) (803)
Retained earnings 13,360 10,413
Total stockholders’ equity 33,437 27,892
Total liabilities and stockholders’ equity 41,081 32,126
See accompanying notes to consolidated financial statements.
Consolidated Balance Sheets as at March 31 (expressed in thousands of US dollars except share data and as otherwise stated)
05050449_139_216.indd 18405050449_139_216.indd 184 5/19/05 10:27:51 PM5/19/05 10:27:51 PM

185Sasken annual report 2004 - 2005
2005 2004 2003
Revenues 55,737 37,221 23,460
Cost of Revenues 38,162 25,084 15,757
Gross Profit 17,575 12,137 7,703
Research & Development expenses 606 421 240
Selling & Marketing expenses 5,562 4,105 4,102
Administrative & General expenses 6,962 4,169 2,566
Employee Stock Option cost 164 34 –
Other than temporary impairment in value of available for sale securities – – 663
Income from Operations 4,281 3,408 132
Other income/(expenses), net 138 1,155 (34)
Interest expense 106 173 749
Income/(Loss) before income taxes 4,313 4,390 (651)
Income tax expense/(credit) 388 (463) 569
Net Income / (Loss) 3,925 4,853 (1,220)
EARNINGS PER SHARE
Basic earnings per share 0.24 0.32 (0.10)
Weighted shares used in computing basic earnings per share 16,335,283 15,093,479 12,689,718
Diluted earnings per share 0.23 0.31 (0.10)
Weighted shares used in computing diluted earnings per share 16,835,322 15,883,602 12,689,718
See accompanying notes to consolidated financial statements.
Consolidated Income Statements for the years ending March 31 (expressed in thousands of US dollars except share data, per share data and as otherwise stated)
05050449_139_216.indd 18505050449_139_216.indd 185 5/19/05 10:27:52 PM5/19/05 10:27:52 PM
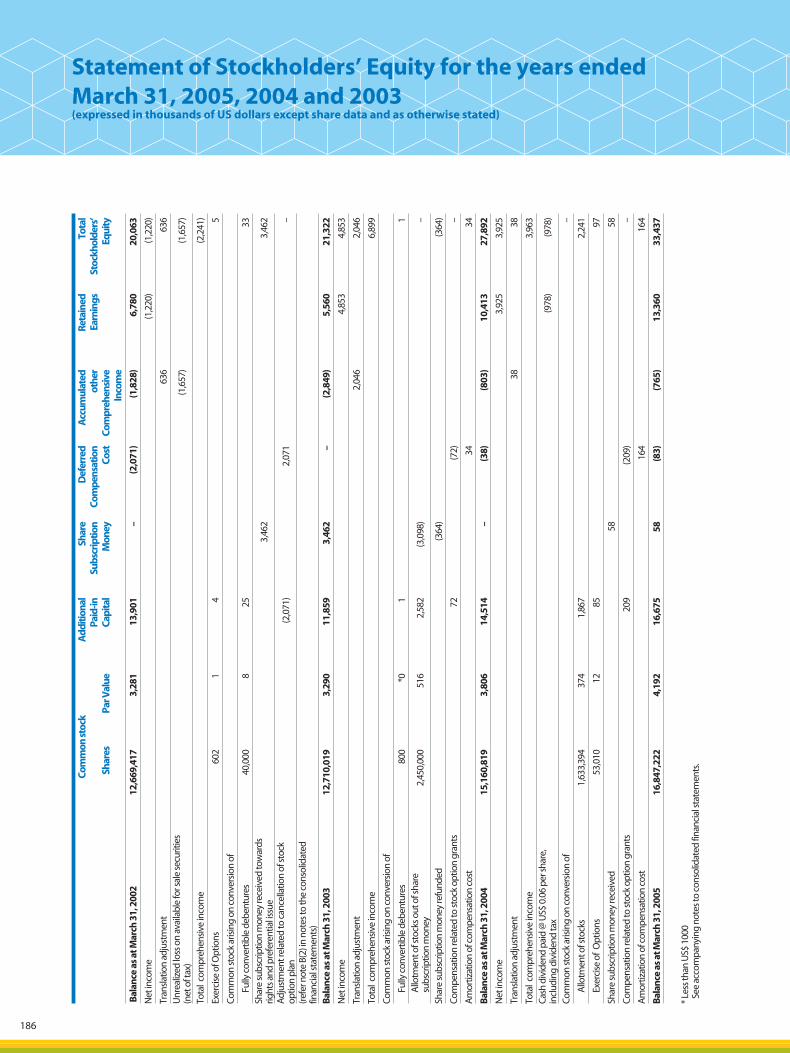
186
Com
mon
stoc
k
Shar
es
Par
Val
ue
Add
ition
al
Pai
d-in
C
apita
l
Sha
re
Sub
scrip
tion
Mon
ey
Def
erre
d
Com
pens
atio
n C
ost
Acc
umul
ated
o
ther
Co
mpr
ehen
sive
In
com
e
Ret
aine
d E
arni
ngs
Tot
al
Sto
ckho
lder
s’
Equ
ity
Bal
ance
as
at M
arch
31,
200
2 1
2,66
9,41
7 3
,281
1
3,90
1 –
(2,0
71)
(1,8
28)
6,7
80
20,
063
Net
inco
me
(1,2
20)
(1,2
20)
Tran
slat
ion
adju
stm
ent
636
6
36
Unr
ealiz
ed lo
ss o
n av
aila
ble
for s
ale
secu
ritie
s (n
et o
f tax
) (1
,657
) (1
,657
)
Tota
l com
preh
ensi
ve in
com
e (2
,241
)
Exer
cise
of O
ptio
ns
602
1
4
5
Com
mon
stoc
k ar
isin
g on
con
vers
ion
of
Fully
con
vert
ible
deb
entu
res
40,
000
8
25
33
Shar
e su
bscr
iptio
n m
oney
rece
ived
tow
ards
rig
hts a
nd p
refe
rent
ial i
ssue
3
,462
3
,462
Adj
ustm
ent r
elat
ed to
can
cella
tion
of st
ock
optio
n pl
an
(2,0
71)
2,0
71
–
(refe
r not
e B(
2) in
not
es to
the
cons
olid
ated
fin
anci
al st
atem
ents
) B
alan
ce a
s at
Mar
ch 3
1, 2
003
12,
710,
019
3,2
90
11,
859
3,4
62
– (2
,849
) 5
,560
2
1,32
2
Net
inco
me
4,8
53
4,8
53
Tran
slat
ion
adju
stm
ent
2,0
46
2,0
46
Tota
l com
preh
ensi
ve in
com
e 6
,899
Com
mon
stoc
k ar
isin
g on
con
vers
ion
of
Fully
con
vert
ible
deb
entu
res
800
*
0 1
1
A
llotm
ent o
f sto
cks o
ut o
f sha
re
subs
crip
tion
mon
ey
2,4
50,0
00
516
2
,582
(3
,098
)–
Shar
e su
bscr
iptio
n m
oney
refu
nded
(3
64)
(364
)
Com
pens
atio
n re
late
d to
stoc
k op
tion
gran
ts
72
(72)
–
Am
ortiz
atio
n of
com
pens
atio
n co
st
34
34
Bal
ance
as
at M
arch
31,
200
4 1
5,16
0,81
9 3
,806
1
4,51
4 –
(38)
(803
) 1
0,41
3 2
7,89
2
Net
inco
me
3,9
25
3,9
25
Tran
slat
ion
adju
stm
ent
38
38
Tota
l com
preh
ensi
ve in
com
e 3
,963
Ca
sh d
ivid
end
paid
@ U
S$ 0
.06
per s
hare
, in
clud
ing
divi
dend
tax
(978
) (9
78)
Com
mon
stoc
k ar
isin
g on
con
vers
ion
of
–
Allo
tmen
t of s
tock
s 1
,633
,394
3
74
1,8
67
2,2
41
Exer
cise
of
Opt
ions
5
3,01
0 1
2 8
5 97
Shar
e su
bscr
iptio
n m
oney
rece
ived
5
8 5
8
Com
pens
atio
n re
late
d to
stoc
k op
tion
gran
ts
209
(2
09)
–
Am
ortiz
atio
n of
com
pens
atio
n co
st
164
164
Bal
ance
as
at M
arch
31,
200
5 1
6,84
7,22
2 4
,192
16,
675
58
(83)
(765
) 1
3,36
0 3
3,43
7
* Le
ss th
an U
S$ 1
000
See
acc
ompa
nyin
g no
tes t
o co
nsol
idat
ed fi
nanc
ial s
tate
men
ts.
Statement of Stockholders’ Equity for the years ended March 31, 2005, 2004 and 2003 (expressed in thousands of US dollars except share data and as otherwise stated)
05050449_139_216.indd 18605050449_139_216.indd 186 5/19/05 10:27:53 PM5/19/05 10:27:53 PM
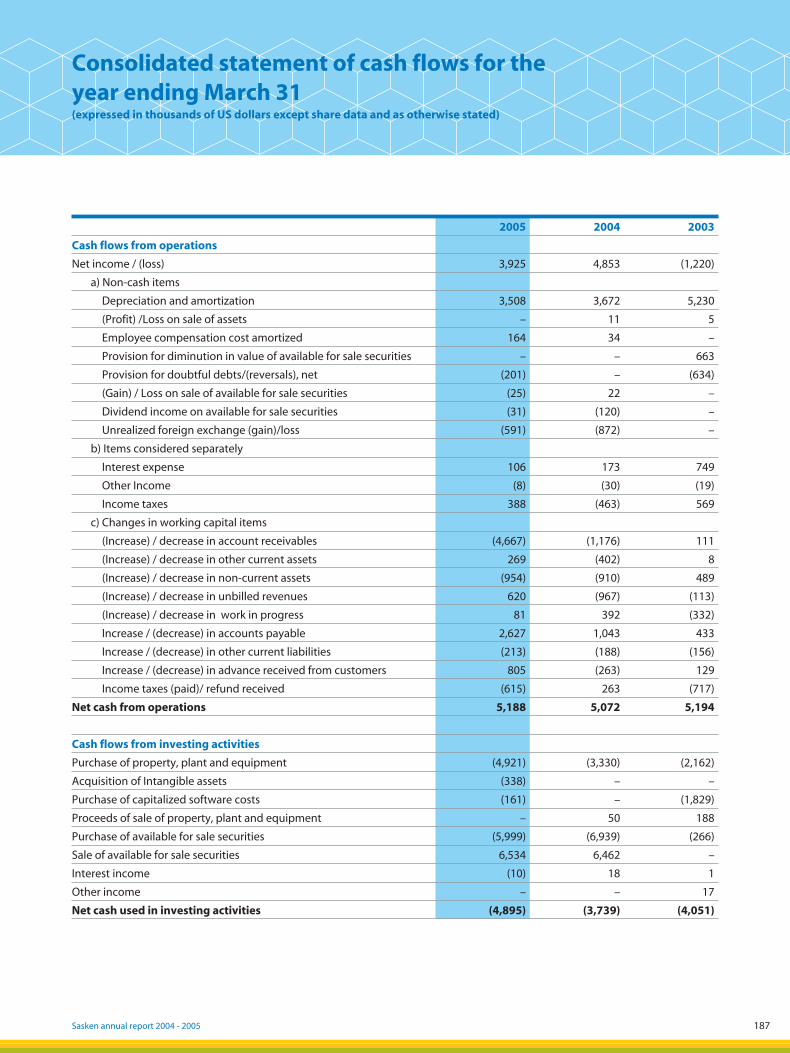
187Sasken annual report 2004 - 2005
Consolidated statement of cash flows for the year ending March 31(expressed in thousands of US dollars except share data and as otherwise stated)
2005 2004 2003
Cash flows from operations
Net income / (loss) 3,925 4,853 (1,220)
a) Non-cash items
Depreciation and amortization 3,508 3,672 5,230
(Profit) /Loss on sale of assets – 11 5
Employee compensation cost amortized 164 34 –
Provision for diminution in value of available for sale securities – – 663
Provision for doubtful debts/(reversals), net (201) – (634)
(Gain) / Loss on sale of available for sale securities (25) 22 –
Dividend income on available for sale securities (31) (120) –
Unrealized foreign exchange (gain)/loss (591) (872) –
b) Items considered separately
Interest expense 106 173 749
Other Income (8) (30) (19)
Income taxes 388 (463) 569
c) Changes in working capital items
(Increase) / decrease in account receivables (4,667) (1,176) 111
(Increase) / decrease in other current assets 269 (402) 8
(Increase) / decrease in non-current assets (954) (910) 489
(Increase) / decrease in unbilled revenues 620 (967) (113)
(Increase) / decrease in work in progress 81 392 (332)
Increase / (decrease) in accounts payable 2,627 1,043 433
Increase / (decrease) in other current liabilities (213) (188) (156)
Increase / (decrease) in advance received from customers 805 (263) 129
Income taxes (paid)/ refund received (615) 263 (717)
Net cash from operations 5,188 5,072 5,194
Cash flows from investing activities
Purchase of property, plant and equipment (4,921) (3,330) (2,162)
Acquisition of Intangible assets (338) – –
Purchase of capitalized software costs (161) – (1,829)
Proceeds of sale of property, plant and equipment – 50 188
Purchase of available for sale securities (5,999) (6,939) (266)
Sale of available for sale securities 6,534 6,462 –
Interest income (10) 18 1
Other income – – 17
Net cash used in investing activities (4,895) (3,739) (4,051)
05050449_139_216.indd 18705050449_139_216.indd 187 5/19/05 10:27:54 PM5/19/05 10:27:54 PM
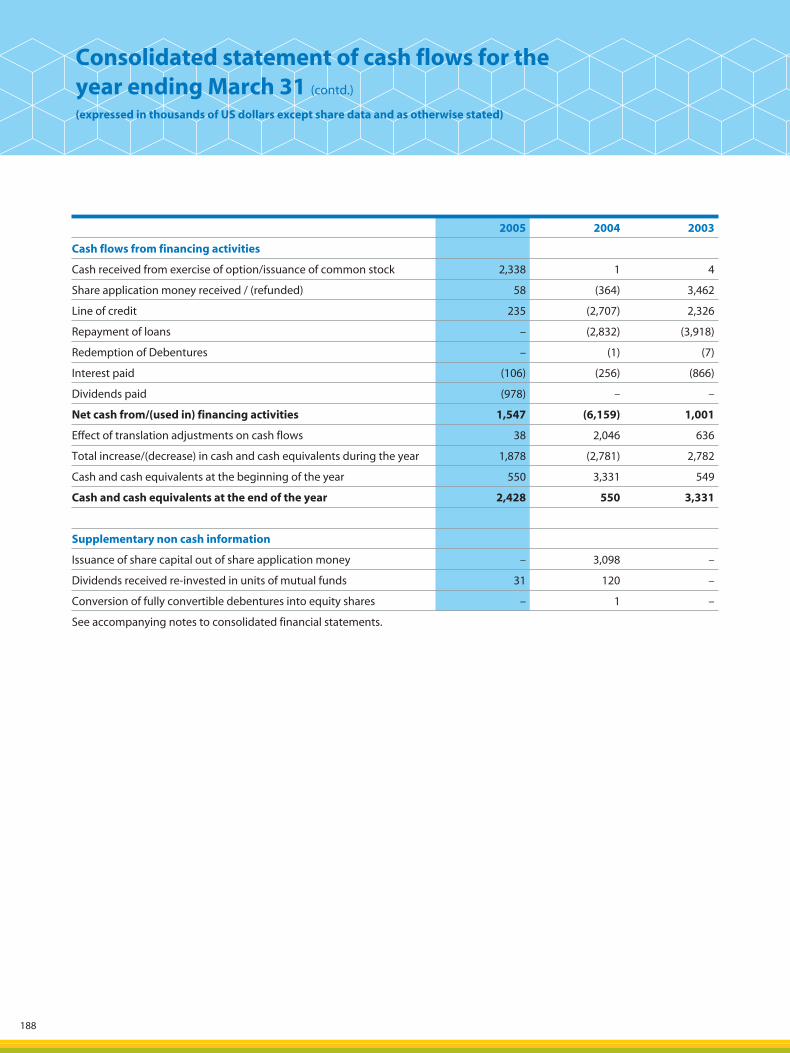
188
2005 2004 2003
Cash flows from financing activities
Cash received from exercise of option/issuance of common stock 2,338 1 4
Share application money received / (refunded) 58 (364) 3,462
Line of credit 235 (2,707) 2,326
Repayment of loans – (2,832) (3,918)
Redemption of Debentures – (1) (7)
Interest paid (106) (256) (866)
Dividends paid (978) – –
Net cash from/(used in) financing activities 1,547 (6,159) 1,001
Effect of translation adjustments on cash flows 38 2,046 636
Total increase/(decrease) in cash and cash equivalents during the year 1,878 (2,781) 2,782
Cash and cash equivalents at the beginning of the year 550 3,331 549
Cash and cash equivalents at the end of the year 2,428 550 3,331
Supplementary non cash information
Issuance of share capital out of share application money – 3,098 –
Dividends received re-invested in units of mutual funds 31 120 –
Conversion of fully convertible debentures into equity shares – 1 –
See accompanying notes to consolidated financial statements.
Consolidated statement of cash flows for theyear ending March 31 (contd.)
(expressed in thousands of US dollars except share data and as otherwise stated)
05050449_139_216.indd 18805050449_139_216.indd 188 5/19/05 10:27:55 PM5/19/05 10:27:55 PM
189Sasken annual report 2004 - 2005
A. Significant Accounting Policies
1. Description of business
Sasken Communication Technologies Limited (“Sasken” or “the Company”) is a provider of telecommunications software services and solutions to network equipment manufacturers, mobile terminal vendors and semiconductor companies around the world. Sasken delivers end-to-end solutions that enable richer content delivery on next generation networks.
Sasken has its headquarters in Bangalore, India with offices in Pune, Canada, China, Germany, Japan, Sweden, United Kingdom and the United States of America.
During the year ended March 31, 2003, the Company promoted Sasken Network Systems Limited (“SNS”) a wholly owned subsidiary in India. SNS was incorporated on October 20, 2003 and obtained its certificate to commence business on November 21, 2003, from the Registrar of Companies, Karnataka, India. SNS provides consultative engineering services focused on telecom operation systems. As at March 31, 2005, SNS is a wholly owned subsidiary of the Company.
During the year ended March 31, 2005, the Company promoted Sasken Network Engineering Limited (“SNEL”), a wholly owned subsidiary in India. SNEL was incorporated on September 29, 2004 and obtained its certificate to commence business on October 11, 2004 from the Registrar of Companies, Karnataka, India. SNEL provides installation and commissioning of and project management services in cellular network. As at March 31, 2005, SNEL is a wholly owned subsidiary of the Company.
2. Basis of preparation of consolidated financial statements
The consolidated financial statements have been prepared in compliance with the accounting principles generally accepted in the United States of America (US GAAP) in Indian Rupees and have thereafter been translated in United States Dollars (USD). The fiscal year begins on April 1 and ends on March 31 of the following year.
3. Use of estimates
The presentation of financial statements in conformity with generally accepted accounting principles requires management to make estimates and assumptions that affect the amounts reported in the financial statements and accompanying notes. Actual results ultimately may differ from the estimates.
4. Consolidation
The consolidated financial statements for the year ended March 31, 2005 include the accounts of the Company, its subsidiaries SNS and SNEL (hereinafter collectively referred to as “the Group”) and, for the year ended March 31, 2004, include the accounts of the Company and its subsidiary SNS. All significant inter-Company accounts and transactions are eliminated in consolidation.
5. Foreign currency transactions and translation
Transactions arising in a currency other than the functional currency are converted into the functional currency at rates closely approximating those ruling during the relevant transaction dates. All monetary assets and liabilities in foreign currency as at the date of the financial statements are restated at the current exchange rate. All exchange differences, including those arising on foreign currency borrowings related to the acquisition of property, plant and equipment are recognized in the Consolidated Income Statement.
Consolidated Income Statement for the years ended March 31, 2005, 2004, and 2003 include foreign exchange gain/(loss) amounting to US$64, (US$ 66), and (US$ 35) respectively.
The functional currency of the Group is the Indian Rupee. The Group’s foreign operations (branch offices) use their local currency as the functional currency. For such entities, all the balance sheet items are translated to Indian Rupees for the purposes of consolidation, using the rate of exchange at the year-end. Revenues and expenses are translated using a monthly simple average rate of exchange. Gains and losses from translation are included as a separate component of accumulated other comprehensive income.
Notes to Consolidated financial statements(expressed in thousands of US dollars except share data, per share data and as otherwise stated)
05050449_139_216.indd 18905050449_139_216.indd 189 5/19/05 10:27:56 PM5/19/05 10:27:56 PM
190
6. Reporting in US Dollars
The consolidated financial statements denominated in Indian Rupees, prepared in compliance with US GAAP, have been reported in US Dollars. For this purpose, incomes and expenses have been translated using a monthly simple average rate of exchange for the respective periods and all balance sheet items, except stockholders’ equity at the year end rate. Gains or losses arising on the translation of the financial statements from Indian Rupees to US Dollars are reported as translation adjustment, a separate component of accumulated other comprehensive income.
The translation of rupee denominated assets and liabilities into US$ for the purposes of these financial statements does not necessarily mean that the Group could realise or settle, in US$, the reported values of these assets and liabilities. Likewise, it does not necessarily mean that the Group could return or distribute the reported US$ value of capital to its shareholders.
The balance sheet items have been translated into US$ at the bank buying rate in Bangalore on March 31, 2005 and 2004 of 1US$ = Rs. 43.74 and Rs. 43.65 respectively. The income statement items have been translated into US$ at the average exchange rates during the year ended on March 31, 2005, 2004 and 2003 of 1US$ = Rs. 44.84, Rs. 46.06 and Rs. 48.39, respectively.
7. Revenue recognition
The Group derives its revenues from product and technology licensing, software services and installation and commissioning services. The Group recognises revenue in accordance with the provisions of Staff Accounting Bulletin No. 104, Revenue Recognition.
Licensing revenue is recognized when the product or technology is delivered and accepted, provided no further vendor obligations remain and collection is probable. Revenue related to customized products or technology development agreements is recognized using the proportionate completion method. The Group measures progress towards completion based on the achievement and acceptance of contract milestones provided no further vendor obligations remain and collection is probable. In order to properly match contract revenue, cost related to milestones that have not been met, are reported as work in progress. Provision for estimated contract losses are recognized when determined. Revenue related to post contract customer support is recognized over the support period.
Revenue from time and material service contracts is recognized as the services are provided. Revenue from fixed price service contracts is recognized based on the proportionate completion method, determined based on the delivery and acceptance of contract milestones, provided collection is probable. Revenue from maintenance arrangement is recognized ratably over the term of the maintenance arrangement.
Revenue from royalty is recognized on an accrual basis based on the terms of the agreement, provided collection is probable.
8. Capitalized software
Costs incurred towards development of computer software are capitalized subsequent to establishing technological feasibility in accordance with SFAS 86 ‘Accounting for the Costs of Computer Software to be sold, leased, or otherwise marketed’. Capitalized software costs are amortized on a product-by-product basis. The amortization shall be greater of the amount computed using (a) the ratio that current gross revenue for a product bear to the total of current and anticipated future gross revenues for that product or (b) the straight-line method over the remaining estimated economic life of the product. Such amortization is included in Cost of Revenues.
Cost of software licenses procured for products are capitalized and amortized over the remaining estimated economic life of the product including the period being reported upon. The un-amortized costs of computer software are compared with the net realizable value of that product, and the excess, if any, of the un-amortized costs over the net realizable value is written off.
Notes to Consolidated financial statements (contd.)(expressed in thousands of US dollars except share data, per share data and as otherwise stated)
05050449_139_216.indd 19005050449_139_216.indd 190 5/19/05 10:27:57 PM5/19/05 10:27:57 PM
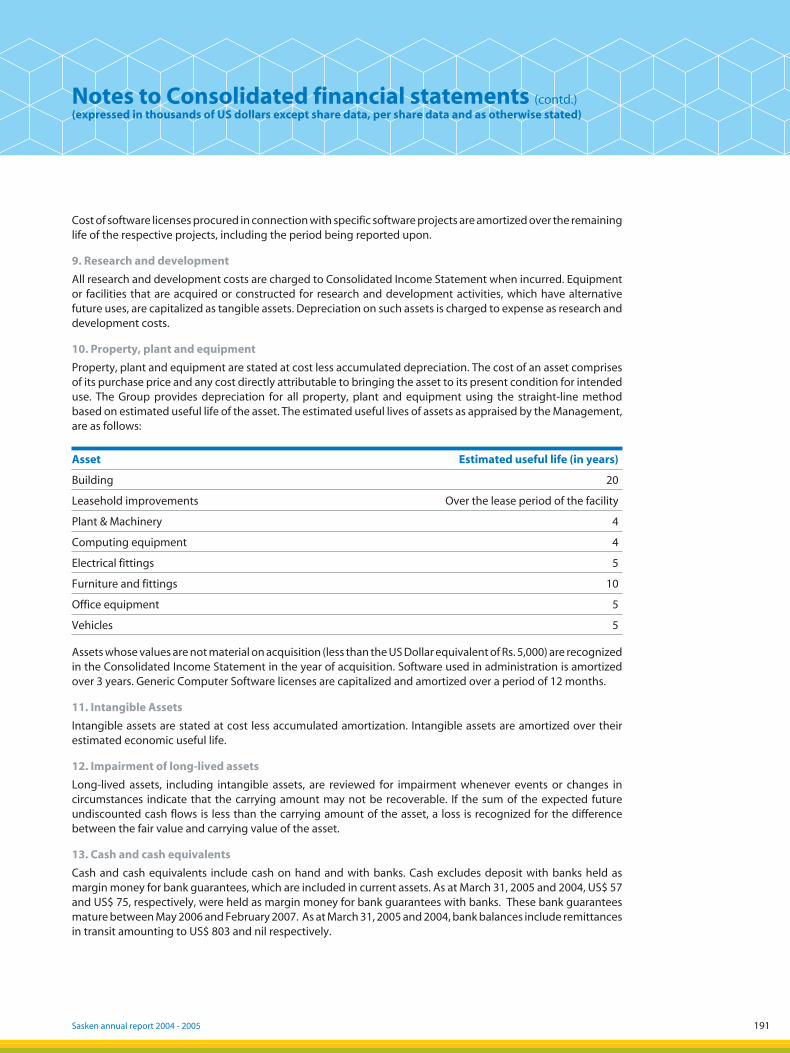
191Sasken annual report 2004 - 2005
Cost of software licenses procured in connection with specific software projects are amortized over the remaining life of the respective projects, including the period being reported upon.
9. Research and development
All research and development costs are charged to Consolidated Income Statement when incurred. Equipment or facilities that are acquired or constructed for research and development activities, which have alternative future uses, are capitalized as tangible assets. Depreciation on such assets is charged to expense as research and development costs.
10. Property, plant and equipment
Property, plant and equipment are stated at cost less accumulated depreciation. The cost of an asset comprises of its purchase price and any cost directly attributable to bringing the asset to its present condition for intended use. The Group provides depreciation for all property, plant and equipment using the straight-line method based on estimated useful life of the asset. The estimated useful lives of assets as appraised by the Management, are as follows:
Asset Estimated useful life (in years)
Building 20
Leasehold improvements Over the lease period of the facility
Plant & Machinery 4
Computing equipment 4
Electrical fittings 5
Furniture and fittings 10
Office equipment 5
Vehicles 5
Assets whose values are not material on acquisition (less than the US Dollar equivalent of Rs. 5,000) are recognized in the Consolidated Income Statement in the year of acquisition. Software used in administration is amortized over 3 years. Generic Computer Software licenses are capitalized and amortized over a period of 12 months.
11. Intangible Assets
Intangible assets are stated at cost less accumulated amortization. Intangible assets are amortized over their estimated economic useful life.
12. Impairment of long-lived assets
Long-lived assets, including intangible assets, are reviewed for impairment whenever events or changes in circumstances indicate that the carrying amount may not be recoverable. If the sum of the expected future undiscounted cash flows is less than the carrying amount of the asset, a loss is recognized for the difference between the fair value and carrying value of the asset.
13. Cash and cash equivalents
Cash and cash equivalents include cash on hand and with banks. Cash excludes deposit with banks held as margin money for bank guarantees, which are included in current assets. As at March 31, 2005 and 2004, US$ 57 and US$ 75, respectively, were held as margin money for bank guarantees with banks. These bank guarantees mature between May 2006 and February 2007. As at March 31, 2005 and 2004, bank balances include remittances in transit amounting to US$ 803 and nil respectively.
Notes to Consolidated financial statements (contd.)(expressed in thousands of US dollars except share data, per share data and as otherwise stated)
05050449_139_216.indd 19105050449_139_216.indd 191 5/19/05 10:27:58 PM5/19/05 10:27:58 PM
192
14. Investments
Investments are stated at their fair values. Dividend and realized/unrealized gains and losses on securities classified as “Trading Securities” are reported in the Consolidated Income Statement, as “Other income/expense.’ Dividend and realized gains and losses on securities classified as “Available for sale securities’ are classified as “Other income/expense”. Unrealized gains or losses on securities classified as “Available for sale securities’, which are temporary, are reported in Stockholders equity, as “Accumulated other comprehensive income’, net of taxes and, the unrealized losses that are considered as “other than temporary “, are reported in the Consolidated Income Statement. The cost of securities sold is based on the specific identification method.
15. Derivative financial instruments
The Group accounts for all derivatives in accordance with FAS 133, “Accounting for Derivative Instruments and Hedging Activities”, as amended. All derivatives are recognized in the balance sheet at fair value. Changes in the fair value of derivatives are recorded in earnings or other comprehensive income, based on whether the instrument is designated as part of a hedge transaction. Gains or losses on derivative instruments reported in other comprehensive income are reclassified to earning in the period in which earnings are affected by the underlying hedge. Derivatives not designated as a hedge and the ineffective portion of all hedges is recognized in earnings in the current period.
16. Earnings per share
Basic earnings per share is computed using the weighted average number of common shares outstanding during the year. Fully diluted earnings per share is computed using the weighted average number of common shares outstanding adjusted for the effects of all dilutive potential ordinary shares. The number of shares and per share amounts has been adjusted retroactively for all periods presented to reflect changes in capital structure arising on account of stock-dividends/stock splits.
17. Fair value of financial instruments
The carrying amounts reflected in the consolidated balance sheets for cash, cash equivalents, accounts receivable, accounts payable and debt approximate their respective fair values due to the short period of maturities.
18. Concentration of credit risk on financial instruments
The Group’s cash is with banks and are considered to be safe and highly liquid. The Group derives its revenue from reputed customers across different geographies and hence, the risk on account of accounts receivables is limited. The Group determines allowances for uncollectible accounts receivables on specific identification basis taking into account factors such as the aging of the uncollected receivables, assessments of collectability based on historical information, etc. Receivables are written off against allowances for uncollectible accounts receivable, when all collection efforts are exhausted and the receivables are no longer collectible. As at March 31, 2005 and 2004, individual customer balances exceeding 10% of the total accounts receivable (including unbilled revenues) are approximately 55% and 44%, respectively.
19. Accumulated other comprehensive income
Accumulated other comprehensive income consists of:
a) Translation adjustment – being gain/loss arising from translation of financial statements of the Company’s subsidiary/ branches, into the functional currency of the Company and gain or loss on translation of the financial statements from Indian Rupees to US Dollars.
b) Unrealized gain / (loss) on “Available for sale securities”, net of taxes.
20. Stock options
The Group uses the fair value based method of accounting for stock-based compensation plans, in accordance with SFAS-123 ‘Accounting for stock based compensation’. Compensation cost is amortized on a straight line basis over the vesting period.
Notes to Consolidated financial statements (contd.)(expressed in thousands of US dollars except share data, per share data and as otherwise stated)
05050449_139_216.indd 19205050449_139_216.indd 192 5/19/05 10:27:59 PM5/19/05 10:27:59 PM
193Sasken annual report 2004 - 2005
21. Income tax
The Group uses the asset and liability method of accounting for income taxes. Under this method, deferred income taxes are recorded to reflect the tax consequences on future years differences between the tax basis of assets and liabilities and the financial reporting amounts at each year-end, based on the enacted tax laws and statutory tax rates applicable to the periods in which the differences are expected to affect taxable income. The effect on deferred tax assets and liabilities of a change in tax rates is recognized in the period in which the tax rates become applicable.
A valuation allowance is provided for deferred tax assets, when it is more likely than not that the asset or a portion thereof would not be realized.
22. Retirement benefits to employees
Gratuity
The Group provides for gratuity, a defined benefit retirement plan covering all employees. The plan provides a lump sum payment to eligible employees at retirement or on termination of employment based on the salary of the respective employee and the years of employment with the Group.
The Group contributes to a gratuity fund maintained by an insurance Company. The amount of contribution is determined based upon actuarial valuations approximately as at year-end. Such contributions are charged off to the Consolidated Income Statement. Provision is made for the difference between the actuarial valuation and the funded balance with the insurance Company.
Provident Fund
Employees are also eligible to receive Provident Fund benefits through a defined contribution plan in which both employee and employer make monthly contributions to the plan, @ 12% each, of the covered employee’s salary. The Company has established a Provident Fund Trust to which contributions towards provident fund are made each month. The contributions towards the pension fund are remitted to the Regional Provident Fund. The contributions towards Provident Fund and Pension Fund of SNS & SNEL are remitted to the Regional Provident Fund Commissioner maintained by the Government of India. Contributions towards Provident Fund and Pension Fund are charged to the Consolidated Income Statement on an accrual basis. The Trust guarantees a specified rate of return on such contributions on a yearly basis. The Company will meet shortfall in the return, if any. At March 31, 2005 and 2004, the shortfall was estimated to be US$ 103 and US$ Nil, respectively.
Superannuation
The Company and SNS have established a Superannuation Scheme administered by private insurers. As per the Scheme, for employees claiming the benefit, the Company and SNS makes monthly contributions, which are charged to the Consolidated Income Statement on an accrual basis. The employer has no other obligations under the Scheme.
Leave Encashment / Compensation absences
As per Group policy, employees are eligible to encash leave standing to the credit of employees subject to terms and conditions. The Group estimates the provision for leave encashment based on the actuarial valuation as of the balance sheet date. Provision for compensated absences is made on an estimate of utilization / availment of the un-availed leave balance to the credit of the employees as at the year-end.
23. Change in estimate
During the year ended March 31, 2005 the Company revised its estimate of useful life of generic computer software to one year, prospectively. Hitherto, generic computer software was charged 100% depreciation in the period of purchase. Due to this change, depreciation on fixed assets for the year ended March 31, 2005 is lower by US$ 116 and profits before tax are higher to the same extent.
Notes to Consolidated financial statements (contd.)(expressed in thousands of US dollars except share data, per share data and as otherwise stated)
05050449_139_216.indd 19305050449_139_216.indd 193 5/19/05 10:28:00 PM5/19/05 10:28:00 PM
194
24. Presentation
Previous years’ numbers have been reclassified/rearranged to conform to the current year’s presentation.
B. Other Notes:
1. Stockholders’ equity
In April 2003, the Company issued warrants to one of the shareholders of the Company, to purchase 1,633,334 equity shares at a price of US$ 1.16 (equivalent to Rs. 60) or such other higher price as may be determined in accordance with the guidelines of the Reserve Bank of India framed for such purposes. These warrants have been exercised during the current fiscal year.
Shares which have been reserved for issuance (other than for stock options) as at March 31, 2005 and 2004 were Nil and 3,484,515 respectively.
Accumulated other comprehensive gain / (loss) (net of taxes) comprise of, as at March 31:
2005 2004 2003
Translation adjustment (765) (803) (2,849)
Total (765) (803) (2,849)
2. Stock option plan
a. SAS Stock Option Plan 1997
The SAS Stock Option Plan (Plan) established during 1997, provided for the issue of Fully Convertible Debentures (FCD’s) to employees, consultants, advisors and to employees of subsidiaries. One million equity shares were approved by the shareholders for the purpose. The FCD’s were convertible into shares over a period of three years and the price and conversion date was determined on the date of allotment of the FCD’s. The shares arising on conversion of the FCD’s would be free of any lock-in provisions. There will be no further issue of securities under the SAS Stock Option Plan 1997 consequent to the establishment of Sasken ESOP-2000.
A summary of the movement and status of shares arising out of the FCD’s issued under the above plan as of March 31, 2005, 2004 and 2003 is given below:
2004* 2003
Shares arisingout of FCD’s
Shares arisingout of FCD’s
Weighted average exercise/
conversion price
Outstanding at the beginning of the year 1,400 51,500 $0.82
Forfeited (600) (10,100) $0.82
Exercised/converted into shares (800) (40,000) $0.82
Outstanding at the end of the year – 1,400 $0.84
*weighted average exercise/conversion price was US$ 0.84.
Notes to Consolidated financial statements (contd.)(expressed in thousands of US dollars except share data, per share data and as otherwise stated)
05050449_139_216.indd 19405050449_139_216.indd 194 5/19/05 10:28:01 PM5/19/05 10:28:01 PM
195Sasken annual report 2004 - 2005
The fair value for each of the Options granted under the above plan was estimated at the date of grant using the minimum value method and the following weighted average assumptions:
Year ended March 31, 2003
Average risk-free interest rate 10%
Expected life of options granted (in months) 6.00
Expected dividend % Nil
b) Sasken ESOP – 2000
Sasken ESOP – 2000 was approved by the shareholders at the Extra Ordinary General Meeting of the Company held on September 22, 2000. The Plan provided for the issue of 3 million shares (including the shares issued/ to be issued under the FCD’s as per the SAS Stock Option Plan, 1997 and the shares to be issued consequent to the exercise of the options granted under the current Plan) of US$ 0.23 par value equivalent of Rs. 10 each.
Options granted under the Plan vest based on the vesting schedule as determined by the Compensation Committee and are issued at an exercise price as fixed by the Compensation Committee from time to time.
Under Sasken ESOP – 2000, stock options were granted to all employees based on the period of service with the Company, performance and potential. However, the intended response to the scheme was poor as the market value of the shares, since the grant of the stock options, had a negative impact due to the global recession and the conditions prevailing in the capital markets. In view of this, the Company, after considering other alternatives, decided to cancel the stock options remaining unexercised as at December 31, 2002. The Compensation Committee and the Shareholders approved the cancellation of the stock options remaining unexercised as on December 31, 2002.
A decision to consolidate the face value of the shares from Rs. 5 to Rs. 10 was taken by the board at the meeting held on June 11, 2004 and an EGM was held on July 16, 2004. The EGM approved the consolidation of the shares and consequently the options also have been adjusted to reflect the consolidations. The options have now been converted to 1 option for every 2 options held earlier and fractional options have been adjusted to the next whole number. All share data including stock option data are restated in line with the consolidation of Rs. 5 to Rs. 10 par value.
In October 2003 and thereafter, the Company issued 296,040 options to employees, with a vesting period of one year at an exercise price of US$ 1.84 (equivalent to Rs. 80 per share) being the fair value of the Company’s share on the date of grant as determined by the Company.
On April 2, 2004 and June 1, 2004, the Company issued 378,925 options to 1372 employees and 971,533 options to 347 employees, respectively. These options carry vesting periods ranging one to four years at an exercise price ranging from US$ 3.66 to US$ 5.85 equivalent to Rs. 160 to Rs. 256 per share depending upon the exercise period being the fair value of the Company’s share as determined by the Company as at the date of grant.
On February 23, 2005, the Company issued 42,530 options to 41 employees of Sasken Communication Technologies Ltd. and 2,735 options to 3 employees of Sasken Networks Systems Ltd. These options carry vesting periods ranging one to four years at an exercise price ranging from US$ 4.21 to US$ 5.85 equivalent to Rs. 184 to Rs. 256 per share depending upon the exercise period being the fair value of the Company’s share as determined by the Company as at the date of grant.
Notes to Consolidated financial statements (contd.)(expressed in thousands of US dollars except share data, per share data and as otherwise stated)
13
05050449_139_216.indd 19505050449_139_216.indd 195 5/19/05 10:28:02 PM5/19/05 10:28:02 PM
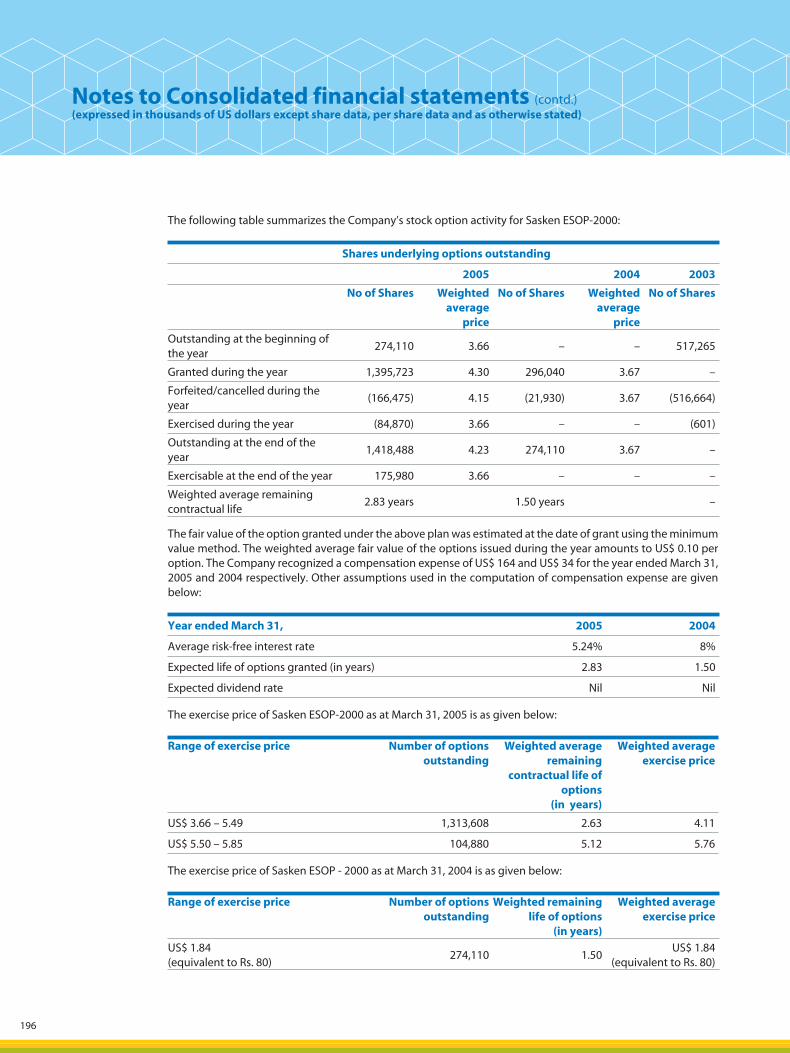
196
The following table summarizes the Company’s stock option activity for Sasken ESOP-2000:
Shares underlying options outstanding
2005 2004 2003
No of Shares Weighted average
price
No of Shares Weighted average
price
No of Shares
Outstanding at the beginning of the year
274,110 3.66 – – 517,265
Granted during the year 1,395,723 4.30 296,040 3.67 –
Forfeited/cancelled during the year
(166,475) 4.15 (21,930) 3.67 (516,664)
Exercised during the year (84,870) 3.66 – – (601)
Outstanding at the end of the year
1,418,488 4.23 274,110 3.67 –
Exercisable at the end of the year 175,980 3.66 – – –
Weighted average remaining contractual life
2.83 years 1.50 years –
The fair value of the option granted under the above plan was estimated at the date of grant using the minimum value method. The weighted average fair value of the options issued during the year amounts to US$ 0.10 per option. The Company recognized a compensation expense of US$ 164 and US$ 34 for the year ended March 31, 2005 and 2004 respectively. Other assumptions used in the computation of compensation expense are given below:
Year ended March 31, 2005 2004
Average risk-free interest rate 5.24% 8%
Expected life of options granted (in years) 2.83 1.50
Expected dividend rate Nil Nil
The exercise price of Sasken ESOP-2000 as at March 31, 2005 is as given below:
Range of exercise price Number of options outstanding
Weighted average remaining
contractual life of options
(in years)
Weighted average exercise price
US$ 3.66 – 5.49 1,313,608 2.63 4.11
US$ 5.50 – 5.85 104,880 5.12 5.76
The exercise price of Sasken ESOP - 2000 as at March 31, 2004 is as given below:
Range of exercise price Number of options outstanding
Weighted remaining life of options
(in years)
Weighted average exercise price
US$ 1.84(equivalent to Rs. 80)
274,110 1.50US$ 1.84
(equivalent to Rs. 80)
Notes to Consolidated financial statements (contd.)(expressed in thousands of US dollars except share data, per share data and as otherwise stated)
05050449_139_216.indd 19605050449_139_216.indd 196 5/19/05 10:28:03 PM5/19/05 10:28:03 PM
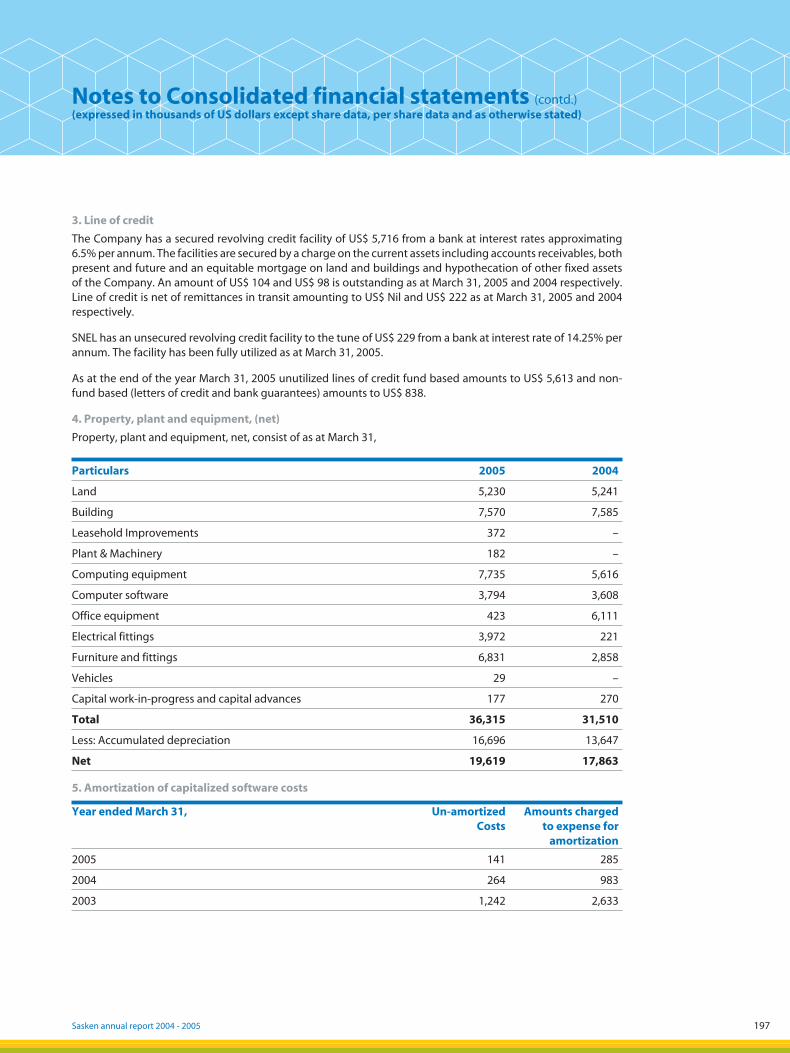
197Sasken annual report 2004 - 2005
3. Line of credit
The Company has a secured revolving credit facility of US$ 5,716 from a bank at interest rates approximating 6.5% per annum. The facilities are secured by a charge on the current assets including accounts receivables, both present and future and an equitable mortgage on land and buildings and hypothecation of other fixed assets of the Company. An amount of US$ 104 and US$ 98 is outstanding as at March 31, 2005 and 2004 respectively. Line of credit is net of remittances in transit amounting to US$ Nil and US$ 222 as at March 31, 2005 and 2004 respectively.
SNEL has an unsecured revolving credit facility to the tune of US$ 229 from a bank at interest rate of 14.25% per annum. The facility has been fully utilized as at March 31, 2005.
As at the end of the year March 31, 2005 unutilized lines of credit fund based amounts to US$ 5,613 and non-fund based (letters of credit and bank guarantees) amounts to US$ 838.
4. Property, plant and equipment, (net)
Property, plant and equipment, net, consist of as at March 31,
Particulars 2005 2004
Land 5,230 5,241
Building 7,570 7,585
Leasehold Improvements 372 –
Plant & Machinery 182 –
Computing equipment 7,735 5,616
Computer software 3,794 3,608
Office equipment 423 6,111
Electrical fittings 3,972 221
Furniture and fittings 6,831 2,858
Vehicles 29 –
Capital work-in-progress and capital advances 177 270
Total 36,315 31,510
Less: Accumulated depreciation 16,696 13,647
Net 19,619 17,863
5. Amortization of capitalized software costs
Year ended March 31, Un-amortizedCosts
Amounts charged to expense for
amortization
2005 141 285
2004 264 983
2003 1,242 2,633
Notes to Consolidated financial statements (contd.)(expressed in thousands of US dollars except share data, per share data and as otherwise stated)
05050449_139_216.indd 19705050449_139_216.indd 197 5/19/05 10:28:04 PM5/19/05 10:28:04 PM
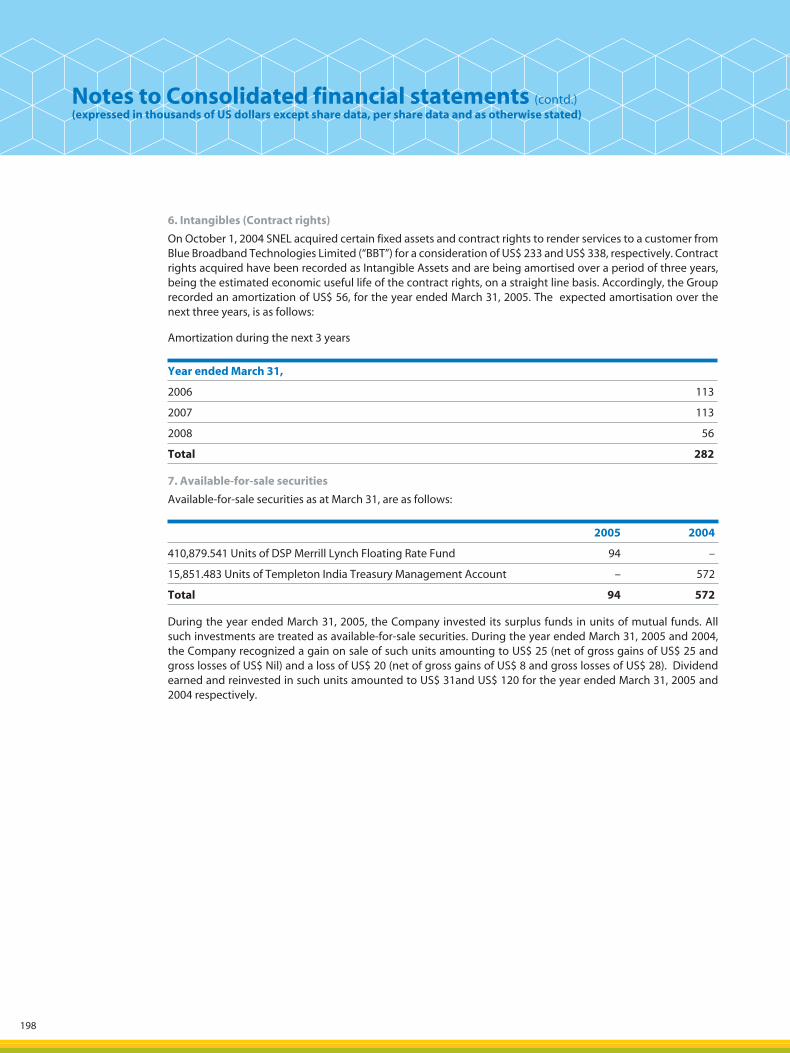
198
6. Intangibles (Contract rights)
On October 1, 2004 SNEL acquired certain fixed assets and contract rights to render services to a customer from Blue Broadband Technologies Limited (“BBT”) for a consideration of US$ 233 and US$ 338, respectively. Contract rights acquired have been recorded as Intangible Assets and are being amortised over a period of three years, being the estimated economic useful life of the contract rights, on a straight line basis. Accordingly, the Group recorded an amortization of US$ 56, for the year ended March 31, 2005. The expected amortisation over the next three years, is as follows:
Amortization during the next 3 years
Year ended March 31,
2006 113
2007 113
2008 56
Total 282
7. Available-for-sale securities
Available-for-sale securities as at March 31, are as follows:
2005 2004
410,879.541 Units of DSP Merrill Lynch Floating Rate Fund 94 –
15,851.483 Units of Templeton India Treasury Management Account – 572
Total 94 572
During the year ended March 31, 2005, the Company invested its surplus funds in units of mutual funds. All such investments are treated as available-for-sale securities. During the year ended March 31, 2005 and 2004, the Company recognized a gain on sale of such units amounting to US$ 25 (net of gross gains of US$ 25 and gross losses of US$ Nil) and a loss of US$ 20 (net of gross gains of US$ 8 and gross losses of US$ 28). Dividend earned and reinvested in such units amounted to US$ 31and US$ 120 for the year ended March 31, 2005 and 2004 respectively.
Notes to Consolidated financial statements (contd.)(expressed in thousands of US dollars except share data, per share data and as otherwise stated)
05050449_139_216.indd 19805050449_139_216.indd 198 5/19/05 10:28:05 PM5/19/05 10:28:05 PM
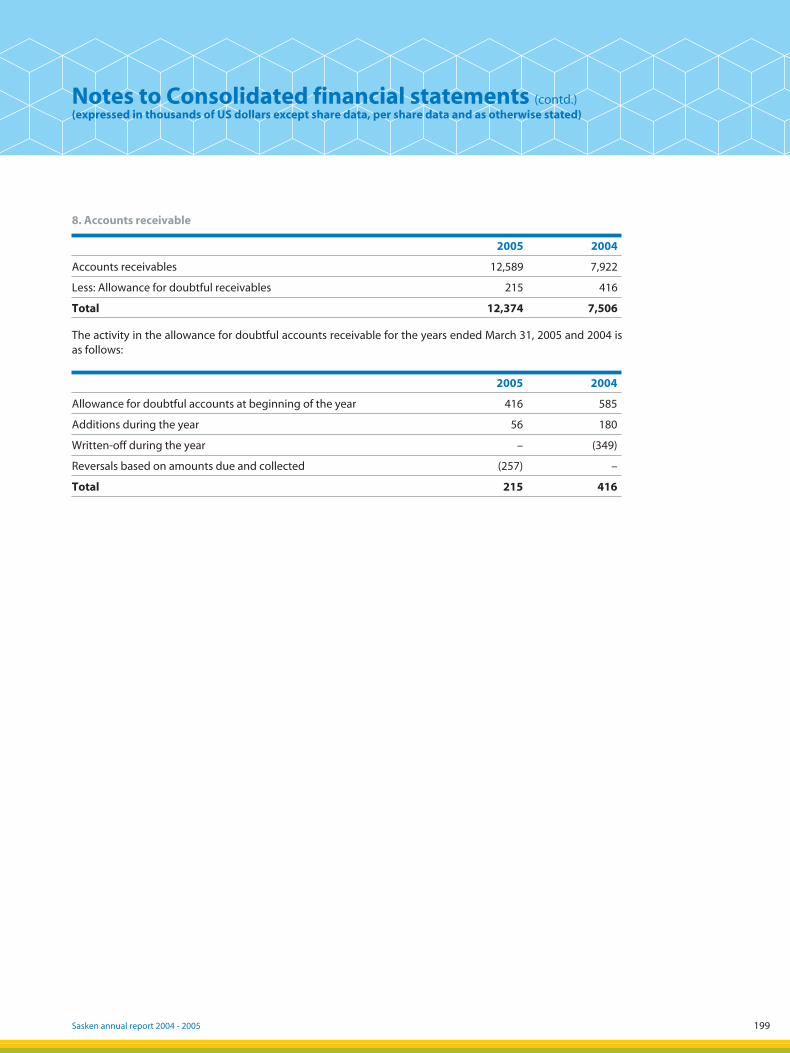
199Sasken annual report 2004 - 2005
Notes to Consolidated financial statements (contd.)(expressed in thousands of US dollars except share data, per share data and as otherwise stated)
8. Accounts receivable
2005 2004
Accounts receivables 12,589 7,922
Less: Allowance for doubtful receivables 215 416
Total 12,374 7,506
The activity in the allowance for doubtful accounts receivable for the years ended March 31, 2005 and 2004 is as follows:
2005 2004
Allowance for doubtful accounts at beginning of the year 416 585
Additions during the year 56 180
Written-off during the year – (349)
Reversals based on amounts due and collected (257) –
Total 215 416
05050449_139_216.indd 19905050449_139_216.indd 199 5/19/05 10:28:06 PM5/19/05 10:28:06 PM
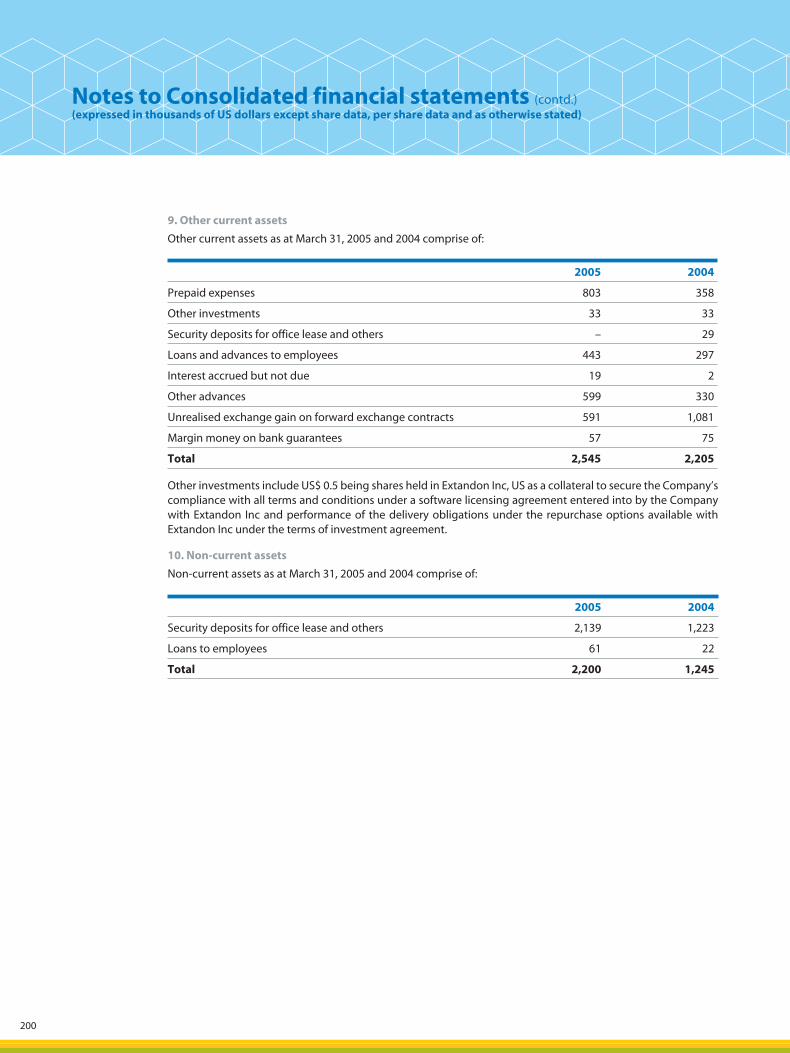
200
9. Other current assets
Other current assets as at March 31, 2005 and 2004 comprise of:
2005 2004
Prepaid expenses 803 358
Other investments 33 33
Security deposits for office lease and others – 29
Loans and advances to employees 443 297
Interest accrued but not due 19 2
Other advances 599 330
Unrealised exchange gain on forward exchange contracts 591 1,081
Margin money on bank guarantees 57 75
Total 2,545 2,205
Other investments include US$ 0.5 being shares held in Extandon Inc, US as a collateral to secure the Company’s compliance with all terms and conditions under a software licensing agreement entered into by the Company with Extandon Inc and performance of the delivery obligations under the repurchase options available with Extandon Inc under the terms of investment agreement.
10. Non-current assets
Non-current assets as at March 31, 2005 and 2004 comprise of:
2005 2004
Security deposits for office lease and others 2,139 1,223
Loans to employees 61 22
Total 2,200 1,245
Notes to Consolidated financial statements (contd.)(expressed in thousands of US dollars except share data, per share data and as otherwise stated)
05050449_139_216.indd 20005050449_139_216.indd 200 5/19/05 10:28:06 PM5/19/05 10:28:06 PM
201Sasken annual report 2004 - 2005
11. Derivative financial instruments and hedging activities
The Company enters into foreign exchange forward contracts to hedge foreign currency exposures on US Dollars, UK Pounds, Euro, etc. on accounts receivables and forecasted cash flows denominated in foreign currencies. The Company generally hedges forecasted transactions over a period of twelve months or less. Sasken held foreign exchange forward contracts of US$ 25,949 and US$ 27,313 as at March 31, 2005 and 2004, respectively. The contracts expire on a monthly basis through the month of March 2006. Unrealized gain on account of restatement of forward covers at fair value as at March 31, 2005 and 2004 amounted to US$ 591 and US$ 1,081 respectively. The receivable is recorded under “Other current assets” in the Consolidated Balance Sheet and the gain has been recorded under “Other income” in the Consolidated Income Statement.
12. Income Taxes
The Company and SNS are mainly engaged in the development and export of software under the Software Technology Parks (STP) scheme. The Company and SNS claim deductions from income tax, with respect to its income earned from exports of computer software, under Section 10A of the Income Tax Act, 1961.
Hence, deferred taxes to the extent of the export operations are not recognized as the timing differences reverse out within the balance period of available deduction. Under the law, tax benefits for the various units under the above sections is estimated to phase out by fiscal 2009. Income earned from sale of software development services to domestic customers is taxable.
Notes to Consolidated financial statements (contd.)(expressed in thousands of US dollars except share data, per share data and as otherwise stated)
05050449_139_216.indd 20105050449_139_216.indd 201 5/19/05 10:28:07 PM5/19/05 10:28:07 PM
202
Income tax expense comprises for year ended March 31,
2005 2004 2003
Current
– Domestic 53 22 59
– Foreign (net of refund) 335 (485) 510
Total 388 (463) 569
During the year ended March 31, 2005 and 2004, foreign taxes are net of refund / reversals recognized as an expense in earlier years amounting to US$ 456 and US$ 1,026 respectively. Current domestic taxes relate to taxes payable under Minimum Alternative Tax (MAT) provision of the Income Tax Act, 1961. For determination of tax under the MAT provisions, the benefit of carry forward of business loss and unabsorbed depreciation are admissible only to the extent of unabsorbed losses as per the books.
The components of net deferred tax asset/(liability) as at March 31, are as follows:
2005 2004
A. Deferred tax assets
Provision for doubtful debts – 8
Accrued retirement benefit 20 5
Depreciation and amortization – 7
Carry forward of unabsorbed depreciation and business loss 134 198
Carry forward of capital loss 21 45
Total deferred tax assets 175 263
B. Deferred tax liabilities
Depreciation and amortization (10) –
Total deferred tax liabilities (10) –
Less: Valuation allowance (165) (263)
Net deferred tax (liability)/asset – –
As at March 31, 2005 the Group has US$ 148 unabsorbed depreciation and business loss in India which mainly pertains to SNEL and US$ 256 unabsorbed business losses relating to foreign branches. The Group set off US$ 765 towards taxable business profits of fiscal 2005 towards tax otherwise leviable on the domestic sales of the Group. The valuation allowance has been created, in view of the uncertainty of taxable income from the Group’s domestic operations. The unabsorbed depreciation loss in India can be carried forward indefinitely.
Notes to Consolidated financial statements (contd.)(expressed in thousands of US dollars except share data, per share data and as otherwise stated)
05050449_139_216.indd 20205050449_139_216.indd 202 5/19/05 10:28:08 PM5/19/05 10:28:08 PM
203Sasken annual report 2004 - 2005
A reconciliation of the income tax provision to the amount computed by applying the statutory income tax rate to income before income taxes is summarized below:
Provision for tax 2005 2004 2003
Net income / (loss) before taxes 4,313 4,390 (651)
Enacted tax rates in India 36.59% 35.87% 36.75%
Statutory tax provision 1,578 1,575 (240)
Tax effect of non taxable income (1,757) (1,544) 253
Brought forward loss adjusted (280) (121) –
Minimum income taxes payable 53 12 –
Tax effect on expenses disallowed / (admissible) (Net)
481 12 246
Valuation allowance on other temporary differences
– 39 (197)
Overseas taxes 769 590 814
Withholding tax refunds / reversal of overseas taxes
(456) (1,026) (307)
Total provision for income taxes 388 (463) 569
13. Retirement benefits to employees
Amounts recognized in the Consolidated Income Statements on account of retirement benefits:
Year ended March 31 Superannuation Scheme
Provident Fund
2005 69 1,012
2004 28 580
2003 – 414
Notes to Consolidated financial statements (contd.)(expressed in thousands of US dollars except share data, per share data and as otherwise stated)
14
05050449_139_216.indd 20305050449_139_216.indd 203 5/19/05 10:28:08 PM5/19/05 10:28:08 PM
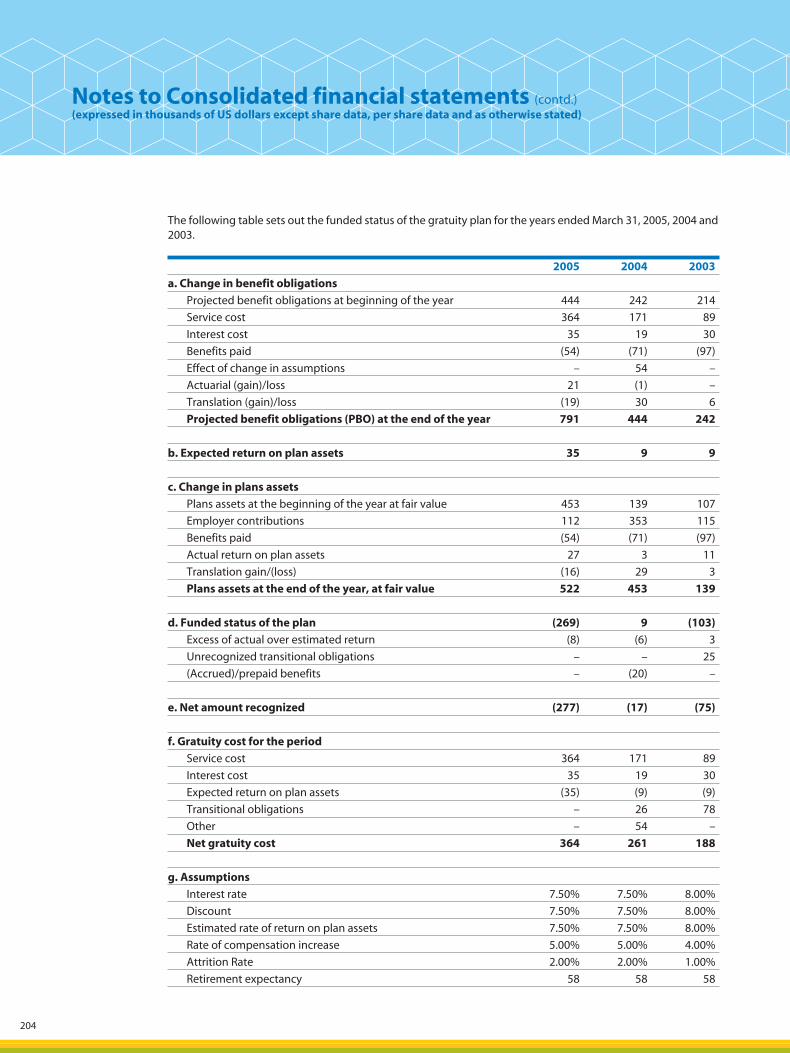
204
The following table sets out the funded status of the gratuity plan for the years ended March 31, 2005, 2004 and 2003.
2005 2004 2003
a. Change in benefit obligations
Projected benefit obligations at beginning of the year 444 242 214
Service cost 364 171 89
Interest cost 35 19 30
Benefits paid (54) (71) (97)
Effect of change in assumptions – 54 –
Actuarial (gain)/loss 21 (1) –
Translation (gain)/loss (19) 30 6
Projected benefit obligations (PBO) at the end of the year 791 444 242
b. Expected return on plan assets 35 9 9
c. Change in plans assets
Plans assets at the beginning of the year at fair value 453 139 107
Employer contributions 112 353 115
Benefits paid (54) (71) (97)
Actual return on plan assets 27 3 11
Translation gain/(loss) (16) 29 3
Plans assets at the end of the year, at fair value 522 453 139
d. Funded status of the plan (269) 9 (103)
Excess of actual over estimated return (8) (6) 3
Unrecognized transitional obligations – – 25
(Accrued)/prepaid benefits – (20) –
e. Net amount recognized (277) (17) (75)
f. Gratuity cost for the period
Service cost 364 171 89
Interest cost 35 19 30
Expected return on plan assets (35) (9) (9)
Transitional obligations – 26 78
Other – 54 –
Net gratuity cost 364 261 188
g. Assumptions
Interest rate 7.50% 7.50% 8.00%
Discount 7.50% 7.50% 8.00%
Estimated rate of return on plan assets 7.50% 7.50% 8.00%
Rate of compensation increase 5.00% 5.00% 4.00%
Attrition Rate 2.00% 2.00% 1.00%
Retirement expectancy 58 58 58
Notes to Consolidated financial statements (contd.)(expressed in thousands of US dollars except share data, per share data and as otherwise stated)
05050449_139_216.indd 20405050449_139_216.indd 204 5/19/05 10:28:09 PM5/19/05 10:28:09 PM
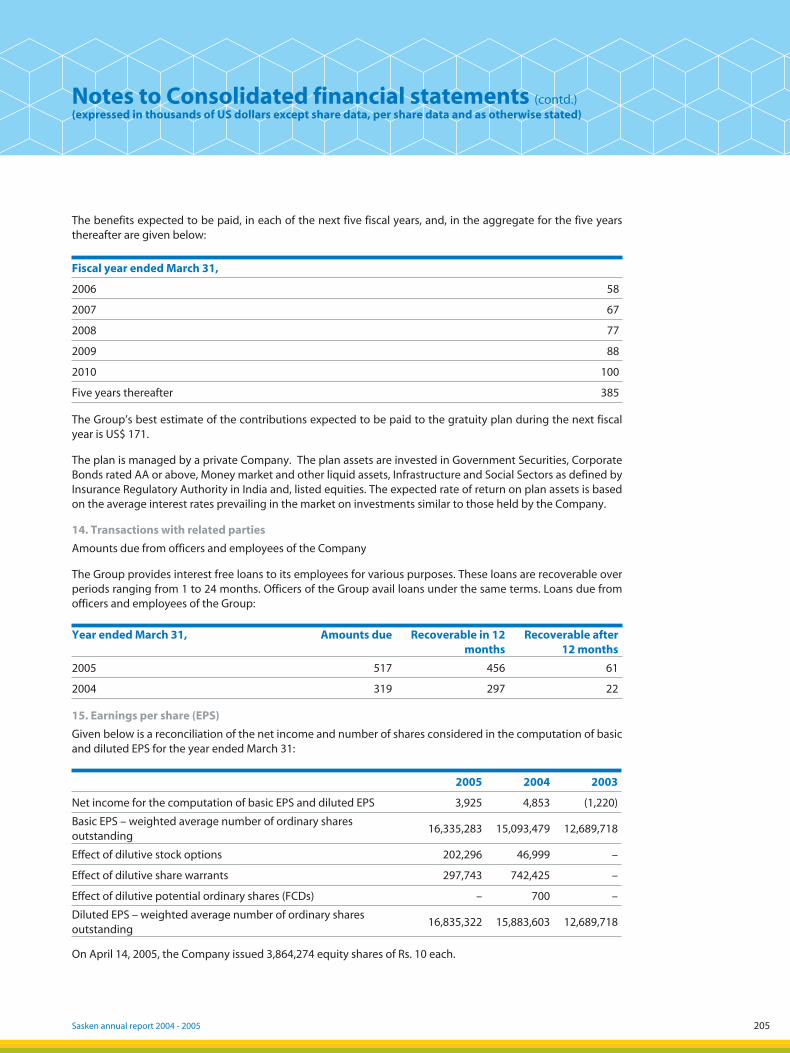
205Sasken annual report 2004 - 2005
The benefits expected to be paid, in each of the next five fiscal years, and, in the aggregate for the five years thereafter are given below:
Fiscal year ended March 31,
2006 58
2007 67
2008 77
2009 88
2010 100
Five years thereafter 385
The Group’s best estimate of the contributions expected to be paid to the gratuity plan during the next fiscal year is US$ 171.
The plan is managed by a private Company. The plan assets are invested in Government Securities, Corporate Bonds rated AA or above, Money market and other liquid assets, Infrastructure and Social Sectors as defined by Insurance Regulatory Authority in India and, listed equities. The expected rate of return on plan assets is based on the average interest rates prevailing in the market on investments similar to those held by the Company.
14. Transactions with related parties
Amounts due from officers and employees of the Company
The Group provides interest free loans to its employees for various purposes. These loans are recoverable over periods ranging from 1 to 24 months. Officers of the Group avail loans under the same terms. Loans due from officers and employees of the Group:
Year ended March 31, Amounts due Recoverable in 12 months
Recoverable after 12 months
2005 517 456 61
2004 319 297 22
15. Earnings per share (EPS)
Given below is a reconciliation of the net income and number of shares considered in the computation of basic and diluted EPS for the year ended March 31:
2005 2004 2003
Net income for the computation of basic EPS and diluted EPS 3,925 4,853 (1,220)
Basic EPS – weighted average number of ordinary shares outstanding
16,335,283 15,093,479 12,689,718
Effect of dilutive stock options 202,296 46,999 –
Effect of dilutive share warrants 297,743 742,425 –
Effect of dilutive potential ordinary shares (FCDs) – 700 –
Diluted EPS – weighted average number of ordinary shares outstanding
16,835,322 15,883,603 12,689,718
On April 14, 2005, the Company issued 3,864,274 equity shares of Rs. 10 each.
Notes to Consolidated financial statements (contd.)(expressed in thousands of US dollars except share data, per share data and as otherwise stated)
05050449_139_216.indd 20505050449_139_216.indd 205 5/19/05 10:28:10 PM5/19/05 10:28:10 PM
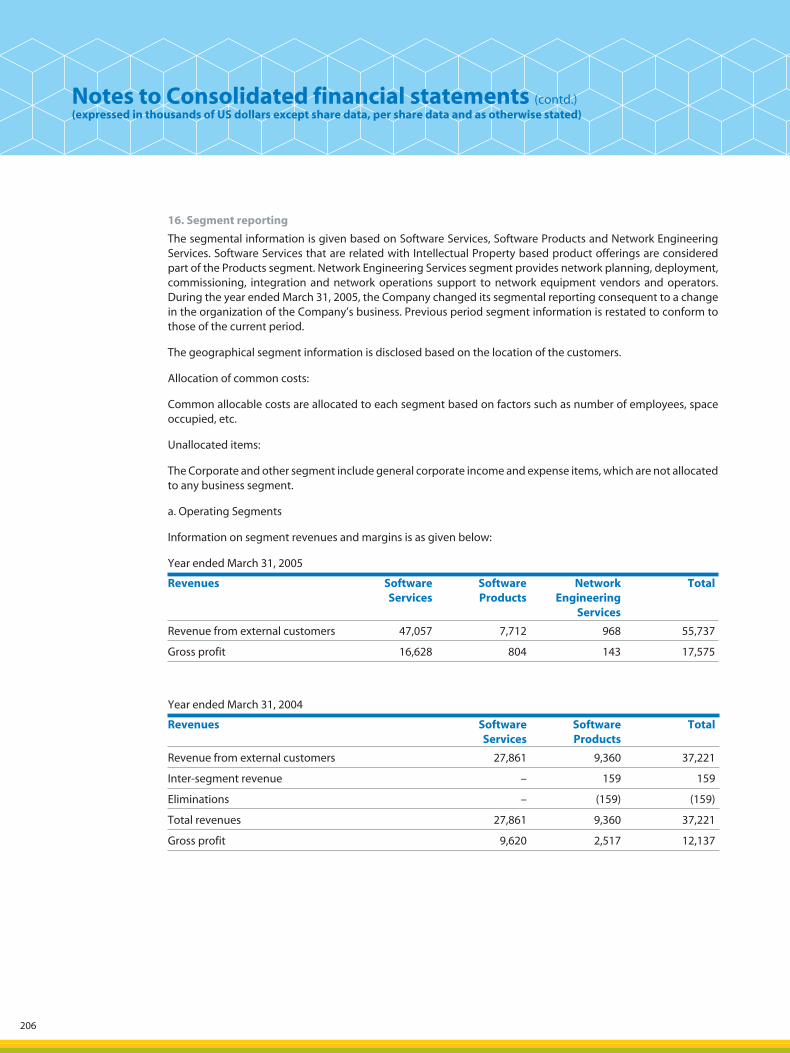
206
16. Segment reporting
The segmental information is given based on Software Services, Software Products and Network Engineering Services. Software Services that are related with Intellectual Property based product offerings are considered part of the Products segment. Network Engineering Services segment provides network planning, deployment, commissioning, integration and network operations support to network equipment vendors and operators. During the year ended March 31, 2005, the Company changed its segmental reporting consequent to a change in the organization of the Company’s business. Previous period segment information is restated to conform to those of the current period.
The geographical segment information is disclosed based on the location of the customers.
Allocation of common costs:
Common allocable costs are allocated to each segment based on factors such as number of employees, space occupied, etc.
Unallocated items:
The Corporate and other segment include general corporate income and expense items, which are not allocated to any business segment.
a. Operating Segments
Information on segment revenues and margins is as given below:
Year ended March 31, 2005
Revenues Software Services
Software Products
Network Engineering
Services
Total
Revenue from external customers 47,057 7,712 968 55,737
Gross profit 16,628 804 143 17,575
Year ended March 31, 2004
Revenues Software Services
Software Products
Total
Revenue from external customers 27,861 9,360 37,221
Inter-segment revenue – 159 159
Eliminations – (159) (159)
Total revenues 27,861 9,360 37,221
Gross profit 9,620 2,517 12,137
Notes to Consolidated financial statements (contd.)(expressed in thousands of US dollars except share data, per share data and as otherwise stated)
05050449_139_216.indd 20605050449_139_216.indd 206 5/19/05 10:28:11 PM5/19/05 10:28:11 PM
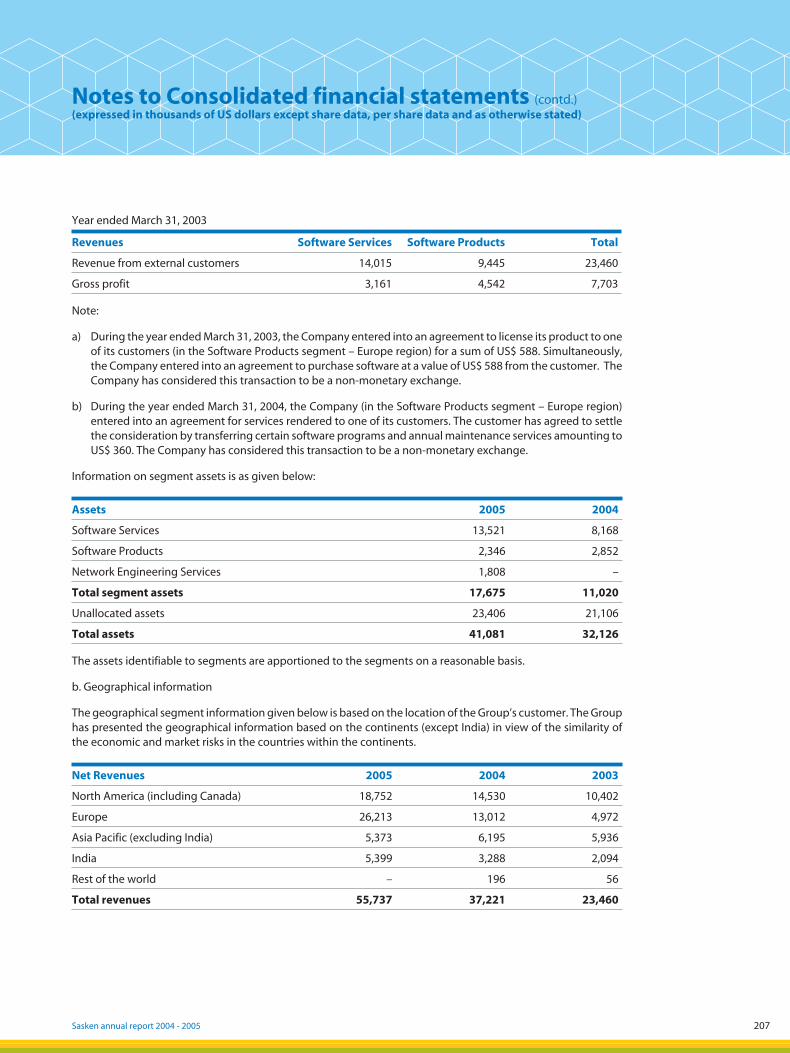
207Sasken annual report 2004 - 2005
Year ended March 31, 2003
Revenues Software Services Software Products Total
Revenue from external customers 14,015 9,445 23,460
Gross profit 3,161 4,542 7,703
Note:
a) During the year ended March 31, 2003, the Company entered into an agreement to license its product to one of its customers (in the Software Products segment – Europe region) for a sum of US$ 588. Simultaneously, the Company entered into an agreement to purchase software at a value of US$ 588 from the customer. The Company has considered this transaction to be a non-monetary exchange.
b) During the year ended March 31, 2004, the Company (in the Software Products segment – Europe region) entered into an agreement for services rendered to one of its customers. The customer has agreed to settle the consideration by transferring certain software programs and annual maintenance services amounting to US$ 360. The Company has considered this transaction to be a non-monetary exchange.
Information on segment assets is as given below:
Assets 2005 2004
Software Services 13,521 8,168
Software Products 2,346 2,852
Network Engineering Services 1,808 –
Total segment assets 17,675 11,020
Unallocated assets 23,406 21,106
Total assets 41,081 32,126
The assets identifiable to segments are apportioned to the segments on a reasonable basis.
b. Geographical information
The geographical segment information given below is based on the location of the Group’s customer. The Group has presented the geographical information based on the continents (except India) in view of the similarity of the economic and market risks in the countries within the continents.
Net Revenues 2005 2004 2003
North America (including Canada) 18,752 14,530 10,402
Europe 26,213 13,012 4,972
Asia Pacific (excluding India) 5,373 6,195 5,936
India 5,399 3,288 2,094
Rest of the world – 196 56
Total revenues 55,737 37,221 23,460
Notes to Consolidated financial statements (contd.)(expressed in thousands of US dollars except share data, per share data and as otherwise stated)
05050449_139_216.indd 20705050449_139_216.indd 207 5/19/05 10:28:12 PM5/19/05 10:28:12 PM
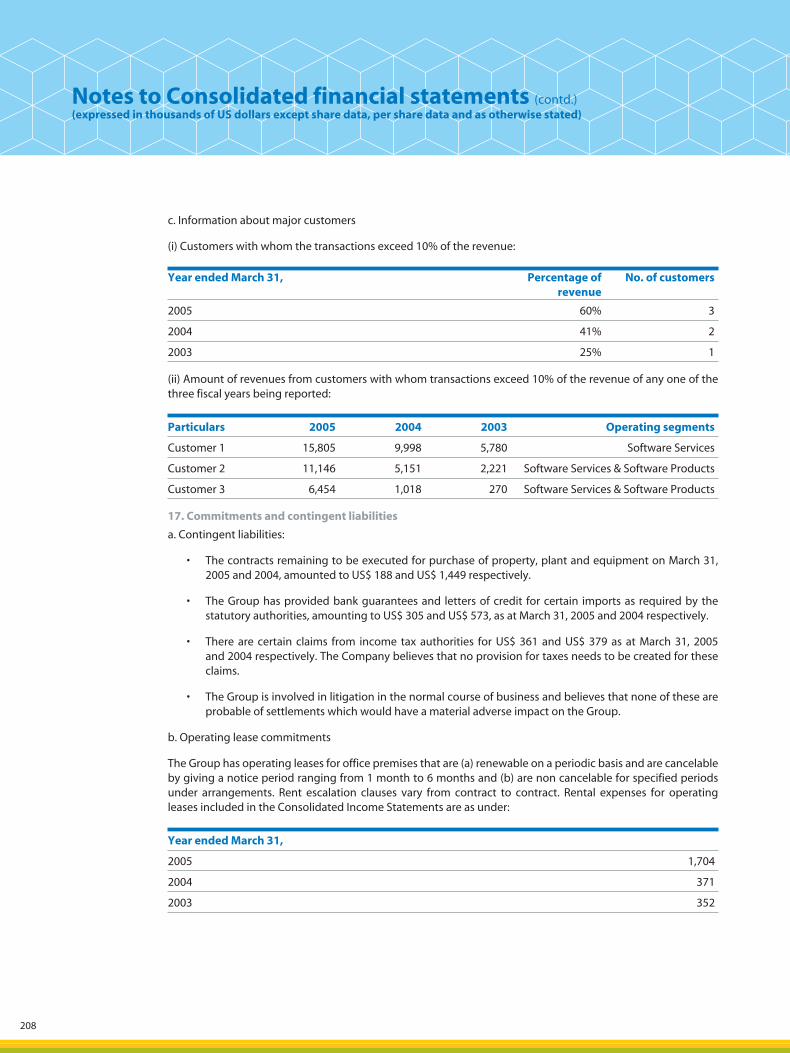
208
c. Information about major customers
(i) Customers with whom the transactions exceed 10% of the revenue:
Year ended March 31, Percentage of revenue
No. of customers
2005 60% 3
2004 41% 2
2003 25% 1
(ii) Amount of revenues from customers with whom transactions exceed 10% of the revenue of any one of the three fiscal years being reported:
Particulars 2005 2004 2003 Operating segments
Customer 1 15,805 9,998 5,780 Software Services
Customer 2 11,146 5,151 2,221 Software Services & Software Products
Customer 3 6,454 1,018 270 Software Services & Software Products
17. Commitments and contingent liabilities
a. Contingent liabilities:
• The contracts remaining to be executed for purchase of property, plant and equipment on March 31, 2005 and 2004, amounted to US$ 188 and US$ 1,449 respectively.
• The Group has provided bank guarantees and letters of credit for certain imports as required by the statutory authorities, amounting to US$ 305 and US$ 573, as at March 31, 2005 and 2004 respectively.
• There are certain claims from income tax authorities for US$ 361 and US$ 379 as at March 31, 2005 and 2004 respectively. The Company believes that no provision for taxes needs to be created for these claims.
• The Group is involved in litigation in the normal course of business and believes that none of these are probable of settlements which would have a material adverse impact on the Group.
b. Operating lease commitments
The Group has operating leases for office premises that are (a) renewable on a periodic basis and are cancelable by giving a notice period ranging from 1 month to 6 months and (b) are non cancelable for specified periods under arrangements. Rent escalation clauses vary from contract to contract. Rental expenses for operating leases included in the Consolidated Income Statements are as under:
Year ended March 31,
2005 1,704
2004 371
2003 352
Notes to Consolidated financial statements (contd.)(expressed in thousands of US dollars except share data, per share data and as otherwise stated)
05050449_139_216.indd 20805050449_139_216.indd 208 5/19/05 10:28:12 PM5/19/05 10:28:12 PM
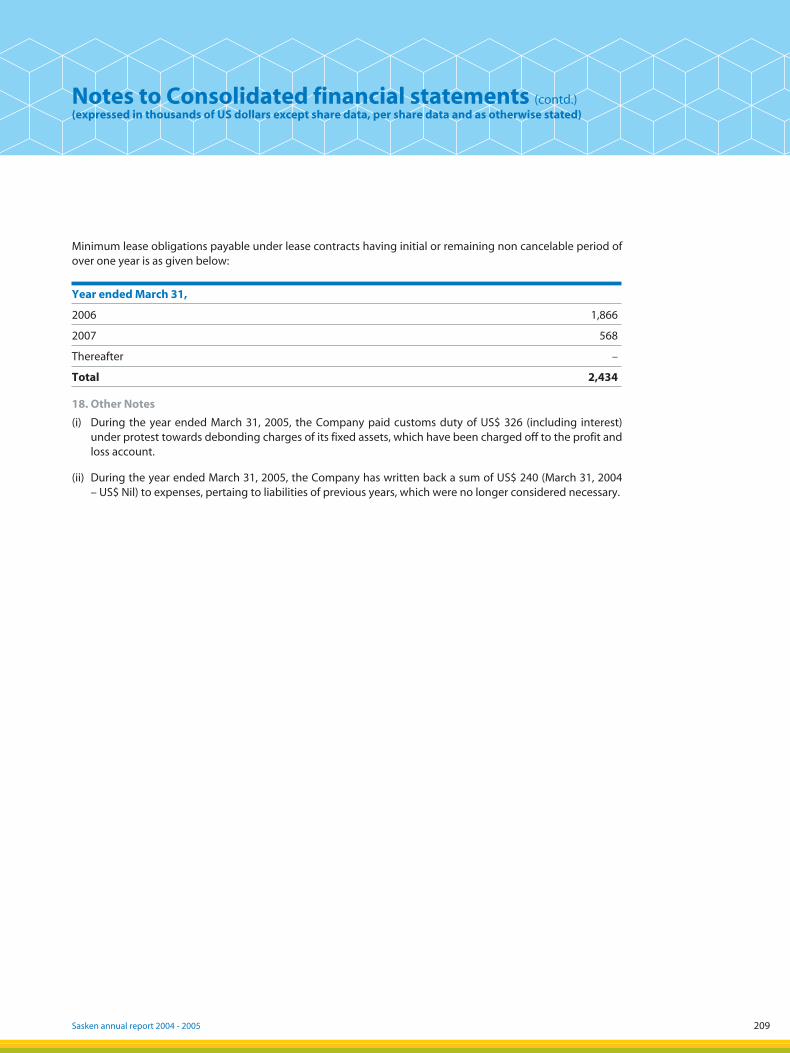
209Sasken annual report 2004 - 2005
Minimum lease obligations payable under lease contracts having initial or remaining non cancelable period of over one year is as given below:
Year ended March 31,
2006 1,866
2007 568
Thereafter –
Total 2,434
18. Other Notes
(i) During the year ended March 31, 2005, the Company paid customs duty of US$ 326 (including interest) under protest towards debonding charges of its fixed assets, which have been charged off to the profit and loss account.
(ii) During the year ended March 31, 2005, the Company has written back a sum of US$ 240 (March 31, 2004 – US$ Nil) to expenses, pertaing to liabilities of previous years, which were no longer considered necessary.
Notes to Consolidated financial statements (contd.)(expressed in thousands of US dollars except share data, per share data and as otherwise stated)
05050449_139_216.indd 20905050449_139_216.indd 209 5/19/05 10:28:13 PM5/19/05 10:28:13 PM
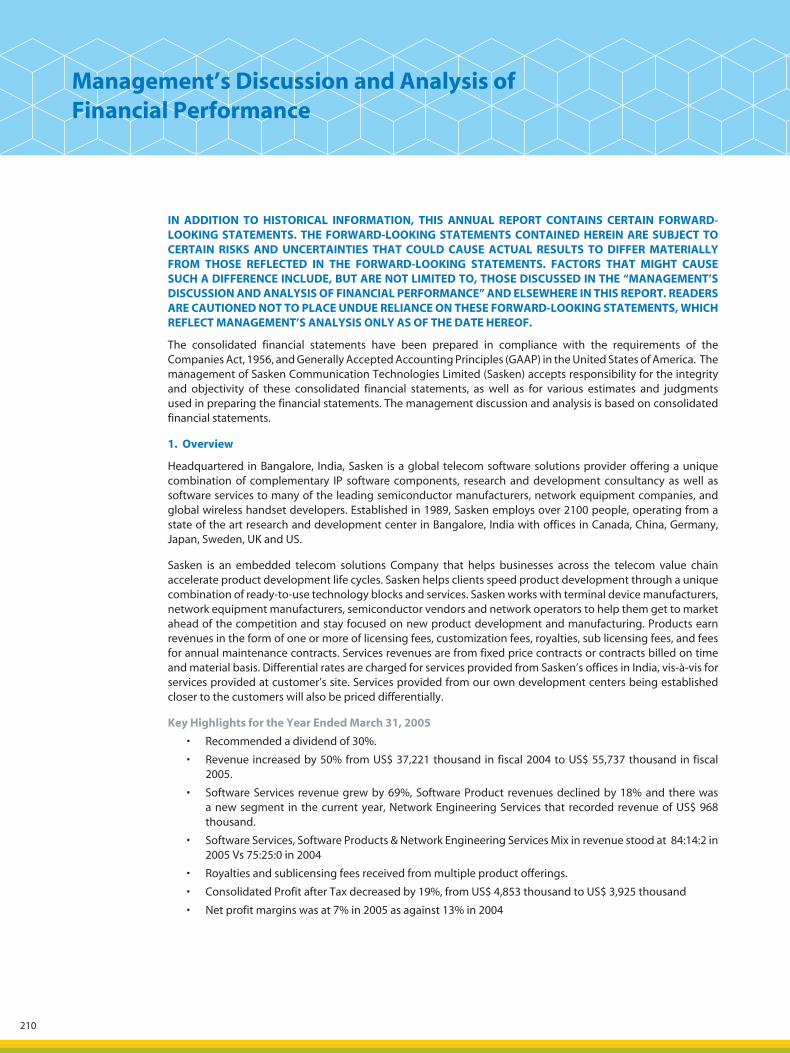
210
IN ADDITION TO HISTORICAL INFORMATION, THIS ANNUAL REPORT CONTAINS CERTAIN FORWARD-LOOKING STATEMENTS. THE FORWARD-LOOKING STATEMENTS CONTAINED HEREIN ARE SUBJECT TO CERTAIN RISKS AND UNCERTAINTIES THAT COULD CAUSE ACTUAL RESULTS TO DIFFER MATERIALLY FROM THOSE REFLECTED IN THE FORWARD-LOOKING STATEMENTS. FACTORS THAT MIGHT CAUSE SUCH A DIFFERENCE INCLUDE, BUT ARE NOT LIMITED TO, THOSE DISCUSSED IN THE “MANAGEMENT’S DISCUSSION AND ANALYSIS OF FINANCIAL PERFORMANCE” AND ELSEWHERE IN THIS REPORT. READERS ARE CAUTIONED NOT TO PLACE UNDUE RELIANCE ON THESE FORWARD-LOOKING STATEMENTS, WHICH REFLECT MANAGEMENT’S ANALYSIS ONLY AS OF THE DATE HEREOF.
The consolidated financial statements have been prepared in compliance with the requirements of the Companies Act, 1956, and Generally Accepted Accounting Principles (GAAP) in the United States of America. The management of Sasken Communication Technologies Limited (Sasken) accepts responsibility for the integrity and objectivity of these consolidated financial statements, as well as for various estimates and judgments used in preparing the financial statements. The management discussion and analysis is based on consolidated financial statements.
1. Overview
Headquartered in Bangalore, India, Sasken is a global telecom software solutions provider offering a unique combination of complementary IP software components, research and development consultancy as well as software services to many of the leading semiconductor manufacturers, network equipment companies, and global wireless handset developers. Established in 1989, Sasken employs over 2100 people, operating from a state of the art research and development center in Bangalore, India with offices in Canada, China, Germany, Japan, Sweden, UK and US.
Sasken is an embedded telecom solutions Company that helps businesses across the telecom value chain accelerate product development life cycles. Sasken helps clients speed product development through a unique combination of ready-to-use technology blocks and services. Sasken works with terminal device manufacturers, network equipment manufacturers, semiconductor vendors and network operators to help them get to market ahead of the competition and stay focused on new product development and manufacturing. Products earn revenues in the form of one or more of licensing fees, customization fees, royalties, sub licensing fees, and fees for annual maintenance contracts. Services revenues are from fixed price contracts or contracts billed on time and material basis. Differential rates are charged for services provided from Sasken’s offices in India, vis-à-vis for services provided at customer’s site. Services provided from our own development centers being established closer to the customers will also be priced differentially.
Key Highlights for the Year Ended March 31, 2005
• Recommended a dividend of 30%.
• Revenue increased by 50% from US$ 37,221 thousand in fiscal 2004 to US$ 55,737 thousand in fiscal 2005.
• Software Services revenue grew by 69%, Software Product revenues declined by 18% and there was a new segment in the current year, Network Engineering Services that recorded revenue of US$ 968 thousand.
• Software Services, Software Products & Network Engineering Services Mix in revenue stood at 84:14:2 in 2005 Vs 75:25:0 in 2004
• Royalties and sublicensing fees received from multiple product offerings.
• Consolidated Profit after Tax decreased by 19%, from US$ 4,853 thousand to US$ 3,925 thousand
• Net profit margins was at 7% in 2005 as against 13% in 2004
Management’s Discussion and Analysis of Financial Performance
05050449_139_216.indd 21005050449_139_216.indd 210 5/19/05 10:28:14 PM5/19/05 10:28:14 PM
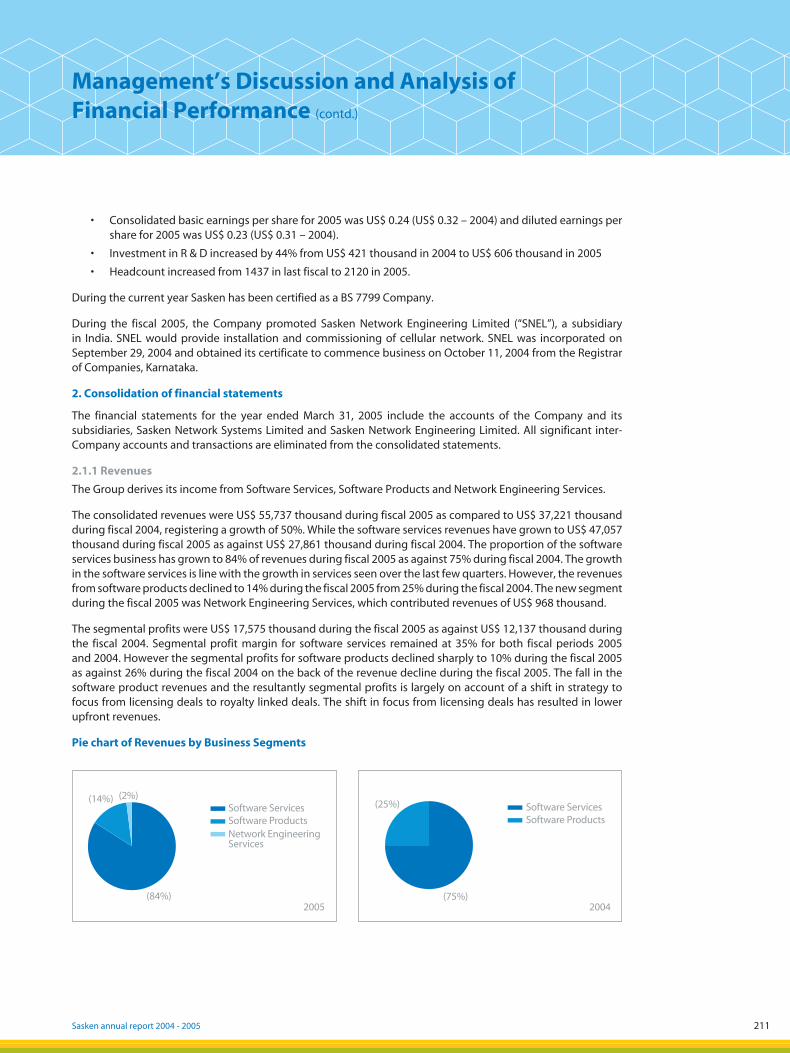
211Sasken annual report 2004 - 2005
• Consolidated basic earnings per share for 2005 was US$ 0.24 (US$ 0.32 – 2004) and diluted earnings per share for 2005 was US$ 0.23 (US$ 0.31 – 2004).
• Investment in R & D increased by 44% from US$ 421 thousand in 2004 to US$ 606 thousand in 2005
• Headcount increased from 1437 in last fiscal to 2120 in 2005.
During the current year Sasken has been certified as a BS 7799 Company.
During the fiscal 2005, the Company promoted Sasken Network Engineering Limited (“SNEL”), a subsidiary in India. SNEL would provide installation and commissioning of cellular network. SNEL was incorporated on September 29, 2004 and obtained its certificate to commence business on October 11, 2004 from the Registrar of Companies, Karnataka.
2. Consolidation of financial statements
The financial statements for the year ended March 31, 2005 include the accounts of the Company and its subsidiaries, Sasken Network Systems Limited and Sasken Network Engineering Limited. All significant inter-Company accounts and transactions are eliminated from the consolidated statements.
2.1.1 Revenues
The Group derives its income from Software Services, Software Products and Network Engineering Services.
The consolidated revenues were US$ 55,737 thousand during fiscal 2005 as compared to US$ 37,221 thousand during fiscal 2004, registering a growth of 50%. While the software services revenues have grown to US$ 47,057 thousand during fiscal 2005 as against US$ 27,861 thousand during fiscal 2004. The proportion of the software services business has grown to 84% of revenues during fiscal 2005 as against 75% during fiscal 2004. The growth in the software services is line with the growth in services seen over the last few quarters. However, the revenues from software products declined to 14% during the fiscal 2005 from 25% during the fiscal 2004. The new segment during the fiscal 2005 was Network Engineering Services, which contributed revenues of US$ 968 thousand.
The segmental profits were US$ 17,575 thousand during the fiscal 2005 as against US$ 12,137 thousand during the fiscal 2004. Segmental profit margin for software services remained at 35% for both fiscal periods 2005 and 2004. However the segmental profits for software products declined sharply to 10% during the fiscal 2005 as against 26% during the fiscal 2004 on the back of the revenue decline during the fiscal 2005. The fall in the software product revenues and the resultantly segmental profits is largely on account of a shift in strategy to focus from licensing deals to royalty linked deals. The shift in focus from licensing deals has resulted in lower upfront revenues.
Pie chart of Revenues by Business Segments
Management’s Discussion and Analysis ofFinancial Performance (contd.)
Software ServicesSoftware ProductsNetwork EngineeringServices
(14%) (2%)
(84%)2005
Software ServicesSoftware Products
(25%)
(75%)2004
05050449_139_216.indd 21105050449_139_216.indd 211 5/19/05 10:28:15 PM5/19/05 10:28:15 PM

212
2.1.2 Cost of revenues
Cost of revenues comprises costs incurred by the business units and operating costs allocated to the business units, based on the related utilization by each of the segments.
The cost of revenues for fiscal 2005 was US$ 38,162 thousand as compared to US$ 25,084 thousand in the previous year. As percentage of revenues, it works out to 68% and 67% respectively in each of the fiscal period. In absolute terms, the cost of revenues has increased by US$ 13,078 thousand (52%).
Employment costs as a percentage of revenue, constitute 45% & 43% for the fiscal 2005 & 2004 respectively. During the year, the employment costs increased by 56%, due to increase in head count, annual increments and increase in salaries paid to employees deputed overseas, on account of an increase in the quantum of on-site work.
Depreciation as a percentage of revenue is 5% for the fiscal 2005 & 6% for the fiscal 2004. In absolute terms, depreciation increased by 11%, mainly on account of increase in expenses on purchase of generic software.
Product Engineering expenses
Product Engineering expenses include the costs of product development, and modifications and enhancements to products that are already available to customers, and for which revenues may or may not have been recognized during the current year. These expenses, which have been charged to the respective expense heads, and the appropriate segments, when taken together, constitute 8% of revenues for fiscal 2005, as compared with 9% in fiscal 2004. In absolute terms, there has been an increase in the amount of expenses incurred in product engineering by US$ 1,229 thousand. Product engineering expenses incurred on new products that have passed the stage of technological feasibility, are capitalized. No costs were capitalized in fiscal 2005 and 2004 on account of the fact that no new R & D initiatives had reached the stage of technological feasibility.
2.1.3 Gross profit
Gross profit was US$ 17,575 at 32% of revenues during the fiscal 2005 and US$ 12,137 at 33% of revenues during the fiscal 2004. In absolute terms, gross profit increased by 45%, on account of increase in revenues. The economies of scale on higher revenues were offset by employment cost and rent on new facilities.
2.1.4 Research and Development (R&D)
Research and development expenses constituted 1% of the revenues each during fiscal 2005 and fiscal 2004. In absolute terms, R&D increased by 44%.
2.1.5 Selling & Marketing expenses
Selling and Marketing expenses primarily include costs related to employment expenses of the marketing and sales staff, rent for foreign offices, distributor fees, channel commissions and travel expenses for marketing and sales staff.
Selling and Marketing expenses were at 10% of revenues for fiscal 2005 as against 11% in fiscal 2004. The increase in absolute terms was US$ 1,457. However the decrease in selling and marketing expenses as percentage of revenue, which is indicative of the fact that economies of scale are being reaped.
2.1.6 Administrative and General expenses
Administrative and General expenses primarily include costs related to employment expenses of support staff, rent, professional, legal and consultancy fees, provision for bad debts, depreciation and, training expenses.
Administrative and General expenses constituted 12% in fiscal 2005 and 11% in fiscal 2004. In absolute terms, these expenses posted an increase of 67% during fiscal 2005 over the previous fiscal mainly on account of increase in employment costs, professional, legal and consultancy, rent, communication expenses, electricity and water charges, rates and taxes, repairs and maintenance. Employment costs increased on account of increase in head count and annual increments and provision for QPIC and Gratuity. Professional, legal and consultancy
Management’s Discussion and Analysis of Financial Performance (contd.)
05050449_139_216.indd 21205050449_139_216.indd 212 5/19/05 10:28:16 PM5/19/05 10:28:16 PM
213Sasken annual report 2004 - 2005
has increased marginally due to higher expenses on EVA consultancy and legal fees. Increase in rent is mainly on account of additional facilities taken on lease in Bangalore and new facility taken in Pune. Communication expense increased due to addition of new facilities and increase in head count. Increase in electricity and water charges is on account of new facilities added during the current fiscal. Rates and taxes increased due to the customs duty paid during the current fiscal on assets debonded. Increase in repairs and maintenance is on account of Company entering into comprehensive maintenance contracts for plant and machinery and also due to new facilities added during the current year. The management periodically reviews the quality of receivables and wherever necessary provisions for bad debts are made. The provisions of an earlier year were reversed during the year on collections.
2.1.7 Employee stock option compensation cost
In the current fiscal, the Company issued 1,395,723 stock options to employees at prices ranging between US$ 3.66 – 5.85 (Rs. 160-256) per option. The Company accounts for stock compensation expense based on the fair value of the options granted on the date of grant. US$ 164 thousand was the compensation cost accounted for the fiscal 2005.
2.1.8 Income from operations
Operating income for fiscal 2005 is US$ 4,281 thousand compared with US$ 3,408 thousand for fiscal 2004. Operating income as a proportion of revenue was 8% for fiscal 2005 as compared to 9% for fiscal 2004. The economies of scale on higher revenues were offset by employment cost under Selling & Marketing expenses, Administrative and General expenses, rent on new facilities added during the year and other costs necessitated by increase in head count.
2.1.9 Other income
Other income for fiscal 2005 was US$ 138 thousand as compared to US$ 1,155 thousand for fiscal 2004. The decrease was mainly on account of decrease in unrealized exchange gain on forward cover, by US$ 884 thousand.
2.1.10 Interest
Interest charged against income during the fiscal 2005 was US$ 106 thousand as compared with US$ 173 thousand for fiscal 2004. The decrease was on account of inflow from the equity issue on exercise of certain warrants and efficiencies in the use of bank credits for working capital purposes.
2.1.11 Income taxes
Income taxes paid during fiscal 2005, was US$ 388 thousand as compared to a tax credit of US$ 463 thousand during fiscal 2004. The tax refunds received during the current year were much lower than those received during fiscal 2004. Additionally, the extent of business carried out in India for our customers saw an increase, leading to a higher domestic tax incidence.
2.1.12 Net income
Net income from ordinary activities and continuing operations for fiscal 2005 was US$ 3,925 thousand as compared to US$ 4,853 thousand during previous fiscal.
3. Results of operations for the fiscal ended March 31, 2004 compared with fiscal ended March 31, 2003
3.1.1 Revenues
The Company derives its income from Software Services and Software Products.
The revenues were US$ 37,221 thousand during fiscal 2004 as compared to US$ 23,460 thousand during fiscal 2003, registering a growth of 59%. While the Software Services revenues have grown to US$ 27,861 thousand during the fiscal 2005 as against US$ 14,015 thousand during the fiscal 2004. The proportion of the Software Services business has grown to 75% of revenues during fiscal 2004 as against 60% during fiscal 2003. The revenues from Software Products declined to 25% during the fiscal 2004 from 40% during the fiscal 2003. The slowdown
Management’s Discussion and Analysis ofFinancial Performance (contd.)
05050449_139_216.indd 21305050449_139_216.indd 213 5/19/05 10:28:17 PM5/19/05 10:28:17 PM
214
in the global telecom sector led to slowdown of investments by telecom vendors in newer technologies such as 3G. This resulted in a reduced demand for our products. This led to a conscious effort on growing the services business to bring greater stability to the overall revenue base of the Company.
Segmental profits were US$ 12,137 thousand during the fiscal 2004 as against US$ 7,703 thousand during the fiscal 2003. Segmental profit margin for Software Services was 35% and 23% respectively for the fiscal 2004 and 2003. However the segmental profits for Software Products declined sharply to 27% during the fiscal 2004 as against 48% during the fiscal 2003 on the back of the revenue decline during the fiscal 2004. The fall in the Software Product revenues and the resultant segmental profits is largely on account of a shift in strategy to focus from licensing deals to royalty linked deals. The shift in focus from licensing deals has resulted in lower upfront revenues.
Pie chart of Revenues by Business Segments
3.1.2 Cost of revenues
Cost of revenues comprises costs incurred by the business units and operating costs allocated to the business units, based on the related utilization by each of the segments.
The cost of revenues for fiscal 2004 was US$ 25,084 thousand as compared to US$ 15,757 thousand in the previous year. As percentage of revenues, it works out to 67% in each of the fiscal period. In absolute terms, the cost of revenues has increased by US$ 9,327 thousands (59%).
Employment costs as a percentage of revenue, constitute 43% & 41% for the fiscal 2004 & 2003 respectively. During the year, the employment costs increased by 70%, mainly on account of an increase in the quantum of onsite work.
Depreciation as a percentage of revenue is 6% for the fiscal 2004 & 9% for the fiscal 2003. This reflects the improvement in the utilization of assets by the organization. In absolute terms, depreciation increased by 12%, mainly on account of increase in expenses on purchase of generic software.
Product Engineering Expenses
Product Engineering expenses include the costs of product development, and modifications and enhancements to products that are already available to customers, and for which revenues may or may not have been recognized during the current year. These expenses, which have been charged to the respective expense heads, and the
Software ServicesSoftware Products
(25%)
(75%)2004
Software ServicesSoftware Products
(40%)
(60%)
2003
Management’s Discussion and Analysis of Financial Performance (contd.)
05050449_139_216.indd 21405050449_139_216.indd 214 5/19/05 10:28:19 PM5/19/05 10:28:19 PM
215Sasken annual report 2004 - 2005
appropriate segments, when taken together, constitute 8% of revenues for fiscal 2004, as compared with 11% in fiscal 2003. In absolute terms, there has been an increase in the amount of expenses incurred in product engineering to the tune of US$ 322 thousand. Product Engineering expenses incurred on new products that have passed the stage of technological feasibility are capitalized. No costs were capitalized in fiscal 2004 on account of the fact that no new R & D initiatives had reached the stage of technological feasibility. Capitalized costs as a percentage of revenue were 8% for the fiscal 2003.
3.1.3 Gross profit
Gross profit remained at 33% of revenues each during fiscal 2004 & 2003. In absolute terms, gross profit increased by 58%, on account of increase in revenues.
3.1.4 Research and Development (R&D)
Research and Development expenses constituted 1% of the revenues each during fiscal 2004 and fiscal 2003. In absolute terms, R&D increased by 75%. The R&D efforts were specifically in the areas of DSL, multimedia codecs and applications, and mobile platform solutions, as in fiscal 2003.
3.1.5 Selling & Marketing expenses
Selling and marketing expenses primarily include costs related to employment expenses of the marketing and sales staff, rent for foreign offices, distributor fees, channel commissions and travel expenses for marketing and sales staff.
Selling and Marketing expenses were at 11% of revenues for fiscal 2004 as against 17% in fiscal 2003. This was largely on account of improvement in productivity of the sales team and also on account of rationalization of the sales staff in Japan, to bring them in line with revenues from the region.
3.1.6 Administrative and General expenses (including provision for diminution in value of investment)
Administrative and General expenses primarily include costs related to employment expenses of support staff, rent, professional, legal and consultancy fees, provision for bad debts, depreciation, ESOP costs and, training expenses.
Administrative and General expenses (excluding provision for diminution in value of investment) constituted 11% in each of the fiscal periods. In absolute terms these expenses posted an increase of 64% during fiscal 2004 over the previous fiscal mainly on account of increase in employment costs, training costs and insurance costs. Employment costs increased on account of increase in head count and annual increments. Training costs increased due to larger number of training programs undertaken both in the technical domain and in organization development. The management periodically reviews the quality of receivables and wherever necessary provisions for bad debts are made. In the current year, under review, a provision of US$ 416 thousand was made. Professional, legal and consultancy has increased marginally due to higher expenses on patents being filed. Insurance costs increased since the charge for fiscal 2003 was for part of the year only, whereas for the current year the cover was there for the full year. Increase in the scope of coverage also cause some part of the increase.
Provision for diminution in value of investment was Nil during 2004 and 3% during fiscal 2003.
Employee stock option compensation cost
Under Sasken ESOP-2000, on October 1, 2003, the Company issued 296,040 options to employees, convertible into 296,040 equity shares, with a vesting period of one year at an exercise price of US$ 1.84. Although the
Management’s Discussion and Analysis ofFinancial Performance (contd.)
05050449_139_216.indd 21505050449_139_216.indd 215 5/19/05 10:28:20 PM5/19/05 10:28:20 PM
216
options were issued at the fair value of the shares, compensation cost arises on account of the inherent value of options. Compensation cost of US$ 34 thousand was booked during fiscal 2004, for the six month period until March 31, 2004. There was no corresponding charge during fiscal 2003, since the Company had cancelled the options, which were substantially out of money, during that year.
3.1.7 Income from operations
Operating income for fiscal 2004 is US$ 3,408 thousand compared with US$ 132 thousand for fiscal 2003. Operating income as a proportion of revenue was 9% for fiscal 2004 as compared to 0.6% for fiscal 2003. Increase in the revenue base, and improvement in the proportion of selling expenses was largely responsible for this.
3.1.8 Other income
Other income for fiscal 2004 was US$ 1,155 thousand as compared to US$ 34 thousand negative for fiscal 2003. The increase was mainly on account of unrealized exchange gain on forward covers of US$ 1,082 thousand.
3.1.9 Interest
Interest charged against income during the fiscal 2004 was US$ 173 thousand as compared with US$ 749 thousand for fiscal 2003. The decrease in interest expense was on account of repayment of the long-term debt availed by the Company during the early part of fiscal 2004, reduction in the interest rates for working capital borrowings, reduction in the utilization of the working capital limits by about 14% in fiscal 2004. Also part of the Rupee denominated line of credit was converted into a US Dollar debt at much lower interest rates towards the end of fiscal 2004, the results of which will be more visible during the coming year.
3.1.10 Income taxes
Income taxes, during fiscal 2004, was a negative amount of US$ 463 thousand as compared to US$ 569 thousand during fiscal 2003. The decrease was mainly due to lower taxable income on account of set off of carry forward losses of earlier years and refund received of US$ 1,026 thousand of excess taxes withheld in the earlier fiscal.
3.1.11 Net income
Net income from ordinary activities and continuing operations for fiscal 2004 was US$ 4,853 thousand as compared to Net loss of US$ 1,220 thousand during previous year.
Management’s Discussion and Analysis of Financial Performance (contd.)
05050449_139_216.indd 21605050449_139_216.indd 216 5/19/05 10:28:21 PM5/19/05 10:28:21 PM
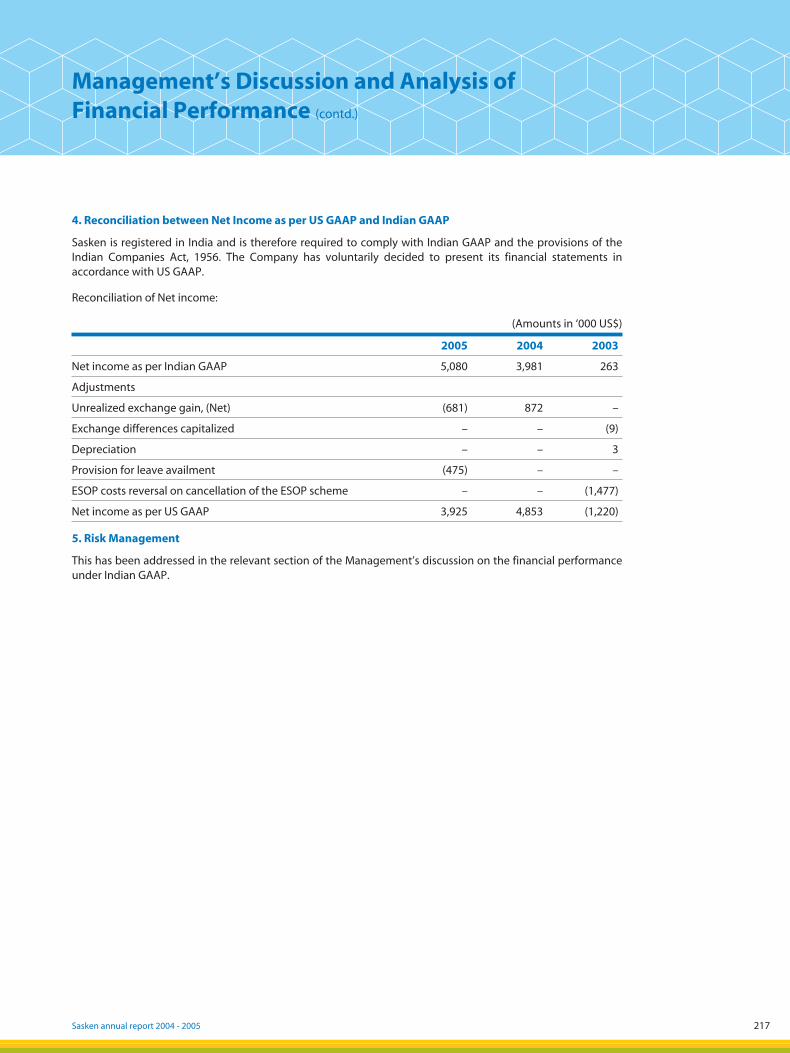
217Sasken annual report 2004 - 2005
4. Reconciliation between Net Income as per US GAAP and Indian GAAP
Sasken is registered in India and is therefore required to comply with Indian GAAP and the provisions of the Indian Companies Act, 1956. The Company has voluntarily decided to present its financial statements in accordance with US GAAP.
Reconciliation of Net income:
(Amounts in ‘000 US$)
2005 2004 2003
Net income as per Indian GAAP 5,080 3,981 263
Adjustments
Unrealized exchange gain, (Net) (681) 872 –
Exchange differences capitalized – – (9)
Depreciation – – 3
Provision for leave availment (475) – –
ESOP costs reversal on cancellation of the ESOP scheme – – (1,477)
Net income as per US GAAP 3,925 4,853 (1,220)
5. Risk Management
This has been addressed in the relevant section of the Management’s discussion on the financial performance under Indian GAAP.
Management’s Discussion and Analysis ofFinancial Performance (contd.)
05050449_139_216.indd 21705050449_139_216.indd 217 5/19/05 10:28:22 PM5/19/05 10:28:22 PM

05050449_139_216.indd 21805050449_139_216.indd 218 5/19/05 10:28:23 PM5/19/05 10:28:23 PM


• INDIA • CHINA • JAPAN • GERMANY • USA • CANADA • SWEDEN • UK • FRANCE
Products and services names mentioned herein are trademarks and service marks of Sasken Communication Technologies Limited
or the respective companies. Copyright 2005.
Sasken annual report 2004 - 2005
Sa
ske
na
nn
ua
lre
po
rt2
00
4 - 2
00
5
PRIN
T@PR
AGAT
I.CO
M
Sasken_Cov_PAP.indd 1Sasken_Cov_PAP.indd 1 5/18/05 11:13:17 PM5/18/05 11:13:17 PM