Embed Size (px)
Citation preview
Page | 1
SAS® UNIX-Space Analyzer – A Handy Tool for UNIX SAS Administrators
Airaha Chelvakkanthan Manickam, Cognizant Technology Solutions, Teaneck, NJ
ABSTRACT:In the fast growing area of information and technology, SAS® users tend to occupy a lot of space with their SASdata sets. As time goes on, these SAS data sets tend to grow and slowly occupy the entire space on the file system. It is a challenge for the SAS admin to bring control over the file system as there are numerous SAS users and everyone utilizes the file system for their day-to-day use. Hence a solution is necessary to manage the UNIX file system from the perspective of top space utilizing users, high volume SAS files, how long SAS files are kept and owners of oldest SAS files and newest SAS files, etc. The proposed solution uses SAS to issue UNIX commands to capture the attributes of every file on the file system and SAS to build a mini-data warehouse around the usage of the file system. Using the data warehouse, the SAS admin can issue simple queries to understand the utilization of the file system at any point in time. The solution also includes creation of usage charts for presentations to uppermanagement on the file system usage. The charts are produced using MS Excel and refreshed automatically using SAS DDE connection with MS Excel. SAS Enterprise Guide 4.3 is used to automatically schedule and refresh the data warehouse on a weekly basis.
INTRODUCTION:SAS data mart is one of the fastest growing areas of data in the current information technology world. This paper explains a solution for building a tool for SAS Administrators to govern control over the usage of the SAS data mart from numerous SAS users. The goal of this paper is to control the space utilization of the SAS data mart which runs on a UNIX server with AIX 5.3 Operating System. This paper also explains how the space utilization details can be prepared in the form of “Usage Charts” for higher management presentations.
The technologies used in this paper are SAS 9.2, SAS Enterprise Guide 4.3, UNIX commands and Microsoft Excel.
PROPOSED SOLUTION:The proposed solution is to build a SAS mini-data mart to monitor and record the usage of available space on the UNIX file system used by SAS users. This is achieved using the following steps.
1. Build Usage mini-data-mart:
o SAS is used to issue Operating System commands to capture all attributes of every file on the UNIX file system and to build a mini-data mart with complete details of the usage of the file system.
o The important goal of building SAS mini-data mart is to provide the ability for SAS administratorsto query the mini-data mart and to obtain the utilization of the file system by user/file/directory/time period very easily.
2. Build Usage Summary Statistics:
o SAS DATA step commands and PROC SUMMARY procedure are used to derive various summary levels of usage for further analysis.
3. Refresh Usage Charts:
o SAS/DDE engine is used to refresh set of pre-defined graphs in Microsoft Excel which are used for further analysis and for management presentation.
4. Scheduled in SAS:
o SAS Enterprise Guide 4.3 is used to schedule the tool to run every week on Friday 10AM, produce the statistics and which are mailed to management for review.
The solution is explained in the following sections with the help of SAS code segments and the resultant charts/graphs.
Management, Administration and SupportNESUG 2012
Page | 2
BUILD USAGE DATA MART:The pre-requisite for this task is to have UNIX admin rights to be able to read the file attributes of all files stored on the target file system.
Following command can be used to obtain the file attributes:
ls -lR /Root/Parent_Directory/* > /Root/Space_used/space_check_&SYSDATE..dat
The command ‘ls’ on AIX 5.3 Operating System provides the list of all files from the directory mentioned in the command. The option ‘-l’ displays the attributes of the files such as permissions/owner/group/size/modified date & time. The command ‘-R’ performs a recursive search under the parent directory and get the attributes of all the files from all sub-directories; whenever a sub-folder is recursively searched, the name of the sub-folder is also written in output. The redirection command ‘>’ makes the output of the command ‘ls –lR’ to be written to a file.
Following code segment shows how SAS issues this command and redirects the data to a flat file.
%let TODAY_DATE=%SYSFUNC(INPUTN(&SYSDATE,DATE7.));x "ls -lR /Root/Parent_Directory/* > /Root/Space_used/space_check_&SYSDATE..dat";
SYSDATE macro variable is used to create a new version of the flat file every time the tool is run.
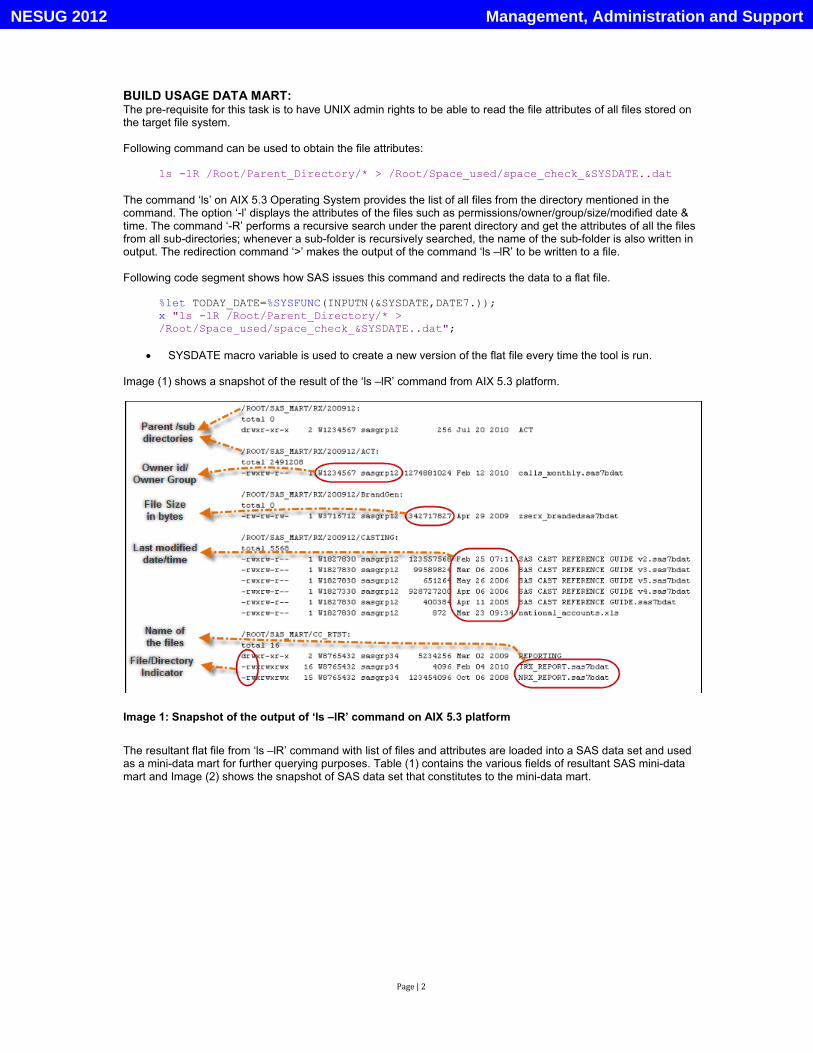
Image (1) shows a snapshot of the result of the ‘ls –lR’ command from AIX 5.3 platform.
Image 1: Snapshot of the output of ‘ls –lR’ command on AIX 5.3 platform
The resultant flat file from ‘ls –lR’ command with list of files and attributes are loaded into a SAS data set and used as a mini-data mart for further querying purposes. Table (1) contains the various fields of resultant SAS mini-data mart and Image (2) shows the snapshot of SAS data set that constitutes to the mini-data mart.
Management, Administration and SupportNESUG 2012
Page | 3
No Name of the attribute
What it means? How is it built?
1File/Directory Indicator
Whether an entry is a file or directory
This attribute is collected as the first byte of the file access permissions from the resultant flat file from ‘ls –lR’ command – as shown in Image(1).
File access permissions such as ‘-rw-r--r—‘ indicates that
it is a file.
File access permissions such as ‘drwxr-xr-x’ indicates
that it is a directory.
2 Owner Id/Owner Group
The owner of the file/directory and the group he/she belongs to
Owner Id/Owner Group are collected from the 3rd
and 4th
columns from file attributes flat file – as shown in Image(1).
3 Owner Name Name of the owner of file
Owner name is obtained from a separate look up data set by searching using owner id
4 Name of the file Name of the file on file system
File name is obtained from the 8th
column from the file attributes flat file – as shown in Image(1).
5 Parent Directory Name of the parent directory where a file is stored
Parent directory is identified as a separate entry from the file attributes flat file – as shown in Image(1).
6 Modified date/time and aging factor
When the file/directory was last modified? How old is a file/directory?
Modified date/time is collected from 6th
and 7th
columns from the file attributes flat file – as shown in Image(1).
Aging factor is calculated from modified date/time. Aging factor helps to divide the entire space usage across major categories such as 1) files modified recently 2) files modified in the last year 3) files modified more than 2 years old, etc.
7 Size of file Size in bytes of a file on the file system
Size is taken from the 5th
column from the file attributes flat file – as shown in Image(1).
8 Size in MB For easy understanding, size is converted to Mega Bytes
It is an calculated value from ‘Size of file’.Size in MB = (Size of file / (1024*1024) )
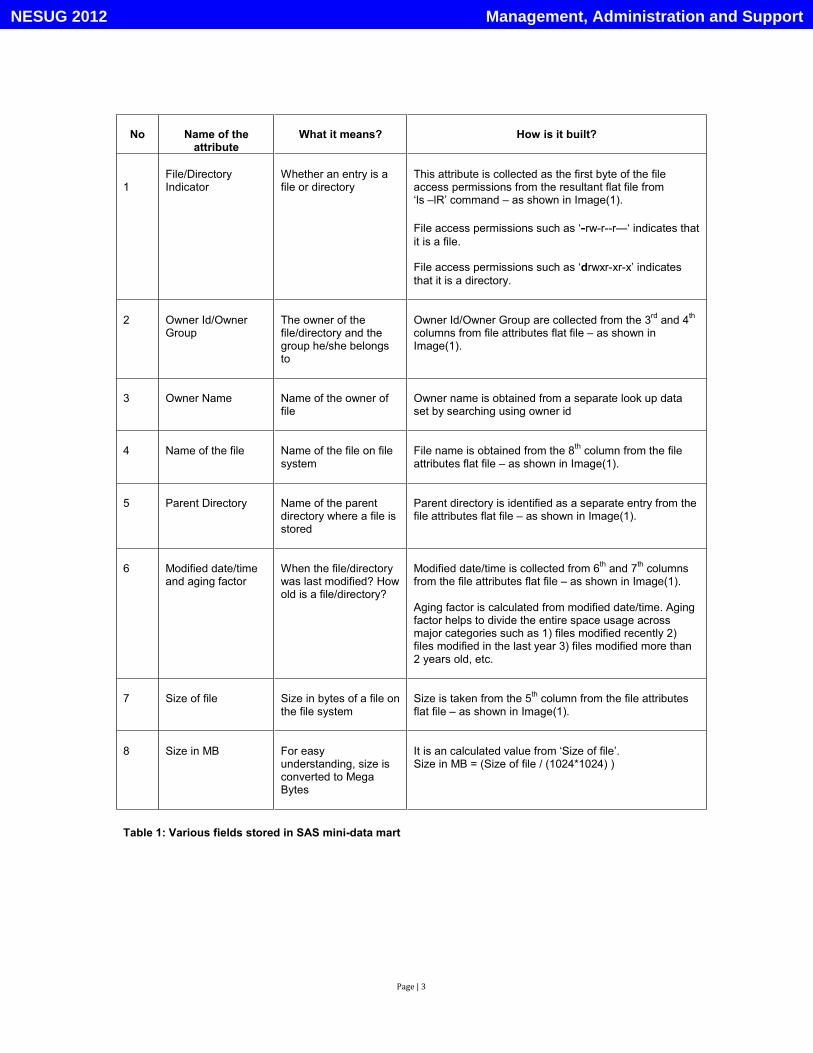
Table 1: Various fields stored in SAS mini-data mart
Management, Administration and SupportNESUG 2012
Page | 4
Image 2: Snapshot of SAS mini-data mart
Appendix (1) provides the program segment to build the SAS min-data mart that is shown above..
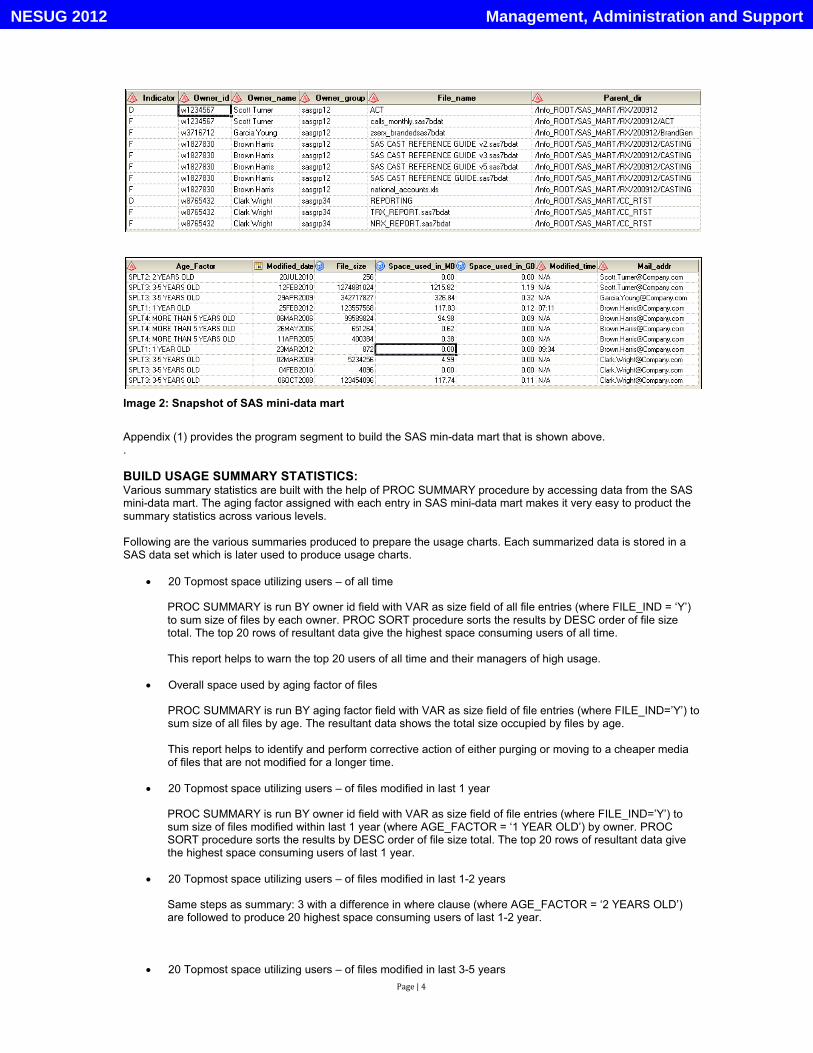
BUILD USAGE SUMMARY STATISTICS:Various summary statistics are built with the help of PROC SUMMARY procedure by accessing data from the SASmini-data mart. The aging factor assigned with each entry in SAS mini-data mart makes it very easy to product the summary statistics across various levels.
Following are the various summaries produced to prepare the usage charts. Each summarized data is stored in a SAS data set which is later used to produce usage charts.
20 Topmost space utilizing users – of all time
PROC SUMMARY is run BY owner id field with VAR as size field of all file entries (where FILE_IND = ‘Y’) to sum size of files by each owner. PROC SORT procedure sorts the results by DESC order of file size total. The top 20 rows of resultant data give the highest space consuming users of all time.
This report helps to warn the top 20 users of all time and their managers of high usage.
Overall space used by aging factor of files
PROC SUMMARY is run BY aging factor field with VAR as size field of file entries (where FILE_IND=’Y’) to sum size of all files by age. The resultant data shows the total size occupied by files by age.
This report helps to identify and perform corrective action of either purging or moving to a cheaper media of files that are not modified for a longer time.
20 Topmost space utilizing users – of files modified in last 1 year
PROC SUMMARY is run BY owner id field with VAR as size field of file entries (where FILE_IND=’Y’) to sum size of files modified within last 1 year (where AGE_FACTOR = ‘1 YEAR OLD’) by owner. PROC SORT procedure sorts the results by DESC order of file size total. The top 20 rows of resultant data give the highest space consuming users of last 1 year.
20 Topmost space utilizing users – of files modified in last 1-2 years
Same steps as summary: 3 with a difference in where clause (where AGE_FACTOR = ‘2 YEARS OLD’) are followed to produce 20 highest space consuming users of last 1-2 year.
20 Topmost space utilizing users – of files modified in last 3-5 years
Management, Administration and SupportNESUG 2012
Page | 5
Same steps as summary: 3 with a difference in where clause (where AGE_FACTOR = ‘3-5 YEARS OLD’) are followed to produce 20 highest space consuming users of last 3-5 year.
20 Topmost space utilizing users – of files modified beyond 5 years
Same steps as summary: 3 with a difference in where clause (where AGE_FACTOR = ‘MORE THAN 5 YEARS OLD’) are followed to produce 20 highest space consuming users of files modified beyond 5 years.
This report helps to contact the top 20 users of files not modified for a longer period to make a decision on either purging or moving the older files to cheaper media.
Appendix (2) provides the program segment that performs the various summary level calculations.
REFRESH USAGE CHARTS:
The usage charts that show the usage at various levels graphically are pre-defined in MS Excel-2007. Though SAS/GRAPH can be programmatically used to produce similar graphs, MS Excel is used as the intended end users are business managers and non-SAS users.
A one-time effort is required to build the charts in MS Excel-2007. In subsequent runs, SAS DDE engine is used to refresh the data in Excel sheet which automatically refreshes the usage charts. SAS DDE provides an efficient way of interacting between SAS and MS Excel. Using DDE commands, the SAS program can directly invoke, populate, refresh and close Excel tabs/sheets. This gives an added advantage to this tool to automatically refresh the Excel charts whenever the SAS summary data sets are refreshed.
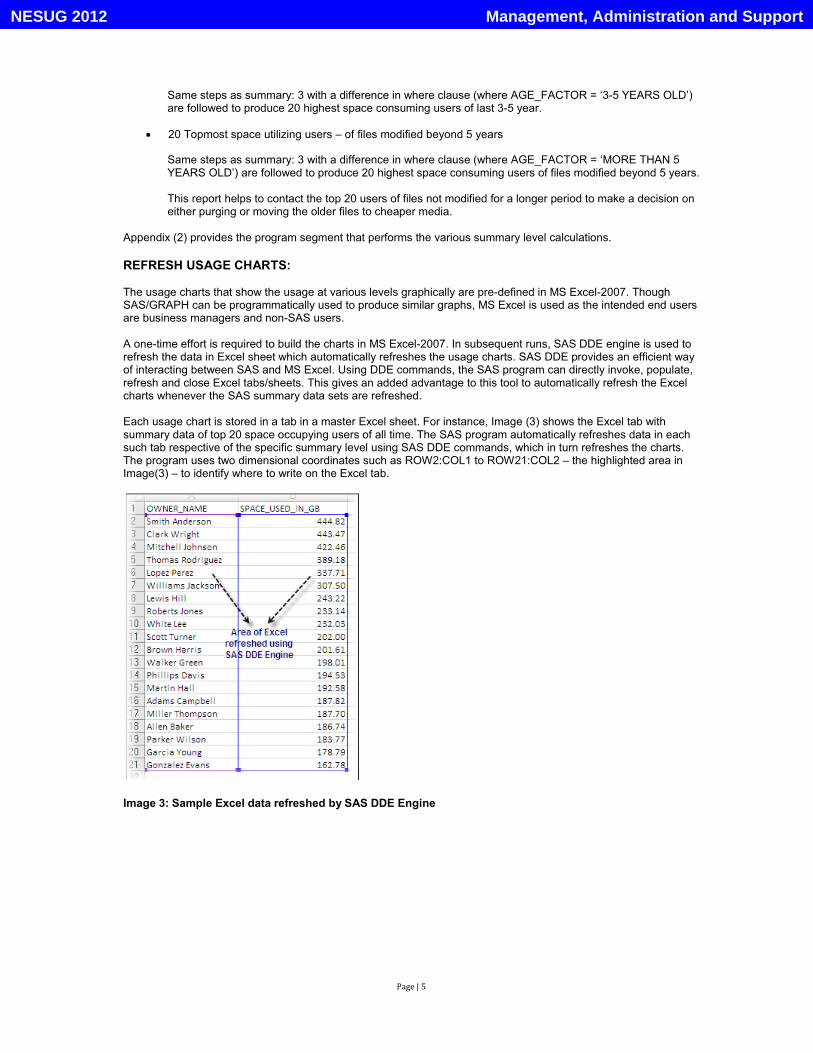
Each usage chart is stored in a tab in a master Excel sheet. For instance, Image (3) shows the Excel tab with summary data of top 20 space occupying users of all time. The SAS program automatically refreshes data in each such tab respective of the specific summary level using SAS DDE commands, which in turn refreshes the charts.The program uses two dimensional coordinates such as ROW2:COL1 to ROW21:COL2 – the highlighted area in Image(3) – to identify where to write on the Excel tab.
Image 3: Sample Excel data refreshed by SAS DDE Engine
Management, Administration and SupportNESUG 2012
Page | 6
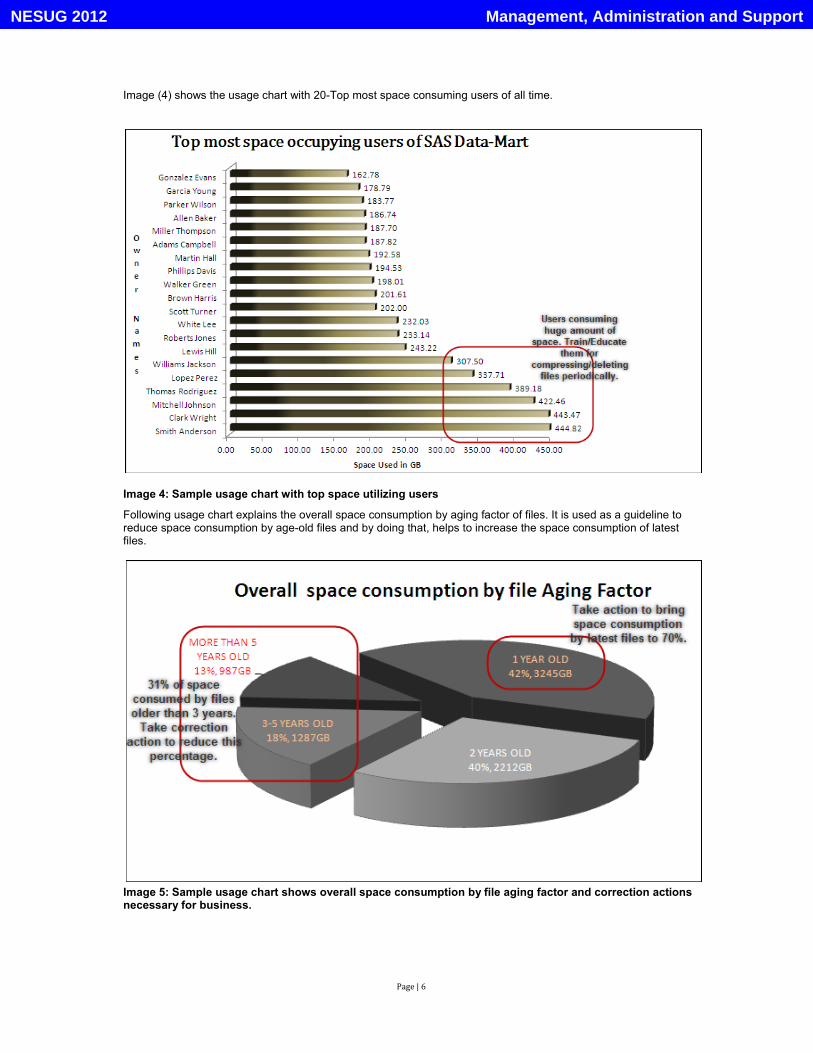
Image (4) shows the usage chart with 20-Top most space consuming users of all time.
Image 4: Sample usage chart with top space utilizing users
Following usage chart explains the overall space consumption by aging factor of files. It is used as a guideline to reduce space consumption by age-old files and by doing that, helps to increase the space consumption of latest files.
Image 5: Sample usage chart shows overall space consumption by file aging factor and correction actionsnecessary for business.
Management, Administration and SupportNESUG 2012
Page | 7
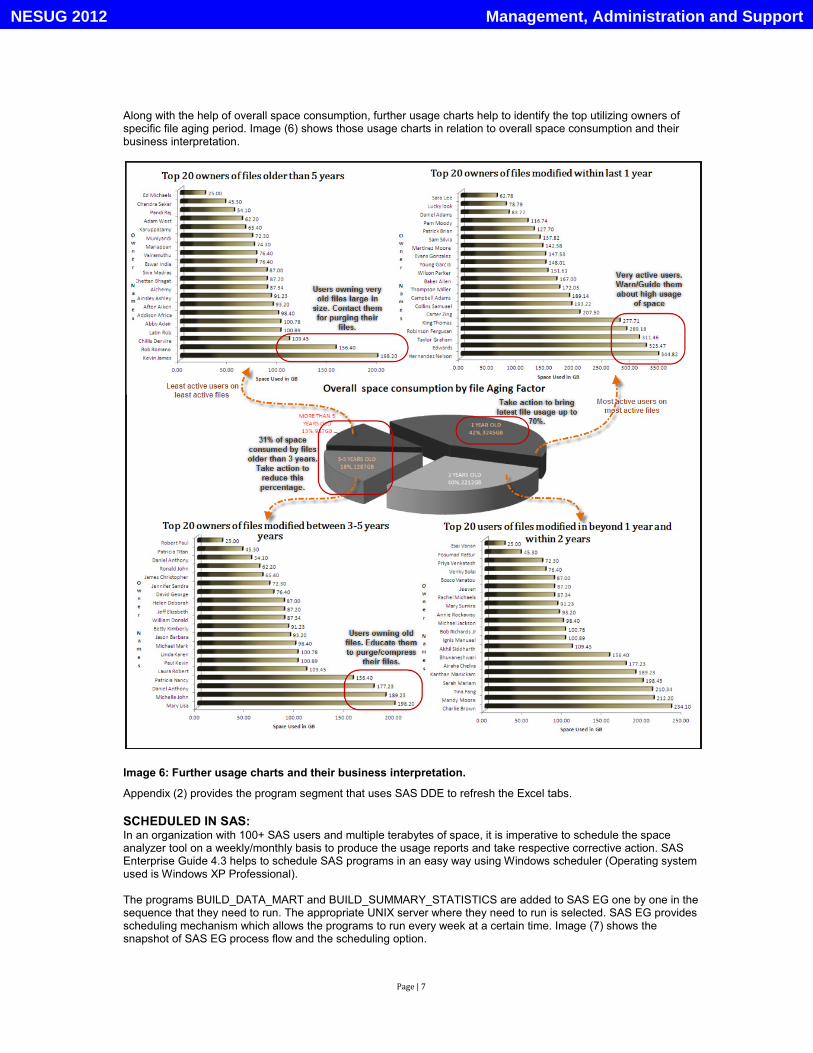
Along with the help of overall space consumption, further usage charts help to identify the top utilizing owners of specific file aging period. Image (6) shows those usage charts in relation to overall space consumption and theirbusiness interpretation.
Image 6: Further usage charts and their business interpretation.
Appendix (2) provides the program segment that uses SAS DDE to refresh the Excel tabs.
SCHEDULED IN SAS:In an organization with 100+ SAS users and multiple terabytes of space, it is imperative to schedule the space analyzer tool on a weekly/monthly basis to produce the usage reports and take respective corrective action. SASEnterprise Guide 4.3 helps to schedule SAS programs in an easy way using Windows scheduler (Operating system used is Windows XP Professional).
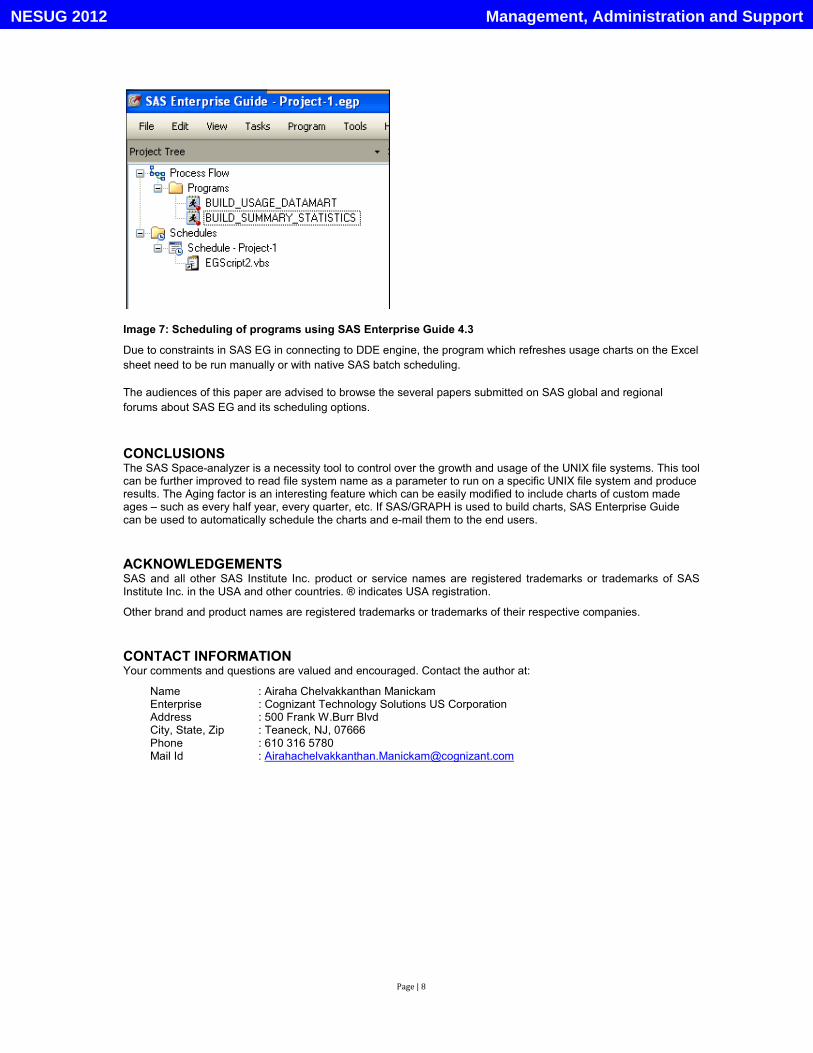
The programs BUILD_DATA_MART and BUILD_SUMMARY_STATISTICS are added to SAS EG one by one in the sequence that they need to run. The appropriate UNIX server where they need to run is selected. SAS EG provides scheduling mechanism which allows the programs to run every week at a certain time. Image (7) shows the snapshot of SAS EG process flow and the scheduling option.
Management, Administration and SupportNESUG 2012
Page | 8
Image 7: Scheduling of programs using SAS Enterprise Guide 4.3
Due to constraints in SAS EG in connecting to DDE engine, the program which refreshes usage charts on the Excel
sheet need to be run manually or with native SAS batch scheduling.
The audiences of this paper are advised to browse the several papers submitted on SAS global and regional
forums about SAS EG and its scheduling options.
CONCLUSIONSThe SAS Space-analyzer is a necessity tool to control over the growth and usage of the UNIX file systems. This tool can be further improved to read file system name as a parameter to run on a specific UNIX file system and produce results. The Aging factor is an interesting feature which can be easily modified to include charts of custom madeages – such as every half year, every quarter, etc. If SAS/GRAPH is used to build charts, SAS Enterprise Guide can be used to automatically schedule the charts and e-mail them to the end users.
ACKNOWLEDGEMENTSSAS and all other SAS Institute Inc. product or service names are registered trademarks or trademarks of SAS Institute Inc. in the USA and other countries. ® indicates USA registration.
Other brand and product names are registered trademarks or trademarks of their respective companies.
CONTACT INFORMATIONYour comments and questions are valued and encouraged. Contact the author at:
Name : Airaha Chelvakkanthan ManickamEnterprise : Cognizant Technology Solutions US CorporationAddress : 500 Frank W.Burr BlvdCity, State, Zip : Teaneck, NJ, 07666Phone : 610 316 5780Mail Id : [email protected]
Management, Administration and SupportNESUG 2012
Page | 9
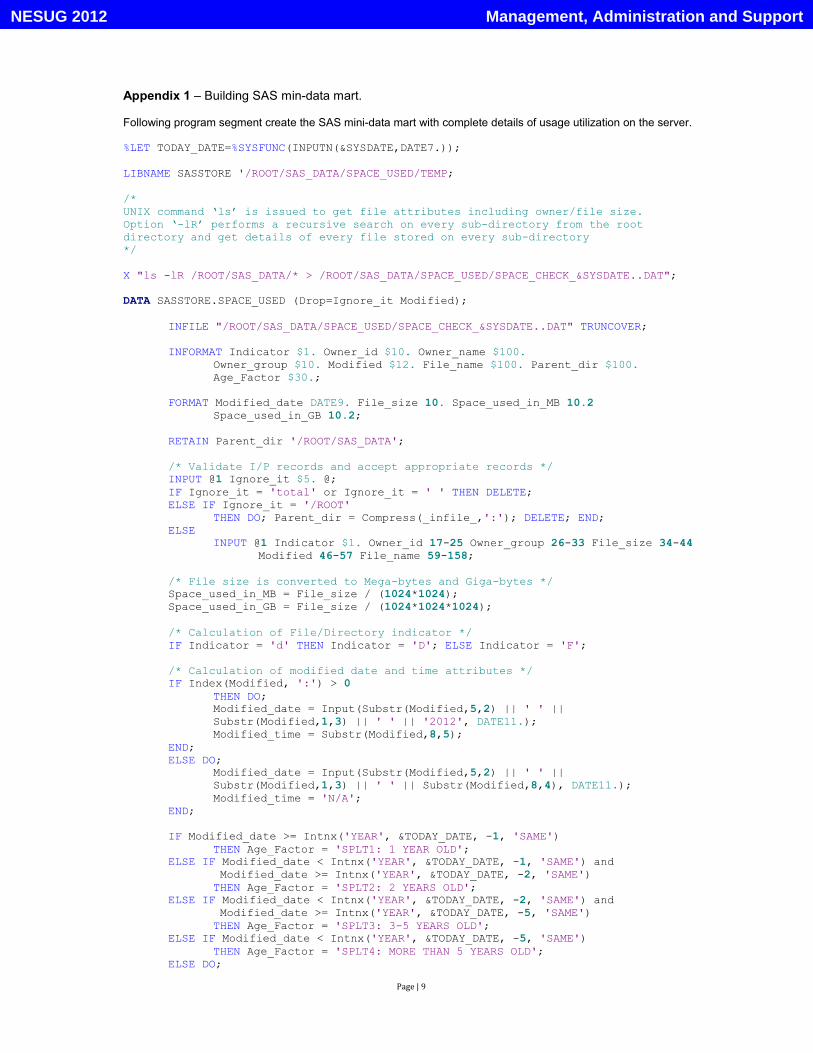
Appendix 1 – Building SAS min-data mart.
Following program segment create the SAS mini-data mart with complete details of usage utilization on the server.
%LET TODAY_DATE=%SYSFUNC(INPUTN(&SYSDATE,DATE7.));
LIBNAME SASSTORE '/ROOT/SAS_DATA/SPACE_USED/TEMP;
/*UNIX command ‘ls’ is issued to get file attributes including owner/file size.Option ‘-lR’ performs a recursive search on every sub-directory from the rootdirectory and get details of every file stored on every sub-directory*/
X "ls -lR /ROOT/SAS_DATA/* > /ROOT/SAS_DATA/SPACE_USED/SPACE_CHECK_&SYSDATE..DAT";
DATA SASSTORE.SPACE_USED (Drop=Ignore_it Modified);
INFILE "/ROOT/SAS_DATA/SPACE_USED/SPACE_CHECK_&SYSDATE..DAT" TRUNCOVER;
INFORMAT Indicator $1. Owner_id $10. Owner_name $100.Owner_group $10. Modified $12. File_name $100. Parent_dir $100.Age_Factor $30.;
FORMAT Modified_date DATE9. File_size 10. Space_used_in_MB 10.2
Space_used_in_GB 10.2;
RETAIN Parent_dir '/ROOT/SAS_DATA';
/* Validate I/P records and accept appropriate records */INPUT @1 Ignore_it $5. @;IF Ignore_it = 'total' or Ignore_it = ' ' THEN DELETE;ELSE IF Ignore_it = '/ROOT'
THEN DO; Parent_dir = Compress(_infile_,':'); DELETE; END;ELSE
INPUT @1 Indicator $1. Owner_id 17-25 Owner_group 26-33 File_size 34-44Modified 46-57 File_name 59-158;
/* File size is converted to Mega-bytes and Giga-bytes */Space_used_in_MB = File_size / (1024*1024);Space_used_in_GB = File_size / (1024*1024*1024);
/* Calculation of File/Directory indicator */IF Indicator = 'd' THEN Indicator = 'D'; ELSE Indicator = 'F';
/* Calculation of modified date and time attributes */IF Index(Modified, ':') > 0
THEN DO;Modified_date = Input(Substr(Modified,5,2) || ' ' ||Substr(Modified,1,3) || ' ' || '2012', DATE11.);Modified_time = Substr(Modified,8,5);
END;ELSE DO;
Modified_date = Input(Substr(Modified,5,2) || ' ' ||Substr(Modified,1,3) || ' ' || Substr(Modified,8,4), DATE11.);Modified_time = 'N/A';
END;
IF Modified_date >= Intnx('YEAR', &TODAY_DATE, -1, 'SAME')THEN Age_Factor = 'SPLT1: 1 YEAR OLD';
ELSE IF Modified_date < Intnx('YEAR', &TODAY_DATE, -1, 'SAME') and Modified_date >= Intnx('YEAR', &TODAY_DATE, -2, 'SAME')THEN Age_Factor = 'SPLT2: 2 YEARS OLD';
ELSE IF Modified_date < Intnx('YEAR', &TODAY_DATE, -2, 'SAME') andModified_date >= Intnx('YEAR', &TODAY_DATE, -5, 'SAME')THEN Age_Factor = 'SPLT3: 3-5 YEARS OLD';
ELSE IF Modified_date < Intnx('YEAR', &TODAY_DATE, -5, 'SAME')THEN Age_Factor = 'SPLT4: MORE THAN 5 YEARS OLD';
ELSE DO;
Management, Administration and SupportNESUG 2012
Page | 10
PUT 'EXCEPTION HANDLER: 1';PUT Modified_date= DATE9.; ABORT ABEND;
END;
Owner_id = Lowcase(Owner_id);
/* Owner Id is mapped with a look-up data set to obtain Owner name and Mail address */SET SASSTORE.OWNER_NAMES Key=Owner_id/unique;IF _iorc_ not = 0
THEN DO; Owner_name = Owner_id; Mail_addr = 'N/A'; _iorc_=0; _error_=0;END;
RUN;
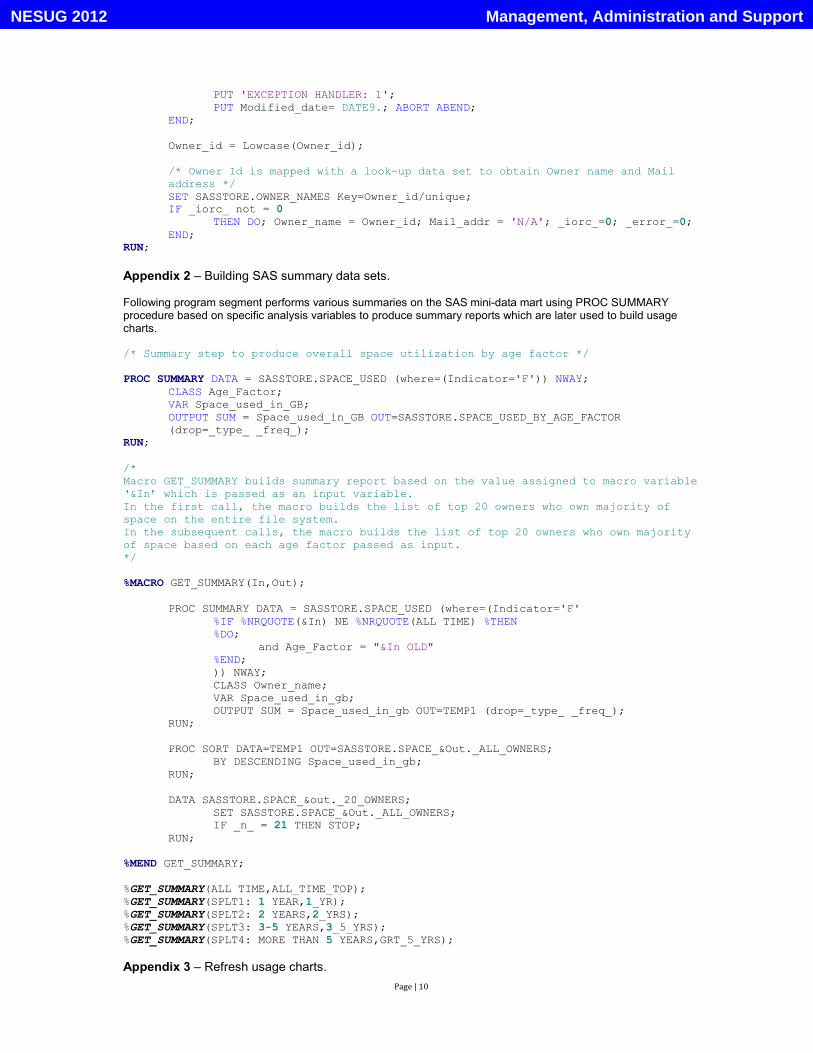
Appendix 2 – Building SAS summary data sets.
Following program segment performs various summaries on the SAS mini-data mart using PROC SUMMARY procedure based on specific analysis variables to produce summary reports which are later used to build usage charts.
/* Summary step to produce overall space utilization by age factor */
PROC SUMMARY DATA = SASSTORE.SPACE_USED (where=(Indicator='F')) NWAY;CLASS Age_Factor;VAR Space_used_in_GB;OUTPUT SUM = Space_used_in_GB OUT=SASSTORE.SPACE_USED_BY_AGE_FACTOR(drop=_type_ _freq_);
RUN;
/*Macro GET_SUMMARY builds summary report based on the value assigned to macro variable ‘&In’ which is passed as an input variable. In the first call, the macro builds the list of top 20 owners who own majority of space on the entire file system.In the subsequent calls, the macro builds the list of top 20 owners who own majority of space based on each age factor passed as input.*/
%MACRO GET_SUMMARY(In,Out);
PROC SUMMARY DATA = SASSTORE.SPACE_USED (where=(Indicator='F'%IF %NRQUOTE(&In) NE %NRQUOTE(ALL TIME) %THEN%DO;
and Age_Factor = "&In OLD"%END;)) NWAY;CLASS Owner_name;VAR Space_used_in_gb;OUTPUT SUM = Space_used_in_gb OUT=TEMP1 (drop=_type_ _freq_);
RUN;
PROC SORT DATA=TEMP1 OUT=SASSTORE.SPACE_&Out._ALL_OWNERS;BY DESCENDING Space_used_in_gb;
RUN;
DATA SASSTORE.SPACE_&out._20_OWNERS;SET SASSTORE.SPACE_&Out._ALL_OWNERS;IF _n_ = 21 THEN STOP;
RUN;
%MEND GET_SUMMARY;
%GET_SUMMARY(ALL TIME,ALL_TIME_TOP);%GET_SUMMARY(SPLT1: 1 YEAR,1_YR);%GET_SUMMARY(SPLT2: 2 YEARS,2_YRS);%GET_SUMMARY(SPLT3: 3-5 YEARS,3_5_YRS);%GET_SUMMARY(SPLT4: MORE THAN 5 YEARS,GRT_5_YRS);
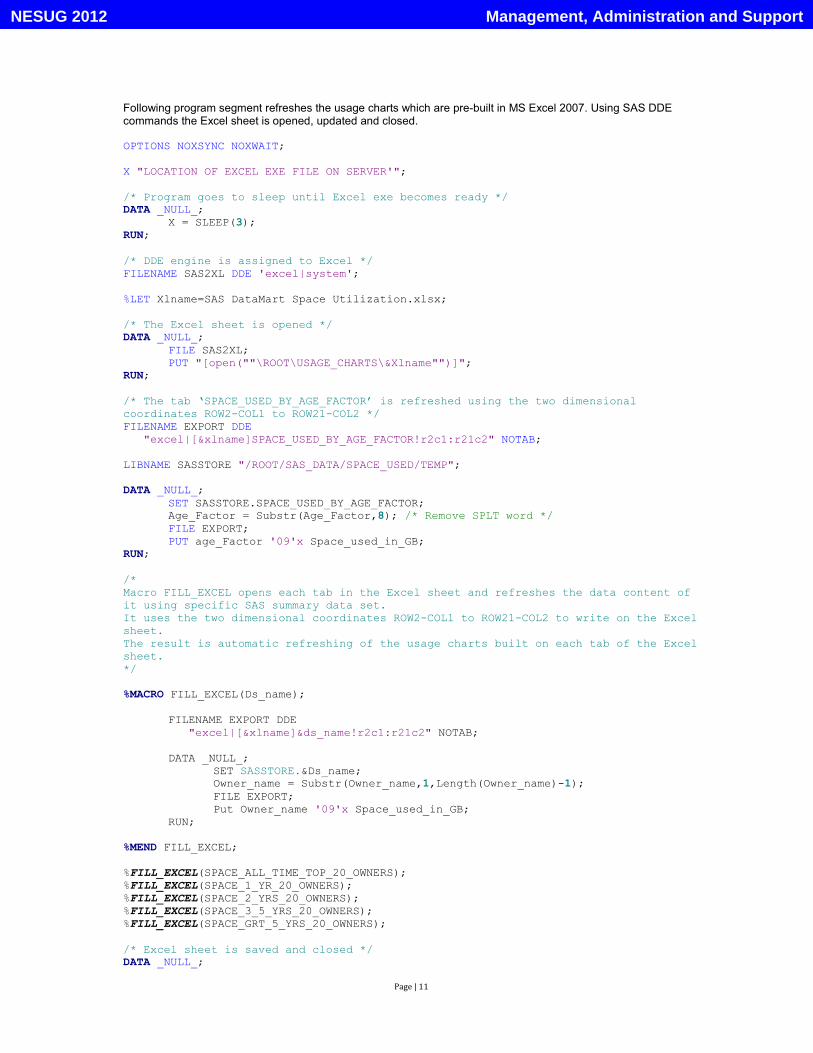
Appendix 3 – Refresh usage charts.
Management, Administration and SupportNESUG 2012
Page | 11
Following program segment refreshes the usage charts which are pre-built in MS Excel 2007. Using SAS DDE commands the Excel sheet is opened, updated and closed.
OPTIONS NOXSYNC NOXWAIT;
X "LOCATION OF EXCEL EXE FILE ON SERVER'";
/* Program goes to sleep until Excel exe becomes ready */DATA _NULL_;
X = SLEEP(3);RUN;
/* DDE engine is assigned to Excel */FILENAME SAS2XL DDE 'excel|system';
%LET Xlname=SAS DataMart Space Utilization.xlsx;
/* The Excel sheet is opened */DATA _NULL_;
FILE SAS2XL;PUT "[open(""\ROOT\USAGE_CHARTS\&Xlname"")]";
RUN;
/* The tab ‘SPACE_USED_BY_AGE_FACTOR’ is refreshed using the two dimensional coordinates ROW2-COL1 to ROW21-COL2 */FILENAME EXPORT DDE
"excel|[&xlname]SPACE_USED_BY_AGE_FACTOR!r2c1:r21c2" NOTAB;
LIBNAME SASSTORE "/ROOT/SAS_DATA/SPACE_USED/TEMP";
DATA _NULL_;SET SASSTORE.SPACE_USED_BY_AGE_FACTOR;Age_Factor = Substr(Age_Factor,8); /* Remove SPLT word */FILE EXPORT;PUT age_Factor '09'x Space_used_in_GB;
RUN;
/*Macro FILL_EXCEL opens each tab in the Excel sheet and refreshes the data content ofit using specific SAS summary data set.It uses the two dimensional coordinates ROW2-COL1 to ROW21-COL2 to write on the Excel sheet.The result is automatic refreshing of the usage charts built on each tab of the Excel sheet.*/
%MACRO FILL_EXCEL(Ds_name);
FILENAME EXPORT DDE"excel|[&xlname]&ds_name!r2c1:r21c2" NOTAB;
DATA _NULL_;SET SASSTORE.&Ds_name;Owner_name = Substr(Owner_name,1,Length(Owner_name)-1);FILE EXPORT;Put Owner_name '09'x Space_used_in_GB;
RUN;
%MEND FILL_EXCEL;
%FILL_EXCEL(SPACE_ALL_TIME_TOP_20_OWNERS);%FILL_EXCEL(SPACE_1_YR_20_OWNERS);%FILL_EXCEL(SPACE_2_YRS_20_OWNERS);%FILL_EXCEL(SPACE_3_5_YRS_20_OWNERS);%FILL_EXCEL(SPACE_GRT_5_YRS_20_OWNERS);
/* Excel sheet is saved and closed */DATA _NULL_;
Management, Administration and SupportNESUG 2012

Page | 12
FILE SAS2XL ;PUT "[Save]";PUT "[Close]";
RUN;
Management, Administration and SupportNESUG 2012