Embed Size (px)
Citation preview
Scandinavian Airlines System, Investor Relations
Tel. +46 (0) 8 797 1451 Fax: +46 (0) 8 85 58 76
e-mail: [email protected] --- Homepage: www.scandinavian.net -- Results Jan - Jun 2000
2000-08-15
SAS IR/STU
2000-08-15
SAS IR/STU
Copenhagen, August 14, 2000
SAS Group
2nd Quarter 2000
Analyst meeting
www.scandinavian.net
2000-08-15
SAS IR/STU
Contents of 2nd Quarter 2000
presentation
�The Quarter in brief
�SAS International Hotels
�Business review
�Result improvement program
�Aircraft fleet
�Outlook
�Appendices

Scandinavian Airlines System, Investor Relations
Tel. +46 (0) 8 797 1451 Fax: +46 (0) 8 85 58 76
e-mail: [email protected] --- Homepage: www.scandinavian.net -- Results Jan - Jun 2000
2000-08-15
SAS IR/STU
The Quarter in briefThe Quarter in brief
2000-08-15
SAS IR/STU
A very encouraging 2nd Quarter
�Breaking trend in Business Class
�Passenger load factors sharply up
�Strong underlying cost development - unit
costs down exempt Jet Fuel
�SAS International Hotels develops well
�Promising trading conditions
SAS Group
2000-08-15
SAS IR/STU
Strong traffic growth and Business
Class recovery 2nd Quarter
�Improved traffic
growth (RPK) up 8%
�Business Class (RPK-C) up 5%
�Sharply improved cabin factor up 4.9 p.u.
�Yields up 0,4%
�EBITDAR up 20%
SAS Group

Scandinavian Airlines System, Investor Relations
Tel. +46 (0) 8 797 1451 Fax: +46 (0) 8 85 58 76
e-mail: [email protected] --- Homepage: www.scandinavian.net -- Results Jan - Jun 2000
2000-08-15
SAS IR/STU
Cash flow from operations
(EBITDAR) up 17% 1st Half 2000
MSEK 2000MSEK 2000MSEK 2000MSEK 2000 1999199919991999 ChangeChangeChangeChange
� Revenue 22 104 20 965 +5%
� EBITDAR 2 075 1 769 +17%
� Pre tax profit
ex gains 443 53
� Pre-tax profit 732 496 +48%
SAS Group
2000-08-15
SAS IR/STU
Financial results - 2nd Quarter 2000
MSEK MSEK MSEK MSEK 2000 2000 2000 2000 1999199919991999 ChangeChangeChangeChange
Revenue 11 799 11 260 +5%
Op. inc. bef. depr. 1 184 924 +28%
Gain on sales 276 46
Pre-tax profit 1 029 507 +103%
SAS Group
2000-08-15
SAS IR/STU
Operating results with market
depreciation- 1st Half 2000MSEK 2000MSEK 2000MSEK 2000MSEK 2000 1999199919991999 ChangeChangeChangeChange
� EBITDAR 2 075 1 769 +17%
� Gain on sales +289 +433
� Depreciation -895 -964
� ∆ ∆ ∆ ∆ MV aircraft +732 +679
� Leasing (40%) -293 -268
� EBIT, market 1908 1649 +16%
SAS Group

Scandinavian Airlines System, Investor Relations
Tel. +46 (0) 8 797 1451 Fax: +46 (0) 8 85 58 76
e-mail: [email protected] --- Homepage: www.scandinavian.net -- Results Jan - Jun 2000
2000-08-15
SAS IR/STU
CFROI - approaching set hurdle rate
�SAS Group's key
financial metric
�Focus on operating
cash flow (EBITDAR)
�CFROI H1/2000
15%
�Hurdle rate through
cycle >17-20%
0%
5%
10%
15%
20%
25%
30%
35%
0006
9909
9903
9809
9803
9709
9703
9609
9603
CFROI Hurdle rate CFROI
SAS Group
2000-08-15
SAS IR/STU
ROCE - passed through
the bottom of the cycle
�SAS market
based ROCE
H1/2000 10%
�Hurdle rate through
cycle >12%0%
5%
10%
15%
20%
25%
30%
0006
9912
9906
9812
9806
9712
9706
9612
9606
9512
ROCE, Market based Hurdle rate ROCE
SAS Group
2000-08-15
SAS IR/STU
SAS International HotelsSAS International Hotels

Scandinavian Airlines System, Investor Relations
Tel. +46 (0) 8 797 1451 Fax: +46 (0) 8 85 58 76
e-mail: [email protected] --- Homepage: www.scandinavian.net -- Results Jan - Jun 2000
2000-08-15
SAS IR/STU
Continued strong developmentIncome before taxes (MSEK)
-200
-100
0
100
200
300
400
500
600
1993 1994 1995 1996 1997 1998 1999
0
100
200
300
400
500
H1/1999 H1/2000
PBT Gains
2000-08-15
SAS IR/STU
Radisson SAS Hotels & Resorts - one
additional hotel sold 1st Half
0
20
40
60
80
100
120
140
1992 1993 1994 1995 1996 1997 1998 1999
No. of hotels
Owned Leased Managed Franchised
�7 new hotels added
�132 hotels in total
�Increased demand in most
markets except Norway
�Radisson SAS Scandinavia
Hotel Oslo sold
�All new hotels developed
well
�7 new hotels added
�132 hotels in total
�Increased demand in most
markets except Norway
�Radisson SAS Scandinavia
Hotel Oslo sold
�All new hotels developed
well
SIH
2000-08-15
SAS IR/STU
Radisson SAS Hotels & Resorts -
continuous positive value creation
�GOP up from 29,9 to
30,9%
�ROCE up from
11,6% to 15,4%
�Strategy of reducing
capital employed
successful
�GOP up from 29,9 to
30,9%
�ROCE up from
11,6% to 15,4%
�Strategy of reducing
capital employed
successful
ROCE
SAS International Hotels
4%
7%
10%
13%
16%
1994 1995 1996 1997 1998 1999 H1/00
SIH

Scandinavian Airlines System, Investor Relations
Tel. +46 (0) 8 797 1451 Fax: +46 (0) 8 85 58 76
e-mail: [email protected] --- Homepage: www.scandinavian.net -- Results Jan - Jun 2000
2000-08-15
SAS IR/STU
Business review
SAS Airline
Business review
SAS Airline
2000-08-15
SAS IR/STU
Business highlights - 1st Half
�Increased traffic growth - Business Class
recovery
�Modest capacity increase
�Improved passenger load factors
�Strengthened home market position
�Strengthened position in Business Class
segment
�Result improvement program as planned
SAS
2000-08-15
SAS IR/STU
Other highlights in 2nd Quarter
�Air Botnia out of the "red"
�Successful turn-a-round in Norwegian
regional carrier Widerøe
�British Midland develops Joint Venture with
SAS and Lufthansa
�Spanair - strengthened position on Madrid
SAS

Scandinavian Airlines System, Investor Relations
Tel. +46 (0) 8 797 1451 Fax: +46 (0) 8 85 58 76
e-mail: [email protected] --- Homepage: www.scandinavian.net -- Results Jan - Jun 2000
2000-08-15
SAS IR/STU
RPK Business Class
1998-2000
Year on Year values
Passenger load factor
total system 1995-2000
Increased passenger load factors and
growth trend in Business Class
Moving 12 months values
62%
63%
64%
65%
66%
67%
DEC94MAR JUN SEP DEC95MAR JUN SEP DEC96MAR JUN SEP DEC97MAR JUN SEP DEC98MAR JUN SEP DEC99MAR JUN-15%
-10%
-5%
0%
5%
10%
15%
20%
25%
JAN98 JUL JAN99 JUL JAN00 JUL
SAS
2000-08-15
SAS IR/STU
Passenger load factors
North Atlantic/ Asia
Intercontinental routes return to
90% passenger load factors1999- July 2000
� Growth in Business Class
on North Atlantic
� Traffic to/ from Chicago
strong - important hub
� Passenger load factors
back to "normal" peak
levels
� Traffic "spill off"
� New capacity essential on
long haul
60
70
80
90
100
JAN
MAR
MAY
JUL
SEP
NOV
JAN
MAR
MAY
JUL
Month
Passenger
load factor
North Atlantic Asia
SAS
2000-08-15
SAS IR/STU
European routes - a breaking trend1999- July 2000
� Strong traffic growth
� Recovery in Business
Class
� Increased market shares
overall and in Business
Class
� Modest capacity increase
"boost" passenger load
factors
Business Class/
Economy Class
80
90
100
110
120
130
JAN
MAR
MAY JU
LSEP
NOV
JAN
MAR
MAY JU
L
Month
Gro
wth
vs L
Y Index
Economy Class Business Class
SAS

Scandinavian Airlines System, Investor Relations
Tel. +46 (0) 8 797 1451 Fax: +46 (0) 8 85 58 76
e-mail: [email protected] --- Homepage: www.scandinavian.net -- Results Jan - Jun 2000
2000-08-15
SAS IR/STU
Danish routes affected by aircraft
introductory problems1999 - July 2000
�Continued capacity
reductions
�Passenger load factor
significantly improved
�Introductory problems
deHavilland Q400
�Continued capacity
reductions
�Passenger load factor
significantly improved
�Introductory problems
deHavilland Q400
Passenger load factor
50
60
70
80
JAN
MAR
MAY
JUL
SEP
NOV
JAN
MAR
MAY
JUL
Month
Passe
nger
load factor
Dansih domestic
SAS
2000-08-15
SAS IR/STU
Reduced over-capacity on
Norwegian domestic routes1999 - July 2000
�Total market
marginally down
�Continued capacity
adjustments
�Passenger load factor
still too low
�Seating reservation
implemented
�SAS gain market shares
�Total market
marginally down
�Continued capacity
adjustments
�Passenger load factor
still too low
�Seating reservation
implemented
�SAS gain market shares
Passenger load factor
40
50
60
70
JAN
MAR
MAY
JUL
SEP
NOV
JAN
MAR
MAY
JUL
Month
Passenger
load factor
Norwegian domestic
SAS
2000-08-15
SAS IR/STU
Swedish domestic routes strong1999- July 2000
� Strong Swedish economy
� Continued strong growth
� Arlanda-Gothenburg and
Arlanda-Malmö gain shares
from secondary airport
Bromma
� Arlanda Express Train
stimulates traffic
� Boeing 737-800 introduced
08MAY
95
105
115
125
135
JAN
MAR
MAY
JUL
SEP
NOV
JAN
MAR
MAY
JUL
Month
Growth vs LY Index
Economy Class Business Class
Business Class/
Economy Class
SAS

Scandinavian Airlines System, Investor Relations
Tel. +46 (0) 8 797 1451 Fax: +46 (0) 8 85 58 76
e-mail: [email protected] --- Homepage: www.scandinavian.net -- Results Jan - Jun 2000
2000-08-15
SAS IR/STU
SAS affiliates continue to add traffic
growth
Q2/2000 vs Q2/1999:
�SAS RPK up 8%
�Total RPK growth SAS
& Partners 12%
Q2/2000 vs Q2/1999:
�SAS RPK up 8%
�Total RPK growth SAS
& Partners 12%
0,0
1,0
2,0
3,0
4,0
5,0
6,0
7,0
8,0
9,0
6m 2000
RPK Growth
RPK Growth
RPK Growth
RPK Growth
SAS
Total SAS & Partners (excl STAR)
2000 vs 1999:
SAS
2000-08-15
SAS IR/STU
Yields marginally up in 2nd QuarterTotal system - currency adjusted
�Overall yields up 0,4%
in Q2
�Overall yields down
0,1% in H1
�Growth in Business
Class but still negative
mix
�Continued yield
pressure in Economy
Class
�Overall yields up 0,4%
in Q2
�Overall yields down
0,1% in H1
�Growth in Business
Class but still negative
mix
�Continued yield
pressure in Economy
Class-3%
-2%
-1%
0%
H1/99 H1/00
SAS
2000-08-15
SAS IR/STU
SAS has not contributed to the recent
over-capacity throughout 1999/2000ASK SAS vs
AEA Geographical Europe
-6%
-4%
-2%
0%
2%
4%
6%
8%
10%
12%
14%
JUL AUG SEP OCT NOV DEC JAN FEB MAR APR MAY JUN
MonthMonthMonthMonth
Change m
onth
vs last year
Change m
onth
vs last year
Change m
onth
vs last year
Change m
onth
vs last year
AEA
SAS
SAS

Scandinavian Airlines System, Investor Relations
Tel. +46 (0) 8 797 1451 Fax: +46 (0) 8 85 58 76
e-mail: [email protected] --- Homepage: www.scandinavian.net -- Results Jan - Jun 2000
2000-08-15
SAS IR/STU
Creation of a Cargo
subsidiary under evaluation
� New Global Cargo has been initiated
� Creation of a new SAS Cargo subsidiary in
progress
� Revenue tonnes up 6%
� Revenues up 8%
1st Half 2000
SAS
2000-08-15
SAS IR/STU
Favorable cost development
except jet fuelIndex Last Year
�Increase of 1,2% in
1st Half
�Down 2,6% adjusted
for fuel costs
�Positively affected by
– Result Improvement
program
�Increase of 1,2% in
1st Half
�Down 2,6% adjusted
for fuel costs
�Positively affected by
– Result Improvement
program
-3%
-2%
-1%
0%
1%
2%
3%
H1/99 H1/00
SAS
2000-08-15
SAS IR/STU
Volume = average growth in ASK and RPK = 4,1%
Adjusted Share of
H1/99 H1/00 Var. % total var %
Commissions 1 089 1 049 3.7% 0.3%
Fuel 1 130 1 699 (50.4%) (3.8%)
Government charges 1 751 1 690 3.5% 0.4%
Personnel 6 546 6 493 0.8% 0.4%
Other oper. net costs 4 628 4 392 5.1% 1.6%
TOTAL 15 144 15 323 (1.2%) (1.2%)
SASSlightly increased unit costJanuary - June 2000 vs 1999

Scandinavian Airlines System, Investor Relations
Tel. +46 (0) 8 797 1451 Fax: +46 (0) 8 85 58 76
e-mail: [email protected] --- Homepage: www.scandinavian.net -- Results Jan - Jun 2000
2000-08-15
SAS IR/STU
Estimated jet fuel expense
for 2000 raised to MSEK 3 500
�Spot Jet Fuel up 20 %
since prognosis given
in May 2000
�Crude oil /Jet Fuel
differential has not
decreased as
anticipated
�Further strengthening
of USD vs SEK
�Spot Jet Fuel up 20 %
since prognosis given
in May 2000
�Crude oil /Jet Fuel
differential has not
decreased as
anticipated
�Further strengthening
of USD vs SEK
Brent Crude vs. Jet Fuel
August 1997 - August 2000
10
15
20
25
30
35
40
97-0
8
97-1
0
97-1
2
98-0
2
98-0
4
98-0
6
98-0
8
98-1
0
98-1
2
99-0
2
99-0
4
99-0
6
99-0
8
99-1
0
99-1
2
00-0
2
00-0
4
00-0
6
00-0
8
US D
olla
r per Barrel
Brent 1st Nearby Close Jet CIF Cargoes NWE
SAS
2000-08-15
SAS IR/STU
Result Improvement Program
2000-08-15
SAS IR/STU
�MSEK 1550 achieved as of 2nd quarter 2000
�Target by early 2001: 3 000 MSEK
Result Improvement Program 1999/00
Area Targeted effect vs. 1998
Cargo 100 MSEK
Catering & In-flight service 300 MSEK
IT & communications 250 MSEK
Distribution & Electronic channels 815 MSEK
Air crew 610 MSEK
Ground handling 300 MSEK
Technical maintenance 310 MSEK
Overhead & other 360 MSEK
Total 3045 MSEK
SAS
Scandinavian Airlines System, Investor Relations
Tel. +46 (0) 8 797 1451 Fax: +46 (0) 8 85 58 76
e-mail: [email protected] --- Homepage: www.scandinavian.net -- Results Jan - Jun 2000
2000-08-15
SAS IR/STU
Approaching
2 million EuroBonus
members
�Steady growthSteady growthSteady growthSteady growth
�Number of members during 2nd quarterNumber of members during 2nd quarterNumber of members during 2nd quarterNumber of members during 2nd quarter
increased by 3,9% to 1 959 000increased by 3,9% to 1 959 000increased by 3,9% to 1 959 000increased by 3,9% to 1 959 000
SAS
2000-08-15
SAS IR/STU
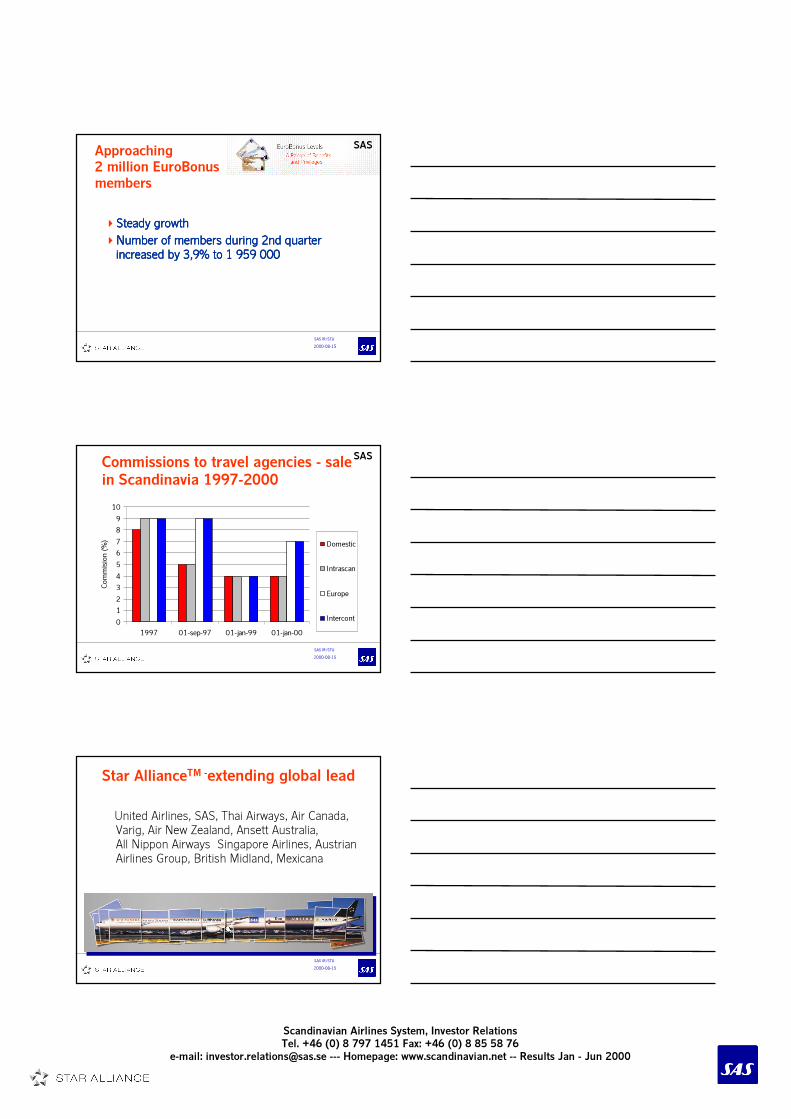
Commissions to travel agencies - sale
in Scandinavia 1997-2000
0
1
2
3
4
5
6
7
8
9
10
1997 01-sep-97 01-jan-99 01-jan-00
Commision (%)
Domestic
Intrascan
Europe
Intercont
SAS
2000-08-15
SAS IR/STU
Star AllianceTM -extending global lead
United Airlines, SAS, Thai Airways, Air Canada,
Varig, Air New Zealand, Ansett Australia,
All Nippon Airways Singapore Airlines, Austrian
Airlines Group, British Midland, Mexicana

Scandinavian Airlines System, Investor Relations
Tel. +46 (0) 8 797 1451 Fax: +46 (0) 8 85 58 76
e-mail: [email protected] --- Homepage: www.scandinavian.net -- Results Jan - Jun 2000
2000-08-15
SAS IR/STU
A firmer organization of Star Alliance
implemented
Chief Executive Board
Alliance Management BoardChairman: Friedel Rödig (LH) Deputy Chairman: Bruce Harris (UA)
Global
NetworkAutomation
Seamless
Service &
Product
Development
Market
Presence
Ross MacCormack (AC)
Tim Moore (UA)
Dieter Grotepass(LH)
Per Stendebakken(SK)
• Network
Connectivity
• Revenue
Management
• Regulatory
Issues
• Marketing
Communication
• Sales Strategy
• Frequent Flyer
Programs
• Third Market
Strategies
• Customer
Relations
• Ground
Services
• Product
Development
• IT Integration
• Automation
Development
Strategic
Development
Areas
Fields of
Responsibility
Supervisory
Function
Management
Function Support
2000-08-15
SAS IR/STU
Electronic Channels -
current volumes of total sales
1st Half 2000
�Travel Pass
�TPC (new in 1999)
�E-TIX
� Other Internet
�Total volume E-channels MSEK 1 500
�10% of total passenger sales
�Travel Pass
�TPC (new in 1999)
�E-TIX
� Other Internet
�Total volume E-channels MSEK 1 500
�10% of total passenger sales
SAS
2000-08-15
SAS IR/STU
Aircraft fleetAircraft fleet

Scandinavian Airlines System, Investor Relations
Tel. +46 (0) 8 797 1451 Fax: +46 (0) 8 85 58 76
e-mail: [email protected] --- Homepage: www.scandinavian.net -- Results Jan - Jun 2000
2000-08-15
SAS IR/STU
Major changes in SAS' production
capacity - very modern fleet
SeatsSeatsSeatsSeats No. aircraftNo. aircraftNo. aircraftNo. aircraft Aircraft typeAircraft typeAircraft typeAircraft type
190 -275190 -275190 -275190 -275 14 14 14 14 Boeing 767/ Boeing 767/ Boeing 767/ Boeing 767/ Airbus A 330/340Airbus A 330/340Airbus A 330/340Airbus A 330/340
180 180 180 180 (12) (12) (12) (12) Airbus A 321Airbus A 321Airbus A 321Airbus A 321
75 -160 75 -160 75 -160 75 -160 100 100 100 100 DC9/MD 80-90DC9/MD 80-90DC9/MD 80-90DC9/MD 80-90
90 -140 90 -140 90 -140 90 -140 40 40 40 40 Boeing 737 seriesBoeing 737 seriesBoeing 737 seriesBoeing 737 series
50 - 75 50 - 75 50 - 75 50 - 75 29 29 29 29 F 50/ SAAB 2000/ F 50/ SAAB 2000/ F 50/ SAAB 2000/ F 50/ SAAB 2000/
Q400Q400Q400Q400
Aircraft beingAircraft beingAircraft beingAircraft being phased in phased in phased in phased in
SAS
2000-08-15
SAS IR/STU
CAPEX 2.6 Billion USD
� Aircraft CAPEX1) as of June 2000
MUSD 2000 2001 2002 2003-
520 740 650 680
� 10 Airbus A340/330-300
� 12 Airbus A321
� 16 Boeing 737
� 16 deHavilland Q400
� Other investments in SAS 800-900 MSEK annually1) Not reduced by prepayments to manufacturers
� Aircraft CAPEX1) as of June 2000
MUSD 2000 2001 2002 2003-
520 740 650 680
� 10 Airbus A340/330-300
� 12 Airbus A321
� 16 Boeing 737
� 16 deHavilland Q400
� Other investments in SAS 800-900 MSEK annually1) Not reduced by prepayments to manufacturers
SAS
2000-08-15
SAS IR/STU
Outlook 2000

Scandinavian Airlines System, Investor Relations
Tel. +46 (0) 8 797 1451 Fax: +46 (0) 8 85 58 76
e-mail: [email protected] --- Homepage: www.scandinavian.net -- Results Jan - Jun 2000
2000-08-15
SAS IR/STU
US:US:US:US:
• GDP +3% (down.)
Continued favorable macroeconomic
outlook SAS' main markets
EurolandEurolandEurolandEuroland::::
• Strong growth
Germany & Italy
catching up
Asia Asia Asia Asia exclexclexclexcl. Japan:. Japan:. Japan:. Japan:
• Continued
recovery in most
regions
Japan:Japan:Japan:Japan:
• Slightly better
but from low
level
Norway:Norway:Norway:Norway:
• GDP 2.5-3%
• Int. rates uncertain
Sweden:Sweden:Sweden:Sweden:
• Export, consumption
and GDP
stronger
Denmark:Denmark:Denmark:Denmark:
• Better growth
UK:UK:UK:UK:
• GDP +3%
2000-08-15
SAS IR/STU
July traffic figures- strong
�Strong growth and sharply increased load factors
�Business Class +13,5% - Economy Class +8,0%
Passenger-Passenger-Passenger-Passenger- Seat capacitySeat capacitySeat capacitySeat capacity Cabin-Cabin-Cabin-Cabin-
traffic (RPK)traffic (RPK)traffic (RPK)traffic (RPK) (ASK) (ASK) (ASK) (ASK) factorfactorfactorfactor
SAS TotalSAS TotalSAS TotalSAS Total +8,8%+8,8%+8,8%+8,8% +1,0%+1,0%+1,0%+1,0% +5,5 p.u.+5,5 p.u.+5,5 p.u.+5,5 p.u.
IntercontinentalIntercontinentalIntercontinentalIntercontinental +10,2%+10,2%+10,2%+10,2% +1,9%+1,9%+1,9%+1,9%
EuropeEuropeEuropeEurope +9,5%+9,5%+9,5%+9,5% +1,7%+1,7%+1,7%+1,7%
Domestic andDomestic andDomestic andDomestic and +5,9%+5,9%+5,9%+5,9% -1,1%-1,1%-1,1%-1,1%
IntrascandinavianIntrascandinavianIntrascandinavianIntrascandinavian
2000-08-15
SAS IR/STU
Operating key figures - year 2000
2000
ASK
Frequencies
Up approx 3%
Up 1%
RPK Up approx. 8%
Passenger yield (currency adjusted) +/- 0
Unit costs Marginally up
�Increased traffic growth scenario
�Reduced yield pressure
�Underlying unit costs down
Key figure

Scandinavian Airlines System, Investor Relations
Tel. +46 (0) 8 797 1451 Fax: +46 (0) 8 85 58 76
e-mail: [email protected] --- Homepage: www.scandinavian.net -- Results Jan - Jun 2000
2000-08-15
SAS IR/STU
The Board of Directors
Assessment for full year 2000:
� Full year forecast from February 17
maintained
� Reduced unit cost except jet fuel
� Jet fuel expense estimated at MSEK 3500
for 2000 as a whole
� Income before taxes ex gains - around
MSEK 1000
2000-08-15
SAS IR/STU
2000-08-15
SAS IR/STU
APPENDICESAPPENDICES

Scandinavian Airlines System, Investor Relations
Tel. +46 (0) 8 797 1451 Fax: +46 (0) 8 85 58 76
e-mail: [email protected] --- Homepage: www.scandinavian.net -- Results Jan - Jun 2000
2000-08-15
SAS IR/STU
Long haul business case
2000-08-15
SAS IR/STU
�6 A 340-300's and 4 A 330-
300's
�Cost / ASK down 12-15% vs.
B 767 (ex. cargo contr,)
�Seat capacity up 45% on long
haul routes
�Cargo capacity up 40-45%
� Investment approx 10 BSEK
�6 A 340-300's and 4 A 330-
300's
�Cost / ASK down 12-15% vs.
B 767 (ex. cargo contr,)
�Seat capacity up 45% on long
haul routes
�Cargo capacity up 40-45%
� Investment approx 10 BSEK
First delivery 2ndFirst delivery 2ndFirst delivery 2ndFirst delivery 2nd
Quarter 2001Quarter 2001Quarter 2001Quarter 2001
Decision to expand long haul
businessOrder of 10 Airbus A 340/330
2000-08-15
SAS IR/STU
Low market share on intercontinental
traffic - large natural catchment area
ScandinaviaScandinaviaScandinaviaScandinavia
18 mill. people18 mill. people18 mill. people18 mill. peopleSAS market shareSAS market shareSAS market shareSAS market share
Scandinavia- Asia/Scandinavia- Asia/Scandinavia- Asia/Scandinavia- Asia/
North America is 25%North America is 25%North America is 25%North America is 25%
Natural Natural Natural Natural catchmentcatchmentcatchmentcatchment area area area area
80 mill. people -80 mill. people -80 mill. people -80 mill. people -
higher on routes to Asiahigher on routes to Asiahigher on routes to Asiahigher on routes to Asia
Home marketHome marketHome marketHome market
80-100 mill. people80-100 mill. people80-100 mill. people80-100 mill. people

Scandinavian Airlines System, Investor Relations
Tel. +46 (0) 8 797 1451 Fax: +46 (0) 8 85 58 76
e-mail: [email protected] --- Homepage: www.scandinavian.net -- Results Jan - Jun 2000
2000-08-15
SAS IR/STU
Fastest connectivity between Oslo and
most European cities
Based on the twenty largest traffic flows between
Oslo and Europe (APM)
SK
KL
SAS
London
Paris
Helsinki
Brussels
Frankfurt
Zurich
Nice
Munich
Manchester
Hamburg
Dusseldorf
Prag
Malaga
Rome
Barcelona
Milan
Reykjavik
Alicante
Vienna
KLMAmsterdam
2000-08-15
SAS IR/STU
Fastest connectivity between Oslo and
USA support long haul business case
Based on the ten largest traffic flows between
Oslo and USA (APM)
SK
KL
SAS
New York
Minneapolis
San Francisco
Miami
Chicago
Orlando
Boston
Seattle
KLMLos Angeles
Houston
* Oslo = Gardermoen & Torp
2000-08-15
SAS IR/STU
Punctual and efficient hub supports
long haul decision
�Copenhagen 18,3%
�Stockholm 18,5%
�Helsinki 18,9%
�Oslo 22,3%
�London LHR 25,7%
�Amsterdam 30,3%
�Copenhagen 18,3%
�Stockholm 18,5%
�Helsinki 18,9%
�Oslo 22,3%
�London LHR 25,7%
�Amsterdam 30,3%
(Major hubs AEA punctuality statistics)
Delay >15 minutes
�Zurich 32,5%
�Frankfurt 33,5%
�Brussels 35,4%
�Paris CDG 36,4%
�Rome 37,4%
�Madrid 48,4%
�Milan Malpensa 54,0%
�Zurich 32,5%
�Frankfurt 33,5%
�Brussels 35,4%
�Paris CDG 36,4%
�Rome 37,4%
�Madrid 48,4%
�Milan Malpensa 54,0%

Scandinavian Airlines System, Investor Relations
Tel. +46 (0) 8 797 1451 Fax: +46 (0) 8 85 58 76
e-mail: [email protected] --- Homepage: www.scandinavian.net -- Results Jan - Jun 2000
2000-08-15
SAS IR/STU
�Current market share artificially low - 25%
�Capacity increase to absorb target market
share of about 30%
40-45 more Economy Class passengers
needed to break-even vs B 767
�Positive cargo contribution
�Generic growth in traffic system - positive
feeder effects
�Current market share artificially low - 25%
�Capacity increase to absorb target market
share of about 30%
40-45 more Economy Class passengers
needed to break-even vs B 767
�Positive cargo contribution
�Generic growth in traffic system - positive
feeder effects
Long haul - natural growth for SAS
2000-08-15
SAS IR/STU
ScandinaviaScandinaviaScandinaviaScandinavia
30%30%30%30%
North AmericaNorth AmericaNorth AmericaNorth America
Rest of EuropeRest of EuropeRest of EuropeRest of Europe
UKUKUKUK
AsiaAsiaAsiaAsia
10%10%10%10%24%24%24%24%
15%15%15%15%
21%21%21%21%
Almost 30% of SAS traffic flows are
within Scandinavia
2000-08-15
SAS IR/STU
�Natural link to long haul
business expansion
�Cost / ASK down 13% vs.
MD 80's
�Seat capacity up 33%
� Ideal for peak periods and
constrained airports
�4,5 BSEK total investment
�Natural link to long haul
business expansion
�Cost / ASK down 13% vs.
MD 80's
�Seat capacity up 33%
� Ideal for peak periods and
constrained airports
�4,5 BSEK total investment
First delivery 2ndFirst delivery 2ndFirst delivery 2ndFirst delivery 2nd
Quarter 2001Quarter 2001Quarter 2001Quarter 2001
New larger short haul aircraftDecision to purchase 12 Airbus A321-100

Scandinavian Airlines System, Investor Relations
Tel. +46 (0) 8 797 1451 Fax: +46 (0) 8 85 58 76
e-mail: [email protected] --- Homepage: www.scandinavian.net -- Results Jan - Jun 2000
2000-08-15
SAS IR/STU
Star AllianceTM and other
partnerships
Star AllianceTM and other
partnerships
2000-08-15
SAS IR/STU
SAS equity linked regional partners
owned 25-100%
49%
Traffic system Partners
20%
SAS
Increased alliance turbulence
KLMKLMKLMKLM ALITALIAALITALIAALITALIAALITALIA
NORTHWESTNORTHWESTNORTHWESTNORTHWEST CONTINENTALCONTINENTALCONTINENTALCONTINENTAL
SWISSAIR SWISSAIR SWISSAIR SWISSAIR AUSTRIAN AUSTRIAN AUSTRIAN AUSTRIAN
SABENASABENASABENASABENA
'WINGS''WINGS''WINGS''WINGS'
SASSASSASSAS
LUFTHANSALUFTHANSALUFTHANSALUFTHANSA
UNITEDUNITEDUNITEDUNITED
AIR CANADAAIR CANADAAIR CANADAAIR CANADA
VARIGVARIGVARIGVARIG
THAITHAITHAITHAI
ANSETTANSETTANSETTANSETT
AIR NEW ZEALANDAIR NEW ZEALANDAIR NEW ZEALANDAIR NEW ZEALAND
ALL NIPPONALL NIPPONALL NIPPONALL NIPPON
SINGAPORESINGAPORESINGAPORESINGAPORE
BRITISH AIRWAYSBRITISH AIRWAYSBRITISH AIRWAYSBRITISH AIRWAYS
AMERICANAMERICANAMERICANAMERICAN
CANADIANCANADIANCANADIANCANADIAN
QANTASQANTASQANTASQANTAS
CATHAYCATHAYCATHAYCATHAY
IBERIAIBERIAIBERIAIBERIA
FINNAIRFINNAIRFINNAIRFINNAIR
LAN CHILELAN CHILELAN CHILELAN CHILE
TAPTAPTAPTAP
AOMAOMAOMAOM
CROSSAIRCROSSAIRCROSSAIRCROSSAIR
TURKISHTURKISHTURKISHTURKISH
AIR LITTORALAIR LITTORALAIR LITTORALAIR LITTORAL
TYROLEANTYROLEANTYROLEANTYROLEAN
LAUDA AIRLAUDA AIRLAUDA AIRLAUDA AIR
AIR EUROPEAIR EUROPEAIR EUROPEAIR EUROPE
BRITISH MIDLANDBRITISH MIDLANDBRITISH MIDLANDBRITISH MIDLAND
MEXICANAMEXICANAMEXICANAMEXICANA
????
???? ????????
Scandinavian Airlines System, Investor Relations
Tel. +46 (0) 8 797 1451 Fax: +46 (0) 8 85 58 76
e-mail: [email protected] --- Homepage: www.scandinavian.net -- Results Jan - Jun 2000
2000-08-15
SAS IR/STU
British Midland Added to SAS' Joint
Ventures�SAS capacity allocated
�Non-SAS capacity
�SAS capacity allocated
�Non-SAS capacity
�Between Finland/Scandinavia and
Germany
�Continued positive development
�Toronto -Copenhagen MAY/JUN
cabin factor 90%
�Established LHR -MPX/FCO/MAD
�Between Finland/Scandinavia and
Germany
�Continued positive development
�Toronto -Copenhagen MAY/JUN
cabin factor 90%
�Established LHR -MPX/FCO/MAD
2000-08-15
SAS IR/STU
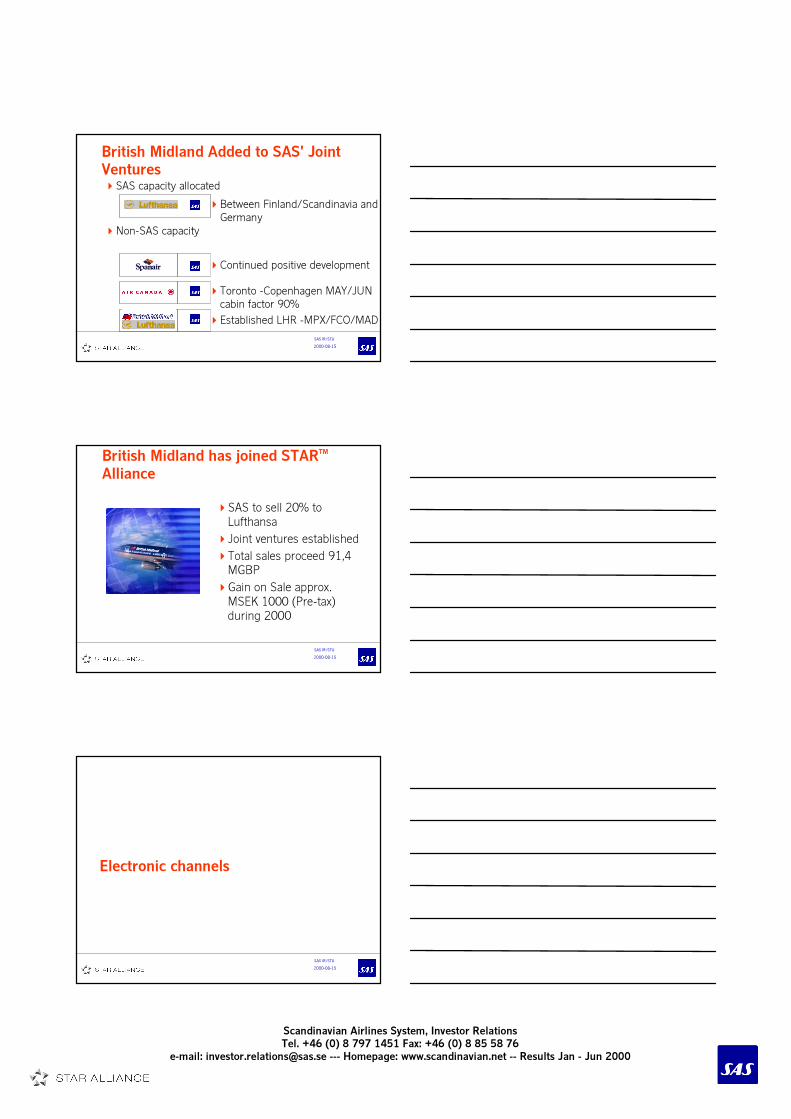
British Midland has joined STARTM
Alliance
�SAS to sell 20% to
Lufthansa
�Joint ventures established
�Total sales proceed 91,4
MGBP
�Gain on Sale approx.
MSEK 1000 (Pre-tax)
during 2000
�SAS to sell 20% to
Lufthansa
�Joint ventures established
�Total sales proceed 91,4
MGBP
�Gain on Sale approx.
MSEK 1000 (Pre-tax)
during 2000
2000-08-15
SAS IR/STU
Electronic channelsElectronic channels

Scandinavian Airlines System, Investor Relations
Tel. +46 (0) 8 797 1451 Fax: +46 (0) 8 85 58 76
e-mail: [email protected] --- Homepage: www.scandinavian.net -- Results Jan - Jun 2000
2000-08-15
SAS IR/STU
www.scandinavian.net
VoiceVoice
D-TVD-TV
SMSSMS
Co-surfCo-surf
Call backCall back
Contact CenterContactContact CenterCenterWAPWAP
SAS
2000-08-15
SAS IR/STU
A marketplace with very
high online penetration
Online penetration of individuals, 2000-2003
0
10
20
30
40
50
60
70
2000 2001 2002 2003
%
Sweden
Norway
Denmark
Finland
US
Source: 1999 Jupiter Strategic Planning Services/MMSC99-V1
SAS
2000-08-15
SAS IR/STU
www.scandinavian net
surpassing 300 000
profiles as of July 2000
�306 265 profiles registered
�650 000 - 800 000 visitor
sessions per month
�>200 000 unique visitors per month
�Quality standards met
�306 265 profiles registered
�650 000 - 800 000 visitor
sessions per month
�>200 000 unique visitors per month
�Quality standards met

Scandinavian Airlines System, Investor Relations
Tel. +46 (0) 8 797 1451 Fax: +46 (0) 8 85 58 76
e-mail: [email protected] --- Homepage: www.scandinavian.net -- Results Jan - Jun 2000
2000-08-15
SAS IR/STU
Travel Pass Corporate - further
positive developments
�30 000 cards
outstanding
�Domestic Norway and
Sweden largest
volumes
�Skyways implemented
as partner
�30 000 cards
outstanding
�Domestic Norway and
Sweden largest
volumes
�Skyways implemented
as partner
Total No of TPC-Cards Total No of TPC-Cards Total No of TPC-Cards Total No of TPC-Cards
0
5 000
10 000
15 000
20 000
25 000
30 000
35 000
Jun
Aug
Okt
Dec Fe
bApr
Jun
Total
2000-08-15
SAS IR/STU
Financials and aircraft fleet dataFinancials and aircraft fleet data
2000-08-15
SAS IR/STU
SAS Group ResultBefore depreciation and Before taxes
MSEK
0
200
400
600
800
1 000
1 200
1 400
JAN-JUN99 JAN-JUN00
Income bef depreciation Income bef taxes
SAS Group

Scandinavian Airlines System, Investor Relations
Tel. +46 (0) 8 797 1451 Fax: +46 (0) 8 85 58 76
e-mail: [email protected] --- Homepage: www.scandinavian.net -- Results Jan - Jun 2000
2000-08-15
SAS IR/STU
Balance Sheet
MSEK 30JUN00 31DEC99
Liquid funds 6 232 8 368
Other interest-bearing assets 3 979 3 356
Aircraft 13 410 11 302
Other assets 20 141 19 601
Total assets 43 762 42 627
Operating liabilities 12 892 13 143
Interest-bearing liabilities 12 555 11 626
Subordinated debenture loan 782 772
Minority interests 18 25
Equity 17 515 17 061
Total liabilities and equity 43 762 42 627
Net debt 3 126 674
SAS Group
2000-08-15
SAS IR/STU
SAS Group Investments
MSEK MSEK MSEK MSEK JAN-JUN00JAN-JUN00JAN-JUN00JAN-JUN00
Aircraft and spare partsAircraft and spare partsAircraft and spare partsAircraft and spare parts 2 6502 6502 6502 650
Prepayments aircraft, netPrepayments aircraft, netPrepayments aircraft, netPrepayments aircraft, net 1 3961 3961 3961 396
OtherOtherOtherOther 431431431431
Total 4 477
2000-08-15
SAS IR/STU
Changes in Financial Position
January - June
2000 1999
Cash flow from operations 1 057 833
Change in working capital + 69 - 317
Net financing from operations 1 126 516
Investments, advance payments - 4 477 - 3 003
Sales of fixed assets, etc. + 1 673 + 866
Payment to mother companies - 770 - 957
Financing surplus - 2 448 - 2 578Changes in external financing, net + 312 - 26
Change in liquid funds - 2 136 - 2 604
MSEKMSEKMSEKMSEK
SAS Group

Scandinavian Airlines System, Investor Relations
Tel. +46 (0) 8 797 1451 Fax: +46 (0) 8 85 58 76
e-mail: [email protected] --- Homepage: www.scandinavian.net -- Results Jan - Jun 2000
2000-08-15
SAS IR/STU
Unit Cost Effected by FuelJanuary - June 2000 vs 1999
MSEK
Volume = average growth in ASK and RPK = 4,1%
Adjusted Share of
H1/99 H1/00 Var. % total var %
Commissions 1 089 1 049 3.7% 0.3%
Fuel 1 130 1 699 (50.4%) (3.8%)
Government charges 1 751 1 690 3.5% 0.4%
Personnel 6 546 6 493 0.8% 0.4%
Other oper. net costs 4 628 4 392 5.1% 1.6%
TOTAL 15 144 15 323 (1.2%) (1.2%)
2000-08-15
SAS IR/STU
�MSEK 1550 achieved as of 2nd quarter 2000
�Increased pace during rest of year 2000
Result Improvement Program 1999/00
Area Achived effect vs. 1998
Cargo 70 MSEK
Catering & In-flight service 0 MSEK
IT & communications 100 MSEK
Distribution & Electronic channels 580 MSEK
Air crew 300 MSEK
Ground handling 160 MSEK
Technical maintenance 190 MSEK
Overhead & other 150 MSEK
Total 1550 MSEK
SAS
2000-08-15
SAS IR/STU
Improved Productivity Development
Measure is average change of RPK /ASK over change in
number of full time employees
-4%
-3%
-2%
-1%
+0%
+1%
+2%
+3%
+4%
+5%
JAN-JUN99 JAN-JUN00

Scandinavian Airlines System, Investor Relations
Tel. +46 (0) 8 797 1451 Fax: +46 (0) 8 85 58 76
e-mail: [email protected] --- Homepage: www.scandinavian.net -- Results Jan - Jun 2000
2000-08-15
SAS IR/STU
SAS Airline
Currency Effects 2000 vs 1999(MSEK)
JAN-JUN
Total revenues - 186
Total costs + 230
Forward cover costs & working cap. - 70
Income bef. depr. - 26
Financial items + 52
Income before tax + 26
2000-08-15
SAS IR/STU
SAS Airline Currency EffectsJAN-JUN 2000 vs 1999
Total revenues & costs:
(Total +44 MSEK)Major approx. effects:
USD -81
DKK +107
NOK -35
EUR -61
Asian curr. +96
All others +18
Forward cover costs:(Total -7 MSEK)
1999 -26
2000 -33
Working capital:
(Total -63 MSEK)
1999 +49
2000 -14
Financial items:
(Total +52 MSEK)
1999 +6
2000 +58
Grand total: +26 MSEK
2000-08-15
SAS IR/STU
SAS Group
Income by Business Unit
(MSEK)
January - June
2000 1999
SAS 335 277
SAS International Hotels 386 229
Other operations/Group elim. + 11 - 10
Income before taxes 732 496

Scandinavian Airlines System, Investor Relations
Tel. +46 (0) 8 797 1451 Fax: +46 (0) 8 85 58 76
e-mail: [email protected] --- Homepage: www.scandinavian.net -- Results Jan - Jun 2000
2000-08-15
SAS IR/STU
SAS GroupDevelopment of Income before Taxes
MSE
KM
SEK
MSE
KM
SEK
0
500
1 000
1 500
2 000
JAN-
JUN99
Curr Yield Traffic Oth rev Costs etc Gain on
sales
SIH JAN-
JUN00
+26
-10
+1 003
+235
-940
-235
+157
496
732
Change in revenues:
+1 228 MSEK
2000-08-15
SAS IR/STU
SAS GroupDevelopment of Equity/Assets Ratio
10%
15%
20%
25%
30%
35%
40%
45%
92-12
93-06
93-12
94-06
94-12
95-06
95-12
96-06
96-12
97-06
97-12
98-06
98-12
99-06
99-12
00-06
2000-08-15
SAS IR/STU
SAS Group
Income before taxes
Bars = Quarterly income Line = Moving 12 months result
Bars = quarterly Line = moving 4 quarters
-3 000
-2 000
-1 000
0
1 000
2 000
3 000
4 000
Q1-92
Q3-92
Q1-93
Q3-93
Q1-94
Q3-94
Q1-95
Q3-95
Q1-96
Q3-96
Q1-97
Q3-97
Q1-98
Q3-98
Q1-99
Q3-99
Q1-00
MSEK

Scandinavian Airlines System, Investor Relations
Tel. +46 (0) 8 797 1451 Fax: +46 (0) 8 85 58 76
e-mail: [email protected] --- Homepage: www.scandinavian.net -- Results Jan - Jun 2000
2000-08-15
SAS IR/STU
SAS (incl. SAS Trading)
Revenues (as is)
MSEK JAN-JUN00 JAN-JUN99 curr adj 99
Passenger revenues 15 747 14 638 14 436
Cargo revenues 1 173 1 088 1 130
Other traffic revenues 476 457 478
Other revenues 3 257 3 376 3 329
TOTAL REVENUES 20 653 19 559 19 373
2000-08-15
SAS IR/STU
SAS (incl. SAS Trading)
Operating Costs (as is) MSEK JAN-JUN00 JAN-JUN99 curr adj 99
Personnel costs 6 655 6 653 6 447
Leasing costs (aircraft) 732 679 717
Sales costs 1 072 1 060 1 050
Fuel 1 739 1 027 1 093
Governmental charges 1 720 1 739 1 688
Meals costs 921 835 812
Handling costs 979 937 915
Maintenance costs 1 136 1 018 1 021
Other costs 4 650 4 803 4 848
TOTAL COSTS 19 604 18 751 18 591
2000-08-15
SAS IR/STU
Financial net January - June 2000
(MSEK)
00-06-30 99-06-30 Difference
Interest net and others -68 -91 23
Exchange rate differences 63 19 44
Financial net -5 -72 67
(in % p.a. of average
net debt) -0,4% -3,8% 3,4%
SAS Group
Scandinavian Airlines System, Investor Relations
Tel. +46 (0) 8 797 1451 Fax: +46 (0) 8 85 58 76
e-mail: [email protected] --- Homepage: www.scandinavian.net -- Results Jan - Jun 2000
2000-08-15
SAS IR/STU
Development and Break Down of Net
Debt 00630
(MSEK) 000630 990630 Difference
Cash 6 232 5 425 807
Other interest bearing
assets 4 012 2 223 1 789
Interest bearing
liabilities -13 370 -12 174 -1 196
Net debt -3 126 -4 526 1 400
SAS Group
2000-08-15
SAS IR/STU
Gross interest income / expenses on
liquidity and debt
(MSEK) 0001-06
Average liquidity 9 887
Interest income 235
Return (% p.a.) 4,8%
Average gross debt 12 312
Interest expenses and others -303
Interest cost (% p.a.) -4,9%
Average net debt 2 425
Interest net and others -68
Interest net (% p.a.) -5,6%
Exchange rate differences 63
Exchange rate differences (% p.a.) 5,2%
Financial net -5
Financial net (% p.a.) -0,4%
SAS Group
2000-08-15
SAS IR/STU
Development of net debt 9112-0006
0
2 000
4 000
6 000
8 000
10 000
12 000
14 000
16 000
18 000
91-12 92-12 93-12 94-12 95-12 96-12 97-12 98-12 99-12
MS
EK
Average -92MSEK13.000
Average -93MSEK 15.900
Average - 94MSEK 9.700
Average -95MSEK 4.750
Average -96MSEK 2.350
Average -97MSEK 1.870
Average -98MSEK 1.950
Average -99MSEK 4.310
Average -0006MSEK 2.425
SAS Group

Scandinavian Airlines System, Investor Relations
Tel. +46 (0) 8 797 1451 Fax: +46 (0) 8 85 58 76
e-mail: [email protected] --- Homepage: www.scandinavian.net -- Results Jan - Jun 2000
2000-08-15
SAS IR/STU
SAS Aircraft Fleet
Aircraft in SAS Traffic
30JUN00 31MAR00 31DEC99
Boeing 767-300 13 13 13
MD-81/82/83 49 49 49
MD-87 18 18 18
MD-90 8 8 8
Boeing 737-600 29 29 29
Boeing 737-700 6 6 1
Boeing 737-800 5 0 0
DC-9-81 3 8 8
DC-9-41 19 19 20
DC-9-21 3 3 4
Fokker F28 0 4 5
de Havilland Q400 4 3 0
Fokker F50 20 20 20
SAAB 2000 5 5 5
TOTAL 182 185 180
2000-08-15
SAS IR/STU
Fleet phase out in progress -
three less units during Q2 Change in Q2 Changes until end year 2000
Boeing 767-300 - Unchanged
MD-80 - Unchanged
MD-90 - Unchanged
Boeing 737 +5 10 new deliveries
DC-9-81 -5 Phase out 2000
DC-9-41 - Phase out 2001
DC-9-21 - Phase out 2000
Boeing 737-300 - Flexible capacity, wet lease
Fokker F28 -4 Completely phased out
Fokker F50 - Gradual phase outGradual phase outGradual phase outGradual phase out
DeHavilland Q400 +1 10 new deliveries
SAAB 2000 - Gradual phase out
TOTAL -3
SAS
2000-08-15
SAS IR/STU
Operating dataOperating data
Scandinavian Airlines System, Investor Relations
Tel. +46 (0) 8 797 1451 Fax: +46 (0) 8 85 58 76
e-mail: [email protected] --- Homepage: www.scandinavian.net -- Results Jan - Jun 2000
2000-08-15
SAS IR/STU
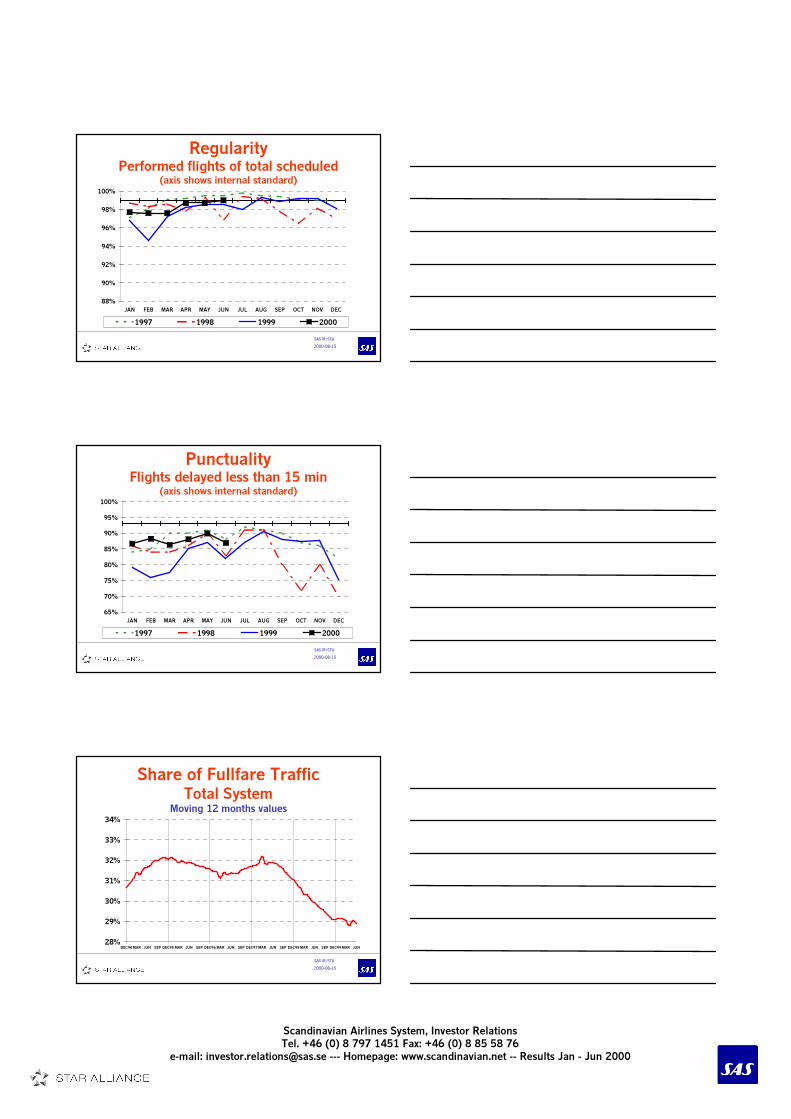
RegularityPerformed flights of total scheduled
(axis shows internal standard)
88%
90%
92%
94%
96%
98%
100%
JAN FEB MAR APR MAY JUN JUL AUG SEP OCT NOV DEC
1997 1998 1999 2000
2000-08-15
SAS IR/STU
PunctualityFlights delayed less than 15 min
(axis shows internal standard)
65%
70%
75%
80%
85%
90%
95%
100%
JAN FEB MAR APR MAY JUN JUL AUG SEP OCT NOV DEC
1997 1998 1999 2000
2000-08-15
SAS IR/STU
Share of Fullfare TrafficTotal System
Moving 12 months values
28%
29%
30%
31%
32%
33%
34%
DEC94MAR JUN SEP DEC95MAR JUN SEP DEC96MAR JUN SEP DEC97MAR JUN SEP DEC98MAR JUN SEP DEC99MAR JUN

Scandinavian Airlines System, Investor Relations
Tel. +46 (0) 8 797 1451 Fax: +46 (0) 8 85 58 76
e-mail: [email protected] --- Homepage: www.scandinavian.net -- Results Jan - Jun 2000
2000-08-15
SAS IR/STU
Monthly Change in Total M-class TrafficJAN98 - JUN00
-10%
-5%
0%
5%
10%
15%
20%
25%
JAN98 JUL JAN99 JUL JAN00 JUL
2000-08-15
SAS IR/STU
Partner SynergiesCode-Sharing with 24 Partners
Number of destinations
31DEC99 30JUN00
SAS network 94 92
SAS code-shared with LH +47 +43
SAS code-shared with other +111 +115
TOTAL 252 250
Number of frequencies/day
10-16JAN00 07-13AUG00
SAS operated, no code-sharing 434 404
Partner flts on SAS 568 553
SAS comm. flts on partners 1 077 1 071
TOTAL 2 079 2 028
2000-08-15
SAS IR/STU
SAS Airline
Currency Distribution 2000
Revenues CostsMajor deficiency currencies:
USD,DKK
31%
21%14%
9%
11%
14% SEK
NOK
DKK
USD
EUR
other
26%
16%
23%
10%
6%
19%
SEK
NOK
DKK
USD
EUR
other

Scandinavian Airlines System, Investor Relations
Tel. +46 (0) 8 797 1451 Fax: +46 (0) 8 85 58 76
e-mail: [email protected] --- Homepage: www.scandinavian.net -- Results Jan - Jun 2000
2000-08-15
SAS IR/STU
Traffic and Yield2nd Quarter 2000 vs 1999
2nd Quarter Index,
SAS Total Scheduled 2000 1999 variance
Production (mill ASK) 8 492 8 466 100
Traffic (mill RPK) 6 008 5 571 108
Cabin factor (%) 70,7 65,8 + 4,9
C-class share (%) 29,9 30,7 - 0,7
Yield (öre/RPK) 138,7 141,7 98
Currency adj. yield 138,7 138,1 100
2000-08-15
SAS IR/STU
Production and Traffic 2nd Quarter 2000 vs 1999
Route Sector Production Traffic CabinScheduled ASK RPK factor %
SAS Total 100 108 + 4,9
Intercontinental 100 109 + 7,0
Europe 101 107 + 3,6
Intrascandinavian 93 102 + 5,7
Denmark/Greenland 90 98 + 5,8
Norway 92 103 + 6,9
Sweden 115 116 + 0,6
2000-08-15
SAS IR/STU
Traffic Analysis 2nd Quarter 2000 vs 1999
Route Sector Fullfare Discounted Total trafficScheduled RPK-C RPK-M RPK
SAS Total 105 109 108
Intercontinental 109 110 109
Europe 106 107 107
Intrascandinavian 100 103 102
Denmark/Greenland 87 108 98
Norway 94 109 103
Sweden 114 118 116
Scandinavian Airlines System, Investor Relations
Tel. +46 (0) 8 797 1451 Fax: +46 (0) 8 85 58 76
e-mail: [email protected] --- Homepage: www.scandinavian.net -- Results Jan - Jun 2000
2000-08-15
SAS IR/STU
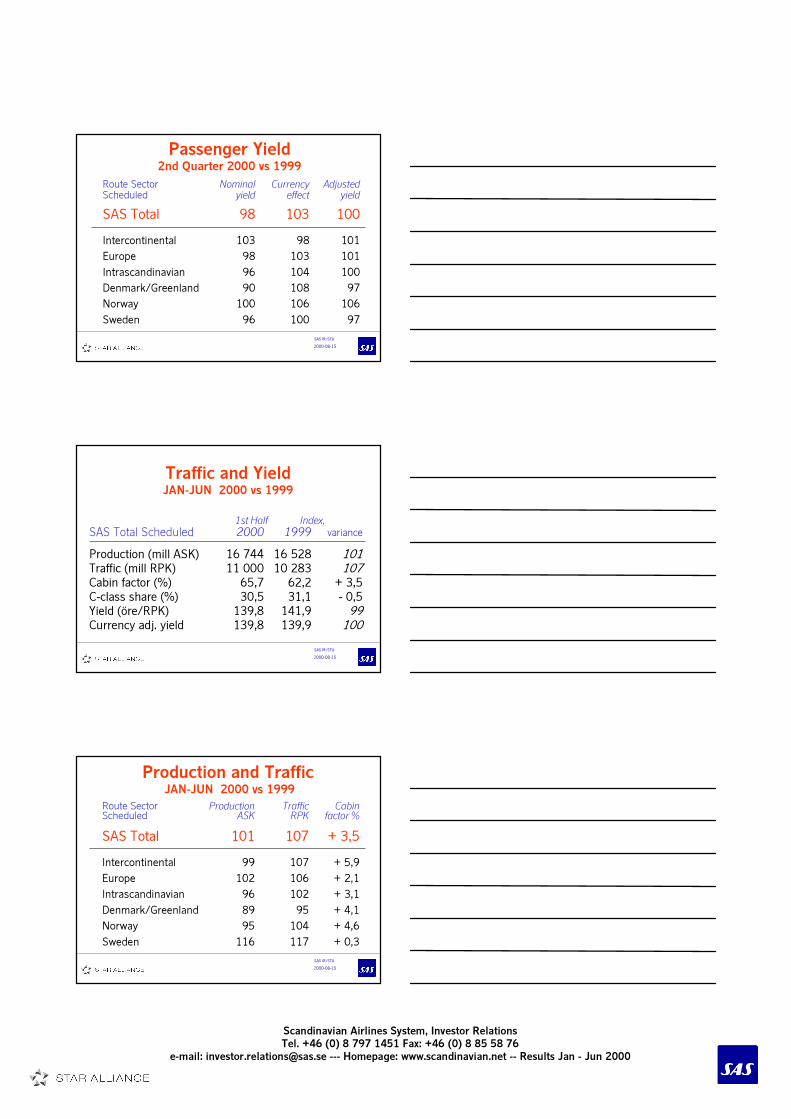
Passenger Yield2nd Quarter 2000 vs 1999
Route Sector Nominal Currency AdjustedScheduled yield effect yield
SAS Total 98 103 100
Intercontinental 103 98 101
Europe 98 103 101
Intrascandinavian 96 104 100
Denmark/Greenland 90 108 97
Norway 100 106 106
Sweden 96 100 97
2000-08-15
SAS IR/STU
Traffic and YieldJAN-JUN 2000 vs 1999
1st Half Index,
SAS Total Scheduled 2000 1999 variance
Production (mill ASK) 16 744 16 528 101
Traffic (mill RPK) 11 000 10 283 107
Cabin factor (%) 65,7 62,2 + 3,5
C-class share (%) 30,5 31,1 - 0,5
Yield (öre/RPK) 139,8 141,9 99
Currency adj. yield 139,8 139,9 100
2000-08-15
SAS IR/STU
Production and Traffic JAN-JUN 2000 vs 1999
Route Sector Production Traffic CabinScheduled ASK RPK factor %
SAS Total 101 107 + 3,5
Intercontinental 99 107 + 5,9
Europe 102 106 + 2,1
Intrascandinavian 96 102 + 3,1
Denmark/Greenland 89 95 + 4,1
Norway 95 104 + 4,6
Sweden 116 117 + 0,3

Scandinavian Airlines System, Investor Relations
Tel. +46 (0) 8 797 1451 Fax: +46 (0) 8 85 58 76
e-mail: [email protected] --- Homepage: www.scandinavian.net -- Results Jan - Jun 2000
2000-08-15
SAS IR/STU
Traffic Analysis JAN-JUN 2000 vs 1999
Route Sector Fullfare Discounted Total trafficScheduled RPK-C RPK-M RPK
SAS Total 105 108 107
Intercontinental 105 108 107
Europe 105 107 106
Intrascandinavian 102 101 102
Denmark/Greenland 84 107 95
Norway 101 105 104
Sweden 115 118 117
2000-08-15
SAS IR/STU
Passenger YieldJAN-JUN 2000 vs 1999
Route Sector Nominal Currency AdjustedScheduled yield effect yield
SAS Total 99 101 100
Intercontinental 102 98 100
Europe 97 102 99
Intrascandinavian 99 102 101
Denmark/Greenland 90 107 96
Norway 104 103 107
Sweden 97 100 97
2000-08-15
SAS IR/STU
SAS Gross Profit Margin Moving 12 months values
0%
2%
4%
6%
8%
10%
12%
14%
16%
DEC94 JUN DEC95 JUN DEC96 JUN DEC97 JUN DEC98 JUN DEC99 JUN
Scandinavian Airlines System, Investor Relations
Tel. +46 (0) 8 797 1451 Fax: +46 (0) 8 85 58 76
e-mail: [email protected] --- Homepage: www.scandinavian.net -- Results Jan - Jun 2000
2000-08-15
SAS IR/STU
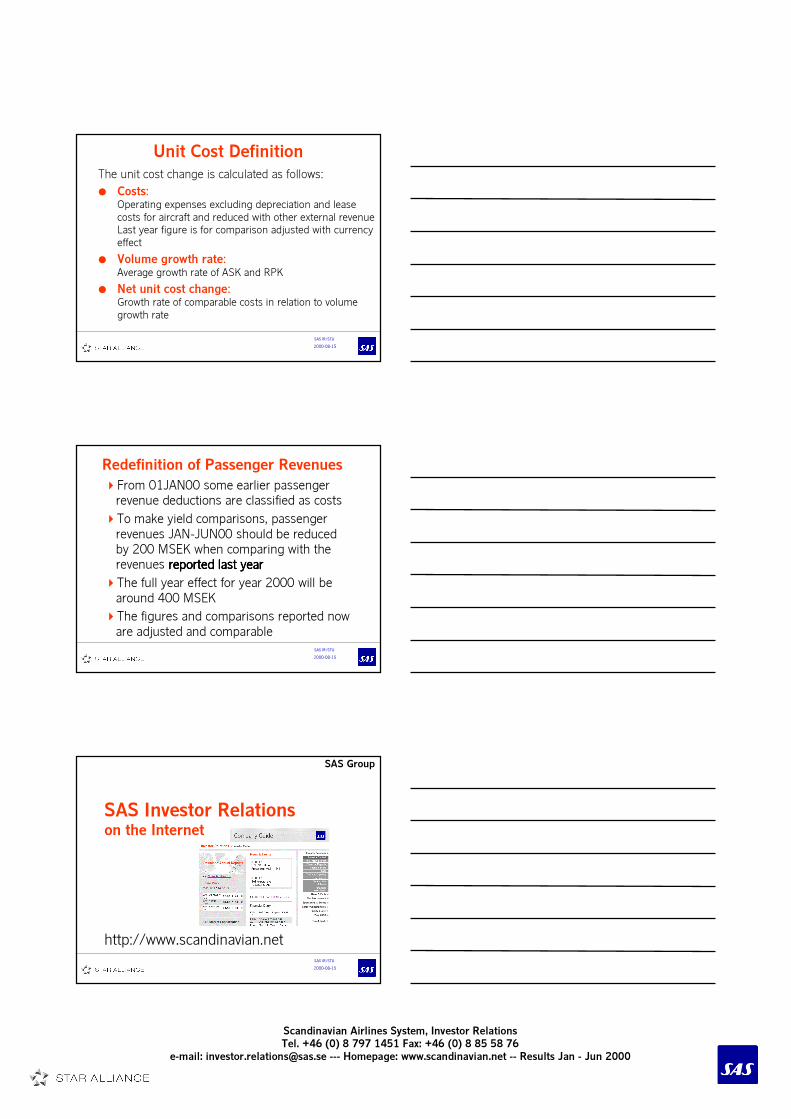
Unit Cost Definition
The unit cost change is calculated as follows:
● Costs:Operating expenses excluding depreciation and lease
costs for aircraft and reduced with other external revenue
Last year figure is for comparison adjusted with currency
effect
● Volume growth rate:Average growth rate of ASK and RPK
● Net unit cost change:Growth rate of comparable costs in relation to volume
growth rate
2000-08-15
SAS IR/STU
Redefinition of Passenger Revenues
�From 01JAN00 some earlier passenger
revenue deductions are classified as costs
�To make yield comparisons, passenger
revenues JAN-JUN00 should be reduced
by 200 MSEK when comparing with the
revenues reported last yearreported last yearreported last yearreported last year
�The full year effect for year 2000 will be
around 400 MSEK
�The figures and comparisons reported now
are adjusted and comparable
2000-08-15
SAS IR/STU
SAS Investor Relations
on the Internet
http://www.scandinavian.net
SAS Group

Scandinavian Airlines System, Investor Relations
Tel. +46 (0) 8 797 1451 Fax: +46 (0) 8 85 58 76
e-mail: [email protected] --- Homepage: www.scandinavian.net -- Results Jan - Jun 2000
2000-08-15
SAS IR/STU
Summary recent analyst's
recommendations
Buy/ Strong buyBuy/ Strong buyBuy/ Strong buyBuy/ Strong buy
Alfred Berg -Aros Securities- Aragon - Goldman Sachs- Gudme
Raaschou- Handelsbanken Markets -First Securities -Den Danske
Bank - BG Bank - Sundal Collier & Co. - Dresdner Kleinworth
Benson
NeutralNeutralNeutralNeutral
Morgan Stanley dean Witter - Merril Lynch -Karl Johan Fonds -
Christiania Markets - Julius Bär - Carnegie
SellSellSellSell
Enskilda Securities
SAS Group
2000-08-15
SAS IR/STU
Discount to book - increase in
spite surplus values
�Surplus values of a/c
fleet MSEK 4 800
Strategic stakes
�SIH
�SMART
�Flight Academy
�British Midland
�Other
5 000
7 000
9 000
11 000
13 000
15 000
17 000
19 000
21 000
23 000
25 000
mar-96
jul-96
nov-96
mar-97
jul-97
nov-97
mar-98
jul-98
nov-98
mar-99
jul-99
nov-99
mar-00
Book Equity Market Cap
SAS Group
2000-08-15
SAS IR/STU
Swedish share still at significant
discount
SAS Share Prices (SEK)Deviation from Mathematical Parity
-30%-30%-30%-30%
-25%-25%-25%-25%
-20%-20%-20%-20%
-15%-15%-15%-15%
-10%-10%-10%-10%
-5%-5%-5%-5%
0%0%0%0%
5%5%5%5%
10%10%10%10%
15%15%15%15%
20%20%20%20%
25%25%25%25%
30%30%30%30%
jjjj mmmm mmmm jjjj aaaa oooo jjjj mmmm mmmm jjjj ssss nnnn jjjj mmmm mmmm jjjj
SAS Danmark A/SSAS Danmark A/SSAS Danmark A/SSAS Danmark A/S SAS Norge ASASAS Norge ASASAS Norge ASASAS Norge ASA SAS Sverige ABSAS Sverige ABSAS Sverige ABSAS Sverige AB
1998 - 2000 4-aug-004-aug-004-aug-004-aug-00
SAS Group
Scandinavian Airlines System, Investor Relations
Tel. +46 (0) 8 797 1451 Fax: +46 (0) 8 85 58 76
e-mail: [email protected] --- Homepage: www.scandinavian.net -- Results Jan - Jun 2000
2000-08-15
SAS IR/STU
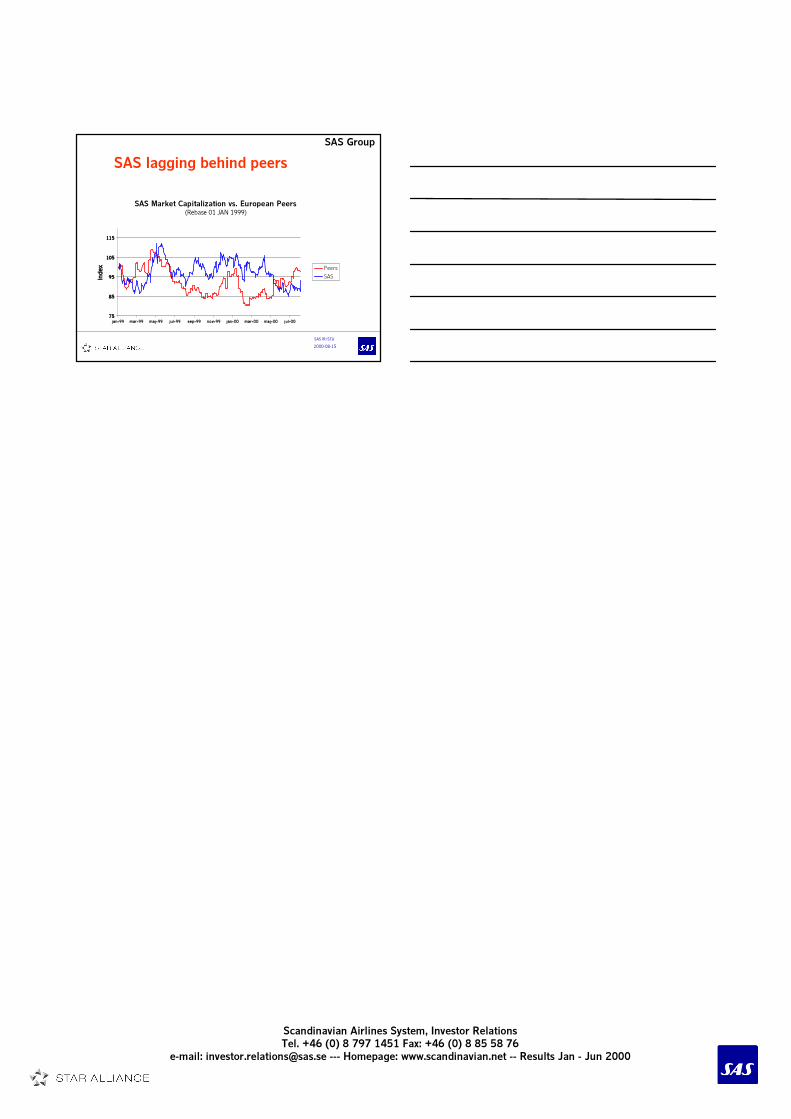
SAS lagging behind peers
SAS Market Capitalization vs. European Peers(Rebase 01 JAN 1999)
75757575
85858585
95959595
105105105105
115115115115
jan-99jan-99jan-99jan-99 mar-99mar-99mar-99mar-99 maj-99maj-99maj-99maj-99 jul-99jul-99jul-99jul-99 sep-99sep-99sep-99sep-99 nov-99nov-99nov-99nov-99 jan-00jan-00jan-00jan-00 mar-00mar-00mar-00mar-00 maj-00maj-00maj-00maj-00 jul-00jul-00jul-00jul-00
Index
Index
Index
Index
Peers
SAS
SAS Group


![UniversityofCaliforniaatSanDiegoandPrincetonUniversity arXiv:math/0411109v2 [math… · 2010-01-04 · arXiv:math/0411109v2 [math.AP] 3 Jan 2010 ... [H1, H2]) has global solutions7](https://img.pdfslide.us/doc/110x75/5e7dc5822700916f13526e83/universityofcaliforniaatsandiegoandprincetonuniversity-arxivmath0411109v2-math.jpg)