Embed Size (px)
Citation preview
© 2012 fintegral consulting•www.fintegral.com
Stress Testing A Whistle-Stop Tour
Jörg Behrens
Owen Matthews
SAS Forum Switzerland 2012

© 2012 fintegral consulting•www.fintegral.com 2
Overview
Modelling
Implementation
Q&A
Agenda

© 2012 fintegral consulting•www.fintegral.com 3
Overview
© 2012 fintegral consulting•www.fintegral.com
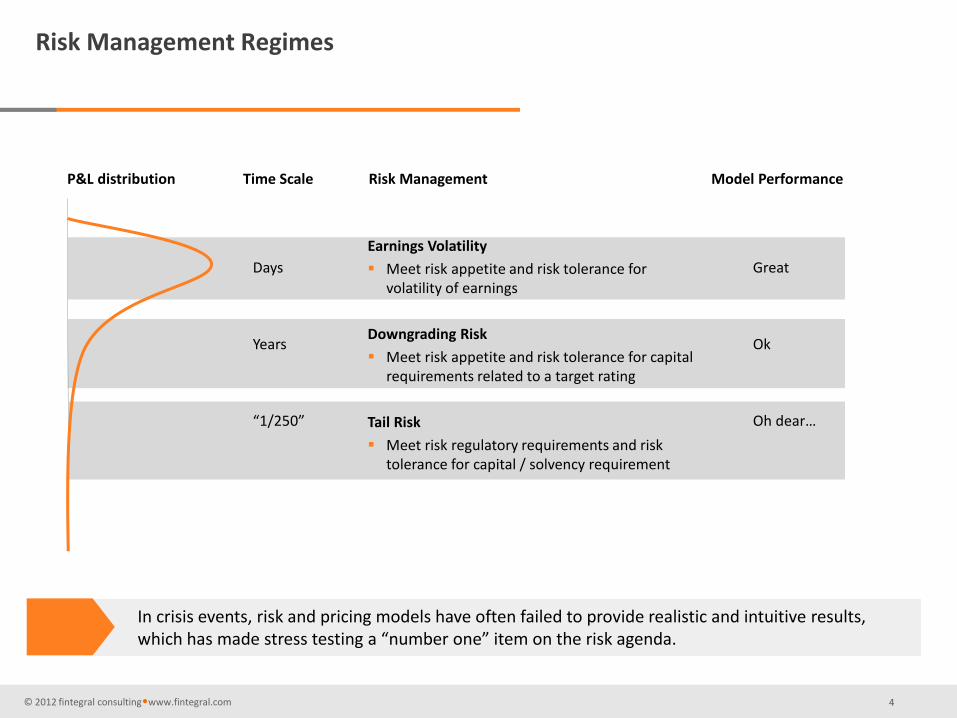
P&L distribution
Earnings Volatility
Meet risk appetite and risk tolerance for volatility of earnings
Downgrading Risk
Meet risk appetite and risk tolerance for capital requirements related to a target rating
Tail Risk
Meet risk regulatory requirements and risk tolerance for capital / solvency requirement
Risk Management Time Scale
Days Years “1/250”
Model Performance
Great Ok Oh dear…
In crisis events, risk and pricing models have often failed to provide realistic and intuitive results, which has made stress testing a “number one” item on the risk agenda.
Risk Management Regimes
4
© 2012 fintegral consulting•www.fintegral.com
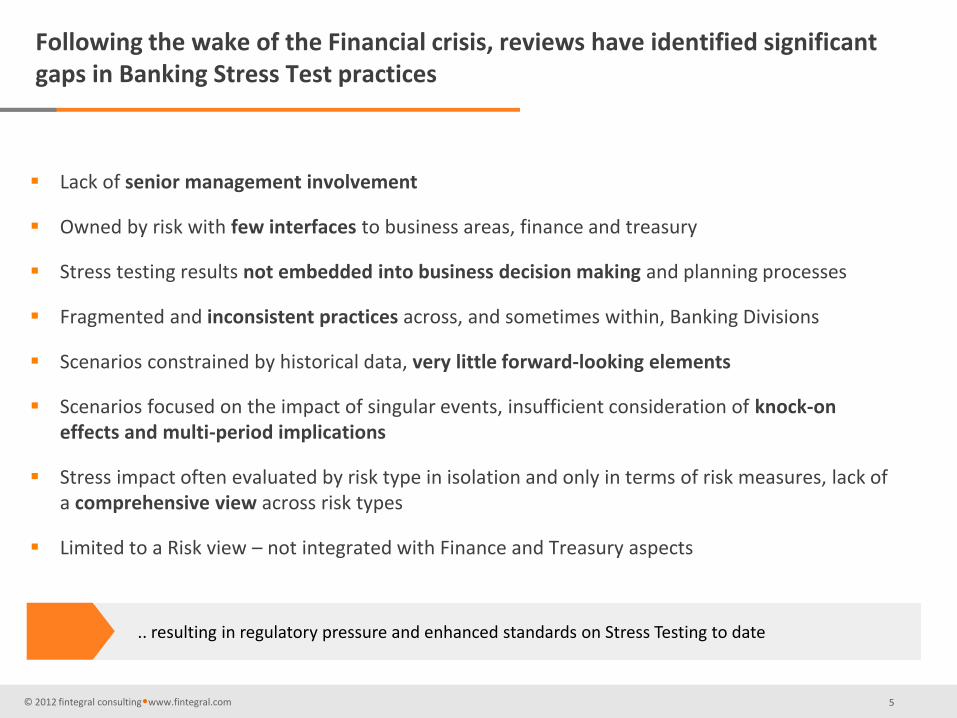
Following the wake of the Financial crisis, reviews have identified significant gaps in Banking Stress Test practices
Lack of senior management involvement
Owned by risk with few interfaces to business areas, finance and treasury
Stress testing results not embedded into business decision making and planning processes
Fragmented and inconsistent practices across, and sometimes within, Banking Divisions
Scenarios constrained by historical data, very little forward-looking elements
Scenarios focused on the impact of singular events, insufficient consideration of knock-on effects and multi-period implications
Stress impact often evaluated by risk type in isolation and only in terms of risk measures, lack of a comprehensive view across risk types
Limited to a Risk view – not integrated with Finance and Treasury aspects
.. resulting in regulatory pressure and enhanced standards on Stress Testing to date
5
© 2012 fintegral consulting•www.fintegral.com
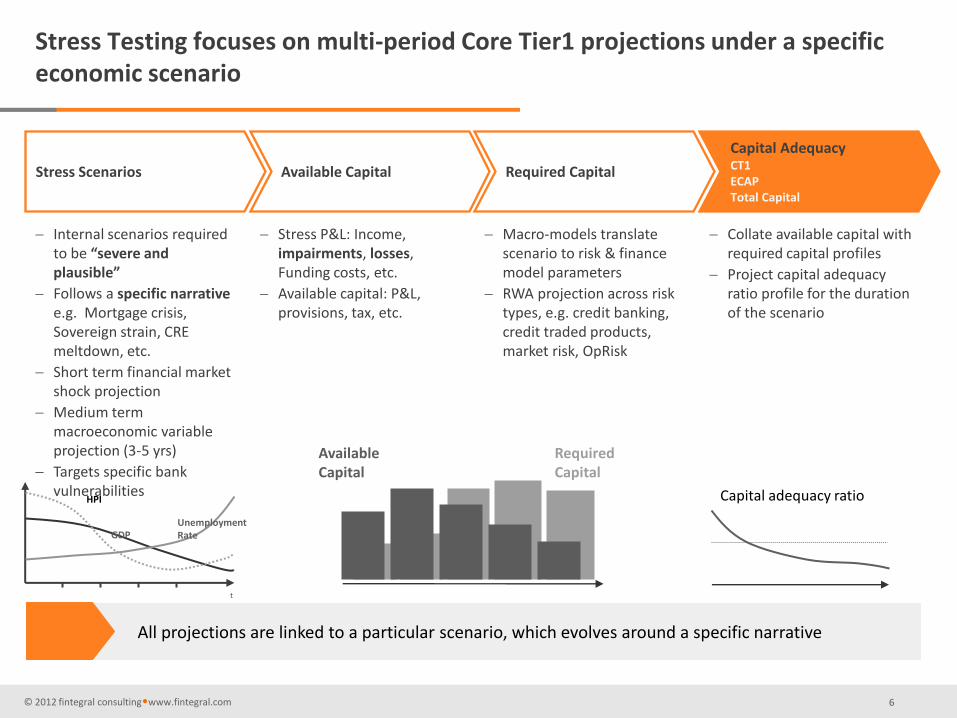
Stress Testing focuses on multi-period Core Tier1 projections under a specific economic scenario
Capital adequacy ratio
Capital Adequacy CT1 ECAP Total Capital
Collate available capital with required capital profiles
Project capital adequacy ratio profile for the duration of the scenario
Required Capital
Macro-models translate scenario to risk & finance model parameters
RWA projection across risk types, e.g. credit banking, credit traded products, market risk, OpRisk
Available Capital
Stress P&L: Income, impairments, losses, Funding costs, etc.
Available capital: P&L, provisions, tax, etc.
Required Capital
Available Capital
Stress Scenarios
Internal scenarios required to be “severe and plausible”
Follows a specific narrative e.g. Mortgage crisis, Sovereign strain, CRE meltdown, etc.
Short term financial market shock projection
Medium term macroeconomic variable projection (3-5 yrs)
Targets specific bank vulnerabilities
t
GDP
HPI
Unemployment Rate
All projections are linked to a particular scenario, which evolves around a specific narrative
6
© 2012 fintegral consulting•www.fintegral.com
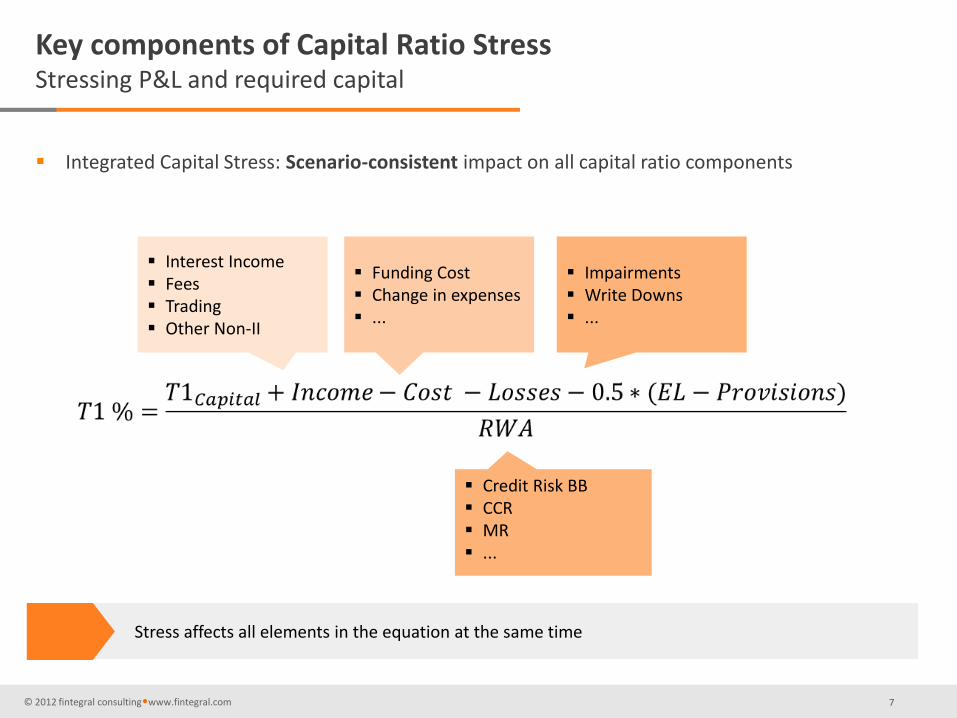
Key components of Capital Ratio Stress Stressing P&L and required capital
Stress affects all elements in the equation at the same time
Impairments Write Downs ...
Funding Cost Change in expenses ...
Interest Income Fees Trading Other Non-II
Credit Risk BB CCR MR ...
Integrated Capital Stress: Scenario-consistent impact on all capital ratio components
7

© 2012 fintegral consulting•www.fintegral.com 8
Modelling
© 2012 fintegral consulting•www.fintegral.com
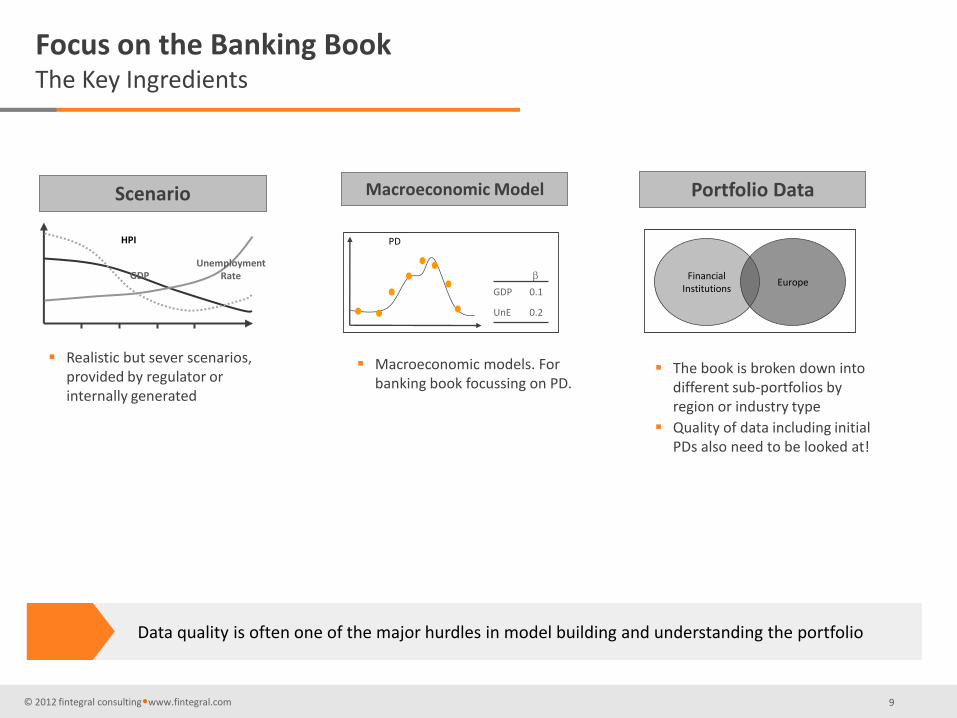
Focus on the Banking Book The Key Ingredients
Scenario Macroeconomic Model Portfolio Data
GDP
HPI
Unemployment Rate
0.2 UnE
0.1 GDP
PD
Financial Institutions
Europe
Realistic but sever scenarios, provided by regulator or internally generated
Macroeconomic models. For banking book focussing on PD.
The book is broken down into different sub-portfolios by region or industry type
Quality of data including initial PDs also need to be looked at!
Data quality is often one of the major hurdles in model building and understanding the portfolio
9
© 2012 fintegral consulting•www.fintegral.com
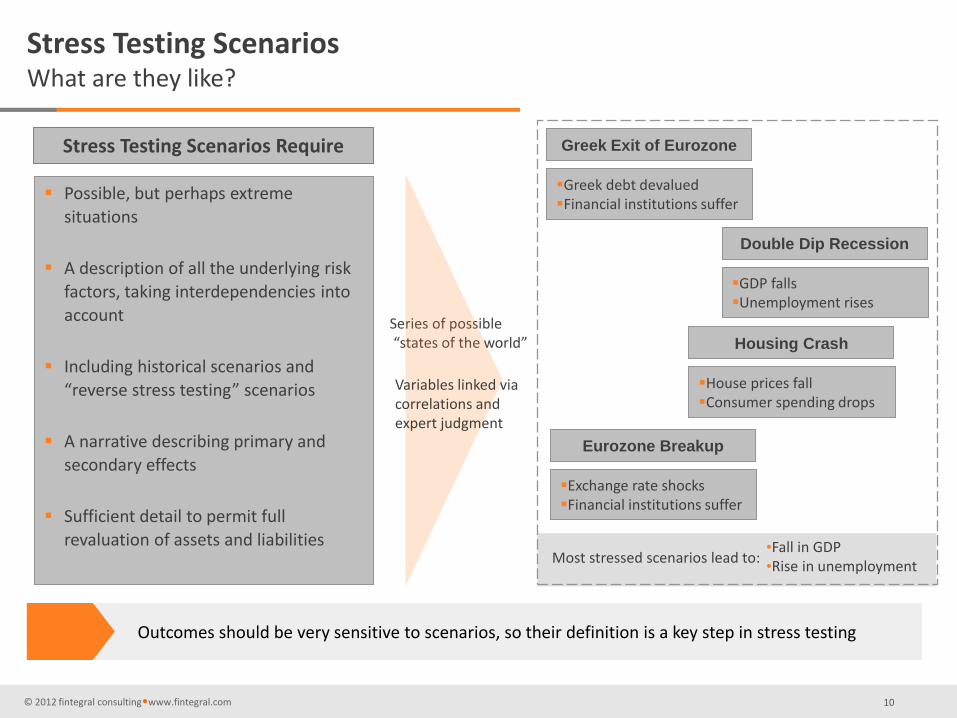
Stress Testing Scenarios What are they like?
Outcomes should be very sensitive to scenarios, so their definition is a key step in stress testing
Stress Testing Scenarios Require
Possible, but perhaps extreme
situations
A description of all the underlying risk
factors, taking interdependencies into
account
Including historical scenarios and
“reverse stress testing” scenarios
A narrative describing primary and
secondary effects
Sufficient detail to permit full
revaluation of assets and liabilities
Series of possible “states of the world”
Greek Exit of Eurozone
Greek debt devalued Financial institutions suffer
Variables linked via correlations and expert judgment
Double Dip Recession
GDP falls Unemployment rises
Housing Crash
House prices fall Consumer spending drops
Eurozone Breakup
Exchange rate shocks Financial institutions suffer
•Fall in GDP •Rise in unemployment
Most stressed scenarios lead to:
10
© 2012 fintegral consulting • www.fintegral.com
-20.00
-15.00
-10.00
-5.00
0.00
5.00
10.00
15.00
2006 2007 2008 2009 2010 2011 2012
UK Macro Core Obs
GDP yoy %
Unexmpl %
Halifax yoy %
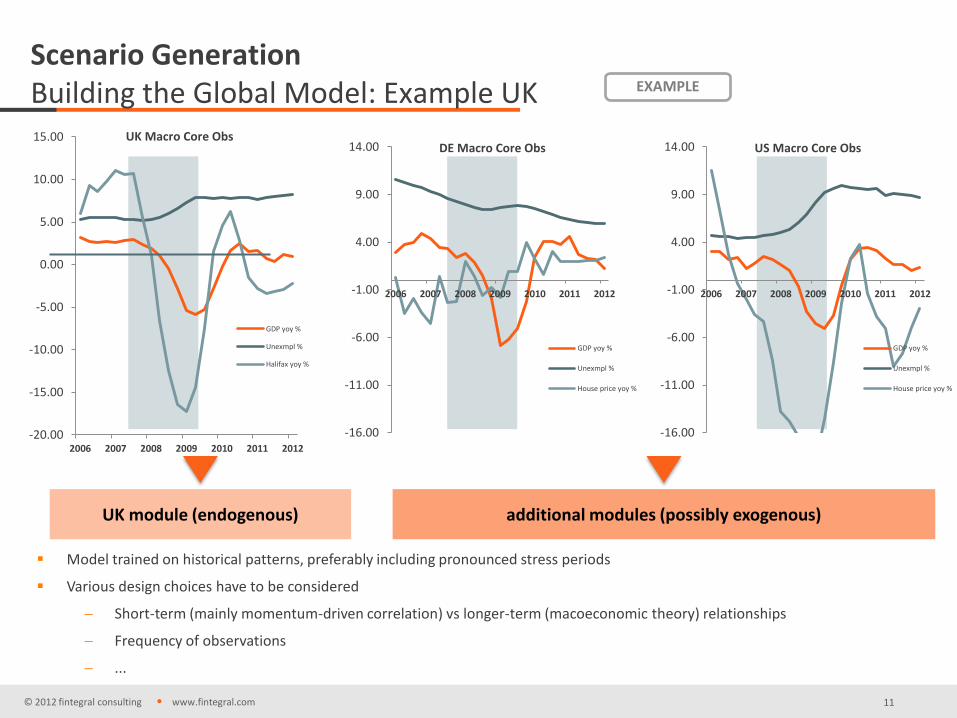
Scenario Generation Building the Global Model: Example UK EXAMPLE
UK module (endogenous)
Model trained on historical patterns, preferably including pronounced stress periods
Various design choices have to be considered
Short-term (mainly momentum-driven correlation) vs longer-term (macoeconomic theory) relationships
Frequency of observations
...
-16.00
-11.00
-6.00
-1.00
4.00
9.00
14.00
2006 2007 2008 2009 2010 2011 2012
DE Macro Core Obs
GDP yoy %
Unexmpl %
House price yoy %
-16.00
-11.00
-6.00
-1.00
4.00
9.00
14.00
2006 2007 2008 2009 2010 2011 2012
US Macro Core Obs
GDP yoy %
Unexmpl %
House price yoy %
additional modules (possibly exogenous)
11
© 2012 fintegral consulting • www.fintegral.com
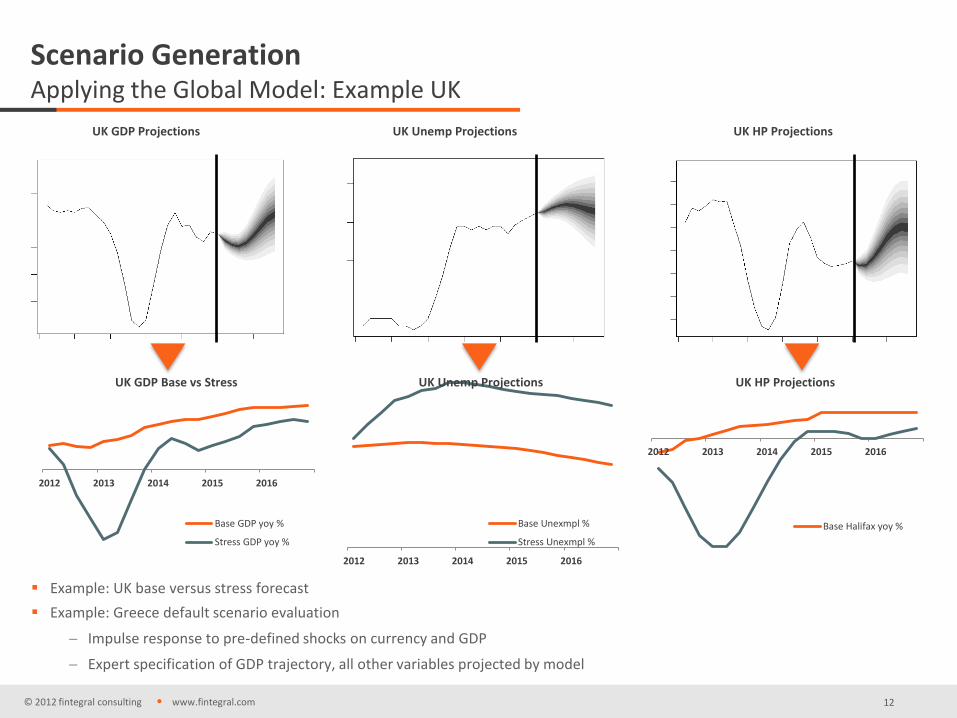
Scenario Generation Applying the Global Model: Example UK
Example: UK base versus stress forecast
Example: Greece default scenario evaluation
Impulse response to pre-defined shocks on currency and GDP
Expert specification of GDP trajectory, all other variables projected by model
2012 2013 2014 2015 2016
UK GDP Base vs Stress
Base GDP yoy %
Stress GDP yoy %
2012 2013 2014 2015 2016
UK Unemp Projections
Base Unexmpl %
Stress Unexmpl %
2012 2013 2014 2015 2016
UK HP Projections
Base Halifax yoy %
UK GDP Projections UK Unemp Projections UK HP Projections
12
© 2012 fintegral consulting•www.fintegral.com
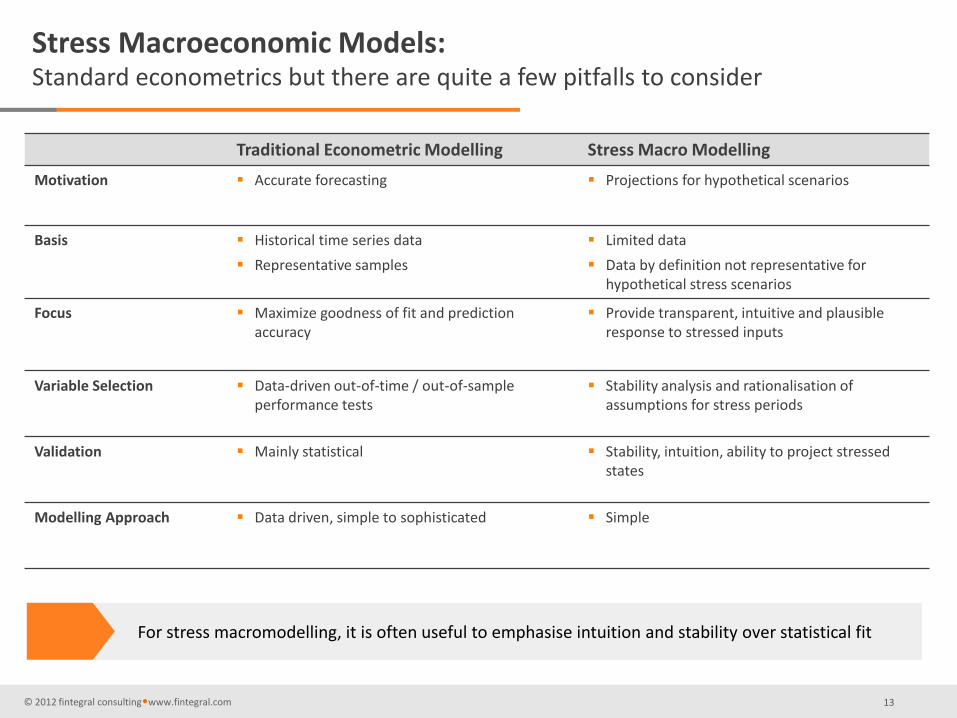
Stress Macroeconomic Models: Standard econometrics but there are quite a few pitfalls to consider
Traditional Econometric Modelling Stress Macro Modelling
Motivation Accurate forecasting Projections for hypothetical scenarios
Basis Historical time series data
Representative samples
Limited data
Data by definition not representative for hypothetical stress scenarios
Focus Maximize goodness of fit and prediction accuracy
Provide transparent, intuitive and plausible response to stressed inputs
Variable Selection Data-driven out-of-time / out-of-sample performance tests
Stability analysis and rationalisation of assumptions for stress periods
Validation Mainly statistical Stability, intuition, ability to project stressed states
Modelling Approach Data driven, simple to sophisticated Simple
For stress macromodelling, it is often useful to emphasise intuition and stability over statistical fit
13
© 2012 fintegral consulting•www.fintegral.com
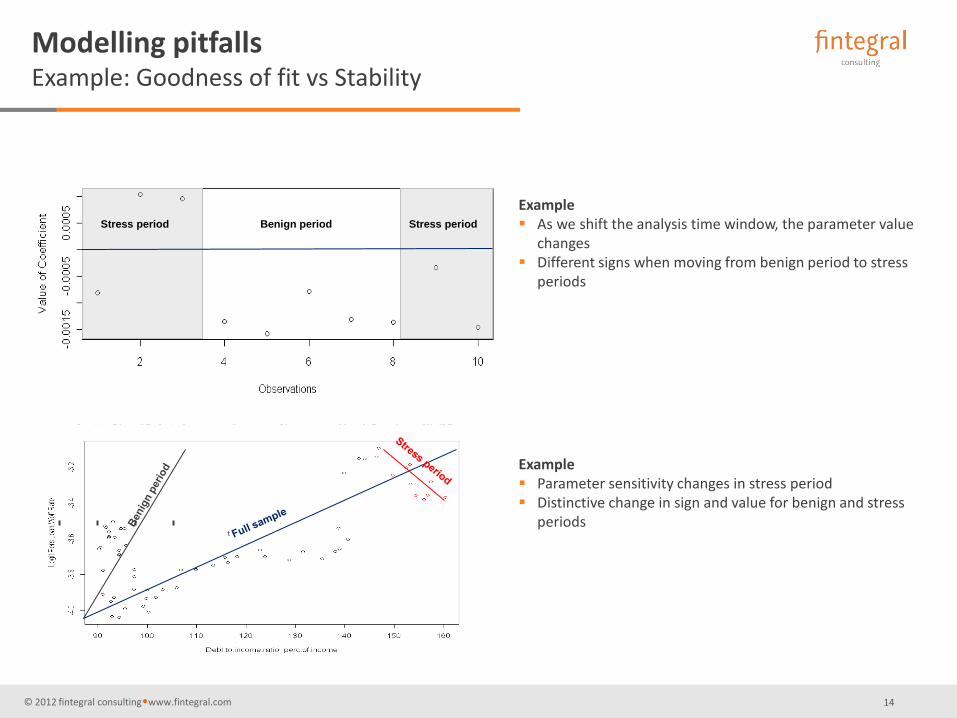
Modelling pitfalls Example: Goodness of fit vs Stability
Example As we shift the analysis time window, the parameter value
changes Different signs when moving from benign period to stress
periods
Stress period Benign period Stress period
Example Parameter sensitivity changes in stress period Distinctive change in sign and value for benign and stress
periods t
14
© 2012 fintegral consulting•www.fintegral.com
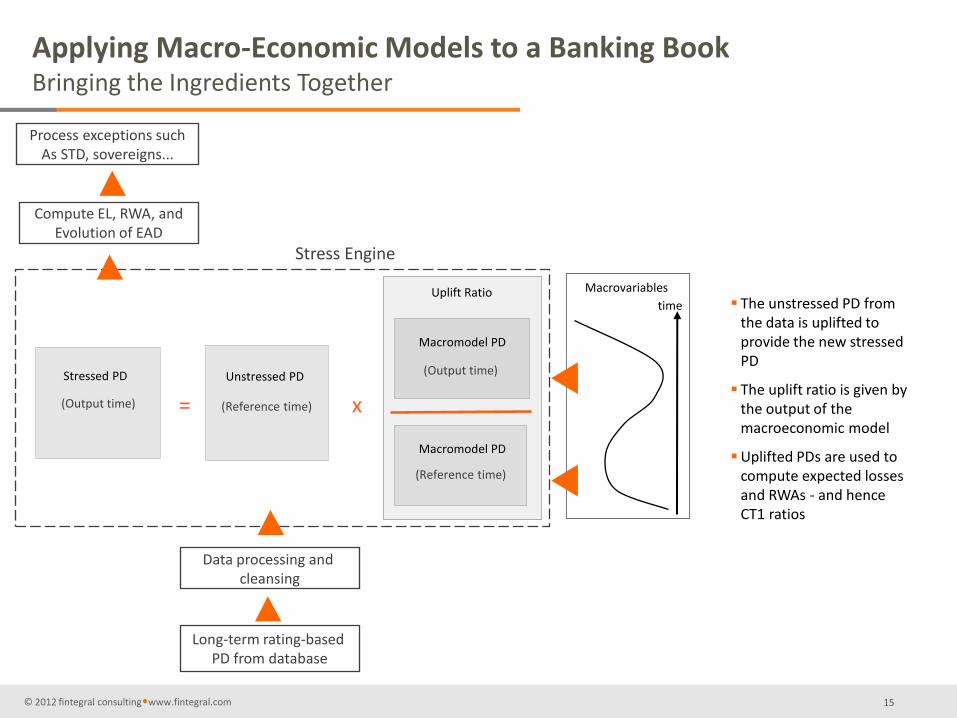
Stressed PD
= x
Uplift Ratio
(Output time)
Unstressed PD
(Reference time)
Macromodel PD
(Output time)
Macromodel PD
(Reference time)
Macrovariables
time
Long-term rating-based PD from database
Applying Macro-Economic Models to a Banking Book Bringing the Ingredients Together
The unstressed PD from the data is uplifted to provide the new stressed PD
The uplift ratio is given by the output of the macroeconomic model
Uplifted PDs are used to compute expected losses and RWAs - and hence CT1 ratios
Data processing and cleansing
Compute EL, RWA, and Evolution of EAD
Process exceptions such As STD, sovereigns...
Stress Engine
15
© 2012 fintegral consulting•www.fintegral.com
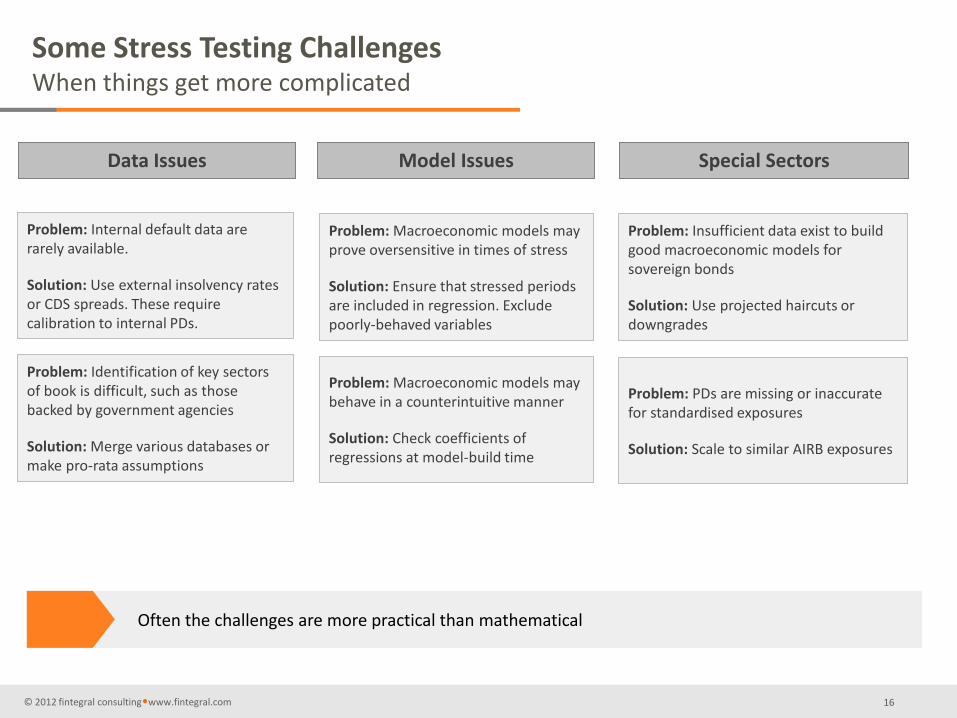
Some Stress Testing Challenges When things get more complicated
Data Issues Model Issues Special Sectors
Problem: Internal default data are rarely available.
Solution: Use external insolvency rates or CDS spreads. These require calibration to internal PDs.
Problem: Identification of key sectors of book is difficult, such as those backed by government agencies
Solution: Merge various databases or make pro-rata assumptions
Problem: Macroeconomic models may prove oversensitive in times of stress
Solution: Ensure that stressed periods are included in regression. Exclude poorly-behaved variables
Problem: Insufficient data exist to build good macroeconomic models for sovereign bonds
Solution: Use projected haircuts or downgrades
Problem: PDs are missing or inaccurate for standardised exposures
Solution: Scale to similar AIRB exposures
Problem: Macroeconomic models may behave in a counterintuitive manner
Solution: Check coefficients of regressions at model-build time
Often the challenges are more practical than mathematical
16
© 2012 fintegral consulting•www.fintegral.com 17
Implementation
© 2012 fintegral consulting•www.fintegral.com 18
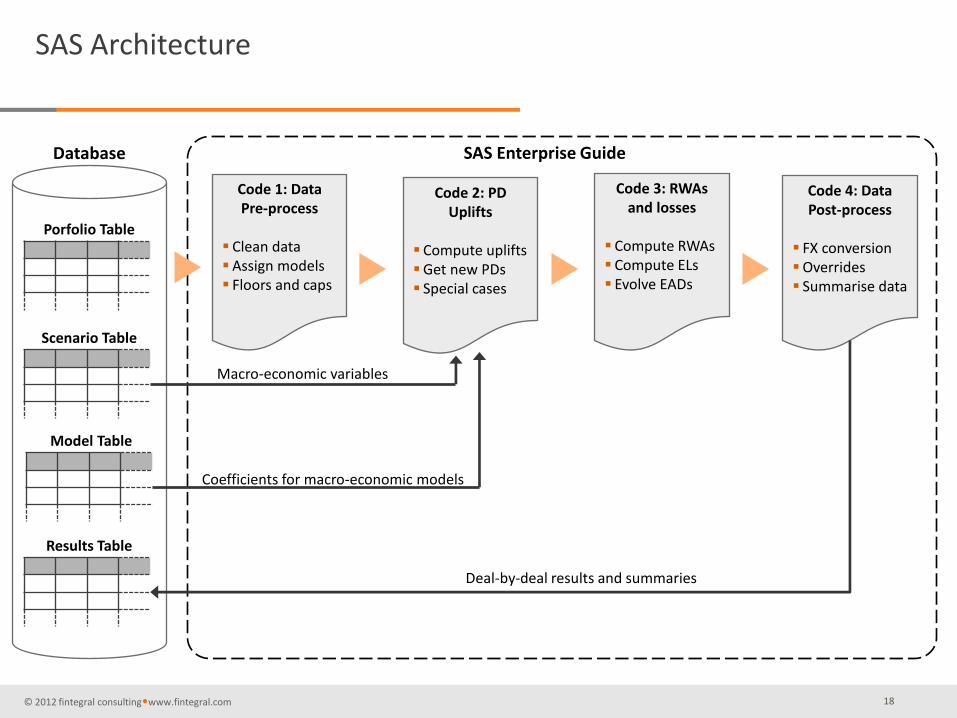
SAS Architecture
Database
Code 1: Data Pre-process
Clean data Assign models Floors and caps
Code 3: RWAs and losses
Compute RWAs Compute ELs Evolve EADs
Code 4: Data Post-process
FX conversion Overrides Summarise data
SAS Enterprise Guide
Porfolio Table
Scenario Table
Model Table
Results Table
Code 2: PD Uplifts
Compute uplifts Get new PDs Special cases
Deal-by-deal results and summaries
Coefficients for macro-economic models
Macro-economic variables
© 2012 fintegral consulting•www.fintegral.com 19
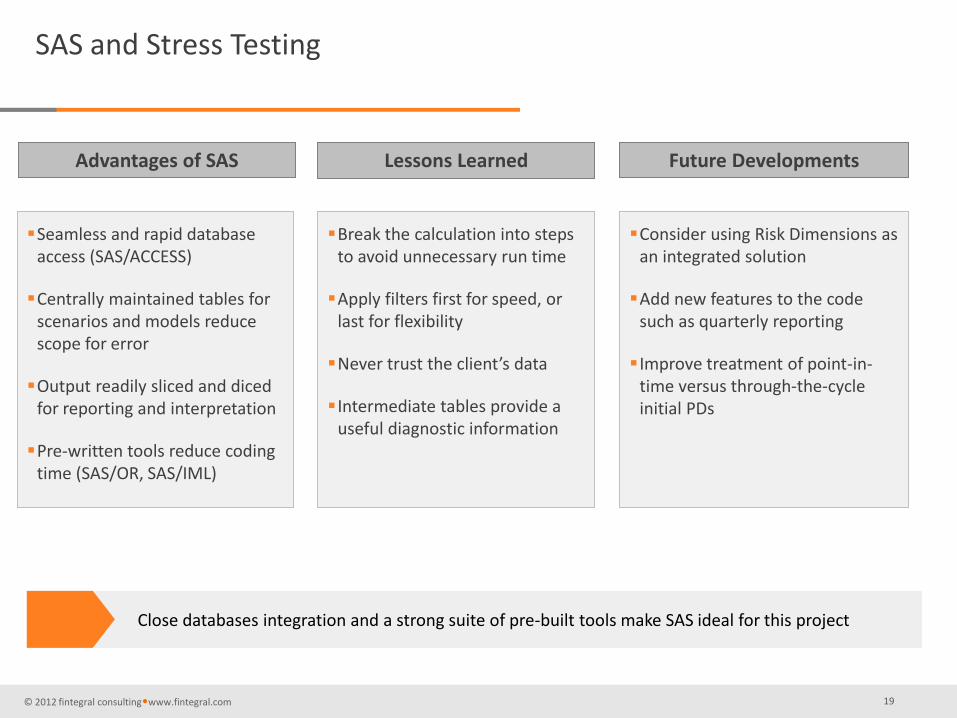
SAS and Stress Testing
Advantages of SAS Lessons Learned Future Developments
Seamless and rapid database access (SAS/ACCESS)
Centrally maintained tables for scenarios and models reduce scope for error
Output readily sliced and diced for reporting and interpretation
Pre-written tools reduce coding time (SAS/OR, SAS/IML)
Close databases integration and a strong suite of pre-built tools make SAS ideal for this project
Break the calculation into steps to avoid unnecessary run time
Apply filters first for speed, or last for flexibility
Never trust the client’s data
Intermediate tables provide a useful diagnostic information
Consider using Risk Dimensions as an integrated solution
Add new features to the code such as quarterly reporting
Improve treatment of point-in-time versus through-the-cycle initial PDs

© 2012 fintegral consulting•www.fintegral.com 20
Q&A

© 2012 fintegral consulting•www.fintegral.com
Fintegral Consulting London / Zürich