Embed Size (px)
Citation preview
Annual Report | for the year ended June 30, 2013
Saritow Spinning Mills Limited
U K A S QUALITY
MANAGEMENT
043-A
SO 900O I 1 T :2D 0E 00R E NT oS . I 16G 7E 6R
CONTENTS
Company Information
Vision and Mission Statement
Directors' Report to the Shareholders
Statement of Compliance with Best Practices of the Code of Corporate Governance
Review Report on Statement of Compliance Best Practices of the Code of Corporate Governance
with
Auditors' Report to the Members
Balance Sheet
Profit and Loss Account
Cash Flow Statement
Statement of Changes in Equity
Notes to and forming part of Financial Statements
Pattern of Shareholding
Form of Proxy
2
3
4
5
6
8
10
11
12
14
15
16
17
18
47
49
Notice of Annual General Meeting
Financial Highlights - Six Years at a Glance
Statement of Profit or Loss and Other Comprehensive Income
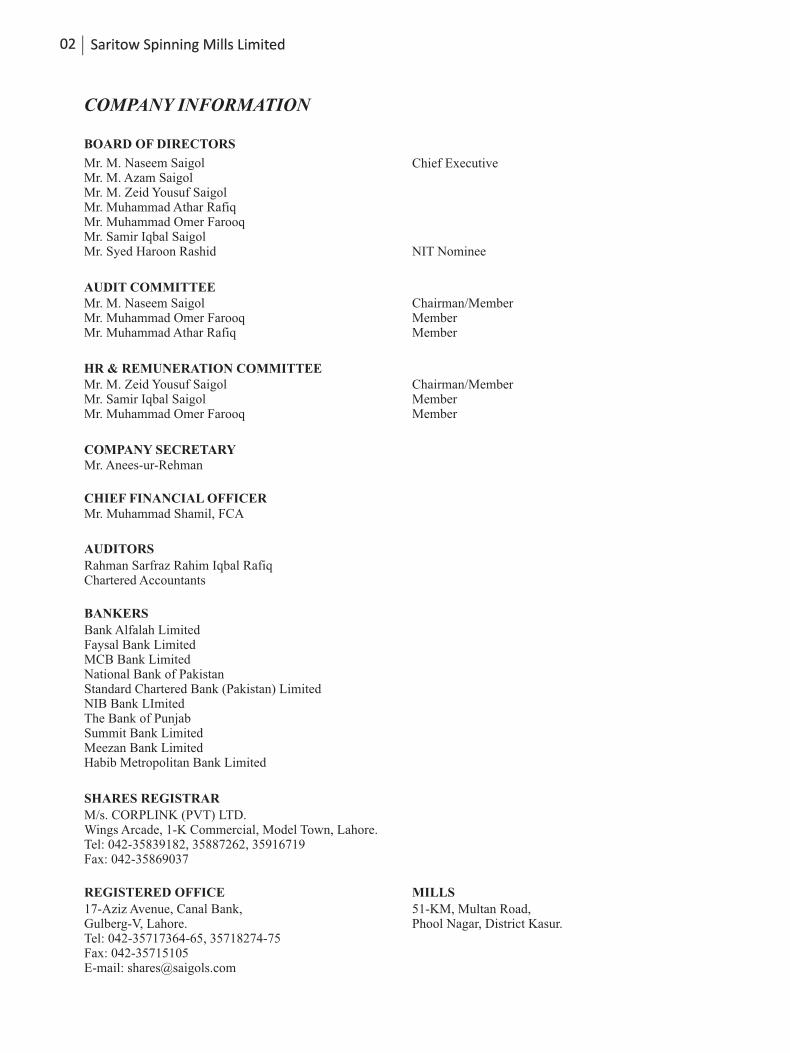
COMPANY INFORMATION
BOARD OF DIRECTORS
Mr. M. Naseem Saigol Mr. M. Azam SaigolMr. M. Zeid Yousuf Saigol Mr. Muhammad Athar RafiqMr. Muhammad Omer Farooq Mr. Samir Iqbal Saigol Mr. Syed Haroon Rashid
Chief Executive
NIT Nominee
COMPANY SECRETARY Mr. Anees-ur-Rehman
CHIEF FINANCIAL OFFICER Mr. Muhammad Shamil, FCA
AUDITORS Rahman Sarfraz Rahim Iqbal Rafiq Chartered Accountants
BANKERS Bank Alfalah LimitedFaysal Bank LimitedMCB Bank LimitedNational Bank of PakistanStandard Chartered Bank (Pakistan) LimitedNIB Bank LImited The Bank of Punjab Summit Bank LimitedMeezan Bank Limited Habib Metropolitan Bank Limited
SHARES REGISTRAR M/s. CORPLINK (PVT) LTD.Wings Arcade, 1-K Commercial, Model Town, Lahore.Tel: 042-35839182, 35887262, 35916719Fax: 042-35869037
17-Aziz Avenue, Canal Bank, Gulberg-V, Lahore. Tel: 042-35717364-65, 35718274-75Fax: 042-35715105 E-mail: [email protected]
REGISTERED OFFICE MILLS 51-KM, Multan Road, Phool Nagar, District Kasur.
AUDIT COMMITTEE Mr. M. Naseem Saigol Mr. Muhammad Omer Farooq Mr. Muhammad Athar Rafiq
Chairman/Member Member Member
HR & REMUNERATION COMMITTEE Mr. M. Zeid Yousuf Saigol Mr. Samir Iqbal SaigolMr. Muhammad Omer Farooq
Chairman/Member Member Member
02 Saritow Spinning Mills Limited

03Annual Report 2013
VISION
To accomplish, build up and sustain a good reputation of the
project in textile sector locally and globally by marketing
high quality of yarn through team work by means of honesty,
integrity and commitment.
MISSION
To transform the Company into a modern and dynamic Yarn
manufacturing Company and to provide quality products to
customers and explore new markets to promote / expand
sales of the Company through Good Governance and foster a
sound and dynamic team, so as to achieve optimum
profitability for the Company for sustainable and equitable
growth and prosperity of the Company.

By Order of the Board
Company Secretary
NOTICE OF ANNUAL GENERAL MEETING
Lahore : October 10, 2013
Notice is hereby given that the 27th Annual General Meeting of Shareholders of Saritow Spinning Mills Limited will be held on Thursday, October 31, 2013 at 10:00 A.M.at17-Aziz Avenue, Canal Bank, Gulberg-V, Lahore the Registered Office of the Company to transact the following business:-
1. To confirm the minutes of the last Annual General Meeting held on October 31, 2012.
2. To receive and adopt the Annual Audited Accounts for the year ended June 30, 2013 alongwith Directors' and Auditors' Reports thereon.
3. To consider and, if thought fit, approve the cash dividend @ Re. 1/- Per share, i.e. 10% (Excluding Sponsor Shareholders)
4. To appoint Auditors of the Company to hold office till the conclusion of next Annual General Meeting and to fix their remuneration.
5. Any other business with the permission of the Chair.
Notes:
1. Share Transfer Books of the Company will remain closed from October 24, 2013 to October 30, 2013 (both days inclusive), for determining the entitlement of 10% Cash dividend. Physical transfers/CDS transactions ID's received in order at "Company Registrar office M/s Corplink (Pvt.) Limited", wings arcade, 1-K, Commercial Model Town, Lahore on October 23, 2013 will be treated in time for entitlement of 10% Cash Dividend.
2. A member entitled to attend and vote at this Meeting may appoint another Member as his/her proxy. Proxies in order to be effective, must be received at 17-Aziz Avenue, Canal Bank, Gulberg-V, Lahore the Registered Office of the Company not later than forty-eight hours before the time for holding the meeting and must be duly stamped, signed and witnessed.
3. Members whose shares are deposited with Central Depository System are requested to bring their original National Identity Cards or original Passports along with their Account Numbers in Central Depository System for attending the meeting.
4. Members are requested to notify the Company change in their addresses, if any.
04 Saritow Spinning Mills Limited
05Annual Report 2013
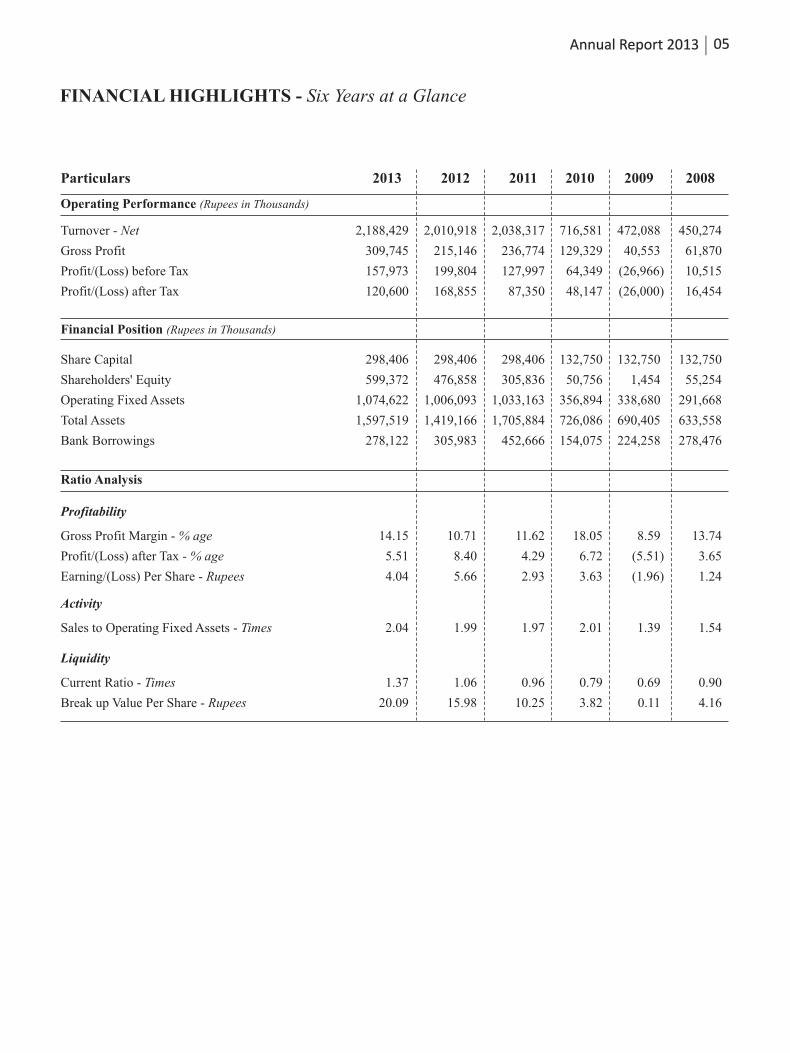
FINANCIAL HIGHLIGHTS - Six Years at a Glance
Turnover - Net
Gross Profit
Profit/(Loss) before Tax
Profit/(Loss) after Tax
Share Capital
Shareholders' Equity
Operating Fixed Assets
Total Assets
Bank Borrowings
Ratio Analysis
Profitability
Gross Profit Margin - % age
Profit/(Loss) after Tax - % age
Earning/(Loss) Per Share - Rupees
Particulars
Activity
Sales to Operating Fixed Assets - Times
Liquidity
Current Ratio - Times
Break up Value Per Share - Rupees
Operating Performance (Rupees in Thousands)
Financial Position (Rupees in Thousands)
2008
450,274
61,870
10,515
16,454
132,750
55,254
291,668
633,558
278,476
13.74
3.65
1.24
1.54
0.90
4.16
2009
472,088
40,553
(26,966)
(26,000)
132,750
1,454
338,680
690,405
224,258
8.59
(5.51)
(1.96)
1.39
0.69
0.11
2010
716,581
129,329
64,349
48,147
132,750
50,756
356,894
726,086
154,075
18.05
6.72
3.63
2.01
0.79
3.82
2011
2,038,317
236,774
127,997
87,350
298,406
305,836
1,033,163
1,705,884
452,666
11.62
4.29
2.93
1.97
0.96
10.25
20122013
2,010,9182,188,429
215,146309,745
199,804157,973
168,855120,600
298,406298,406
476,858599,372
1,006,0931,074,622
1,419,1661,597,519
305,983278,122
10.71
8.40
5.66
14.15
5.51
4.04
1.992.04
1.06
15.98
1.37
20.09
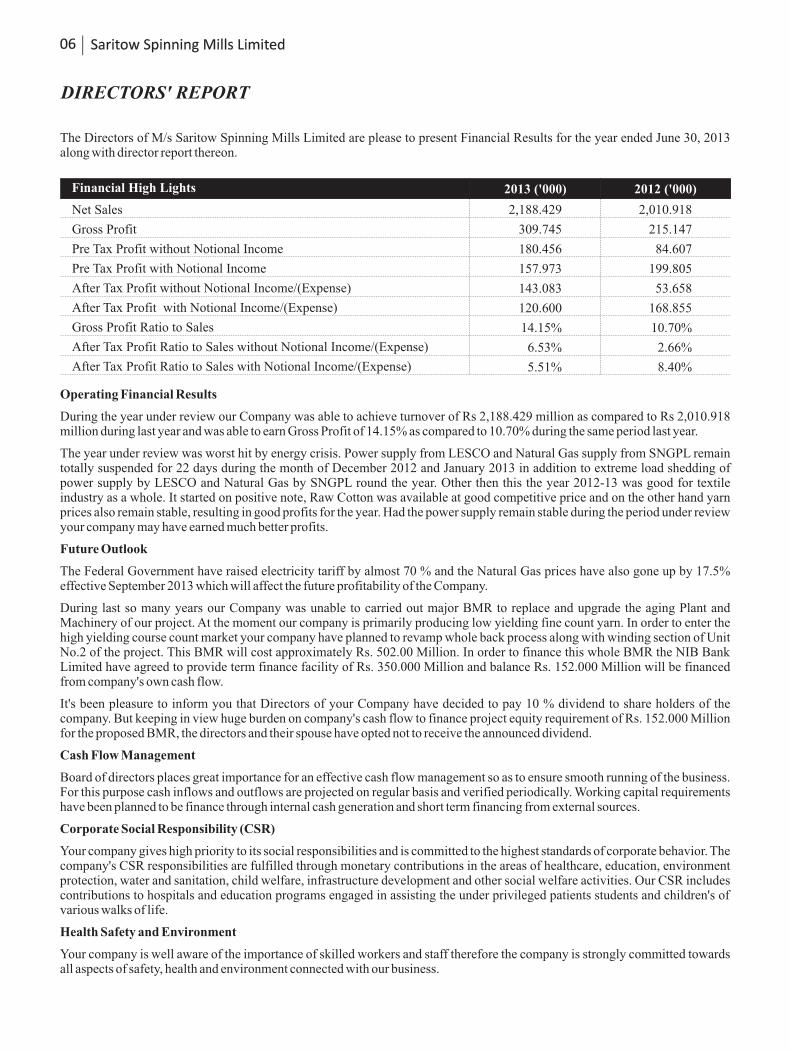
DIRECTORS' REPORT
Net Sales
Gross Profit
Pre Tax Profit without Notional Income
After Tax Profit without Notional Income/(Expense)
Gross Profit Ratio to Sales
After Tax Profit Ratio to Sales without Notional Income/(Expense)
After Tax Profit Ratio to Sales with Notional Income/(Expense)
2013 ('000) 2012 ('000) Financial High Lights
Pre Tax Profit with Notional Income
After Tax Profit with Notional Income/(Expense)
2,188.429
309.745
180.456
157.973
143.083
120.600
14.15%
6.53%
5.51%
2,010.918
215.147
84.607
199.805
53.658
168.855
10.70%
2.66%
8.40%
The Directors of M/s Saritow Spinning Mills Limited are please to present Financial Results for the year ended June 30, 2013 along with director report thereon.
Operating Financial Results
During the year under review our Company was able to achieve turnover of Rs 2,188.429 million as compared to Rs 2,010.918 million during last year and was able to earn Gross Profit of 14.15% as compared to 10.70% during the same period last year.
The year under review was worst hit by energy crisis. Power supply from LESCO and Natural Gas supply from SNGPL remain totally suspended for 22 days during the month of December 2012 and January 2013 in addition to extreme load shedding of power supply by LESCO and Natural Gas by SNGPL round the year. Other then this the year 2012-13 was good for textile industry as a whole. It started on positive note, Raw Cotton was available at good competitive price and on the other hand yarn prices also remain stable, resulting in good profits for the year. Had the power supply remain stable during the period under review your company may have earned much better profits.
Future Outlook
The Federal Government have raised electricity tariff by almost 70 % and the Natural Gas prices have also gone up by 17.5% effective September 2013 which will affect the future profitability of the Company.
During last so many years our Company was unable to carried out major BMR to replace and upgrade the aging Plant and Machinery of our project. At the moment our company is primarily producing low yielding fine count yarn. In order to enter the high yielding course count market your company have planned to revamp whole back process along with winding section of Unit No.2 of the project. This BMR will cost approximately Rs. 502.00 Million. In order to finance this whole BMR the NIB Bank Limited have agreed to provide term finance facility of Rs. 350.000 Million and balance Rs. 152.000 Million will be financed from company's own cash flow.
It's been pleasure to inform you that Directors of your Company have decided to pay 10 % dividend to share holders of the company. But keeping in view huge burden on company's cash flow to finance project equity requirement of Rs. 152.000 Million for the proposed BMR, the directors and their spouse have opted not to receive the announced dividend.
Cash Flow Management
Board of directors places great importance for an effective cash flow management so as to ensure smooth running of the business. For this purpose cash inflows and outflows are projected on regular basis and verified periodically. Working capital requirements have been planned to be finance through internal cash generation and short term financing from external sources.
Corporate Social Responsibility (CSR)
Your company gives high priority to its social responsibilities and is committed to the highest standards of corporate behavior. The company's CSR responsibilities are fulfilled through monetary contributions in the areas of healthcare, education, environment protection, water and sanitation, child welfare, infrastructure development and other social welfare activities. Our CSR includes contributions to hospitals and education programs engaged in assisting the under privileged patients students and children's of various walks of life.
Health Safety and Environment
Your company is well aware of the importance of skilled workers and staff therefore the company is strongly committed towards all aspects of safety, health and environment connected with our business.
06 Saritow Spinning Mills Limited
07Annual Report 2013
Lahore : October 09, 2013
For and on behalf of the Board
CHIEF EXECUTIVE
Statement in Compliance of the Code of Corporate Governance
- The Financial Statements, prepared by the management, present a true and fair state of affairs of the company, the results of its operations, cash flows and changes in equity.
- Proper books of accounts of the Company have been maintained.
- Appropriate accounting policies have been consistently applied in preparation of financial statements and accounting estimates are based on reasonable and prudent judgment.
- International Accounting Standards, as applicable in Pakistan, have been followed in preparation of financial statements.
- The system of internal control is sound in design and has been effectively implemented and monitored.
- There are no significant doubts upon the Company's ability to continue as a going concern.
- There has been no material departure from the best practices of corporate governance, as detailed in the listing regulations.
- There are no outstanding statutory payments on account of duties, levies and charges.
- Significant deviation from last year in operating results of the Company and reasons thereof have been explained.
- The Key Operating and Financial Data of last six years is attached to the Report.
- There are no significant plans for corporate restructuring and discontinuation of operations except for improvement in the normal business activities to increase the business.
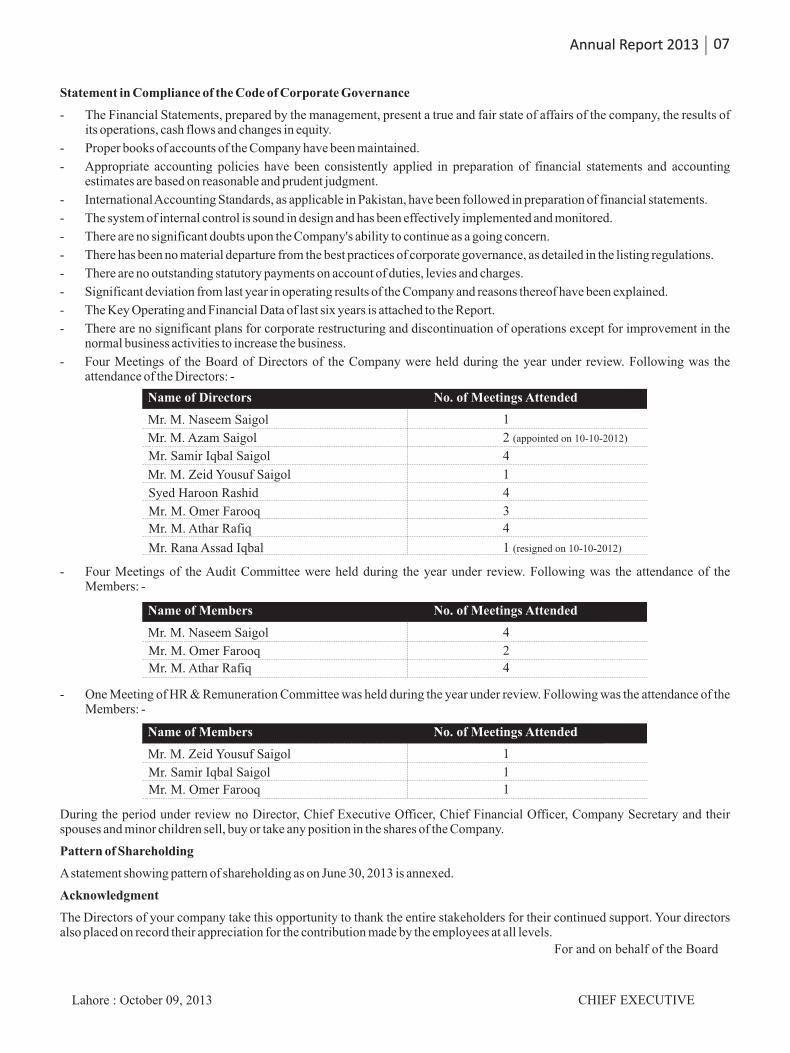
- Four Meetings of the Board of Directors of the Company were held during the year under review. Following was the attendance of the Directors: -
Name of Members
Name of Members
Mr. M. Naseem Saigol
Mr. M. Zeid Yousuf Saigol
4
1
Mr. M. Omer Farooq
Mr. Samir Iqbal Saigol
2
1
No. of Meetings Attended
No. of Meetings Attended
Mr. M. Athar Rafiq
Mr. M. Omer Farooq
4
1
Name of Directors
Mr. M. Naseem Saigol 1
Mr. M. Azam Saigol 2 (appointed on 10-10-2012)
Mr. Samir Iqbal Saigol
1
Syed Haroon Rashid 4
Mr. M. Omer Farooq 3
Mr. Rana Assad Iqbal 1 (resigned on 10-10-2012)
No. of Meetings Attended
Mr. M. Zeid Yousuf Saigol
4
Mr. M. Athar Rafiq 4
- Four Meetings of the Audit Committee were held during the year under review. Following was the attendance of the Members: -
- One Meeting of HR & Remuneration Committee was held during the year under review. Following was the attendance of the Members: -
During the period under review no Director, Chief Executive Officer, Chief Financial Officer, Company Secretary and their spouses and minor children sell, buy or take any position in the shares of the Company.
Pattern of Shareholding
A statement showing pattern of shareholding as on June 30, 2013 is annexed.
Acknowledgment
The Directors of your company take this opportunity to thank the entire stakeholders for their continued support. Your directors also placed on record their appreciation for the contribution made by the employees at all levels.
STATEMENT OF COMPLIANCE WITH THE BEST PRACTICES OF THE CODE OF CORPORATE GOVERNANCE
This statement is being presented to comply with the code of Corporate Governance contained in regulation No. 37, 43 & 36 of listing regulations of Karachi, Lahore & Islamabad Stock Exchanges respectively for the purpose of establishing a framework of good governance, whereby a listed company is managed in compliance with the best of practices of corporate governance.
The company has applied the principles contained in the CCG in the following manner:
1. The company encourages representation of independent non-executive directors and directors representing minority interests on its board of directors. At present the board includes:
Category Names
Independent Directors
Executive Directors
Non-Executive Directors
N/A
Mr. Samir Iqbal Saigol
Mr. M. Azam Saigol
Mr. M. Naseem Saigol
Mr. M. Zeid Yousuf Saigol
Mr. Muhammad Athar Rafiq
Mr. Muhammad Omer Farooq
Mr. Syed Haroon Rashid
The independent directors meeting the criteria of independence under clause I (b) of the CCG will be appointed in the election of directors due on March 24, 2015.
2. The directors have confirmed that none of them is serving as a director in more than seven listed companies, including this Company.
3. All the resident directors of the Company are registered as taxpayers and none of them has defaulted in the payment of any loan to a banking company, a DFI or an NBFI or, being a member of a stock exchange, has been declared as a defaulter by that stock exchange.
4. A casual vacancy occurring on the board on October 10, 2012 was filled up by the directors on the same day.
5. The Company has prepared a "Code of Conduct" and has ensured that appropriate steps have been taken to disseminate it throughout the company along with its supporting policies and procedures.
6. The Board has developed a vision/mission statement, overall corporate strategy and significant policies of the company. A complete record of particulars of significant policies along with the dates on which they were approved or amended has been maintained.
7. All the powers of the Board have been duly exercised and decisions on material transactions including appointment and determination of remuneration and terms and conditions of employment of the CEO, other executive and non-executive directors, have been taken by the Board/shareholders.
8. The meetings of the Board were presided over by the Chairman and, in his absence, by a director elected by the Board for this purpose and the Board met at least once in every quarter. Written notices of the Board meetings, along with agenda and working papers, were circulated at least seven days before the meetings. The minutes of the meetings were appropriately recorded and circulated.
9. The board arranged one training program for its director during the year.
10. The Board has approved appointment of CFO, Company Secretary and Head of Internal Audit, including their remuneration and terms and conditions of employment.
11. The Director's report for this year has been prepared in compliance with the requirements of the CCG and fully describes the salient matters required to be disclosed.
08 Saritow Spinning Mills Limited
09Annual Report 2013
Lahore : October 09, 2013
For and on behalf of the Board
CHIEF EXECUTIVE
12. Financial statements of the company were duly endorsed by CEO and CFO before approval of the Board.
13. The directors, CEO and executives do not hold any interest in the shares of the Company other than that disclosed in the pattern of shareholding.
14. The Company has complied with all the corporate and financial reporting requirements of the CCG.
15. The Board has formed an audit committee. It comprises of three members, of whom three are non executive directors including the chairman of the committee.
16. The meetings of the audit committee were held at least once every quarter prior to approval of interim and final results of the Company as required by the CCG. The terms of reference of the committee have been formed and advised to the committee for compliance.
17. The Board has formed an HR and remuneration committee. Its comprises three members, of whom two are none executive directors including the chairman of the committee.
18. The board has set up an effective internal audit function who are considered suitably qualified and experienced for the purpose and are conversant with the policies and procedures of the company.
19. The statutory auditors of the Company have confirmed that they have been given a satisfactory rating under the Quality Control Review program of the ICAP, that they or any of the partner of the firm, their spouses and minor children do not hold shares of the Company and that the firm and all its partners are in compliance with International Federation of Accountants (IFAC) guidelines on code of ethics as adopted by ICAP.
20. The statutory auditors or the persons associated with them have not been appointed to provide other services except in accordance with the listing regulations and the auditors have confirmed that they have observed IFAC guidelines in this regards.
21. The 'closed period' prior to the announcement of interim/final results, and business decisions, which may materially affect the market price of company's securities, was determined and intimated to directors, employees and stock exchange(s).
22. Material/price sensitive information has been disseminated among all market participants at once through stock exchange(s).
23. We confirm that all other material principles enshrined in the CCG have been complied with.
RAHMAN SARFARAZ RAHIM IQBAL RAFIQChartered Accountants
Engagement Partner: ZUBAIR IRFAN MALIK
Date: OCTOBER 09, 2013Place: LAHORE
REVIEW REPORT ON STATEMENT OF COMPLIANCE WITH BEST PRACTICES OF CODE OF CORPORATE GOVERNANCE
We have reviewed the Statement of Compliance with the best practices contained in the Code of Corporate Governance prepared by the Board of Directors of SARITOW SPINNING MILLS LIMITED ("the Company") to comply with the listing regulation No. 35 of Karachi Stock Exchange Limited and Lahore Stock Exchange Limited, where the Company is listed.
The responsibility for compliance with the Code of Corporate Governance is that of the Board of Directors of the Company. Our responsibility is to review, to the extent where such compliance can be objectively verified, whether the Statement of Compliance reflects the status of the Company's compliance with the provisions of the Code of Corporate Governance and report if it does not. A review is limited primarily to inquiries of the Company personnel and review of various documents prepared by the Company to comply with the Code.
As part of our audit of financial statements we are required to obtain an understanding of the accounting and internal control systems sufficient to plan the audit and develop an effective audit approach. We are not required to consider whether the Board's statement on internal control covers all risks and controls, or to form an opinion on the effectiveness of such internal controls, the Company's corporate governance procedures and risks.
There were no related party transactions falling within the ambit of the Sub-Regulation (x) of the Listing Regulation 35 of Karachi Stock Exchange Limited and Lahore Stock Exchange Limited, where the Company is listed other than loan from directors and their family members and rental income.
Based on our review, nothing has come to our attention which causes us to believe that the Statement of Compliance does not appropriately reflect the Company's compliance, in all material respects, with the best practices contained in the code of corporate governance for the year ended June 30, 2013.
10 Saritow Spinning Mills Limited
RAHMAN SARFARAZ RAHIM IQBAL RAFIQChartered Accountants
Engagement Partner: ZUBAIR IRFAN MALIK
Date: OCTOBER 09, 2013Place: LAHORE
We have audited the annexed balance sheet of SARITOW SPINNING MILLS LIMITED ("the Company") as at June 30, 2013 and the related profit and loss account, statement of profit or loss and other comprehensive income, cash flow statement and statement of changes in equity together with the notes forming part thereof, for the year then ended and we state that we have obtained all the information and explanations which, to the best of our knowledge and belief, were necessary for the purpose of our audit.
It is the responsibility of the Company's management to establish and maintain a system of internal control, and prepare and present the above said statements in conformity with the approved accounting standards and the requirements of the Companies Ordinance, 1984. Our responsibility is to express an opinion on these statements based on our audit.
We conducted our audit in accordance with the auditing standards as applicable in Pakistan. These standards require that we plan and perform the audit to obtain reasonable assurance about whether the above said statements are free of any material misstatement. An audit includes examining on a test basis, evidence supporting the amounts and disclosures in the above said statements. An audit also includes assessing the accounting policies and significant estimates made by management, as well as, evaluating the overall presentation of the above said statements. We believe that our audit provides a reasonable basis for our opinion and, after due verification, we report that-
a) in our opinion, proper books of accounts have been kept by the Company as required by the Companies Ordinance, 1984;
b) in our opinion-
i. the balance sheet and profit and loss account together with the notes thereon have been drawn up in conformity with the Companies Ordinance, 1984, and are in agreement with the books of accounts and are further in accordance with accounting policies consistently applied;
ii. the expenditure incurred during the year was for the purpose of the Company's business; and
iii. the business conducted, investments made and the expenditure incurred during the year were in accordance with the objects of the Company;
c) in our opinion and to the best of our information and according to the explanations given to us, the balance sheet, profit and loss account, statement of profit or loss and other comprehensive income, cash flow statement and statement of changes in equity together with the notes forming part thereof conform with approved accounting standards as applicable in Pakistan, and, give the information required by the Companies Ordinance, 1984, in the manner so required and respectively give a true and fair view of the state of the Company's affairs as at June 30, 2013 and of the profit, other comprehensive income, its cash flows and changes in equity for the year then ended; and
d) in our opinion, no Zakat was deductible at source under the Zakat and Ushr Ordinance, 1980 (XVIII of 1980.)
AUDITORS' REPORT TO THE MEMBERS
11Annual Report 2013

BALANCE SHEET as at June 30, 2013
LahoreDate: October 09, 2013 CHIEF EXECUTIVE
Note 2013 2012
Rupees Rupees
EQUITY AND LIABILITIES
SHARE CAPITAL AND RESERVES
Authorized share capital
35,000,000 (2012: 35,000,000) ordinary shares of Rs. 10 each
Issued, subscribed and paid-up capital 6
Accumulated profit
TOTAL EQUITY
SURPLUS ON REVALUATION OF PROPERTY, PLANT AND EQUIPMENT 7
LOAN FROM DIRECTORS AND FAMILY MEMBERS - UNSECURED, SUBORDINATE 8
NON-CURRENT LIABILITIES
Long term finances - Secured 9
Liabilities against assets subject to finance lease - Secured 10
Long term deposits - Unsecured 11
Employees retirement benefits 12
Deferred taxation 13
CURRENT LIABILITIES
Trade and other payables 14
Accrued interest/mark-up
Short term borrowings - Secured 15
Current portion of non-current liabilities 16
Current tax liability 17
TOTAL LIABILITIES
CONTINGENCIES AND COMMITMENTS 18
The annexed notes 1 to 48 form an integral part of these financial statements.
350,000,000
298,406,070
300,966,595
599,372,665
76,515,348
173,170,520
57,091,395
61,764,706
8,000,000
29,399,306
223,050,095
379,305,502
174,702,605
16,353,300
110,722,646
48,543,523
18,833,829
369,155,903
748,461,405
-
1,597,519,938
350,000,000
298,406,070
178,451,690
476,857,760
78,429,877
150,687,887
85,506,419
-
8,000,000
29,439,575
216,826,262
339,772,256
134,524,355
15,625,522
154,742,636
65,734,556
2,791,355
373,418,424
713,190,680
-
1,419,166,204
12 Saritow Spinning Mills Limited

DIRECTOR
Note 2013 2012
Rupees Rupees
19 1,074,622,209 1,006,093,165
20 15,989,766 14,373,910
1,090,611,975 1,020,467,075
21 19,459,940 13,330,454
22 369,678,225 280,650,629
22,256,811 33,750,748
23 74,869,488 54,711,630
24 20,643,499 16,255,668
506,907,963 398,699,129
1,597,519,938 1,419,166,204
ASSETS
NON-CURRENT ASSETS
Property, plant and equipment
Long term deposits - Unsecured, considered good
CURRENT ASSETS
Stores, spares and loose tools
Stock in trade
Trade receivables - Unsecured, considered good
Advances, prepayments and other receivables
Cash and bank balances
TOTAL ASSETS
13Annual Report 2013

PROFIT AND LOSS ACCOUNT for the year ended June 30, 2013
Note 2013 2012
Rupees Rupees
LahoreDate: October 09, 2013 CHIEF EXECUTIVE DIRECTOR
Turnover - net 25 2,010,918,031
Cost of sales 26 1,795,771,458
Gross profit 215,146,573
Selling and distribution expenses 27 5,001,155
Administrative and general expenses 28 50,164,067
55,165,222
Other income - net 29 1,150,957
Operating profit 161,132,308
Finance cost 30 70,182,498
Other charges 31 6,341,961
76,524,459
Notional interest (expense)/income 8.2 115,197,079
Profit before taxation 199,804,928
Taxation 32 30,949,944
Profit after taxation 168,854,984
Earnings per share - basic and diluted 33
2,188,428,877
1,878,683,517
309,745,360
4,058,959
54,933,687
58,992,646
950,707
251,703,421
58,211,209
13,036,661
71,247,870
(22,482,633)
157,972,918
37,372,542
120,600,376
4.04 5.66
The annexed notes 1 to 48 form an integral part of these financial statements.
14 Saritow Spinning Mills Limited
Note 2013 2012)
Rupees Rupees
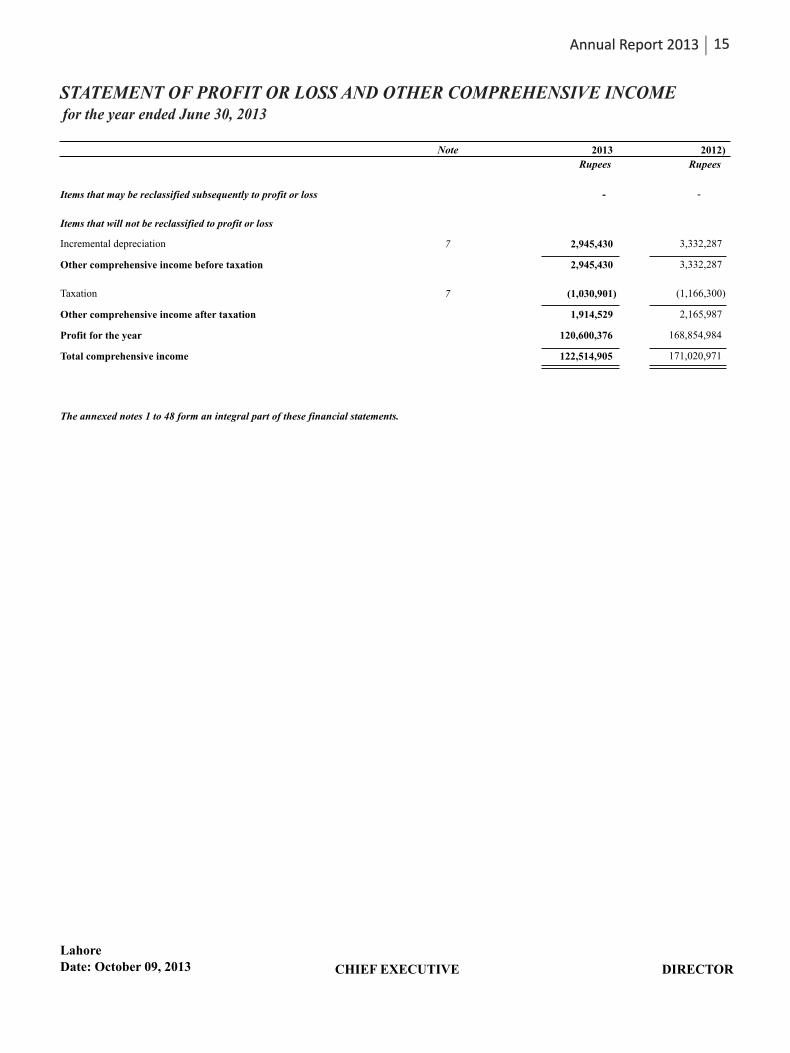
STATEMENT OF PROFIT OR LOSS AND OTHER COMPREHENSIVE INCOMEfor the year ended June 30, 2013
LahoreDate: October 09, 2013 CHIEF EXECUTIVE DIRECTOR
Items that may be reclassified subsequently to profit or loss - -
Items that will not be reclassified to profit or loss
Incremental depreciation 7
Other comprehensive income before taxation
Taxation 7
Other comprehensive income after taxation
Profit for the year
Total comprehensive income
2,945,430
2,945,430
(1,030,901)
1,914,529
120,600,376
122,514,905
3,332,287
3,332,287
(1,166,300)
2,165,987
168,854,984
171,020,971
The annexed notes 1 to 48 form an integral part of these financial statements.
15Annual Report 2013
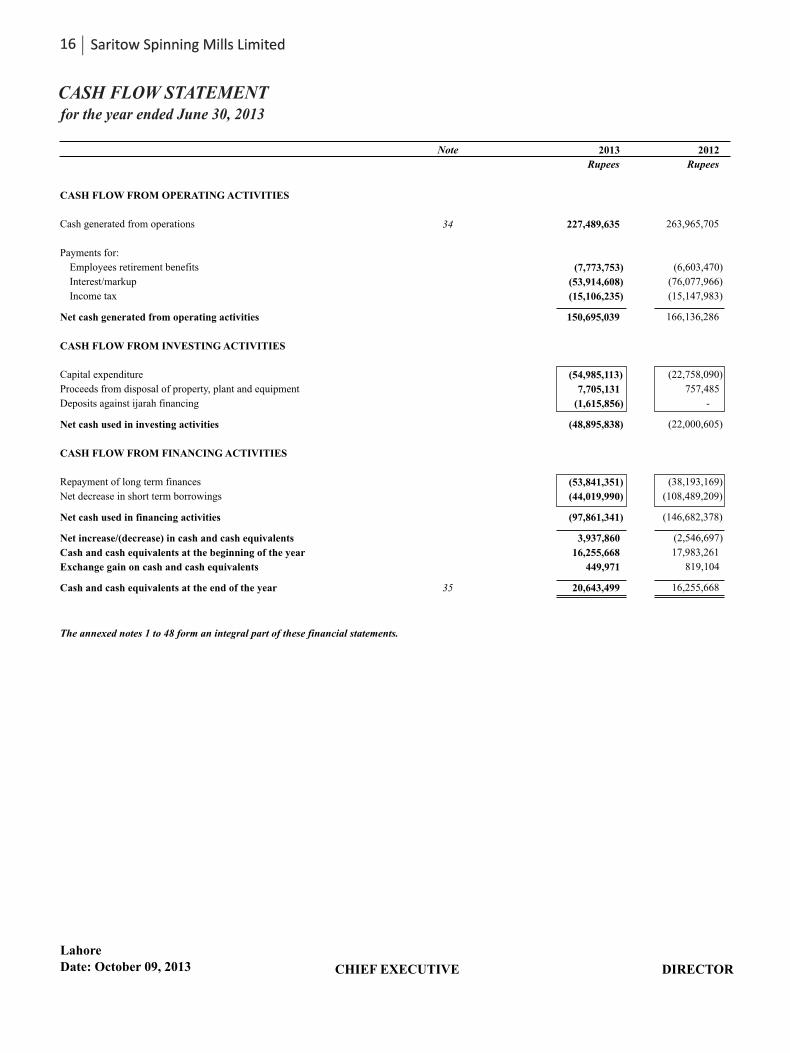
CASH FLOW STATEMENT for the year ended June 30, 2013
LahoreDate: October 09, 2013 CHIEF EXECUTIVE DIRECTOR
Note 2013 2012
Rupees Rupees
CASH FLOW FROM OPERATING ACTIVITIES
Cash generated from operations 34
Payments for:
Employees retirement benefits
Interest/markup
Income tax
Net cash generated from operating activities
CASH FLOW FROM INVESTING ACTIVITIES
Capital expenditure
Proceeds from disposal of property, plant and equipment
Deposits against ijarah financing
Net cash used in investing activities
CASH FLOW FROM FINANCING ACTIVITIES
Repayment of long term finances
Net decrease in short term borrowings
Net cash used in financing activities
Net increase/(decrease) in cash and cash equivalents
Cash and cash equivalents at the beginning of the year
Exchange gain on cash and cash equivalents
Cash and cash equivalents at the end of the year 35
227,489,635
(7,773,753)
(53,914,608)
(15,106,235)
150,695,039
(54,985,113)
7,705,131
(1,615,856)
(48,895,838)
(53,841,351)
(44,019,990)
(97,861,341)
3,937,860
16,255,668
449,971
20,643,499
263,965,705
(6,603,470)
(76,077,966)
(15,147,983)
166,136,286
(22,758,090)
757,485
-
(22,000,605)
(38,193,169)
(108,489,209)
(146,682,378)
(2,546,697)
17,983,261
819,104
16,255,668
The annexed notes 1 to 48 form an integral part of these financial statements.
16 Saritow Spinning Mills Limited
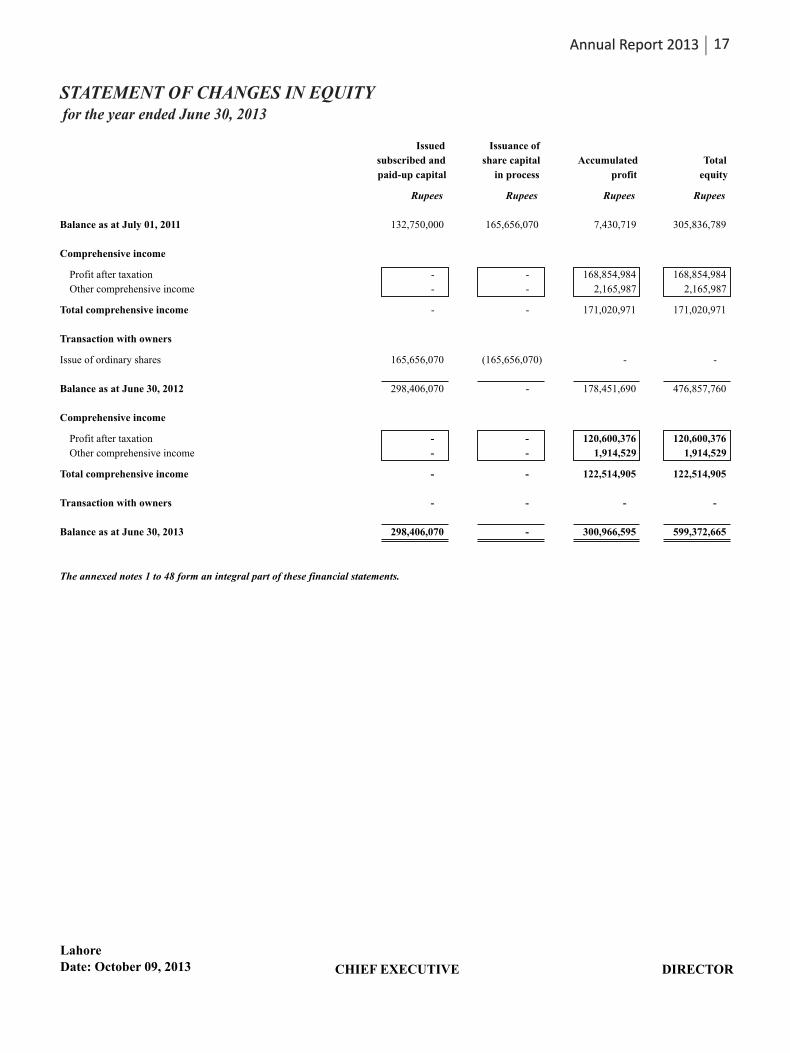
STATEMENT OF CHANGES IN EQUITY for the year ended June 30, 2013
LahoreDate: October 09, 2013 CHIEF EXECUTIVE DIRECTOR
Balance as at July 01, 2011
Comprehensive income
Profit after taxation
Other comprehensive income
Total comprehensive income
Transaction with owners
Issue of ordinary shares
Balance as at June 30, 2012
Comprehensive income
Profit after taxation
Other comprehensive income
Total comprehensive income
Transaction with owners
Balance as at June 30, 2013
The annexed notes 1 to 48 form an integral part of these financial statements.
Total
equity
Rupees
305,836,789
168,854,984
2,165,987
171,020,971
-
476,857,760
120,600,376
1,914,529
122,514,905
-
599,372,665
Accumulated
profit
Rupees
7,430,719
168,854,984
2,165,987
171,020,971
-
178,451,690
120,600,376
1,914,529
122,514,905
-
300,966,595
Issuance of
share capital
in process
Rupees
165,656,070
-
-
-
(165,656,070)
-
-
-
-
-
-
Issued
subscribed and
paid-up capital
Rupees
132,750,000
-
-
-
165,656,070
298,406,070
-
-
-
-
298,406,070
17Annual Report 2013
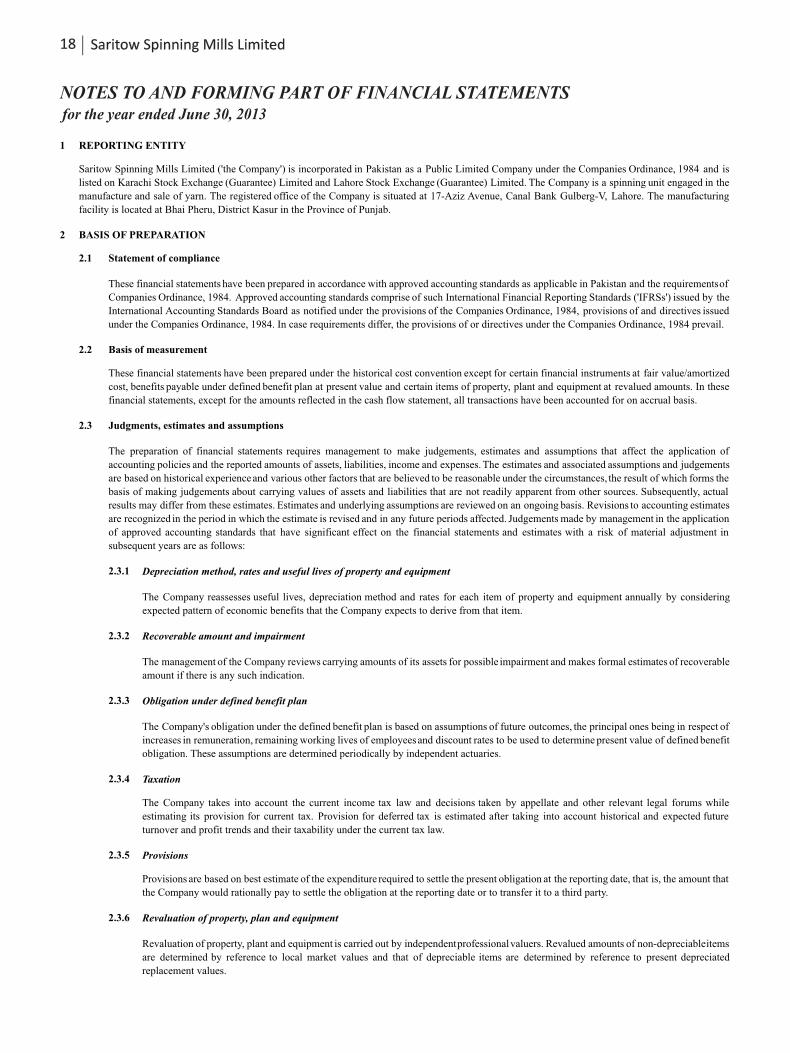
NOTES TO AND FORMING PART OF FINANCIAL STATEMENTS for the year ended June 30, 2013
1 REPORTING ENTITY
2 BASIS OF PREPARATION
2.1 Statement of compliance
2.2 Basis of measurement
2.3 Judgments, estimates and assumptions
2.3.1 Depreciation method, rates and useful lives of property and equipment
2.3.2 Recoverable amount and impairment
2.3.3 Obligation under defined benefit plan
2.3.4 Taxation
2.3.5 Provisions
2.3.6 Revaluation of property, plan and equipment
The management of the Company reviews carrying amounts of its assets for possible impairment and makes formal estimates of recoverable
amount if there is any such indication.
The Company's obligation under the defined benefit plan is based on assumptions of future outcomes, the principal ones being in respect of
increases in remuneration, remaining working lives of employeesand discount rates to be used to determine present value of defined benefit
obligation. These assumptions are determined periodically by independent actuaries.
The Company takes into account the current income tax law and decisions taken by appellate and other relevant legal forums while
estimating its provision for current tax. Provision for deferred tax is estimated after taking into account historical and expected future
turnover and profit trends and their taxability under the current tax law.
Revaluation of property, plant and equipment is carried out by independentprofessionalvaluers. Revalued amounts of non-depreciableitems
are determined by reference to local market values and that of depreciable items are determined by reference to present depreciated
replacement values.
Saritow Spinning Mills Limited ('the Company') is incorporated in Pakistan as a Public Limited Company under the Companies Ordinance, 1984 and is
listed on Karachi Stock Exchange (Guarantee) Limited and Lahore Stock Exchange (Guarantee) Limited. The Company is a spinning unit engaged in the
manufacture and sale of yarn. The registered office of the Company is situated at 17-Aziz Avenue, Canal Bank Gulberg-V, Lahore. The manufacturing
facility is located at Bhai Pheru, District Kasur in the Province of Punjab.
These financial statements have been prepared in accordance with approved accounting standards as applicable in Pakistan and the requirementsof
Companies Ordinance, 1984. Approved accounting standards comprise of such International Financial Reporting Standards ('IFRSs') issued by the
International Accounting Standards Board as notified under the provisions of the Companies Ordinance, 1984, provisions of and directives issued
under the Companies Ordinance, 1984. In case requirements differ, the provisions of or directives under the Companies Ordinance, 1984 prevail.
These financial statements have been prepared under the historical cost convention except for certain financial instruments at fair value/amortized
cost, benefits payable under defined benefit plan at present value and certain items of property, plant and equipment at revalued amounts. In these
financial statements, except for the amounts reflected in the cash flow statement, all transactions have been accounted for on accrual basis.
The preparation of financial statements requires management to make judgements, estimates and assumptions that affect the application of
accounting policies and the reported amounts of assets, liabilities, income and expenses. The estimates and associated assumptions and judgements
are based on historical experienceand various other factors that are believed to be reasonable under the circumstances, the result of which forms the
basis of making judgements about carrying values of assets and liabilities that are not readily apparent from other sources. Subsequently, actual
results may differ from these estimates. Estimates and underlying assumptions are reviewed on an ongoing basis. Revisions to accounting estimates
are recognized in the period in which the estimate is revised and in any future periods affected. Judgements made by management in the application
of approved accounting standards that have significant effect on the financial statements and estimates with a risk of material adjustment in
subsequent years are as follows:
The Company reassesses useful lives, depreciation method and rates for each item of property and equipment annually by considering
expected pattern of economic benefits that the Company expects to derive from that item.
Provisions are based on best estimate of the expenditure required to settle the present obligation at the reporting date, that is, the amount that
the Company would rationally pay to settle the obligation at the reporting date or to transfer it to a third party.
18 Saritow Spinning Mills Limited
2.4 Functional currency
3 SIGNIFICANT ACCOUNTING POLICIES
The accounting policies set out below have been applied consistently to all periods presented in these financial statements.
3.1 Property, plant and equipment
`
3.2 Surplus / deficit arising on revaluation of property, plant and equipment
3.3 Stores, spares and loose tools
3.4 Stock in trade
Raw materials Average cost
Work in process Average manufacturing cost
Finished goods Average manufacturing cost
Stock in transit Invoice price plus related cost incurred up to the reporting date
These are valued at lower of cost and net realizable value, with the exception of stock of waste which is valued at net realizable value. Cost is
determined using the following basis:
Average manufacturing cost in relation to work in process and finished goods consists of direct material, labour and an appropriate proportion of
manufacturing overheads.
An operating fixed asset is de-recognized when permanently retired from use. Any gain or loss on disposal of operating fixed assets is
recognized in profit or loss.
3.1.2 Capital work in progress
Capital work in progress is stated at cost less identified impairment loss, if any, and includes the cost of material, labour and appropriate
overheads directly relating to the construction, erection or installation of an item of operating fixed assets. These costs are transferred to
operating fixed assets as and when related items become available for intended use.
Surplus arising on revaluation of items of property, plant and equipment is carried on balance sheet after reversing deficit relating to the same item
previously recognizedin profit or loss, if any. Deficit arising on revaluation is recognizedin profit or loss after reversing the surplus relating to the
same item previously carried on balance sheet, if any. An amount equal to incremental depreciation, being the differencebetween the depreciation
based on revalued amounts and that based on the original cost, net of deferred tax, if any, is transferred from surplus on revaluation of property,
plant and equipment to accumulated profit every year, through statement of other comprehensive income.
These are generally held for internal use and are valued at cost. Cost is determined on the basis of moving average except for items in transit,
which are valued at invoice price plus related cost incurred up to the reporting date. For items which are consideredobsolete, the carrying amount
is written down to nil. Stores held exclusively for capitalization are recognized as capital work in progress.
These financial statements have been prepared in Pak Rupees which is the Company's functional currency.
3.1.1 Operating fixed assets
Operating fixed assets are measured at cost less accumulated depreciation and accumulated impairment losses with the exception of
freehold land, which is stated at cost less accumulated impairment losses and buildings on freehold land and plant and machinery stated at
revalued amount less accumulated depreciation. Cost comprises purchase price, including import duties and non-refundable purchase
taxes, after deducting trade discounts and rebates, and includes other costs directly attributable to the acquisition or construction, erection
and installation.
Major renewals and improvements to operating fixed assets are recognized in the carrying amount of the item if it is probable that the
embodied future economic benefits will flow to the Company and the cost of renewal or improvement can be measured reliably. The cost
of the day-to-day servicing of operating fixed assets are recognized in profit or loss as incurred.
The Company recognizes depreciation in profit or loss by applying reducing balance method over the useful life of each operating fixed
asset using rates specified in note 19 to the financial statements. Depreciation on additions to operating fixed assets is charged from the
month in which the item becomes available for use. Depreciation is discontinued from the month in which it is disposed or classified as
held for disposal.
19Annual Report 2013
3.5 Employee benefits
3.6 Financial instruments
3.7 Loans and borrowings
Net realizable value signifies the estimated selling price in the ordinary course of business less estimated costs of completion and estimated costs
necessary to make the sale.
3.6.5 Off-setting
A financial asset and a financial liability is offset and the net amount reported in the balance sheet if the Company has legally enforceable
right to set-off the recognized amounts and intends either to settle on a net basis or to realize the asset and settle the liability
simultaneously.
Loans and borrowings are classified as 'financial liabilities at amortized cost'. On initial recognition, these are measured at cost, being fair value at
the date the liability is incurred, less attributable transaction costs. Subsequent to initial recognition, these are measured at amortized cost with any
difference between cost and value at maturity recognized in the profit or loss over the period of the borrowings on an effective interest basis.
Short-term employee benefits
The Company recognizesthe undiscountedamount of short term employeebenefits to be paid in exchange for services rendered by employeesas a
liability after deducting amount already paid and as an expense in profit or loss unless it is included in the cost of inventories or property, plant and
equipment as permitted or required by the approved accounting standards. If the amount paid exceeds the undiscounted amount of benefits, the
excess is recognized as an asset to the extent that the prepayment would lead to a reduction in future payments or cash refund.
Post-employment benefits
The Company operates an unfunded gratuity scheme (defined benefit plan) for all its employees who have completed the minimum qualifying
service period. Liability is adjusted on each reporting date to cover the obligation and the adjustment is charged to profit or loss. The amount
recognized on balance sheet represents the present value of defined benefit obligation as adjusted for unrecognized actuarial gains or losses.
Actuarial gains or loss are recognized using '10% corridor approach' as set out by International Accounting Standard 19 - Employee Benefits.The
details of the scheme are referred to in note 12 to the financial statements.
3.6.1 Recognition
A financial instrument is recognized when the Company becomes a party to the contractual provisions of the instrument.
3.6.2 Classification
The Company classifies its financial instruments into following classes depending on the purpose for which the financial assets and
liabilities are acquired or incurred. The Company determines the classification of its financial assets and liabilities at initial recognition.
3.6.2(a) Loans and receivables
Non-derivative financial assets with fixed or determinable payments that are not quoted in an active market are classified as
loans and receivables. Assets in this category are presented as current assets except for maturities greater than twelve months
from the reporting date, where these are presented as non-current assets.
3.6.2(b) Financial liabilities at amortized cost
Non-derivative financial liabilities that are not financial liabilities at fair value through profit or loss, with the exception of
interest free loans from sponsors, are classified as financial liabilities at amortized cost. Financial liabilities in this category are
presentedas current liabilities except for maturities greater than twelve months from the reporting date where these are presented
as non-current liabilities.
3.6.3 Measurement
The particular measurement methods adopted are disclosed in the individual policy statements associated with each instrument.
3.6.4 De-recognition
Financial assets are de-recognizedif the Company's contractual rights to the cash flows from the financial assets expire or if the Company
transfers the financial asset to another party without retaining control or substantially all risks and rewards of the asset. Financial liabilities
are de-recognized if the Company's obligations specified in the contract expire or are discharged or cancelled. Any gain or loss on de-
recognition of financial assets and financial liabilities is recognized in profit or loss.
20 Saritow Spinning Mills Limited
Revenue when risks and rewards incidental to the ownership of goods are transferred to the buyer. Transfer
risks terms of the contract of sale. For local sales transfer usually occurs on dispatch of goods to
has a legal and constructive obligation as a result of past events and it is probable that outflow of
be required to settle the obligation and a reliable estimate can be made of the amount of obligation.
is the best estimate of the expenditure required to settle the present obligation at the reporting date.
Where benefits is not probable, or where a reliable estimate of the amount of obligation cannot be
3.8 Finance leases
3.9 Operating leases
3.10 Ijarah Transactions
3.11 Ordinary share capital
3.12 Trade and other payables
3.12.1 Financial liabilities
3.12.2 Non-financial liabilities
3.13 Provisions and contingencies
3.14 Trade and other receivables
3.14.1 Financial assets
3.14.2 Non-financial assets
3.15 Revenue
Ordinary share capital is recognized as equity.
These are classifiedas 'financial liabilities at amortized cost'. On initial recognition, these are measured at cost, being their fair value at the
date the liability is incurred, less attributable transaction costs. Subsequent to initial recognition, these are measured at amortized cost
using the effective interest method, with interest recognized in profit or loss.
These, both on initial recognition and subsequently, are measured at cost.
Provisions are recognized when the Company
resources embodying economic benefits will
Provision is recognized at an amount that
outflow of resources embodying economic
made, a contingent liability is disclosed, unless the possibility of outflow is remote.
Leases that do not transfer substantially all risks and rewards of ownership are classified as operating leases. Payments made under operating
leases are recognized in profit or loss on a straight line basis over the lease term.
Ujrah payments under an ijarah are recognized as an expense in profit or loss on straight line basis over the Ijarah terms unless another systematic
basis are representative of the time pattern of the user's benefit even if the payments are not on those basis.
These are classified as 'loans and receivables'. On initial recognition, these are measured at cost, being their fair value at the date of
transaction, plus attributable transaction costs. Subsequent to initial recognition, these are measured at amortized cost using the effective
interest method, with interest recognized in profit or loss.
These, both on initial recognition and subsequently, are measured at cost.
Revenue is measured at the fair value of the consideration received or receivable, net of returns allowances, trade discounts and rebates, and
represents amounts received or receivable for goods and services provided and other income earned in the normal course of business. Revenue is
recognizedwhen it is probable that the economicbenefitsassociated with the transaction will flow to the Company, and the amount of revenue and
the associated costs incurred or to be incurred can be measured reliably.
from sale of goods is recognized
and rewards vary depending on the individual
customers. For export sales transfer occurs upon loading the goods onto the relevant carrier.
Leases in terms of which the Company assumes substantially all risks and rewards of ownership are classified as finance leases. Assets subject to finance lease are classified as 'property, plant and equipment'. On initial recognition, these are measured at cost, being an amount equal to the lower of its fair value and the present value of minimum lease payments. Subsequent to initial recognition, these are measured at cost less accumulated depreciation and accumulated impairment losses. Depreciation, subsequent expenditure, de-recognition, and gains and losses on de-recognition are accounted for in accordance with the respective policies for property, plant and equipment. Liabilities against assets subject to finance lease and deposits against finance lease are classified as 'financial liabilities at amortized cost' and 'loans and receivables' respectively, however, since they fall outside the scope of measurement requirements of IAS 39 'Financial Instruments - Recognition and Measurement', these are measured in accordance with the requirements of IAS 17 'Leases'. On initial recognition, these are measured at cost, being their fair value at the date of commencement of lease, less attributable transaction costs. Subsequent to initial recognition, minimum lease payments made under finance leases are apportioned between the finance charge and the reduction of outstanding liability. The finance charge is allocated to each period during the lease term so as to produce a constant periodic rate of interest on the remaining balance of the liability. Deposits against finance leases, subsequent to initial recognition are carried at cost.
21Annual Report 2013
3.16 Comprehensive income
3.17 Borrowing costs
3.18 Income tax
3.18.1 Current taxation
3.18.2 Deferred taxation
3.19 Earnings per share ('EPS')
3.20 Cash and cash equivalents
3.21 Foreign currency transactions and balances
Comprehensive income is the change in equity resulting from transactions and other events, other than changes resulting from transactions with
shareholders in their capacity as shareholders. Total comprehensive income comprises all components of profit or loss and other comprehensive
income. Other comprehensive income comprises items of income and expense, including reclassification adjustments, that are not recognized in
profit or loss as required or permitted by approved accounting standards, and is presented in 'statement of profit or loss and other comprehensive
income'.
Borrowing costs directly attributable to the acquisition, construction or production of qualifying assets, which are assets that necessarily take a
substantial period of time to get ready for their intended use or sale, are added to the cost of those assets, until such time as the assets are
substantially ready for their intended use or sale. Investment income earned on the temporary investment of specific borrowings pending their
expenditure on qualifying asset is deducted from the borrowing costs eligible for capitalization. All other borrowing costs are recognized in profit
or loss as incurred.
Transactions in foreign currency are translated to the functional currency of the Company using exchange rate prevailing at the date of transaction.
Monetary assets and liabilities denominated in foreign currency are translated to the functional currency at exchange rate prevailing at the
reporting date. Non-monetary assets and liabilities denominated in foreign currency that are measured at fair value are translated to the functional
currency at exchange rate prevailing at the date the fair value is determined. Non-monetary assets and liabilities denominated in foreign currency
that are measured at historical cost are translated to functional currency at exchange rate prevailing at the date of initial recognition. Any gain or
loss arising on translation of foreign currency transactions and balances is recognized in profit or loss.
Deferred tax is accounted for using the balance sheet approach providing for temporary differencesbetween the carrying amounts of assets
and liabilities for financial reporting purposes and the amounts used for tax purposes. In this regard, the effectson deferred taxation of the
portion of income that is subject to final tax regime is also considered in accordance with the treatment prescribed by the Institute of
Chartered Accountants of Pakistan. Deferred tax is measured at rates that are expected to be applied to the temporary differenceswhen
they reverse, based on laws that have been enacted or substantively enacted by the reporting date. A deferred tax liability is recognizedfor
all taxable temporary differences.A deferred tax asset is recognized for deductible temporary differences to the extent that future taxable
profits will be available against which temporary differencescan be utilized. Deferred tax assets are reviewed at each reporting date and
are reduced to the extent that it is no longer probable that the related tax benefit will be realized.
Basic EPS is calculated by dividing the profit or loss attributable to ordinary shareholders of the Company by the weighted average number of
ordinary shares outstanding during the year.
Current tax is the amount of tax payable on taxable income for the year and any adjustment to the tax payable in respect of previous years.
Provision for current tax is based on current rates of taxation in Pakistan after taking into account tax credits, rebates and exemptions
available, if any. The amount of unpaid income tax in respect of the current or prior periods is recognized as a liability. Any excess paid
over what is due in respect of the current or prior periods is recognized as an asset.
Income tax expense comprises current tax and deferred tax. Income tax expense is recognized in profit or loss except to the extent that it relates to
items recognized directly in other comprehensive income, in which case it is recognized in other comprehensive income.
Diluted EPS is calculated by adjusting basic EPS by the weighted average number of ordinary shares that would be issued on conversion of all
dilutive potential ordinary shares into ordinary shares and post-tax effect of changes in profit or loss attributable to ordinary shareholders of the
Company that would result from conversion of all dilutive potential ordinary shares into ordinary shares.
Cash and cash equivalents for the purpose of cash flow statement comprise cash in hand and cash at banks. These are classified as 'loans and
receivables' and are carried at cost.
22 Saritow Spinning Mills Limited

3.22 Impairment
3.22.1 Financial assets
3.22.2 Non-financial assets
3.23 Dividend distribution to ordinary shareholders
4 ADOPTION OF NEW AND REVISED APPROVED ACCOUNTING STANDARDS, INTERPRETATIONS AND AMENDMENTS
The following amendments to approved accounting standards are effective in the current year and relevant to the Company.
Fourth Schedule to the Companies Ordinance, 1984
IAS 1 - Presentation of Financial Statements ('Amendments')
Dividend to ordinary shareholders is recognized as a deduction from accumulated profit in statement of changes in equity and as a liability, to the
extent it is unclaimed/unpaid, in the Company’s financial statements in the year in which the dividends are approved by the Company’s
shareholders.
A financial asset is assessed at each reporting date to determine whether there is any objective evidence that it is impaired. Individually
significant financial assets are tested for impairment on an individual basis. The remaining financial assets are assessed collectively in
groups that share similar credit risk characteristics.A financial asset is consideredto be impaired if objectiveevidence indicates that one or
more events have had a negative effect on the estimated future cash flows of the asset.
An impairment loss in respect of a financial asset measured at amortized cost is calculated as the difference between its carrying amount,
and the present value of the estimated future cash flows discounted at the original effective interest rate. Impairment loss in respect of a
financial asset measured at fair value is determined by reference to that fair value. All impairment losses are recognized in profit or loss.
An impairment loss is reversed if the reversal can be related objectivelyto an event occurring after the impairment loss was recognized.An
impairment loss is reversed only to the extent that the financial asset’s carrying amount after the reversal does not exceed the carrying
amount that would have been determined, net of amortization, if no impairment loss had been recognized.
The carrying amount of the Company’s non-financial assets, other than inventories and deferred tax assets are reviewed at each reporting
date to determine whether there is any indication of impairment. If any such indication exists, then the asset’s recoverable amount is
estimated. The recoverableamount of an asset or cash generating unit is the greater of its value in use and its fair value less costs to sell. In
assessing value in use, the estimated future cash flows are discounted to their present values using a pre-tax discount rate that reflects
current market assessments of the time value of money and the risks specific to the asset or cash generating unit.
An impairment loss is recognized if the carrying amount of the asset or its cash generating unit exceeds its estimated recoverable amount.
Impairment losses are recognized in profit or loss. Impairment losses recognized in respect of cash generating units are allocated to reduce
the carrying amounts of the assets in a unit on a pro rata basis. Impairment losses recognized in prior periods are assessedat each reporting
date for any indications that the loss has decreased or no longer exists. An impairment loss is reversed if there has been a change in the
estimates used in determine the recoverable amount. An impairment loss is reversed only to that extent that the asset’s carrying amount
after the reversal does not exceed the carrying amount that would have been determined, net of depreciation and amortization, if no
impairment loss had been recognized.
The Securities and Exchange Commission of Pakistan through S.R.O. 183(I)/2013 has notified certain amendments in the Fourth Schedule to the
Companies Ordinance, 1984. These amendments have principally clarified certain matters, changed some of the presentation and classification
requirements and incorporated additional disclosure requirements. The Company has adopted these changes which has resulted in additional disclosures
made in the financial statements. However, no change in accounting policy was required and accordingly there was no impact on the amounts reported in
these financial statements.
The amendmentsrename 'statementof comprehensiveincome'as 'statementof profit or loss and other comprehensiveincome'and require entities to group
items presented as other comprehensiveincome based on whether they are potentially reclassifiable to profit or loss subsequently, i.e. those that might be
reclassified and those that will not be reclassified, and require tax associated with items presented before tax to be shown separately for each of the two
groups, without changing the option to present items of other comprehensive income either before tax or net of tax. The Company has adopted the
amendment and has presented the items of other comprehensiveincome accordingly. There were no other changes resulting from the adoption, with the
exception of change of name to 'statement of profit or loss and other comprehensive income'.
23Annual Report 2013

5 NEW AND REVISED APPROVED ACCOUNTING STANDARDS, INTERPRETATIONS AND AMENDMENTS NOT YET EFFECTIVE
5.1 New and Revised Approved Accounting Standards and Interpretations
IFRS 9 - Financial Instruments: Classification and Measurement (2010)
IFRS 10 - Consolidated Financial Statements (2011)
IFRS 11 - Joint Arrangements (2011)
IFRS 12 - Disclosure of Interests in Other Entities (2011)
IFRS 13 - Fair Value Measurement (2011)
IAS 19 - Employee Benefits (Revised 2011)
IAS 27 - Separate Financial Statements (Revised 2011)
IAS 28 - Investments in Associates and Joint Ventures (Revised 2011)
IFRIC 20 - Stripping Cost in the Production Phase of a Surface Mining (2011)
IFRIC 21 - Levies (2013)
The interpretation requires production stripping cost in a surface mine to be capitalized if certain criteria are met. The Interpretation is effective for
annual periods beginning on or after January 01, 2013.
The interpretation provides guidance on when to recognize a liability for levy imposed by a government. The Interpretation is effective for annual
periods beginning on or after January 01, 2014.
The standard establishesa single framework for measuring fair value where that is required by other standards. The standard is effective for annual
periods beginning on or after January 01, 2013.
The revised standard requires actuarial gains and losses to be recognized immediately in other comprehensive income and removes the corridor
method as well as the option to recognize all changes in defined benefit obligation and plan assets in profit or loss. The revisions are effective for
annual periods beginning on or after January 01, 2013.
The revised standard supersedes IAS 27 - Consolidated and Separate Financial Statements (Revised 2008). The revised standard carries forward
existing accounting and disclosure requirements for separate financial statementswith some minor clarifications.The revised standard is effectivefor
annual periods beginning on or after January 01, 2013.
The revised standard supersedesIAS 28 - Investmentsin Associates(revised 2008). The revised standard makes amendments to apply IFRS 5 - Non-
Current Assets Held for Sale and Discontinued Operations to investment,or a portion thereof, in an associate or joint venture, that meets the criteria
to be classified as held for sale. The revised standard is effective for annual periods beginning on or after January 01, 2013.
The following standards, interpretations and amendments are in issue which are not effective as at the reporting date. Their impact on the Company's
financial statements cannot be ascertained as at the reporting date.
The revised standard incorporates new requirements for the classification and measurement of financial instruments and carries over existing
derecognition requirements from IAS 39 - Financial Instruments: Recognition and Measurement. The standard was originally effective for annual
periods beginningon or after January 01, 2013, however IASB issued "Mandatory EffectiveDate and Transition Disclosures (Amendmentsto IFRS
9 and IFRS 7) which amended the effective date of IFRS 9 to annual periods beginning on or after January 01, 2015.
The standard replaces those parts of IAS 27 - Consolidated and Separate Financial Statements, that address when and how an investor should
prepare consolidated financial statements and supersedes SIC 12 - Consolidation: Special Purpose Entities. The standard is effective for annual
periods beginning on or after January 01, 2013.
The standard supersedesIAS 31 - Interest in Joint Ventures and SIC 13 - Jointly Controlled Entities: Non-monetaryContributions by Venturers. The
standard is effective for annual periods beginning on or after January 01, 2013.
The standard introduces disclosure requirements relating to interests in subsidiaries, joint arrangements, associates and unconsolidated structured
entities. The standard is effective for annual periods beginning on or after January 01, 2013.
24 Saritow Spinning Mills Limited
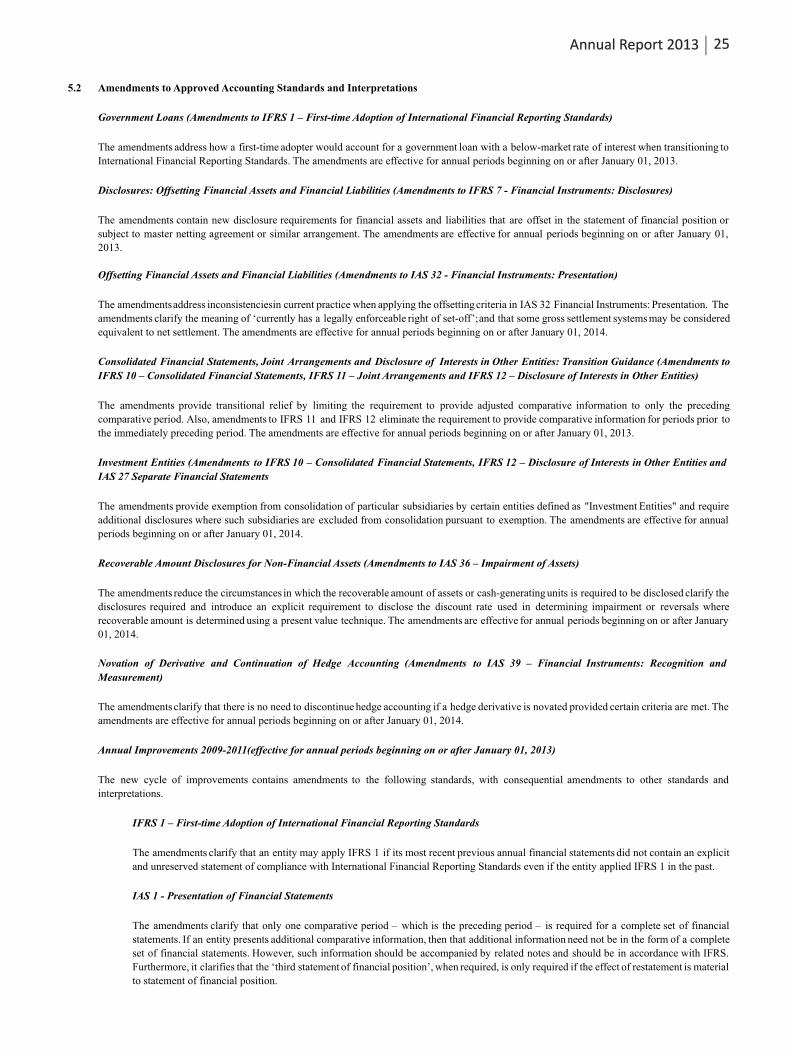
5.2 Amendments to Approved Accounting Standards and Interpretations
Government Loans (Amendments to IFRS 1 – First-time Adoption of International Financial Reporting Standards)
Disclosures: Offsetting Financial Assets and Financial Liabilities (Amendments to IFRS 7 - Financial Instruments: Disclosures)
Offsetting Financial Assets and Financial Liabilities (Amendments to IAS 32 - Financial Instruments: Presentation)
Recoverable Amount Disclosures for Non-Financial Assets (Amendments to IAS 36 – Impairment of Assets)
Annual Improvements 2009-2011(effective for annual periods beginning on or after January 01, 2013)
IFRS 1 – First-time Adoption of International Financial Reporting Standards
IAS 1 - Presentation of Financial Statements
The new cycle of improvements contains amendments to the following standards, with consequential amendments to other standards and
interpretations.
The amendments clarify that an entity may apply IFRS 1 if its most recent previous annual financial statements did not contain an explicit
and unreserved statement of compliance with International Financial Reporting Standards even if the entity applied IFRS 1 in the past.
The amendments clarify that only one comparative period – which is the preceding period – is required for a complete set of financial
statements. If an entity presents additional comparative information, then that additional information need not be in the form of a complete
set of financial statements. However, such information should be accompanied by related notes and should be in accordance with IFRS.
Furthermore, it clarifies that the ‘third statement of financial position’, when required, is only required if the effect of restatement is material
to statement of financial position.
The amendments reduce the circumstances in which the recoverable amount of assets or cash-generatingunits is required to be disclosed clarify the
disclosures required and introduce an explicit requirement to disclose the discount rate used in determining impairment or reversals where
recoverable amount is determined using a present value technique. The amendments are effective for annual periods beginning on or after January
01, 2014.
Novation of Derivative and Continuation of Hedge Accounting (Amendments to IAS 39 – Financial Instruments: Recognition and
Measurement)
The amendments clarify that there is no need to discontinue hedge accounting if a hedge derivative is novated provided certain criteria are met. The
amendments are effective for annual periods beginning on or after January 01, 2014.
The amendments address how a first-time adopter would account for a government loan with a below-market rate of interest when transitioning to
International Financial Reporting Standards. The amendments are effective for annual periods beginning on or after January 01, 2013.
The amendments contain new disclosure requirements for financial assets and liabilities that are offset in the statement of financial position or
subject to master netting agreement or similar arrangement. The amendments are effective for annual periods beginning on or after January 01,
2013.
The amendmentsaddress inconsistenciesin current practice when applying the offsettingcriteria in IAS 32 Financial Instruments: Presentation. The
amendments clarify the meaning of ‘currently has a legally enforceable right of set-off’;and that some gross settlement systems may be considered
equivalent to net settlement. The amendments are effective for annual periods beginning on or after January 01, 2014.
Consolidated Financial Statements, Joint Arrangements and Disclosure of Interests in Other Entities: Transition Guidance (Amendments to
IFRS 10 – Consolidated Financial Statements, IFRS 11 – Joint Arrangements and IFRS 12 – Disclosure of Interests in Other Entities)
The amendments provide transitional relief by limiting the requirement to provide adjusted comparative information to only the preceding
comparative period. Also, amendments to IFRS 11 and IFRS 12 eliminate the requirement to provide comparative information for periods prior to
the immediately preceding period. The amendments are effective for annual periods beginning on or after January 01, 2013.
Investment Entities (Amendments to IFRS 10 – Consolidated Financial Statements, IFRS 12 – Disclosure of Interests in Other Entities and
IAS 27 Separate Financial Statements
The amendments provide exemption from consolidation of particular subsidiaries by certain entities defined as "Investment Entities" and require
additional disclosures where such subsidiaries are excluded from consolidation pursuant to exemption. The amendments are effective for annual
periods beginning on or after January 01, 2014.
25Annual Report 2013

IAS 16 - Property, Plant and Equipment
IAS 32 - Financial Instruments: Presentation
IAS 34 - Interim Financial Reporting
The amendments clarify the accounting of spare parts, stand-by equipment and servicing equipment. The definition of ‘property, plant and
equipment’ in IAS 16 is now considered in determining whether these items should be accounted for under that standard. If these items do
not meet the definition, then they are accounted for using IAS 2 Inventories.
The amendments clarify that IAS 12 - Income Taxes applies to the accounting for income taxes relating to distributions to holders of an
equity instrument and transaction costs of an equity transaction. The amendment removes a perceived inconsistency between IAS 32 and
IAS 12.
The amendments align the disclosure requirements for segment assets and segment liabilities in interim financial reports with those in IFRS
8 - Operating Segments. IAS 34 now requires the disclosure of a measure of total assets and liabilities for a particular reportable segment. In
addition, such disclosure is only required when the amount is regularly provided to the chief operating decision maker and there has been a
material change from the amount disclosed in the last annual financial statements for that reportable segment.
Note 2013 2012
Rupees Rupees
132,750,000 132,750,000
165,656,070 165,656,070
298,406,070 298,406,070
78,429,877 80,595,864
- -
(2,945,430) (3,332,287)
1,030,901 1,166,300
(1,914,529) (2,165,987)
76,515,348 78,429,877
265,884,966 265,884,966
6 ISSUED, SUBSCRIBED AND PAID-UP CAPITAL
Ordinary shares of Rs. 10 each
13,275,000 (2012: 13,275,000) ordinary shares issued for cash
16,565,607 (2012: 16,565,607) ordinary shares issued as consideration of merger
7 SURPLUS ON REVALUATION OF PROPERTY, PLANT AND EQUIPMENT
As at beginning of the year
Surplus recognized during the year
Incremental depreciation recognized in other comprehensive income
Incremental depreciation for the year
Deferred taxation
As at end of the year
8 LOAN FROM DIRECTORS AND FAMILY MEMBERS - UNSECURED, SUBORDINATE
Face value of loan 8.1
Unamortized notional interest 8.2 (92,714,446) (115,197,079)
173,170,520 150,687,887
8.1 This loan has been obtained from directors and their family members of the Company and is interest free. The loan is subordinate to all term
finances (see note 9) and short term borrowings of the Company (see note 15).
As per terms of agreement between the lenders and the Company, no repayment shall be demanded and no repayments shall be made by the
Company to the lenders before July 31, 2016, being the earliest date on which the underlying borrowings, to which this loan is subordinated, are
expected to be completely repaid. Accordingly, this loan has been carried at amortized cost which has been determined using a discount rate of
14.92% per annum, being the average effective borrowing rate of the Company on the date of initial measurement at amortized cost.
26 Saritow Spinning Mills Limited
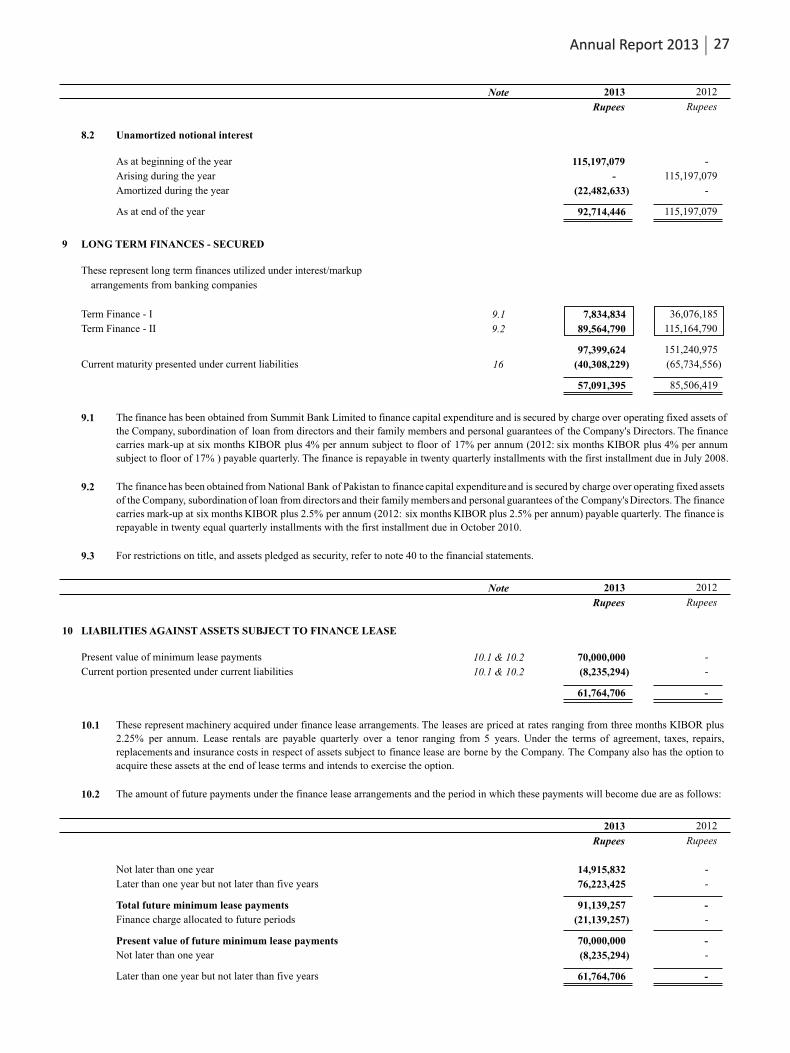
8.2 Unamortized notional interest
9 LONG TERM FINANCES - SECURED
9.3 For restrictions on title, and assets pledged as security, refer to note 40 to the financial statements.
10 LIABILITIES AGAINST ASSETS SUBJECT TO FINANCE LEASE
9.1 The finance has been obtained from Summit Bank Limited to finance capital expenditure and is secured by charge over operating fixed assets of
the Company, subordination of loan from directors and their family members and personal guarantees of the Company's Directors. The finance
carries mark-up at six months KIBOR plus 4% per annum subject to floor of 17% per annum (2012: six months KIBOR plus 4% per annum
subject to floor of 17% ) payable quarterly. The finance is repayable in twenty quarterly installments with the first installment due in July 2008.
9.2 The finance has been obtained from National Bank of Pakistan to finance capital expenditure and is secured by charge over operating fixed assets
of the Company, subordination of loan from directors and their family membersand personal guarantees of the Company'sDirectors. The finance
carries mark-up at six months KIBOR plus 2.5% per annum (2012: six months KIBOR plus 2.5% per annum) payable quarterly. The finance is
repayable in twenty equal quarterly installments with the first installment due in October 2010.
10.1 These represent machinery acquired under finance lease arrangements. The leases are priced at rates ranging from three months KIBOR plus
2.25% per annum. Lease rentals are payable quarterly over a tenor ranging from 5 years. Under the terms of agreement, taxes, repairs,
replacements and insurance costs in respect of assets subject to finance lease are borne by the Company. The Company also has the option to
acquire these assets at the end of lease terms and intends to exercise the option.
10.2 The amount of future payments under the finance lease arrangements and the period in which these payments will become due are as follows:
Note 2013 2012
Rupees Rupees
Note 2013 2012
Rupees Rupees
2013 2012
Rupees Rupees
As at beginning of the year 115,197,079 -
Arising during the year - 115,197,079
Amortized during the year (22,482,633) -
As at end of the year 92,714,446 115,197,079
Present value of minimum lease payments 10.1 & 10.2 -
Current portion presented under current liabilities 10.1 & 10.2 -
70,000,000
(8,235,294)
61,764,706 -
Not later than one year 14,915,832 -
Later than one year but not later than five years 76,223,425 -
Total future minimum lease payments 91,139,257 -
Finance charge allocated to future periods (21,139,257) -
Present value of future minimum lease payments 70,000,000 -
Not later than one year (8,235,294) -
Later than one year but not later than five years 61,764,706 -
These represent long term finances utilized under interest/markup
arrangements from banking companies
Term Finance - I 9.1 7,834,834 36,076,185
Term Finance - II 9.2 89,564,790 115,164,790
97,399,624 151,240,975
Current maturity presented under current liabilities 16 (40,308,229) (65,734,556)
57,091,395 85,506,419
27Annual Report 2013
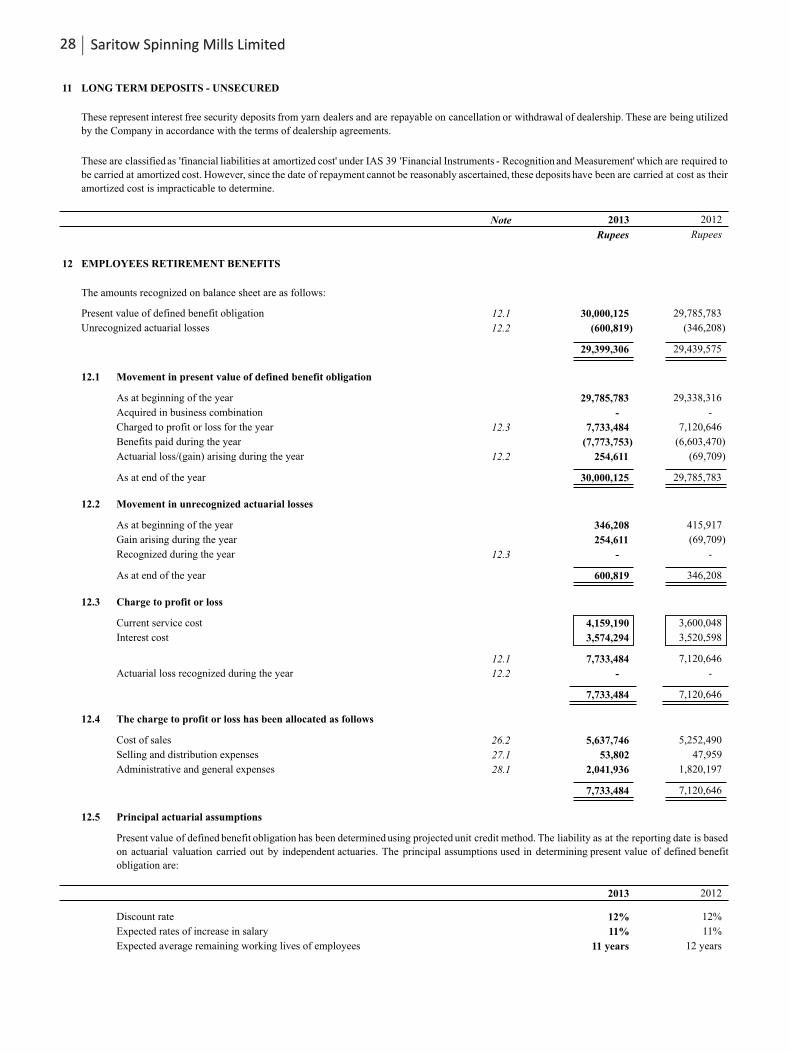
11 LONG TERM DEPOSITS - UNSECURED
Note 2013 2012
Rupees Rupees
12 EMPLOYEES RETIREMENT BENEFITS
The amounts recognized on balance sheet are as follows:
Present value of defined benefit obligation 12.1 30,000,125 29,785,783
Unrecognized actuarial losses 12.2 (600,819) (346,208)
29,399,306 29,439,575
12.1 Movement in present value of defined benefit obligation
As at beginning of the year 29,785,783 29,338,316
Acquired in business combination - -
Charged to profit or loss for the year 12.3 7,733,484 7,120,646
Benefits paid during the year (7,773,753) (6,603,470)
Actuarial loss/(gain) arising during the year 12.2 254,611 (69,709)
As at end of the year 30,000,125 29,785,783
12.2 Movement in unrecognized actuarial losses
As at beginning of the year 346,208 415,917
Gain arising during the year 254,611 (69,709)
Recognized during the year 12.3 - -
As at end of the year 600,819 346,208
12.3 Charge to profit or loss
Current service cost 4,159,190 3,600,048
Interest cost 3,574,294 3,520,598
12.1 7,733,484 7,120,646
Actuarial loss recognized during the year 12.2 - -
7,733,484 7,120,646
12.4 The charge to profit or loss has been allocated as follows
Cost of sales 26.2 5,637,746 5,252,490
Selling and distribution expenses 27.1 53,802 47,959
Administrative and general expenses 28.1 2,041,936 1,820,197
7,733,484 7,120,646
12.5 Principal actuarial assumptions
2013 2012
Discount rate 12% 12%
Expected rates of increase in salary 11% 11%
Expected average remaining working lives of employees 11 years 12 years
These are classified as 'financial liabilities at amortized cost' under IAS 39 'Financial Instruments - Recognition and Measurement' which are required to
be carried at amortized cost. However, since the date of repayment cannot be reasonably ascertained, these deposits have been are carried at cost as their
amortized cost is impracticable to determine.
Present value of defined benefit obligation has been determined using projected unit credit method. The liability as at the reporting date is based
on actuarial valuation carried out by independent actuaries. The principal assumptions used in determining present value of defined benefit
obligation are:
These represent interest free security deposits from yarn dealers and are repayable on cancellation or withdrawal of dealership. These are being utilized
by the Company in accordance with the terms of dealership agreements.
28 Saritow Spinning Mills Limited

12.6 Historical information
2013 2012 2011 2010 2009
Present value of defined Rupees 30,000,125 29,785,783 29,338,316 13,614,456 12,017,310
benefit obligation
Actuarial adjustment arising % 0.85 0.23 - 11.13 -
during the year
The experience adjustment component of actuarial adjustment is impracticable to determine and thus has not been disclosed.
Note 2013 2012
Rupees Rupees
13 DEFERRED TAXATION
Deferred tax liability on taxable temporary differences 13.1 240,955,956 237,933,187
Deferred tax asset on deductible temporary differences 13.1 (17,905,861) (21,106,925)
223,050,095 216,826,262
13.1 Recognized deferred tax assets and liabilities
Deferred tax assets and liabilities are attributable to the following:
Deferred tax liabilities
Operating fixed assets - owned
Deferred tax assets
Employees retirement benefits
Assets subject to finance lease
Unused tax losses and credits
Deferred tax liabilities
Operating fixed assets - owned
Deferred tax assets
Employees retirement benefits
Assets subject to finance lease
Unused tax losses and credits
13.2 Deferred tax has been calculated at 35% (2012: 35%) of the timing differences as at the reporting date. The Government of Pakistan vide
Finance Act, 2013 has notified a reduced tax rate of 34% for tax year 2014 only, however deferred tax has been recognized using tax rate of
35% as the impact of reduction in tax rate for one tax year is immaterial.
2013
2012
As at
June 30, 2013
Rupees
240,955,956
(10,289,757)
(7,616,104)
-
(17,905,861)
223,050,095
As at
June 30, 2012
Rupees
237,933,187
(10,303,851)
-
(10,803,074)
(21,106,925)
216,826,262
Recognized
in equity
Rupees
-
-
-
-
-
-
Recognized in
profit or loss
Rupees
21,807,171
(181,011)
-
(10,803,074)
(10,984,085)
10,823,086
As at
July 01, 2011
Rupees
216,126,016
(10,122,840)
-
-
(10,122,840)
206,003,176
Recognized
in equity
Rupees
-
-
-
-
-
Recognized in
profit or loss
Rupees
3,022,769
14,094
(7,616,104)
10,803,074
3,201,064
6,223,833
As at
July 01, 2012
Rupees
237,933,187
(10,303,851)
-
(10,803,074)
(21,106,925)
216,826,262
29Annual Report 2013

Note 2013 2012
Rupees Rupees
14 TRADE AND OTHER PAYABLES
Trade creditors - Unsecured 69,963,499 55,435,918
Bills payable - Secured 14.1 - 15,273,196
Accrued liabilities 56,842,237 47,651,384
Advances from customers - Unsecured 24,934,727 940,908
Workers' Profit Participation Fund 14.2 9,213,915 4,547,491
Workers' Welfare Fund 14.3 5,546,736 3,814,460
Unclaimed dividend 1,077,033 1,077,033
Deductions against vehicle scheme 2,873,501 2,120,016
Other payables - Unsecured 4,250,957 3,663,949
174,702,605 134,524,355
14.1 These are secured through letters of credit.
14.2 Workers' Profit Participation Fund
As at beginning of the year 4,547,491 5,268,609
Interest on funds utilized by the Company 14.2.1 417,655 434,480
Charged to profit or loss for the year 31 9,213,915 4,547,491
Paid during the year (4,965,146) (5,703,089)
As at end of the year 9,213,915 4,547,491
14.2.1 Interest is charged at 11.75% (2012: 14%) per annum.
14.3 Workers' Welfare Fund
As at beginning of the year 3,814,460 2,031,990
Charged to profit or loss for the year 31 3,514,746 1,782,470
Paid/adjusted during the year (1,782,470) -
As at end of the year 5,546,736 3,814,460
14.4
14.5
Note 2013 2012
Rupees Rupees
15 SHORT TERM BORROWINGS - SECURED
These represent short term finances utilized under interest/mark-up arrangements
from banking companies
Running finances 15.1 54,302,694 135,681,083
Term loans 15.1 56,419,952 19,061,553
110,722,646 154,742,636
These include witholding tax payable amounting to Rs.4,250,957 (2012: Rs. 3,663,949).
These represent deductions from employees' salaries on account of vehicle scheme whereby the Company and employees share a portion of the
cost of vehicle. The vehiclesare registered in the name of employeeor leasing company in case of leased vehicles.The cost of vehicles is borne by
the Company initially and is recovered from employees on monthly basis.
15.1 These facilities have been obtained from various banking companies for working capital requirements and are secured by charge over current
assets and operating fixed assets of the Company, pledge of stock, subordination of loan from directors and their family members and personal
guarantees of the Company's Directors.
These finances carry markup at rates ranging from one to six months KIBOR plus 2.5% to 5% per annum (2012: one to six months KIBOR plus
2.5% to 5% per annum), payable quarterly, except for term loans for which interest/markup is payable with principal on maturity.
The aggregate available short term funded facilities amounts to Rs. 570 million (2012: Rs. 615 million) out of which Rs. 459 million (2012: Rs.
460 million) remained unavailed as at the reporting date.
30 Saritow Spinning Mills Limited
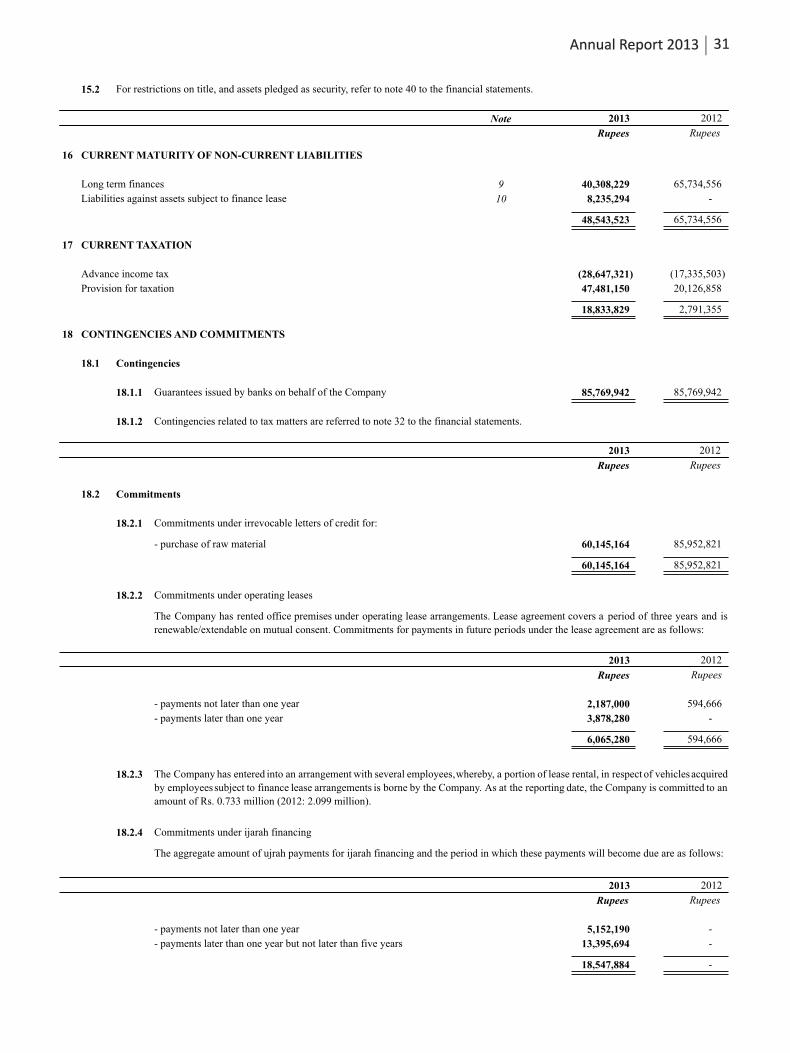
15.2
16 CURRENT MATURITY OF NON-CURRENT LIABILITIES
Long term finances
Liabilities against assets subject to finance lease
17 CURRENT TAXATION
Advance income tax
Provision for taxation
18 CONTINGENCIES AND COMMITMENTS
18.1
18.2
For restrictions on title, and assets pledged as security, refer to note 40 to the financial statements.
Note 2013 2012
Rupees Rupees
9 40,308,229 65,734,556
10 8,235,294 -
48,543,523 65,734,556
(28,647,321) (17,335,503)
47,481,150 20,126,858
18,833,829 2,791,355
Contingencies
18.1.1 Guarantees issued by banks on behalf of the Company 85,769,942 85,769,942
18.1.2
2013 2012
Rupees Rupees
Commitments
18.2.1 Commitments under irrevocable letters of credit for:
- purchase of raw material 60,145,164 85,952,821
60,145,164 85,952,821
18.2.2 Commitments under operating leases
2013 2012
Rupees Rupees
- payments not later than one year 2,187,000 594,666
- payments later than one year 3,878,280 -
6,065,280 594,666
18.2.3
18.2.4 Commitments under ijarah financing
2013 2012
Rupees Rupees
- payments not later than one year 5,152,190 -
- payments later than one year but not later than five years 13,395,694 -
18,547,884 -
The Company has entered into an arrangement with several employees,whereby, a portion of lease rental, in respect of vehiclesacquired
by employeessubject to finance lease arrangements is borne by the Company. As at the reporting date, the Company is committed to an
amount of Rs. 0.733 million (2012: 2.099 million).
The aggregate amount of ujrah payments for ijarah financing and the period in which these payments will become due are as follows:
Contingencies related to tax matters are referred to note 32 to the financial statements.
The Company has rented office premises under operating lease arrangements. Lease agreement covers a period of three years and is
renewable/extendable on mutual consent. Commitments for payments in future periods under the lease agreement are as follows:
31Annual Report 2013
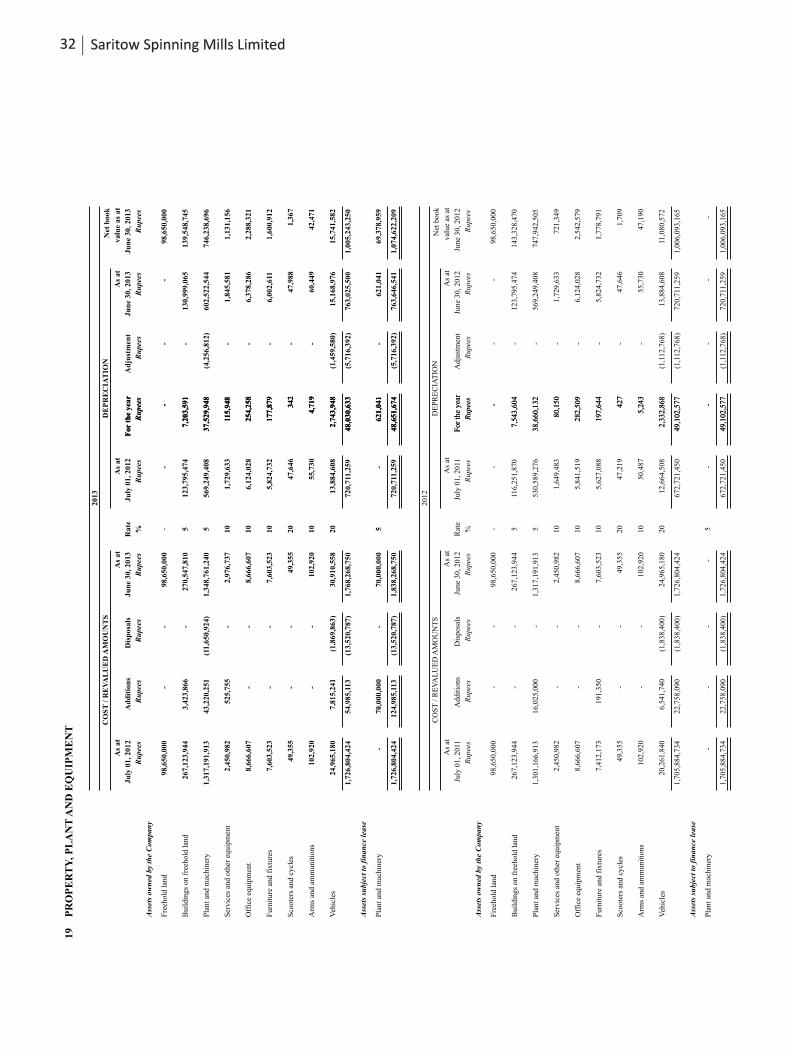
19P
RO
PE
RT
Y, P
LA
NT
AN
D E
QU
IPM
EN
T
Rat
e
%
Ass
ets
own
ed b
y th
e C
ompa
ny
Fre
ehol
d la
nd-
Bui
ldin
gs o
n fr
eeho
ld l
and
5
Pla
nt
and
mac
hin
ery
5
Ser
vice
s an
d o
ther
eq
uipm
ent
10
Off
ice
equi
pmen
t10
Fur
nitu
re a
nd f
ixtu
res
10
Sco
oter
s an
d c
ycle
s20
A
rms
and
amm
uni
tion
s10
Veh
icle
s20
Ass
ets
subj
ect
to f
inan
ce l
ease
Pla
nt
and
mac
hin
ery
5
Rat
e
%
Ass
ets
own
ed b
y th
e C
ompa
ny
Fre
ehol
d la
nd-
Bui
ldin
gs o
n fr
eeho
ld l
and
5
Pla
nt
and
mac
hin
ery
5
Ser
vice
s an
d o
ther
eq
uipm
ent
10
Off
ice
equi
pmen
t10
Fur
nitu
re a
nd f
ixtu
res
10
Sco
oter
s an
d c
ycle
s20
Arm
s an
d am
mu
niti
ons
10
Veh
icle
s20
Ass
ets
subj
ect
to f
inan
ce l
ease
Pla
nt
and
mac
hin
ery
5
2012
CO
ST
/ R
EV
AL
UE
D A
MO
UN
TS
DE
PR
EC
IAT
ION
2013
CO
ST
/ R
EV
AL
UE
D A
MO
UN
TS
DE
PR
EC
IAT
ION
Net
boo
k
valu
e as
at
Jun
e 30
, 20
13
Ru
pees
98,6
50,0
00
139,
548,
745
746,
238,
696
1,13
1,15
6
2,28
8,32
1
1,60
0,91
2
1,36
7
42
,471
15,7
41,5
82
1,00
5,24
3,25
0
69,3
78,9
59
1,07
4,62
2,20
9
Net
boo
k
valu
e as
at
June
30,
201
2
Rup
ees
98,6
50,0
00
143,
328,
470
747,
942,
505
721,
349
2,54
2,57
9
1,77
8,79
1
1,70
9
47,1
90
11,0
80,5
72
1,00
6,09
3,16
5
-
1,00
6,09
3,16
5
As
at
Jun
e 30
, 20
13
Ru
pees -
130,
999,
065
602,
522,
544
1,84
5,58
1
6,37
8,28
6
6,
002,
611
47
,988
60
,449
15,1
68,9
76
763,
025,
500
621,
041
763,
646,
541
As
at
June
30,
201
2
Rup
ees
-
123,
795,
474
569,
249,
408
1,72
9,63
3
6,12
4,02
8
5,82
4,73
2
47,6
46
55,7
30
13,8
84,6
08
720,
711,
259
-
720,
711,
259
Ad
just
men
t
Ru
pees -
-
(4,2
56,8
12)
-
-
-
-
-
(1,4
59,5
80)
(5,7
16,3
92)
-
(5,7
16,3
92)
Adj
ustm
ent
Rup
ees
-
-
-
-
-
- - -
(1,1
12,7
68)
(1,1
12,7
68)
-
(1,1
12,7
68)
For
th
e ye
ar
Ru
pees -
7,20
3,59
1
37,5
29,9
48
115,
948
254,
258
177,
879
342
4,71
9
2,74
3,94
8
48,0
30,6
33
621,
041
48,6
51,6
74
For
the
yea
r
Rup
ees
-
7,54
3,60
4
38,6
60,1
32
80,1
50
282,
509
197,
644
427
5,24
3
2,33
2,86
8
49,1
02,5
77 -
49,1
02,5
77
For
th
e ye
ar
Ru
pees -
7,20
3,59
1
37,5
29,9
48
115,
948
254,
258
177,
879
342
4,71
9
2,74
3,94
8
48,0
30,6
33
621,
041
48,6
51,6
74
For
the
yea
r
Rup
ees
-
7,54
3,60
4
38,6
60,1
32
80,1
50
282,
509
197,
644
427
5,24
3
2,33
2,86
8
49,1
02,5
77 -
49,1
02,5
77
As
at
July
01,
201
2
Ru
pees -
123,
795,
474
569,
249,
408
1,72
9,63
3
6,12
4,02
8
5,
824,
732
47
,646
55
,730
13,8
84,6
08
720,
711,
259
-
720,
711,
259
As
at
July
01,
201
1
Rup
ees
-
116,
251,
870
530,
589,
276
1,64
9,48
3
5,84
1,51
9
5,62
7,08
8
47,2
19
50,4
87
12,6
64,5
08
672,
721,
450
-
672,
721,
450
As
at
Jun
e 30
, 201
3
Ru
pees
98,6
50,0
00
270,
547,
810
1,34
8,76
1,24
0
2,97
6,73
7
8,66
6,60
7
7,60
3,52
3
49,3
55
10
2,92
0
30,9
10,5
58
1,76
8,26
8,75
0
70,0
00,0
00
1,83
8,26
8,75
0
As
at
June
30,
201
2
Rup
ees
98,6
50,0
00
267,
123,
944
1,31
7,19
1,91
3
2,45
0,98
2
8,66
6,60
7
7,60
3,52
3
49,3
55
102,
920
24,9
65,1
80
1,72
6,80
4,42
4
-
1,72
6,80
4,42
4
Dis
pos
als
Ru
pees -
-
(11,
650,
924)
-
-
-
-
-
(1,8
69,8
63)
(13,
520,
787)
-
(13,
520,
787)
Dis
posa
ls
Rup
ees
-
-
-
-
-
- - -
(1,8
38,4
00)
(1,8
38,4
00)
-
(1,8
38,4
00)
Ad
dit
ion
s
Ru
pees -
3,42
3,86
6
43,2
20,2
51
525,
755
-
-
-
-
7,81
5,24
1
54,9
85,1
13
70,0
00,0
00
124,
985,
113
Addi
tions
Rup
ees
-
-
16,0
25,0
00
-
-
191,
350
- -
6,54
1,74
0
22,7
58,0
90
-
22,7
58,0
90
As
at
Ju
ly 0
1, 2
012
Ru
pees
98,6
50,
000
267,
123
,944
1,3
17,1
91,9
13
2,45
0,9
82
8,66
6,6
07
7,60
3,5
23
49,3
55
102,
920
24,9
65,
180
1,7
26,8
04,4
24
-
1,7
26,8
04,4
24
As
at
July
01,
20
11
Rup
ees
98,6
50,
000
267,
123
,944
1,3
01,1
66,9
13
2,45
0,9
82
8,66
6,6
07
7,41
2,1
73
49,3
55
102,
920
20,2
61,
840
1,7
05,8
84,7
34
-
1,7
05,8
84,7
34
32 Saritow Spinning Mills Limited
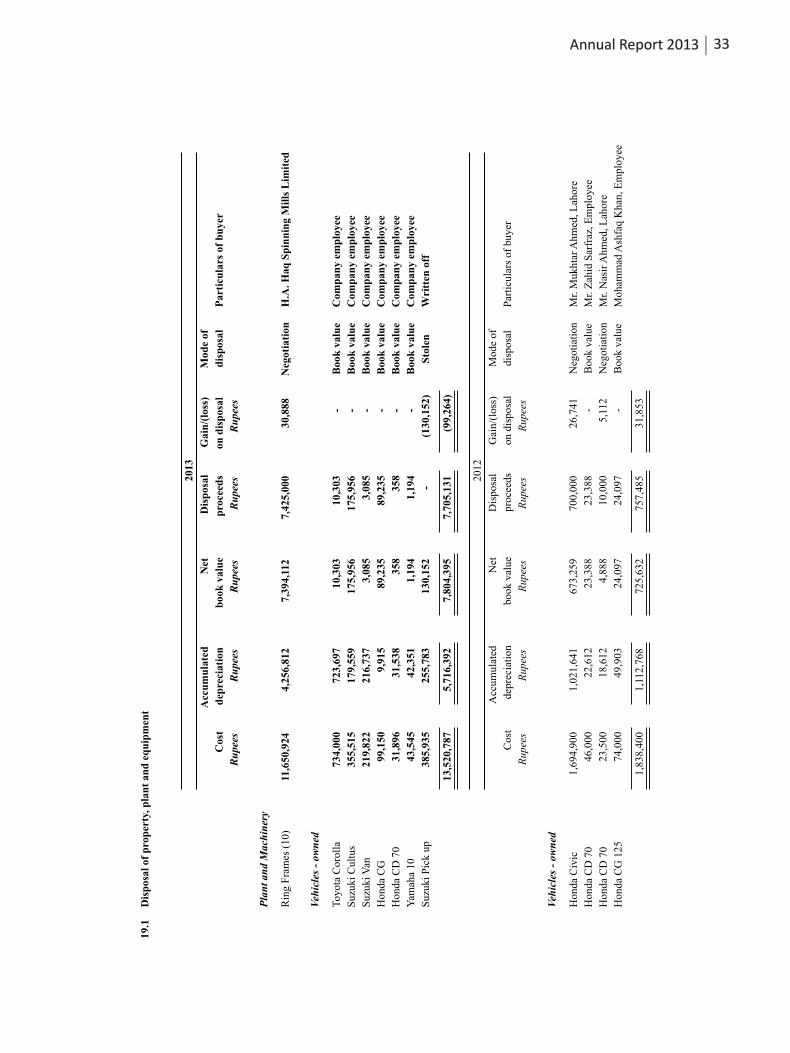
19.1
Dis
pos
al o
f p
rop
erty
, pla
nt
and
eq
uip
men
t
Pla
nt
and
Mach
iner
y
Rin
g F
ram
es (
10)
Veh
icle
s -
own
ed
Toy
ota
Cor
oll
a
Suz
uki
Cul
tus
Suz
uki
Van
Hon
da C
G
Hon
da C
D 7
0
Yam
aha
10
Suz
uki
Pic
k u
p
Veh
icle
s -
own
ed
Hon
da C
ivic
Hon
da C
D 7
0
Hon
da C
D 7
0
Hon
da C
G 1
25
Mod
e of
dis
pos
al
Neg
otia
tion
Boo
k v
alu
e
Boo
k v
alu
e
Boo
k v
alu
e
Boo
k v
alu
e
Boo
k v
alu
e
Boo
k v
alu
e
Sto
len
Mod
e of
disp
osal
Neg
otia
tion
Boo
k va
lue
Neg
otia
tion
Boo
k va
lue
Par
ticu
lars
of
bu
yer
H.A
. H
aq S
pin
nin
g M
ills
Lim
ited
Com
pan
y em
plo
yee
Com
pan
y em
plo
yee
Com
pan
y em
plo
yee
Com
pan
y em
plo
yee
Com
pan
y em
plo
yee
Com
pan
y em
plo
yee
Wri
tten
off
Par
ticu
lars
of
buye
r
Mr.
Muk
htar
Ahm
ed, L
ahor
e
Mr.
Zah
id S
arfr
az, E
mpl
oyee
Mr.
Nas
ir A
hmed
, L
ahor
e
Moh
amm
ad A
shfa
q K
han,
Em
ploy
ee
2012
2013
Cos
t
Ru
pees
11,6
50,9
24
734,
000
35
5,51
5
219,
822
99,1
50
31
,896
43,5
45
385,
935
13,5
20,7
87
Cos
t
Rup
ees
1,69
4,90
0
46,0
00
23
,500
74,0
00
1,83
8,40
0
Acc
um
ula
ted
dep
reci
atio
n
Ru
pees
4,25
6,81
2
723,
697
179,
559
216,
737
9,91
5
31,5
38
42
,351
25
5,78
3
5,71
6,39
2
Acc
um
ulat
ed
depr
ecia
tion
Rup
ees
1,02
1,64
1
22,6
12
18
,612
49
,903
1,11
2,76
8
Net
boo
k v
alu
e
Ru
pees
7,39
4,11
2
10,3
03
175,
956
3,08
5
89
,235
358
1,19
4
130,
152
7,80
4,39
5
Net
book
val
ue
Rup
ees
673,
259
23,3
88
4,
888
24,0
97
725,
632
Dis
pos
al
pro
ceed
s
Ru
pees
7,42
5,00
0
10,3
03
175,
956
3,08
5
89,2
35
358
1,19
4
-
7,70
5,13
1
Dis
posa
l
proc
eeds
Rup
ees
700,
000
23,3
88
10,0
00
24,0
97 75
7,48
5
Gai
n/(
loss
)
on d
isp
osal
Ru
pees
30,8
88
-
-
-
-
-
-
(130
,152
)
(99,
264)
Gai
n/(l
oss)
on d
ispo
sal
Rup
ees
26,7
41
-
5,11
2
-
31,8
53
33Annual Report 2013
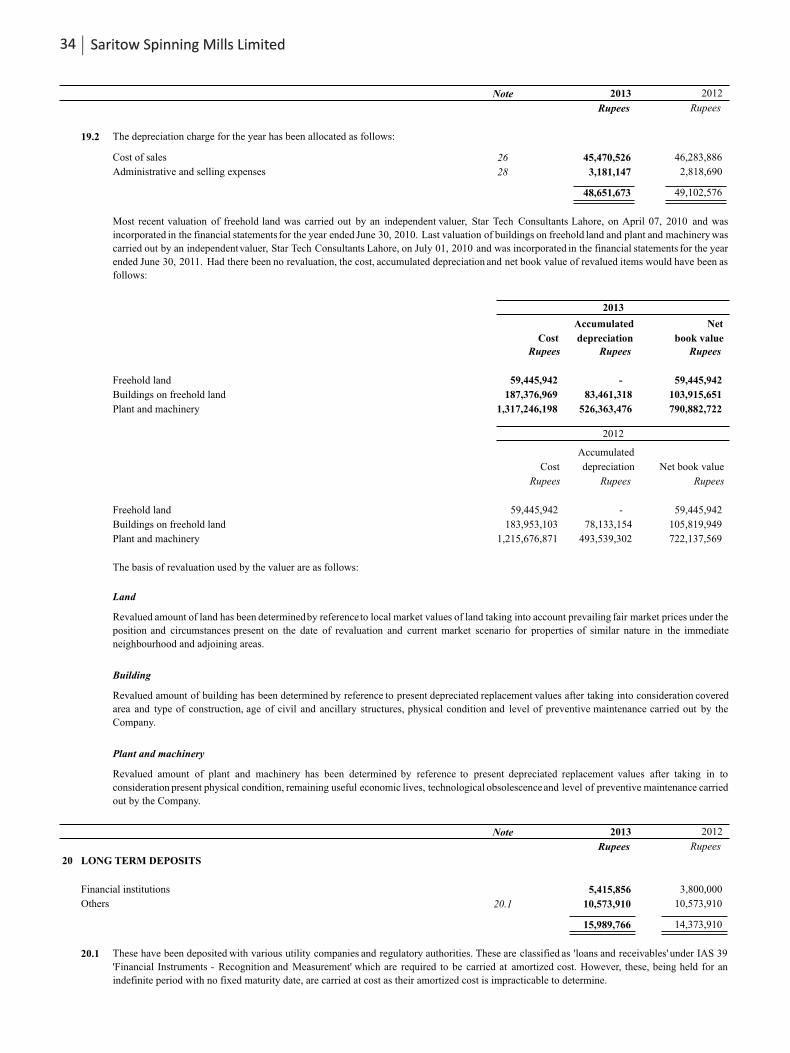
Note 2013 2012
Rupees Rupees
19.2 The depreciation charge for the year has been allocated as follows:
Cost of sales 26 45,470,526 46,283,886
Administrative and selling expenses 28 3,181,147 2,818,690
48,651,673 49,102,576
Freehold land
Buildings on freehold land
Plant and machinery
Freehold land
Buildings on freehold land
Plant and machinery
CostRupees
59,445,942
187,376,969
1,317,246,198
Cost
Rupees
59,445,942
183,953,103
1,215,676,871
Accumulated
depreciationRupees
-
83,461,318
526,363,476
Accumulated
depreciation
Rupees
-
78,133,154
493,539,302
Net
book valueRupees
59,445,942
103,915,651
790,882,722
Net book value
Rupees
59,445,942
105,819,949
722,137,569
The basis of revaluation used by the valuer are as follows:
Land
Building
Plant and machinery
Note 2013 2012
Rupees Rupees
20 LONG TERM DEPOSITS
Financial institutions 5,415,856 3,800,000
Others 20.1 10,573,910 10,573,910
15,989,766 14,373,910
20.1
Revalued amount of land has been determinedby referenceto local market values of land taking into account prevailing fair market prices under the
position and circumstances present on the date of revaluation and current market scenario for properties of similar nature in the immediate
neighbourhood and adjoining areas.
Revalued amount of building has been determined by reference to present depreciated replacement values after taking into consideration covered
area and type of construction, age of civil and ancillary structures, physical condition and level of preventive maintenance carried out by the
Company.
Revalued amount of plant and machinery has been determined by reference to present depreciated replacement values after taking in to
consideration present physical condition, remaining useful economic lives, technological obsolescenceand level of preventive maintenance carried
out by the Company.
These have been deposited with various utility companies and regulatory authorities. These are classified as 'loans and receivables' under IAS 39
'Financial Instruments - Recognition and Measurement' which are required to be carried at amortized cost. However, these, being held for an
indefinite period with no fixed maturity date, are carried at cost as their amortized cost is impracticable to determine.
2012
Most recent valuation of freehold land was carried out by an independent valuer, Star Tech Consultants Lahore, on April 07, 2010 and was
incorporated in the financial statements for the year ended June 30, 2010. Last valuation of buildings on freehold land and plant and machinery was
carried out by an independentvaluer, Star Tech Consultants Lahore, on July 01, 2010 and was incorporated in the financial statements for the year
ended June 30, 2011. Had there been no revaluation, the cost, accumulated depreciation and net book value of revalued items would have been as
follows:
2013
34 Saritow Spinning Mills Limited
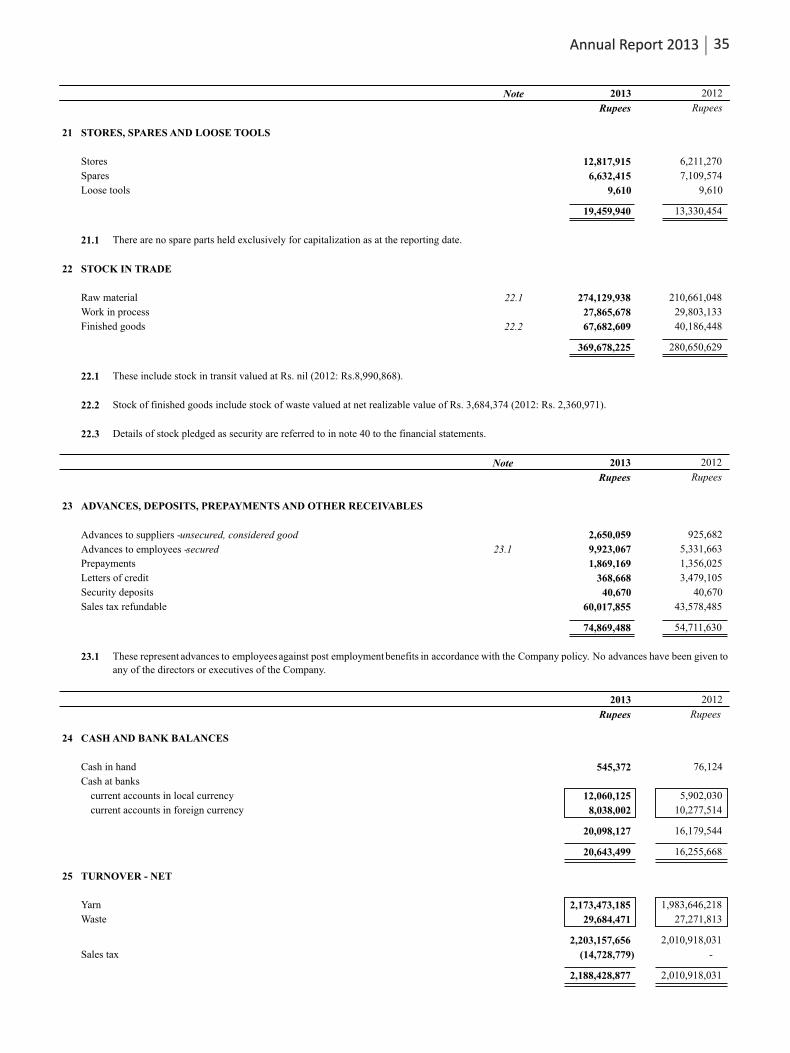
21 STORES, SPARES AND LOOSE TOOLS
Stores 12,817,915 6,211,270
Spares 6,632,415 7,109,574
Loose tools 9,610 9,610
19,459,940 13,330,454
21.1
22 STOCK IN TRADE
Raw material 22.1 274,129,938 210,661,048
Work in process 27,865,678 29,803,133
Finished goods 22.2 67,682,609 40,186,448
369,678,225 280,650,629
22.1 These include stock in transit valued at Rs. nil (2012: Rs.8,990,868).
22.2 Stock of finished goods include stock of waste valued at net realizable value of Rs. 3,684,374 (2012: Rs. 2,360,971).
22.3 Details of stock pledged as security are referred to in note 40 to the financial statements.
Note 2013 2012
Rupees Rupees
23 ADVANCES, DEPOSITS, PREPAYMENTS AND OTHER RECEIVABLES
Advances to suppliers - unsecured, considered good 2,650,059 925,682
Advances to employees - secured 23.1 9,923,067 5,331,663
Prepayments 1,869,169 1,356,025
Letters of credit 368,668 3,479,105
Security deposits 40,670 40,670
Sales tax refundable 60,017,855 43,578,485
74,869,488 54,711,630
23.1
2013 2012
Rupees Rupees
24 CASH AND BANK BALANCES
Cash in hand 545,372 76,124
Cash at banks
current accounts in local currency 12,060,125 5,902,030
current accounts in foreign currency 8,038,002 10,277,514
20,098,127 16,179,544
20,643,499 16,255,668
25 TURNOVER - NET
Yarn 2,173,473,185 1,983,646,218
Waste 29,684,471 27,271,813
2,203,157,656 2,010,918,031
Sales tax (14,728,779) -
2,188,428,877 2,010,918,031
These represent advances to employeesagainst post employmentbenefits in accordance with the Company policy. No advances have been given to
any of the directors or executives of the Company.
There are no spare parts held exclusively for capitalization as at the reporting date.
Note 2013 2012
Rupees Rupees
35Annual Report 2013
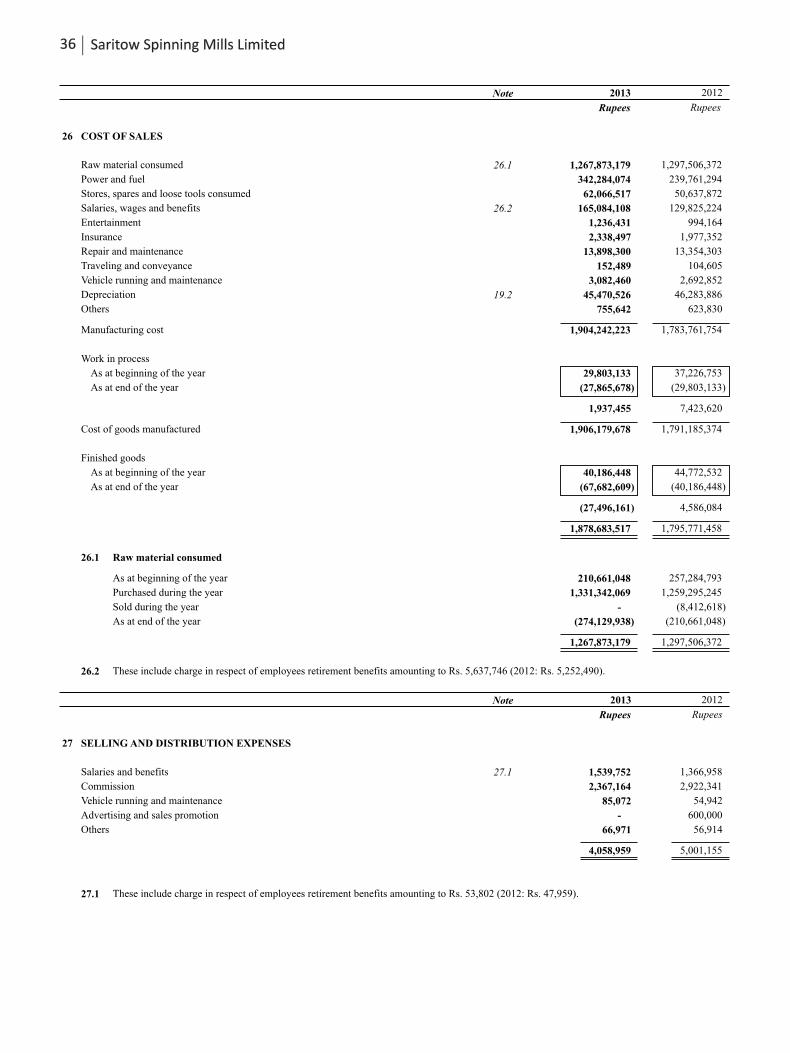
Note 2013 2012
Rupees Rupees
26 COST OF SALES
Raw material consumed 26.1 1,267,873,179 1,297,506,372
Power and fuel 342,284,074 239,761,294
Stores, spares and loose tools consumed 62,066,517 50,637,872
Salaries, wages and benefits 26.2 165,084,108 129,825,224
Entertainment 1,236,431 994,164
Insurance 2,338,497 1,977,352
Repair and maintenance 13,898,300 13,354,303
Traveling and conveyance 152,489 104,605
Vehicle running and maintenance 3,082,460 2,692,852
Depreciation 19.2 45,470,526 46,283,886
Others 755,642 623,830
Manufacturing cost 1,904,242,223 1,783,761,754
Work in process
As at beginning of the year 29,803,133 37,226,753
As at end of the year (27,865,678) (29,803,133)
1,937,455 7,423,620
Cost of goods manufactured 1,906,179,678 1,791,185,374
Finished goods
As at beginning of the year 40,186,448 44,772,532
As at end of the year (67,682,609) (40,186,448)
(27,496,161) 4,586,084
1,878,683,517 1,795,771,458
26.1 Raw material consumed
As at beginning of the year 210,661,048 257,284,793
Purchased during the year 1,331,342,069 1,259,295,245
Sold during the year - (8,412,618)
As at end of the year (274,129,938) (210,661,048)
1,267,873,179 1,297,506,372
26.2 These include charge in respect of employees retirement benefits amounting to Rs. 5,637,746 (2012: Rs. 5,252,490).
Note 2013 2012
Rupees Rupees
27 SELLING AND DISTRIBUTION EXPENSES
Salaries and benefits 27.1 1,539,752 1,366,958
Commission 2,367,164 2,922,341
Vehicle running and maintenance 85,072 54,942
Advertising and sales promotion - 600,000
Others 66,971 56,914
4,058,959 5,001,155
27.1 These include charge in respect of employees retirement benefits amounting to Rs. 53,802 (2012: Rs. 47,959).
36 Saritow Spinning Mills Limited
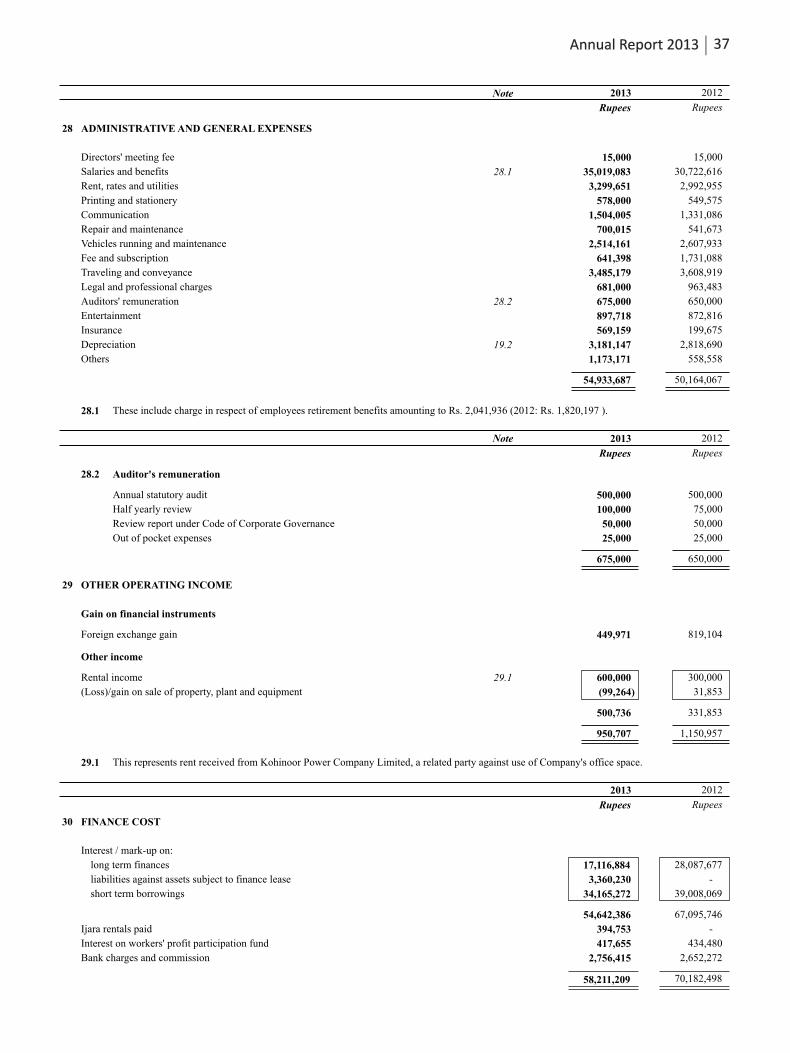
28 ADMINISTRATIVE AND GENERAL EXPENSES
Directors' meeting fee 15,000 15,000
Salaries and benefits 28.1 35,019,083 30,722,616
Rent, rates and utilities 3,299,651 2,992,955
Printing and stationery 578,000 549,575
Communication 1,504,005 1,331,086
Repair and maintenance 700,015 541,673
Vehicles running and maintenance 2,514,161 2,607,933
Fee and subscription 641,398 1,731,088
Traveling and conveyance 3,485,179 3,608,919
Legal and professional charges 681,000 963,483
Auditors' remuneration 28.2 675,000 650,000
Entertainment 897,718 872,816
Insurance 569,159 199,675
Depreciation 19.2 3,181,147 2,818,690
Others 1,173,171 558,558
54,933,687 50,164,067
28.1 These include charge in respect of employees retirement benefits amounting to Rs. 2,041,936 (2012: Rs. 1,820,197 ).
28.2 Auditor's remuneration
Annual statutory audit 500,000 500,000
Half yearly review 100,000 75,000
Review report under Code of Corporate Governance 50,000 50,000
Out of pocket expenses 25,000 25,000
675,000 650,000
29 OTHER OPERATING INCOME
Gain on financial instruments
Foreign exchange gain 449,971 819,104
Other income
Rental income 29.1 600,000 300,000
(Loss)/gain on sale of property, plant and equipment (99,264) 31,853
500,736 331,853
950,707 1,150,957
29.1 This represents rent received from Kohinoor Power Company Limited, a related party against use of Company's office space.
30 FINANCE COST
Interest / mark-up on:
long term finances 17,116,884 28,087,677
liabilities against assets subject to finance lease 3,360,230 -
short term borrowings 34,165,272 39,008,069
54,642,386 67,095,746
Ijara rentals paid 394,753 -
Interest on workers' profit participation fund 417,655 434,480
Bank charges and commission 2,756,415 2,652,272
58,211,209 70,182,498
Note
Note
2013 2012
Rupees Rupees
2013 2012
Rupees Rupees
2013 2012
Rupees Rupees
37Annual Report 2013
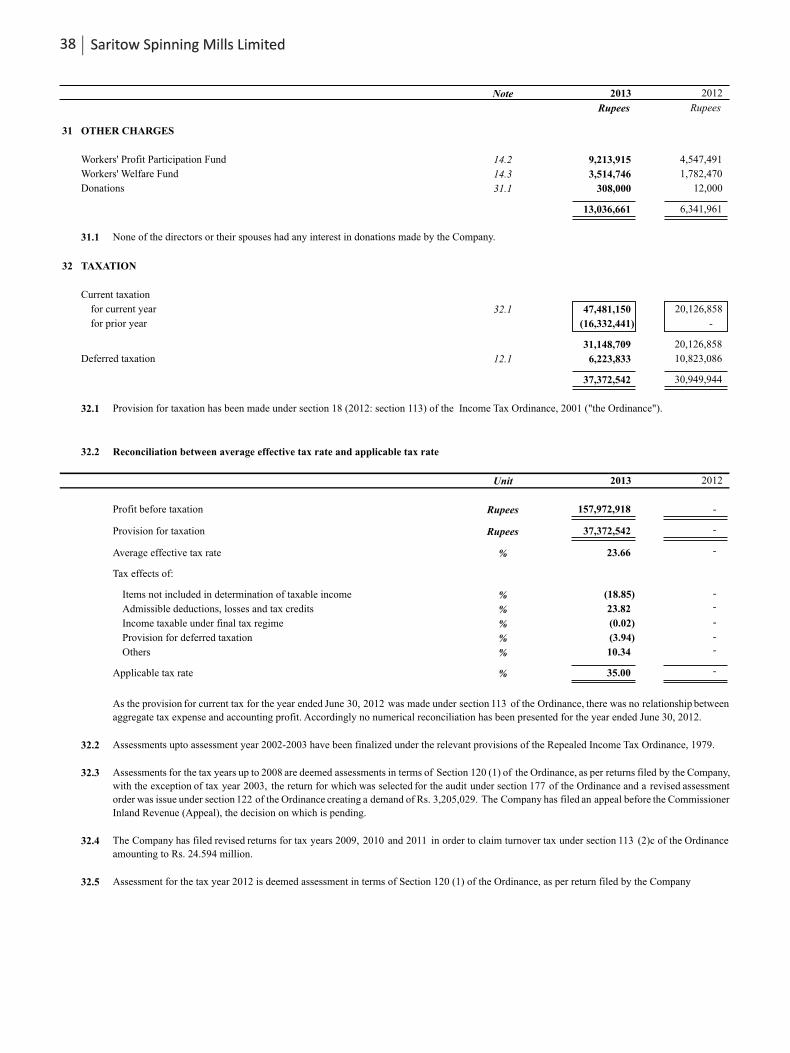
Note 2013 2012
Rupees Rupees
31 OTHER CHARGES
Workers' Profit Participation Fund 14.2 9,213,915 4,547,491
Workers' Welfare Fund 14.3 3,514,746 1,782,470
Donations 31.1 308,000 12,000
13,036,661 6,341,961
31.1 None of the directors or their spouses had any interest in donations made by the Company.
32 TAXATION
Current taxation
for current year 32.1 47,481,150 20,126,858
for prior year (16,332,441) -
31,148,709 20,126,858
Deferred taxation 12.1 6,223,833 10,823,086
37,372,542 30,949,944
32.1
32.2 Reconciliation between average effective tax rate and applicable tax rate
Unit 2013 2012
Profit before taxation Rupees 157,972,918
Provision for taxation Rupees 37,372,542
Average effective tax rate % 23.66
Tax effects of:
Items not included in determination of taxable income % (18.85)
Admissible deductions, losses and tax credits % 23.82
Income taxable under final tax regime % (0.02)
Provision for deferred taxation % (3.94)
Others % 10.34
Applicable tax rate % 35.00
Provision for taxation has been made under section 18 (2012: section 113) of the Income Tax Ordinance, 2001 ("the Ordinance").
32.2 Assessments upto assessment year 2002-2003 have been finalized under the relevant provisions of the Repealed Income Tax Ordinance, 1979.
32.3 Assessments for the tax years up to 2008 are deemed assessments in terms of Section 120 (1) of the Ordinance, as per returns filed by the Company,
with the exception of tax year 2003, the return for which was selected for the audit under section 177 of the Ordinance and a revised assessment
order was issue under section 122 of the Ordinance creating a demand of Rs. 3,205,029. The Company has filed an appeal before the Commissioner
Inland Revenue (Appeal), the decision on which is pending.
32.4 The Company has filed revised returns for tax years 2009, 2010 and 2011 in order to claim turnover tax under section 113 (2)c of the Ordinance
amounting to Rs. 24.594 million.
32.5 Assessment for the tax year 2012 is deemed assessment in terms of Section 120 (1) of the Ordinance, as per return filed by the Company
As the provision for current tax for the year ended June 30, 2012 was made under section 113 of the Ordinance, there was no relationship between
aggregate tax expense and accounting profit. Accordingly no numerical reconciliation has been presented for the year ended June 30, 2012.
-
-
-
-
-
-
-
-
-
38 Saritow Spinning Mills Limited
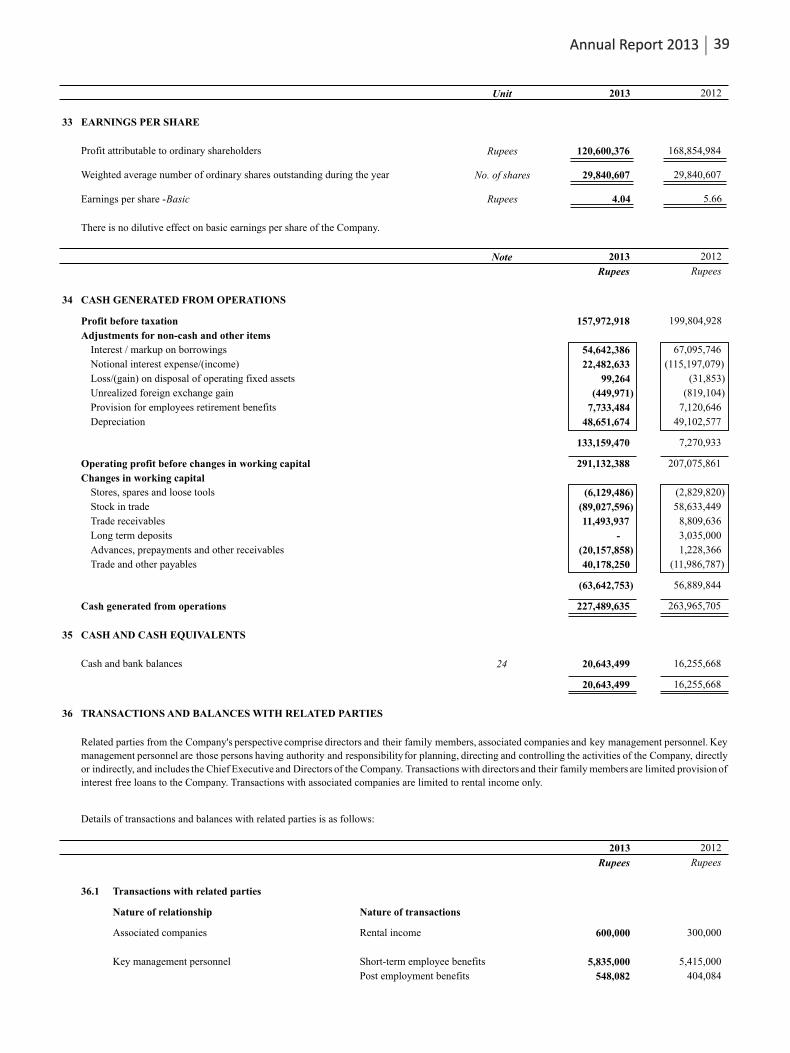
Unit 2013 2012
33 EARNINGS PER SHARE
Profit attributable to ordinary shareholders Rupees 120,600,376 168,854,984
Weighted average number of ordinary shares outstanding during the year No. of shares 29,840,607 29,840,607
Earnings per share - Basic Rupees 4.04 5.66
There is no dilutive effect on basic earnings per share of the Company.
Note 2013 2012
Rupees Rupees
34 CASH GENERATED FROM OPERATIONS
Profit before taxation 157,972,918 199,804,928
Adjustments for non-cash and other items
Interest / markup on borrowings 54,642,386 67,095,746
Notional interest expense/(income) 22,482,633 (115,197,079)
Loss/(gain) on disposal of operating fixed assets 99,264 (31,853)
Unrealized foreign exchange gain (449,971) (819,104)
Provision for employees retirement benefits 7,733,484 7,120,646
Depreciation 48,651,674 49,102,577
133,159,470 7,270,933
Operating profit before changes in working capital 291,132,388 207,075,861
Changes in working capital
Stores, spares and loose tools (6,129,486) (2,829,820)
Stock in trade (89,027,596) 58,633,449
Trade receivables 11,493,937 8,809,636
Long term deposits - 3,035,000
Advances, prepayments and other receivables (20,157,858) 1,228,366
Trade and other payables 40,178,250 (11,986,787)
(63,642,753) 56,889,844
Cash generated from operations 227,489,635 263,965,705
35 CASH AND CASH EQUIVALENTS
Cash and bank balances 24 20,643,499 16,255,668
20,643,499 16,255,668
36 TRANSACTIONS AND BALANCES WITH RELATED PARTIES
Details of transactions and balances with related parties is as follows:
2013 2012
Rupees Rupees
36.1 Transactions with related parties
Nature of relationship Nature of transactions
Associated companies Rental income 600,000 300,000
Key management personnel Short-term employee benefits 5,835,000 5,415,000
Post employment benefits 548,082 404,084
Related parties from the Company's perspective comprise directors and their family members, associated companies and key management personnel. Key
management personnel are those persons having authority and responsibilityfor planning, directing and controlling the activities of the Company, directly
or indirectly, and includes the Chief Executive and Directors of the Company. Transactions with directors and their family members are limited provision of
interest free loans to the Company. Transactions with associated companies are limited to rental income only.
39Annual Report 2013
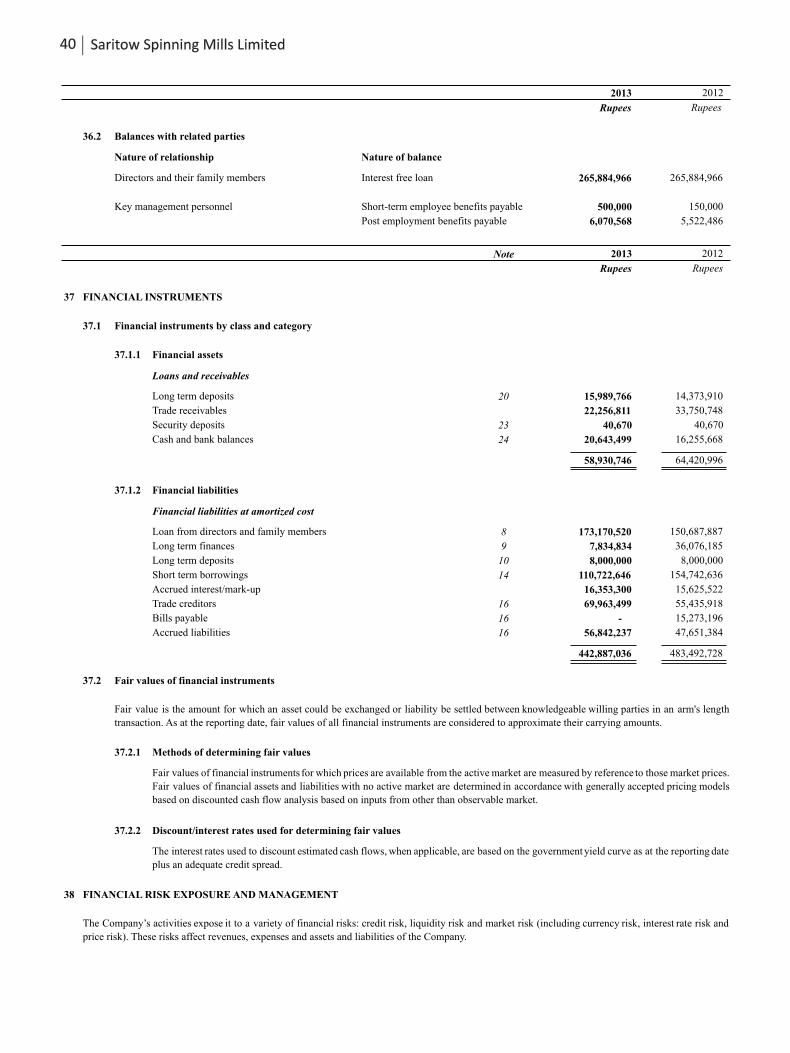
2013 2012
Rupees Rupees
36.2 Balances with related parties
Nature of relationship Nature of balance
Directors and their family members Interest free loan 265,884,966 265,884,966
Key management personnel Short-term employee benefits payable 500,000 150,000
Post employment benefits payable 6,070,568 5,522,486
Note 2013 2012
Rupees Rupees
37 FINANCIAL INSTRUMENTS
37.1 Financial instruments by class and category
37.1.1 Financial assets
Loans and receivables
Long term deposits 20 15,989,766 14,373,910
Trade receivables 22,256,811 33,750,748
Security deposits 23 40,670 40,670
Cash and bank balances 24 20,643,499 16,255,668
58,930,746 64,420,996
37.1.2 Financial liabilities
Financial liabilities at amortized cost
Loan from directors and family members 8 173,170,520 150,687,887
Long term finances 9 7,834,834 36,076,185
Long term deposits 10 8,000,000 8,000,000
Short term borrowings 14 110,722,646 154,742,636
Accrued interest/mark-up 16,353,300 15,625,522
Trade creditors 16 69,963,499 55,435,918
Bills payable 16 - 15,273,196
Accrued liabilities 16 56,842,237 47,651,384
442,887,036 483,492,728
37.2 Fair values of financial instruments
37.2.1 Methods of determining fair values
37.2.2 Discount/interest rates used for determining fair values
38 FINANCIAL RISK EXPOSURE AND MANAGEMENT
The interest rates used to discount estimated cash flows, when applicable, are based on the government yield curve as at the reporting date
plus an adequate credit spread.
The Company’s activities expose it to a variety of financial risks: credit risk, liquidity risk and market risk (including currency risk, interest rate risk and
price risk). These risks affect revenues, expenses and assets and liabilities of the Company.
Fair value is the amount for which an asset could be exchanged or liability be settled between knowledgeable willing parties in an arm's length
transaction. As at the reporting date, fair values of all financial instruments are considered to approximate their carrying amounts.
Fair values of financial instruments for which prices are available from the active market are measured by reference to those market prices.
Fair values of financial assets and liabilities with no active market are determined in accordance with generally accepted pricing models
based on discounted cash flow analysis based on inputs from other than observable market.
40 Saritow Spinning Mills Limited
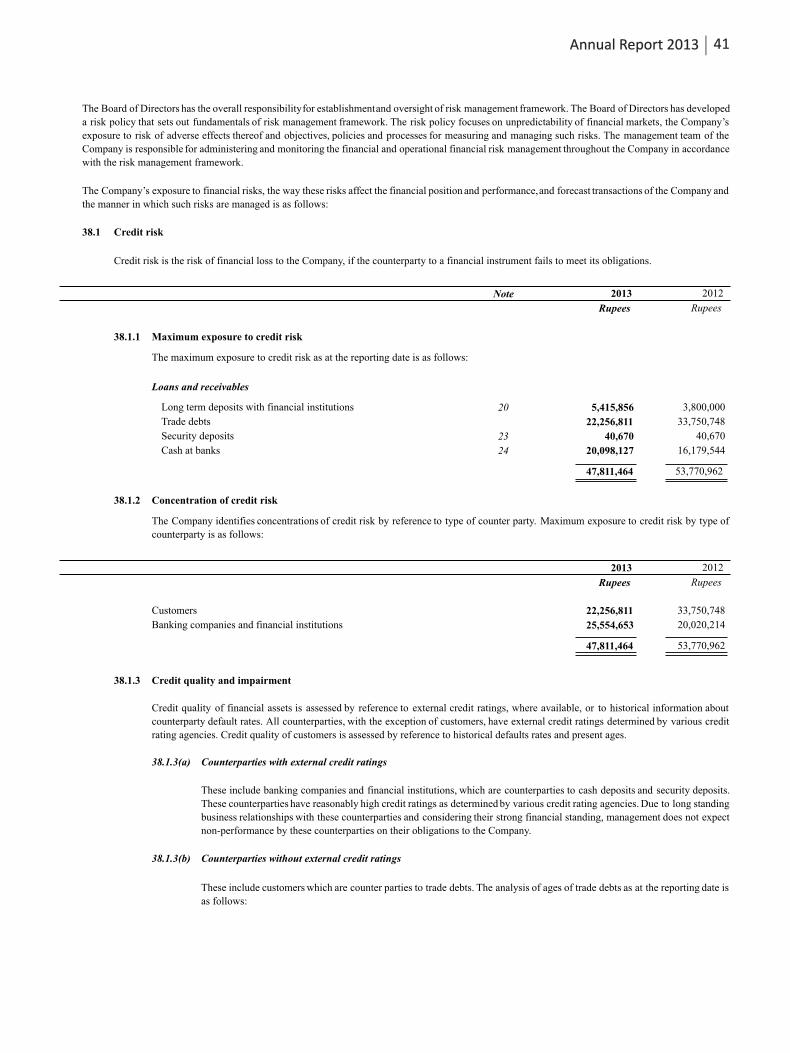
38.1 Credit risk
Note 2013
2013
2012
2012
Rupees
Rupees
Rupees
Rupees
38.1.1 Maximum exposure to credit risk
The maximum exposure to credit risk as at the reporting date is as follows:
Loans and receivables
Long term deposits with financial institutions 20 5,415,856 3,800,000
Trade debts 22,256,811 33,750,748
Security deposits 23 40,670 40,670
Cash at banks 24 20,098,127 16,179,544
47,811,464 53,770,962
38.1.2 Concentration of credit risk
Customers 22,256,811 33,750,748
Banking companies and financial institutions 25,554,653 20,020,214
47,811,464 53,770,962
38.1.3 Credit quality and impairment
38.1.3(a) Counterparties with external credit ratings
38.1.3(b) Counterparties without external credit ratings
The Board of Directors has the overall responsibilityfor establishmentand oversight of risk management framework. The Board of Directors has developed
a risk policy that sets out fundamentals of risk management framework. The risk policy focuses on unpredictability of financial markets, the Company’s
exposure to risk of adverse effects thereof and objectives, policies and processes for measuring and managing such risks. The management team of the
Company is responsible for administering and monitoring the financial and operational financial risk management throughout the Company in accordance
with the risk management framework.
The Company’s exposure to financial risks, the way these risks affect the financial position and performance,and forecast transactions of the Company and
the manner in which such risks are managed is as follows:
These include banking companies and financial institutions, which are counterparties to cash deposits and security deposits.
These counterparties have reasonably high credit ratings as determined by various credit rating agencies. Due to long standing
business relationships with these counterparties and considering their strong financial standing, management does not expect
non-performance by these counterparties on their obligations to the Company.
These include customers which are counter parties to trade debts. The analysis of ages of trade debts as at the reporting date is
as follows:
Credit risk is the risk of financial loss to the Company, if the counterparty to a financial instrument fails to meet its obligations.
The Company identifies concentrations of credit risk by reference to type of counter party. Maximum exposure to credit risk by type of
counterparty is as follows:
Credit quality of financial assets is assessed by reference to external credit ratings, where available, or to historical information about
counterparty default rates. All counterparties, with the exception of customers, have external credit ratings determined by various credit
rating agencies. Credit quality of customers is assessed by reference to historical defaults rates and present ages.
41Annual Report 2013
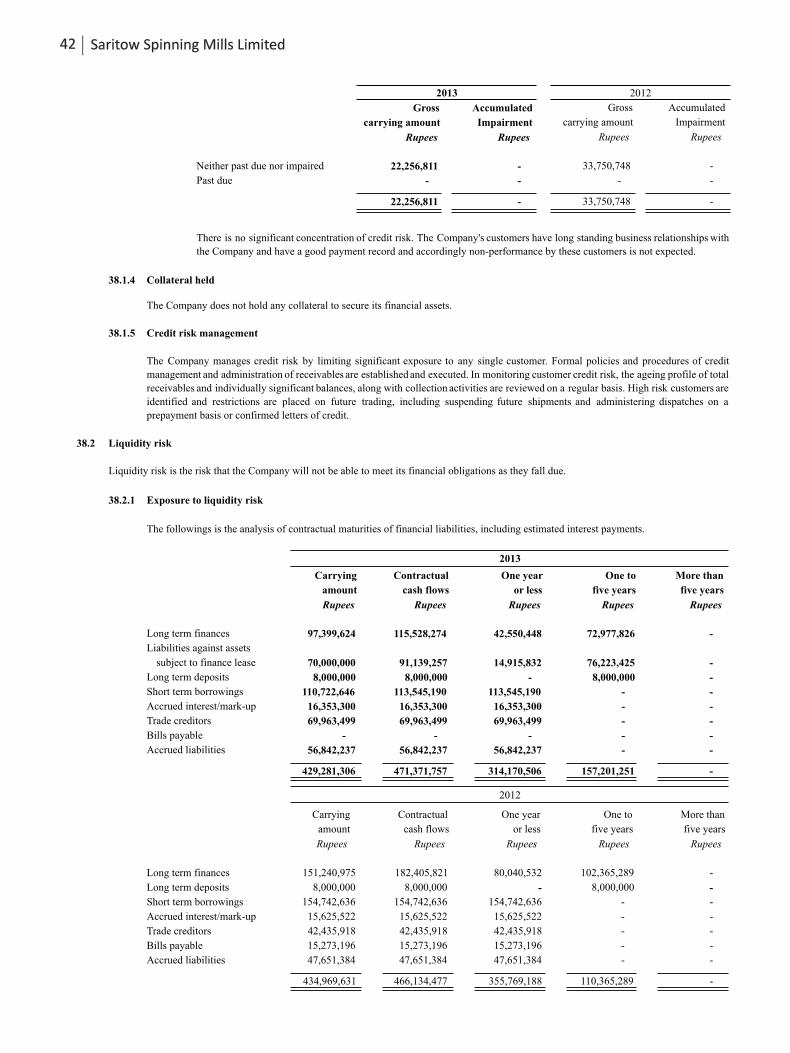
Gross Accumulated Gross Accumulated
carrying amount Impairment carrying amount Impairment
Rupees Rupees Rupees Rupees
Neither past due nor impaired 22,256,811 - 33,750,748 -
Past due - - - -
22,256,811 - 33,750,748 -
38.1.4 Collateral held
38.1.5 Credit risk management
38.2 Liquidity risk
Liquidity risk is the risk that the Company will not be able to meet its financial obligations as they fall due.
38.2.1 Exposure to liquidity risk
The followings is the analysis of contractual maturities of financial liabilities, including estimated interest payments.
Long term finances
Liabilities against assets
subject to finance lease
Long term deposits
Short term borrowings
Accrued interest/mark-up
Trade creditors
Bills payable
Accrued liabilities
Carrying Contractual One year One to More than
amount cash flows or less five years five years
Rupees Rupees Rupees Rupees Rupees
Long term finances 151,240,975 182,405,821 80,040,532 -
Long term deposits 8,000,000 8,000,000 - -
Short term borrowings 154,742,636 154,742,636 154,742,636 -
Accrued interest/mark-up 15,625,522 15,625,522 15,625,522 -
Trade creditors 42,435,918 42,435,918 42,435,918 -
Bills payable 15,273,196 15,273,196 15,273,196 -
Accrued liabilities 47,651,384 47,651,384 47,651,384 -
434,969,631 466,134,477 355,769,188
102,365,289
8,000,000
-
-
-
-
-
110,365,289 -
The Company manages credit risk by limiting significant exposure to any single customer. Formal policies and procedures of credit
management and administration of receivables are established and executed. In monitoring customer credit risk, the ageing profile of total
receivables and individually significant balances, along with collection activities are reviewed on a regular basis. High risk customers are
identified and restrictions are placed on future trading, including suspending future shipments and administering dispatches on a
prepayment basis or confirmed letters of credit.
2013
2012
There is no significant concentration of credit risk. The Company's customers have long standing business relationships with
the Company and have a good payment record and accordingly non-performance by these customers is not expected.
2013 2012
The Company does not hold any collateral to secure its financial assets.
Carrying
amount
Rupees
97,399,624
70,000,000
8,000,000
110,722,646
16,353,300
69,963,499
-
56,842,237
429,281,306
Contractual
cash flows
Rupees
115,528,274
91,139,257
8,000,000
113,545,190
16,353,300
69,963,499
-
56,842,237
471,371,757
One year
or less
Rupees
42,550,448
14,915,832
-
113,545,190
16,353,300
69,963,499
-
56,842,237
314,170,506
One to
five years
Rupees
72,977,826
76,223,425
8,000,000
-
-
-
-
-
157,201,251
More than
five years
Rupees
-
-
-
-
-
-
-
-
-
42 Saritow Spinning Mills Limited
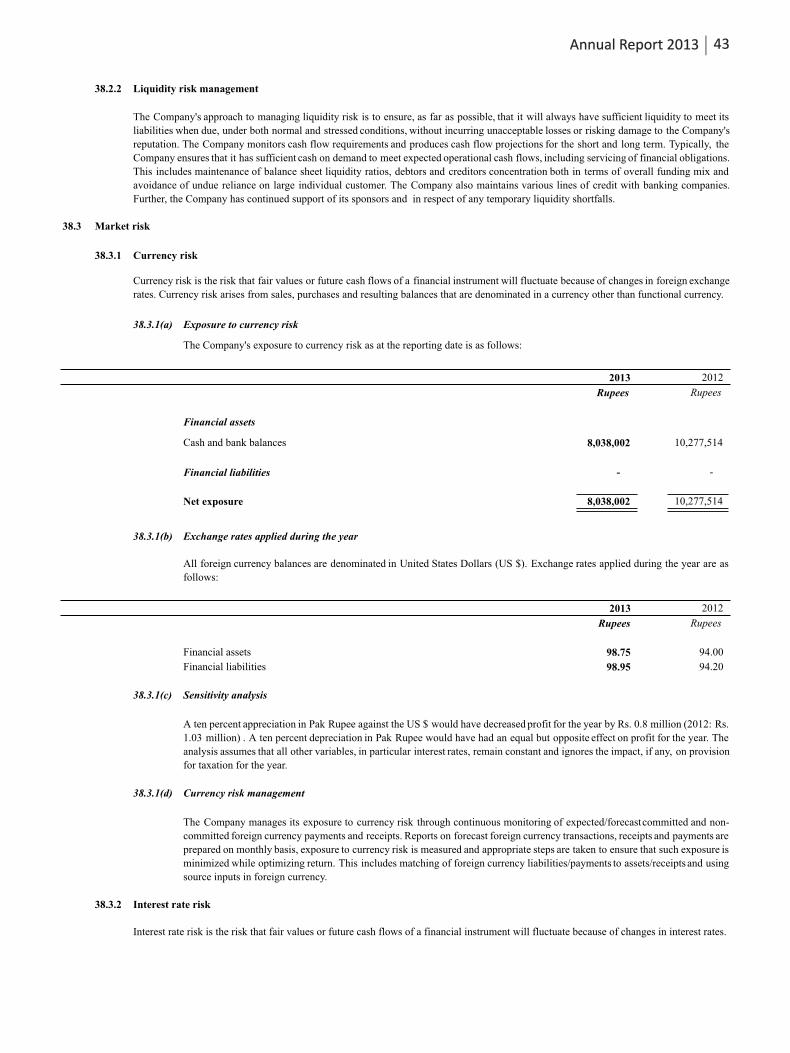
38.2.2 Liquidity risk management
38.3 Market risk
38.3.1 Currency risk
38.3.1(a) Exposure to currency risk
2013 2012
Rupees Rupees
Financial assets
Cash and bank balances 8,038,002 10,277,514
Financial liabilities - -
Net exposure 8,038,002 10,277,514
38.3.1(b) Exchange rates applied during the year
2013 2012
Rupees Rupees
Financial assets 98.75 94.00
Financial liabilities 98.95 94.20
38.3.1(c) Sensitivity analysis
38.3.1(d) Currency risk management
38.3.2 Interest rate risk
A ten percent appreciation in Pak Rupee against the US $ would have decreased profit for the year by Rs. 0.8 million (2012: Rs.
1.03 million) . A ten percent depreciation in Pak Rupee would have had an equal but opposite effect on profit for the year. The
analysis assumes that all other variables, in particular interest rates, remain constant and ignores the impact, if any, on provision
for taxation for the year.
The Company's approach to managing liquidity risk is to ensure, as far as possible, that it will always have sufficient liquidity to meet its
liabilities when due, under both normal and stressed conditions, without incurring unacceptable losses or risking damage to the Company's
reputation. The Company monitors cash flow requirements and produces cash flow projections for the short and long term. Typically, the
Company ensures that it has sufficient cash on demand to meet expected operational cash flows, including servicing of financial obligations.
This includes maintenance of balance sheet liquidity ratios, debtors and creditors concentration both in terms of overall funding mix and
avoidance of undue reliance on large individual customer. The Company also maintains various lines of credit with banking companies.
Further, the Company has continued support of its sponsors and in respect of any temporary liquidity shortfalls.
Currency risk is the risk that fair values or future cash flows of a financial instrument will fluctuate because of changes in foreign exchange
rates. Currency risk arises from sales, purchases and resulting balances that are denominated in a currency other than functional currency.
The Company's exposure to currency risk as at the reporting date is as follows:
All foreign currency balances are denominated in United States Dollars (US $). Exchange rates applied during the year are as
follows:
The Company manages its exposure to currency risk through continuous monitoring of expected/forecastcommitted and non-
committed foreign currency payments and receipts. Reports on forecast foreign currency transactions, receipts and payments are
prepared on monthly basis, exposure to currency risk is measured and appropriate steps are taken to ensure that such exposure is
minimized while optimizing return. This includes matching of foreign currency liabilities/payments to assets/receipts and using
source inputs in foreign currency.
Interest rate risk is the risk that fair values or future cash flows of a financial instrument will fluctuate because of changes in interest rates.
43Annual Report 2013
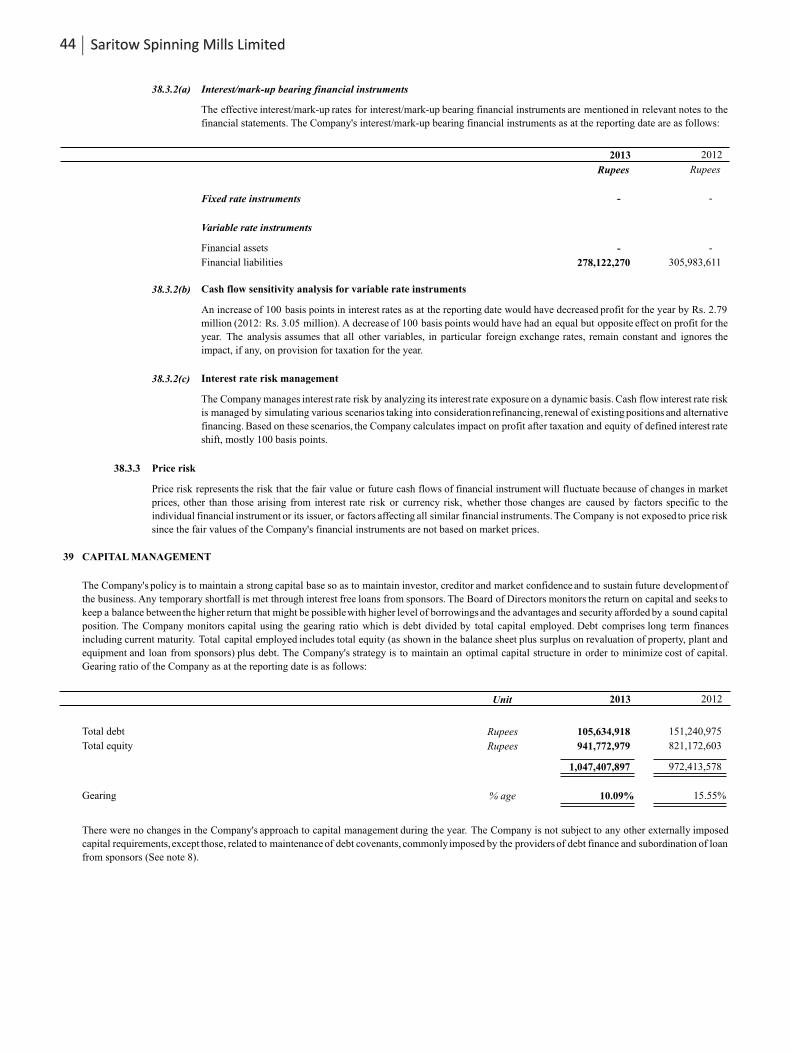
38.3.2(a) Interest/mark-up bearing financial instruments
2013 2012
Rupees Rupees
Fixed rate instruments - -
Variable rate instruments
Financial assets - -
Financial liabilities 278,122,270 305,983,611
38.3.2(b) Cash flow sensitivity analysis for variable rate instruments
38.3.2(c) Interest rate risk management
38.3.3 Price risk
39 CAPITAL MANAGEMENT
Unit 2013 2012
Total debt Rupees 105,634,918 151,240,975
Total equity Rupees 941,772,979 821,172,603
1,047,407,897 972,413,578
Gearing % age 10.09% 15.55%
The Company manages interest rate risk by analyzing its interest rate exposure on a dynamic basis. Cash flow interest rate risk
is managed by simulating various scenarios taking into considerationrefinancing, renewal of existing positions and alternative
financing. Based on these scenarios, the Company calculates impact on profit after taxation and equity of defined interest rate
shift, mostly 100 basis points.
The Company's policy is to maintain a strong capital base so as to maintain investor, creditor and market confidence and to sustain future developmentof
the business. Any temporary shortfall is met through interest free loans from sponsors. The Board of Directors monitors the return on capital and seeks to
keep a balance between the higher return that might be possiblewith higher level of borrowingsand the advantages and security afforded by a sound capital
position. The Company monitors capital using the gearing ratio which is debt divided by total capital employed. Debt comprises long term finances
including current maturity. Total capital employed includes total equity (as shown in the balance sheet plus surplus on revaluation of property, plant and
equipment and loan from sponsors) plus debt. The Company's strategy is to maintain an optimal capital structure in order to minimize cost of capital.
Gearing ratio of the Company as at the reporting date is as follows:
There were no changes in the Company's approach to capital management during the year. The Company is not subject to any other externally imposed
capital requirements,except those, related to maintenance of debt covenants, commonly imposed by the providers of debt finance and subordination of loan
from sponsors (See note 8).
Price risk represents the risk that the fair value or future cash flows of financial instrument will fluctuate because of changes in market
prices, other than those arising from interest rate risk or currency risk, whether those changes are caused by factors specific to the
individual financial instrument or its issuer, or factors affecting all similar financial instruments. The Company is not exposed to price risk
since the fair values of the Company's financial instruments are not based on market prices.
An increase of 100 basis points in interest rates as at the reporting date would have decreased profit for the year by Rs. 2.79
million (2012: Rs. 3.05 million). A decrease of 100 basis points would have had an equal but opposite effect on profit for the
year. The analysis assumes that all other variables, in particular foreign exchange rates, remain constant and ignores the
impact, if any, on provision for taxation for the year.
The effective interest/mark-up rates for interest/mark-up bearing financial instruments are mentioned in relevant notes to the
financial statements. The Company's interest/mark-up bearing financial instruments as at the reporting date are as follows:
44 Saritow Spinning Mills Limited

2013 2012
Rupees Rupees
40 RESTRICTION ON TITLE, AND ASSETS PLEDGED AS SECURITY
Mortgages and charges
Charge over current assets 800,828,000 800,828,000
Charge over operating fixed assets 1,108,173,000 1,108,173,000
Pledge
Raw material 274,129,938 210,661,048
Finished goods 65,321,638 37,825,477
41 EVENTS AFTER THE REPORTING PERIOD
42 REMUNERATION OF CHIEF EXECUTIVE, DIRECTORS AND EXECUTIVES
Chief Executive Directors Executives
Rupees Rupees Rupees
Managerial remuneration - 3,820,000 7,092,216
Allowances and perquisites - 2,000,000 3,546,060
Meeting fee - 15,000 -
Post employment benefits - 548,082 803,239
- 6,383,082 11,441,515
Number of persons - 2 8
Chief Executive Directors Executives
Rupees Rupees Rupees
Managerial remuneration - 3,600,000 5,563,728
Allowances and perquisites - 1,800,000 2,871,867
Meeting fee - 15,000 -
Post employment benefits - 404,084 898,883
- 5,819,084 9,334,478
Number of persons - 2 8
43 PLANT CAPACITY AND ACTUAL PRODUCTION
Unit 2013 2012
Number of spindles installed No. 51,840 51,840
Plant capacity on the basis of utilization converted into 80s count Kgs 3,054,796 3,054,796
Actual production converted into 80s count Kgs 2,396,784 2,294,413
The Board of Directors in their meeting held on October 09, 2013 has proposed dividend on ordinary shares at Rs. 1 per ordinary share of Rs. 10 each
payable to shareholders other than sponsors and directors of the Company. The proposed dividend is subject to approval by the shareholders in the
forthcoming annual general meeting.
It is difficult to precisely compare production capacity and the resultant production converted into base count in the textile industry since it fluctuates
widely depending on various factors such as count of yarn spun, raw materials used, spindle speed and twist etc. It would also vary according to the
pattern of production adopted in a particular year. Further, power shortage in the country has also resulted in lower capacity utilization.
In addition to the above, Saritow Spinning Mills Limited ("SSML") has given undertaking to various banking companies to effect that the Company,
pursuant to the merger of Azam Textile Mills Limited ("ATML") into SSML will be liable in respect of all finance facilities availed by ATML in the
same manner as ATML was originally liable to the extent of Rs. 720 million.
The aggregate amount charged to profit or loss in respect of chief executive, directors and executives of the Company on account of managerial
remuneration, allowances and perquisites, post employment benefits and the number of such directors and executives is as follows:
2013
2012
45Annual Report 2013
LahoreDate: October 09, 2013 CHIEF EXECUTIVE DIRECTOR
44 NUMBER OF EMPLOYEES
45 NON-CASH FINANCING ACTIVITIES
46 RECOVERABLE AMOUNTS AND IMPAIRMENT
47 DATE OF AUTHORIZATION FOR ISSUE
48 GENERAL
Figures have been rounded off to the nearest rupee.
Total number of employees of the Company as at the reporting date are 1,167 (2012: 1,095). Average number of persons employed by the Company
during the year are 1,162 (2012: 1,038).
As at the reporting date, recoverable amounts of all assets/cash generating units are equal to or exceed their carrying amounts, unless stated otherwise in
these financial statements.
During the year, the Company acquired property, plant and equipment amounting to Rs. 70,000,000 (2012: nil) by means of finance lease.
These financial statements were authorized for issue on October 09, 2013 by the Board of Directors of the Company.
Comparative figures have been rearranged and reclassified, where necessary, for the purpose of comparison. However, there were no significant
reclassifications during the year.
46 Saritow Spinning Mills Limited
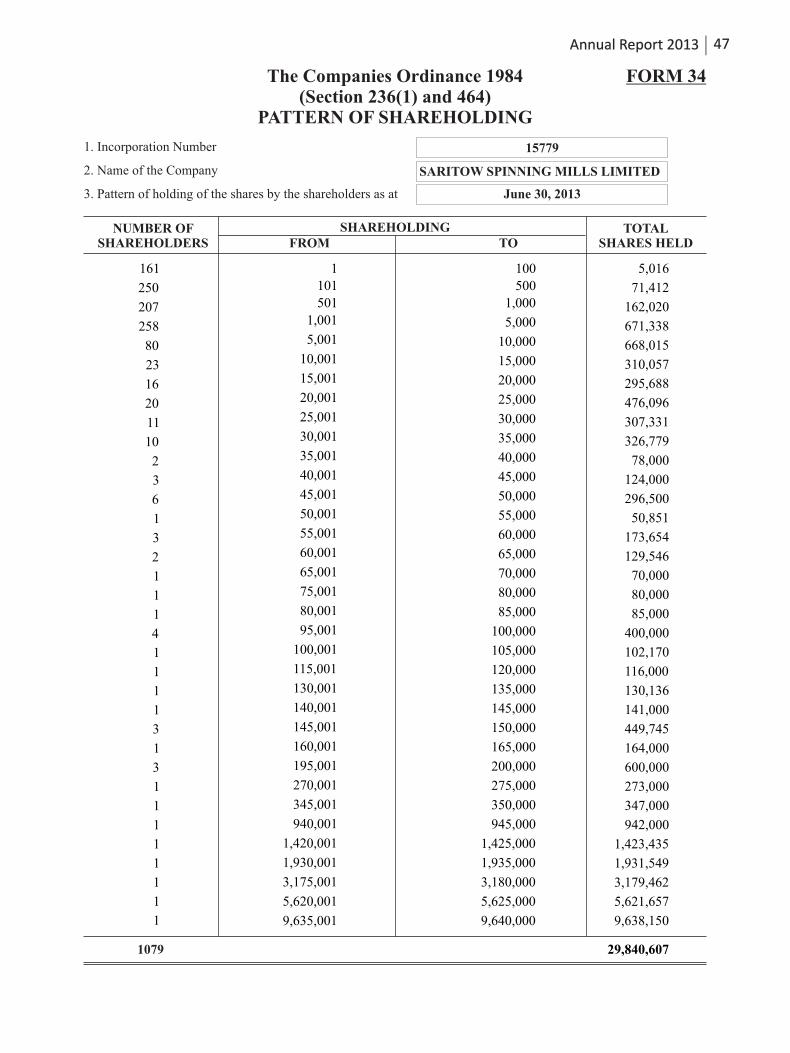
47Annual Report 2013
The Companies Ordinance 1984(Section 236(1) and 464)
PATTERN OF SHAREHOLDING
SHAREHOLDING FROM TO
NUMBER OF SHAREHOLDERS
TOTALSHARES HELD
1. Incorporation Number
2. Name of the Company
3. Pattern of holding of the shares by the shareholders as at
SARITOW SPINNING MILLS LIMITED
June 30, 2013
FORM 34
15779
1079
161
250
207
258
80
23
16
20
11
10
2
3
6
1
3
2
1
1
1
4
1
1
1
1
3
1
3
1
1
1
1
1
1
1
1
1101
501
1,001
5,001
10,001
15,001
20,001
25,001
30,001
35,001
40,001
45,001
50,001
55,001
60,001
65,001
75,001
80,001
95,001
100,001
115,001
130,001
140,001
145,001
160,001
195,001
270,001
345,001
940,001
1,420,001
1,930,001
3,175,001
5,620,001
9,635,001
100
500
1,000
5,000
10,000
15,000
20,000
25,000
30,000
35,000
40,000
45,000
50,000
55,000
60,000
65,000
70,000
80,000
85,000
100,000
105,000
120,000
135,000
145,000
150,000
165,000
200,000
275,000
350,000
945,000
1,425,000
1,935,000
3,180,000
5,625,000
9,640,000
5,016
71,412
162,020
671,338
668,015
310,057
295,688
476,096
307,331
326,779
78,000
124,000
296,500
50,851
173,654
129,546
70,000
80,000
85,000
400,000
102,170
116,000
130,136
141,000
449,745
164,000
600,000
273,000
347,000
942,000
1,423,435
1,931,549
3,179,462
5,621,657
9,638,150
29,840,607
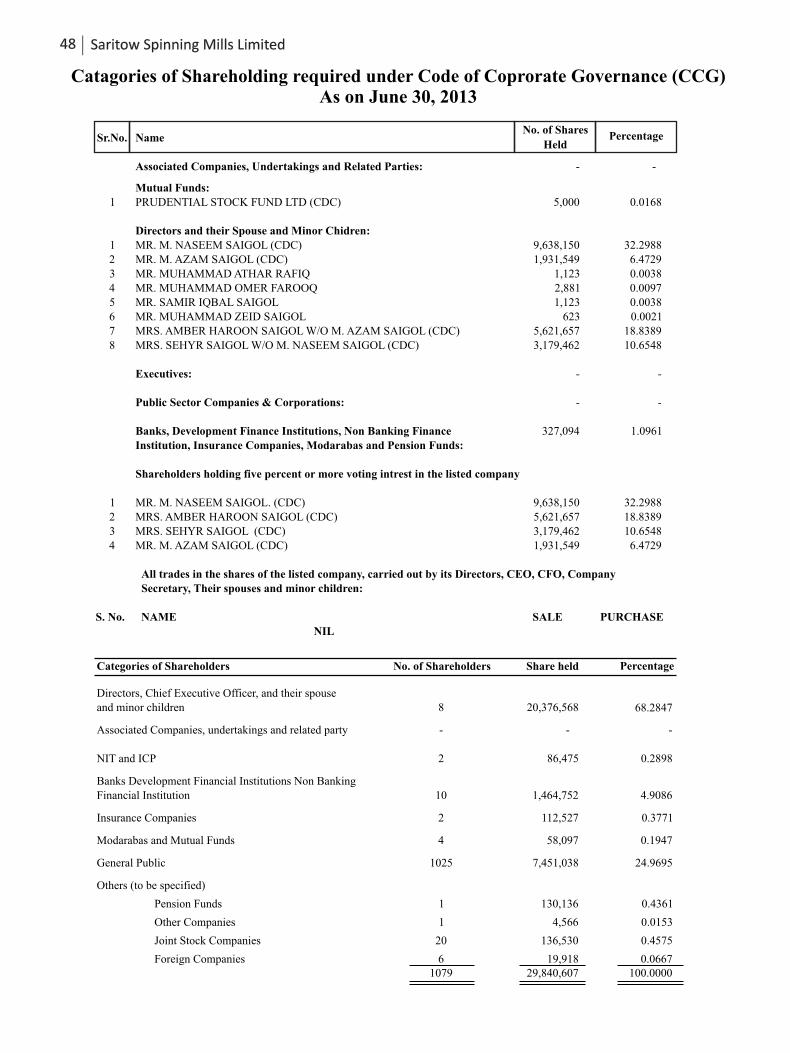
Catagories of Shareholding required under Code of Coprorate Governance (CCG)As on June 30, 2013
Sr.No. NameNo. of Shares
HeldPercentage
Associated Companies, Undertakings and Related Parties:
-
Mutual Funds:1 PRUDENTIAL STOCK FUND LTD (CDC)
0.0168
Directors and their Spouse and Minor Chidren: 1 MR. M. NASEEM SAIGOL (CDC) 32.29882 MR. M. AZAM SAIGOL (CDC) 6.47293 MR. MUHAMMAD ATHAR RAFIQ
0.0038
4 MR. MUHAMMAD OMER FAROOQ
0.00975 MR. SAMIR IQBAL SAIGOL
0.0038
6 MR. MUHAMMAD ZEID SAIGOL 0.00217 MRS. AMBER HAROON SAIGOL W/O M. AZAM SAIGOL (CDC) 18.83898 MRS. SEHYR SAIGOL W/O M. NASEEM SAIGOL (CDC) 10.6548
Executives: -
Public Sector Companies & Corporations:
-
Banks, Development Finance Institutions, Non Banking Finance
1.0961Institution, Insurance Companies, Modarabas and Pension Funds:
Shareholders holding five percent or more voting intrest in the listed company
1 MR. M. NASEEM SAIGOL. (CDC) 32.29882 MRS. AMBER HAROON SAIGOL (CDC)
18.83893 MRS. SEHYR SAIGOL (CDC)
10.65484 MR. M. AZAM SAIGOL (CDC)
-
5,000
9,638,150
1,931,549
1,123
2,881
1,123
623 5,621,657 3,179,462
-
-
327,094
9,638,150
5,621,6573,179,4621,931,549
6.4729
All trades in the shares of the listed company, carried out by its Directors, CEO, CFO, CompanySecretary, Their spouses and minor children:
S. No. NAME SALE PURCHASENIL
Categories of Shareholders No. of Shareholders Share held Percentage
Directors, Chief Executive Officer, and their spouseand minor children 20,376,568 68.2847
Associated Companies, undertakings and related party - - -
NIT and ICP 86,475 0.2898
Banks Development Financial Institutions Non BankingFinancial Institution 1,464,752 4.9086
Insurance Companies 112,527 0.3771
Modarabas and Mutual Funds 58,097 0.1947
General Public 7,451,038 24.9695
Others (to be specified)
Pension Funds 130,136 0.4361
Other Companies 4,566 0.0153
Joint Stock Companies 136,530 0.4575
Foreign Companies 19,918 0.066729,840,607 100.0000
20
1
6
1
1079
8
2
10
2
4
1025
48 Saritow Spinning Mills Limited

FORM OF PROXY
Shares Held Ledger Folio/CDC Ac No.
I/We
Of
Appoint
Of
(or failing him
Of
Being another member of the Company as my / our proxy to attend and vote for me / us on my / our behalf, at the
27th Annual General Meeting of the Company to be held on Thursday, October 31, 2013 at 10.00 A.M. and at every
adjournment thereof.
As witness my / our hand (s) this Day of October, 2013
Signed by the said
Witnesses: REVENUE
STAMP
(1) Name
N.I.C. No.
Address
(2) Name
N.I.C. No.
Address
Notes:
1. A member entitled to attend and vote at this meeting may appoint another member as Proxy, Proxies in order to
be effective, must be received at 17-Aziz Avenue, Canal Bank, Gulberg V, Lahore. the Registered Office of the
Company not later than forty-eight hours before the time for holding the meeting and must be duly stamped,
signed and witnessed.

17-Aziz Avenue, Canal Bank,Gulberg-V, Lahore. Tel : 042 - 35717364-65, 35718274-75Fax: 042 - 35715105
SARITOW SPINNING MILLS LIMITED