Embed Size (px)
Citation preview
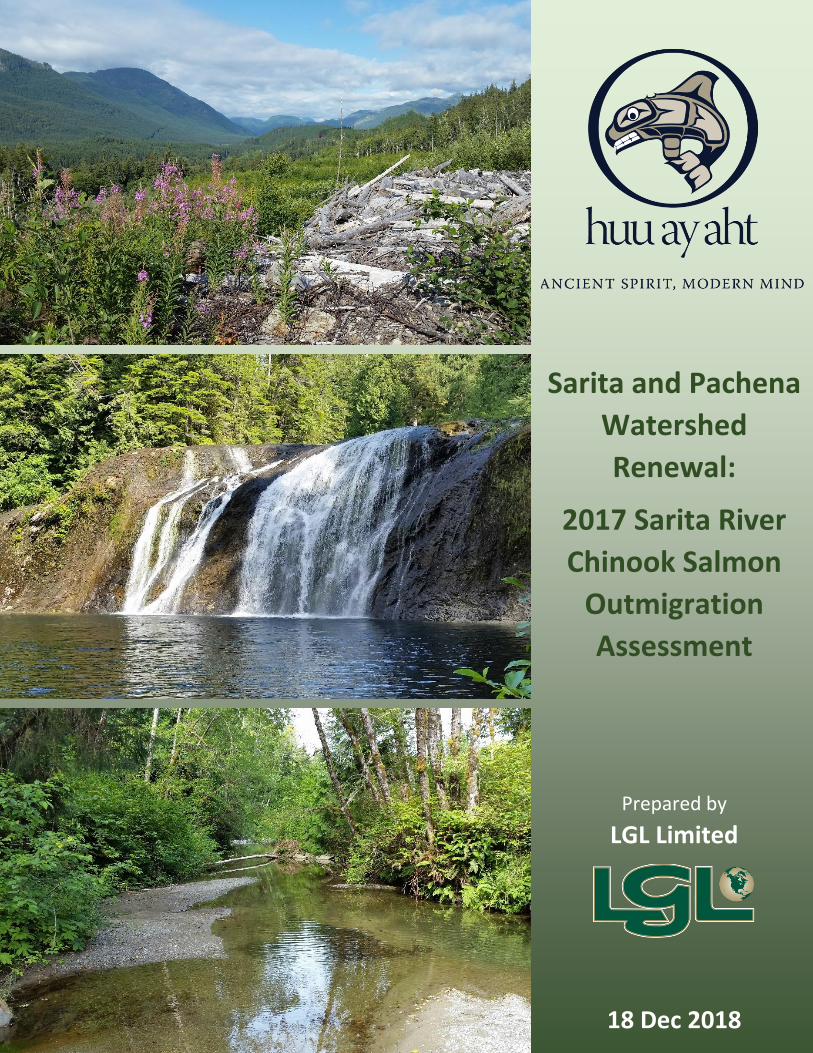
Sarita and Pachena
Watershed
Renewal:
2017 Sarita River
Chinook Salmon
Outmigration
Assessment
Prepared by LGL Limited
18 Dec 2018
EA3716B.34
Sarita and Pachena Watershed Renewal: 2017 Sarita River Chinook Salmon Outmigration Assessment
Prepared by:
S. T. Johnson, C. W. Burns, and C. T. McCulloch
LGL Limited environmental research associates
9768 Second Street Sidney, BC
V8L 3Y8
Prepared for:
Huu-ay-aht First Nations 170 Nookemus Road
Anacla, BC V0R 1B0
18 December 2018
2017 Sarita River Chinook Salmon Outmigration Assessment EXECUTIVE SUMMARY
LGL Limited i
EXECUTIVE SUMMARY In 2017, Huu-ay-aht First Nations and LGL Limited developed a framework for renewal of the Sarita and Pachena watersheds. The purpose of the “Renewal Framework” is to provide direction that will ultimately lead to the development of a comprehensive “Renewal Plan”. The Renewal Plan will incorporate a two-pronged strategy that prioritizes both, long term objectives (10 years or greater) intended to restore ecosystem processes, and short-term objectives required for the management and conservation of high value species or the protection and enhancement of important fish and wildlife habitat. Monitoring and adaptive management will form part of the Renewal Plan which will be a living document for decades.
To address the data gap with regards to estimating Chinook Salmon (Oncorhynchus tshawytscha) production in the Sarita River, a salmonid smolt outmigration trapping project was initiated. On April 21, two rotary screw traps (RSTs) 1.2 m (4-foot) and 1.8 m (6-foot) diameter, were installed and operated near river kilometer 1.75 of the Sarita River. The two RSTs were continuously operated from April 21 until June 2, for a total of 1,815.4 hours; 660.2 hours for the large trap, 639.8 hours for the small trap and 515.4 hours in tandem.
A total of 522 wild and 1,114 hatchery origin Chinook Salmon were captured in 2017. All captured Chinook Salmon aside from hatchery released fish were marked with either Bismarck Brown dye or a fin clip and released approximately 1.0 km upstream. Up to 150 individuals were randomly selected each day and measured for fork length (to the nearest millimetre) and weighed (to the nearest tenth of a gram). The randomly chosen Chinook Salmon smolts had an averaged fork length of 43.5 mm (range: 35−63 mm fork length; n = 446) and average weight of 0.7 g (range: 0.2−3.0 g; n = 347).
In total, seven different species were captured including: Chinook, Coho (O. kisutch), Chum (O. keta), steelhead (O. mykiss), Rainbow Trout (O. mykiss), Prickly Sculpin (Cottus asper), and Threespine Stickleback (Gasterosteus aculeatus). Chum Salmon (32,332) were the most common species captured followed by Coho Salmon (2,415). All non-target fish were released downstream of the RSTs.
A subsample of Coho Salmon was randomly selected daily from May 25 to May 30 and measured for fork length and weight. The Coho Salmon had an average fork length of 39.5 mm (range: 30−58 mm fork length; n = 102) and average weight of 1.0 g (range: 0.5−2.8 g; n = 102).
Approximately 380,000 hatchery Chinook Salmon smolts were released by the Nitinat River Hatchery on May 23 and 24 at the Blenheim bridge pool. Of the approximately 380,000 hatchery Chinook Salmon released, 1,114 were recaptured (0.29% of the total released) at the RSTs. A subsample of hatchery Chinook Salmon was randomly selected and measured for fork length and weight. The hatchery Chinook Salmon had an average fork length of 64.6 mm (range: 41−97 mm fork length; n = 246) and 3.6 g (range: 1.0−9.0 g; n = 246).
Due to the low numbers (6 in total) of marked re-captured wild Chinook Salmon caught in the RSTs, an estimate was not generated. The hope is to establish a long-term dataset to improve the understanding of Chinook Salmon escapement. This report documents the methods and results of the 2017 RSTs operations in the Sarita River and provides recommendation for the RST studies in the future.
2017 Sarita River Chinook Salmon Outmigration Assessment ACKNOWLEDGEMENTS
LGL Limited ii
ACKNOWLEDGEMENTS This project would not have been possible without the cooperation and support of numerous people. We would like to acknowledge Huu-ay-aht First Nations Government for their partnership and support on the project. From Huu-ay-aht First Nations, we are grateful to Christine Gruman and Amelia Vos who provided local information and knowledge of salmon spawning distribution in the Sarita Watershed. Fieldwork and logistical project support was provided by Shannon Nookemus, Lee Frank, and Robert Seward (Huu-ay-aht First Nations Technicians) and Katie Imrie (LGL Limited). We would also like to thank Stephan Ochman (independent local consultant) for guidance during the site selection. Dave Key (Key Mill Construction Ltd., Ladysmith, BC) and Jason Smith (LGL Limited) provided assistance with site selection and RST installation. From LGL Limited, Elmar Plate assisted with project management and report review. Connie Kleckner and Joanne Dovey (LGL Limited) were essential in providing safety and field logistics support. Dawn Keller (LGL Limited) provided reporting quality assurance and control. Lastly, we thank Bob Bocking (LGL Limited) for his senior review.
Citation: Johnson S. T, C. W. Burns, and C. T. McCulloch. 2018. Sarita and Pachena watershed renewal: 2017 Sarita River Chinook Salmon outmigration assessment. LGL Report EA3718B.34. Prepared for Huu-ay-aht First Nations, Anacla, BC, by LGL Limited, Sidney, BC. 43 p.
2017 Sarita River Chinook Salmon Outmigration Assessment TABLE OF CONTENTS
LGL Limited iii
TABLE OF CONTENTS
EXECUTIVE SUMMARY ................................................................................................................................... i
ACKNOWLEDGEMENTS ................................................................................................................................. ii
TABLE OF CONTENTS .................................................................................................................................... iii
LIST OF TABLES ............................................................................................................................................. iv
LIST OF FIGURES ........................................................................................................................................... iv
LIST OF PHOTOS ............................................................................................................................................ v
LIST OF APPENDICES ..................................................................................................................................... v
ABBREVIATIONS ........................................................................................................................................... vi
1 Introduction ......................................................................................................................................... 1
1.1 Background ................................................................................................................................... 1
1.2 Study Area ..................................................................................................................................... 1
1.3 Objectives ...................................................................................................................................... 3
2 Methods ............................................................................................................................................... 3
2.1 Trap Operations and Environmental Conditions .......................................................................... 3
2.2 Fish Capture and Sampling ............................................................................................................ 5
2.3 Analysis ....................................................................................................................................... 10
2.3.1 Environmental Conditions................................................................................................... 10
2.3.2 Juvenile Salmonid Relative Abundance and Size Distribution ............................................ 10
2.4 Data Quality Assurance and Control ........................................................................................... 10
3 Results ................................................................................................................................................ 11
3.1 Trap Operations and Environmental Conditions ........................................................................ 11
3.2 Juvenile Salmonid Relative Abundance and Size Distribution .................................................... 12
3.2.1 Wild Origin Chinook Salmon ............................................................................................... 12
3.2.2 Hatchery Origin Chinook Salmon ........................................................................................ 14
3.2.3 Coho Salmon ....................................................................................................................... 15
3.2.3.1 Fry.................................................................................................................................... 15
3.2.3.2 Parr/Smolt ....................................................................................................................... 16
3.2.4 Chum Salmon ...................................................................................................................... 17
3.2.5 Other Species ...................................................................................................................... 18
4 Discussion ........................................................................................................................................... 19
5 Recommendations ............................................................................................................................. 20
REFERENCES ................................................................................................................................................ 21
APPENDICES ................................................................................................................................................ 22
2017 Sarita River Chinook Salmon Outmigration Assessment LIST OF FIGURES
LGL Limited iv
LIST OF TABLES
Table 1. Fish species present in the Sarita Watershed (BC MOE 2017). .......................................... 3
Table 2. Life history stage classification and fork length criteria. .................................................... 7
Table 3. Summary of rotary screw trap operations for the 2017 sampling period. ....................... 11
Table 4. Wild Chinook Salmon fork length and weight results from the Sarita River RSTs. ........... 12
Table 5. Hatchery Chinook Salmon fork length and weight results from the Sarita River RSTs. .......................................................................................................................................... 15
Table 6. Coho Salmon fry fork length and weight results from the Sarita River RSTs. ................... 16
LIST OF FIGURES
Figure 1. Location of the Sarita Watershed. ...................................................................................... 2
Figure 2. Location of the rotary screw traps and mark release site. ................................................. 8
Figure 3. Daily flows and temperatures of the Sarita River at the Water Survey of Canada hydrometric station No. 08HB014, 2017. ......................................................................... 11
Figure 4. Daily catch of wild Chinook Salmon at the Sarita River rotary screw traps in the 2017 study. ................................................................................................................................ 13
Figure 5. Cumulative catch (%) of wild Chinook Salmon at the Sarita River rotary screw traps in the 2017 study. ............................................................................................................. 13
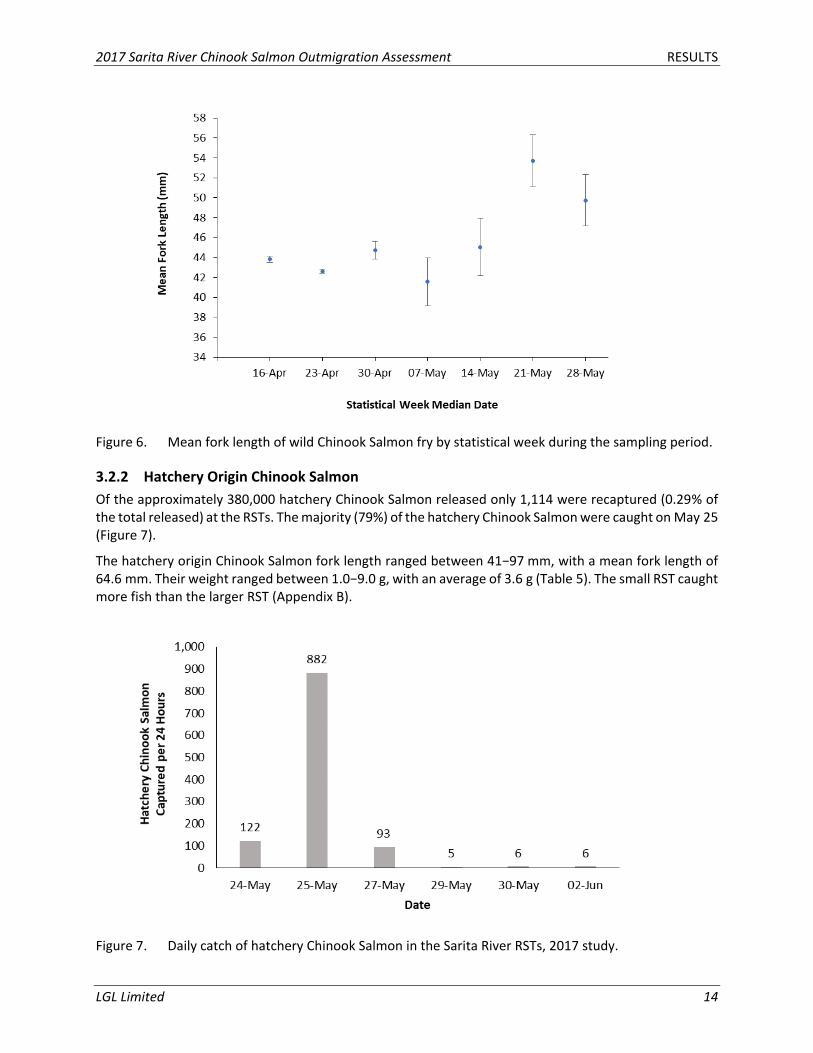
Figure 6. Mean fork length of wild Chinook Salmon fry by statistical week during the sampling period. ............................................................................................................................... 14
Figure 7. Daily catch of hatchery Chinook Salmon in the Sarita River RSTs, 2017 study................. 14
Figure 8. Daily catch of Coho Salmon fry at the Sarita River rotary screw traps, 2017. .................. 15
Figure 9. Cumulative catch (%) of Coho Salmon fry at the Sarita River rotary screw traps in the 2017 study. ................................................................................................................. 16
Figure 10. Daily catch of Coho Salmon parr at the Sarita River rotary screw traps, 2017. ............... 17
Figure 11. Cumulative catch (%) of Coho Salmon parr at the Sarita River rotary screw traps in the 2017 study. ................................................................................................................. 17
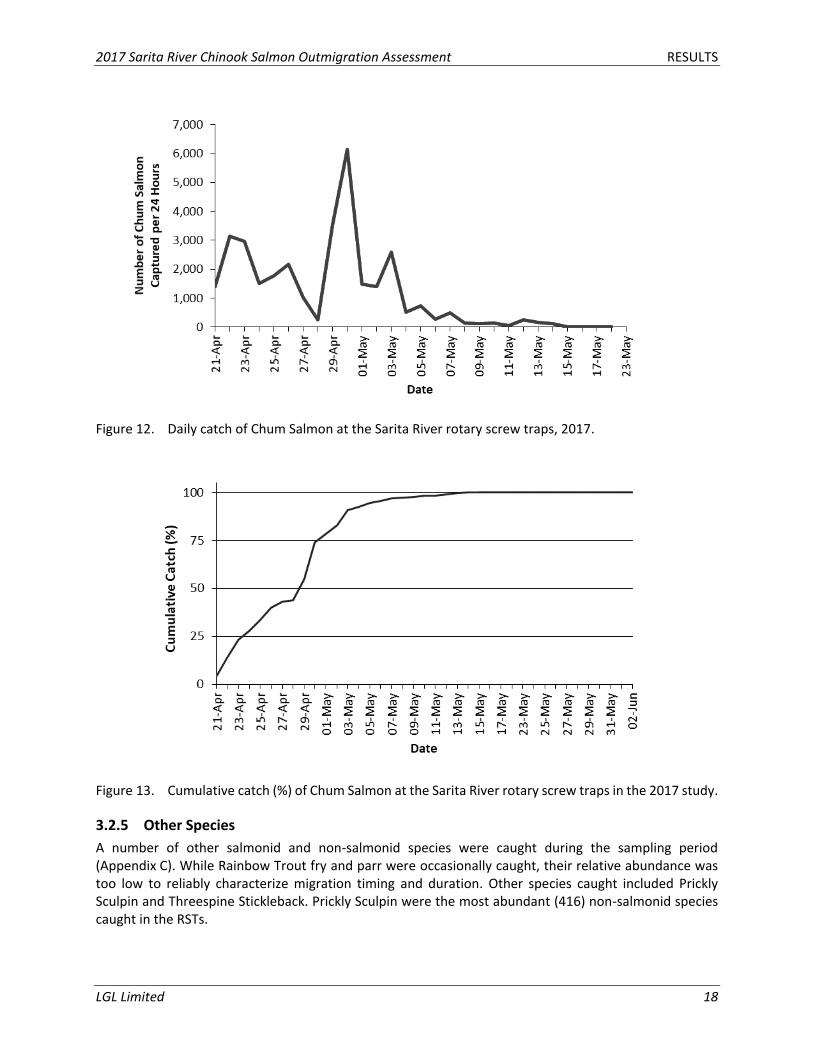
Figure 12. Daily catch of Chum Salmon at the Sarita River rotary screw traps, 2017. ...................... 18
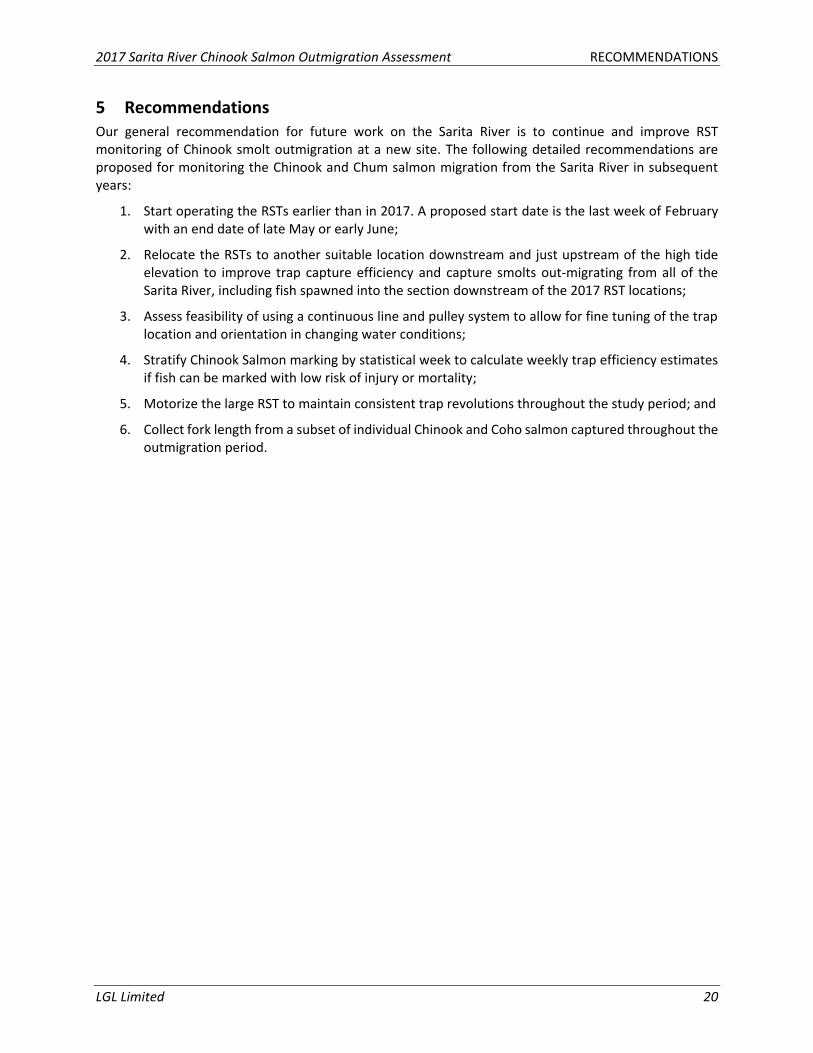
Figure 13. Cumulative catch (%) of Chum Salmon at the Sarita River rotary screw traps in the 2017 study. ....................................................................................................................... 18
2017 Sarita River Chinook Salmon Outmigration Assessment LIST OF APPENDICES
LGL Limited v
LIST OF PHOTOS
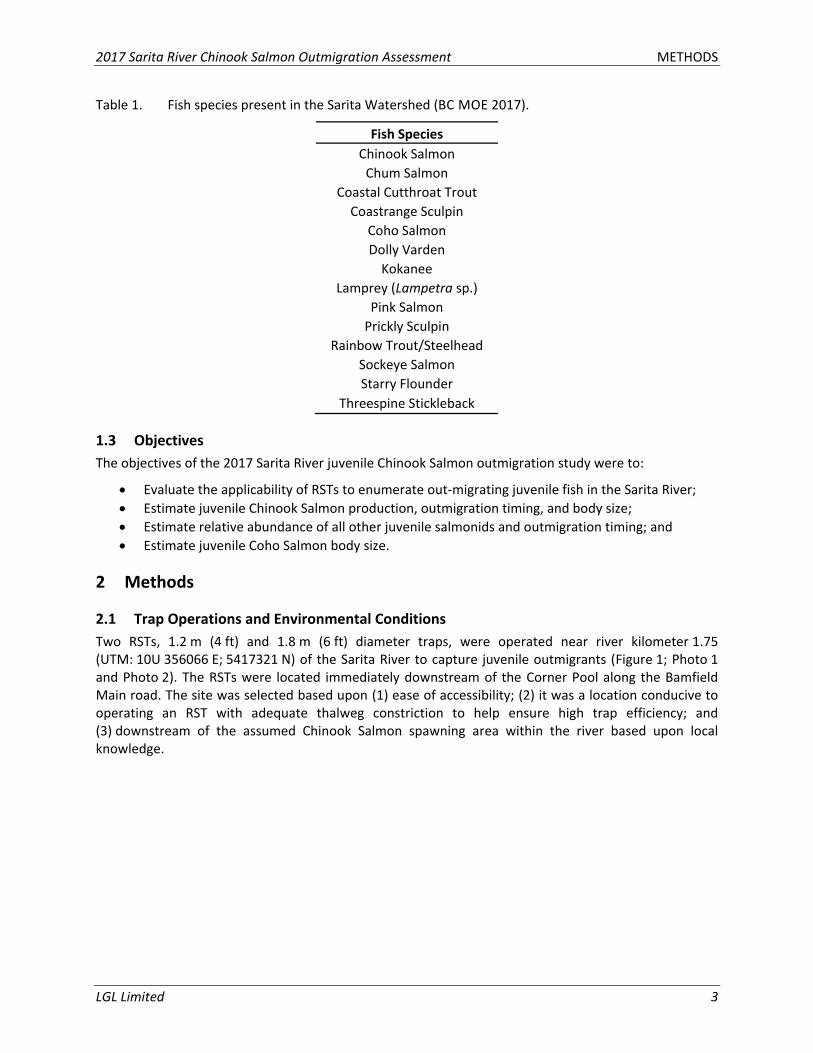
Photo 1. Looking from left bank to right bank at the small (1.4 m diameter) RST (April 28, 2017). .................................................................................................................................. 4
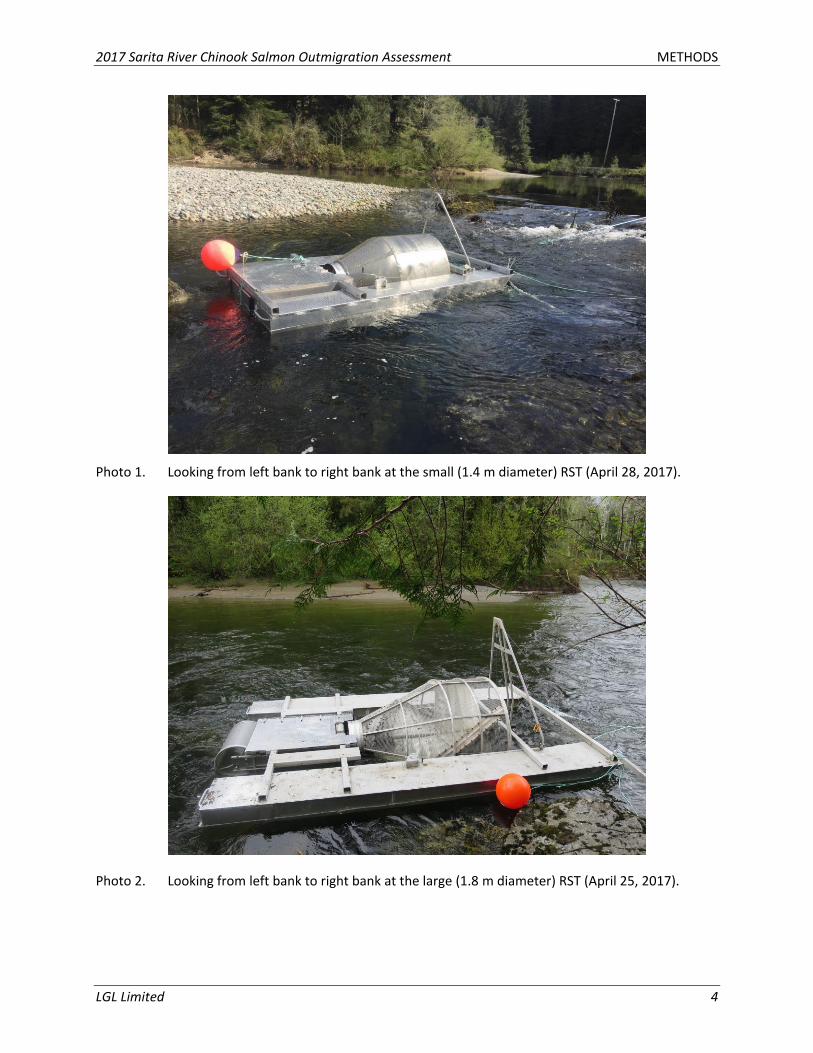
Photo 2. Looking from left bank to right bank at the large (1.8 m diameter) RST (April 25, 2017). .................................................................................................................................. 4
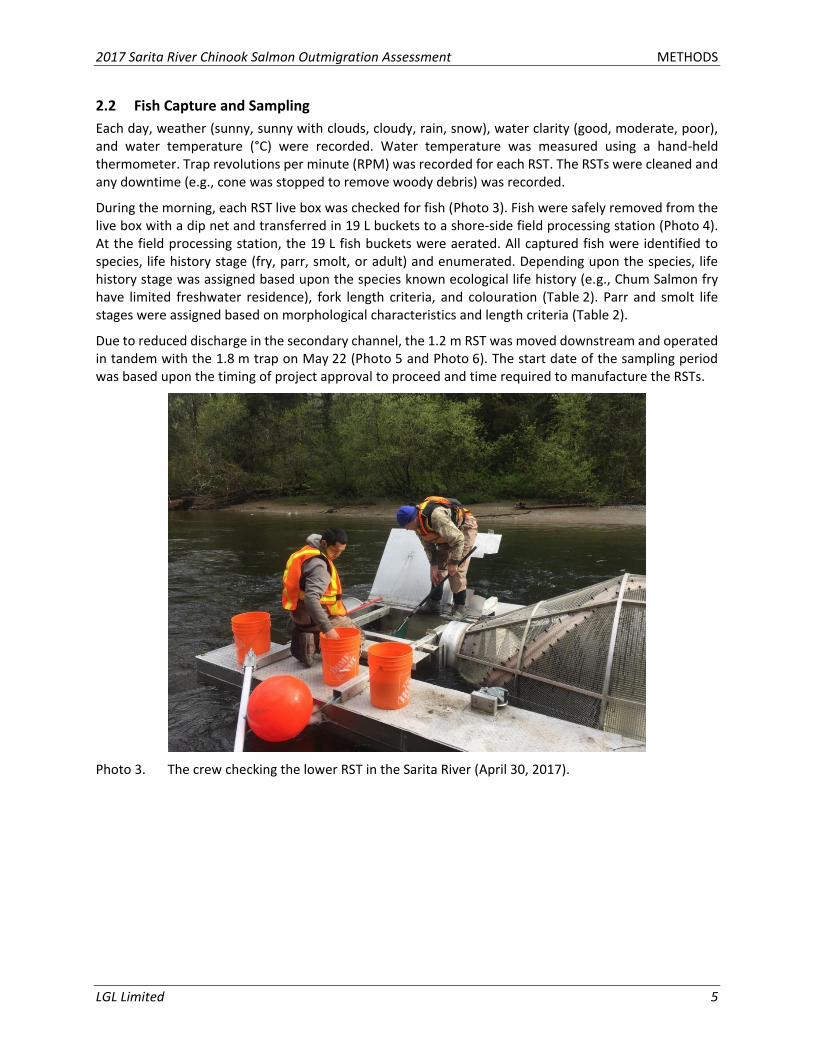
Photo 3. The crew checking the lower RST in the Sarita River (April 30, 2017). ............................... 5
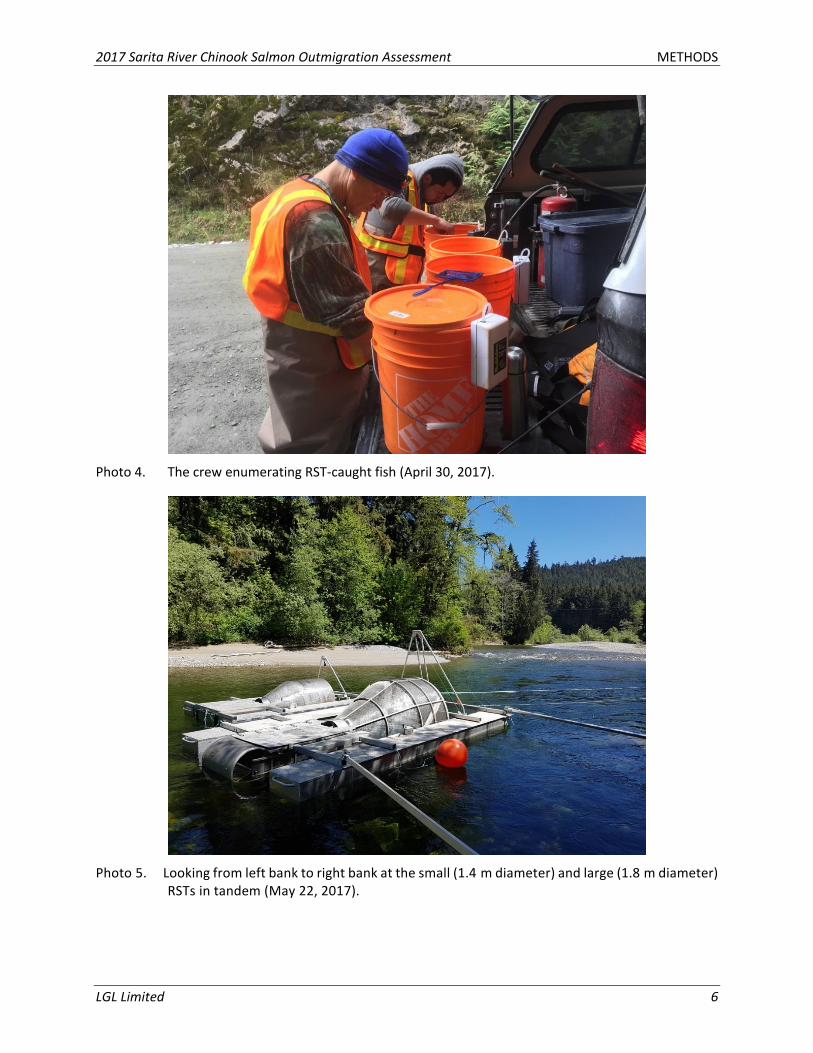
Photo 4. The crew enumerating RST-caught fish (April 30, 2017). ................................................... 6
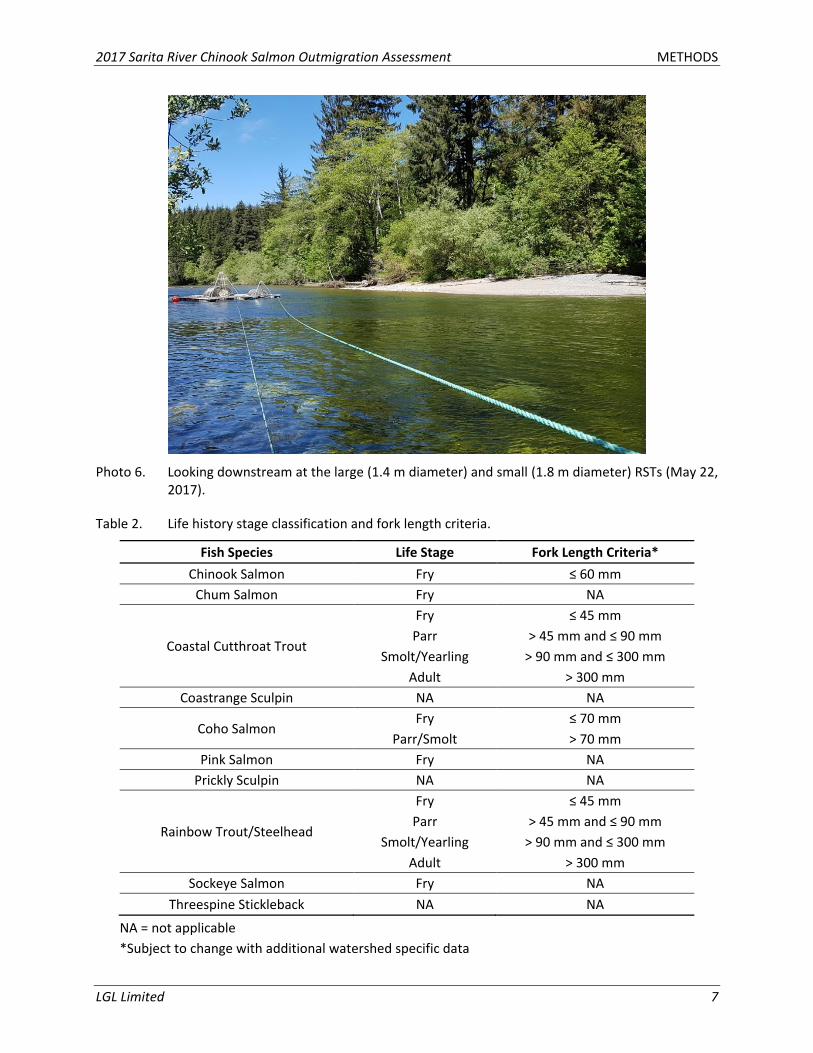
Photo 5. Looking from left bank to right bank at the small (1.4 m diameter) and large (1.8 m diameter) RSTs in tandem (May 22, 2017). ....................................................................... 6
Photo 6. Looking downstream at the large (1.4 m diameter) and small (1.8 m diameter) RSTs (May 22, 2017). ................................................................................................................... 7
Photo 7. Chinook Salmon on the left and a Bismarck Brown Y dyed Chinook Salmon on the right (May 24, 2017). .......................................................................................................... 9
Photo 8. Looking at hatchery origin Chinook Salmon (May 23, 2017; photo credit to Nitinat River Hatchery). .................................................................................................................. 9
LIST OF APPENDICES
Appendix A. Daily physical data. ........................................................................................................... 23
Appendix B. Sarita River rotary screw trap daily catch. ........................................................................ 26
Appendix C. Sarita River rotary screw trap photography. .................................................................... 40
2017 Sarita River Chinook Salmon Outmigration Assessment ABBREVIATIONS
LGL Limited vi
ABBREVIATIONS The following abbreviations are used in this report:
CPUE catch per unit effort
DFO Fisheries and Oceans Canada
HFN Huu-ay-aht First Nations
MOE Ministry of Environment
QA quality assurance
QC quality control
RPM revolutions per minute
RST rotary screw trap
SD standard deviation
UTM Universal Transverse Mercator
WSC Water Survey of Canada
2017 Sarita River Chinook Salmon Outmigration Assessment INTRODUCTION
LGL Limited 1
1 Introduction
1.1 Background
The Sarita, Pachena, and Sugsaw watersheds are located on the west coast of Vancouver Island within the traditional territories and Treaty Lands of the Huu-ay-aht (the Haa-houlthee) First Nations (HFN). Until the 1990s, road building and timber harvesting throughout much of the watersheds was carried out on steep unstable slopes and up to the edge of watercourses. Roads were often poorly built and stream crossings poorly designed. This has resulted in numerous landslides, the mobilization of sediments to watercourses, increased peak and annual flows, changes in stream channel morphology, loss of fish habitat, fish passage restrictions, and the degradation of the Sarita River estuary. In recent years, forest practices have improved; however, the legacy of poor forest practices remains (LGL 2017).
In 2017, HFN and LGL Limited developed a framework for renewal of the Sarita and Pachena watersheds (LGL 2017). The purpose of this “Renewal Framework” was to provide direction that will ultimately lead to the development of a comprehensive Renewal Plan. The Renewal Plan incorporated a two-pronged strategy that prioritizes both, long term objectives (10 years or greater) intended to restore ecosystem processes, and short-term objectives required for the management and conservation of high value species or the protection and enhancement of important fish and wildlife habitat. Monitoring and adaptive management will form part of the Renewal Plan which will be a living document for decades.
This Renewal Framework identified several assessments and inventories that can be conducted while the Renewal Plan is being prepared to address known information gaps relating to the condition of the Sarita and Pachena watersheds, the condition of fish and wildlife habitats, and the status of fish, wildlife, and species at risk in the watersheds (LGL 2017). The purpose of these assessments and inventories was to specify where and what kinds of renewal actions were required to achieve short and long-term renewal goals; such as restoring watershed processes, fish habitat and productivity, estuary productivity, wildlife habitat and populations, and species at risk.
Within the Sarita River, the most abundant salmon species in recent years have been Chum Salmon; however historical information suggests that Chinook Salmon abundance was significantly higher than in recent years (Barry 2010). The Chinook Salmon management concerns have been and are being addressed through habitat restoration activities as well as stocking programs. The Fisheries and Oceans Canada (DFO) Nitinat River Hatchery has been releasing juvenile Chinook Salmon into the Sarita River since 1985. However, the estimation of out-migrating Chinook Salmon juvenile abundance, from natural reproduction, has not been conducted to date in the Sarita River. Rotary screw traps are an effective way to assess out-migrating salmon in rivers and when paired with mark-recapture techniques can produce accurate abundance estimates (Volkhardt et al. 2007). A rotary screw trap (RST) program is also a powerful tool for validating the assumptions of watershed restoration programs, fisheries management strategies, and land-use policies on fish populations (Volkhardt et al. 2007). In addition to serving as a tool to monitor wild populations, RSTs are useful for evaluating hatchery programs and wild/hatchery fish interactions to inform management decisions (Volkhardt et al. 2007). Therefore, obtaining annual outmigration Chinook Salmon juvenile abundance estimates in the Sarita Watershed was one of the assessment steps needed to determine and achieve the long-term Renewal Plan objectives.
1.2 Study Area
The study area for this assessment was the Sarita Watershed, which is located on the west coast of Vancouver Island adjacent to Barkley Sound (Figure 1) and located 30 km southwest of Port Alberni. The Sarita Watershed is approximately 19,247 ha in area and drains into Trevor Channel on the west side of Vancouver Island. The main watercourses of the Sarita Watershed include the Sarita River, South Sarita
2017 Sarita River Chinook Salmon Outmigration Assessment INTRODUCTION
LGL Limited 2
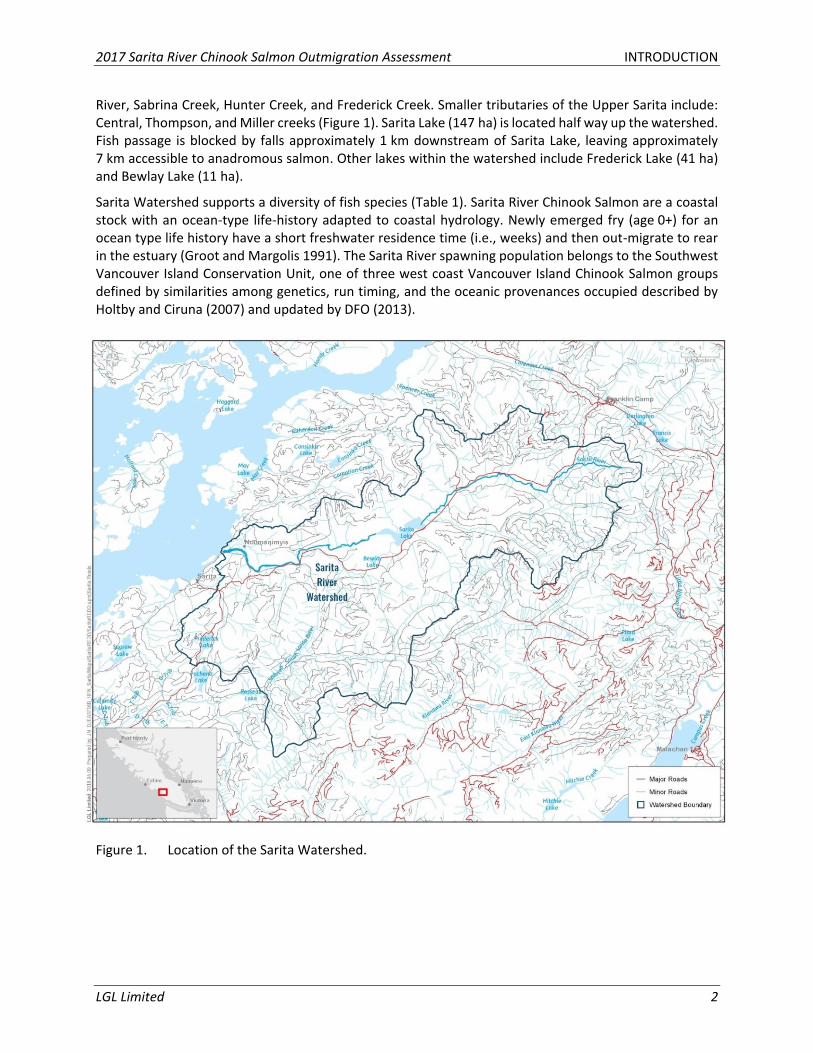
River, Sabrina Creek, Hunter Creek, and Frederick Creek. Smaller tributaries of the Upper Sarita include: Central, Thompson, and Miller creeks (Figure 1). Sarita Lake (147 ha) is located half way up the watershed. Fish passage is blocked by falls approximately 1 km downstream of Sarita Lake, leaving approximately 7 km accessible to anadromous salmon. Other lakes within the watershed include Frederick Lake (41 ha) and Bewlay Lake (11 ha).
Sarita Watershed supports a diversity of fish species (Table 1). Sarita River Chinook Salmon are a coastal stock with an ocean-type life-history adapted to coastal hydrology. Newly emerged fry (age 0+) for an ocean type life history have a short freshwater residence time (i.e., weeks) and then out-migrate to rear in the estuary (Groot and Margolis 1991). The Sarita River spawning population belongs to the Southwest Vancouver Island Conservation Unit, one of three west coast Vancouver Island Chinook Salmon groups defined by similarities among genetics, run timing, and the oceanic provenances occupied described by Holtby and Ciruna (2007) and updated by DFO (2013).
Figure 1. Location of the Sarita Watershed.
2017 Sarita River Chinook Salmon Outmigration Assessment METHODS
LGL Limited 3
Table 1. Fish species present in the Sarita Watershed (BC MOE 2017).
Fish Species
Chinook Salmon
Chum Salmon
Coastal Cutthroat Trout
Coastrange Sculpin
Coho Salmon
Dolly Varden
Kokanee
Lamprey (Lampetra sp.)
Pink Salmon
Prickly Sculpin
Rainbow Trout/Steelhead
Sockeye Salmon
Starry Flounder
Threespine Stickleback
1.3 Objectives
The objectives of the 2017 Sarita River juvenile Chinook Salmon outmigration study were to:
• Evaluate the applicability of RSTs to enumerate out-migrating juvenile fish in the Sarita River;
• Estimate juvenile Chinook Salmon production, outmigration timing, and body size;
• Estimate relative abundance of all other juvenile salmonids and outmigration timing; and
• Estimate juvenile Coho Salmon body size.
2 Methods
2.1 Trap Operations and Environmental Conditions
Two RSTs, 1.2 m (4 ft) and 1.8 m (6 ft) diameter traps, were operated near river kilometer 1.75 (UTM: 10U 356066 E; 5417321 N) of the Sarita River to capture juvenile outmigrants (Figure 1; Photo 1 and Photo 2). The RSTs were located immediately downstream of the Corner Pool along the Bamfield Main road. The site was selected based upon (1) ease of accessibility; (2) it was a location conducive to operating an RST with adequate thalweg constriction to help ensure high trap efficiency; and (3) downstream of the assumed Chinook Salmon spawning area within the river based upon local knowledge.
2017 Sarita River Chinook Salmon Outmigration Assessment METHODS
LGL Limited 4
Photo 1. Looking from left bank to right bank at the small (1.4 m diameter) RST (April 28, 2017).
Photo 2. Looking from left bank to right bank at the large (1.8 m diameter) RST (April 25, 2017).
2017 Sarita River Chinook Salmon Outmigration Assessment METHODS
LGL Limited 5
2.2 Fish Capture and Sampling
Each day, weather (sunny, sunny with clouds, cloudy, rain, snow), water clarity (good, moderate, poor), and water temperature (°C) were recorded. Water temperature was measured using a hand-held thermometer. Trap revolutions per minute (RPM) was recorded for each RST. The RSTs were cleaned and any downtime (e.g., cone was stopped to remove woody debris) was recorded.
During the morning, each RST live box was checked for fish (Photo 3). Fish were safely removed from the live box with a dip net and transferred in 19 L buckets to a shore-side field processing station (Photo 4). At the field processing station, the 19 L fish buckets were aerated. All captured fish were identified to species, life history stage (fry, parr, smolt, or adult) and enumerated. Depending upon the species, life history stage was assigned based upon the species known ecological life history (e.g., Chum Salmon fry have limited freshwater residence), fork length criteria, and colouration (Table 2). Parr and smolt life stages were assigned based on morphological characteristics and length criteria (Table 2).
Due to reduced discharge in the secondary channel, the 1.2 m RST was moved downstream and operated in tandem with the 1.8 m trap on May 22 (Photo 5 and Photo 6). The start date of the sampling period was based upon the timing of project approval to proceed and time required to manufacture the RSTs.
Photo 3. The crew checking the lower RST in the Sarita River (April 30, 2017).
2017 Sarita River Chinook Salmon Outmigration Assessment METHODS
LGL Limited 6
Photo 4. The crew enumerating RST-caught fish (April 30, 2017).
Photo 5. Looking from left bank to right bank at the small (1.4 m diameter) and large (1.8 m diameter) RSTs in tandem (May 22, 2017).
2017 Sarita River Chinook Salmon Outmigration Assessment METHODS
LGL Limited 7
Photo 6. Looking downstream at the large (1.4 m diameter) and small (1.8 m diameter) RSTs (May 22, 2017).
Table 2. Life history stage classification and fork length criteria.
Fish Species Life Stage Fork Length Criteria*
Chinook Salmon Fry ≤ 60 mm
Chum Salmon Fry NA
Coastal Cutthroat Trout
Fry ≤ 45 mm
Parr ˃ 45 mm and ≤ 90 mm
Smolt/Yearling ˃ 90 mm and ≤ 300 mm
Adult > 300 mm
Coastrange Sculpin NA NA
Coho Salmon Fry ≤ 70 mm
Parr/Smolt > 70 mm
Pink Salmon Fry NA
Prickly Sculpin NA NA
Rainbow Trout/Steelhead
Fry ≤ 45 mm
Parr ˃ 45 mm and ≤ 90 mm
Smolt/Yearling ˃ 90 mm and ≤ 300 mm
Adult > 300 mm
Sockeye Salmon Fry NA
Threespine Stickleback NA NA
NA = not applicable
*Subject to change with additional watershed specific data
2017 Sarita River Chinook Salmon Outmigration Assessment METHODS
LGL Limited 8
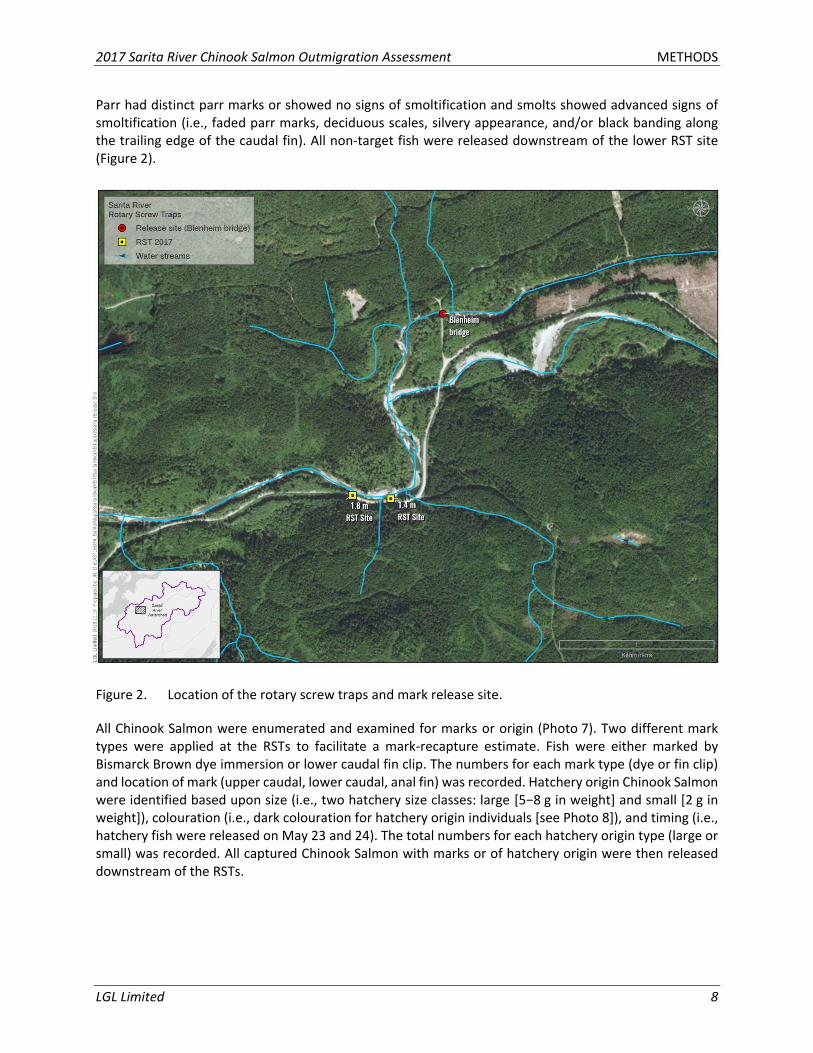
Parr had distinct parr marks or showed no signs of smoltification and smolts showed advanced signs of smoltification (i.e., faded parr marks, deciduous scales, silvery appearance, and/or black banding along the trailing edge of the caudal fin). All non-target fish were released downstream of the lower RST site (Figure 2).
Figure 2. Location of the rotary screw traps and mark release site.
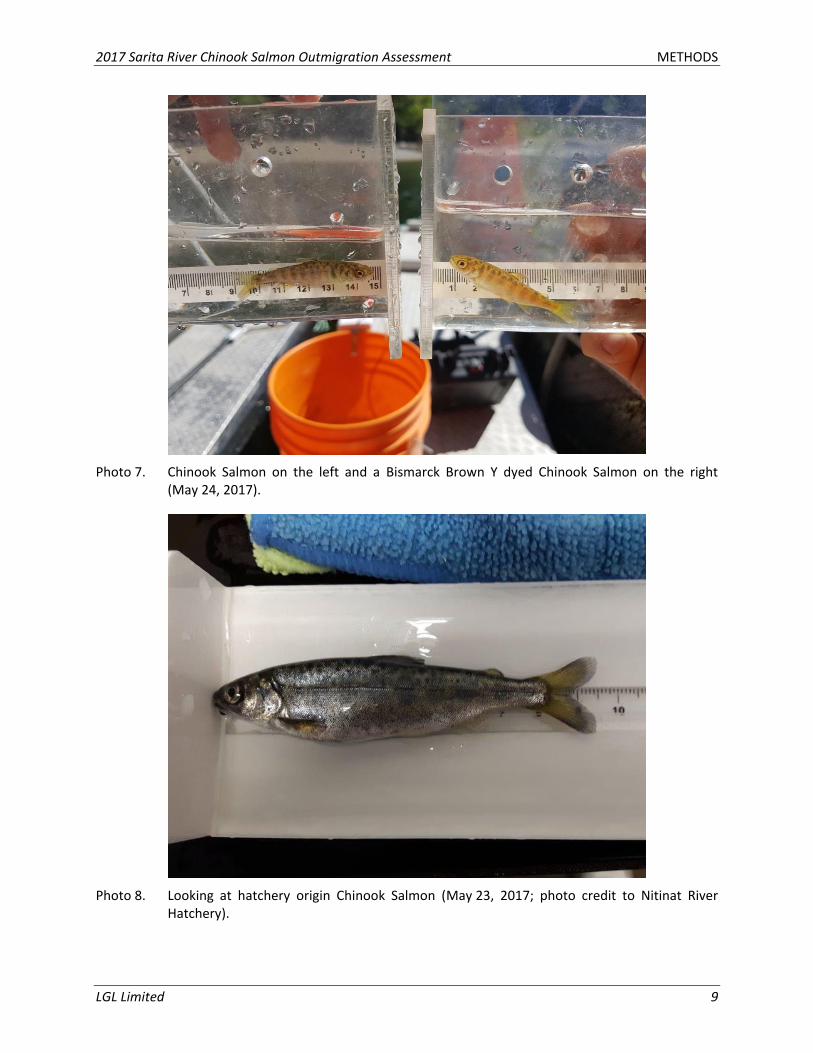
All Chinook Salmon were enumerated and examined for marks or origin (Photo 7). Two different mark types were applied at the RSTs to facilitate a mark-recapture estimate. Fish were either marked by Bismarck Brown dye immersion or lower caudal fin clip. The numbers for each mark type (dye or fin clip) and location of mark (upper caudal, lower caudal, anal fin) was recorded. Hatchery origin Chinook Salmon were identified based upon size (i.e., two hatchery size classes: large [5−8 g in weight] and small [2 g in weight]), colouration (i.e., dark colouration for hatchery origin individuals [see Photo 8]), and timing (i.e., hatchery fish were released on May 23 and 24). The total numbers for each hatchery origin type (large or small) was recorded. All captured Chinook Salmon with marks or of hatchery origin were then released downstream of the RSTs.
2017 Sarita River Chinook Salmon Outmigration Assessment METHODS
LGL Limited 9
Photo 7. Chinook Salmon on the left and a Bismarck Brown Y dyed Chinook Salmon on the right (May 24, 2017).
Photo 8. Looking at hatchery origin Chinook Salmon (May 23, 2017; photo credit to Nitinat River Hatchery).
2017 Sarita River Chinook Salmon Outmigration Assessment METHODS
LGL Limited 10
Captured Chinook Salmon with no marks or of hatchery origin were marked with either Bismarck Brown dye or a fin clip. The Bismarck Brown dye marking procedure involved mixing a solution of 21 mg/L of dye with 19 L of water in an aerated bucket, immersing the Chinook Salmon in the solution for a period of 50 minutes, and transferring the dyed Chinook Salmon into an aerated recovery bucket (Photo 7). The fin clipping marking procedure involved mixing an anesthetic solution composed of 9 parts ethanol and 1 part of clove oil. For clipping, Chinook Salmon were immersed in 10 L of water in a bucket mixed with 6ml of the anesthetic solution. Following clipping, fish were transferred into an aerated recovery bucket. Up to 150 individuals were randomly selected each day to be measured for fork length (to the nearest millimetre) and to be weighed (to the nearest tenth of a gram). Marked Chinook Salmon were then released at the Blenheim Bridge pool (approximately 1.0 km upstream of the RST location; Figure 2) during the evening on the day they were marked which allowed adequate time for recovery.
From May 25 to 30, a subsample of juvenile Coho Salmon was randomly selected from the upper RST and measured for fork length (to the nearest millimetre) and weighed (to the nearest tenth of a gram).
2.3 Analysis
2.3.1 Environmental Conditions
Continuous water temperature (°C) and discharge (m3/sec) data for the duration of the sampling period was obtained from the real-time Water Survey of Canada (WSC) continuous data logger for the Sarita River (Station number: 08HB014; WSC 2018). Mean daily water temperature and discharge was then calculated for each sampling day.
2.3.2 Juvenile Salmonid Relative Abundance and Size Distribution
Catch per unit effort (CPUE) was calculated as an index of relative abundance for each sampling day for all juvenile salmonids, by life history stage, trap (i.e., small and large trap) and combined traps. Catch per unit effort was defined as the number fish captured per 24 hours of RST operation:
𝐶𝑃𝑈𝐸 =𝑀
𝐸 𝑥 24 (1)
Where:
M = Number of fish caught in RST; and
E = RST fishing effort (h).
Median and 95% catch dates were calculated for Chinook, Coho, and Chum salmon, by life history stage, as a proxy for median and 95% migration date, as daily juvenile abundance estimates were not determined. Median catch date was the date that 50% of juvenile outmigrants were estimated to have passed the RSTs.
Fork length statistics were calculated for Chinook and Coho salmon, by life history stage. Mean fork length with 95% confidence limits were calculated for juvenile Chinook Salmon by statistical week.
2.4 Data Quality Assurance and Control
In order to ensure consistently accurate data collection, a quality assurance (QA) and quality control (QC) program was established at the onset of the field program. The program involved a practice session held in the field prior to a new crew conducting the fieldwork to review data collection procedures. Data were entered in a rugged field iPad® to reduce the likelihood of transcription errors. Throughout the course of the study, a qualified and experienced Fisheries Biologist reviewed the data to ensure consistency in data collection procedures. Whenever clarification was required on specific points, the Field Technician was contacted by the Fisheries Biologist for editing and was accepted only after the necessary changes were made.
2017 Sarita River Chinook Salmon Outmigration Assessment RESULTS
LGL Limited 11
3 Results
3.1 Trap Operations and Environmental Conditions
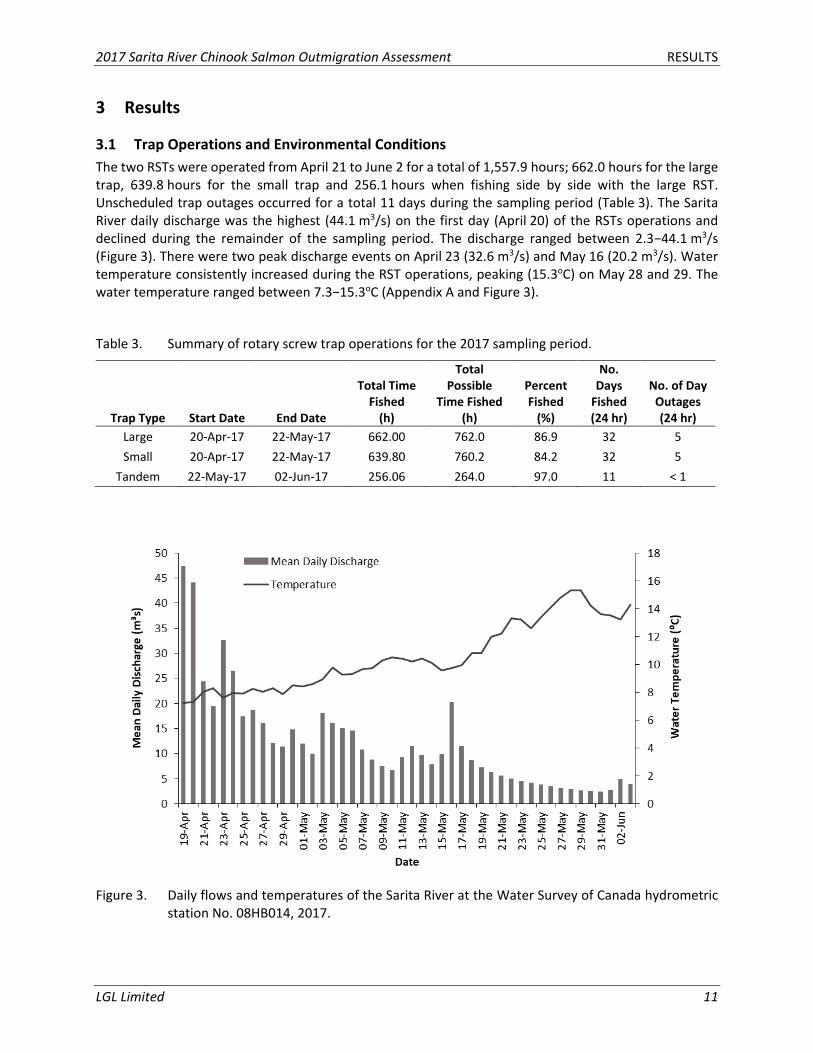
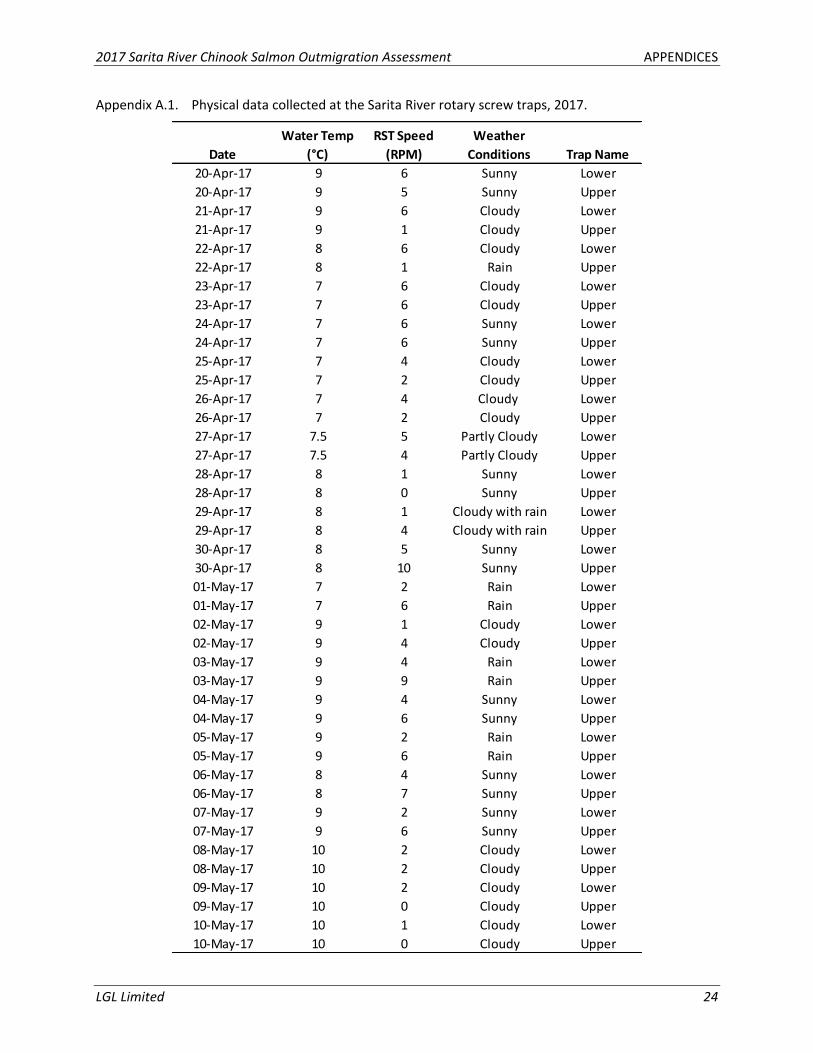
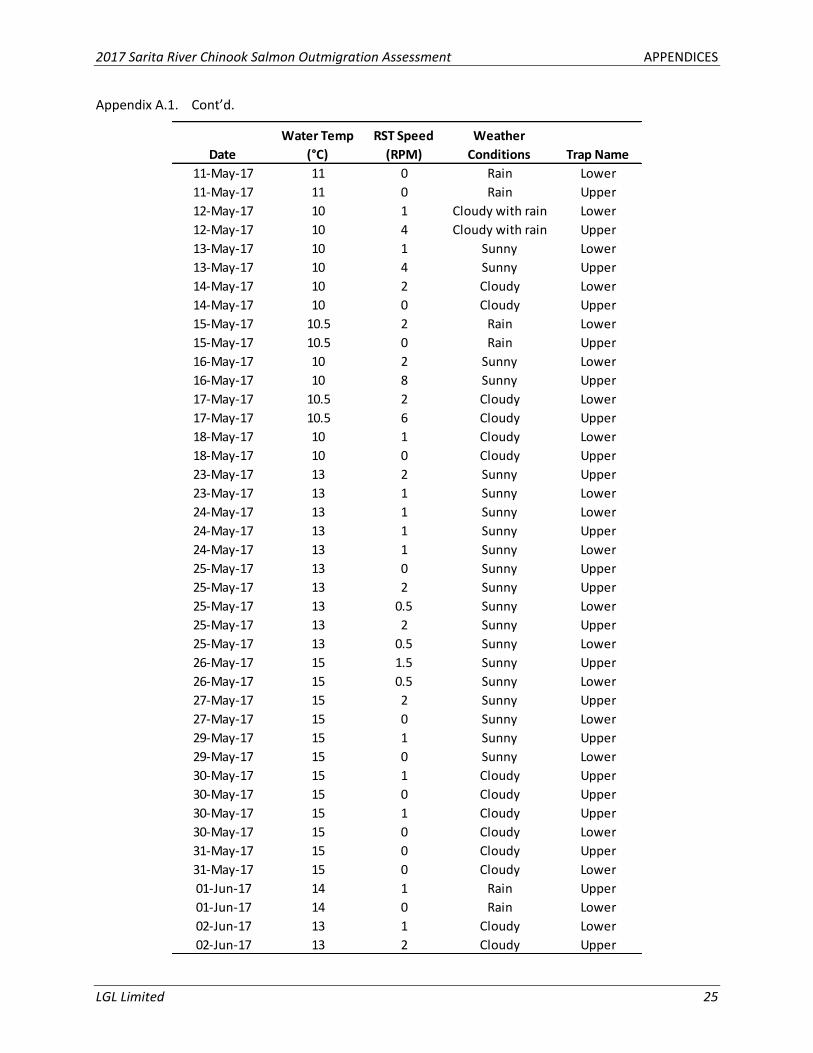
The two RSTs were operated from April 21 to June 2 for a total of 1,557.9 hours; 662.0 hours for the large trap, 639.8 hours for the small trap and 256.1 hours when fishing side by side with the large RST. Unscheduled trap outages occurred for a total 11 days during the sampling period (Table 3). The Sarita River daily discharge was the highest (44.1 m3/s) on the first day (April 20) of the RSTs operations and declined during the remainder of the sampling period. The discharge ranged between 2.3−44.1 m3/s (Figure 3). There were two peak discharge events on April 23 (32.6 m3/s) and May 16 (20.2 m3/s). Water temperature consistently increased during the RST operations, peaking (15.3oC) on May 28 and 29. The water temperature ranged between 7.3−15.3oC (Appendix A and Figure 3).
Table 3. Summary of rotary screw trap operations for the 2017 sampling period.
Trap Type Start Date End Date
Total Time Fished
(h)
Total Possible
Time Fished (h)
Percent Fished
(%)
No. Days
Fished (24 hr)
No. of Day Outages (24 hr)
Large 20-Apr-17 22-May-17 662.00 762.0 86.9 32 5
Small 20-Apr-17 22-May-17 639.80 760.2 84.2 32 5
Tandem 22-May-17 02-Jun-17 256.06 264.0 97.0 11 < 1
Figure 3. Daily flows and temperatures of the Sarita River at the Water Survey of Canada hydrometric station No. 08HB014, 2017.
2017 Sarita River Chinook Salmon Outmigration Assessment RESULTS
LGL Limited 12
3.2 Juvenile Salmonid Relative Abundance and Size Distribution
3.2.1 Wild Origin Chinook Salmon
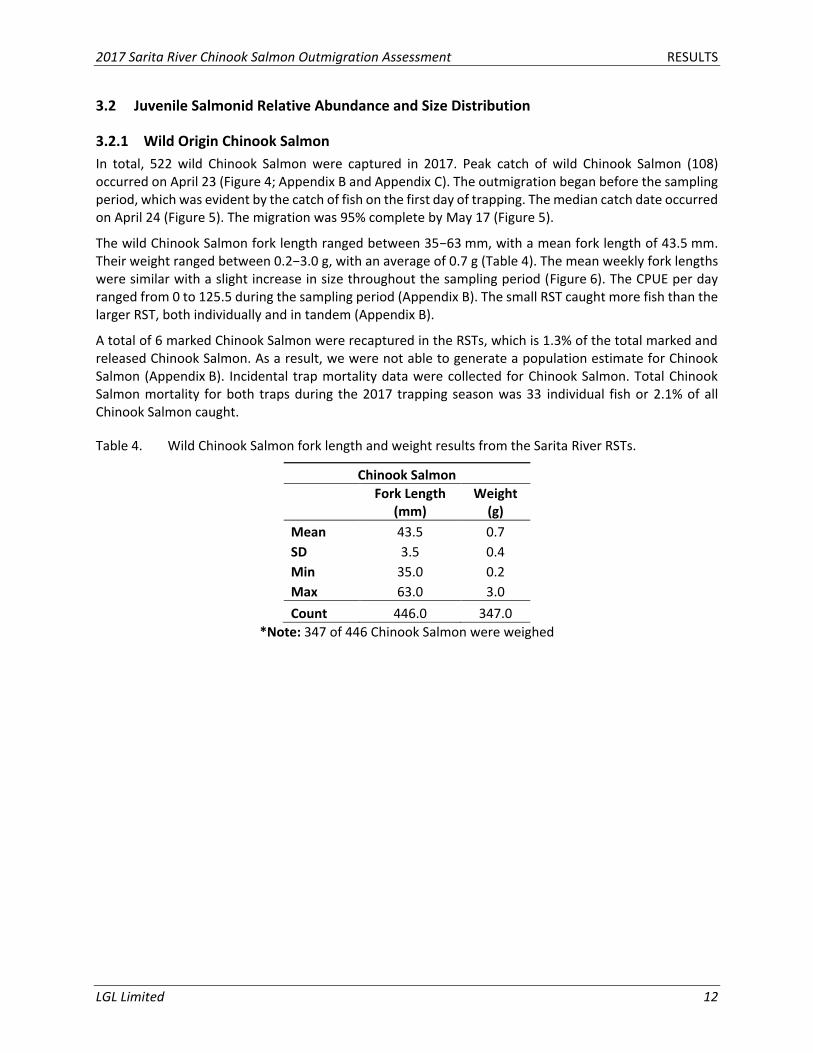
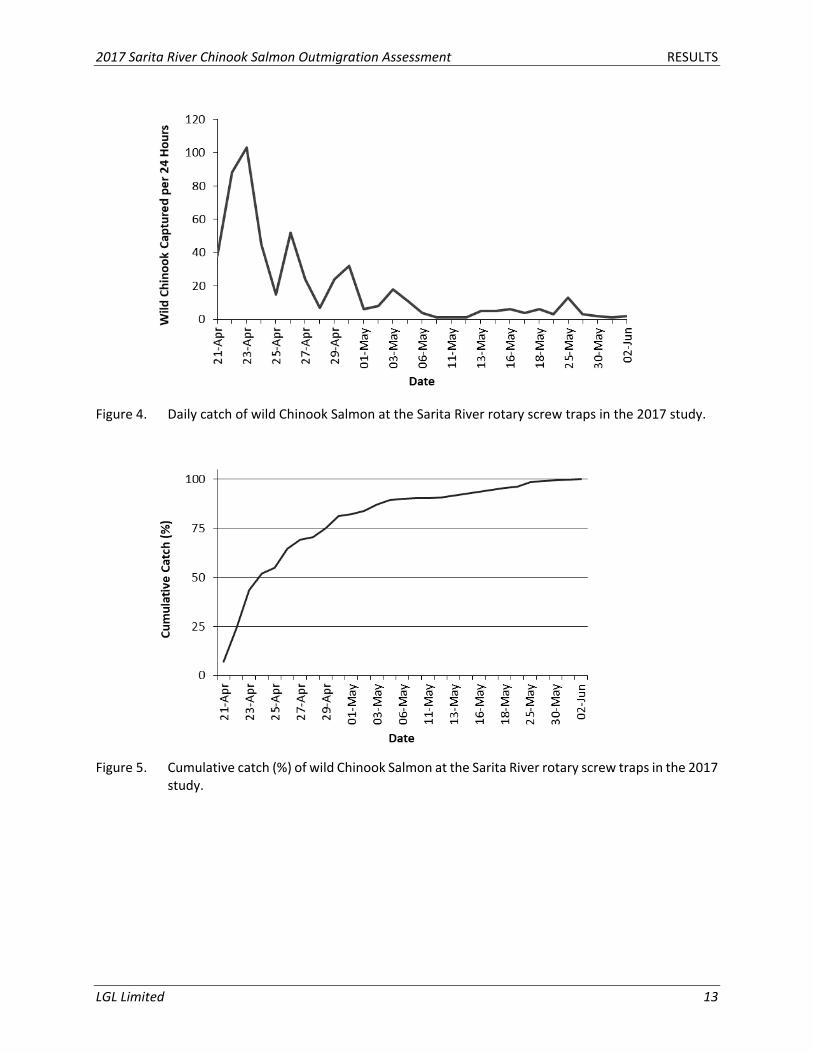
In total, 522 wild Chinook Salmon were captured in 2017. Peak catch of wild Chinook Salmon (108) occurred on April 23 (Figure 4; Appendix B and Appendix C). The outmigration began before the sampling period, which was evident by the catch of fish on the first day of trapping. The median catch date occurred on April 24 (Figure 5). The migration was 95% complete by May 17 (Figure 5).
The wild Chinook Salmon fork length ranged between 35−63 mm, with a mean fork length of 43.5 mm. Their weight ranged between 0.2−3.0 g, with an average of 0.7 g (Table 4). The mean weekly fork lengths were similar with a slight increase in size throughout the sampling period (Figure 6). The CPUE per day ranged from 0 to 125.5 during the sampling period (Appendix B). The small RST caught more fish than the larger RST, both individually and in tandem (Appendix B).
A total of 6 marked Chinook Salmon were recaptured in the RSTs, which is 1.3% of the total marked and released Chinook Salmon. As a result, we were not able to generate a population estimate for Chinook Salmon (Appendix B). Incidental trap mortality data were collected for Chinook Salmon. Total Chinook Salmon mortality for both traps during the 2017 trapping season was 33 individual fish or 2.1% of all Chinook Salmon caught.
Table 4. Wild Chinook Salmon fork length and weight results from the Sarita River RSTs.
Chinook Salmon
Fork Length
(mm) Weight
(g)
Mean 43.5 0.7
SD 3.5 0.4
Min 35.0 0.2
Max 63.0 3.0
Count 446.0 347.0
*Note: 347 of 446 Chinook Salmon were weighed
2017 Sarita River Chinook Salmon Outmigration Assessment RESULTS
LGL Limited 13
Figure 4. Daily catch of wild Chinook Salmon at the Sarita River rotary screw traps in the 2017 study.
Figure 5. Cumulative catch (%) of wild Chinook Salmon at the Sarita River rotary screw traps in the 2017 study.
2017 Sarita River Chinook Salmon Outmigration Assessment RESULTS
LGL Limited 14
Figure 6. Mean fork length of wild Chinook Salmon fry by statistical week during the sampling period.
3.2.2 Hatchery Origin Chinook Salmon
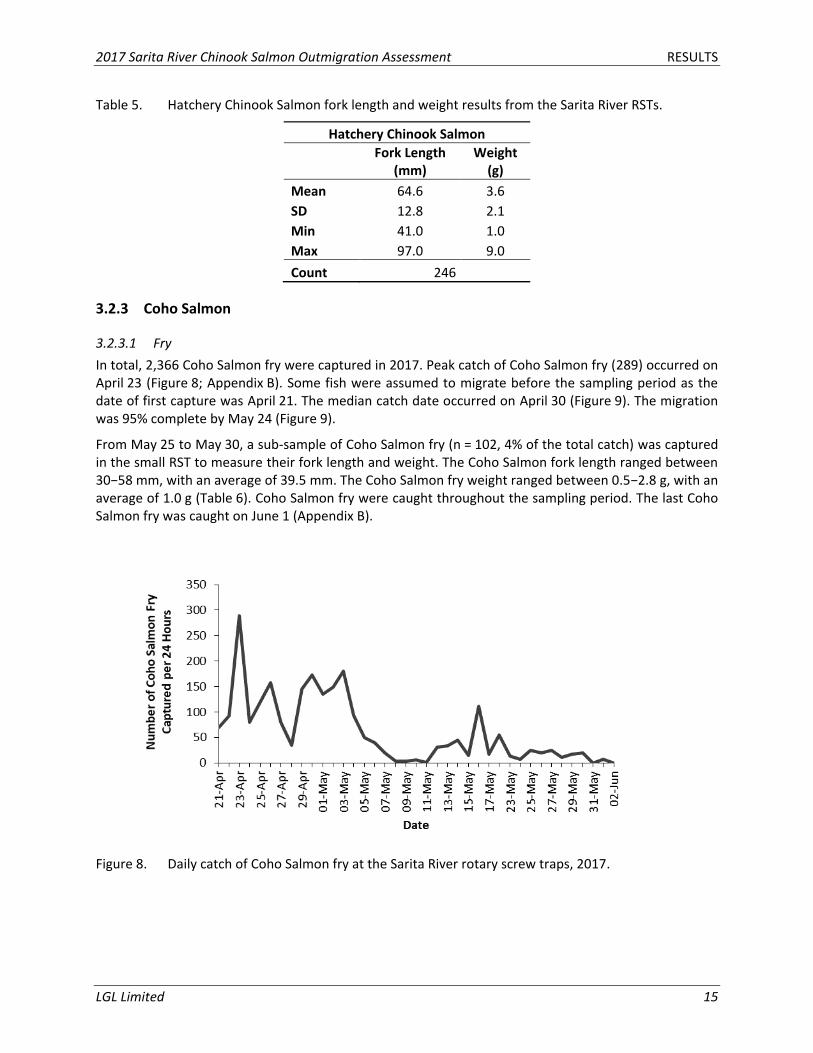
Of the approximately 380,000 hatchery Chinook Salmon released only 1,114 were recaptured (0.29% of the total released) at the RSTs. The majority (79%) of the hatchery Chinook Salmon were caught on May 25 (Figure 7).
The hatchery origin Chinook Salmon fork length ranged between 41−97 mm, with a mean fork length of 64.6 mm. Their weight ranged between 1.0−9.0 g, with an average of 3.6 g (Table 5). The small RST caught more fish than the larger RST (Appendix B).
Figure 7. Daily catch of hatchery Chinook Salmon in the Sarita River RSTs, 2017 study.
2017 Sarita River Chinook Salmon Outmigration Assessment RESULTS
LGL Limited 15
Table 5. Hatchery Chinook Salmon fork length and weight results from the Sarita River RSTs.
Hatchery Chinook Salmon
Fork Length
(mm) Weight
(g)
Mean 64.6 3.6
SD 12.8 2.1
Min 41.0 1.0
Max 97.0 9.0
Count 246
3.2.3 Coho Salmon
3.2.3.1 Fry
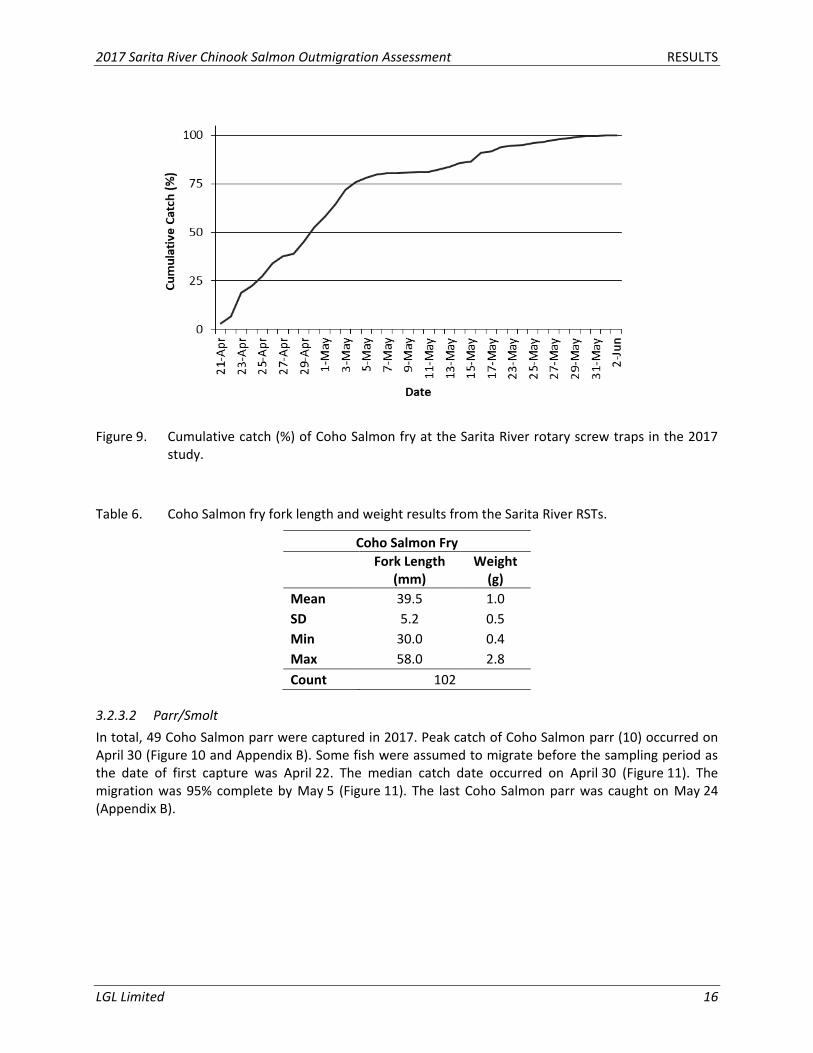
In total, 2,366 Coho Salmon fry were captured in 2017. Peak catch of Coho Salmon fry (289) occurred on April 23 (Figure 8; Appendix B). Some fish were assumed to migrate before the sampling period as the date of first capture was April 21. The median catch date occurred on April 30 (Figure 9). The migration was 95% complete by May 24 (Figure 9).
From May 25 to May 30, a sub-sample of Coho Salmon fry (n = 102, 4% of the total catch) was captured in the small RST to measure their fork length and weight. The Coho Salmon fork length ranged between 30−58 mm, with an average of 39.5 mm. The Coho Salmon fry weight ranged between 0.5−2.8 g, with an average of 1.0 g (Table 6). Coho Salmon fry were caught throughout the sampling period. The last Coho Salmon fry was caught on June 1 (Appendix B).
Figure 8. Daily catch of Coho Salmon fry at the Sarita River rotary screw traps, 2017.
2017 Sarita River Chinook Salmon Outmigration Assessment RESULTS
LGL Limited 16
Figure 9. Cumulative catch (%) of Coho Salmon fry at the Sarita River rotary screw traps in the 2017 study.
Table 6. Coho Salmon fry fork length and weight results from the Sarita River RSTs.
Coho Salmon Fry
Fork Length
(mm) Weight
(g)
Mean 39.5 1.0
SD 5.2 0.5
Min 30.0 0.4
Max 58.0 2.8
Count 102
3.2.3.2 Parr/Smolt
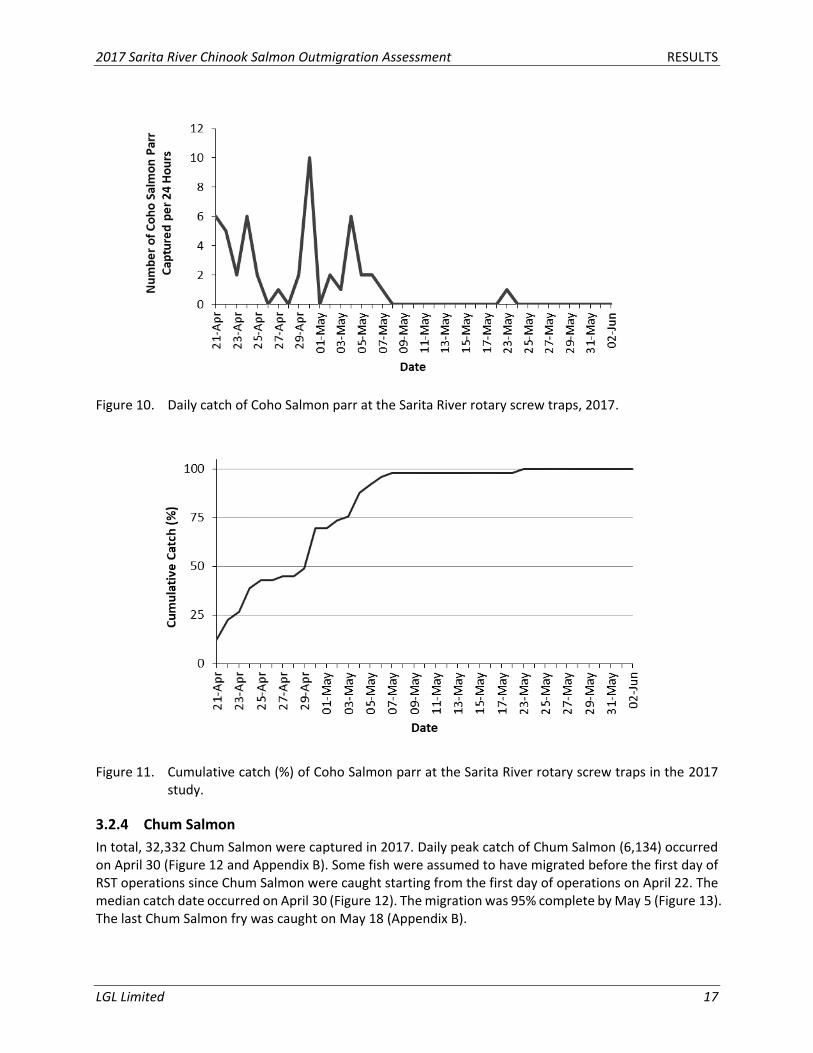
In total, 49 Coho Salmon parr were captured in 2017. Peak catch of Coho Salmon parr (10) occurred on April 30 (Figure 10 and Appendix B). Some fish were assumed to migrate before the sampling period as the date of first capture was April 22. The median catch date occurred on April 30 (Figure 11). The migration was 95% complete by May 5 (Figure 11). The last Coho Salmon parr was caught on May 24 (Appendix B).
2017 Sarita River Chinook Salmon Outmigration Assessment RESULTS
LGL Limited 17
Figure 10. Daily catch of Coho Salmon parr at the Sarita River rotary screw traps, 2017.
Figure 11. Cumulative catch (%) of Coho Salmon parr at the Sarita River rotary screw traps in the 2017 study.
3.2.4 Chum Salmon
In total, 32,332 Chum Salmon were captured in 2017. Daily peak catch of Chum Salmon (6,134) occurred on April 30 (Figure 12 and Appendix B). Some fish were assumed to have migrated before the first day of RST operations since Chum Salmon were caught starting from the first day of operations on April 22. The median catch date occurred on April 30 (Figure 12). The migration was 95% complete by May 5 (Figure 13). The last Chum Salmon fry was caught on May 18 (Appendix B).
2017 Sarita River Chinook Salmon Outmigration Assessment RESULTS
LGL Limited 18
Figure 12. Daily catch of Chum Salmon at the Sarita River rotary screw traps, 2017.
Figure 13. Cumulative catch (%) of Chum Salmon at the Sarita River rotary screw traps in the 2017 study.
3.2.5 Other Species
A number of other salmonid and non-salmonid species were caught during the sampling period (Appendix C). While Rainbow Trout fry and parr were occasionally caught, their relative abundance was too low to reliably characterize migration timing and duration. Other species caught included Prickly Sculpin and Threespine Stickleback. Prickly Sculpin were the most abundant (416) non-salmonid species caught in the RSTs.

2017 Sarita River Chinook Salmon Outmigration Assessment DISCUSSION
LGL Limited 19
4 Discussion This study marked the first time RSTs were operated in the Sarita River. Crews were able to effectively and safely operate the RSTs over a range of water conditions with minimal down time. Lower than average flows caused decreased RPMs in the latter part of the study and the selected RST sites did not provide sufficient flows funneled into the RSTs to perform optimally in these low flow conditions. This problem is planned to be addressed with the selection of a new site for the 2018 outmigration, ideally a location with more constricted flows during low water events and therefore higher velocities of water flowing through the RSTs. Although water conditions provided some challenges in the study, valuable insight was gained with regards to Sarita River juvenile Chinook Salmon outmigration. These data provide the first assessment on naturally spawned juvenile Chinook Salmon abundance and outmigration timing in the Sarita River.
Water flows in the Sarita River in the spring of 2017 were below preferred discharge conditions for RST operations given the hydrological characteristics of the chosen sites. In an attempt to improve the small RST operation and increase trap efficiency, the trap was moved downstream on May 22, to operate in tandem with the large RST. However, as flows continued to decline, the lower site saw an increase in eddies and a decrease in water velocity. As a result, the RSTs would only rotate intermittently during the lower flows to the end of the study period. On occasion adjustments to the RSTs angle within the river channel were required in order to maximize cone rotation speed.
The overall relative abundance of juvenile Chinook Salmon and recapture of marked juvenile Chinook Salmon were lower than expected. This is because of (1) low catch efficiency throughout the majority of the study period; and (2) commencement of the study after peak outmigration. Greater relative abundance at the start of the study followed by declining relative abundance throughout the study period suggests that the peak outmigration occurred prior to the start date. Furthermore, the timing of juvenile Chinook Salmon outmigration is known to commence as early as February and peak between mid-March and early April for other Chinook Salmon stocks on Vancouver Island (Groot and Margolis 1991). An earlier mobilization date for the RSTs would have allowed for an increase in juvenile Chinook Salmon catches as the start, peak, and end of the outmigration could have been sampled.
The estimated catch efficiency was low throughout the duration of the sampling period. Low trap efficiency was confirmed in late May with the release of hatchery Chinook Salmon, where 0.29% of the released fish were caught. We were unable to estimate the catch efficiency before the hatchery release earlier in the study due to low re-capture (6 in total) of marked Chinook Salmon of marked fish. Therefore, a Chinook Salmon abundance estimate could not be calculated with confidence.
Juvenile Chinook Salmon mortality was low from RST operations throughout the study period. The low mortality was as a result of mitigation measures put in place at the onset of the study. These mitigation measures included using weighted buckets in the holding boxes as a flow refugia and using other materials as cover in the holding boxes.
2017 Sarita River Chinook Salmon Outmigration Assessment RECOMMENDATIONS
LGL Limited 20
5 Recommendations Our general recommendation for future work on the Sarita River is to continue and improve RST monitoring of Chinook smolt outmigration at a new site. The following detailed recommendations are proposed for monitoring the Chinook and Chum salmon migration from the Sarita River in subsequent years:
1. Start operating the RSTs earlier than in 2017. A proposed start date is the last week of February with an end date of late May or early June;
2. Relocate the RSTs to another suitable location downstream and just upstream of the high tide elevation to improve trap capture efficiency and capture smolts out-migrating from all of the Sarita River, including fish spawned into the section downstream of the 2017 RST locations;
3. Assess feasibility of using a continuous line and pulley system to allow for fine tuning of the trap location and orientation in changing water conditions;
4. Stratify Chinook Salmon marking by statistical week to calculate weekly trap efficiency estimates if fish can be marked with low risk of injury or mortality;
5. Motorize the large RST to maintain consistent trap revolutions throughout the study period; and
6. Collect fork length from a subset of individual Chinook and Coho salmon captured throughout the outmigration period.
2017 Sarita River Chinook Salmon Outmigration Assessment REFERENCES
LGL Limited 21
REFERENCES Barry, K. 2010. Habitat status report for the Sarita River watershed, Vancouver Island, BC. Prepared for
Department of Fisheries and Oceans Canada, Nanaimo, BC.
BC MOE (Ministry of Environment). 2017. HabitatWizard stream report: Sarita River. Available at http://a100.gov.bc.ca/pub/reports/rwservlet?habitat_wizard_streams_report&p_title=%22Ministry%20of%20Environment%22&P_STREAM_ID=505133.
DFO (Fisheries and Oceans Canada). 2013. Review and update of southern BC Chinook conservation unit assignments. DFO Can. Sci. Advis. Sec. Sci. Resp. 2013/022.
Groot, C. and L. Margolis. 1991. Pacific Salmon life histories. University of British Columbia Press, Vancouver, BC.
Holtby, L. B. and K. A Ciruna. 2007. Conservation units for Pacific Salmon under the Wild Salmon Policy. Fisheries and Oceans Canada, Canadian Science Advisory Secretariat Research Paper 2007/070.
LGL (LGL Limited). 2017. Sarita and Pachena watershed renewal framework. Prepared for Huu-ay-aht First Nations, Anacla, BC.
Volkhardt, G. C., S. L. Johnson, B. A. Miller, T. E. Nickelson, and D. E. Seiler. 2007. Rotary screw traps and inclined plane screen traps. Pages 235−266 in D. H. Johnson et al. 2007. Salmonid field protocols handbook: techniques for assessing status and trends in salmon and trout populations. American Fisheries Society, Bethesda, MD.
WSC (Water Survey of Canada). 2018. Real-time hydrometric data. Retrieved March 01, 2018, from https://wateroffice.ec.gc.ca/mainmenu/real_time_data_index_e.html.
2017 Sarita River Chinook Salmon Outmigration Assessment APPENDICES
LGL Limited 22
APPENDICES
2017 Sarita River Chinook Salmon Outmigration Assessment APPENDICES
LGL Limited 23
APPENDIX A
DAILY PHYSICAL DATA
Appendix A. Daily physical data.
2017 Sarita River Chinook Salmon Outmigration Assessment APPENDICES
LGL Limited 24
Appendix A.1. Physical data collected at the Sarita River rotary screw traps, 2017.
Date
Water Temp
(°C)
RST Speed
(RPM)
Weather
Conditions Trap Name
20-Apr-17 9 6 Sunny Lower
20-Apr-17 9 5 Sunny Upper
21-Apr-17 9 6 Cloudy Lower
21-Apr-17 9 1 Cloudy Upper
22-Apr-17 8 6 Cloudy Lower
22-Apr-17 8 1 Rain Upper
23-Apr-17 7 6 Cloudy Lower
23-Apr-17 7 6 Cloudy Upper
24-Apr-17 7 6 Sunny Lower
24-Apr-17 7 6 Sunny Upper
25-Apr-17 7 4 Cloudy Lower
25-Apr-17 7 2 Cloudy Upper
26-Apr-17 7 4 Cloudy Lower
26-Apr-17 7 2 Cloudy Upper
27-Apr-17 7.5 5 Partly Cloudy Lower
27-Apr-17 7.5 4 Partly Cloudy Upper
28-Apr-17 8 1 Sunny Lower
28-Apr-17 8 0 Sunny Upper
29-Apr-17 8 1 Cloudy with rain Lower
29-Apr-17 8 4 Cloudy with rain Upper
30-Apr-17 8 5 Sunny Lower
30-Apr-17 8 10 Sunny Upper
01-May-17 7 2 Rain Lower
01-May-17 7 6 Rain Upper
02-May-17 9 1 Cloudy Lower
02-May-17 9 4 Cloudy Upper
03-May-17 9 4 Rain Lower
03-May-17 9 9 Rain Upper
04-May-17 9 4 Sunny Lower
04-May-17 9 6 Sunny Upper
05-May-17 9 2 Rain Lower
05-May-17 9 6 Rain Upper
06-May-17 8 4 Sunny Lower
06-May-17 8 7 Sunny Upper
07-May-17 9 2 Sunny Lower
07-May-17 9 6 Sunny Upper
08-May-17 10 2 Cloudy Lower
08-May-17 10 2 Cloudy Upper
09-May-17 10 2 Cloudy Lower
09-May-17 10 0 Cloudy Upper
10-May-17 10 1 Cloudy Lower
10-May-17 10 0 Cloudy Upper
2017 Sarita River Chinook Salmon Outmigration Assessment APPENDICES
LGL Limited 25
Appendix A.1. Cont’d.
Date
Water Temp
(°C)
RST Speed
(RPM)
Weather
Conditions Trap Name
11-May-17 11 0 Rain Lower
11-May-17 11 0 Rain Upper
12-May-17 10 1 Cloudy with rain Lower
12-May-17 10 4 Cloudy with rain Upper
13-May-17 10 1 Sunny Lower
13-May-17 10 4 Sunny Upper
14-May-17 10 2 Cloudy Lower
14-May-17 10 0 Cloudy Upper
15-May-17 10.5 2 Rain Lower
15-May-17 10.5 0 Rain Upper
16-May-17 10 2 Sunny Lower
16-May-17 10 8 Sunny Upper
17-May-17 10.5 2 Cloudy Lower
17-May-17 10.5 6 Cloudy Upper
18-May-17 10 1 Cloudy Lower
18-May-17 10 0 Cloudy Upper
23-May-17 13 2 Sunny Upper
23-May-17 13 1 Sunny Lower
24-May-17 13 1 Sunny Lower
24-May-17 13 1 Sunny Upper
24-May-17 13 1 Sunny Lower
25-May-17 13 0 Sunny Upper
25-May-17 13 2 Sunny Upper
25-May-17 13 0.5 Sunny Lower
25-May-17 13 2 Sunny Upper
25-May-17 13 0.5 Sunny Lower
26-May-17 15 1.5 Sunny Upper
26-May-17 15 0.5 Sunny Lower
27-May-17 15 2 Sunny Upper
27-May-17 15 0 Sunny Lower
29-May-17 15 1 Sunny Upper
29-May-17 15 0 Sunny Lower
30-May-17 15 1 Cloudy Upper
30-May-17 15 0 Cloudy Upper
30-May-17 15 1 Cloudy Upper
30-May-17 15 0 Cloudy Lower
31-May-17 15 0 Cloudy Upper
31-May-17 15 0 Cloudy Lower
01-Jun-17 14 1 Rain Upper
01-Jun-17 14 0 Rain Lower
02-Jun-17 13 1 Cloudy Lower
02-Jun-17 13 2 Cloudy Upper
2017 Sarita River Chinook Salmon Outmigration Assessment APPENDICES
LGL Limited 26
APPENDIX B
SARITA RIVER ROTARY SCREW TRAP DAILY CATCH
Appendix B. Sarita River rotary screw trap daily catch.
2017 Sarita River Chinook Salmon Outmigration Assessment APPENDICES
LGL Limited 27
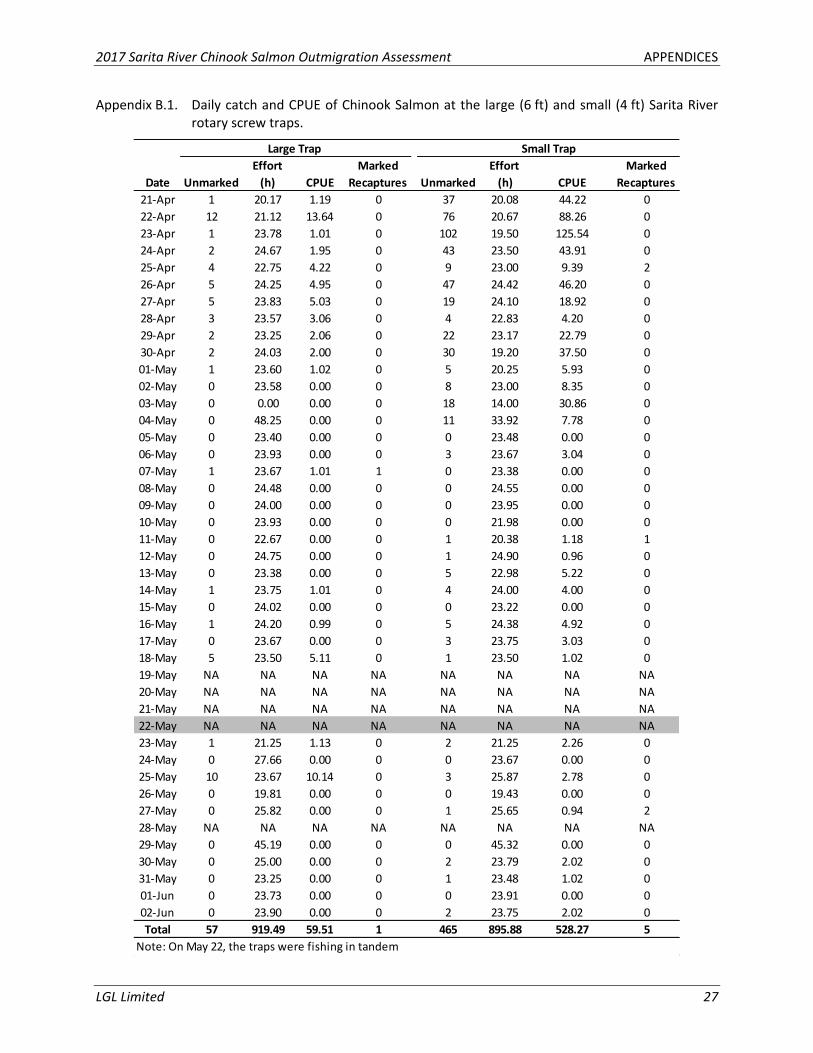
Appendix B.1. Daily catch and CPUE of Chinook Salmon at the large (6 ft) and small (4 ft) Sarita River rotary screw traps.
Date Unmarked
Effort
(h) CPUE
Marked
Recaptures Unmarked
Effort
(h) CPUE
Marked
Recaptures
21-Apr 1 20.17 1.19 0 37 20.08 44.22 0
22-Apr 12 21.12 13.64 0 76 20.67 88.26 0
23-Apr 1 23.78 1.01 0 102 19.50 125.54 0
24-Apr 2 24.67 1.95 0 43 23.50 43.91 0
25-Apr 4 22.75 4.22 0 9 23.00 9.39 2
26-Apr 5 24.25 4.95 0 47 24.42 46.20 0
27-Apr 5 23.83 5.03 0 19 24.10 18.92 0
28-Apr 3 23.57 3.06 0 4 22.83 4.20 0
29-Apr 2 23.25 2.06 0 22 23.17 22.79 0
30-Apr 2 24.03 2.00 0 30 19.20 37.50 0
01-May 1 23.60 1.02 0 5 20.25 5.93 0
02-May 0 23.58 0.00 0 8 23.00 8.35 0
03-May 0 0.00 0.00 0 18 14.00 30.86 0
04-May 0 48.25 0.00 0 11 33.92 7.78 0
05-May 0 23.40 0.00 0 0 23.48 0.00 0
06-May 0 23.93 0.00 0 3 23.67 3.04 0
07-May 1 23.67 1.01 1 0 23.38 0.00 0
08-May 0 24.48 0.00 0 0 24.55 0.00 0
09-May 0 24.00 0.00 0 0 23.95 0.00 0
10-May 0 23.93 0.00 0 0 21.98 0.00 0
11-May 0 22.67 0.00 0 1 20.38 1.18 1
12-May 0 24.75 0.00 0 1 24.90 0.96 0
13-May 0 23.38 0.00 0 5 22.98 5.22 0
14-May 1 23.75 1.01 0 4 24.00 4.00 0
15-May 0 24.02 0.00 0 0 23.22 0.00 0
16-May 1 24.20 0.99 0 5 24.38 4.92 0
17-May 0 23.67 0.00 0 3 23.75 3.03 0
18-May 5 23.50 5.11 0 1 23.50 1.02 0
19-May NA NA NA NA NA NA NA NA
20-May NA NA NA NA NA NA NA NA
21-May NA NA NA NA NA NA NA NA
22-May NA NA NA NA NA NA NA NA
23-May 1 21.25 1.13 0 2 21.25 2.26 0
24-May 0 27.66 0.00 0 0 23.67 0.00 0
25-May 10 23.67 10.14 0 3 25.87 2.78 0
26-May 0 19.81 0.00 0 0 19.43 0.00 0
27-May 0 25.82 0.00 0 1 25.65 0.94 2
28-May NA NA NA NA NA NA NA NA
29-May 0 45.19 0.00 0 0 45.32 0.00 0
30-May 0 25.00 0.00 0 2 23.79 2.02 0
31-May 0 23.25 0.00 0 1 23.48 1.02 0
01-Jun 0 23.73 0.00 0 0 23.91 0.00 0
02-Jun 0 23.90 0.00 0 2 23.75 2.02 0
Total 57 919.49 59.51 1 465 895.88 528.27 5
Large Trap Small Trap
Note: On May 22, the traps were fishing in tandem
2017 Sarita River Chinook Salmon Outmigration Assessment APPENDICES
LGL Limited 28
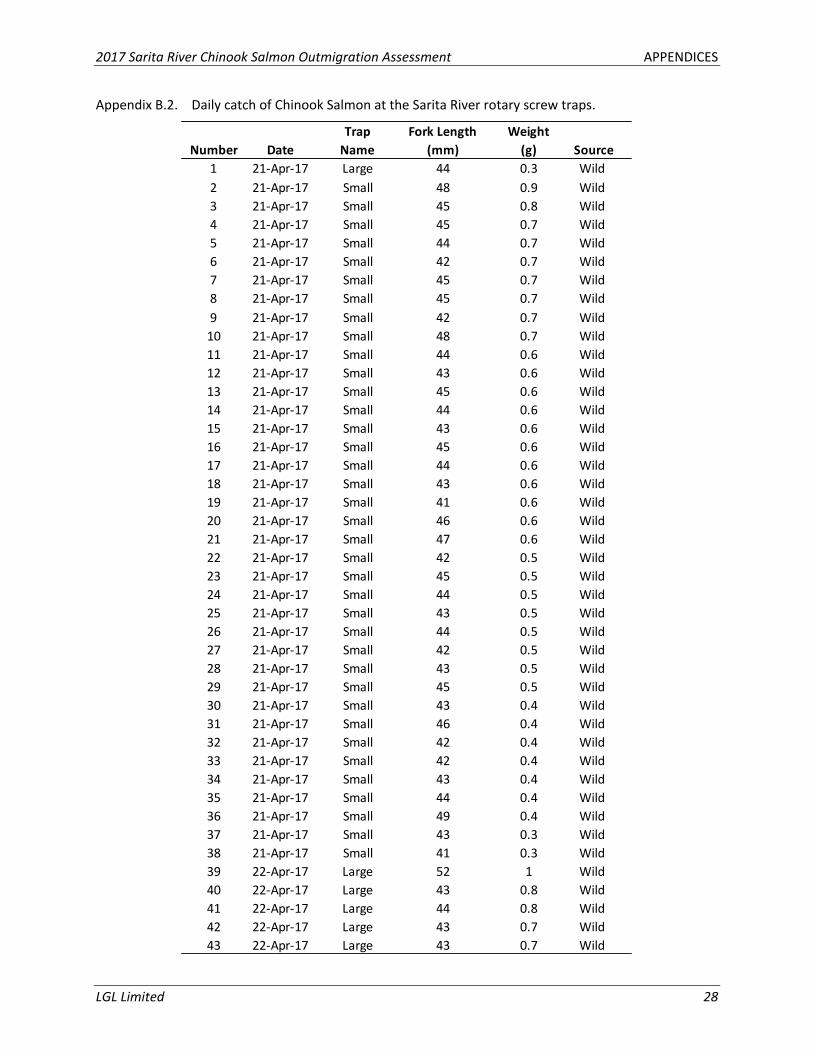
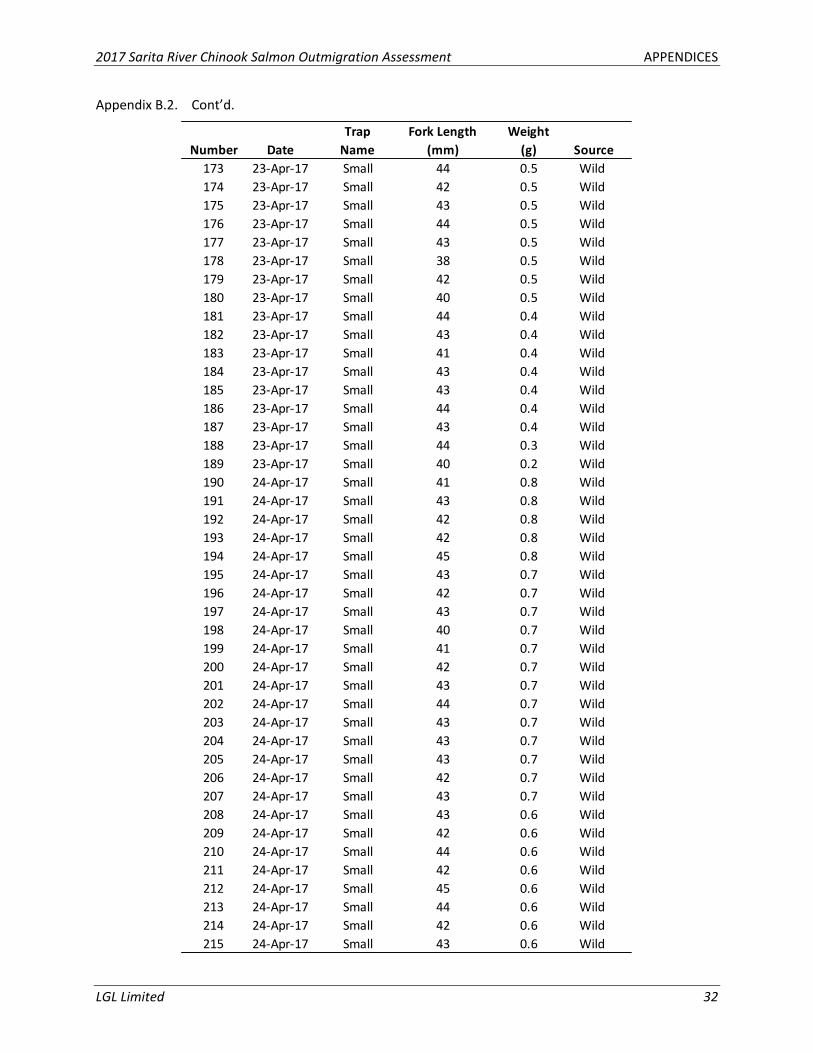
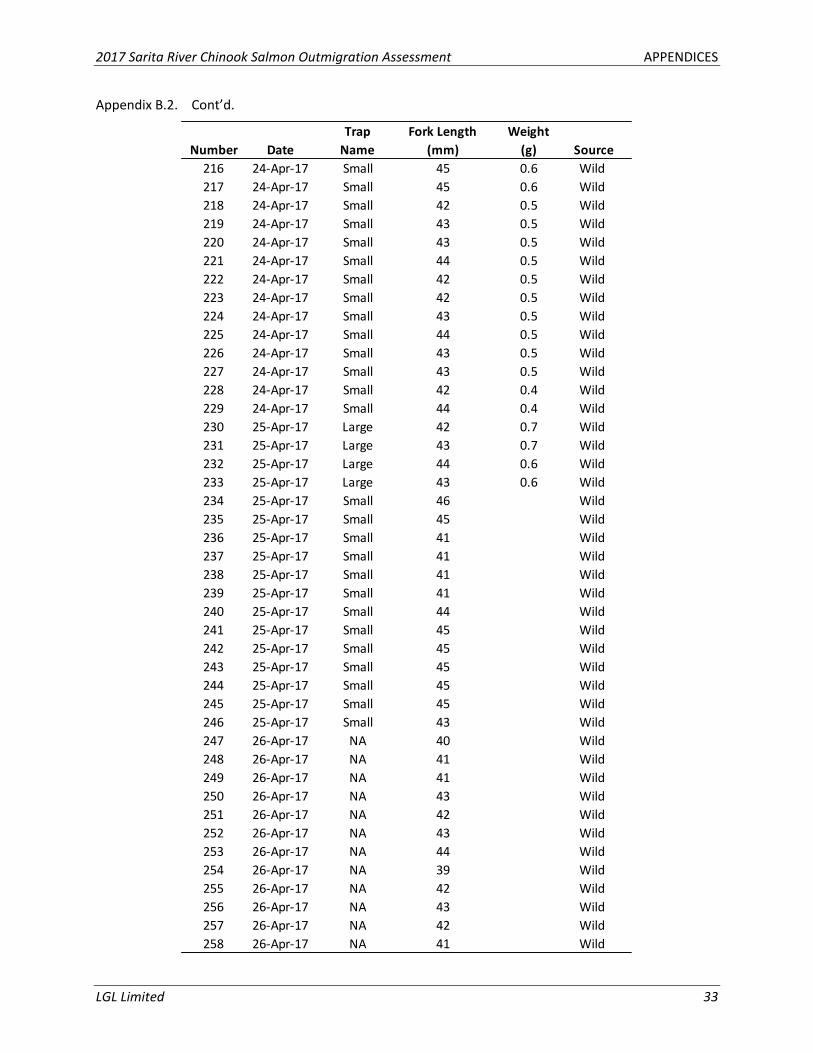
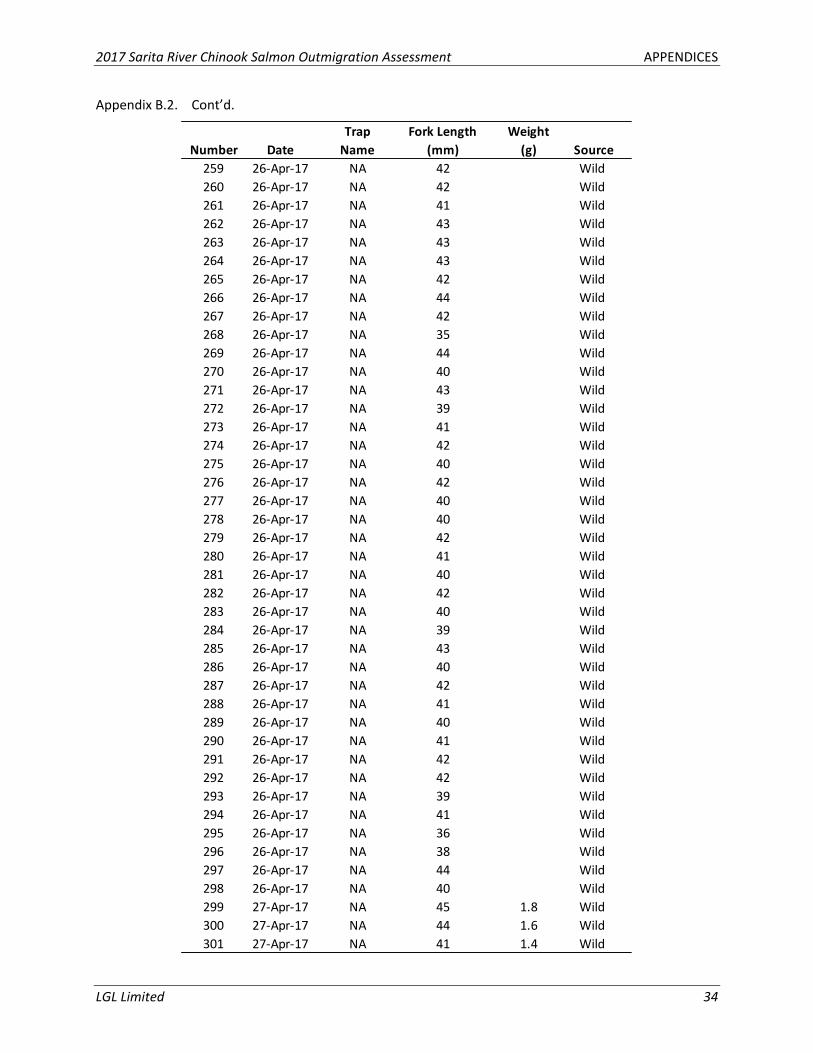
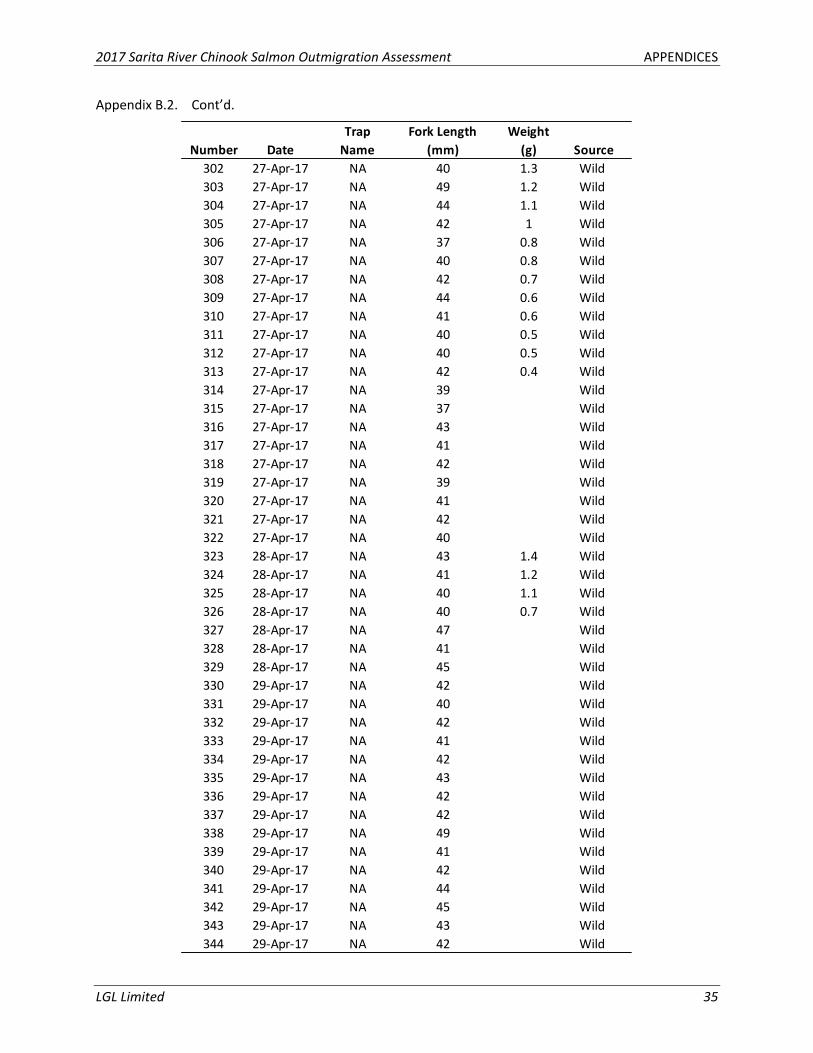
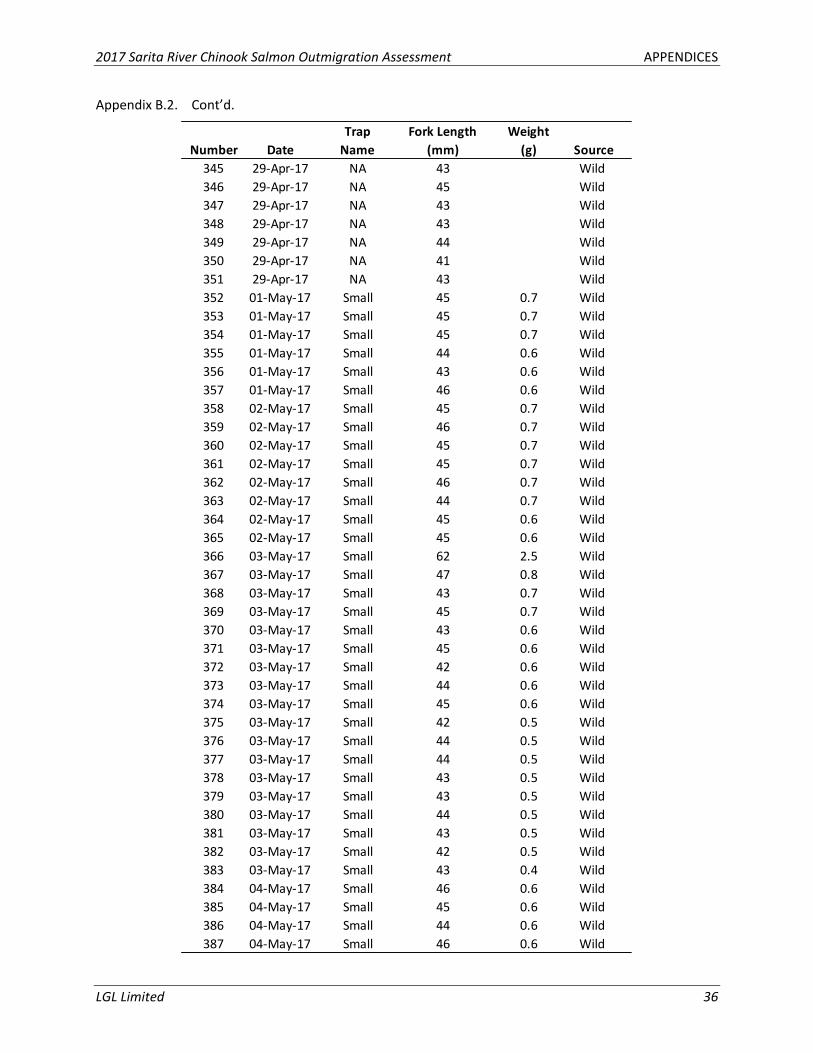
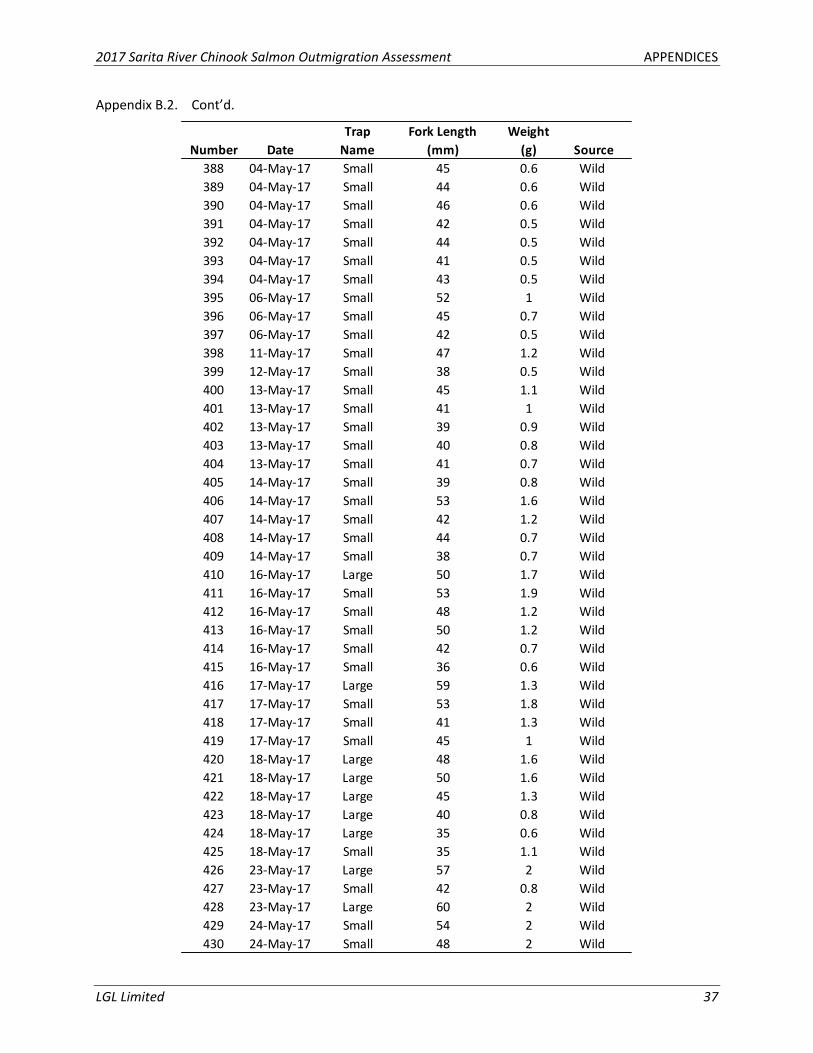
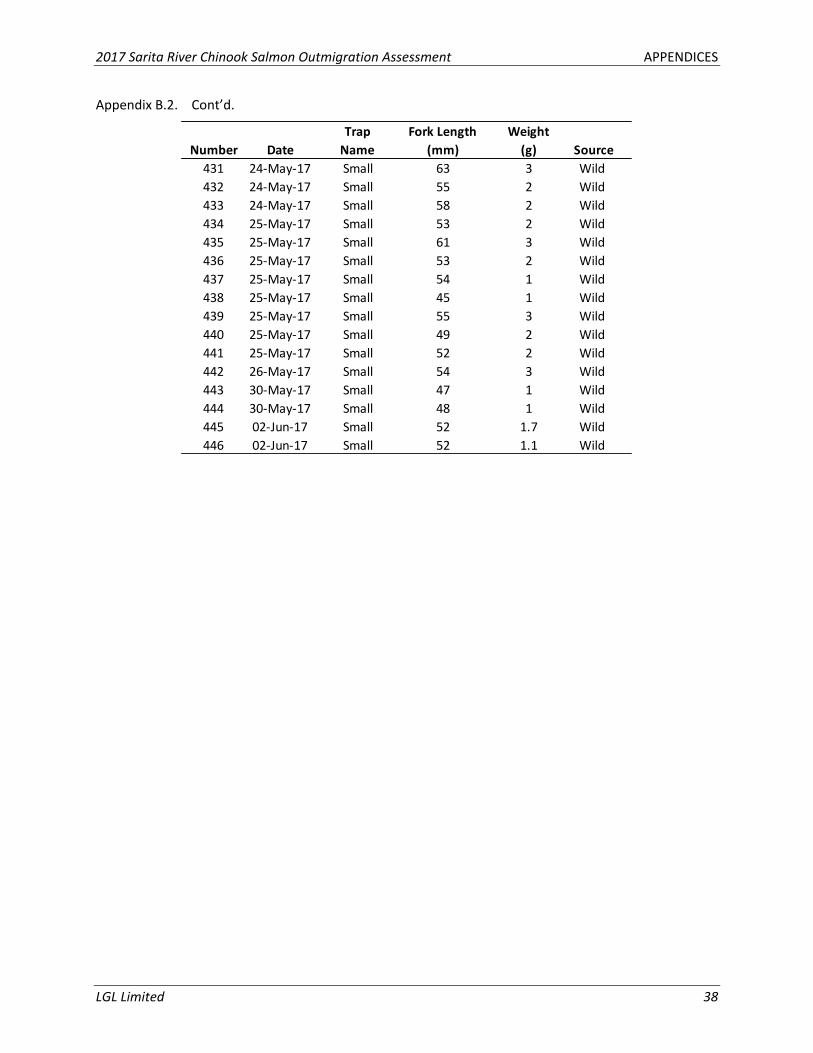
Appendix B.2. Daily catch of Chinook Salmon at the Sarita River rotary screw traps.
Number Date
Trap
Name
Fork Length
(mm)
Weight
(g) Source
1 21-Apr-17 Large 44 0.3 Wild
2 21-Apr-17 Small 48 0.9 Wild
3 21-Apr-17 Small 45 0.8 Wild
4 21-Apr-17 Small 45 0.7 Wild
5 21-Apr-17 Small 44 0.7 Wild
6 21-Apr-17 Small 42 0.7 Wild
7 21-Apr-17 Small 45 0.7 Wild
8 21-Apr-17 Small 45 0.7 Wild
9 21-Apr-17 Small 42 0.7 Wild
10 21-Apr-17 Small 48 0.7 Wild
11 21-Apr-17 Small 44 0.6 Wild
12 21-Apr-17 Small 43 0.6 Wild
13 21-Apr-17 Small 45 0.6 Wild
14 21-Apr-17 Small 44 0.6 Wild
15 21-Apr-17 Small 43 0.6 Wild
16 21-Apr-17 Small 45 0.6 Wild
17 21-Apr-17 Small 44 0.6 Wild
18 21-Apr-17 Small 43 0.6 Wild
19 21-Apr-17 Small 41 0.6 Wild
20 21-Apr-17 Small 46 0.6 Wild
21 21-Apr-17 Small 47 0.6 Wild
22 21-Apr-17 Small 42 0.5 Wild
23 21-Apr-17 Small 45 0.5 Wild
24 21-Apr-17 Small 44 0.5 Wild
25 21-Apr-17 Small 43 0.5 Wild
26 21-Apr-17 Small 44 0.5 Wild
27 21-Apr-17 Small 42 0.5 Wild
28 21-Apr-17 Small 43 0.5 Wild
29 21-Apr-17 Small 45 0.5 Wild
30 21-Apr-17 Small 43 0.4 Wild
31 21-Apr-17 Small 46 0.4 Wild
32 21-Apr-17 Small 42 0.4 Wild
33 21-Apr-17 Small 42 0.4 Wild
34 21-Apr-17 Small 43 0.4 Wild
35 21-Apr-17 Small 44 0.4 Wild
36 21-Apr-17 Small 49 0.4 Wild
37 21-Apr-17 Small 43 0.3 Wild
38 21-Apr-17 Small 41 0.3 Wild
39 22-Apr-17 Large 52 1 Wild
40 22-Apr-17 Large 43 0.8 Wild
41 22-Apr-17 Large 44 0.8 Wild
42 22-Apr-17 Large 43 0.7 Wild
43 22-Apr-17 Large 43 0.7 Wild
2017 Sarita River Chinook Salmon Outmigration Assessment APPENDICES
LGL Limited 29
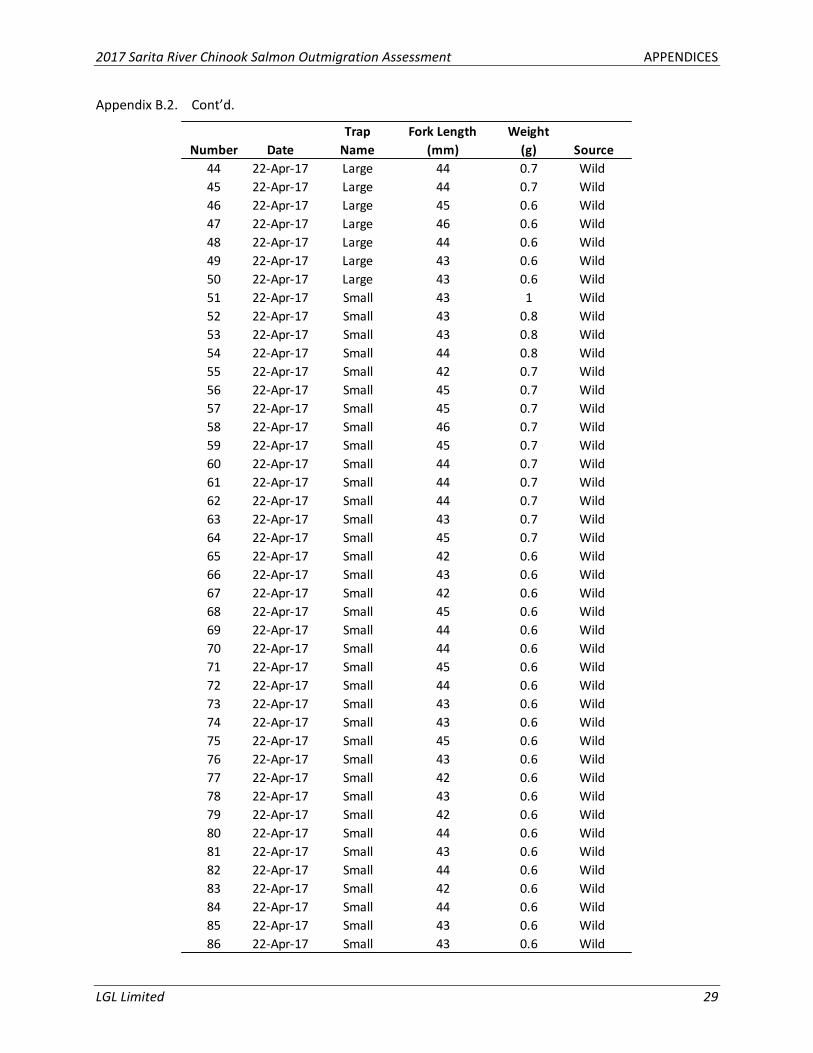
Appendix B.2. Cont’d.
Number Date
Trap
Name
Fork Length
(mm)
Weight
(g) Source
44 22-Apr-17 Large 44 0.7 Wild
45 22-Apr-17 Large 44 0.7 Wild
46 22-Apr-17 Large 45 0.6 Wild
47 22-Apr-17 Large 46 0.6 Wild
48 22-Apr-17 Large 44 0.6 Wild
49 22-Apr-17 Large 43 0.6 Wild
50 22-Apr-17 Large 43 0.6 Wild
51 22-Apr-17 Small 43 1 Wild
52 22-Apr-17 Small 43 0.8 Wild
53 22-Apr-17 Small 43 0.8 Wild
54 22-Apr-17 Small 44 0.8 Wild
55 22-Apr-17 Small 42 0.7 Wild
56 22-Apr-17 Small 45 0.7 Wild
57 22-Apr-17 Small 45 0.7 Wild
58 22-Apr-17 Small 46 0.7 Wild
59 22-Apr-17 Small 45 0.7 Wild
60 22-Apr-17 Small 44 0.7 Wild
61 22-Apr-17 Small 44 0.7 Wild
62 22-Apr-17 Small 44 0.7 Wild
63 22-Apr-17 Small 43 0.7 Wild
64 22-Apr-17 Small 45 0.7 Wild
65 22-Apr-17 Small 42 0.6 Wild
66 22-Apr-17 Small 43 0.6 Wild
67 22-Apr-17 Small 42 0.6 Wild
68 22-Apr-17 Small 45 0.6 Wild
69 22-Apr-17 Small 44 0.6 Wild
70 22-Apr-17 Small 44 0.6 Wild
71 22-Apr-17 Small 45 0.6 Wild
72 22-Apr-17 Small 44 0.6 Wild
73 22-Apr-17 Small 43 0.6 Wild
74 22-Apr-17 Small 43 0.6 Wild
75 22-Apr-17 Small 45 0.6 Wild
76 22-Apr-17 Small 43 0.6 Wild
77 22-Apr-17 Small 42 0.6 Wild
78 22-Apr-17 Small 43 0.6 Wild
79 22-Apr-17 Small 42 0.6 Wild
80 22-Apr-17 Small 44 0.6 Wild
81 22-Apr-17 Small 43 0.6 Wild
82 22-Apr-17 Small 44 0.6 Wild
83 22-Apr-17 Small 42 0.6 Wild
84 22-Apr-17 Small 44 0.6 Wild
85 22-Apr-17 Small 43 0.6 Wild
86 22-Apr-17 Small 43 0.6 Wild
2017 Sarita River Chinook Salmon Outmigration Assessment APPENDICES
LGL Limited 30
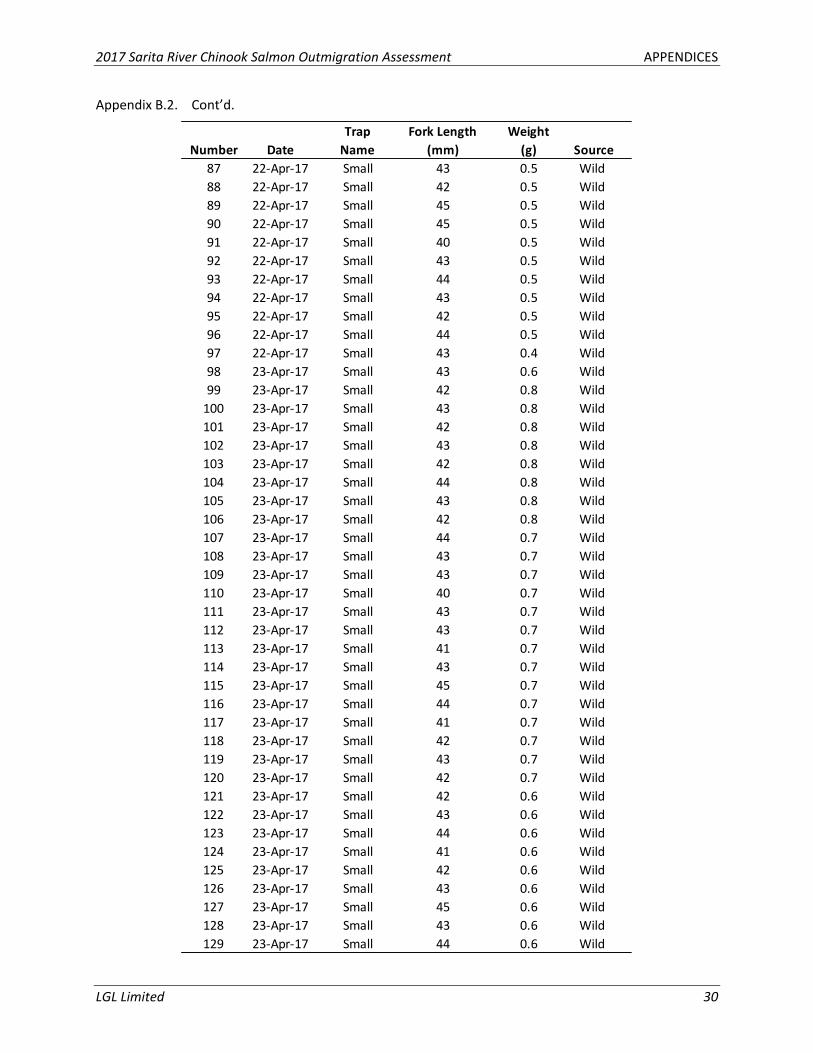
Appendix B.2. Cont’d.
Number Date
Trap
Name
Fork Length
(mm)
Weight
(g) Source
87 22-Apr-17 Small 43 0.5 Wild
88 22-Apr-17 Small 42 0.5 Wild
89 22-Apr-17 Small 45 0.5 Wild
90 22-Apr-17 Small 45 0.5 Wild
91 22-Apr-17 Small 40 0.5 Wild
92 22-Apr-17 Small 43 0.5 Wild
93 22-Apr-17 Small 44 0.5 Wild
94 22-Apr-17 Small 43 0.5 Wild
95 22-Apr-17 Small 42 0.5 Wild
96 22-Apr-17 Small 44 0.5 Wild
97 22-Apr-17 Small 43 0.4 Wild
98 23-Apr-17 Small 43 0.6 Wild
99 23-Apr-17 Small 42 0.8 Wild
100 23-Apr-17 Small 43 0.8 Wild
101 23-Apr-17 Small 42 0.8 Wild
102 23-Apr-17 Small 43 0.8 Wild
103 23-Apr-17 Small 42 0.8 Wild
104 23-Apr-17 Small 44 0.8 Wild
105 23-Apr-17 Small 43 0.8 Wild
106 23-Apr-17 Small 42 0.8 Wild
107 23-Apr-17 Small 44 0.7 Wild
108 23-Apr-17 Small 43 0.7 Wild
109 23-Apr-17 Small 43 0.7 Wild
110 23-Apr-17 Small 40 0.7 Wild
111 23-Apr-17 Small 43 0.7 Wild
112 23-Apr-17 Small 43 0.7 Wild
113 23-Apr-17 Small 41 0.7 Wild
114 23-Apr-17 Small 43 0.7 Wild
115 23-Apr-17 Small 45 0.7 Wild
116 23-Apr-17 Small 44 0.7 Wild
117 23-Apr-17 Small 41 0.7 Wild
118 23-Apr-17 Small 42 0.7 Wild
119 23-Apr-17 Small 43 0.7 Wild
120 23-Apr-17 Small 42 0.7 Wild
121 23-Apr-17 Small 42 0.6 Wild
122 23-Apr-17 Small 43 0.6 Wild
123 23-Apr-17 Small 44 0.6 Wild
124 23-Apr-17 Small 41 0.6 Wild
125 23-Apr-17 Small 42 0.6 Wild
126 23-Apr-17 Small 43 0.6 Wild
127 23-Apr-17 Small 45 0.6 Wild
128 23-Apr-17 Small 43 0.6 Wild
129 23-Apr-17 Small 44 0.6 Wild

2017 Sarita River Chinook Salmon Outmigration Assessment APPENDICES
LGL Limited 31
Appendix B.2. Cont’d.
Number Date
Trap
Name
Fork Length
(mm)
Weight
(g) Source
130 23-Apr-17 Small 43 0.6 Wild
131 23-Apr-17 Small 45 0.6 Wild
132 23-Apr-17 Small 42 0.6 Wild
133 23-Apr-17 Small 42 0.6 Wild
134 23-Apr-17 Small 44 0.6 Wild
135 23-Apr-17 Small 42 0.6 Wild
136 23-Apr-17 Small 44 0.6 Wild
137 23-Apr-17 Small 42 0.6 Wild
138 23-Apr-17 Small 42 0.6 Wild
139 23-Apr-17 Small 42 0.6 Wild
140 23-Apr-17 Small 44 0.6 Wild
141 23-Apr-17 Small 41 0.6 Wild
142 23-Apr-17 Small 42 0.6 Wild
143 23-Apr-17 Small 41 0.6 Wild
144 23-Apr-17 Small 42 0.6 Wild
145 23-Apr-17 Small 44 0.6 Wild
146 23-Apr-17 Small 45 0.6 Wild
147 23-Apr-17 Small 42 0.6 Wild
148 23-Apr-17 Small 44 0.6 Wild
149 23-Apr-17 Small 43 0.6 Wild
150 23-Apr-17 Small 45 0.6 Wild
151 23-Apr-17 Small 42 0.6 Wild
152 23-Apr-17 Small 43 0.6 Wild
153 23-Apr-17 Small 41 0.6 Wild
154 23-Apr-17 Small 43 0.6 Wild
155 23-Apr-17 Small 43 0.6 Wild
156 23-Apr-17 Small 43 0.6 Wild
157 23-Apr-17 Small 44 0.5 Wild
158 23-Apr-17 Small 41 0.5 Wild
159 23-Apr-17 Small 44 0.5 Wild
160 23-Apr-17 Small 43 0.5 Wild
161 23-Apr-17 Small 43 0.5 Wild
162 23-Apr-17 Small 43 0.5 Wild
163 23-Apr-17 Small 43 0.5 Wild
164 23-Apr-17 Small 42 0.5 Wild
165 23-Apr-17 Small 43 0.5 Wild
166 23-Apr-17 Small 42 0.5 Wild
167 23-Apr-17 Small 41 0.5 Wild
168 23-Apr-17 Small 43 0.5 Wild
169 23-Apr-17 Small 41 0.5 Wild
170 23-Apr-17 Small 42 0.5 Wild
171 23-Apr-17 Small 44 0.5 Wild
172 23-Apr-17 Small 40 0.5 Wild
2017 Sarita River Chinook Salmon Outmigration Assessment APPENDICES
LGL Limited 32
Appendix B.2. Cont’d.
Number Date
Trap
Name
Fork Length
(mm)
Weight
(g) Source
173 23-Apr-17 Small 44 0.5 Wild
174 23-Apr-17 Small 42 0.5 Wild
175 23-Apr-17 Small 43 0.5 Wild
176 23-Apr-17 Small 44 0.5 Wild
177 23-Apr-17 Small 43 0.5 Wild
178 23-Apr-17 Small 38 0.5 Wild
179 23-Apr-17 Small 42 0.5 Wild
180 23-Apr-17 Small 40 0.5 Wild
181 23-Apr-17 Small 44 0.4 Wild
182 23-Apr-17 Small 43 0.4 Wild
183 23-Apr-17 Small 41 0.4 Wild
184 23-Apr-17 Small 43 0.4 Wild
185 23-Apr-17 Small 43 0.4 Wild
186 23-Apr-17 Small 44 0.4 Wild
187 23-Apr-17 Small 43 0.4 Wild
188 23-Apr-17 Small 44 0.3 Wild
189 23-Apr-17 Small 40 0.2 Wild
190 24-Apr-17 Small 41 0.8 Wild
191 24-Apr-17 Small 43 0.8 Wild
192 24-Apr-17 Small 42 0.8 Wild
193 24-Apr-17 Small 42 0.8 Wild
194 24-Apr-17 Small 45 0.8 Wild
195 24-Apr-17 Small 43 0.7 Wild
196 24-Apr-17 Small 42 0.7 Wild
197 24-Apr-17 Small 43 0.7 Wild
198 24-Apr-17 Small 40 0.7 Wild
199 24-Apr-17 Small 41 0.7 Wild
200 24-Apr-17 Small 42 0.7 Wild
201 24-Apr-17 Small 43 0.7 Wild
202 24-Apr-17 Small 44 0.7 Wild
203 24-Apr-17 Small 43 0.7 Wild
204 24-Apr-17 Small 43 0.7 Wild
205 24-Apr-17 Small 43 0.7 Wild
206 24-Apr-17 Small 42 0.7 Wild
207 24-Apr-17 Small 43 0.7 Wild
208 24-Apr-17 Small 43 0.6 Wild
209 24-Apr-17 Small 42 0.6 Wild
210 24-Apr-17 Small 44 0.6 Wild
211 24-Apr-17 Small 42 0.6 Wild
212 24-Apr-17 Small 45 0.6 Wild
213 24-Apr-17 Small 44 0.6 Wild
214 24-Apr-17 Small 42 0.6 Wild
215 24-Apr-17 Small 43 0.6 Wild
2017 Sarita River Chinook Salmon Outmigration Assessment APPENDICES
LGL Limited 33
Appendix B.2. Cont’d.
Number Date
Trap
Name
Fork Length
(mm)
Weight
(g) Source
216 24-Apr-17 Small 45 0.6 Wild
217 24-Apr-17 Small 45 0.6 Wild
218 24-Apr-17 Small 42 0.5 Wild
219 24-Apr-17 Small 43 0.5 Wild
220 24-Apr-17 Small 43 0.5 Wild
221 24-Apr-17 Small 44 0.5 Wild
222 24-Apr-17 Small 42 0.5 Wild
223 24-Apr-17 Small 42 0.5 Wild
224 24-Apr-17 Small 43 0.5 Wild
225 24-Apr-17 Small 44 0.5 Wild
226 24-Apr-17 Small 43 0.5 Wild
227 24-Apr-17 Small 43 0.5 Wild
228 24-Apr-17 Small 42 0.4 Wild
229 24-Apr-17 Small 44 0.4 Wild
230 25-Apr-17 Large 42 0.7 Wild
231 25-Apr-17 Large 43 0.7 Wild
232 25-Apr-17 Large 44 0.6 Wild
233 25-Apr-17 Large 43 0.6 Wild
234 25-Apr-17 Small 46 Wild
235 25-Apr-17 Small 45 Wild
236 25-Apr-17 Small 41 Wild
237 25-Apr-17 Small 41 Wild
238 25-Apr-17 Small 41 Wild
239 25-Apr-17 Small 41 Wild
240 25-Apr-17 Small 44 Wild
241 25-Apr-17 Small 45 Wild
242 25-Apr-17 Small 45 Wild
243 25-Apr-17 Small 45 Wild
244 25-Apr-17 Small 45 Wild
245 25-Apr-17 Small 45 Wild
246 25-Apr-17 Small 43 Wild
247 26-Apr-17 NA 40 Wild
248 26-Apr-17 NA 41 Wild
249 26-Apr-17 NA 41 Wild
250 26-Apr-17 NA 43 Wild
251 26-Apr-17 NA 42 Wild
252 26-Apr-17 NA 43 Wild
253 26-Apr-17 NA 44 Wild
254 26-Apr-17 NA 39 Wild
255 26-Apr-17 NA 42 Wild
256 26-Apr-17 NA 43 Wild
257 26-Apr-17 NA 42 Wild
258 26-Apr-17 NA 41 Wild
2017 Sarita River Chinook Salmon Outmigration Assessment APPENDICES
LGL Limited 34
Appendix B.2. Cont’d.
Number Date
Trap
Name
Fork Length
(mm)
Weight
(g) Source
259 26-Apr-17 NA 42 Wild
260 26-Apr-17 NA 42 Wild
261 26-Apr-17 NA 41 Wild
262 26-Apr-17 NA 43 Wild
263 26-Apr-17 NA 43 Wild
264 26-Apr-17 NA 43 Wild
265 26-Apr-17 NA 42 Wild
266 26-Apr-17 NA 44 Wild
267 26-Apr-17 NA 42 Wild
268 26-Apr-17 NA 35 Wild
269 26-Apr-17 NA 44 Wild
270 26-Apr-17 NA 40 Wild
271 26-Apr-17 NA 43 Wild
272 26-Apr-17 NA 39 Wild
273 26-Apr-17 NA 41 Wild
274 26-Apr-17 NA 42 Wild
275 26-Apr-17 NA 40 Wild
276 26-Apr-17 NA 42 Wild
277 26-Apr-17 NA 40 Wild
278 26-Apr-17 NA 40 Wild
279 26-Apr-17 NA 42 Wild
280 26-Apr-17 NA 41 Wild
281 26-Apr-17 NA 40 Wild
282 26-Apr-17 NA 42 Wild
283 26-Apr-17 NA 40 Wild
284 26-Apr-17 NA 39 Wild
285 26-Apr-17 NA 43 Wild
286 26-Apr-17 NA 40 Wild
287 26-Apr-17 NA 42 Wild
288 26-Apr-17 NA 41 Wild
289 26-Apr-17 NA 40 Wild
290 26-Apr-17 NA 41 Wild
291 26-Apr-17 NA 42 Wild
292 26-Apr-17 NA 42 Wild
293 26-Apr-17 NA 39 Wild
294 26-Apr-17 NA 41 Wild
295 26-Apr-17 NA 36 Wild
296 26-Apr-17 NA 38 Wild
297 26-Apr-17 NA 44 Wild
298 26-Apr-17 NA 40 Wild
299 27-Apr-17 NA 45 1.8 Wild
300 27-Apr-17 NA 44 1.6 Wild
301 27-Apr-17 NA 41 1.4 Wild
2017 Sarita River Chinook Salmon Outmigration Assessment APPENDICES
LGL Limited 35
Appendix B.2. Cont’d.
Number Date
Trap
Name
Fork Length
(mm)
Weight
(g) Source
302 27-Apr-17 NA 40 1.3 Wild
303 27-Apr-17 NA 49 1.2 Wild
304 27-Apr-17 NA 44 1.1 Wild
305 27-Apr-17 NA 42 1 Wild
306 27-Apr-17 NA 37 0.8 Wild
307 27-Apr-17 NA 40 0.8 Wild
308 27-Apr-17 NA 42 0.7 Wild
309 27-Apr-17 NA 44 0.6 Wild
310 27-Apr-17 NA 41 0.6 Wild
311 27-Apr-17 NA 40 0.5 Wild
312 27-Apr-17 NA 40 0.5 Wild
313 27-Apr-17 NA 42 0.4 Wild
314 27-Apr-17 NA 39 Wild
315 27-Apr-17 NA 37 Wild
316 27-Apr-17 NA 43 Wild
317 27-Apr-17 NA 41 Wild
318 27-Apr-17 NA 42 Wild
319 27-Apr-17 NA 39 Wild
320 27-Apr-17 NA 41 Wild
321 27-Apr-17 NA 42 Wild
322 27-Apr-17 NA 40 Wild
323 28-Apr-17 NA 43 1.4 Wild
324 28-Apr-17 NA 41 1.2 Wild
325 28-Apr-17 NA 40 1.1 Wild
326 28-Apr-17 NA 40 0.7 Wild
327 28-Apr-17 NA 47 Wild
328 28-Apr-17 NA 41 Wild
329 28-Apr-17 NA 45 Wild
330 29-Apr-17 NA 42 Wild
331 29-Apr-17 NA 40 Wild
332 29-Apr-17 NA 42 Wild
333 29-Apr-17 NA 41 Wild
334 29-Apr-17 NA 42 Wild
335 29-Apr-17 NA 43 Wild
336 29-Apr-17 NA 42 Wild
337 29-Apr-17 NA 42 Wild
338 29-Apr-17 NA 49 Wild
339 29-Apr-17 NA 41 Wild
340 29-Apr-17 NA 42 Wild
341 29-Apr-17 NA 44 Wild
342 29-Apr-17 NA 45 Wild
343 29-Apr-17 NA 43 Wild
344 29-Apr-17 NA 42 Wild
2017 Sarita River Chinook Salmon Outmigration Assessment APPENDICES
LGL Limited 36
Appendix B.2. Cont’d.
Number Date
Trap
Name
Fork Length
(mm)
Weight
(g) Source
345 29-Apr-17 NA 43 Wild
346 29-Apr-17 NA 45 Wild
347 29-Apr-17 NA 43 Wild
348 29-Apr-17 NA 43 Wild
349 29-Apr-17 NA 44 Wild
350 29-Apr-17 NA 41 Wild
351 29-Apr-17 NA 43 Wild
352 01-May-17 Small 45 0.7 Wild
353 01-May-17 Small 45 0.7 Wild
354 01-May-17 Small 45 0.7 Wild
355 01-May-17 Small 44 0.6 Wild
356 01-May-17 Small 43 0.6 Wild
357 01-May-17 Small 46 0.6 Wild
358 02-May-17 Small 45 0.7 Wild
359 02-May-17 Small 46 0.7 Wild
360 02-May-17 Small 45 0.7 Wild
361 02-May-17 Small 45 0.7 Wild
362 02-May-17 Small 46 0.7 Wild
363 02-May-17 Small 44 0.7 Wild
364 02-May-17 Small 45 0.6 Wild
365 02-May-17 Small 45 0.6 Wild
366 03-May-17 Small 62 2.5 Wild
367 03-May-17 Small 47 0.8 Wild
368 03-May-17 Small 43 0.7 Wild
369 03-May-17 Small 45 0.7 Wild
370 03-May-17 Small 43 0.6 Wild
371 03-May-17 Small 45 0.6 Wild
372 03-May-17 Small 42 0.6 Wild
373 03-May-17 Small 44 0.6 Wild
374 03-May-17 Small 45 0.6 Wild
375 03-May-17 Small 42 0.5 Wild
376 03-May-17 Small 44 0.5 Wild
377 03-May-17 Small 44 0.5 Wild
378 03-May-17 Small 43 0.5 Wild
379 03-May-17 Small 43 0.5 Wild
380 03-May-17 Small 44 0.5 Wild
381 03-May-17 Small 43 0.5 Wild
382 03-May-17 Small 42 0.5 Wild
383 03-May-17 Small 43 0.4 Wild
384 04-May-17 Small 46 0.6 Wild
385 04-May-17 Small 45 0.6 Wild
386 04-May-17 Small 44 0.6 Wild
387 04-May-17 Small 46 0.6 Wild
2017 Sarita River Chinook Salmon Outmigration Assessment APPENDICES
LGL Limited 37
Appendix B.2. Cont’d.
Number Date
Trap
Name
Fork Length
(mm)
Weight
(g) Source
388 04-May-17 Small 45 0.6 Wild
389 04-May-17 Small 44 0.6 Wild
390 04-May-17 Small 46 0.6 Wild
391 04-May-17 Small 42 0.5 Wild
392 04-May-17 Small 44 0.5 Wild
393 04-May-17 Small 41 0.5 Wild
394 04-May-17 Small 43 0.5 Wild
395 06-May-17 Small 52 1 Wild
396 06-May-17 Small 45 0.7 Wild
397 06-May-17 Small 42 0.5 Wild
398 11-May-17 Small 47 1.2 Wild
399 12-May-17 Small 38 0.5 Wild
400 13-May-17 Small 45 1.1 Wild
401 13-May-17 Small 41 1 Wild
402 13-May-17 Small 39 0.9 Wild
403 13-May-17 Small 40 0.8 Wild
404 13-May-17 Small 41 0.7 Wild
405 14-May-17 Small 39 0.8 Wild
406 14-May-17 Small 53 1.6 Wild
407 14-May-17 Small 42 1.2 Wild
408 14-May-17 Small 44 0.7 Wild
409 14-May-17 Small 38 0.7 Wild
410 16-May-17 Large 50 1.7 Wild
411 16-May-17 Small 53 1.9 Wild
412 16-May-17 Small 48 1.2 Wild
413 16-May-17 Small 50 1.2 Wild
414 16-May-17 Small 42 0.7 Wild
415 16-May-17 Small 36 0.6 Wild
416 17-May-17 Large 59 1.3 Wild
417 17-May-17 Small 53 1.8 Wild
418 17-May-17 Small 41 1.3 Wild
419 17-May-17 Small 45 1 Wild
420 18-May-17 Large 48 1.6 Wild
421 18-May-17 Large 50 1.6 Wild
422 18-May-17 Large 45 1.3 Wild
423 18-May-17 Large 40 0.8 Wild
424 18-May-17 Large 35 0.6 Wild
425 18-May-17 Small 35 1.1 Wild
426 23-May-17 Large 57 2 Wild
427 23-May-17 Small 42 0.8 Wild
428 23-May-17 Large 60 2 Wild
429 24-May-17 Small 54 2 Wild
430 24-May-17 Small 48 2 Wild
2017 Sarita River Chinook Salmon Outmigration Assessment APPENDICES
LGL Limited 38
Appendix B.2. Cont’d.
Number Date
Trap
Name
Fork Length
(mm)
Weight
(g) Source
431 24-May-17 Small 63 3 Wild
432 24-May-17 Small 55 2 Wild
433 24-May-17 Small 58 2 Wild
434 25-May-17 Small 53 2 Wild
435 25-May-17 Small 61 3 Wild
436 25-May-17 Small 53 2 Wild
437 25-May-17 Small 54 1 Wild
438 25-May-17 Small 45 1 Wild
439 25-May-17 Small 55 3 Wild
440 25-May-17 Small 49 2 Wild
441 25-May-17 Small 52 2 Wild
442 26-May-17 Small 54 3 Wild
443 30-May-17 Small 47 1 Wild
444 30-May-17 Small 48 1 Wild
445 02-Jun-17 Small 52 1.7 Wild
446 02-Jun-17 Small 52 1.1 Wild
2017 Sarita River Chinook Salmon Outmigration Assessment APPENDICES
LGL Limited 39
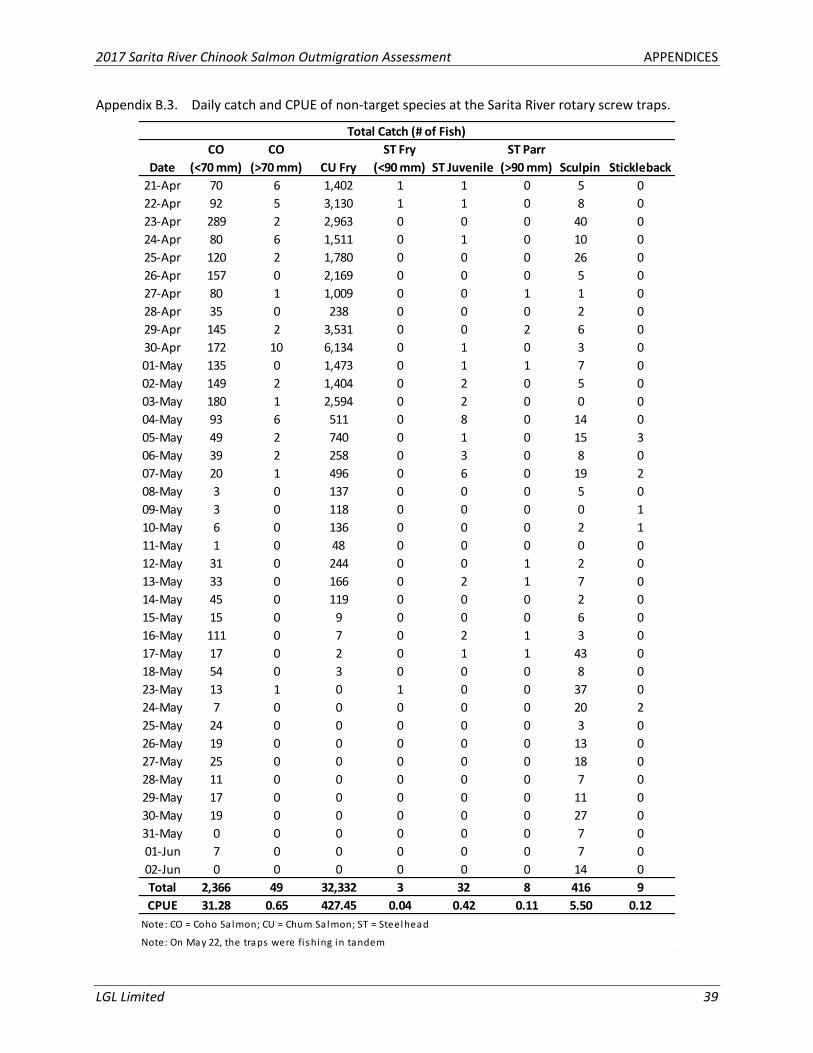
Appendix B.3. Daily catch and CPUE of non-target species at the Sarita River rotary screw traps.
Date
CO
(<70 mm)
CO
(>70 mm) CU Fry
ST Fry
(<90 mm) ST Juvenile
ST Parr
(>90 mm) Sculpin Stickleback
21-Apr 70 6 1,402 1 1 0 5 0
22-Apr 92 5 3,130 1 1 0 8 0
23-Apr 289 2 2,963 0 0 0 40 0
24-Apr 80 6 1,511 0 1 0 10 0
25-Apr 120 2 1,780 0 0 0 26 0
26-Apr 157 0 2,169 0 0 0 5 0
27-Apr 80 1 1,009 0 0 1 1 0
28-Apr 35 0 238 0 0 0 2 0
29-Apr 145 2 3,531 0 0 2 6 0
30-Apr 172 10 6,134 0 1 0 3 0
01-May 135 0 1,473 0 1 1 7 0
02-May 149 2 1,404 0 2 0 5 0
03-May 180 1 2,594 0 2 0 0 0
04-May 93 6 511 0 8 0 14 0
05-May 49 2 740 0 1 0 15 3
06-May 39 2 258 0 3 0 8 0
07-May 20 1 496 0 6 0 19 2
08-May 3 0 137 0 0 0 5 0
09-May 3 0 118 0 0 0 0 1
10-May 6 0 136 0 0 0 2 1
11-May 1 0 48 0 0 0 0 0
12-May 31 0 244 0 0 1 2 0
13-May 33 0 166 0 2 1 7 0
14-May 45 0 119 0 0 0 2 0
15-May 15 0 9 0 0 0 6 0
16-May 111 0 7 0 2 1 3 0
17-May 17 0 2 0 1 1 43 0
18-May 54 0 3 0 0 0 8 0
23-May 13 1 0 1 0 0 37 0
24-May 7 0 0 0 0 0 20 2
25-May 24 0 0 0 0 0 3 0
26-May 19 0 0 0 0 0 13 0
27-May 25 0 0 0 0 0 18 0
28-May 11 0 0 0 0 0 7 0
29-May 17 0 0 0 0 0 11 0
30-May 19 0 0 0 0 0 27 0
31-May 0 0 0 0 0 0 7 0
01-Jun 7 0 0 0 0 0 7 0
02-Jun 0 0 0 0 0 0 14 0
Total 2,366 49 32,332 3 32 8 416 9
CPUE 31.28 0.65 427.45 0.04 0.42 0.11 5.50 0.12
Total Catch (# of Fish)
Note: CO = Coho Sa lmon; CU = Chum Salmon; ST = Steelhead
Note: On May 22, the traps were fi shing in tandem
2017 Sarita River Chinook Salmon Outmigration Assessment APPENDICES
LGL Limited 40
APPENDIX C
SARITA RIVER ROTARY SCREW TRAP PHOTOGRAPHY
Appendix C. Sarita River rotary screw trap photography.
2017 Sarita River Chinook Salmon Outmigration Assessment APPENDICES
LGL Limited 41
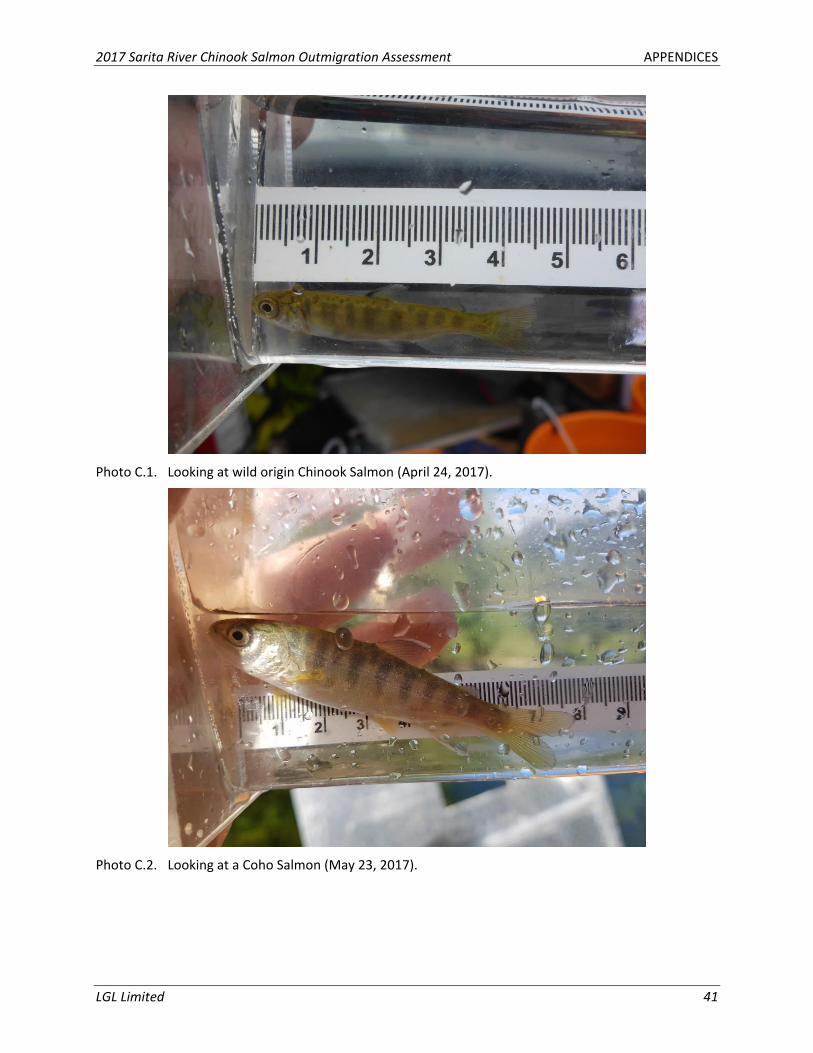
Photo C.1. Looking at wild origin Chinook Salmon (April 24, 2017).
Photo C.2. Looking at a Coho Salmon (May 23, 2017).
2017 Sarita River Chinook Salmon Outmigration Assessment APPENDICES
LGL Limited 42
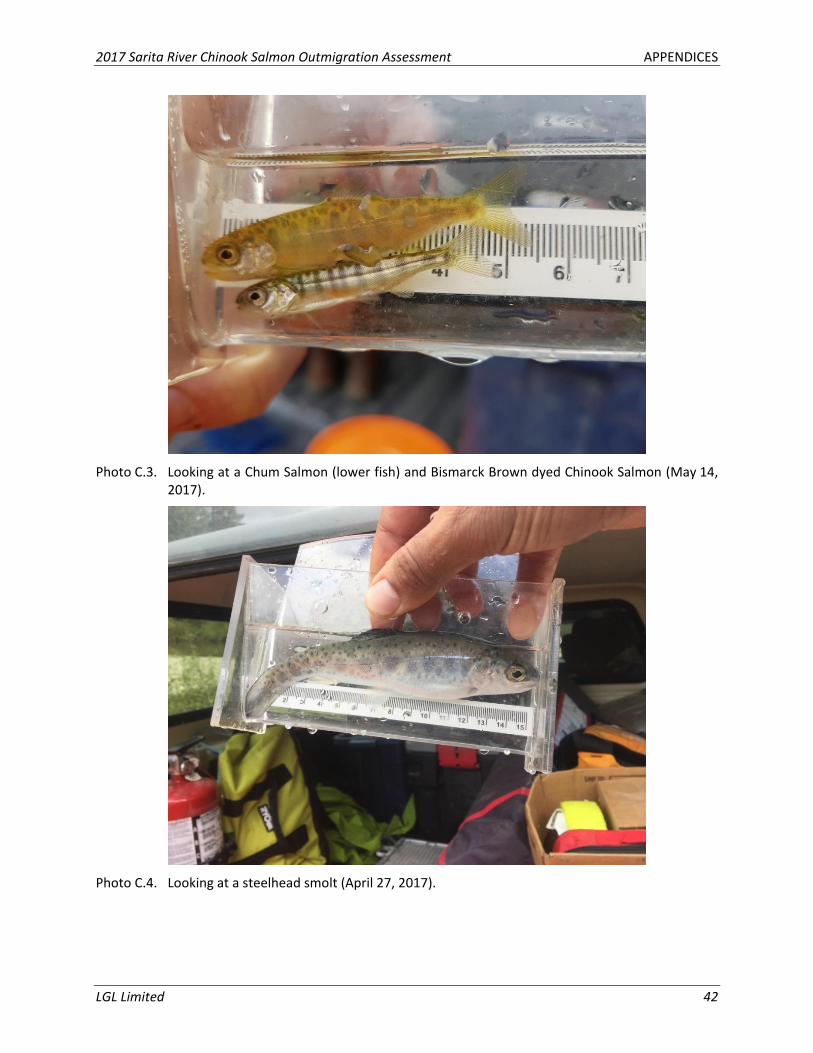
Photo C.3. Looking at a Chum Salmon (lower fish) and Bismarck Brown dyed Chinook Salmon (May 14, 2017).
Photo C.4. Looking at a steelhead smolt (April 27, 2017).
2017 Sarita River Chinook Salmon Outmigration Assessment APPENDICES
LGL Limited 43
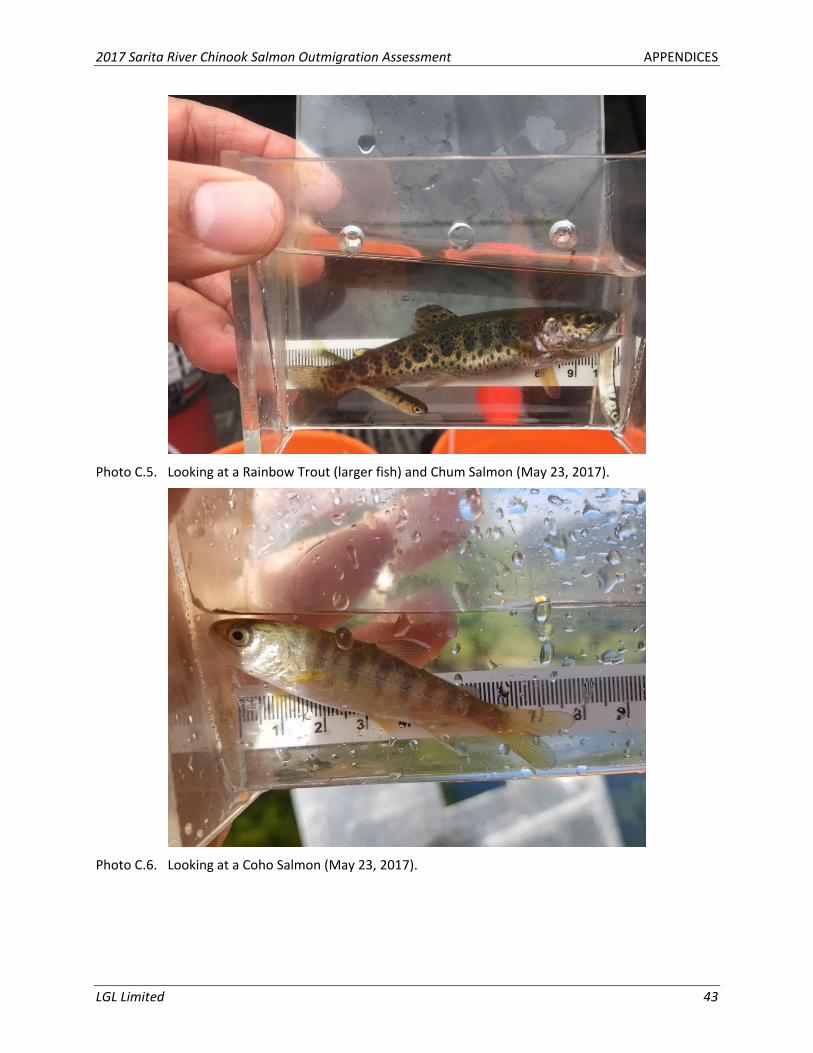
Photo C.5. Looking at a Rainbow Trout (larger fish) and Chum Salmon (May 23, 2017).
Photo C.6. Looking at a Coho Salmon (May 23, 2017).