Embed Size (px)
Citation preview
Tracy Elementary
By February 1 of each year, every school in California is required by state law to publish a School Accountability Report Card (SARC).The SARC contains information aboutthe condit ion and performance of each California public school. Under the Local Control Funding Formula (LCFF) all local educat ional agencies (LEAs) are required toprepare a Local Control Accountability Plan (LCAP), which describes how they intend to meet annual school-specific goals for all pupils, w ith specific act ivit ies to addressstate and local priorit ies. Addit ionally, data reported in an LCAP is to be consistent w ith data reported in the SARC.
For more information about SARC requirements, see the California Department of Educat ion (CDE) SARC Web page at http://www.cde.ca.gov/ta/ac/sa/.
For more information about the LCFF or LCAP, see the CDE LCFF Web page at http://www.cde.ca.gov/fg/aa/lc/.
For addit ional information about the school, parents/guardians, and community members should contact the school principal or the district office.
DataQuest
Internet Access
California Department of Education
School Accountability Report CardReported Using Data from the 2015-16 School Year
DataQuest is an online data tool located on the CDE DataQuest Web page that contains addit ional information about this school and comparisons of the school tothe district and the county. Specifically, DataQuest is a dynamic system that provides reports for accountability (e.g., test data, enrollment, high school graduates,dropouts, course enrollments, staffing, and data regarding English learners).
Internet access is available at public libraries and other locat ions that are publicly accessible (e.g., the California State Library). Access to the Internet at librariesand public locat ions is generally provided on a first-come, first-served basis. Other use restrict ions may include the hours of operat ion, the length of t ime that aworkstat ion may be used (depending on availability), the types of software programs available on a workstat ion, and the ability to print documents.
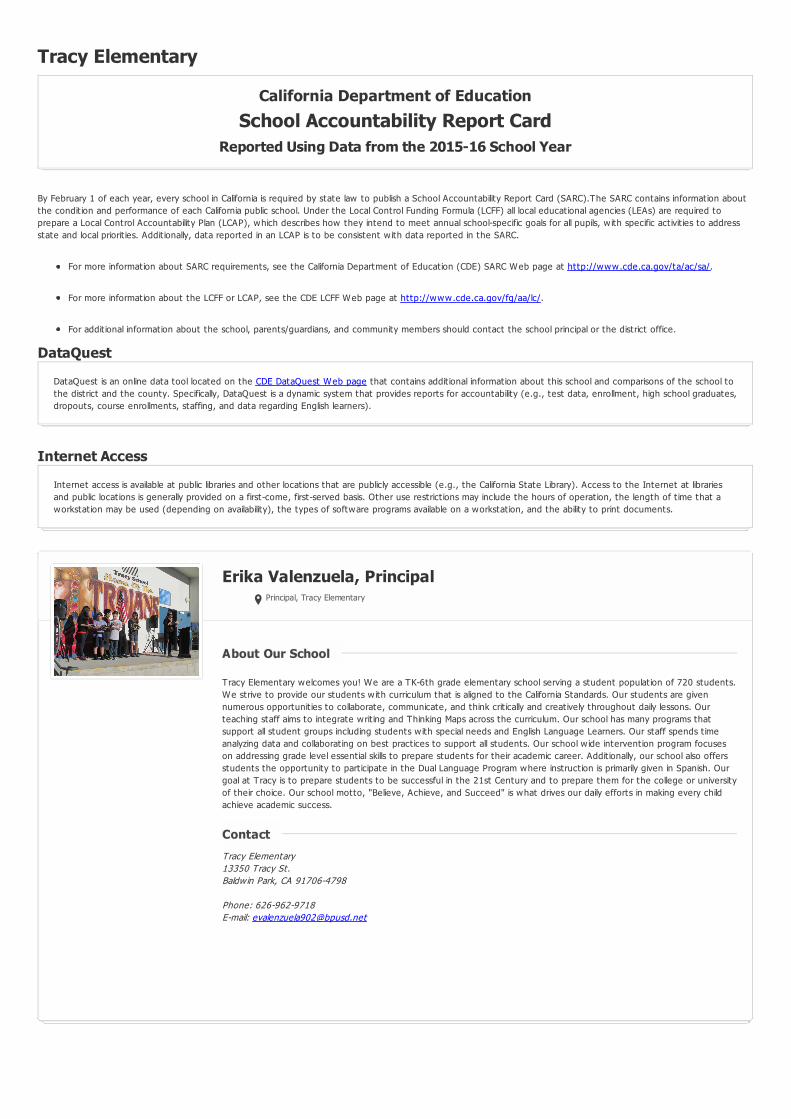
Erika Valenzuela, PrincipalPrincipal, Tracy Elementary
Tracy Elementary welcomes you! We are a TK-6th grade elementary school serving a student populat ion of 720 students.We strive to provide our students w ith curriculum that is aligned to the California Standards. Our students are givennumerous opportunit ies to collaborate, communicate, and think crit ically and creat ively throughout daily lessons. Ourteaching staff aims to integrate writ ing and Thinking Maps across the curriculum. Our school has many programs thatsupport all student groups including students w ith special needs and English Language Learners. Our staff spends t imeanalyzing data and collaborat ing on best pract ices to support all students. Our school w ide intervent ion program focuseson addressing grade level essent ial skills to prepare students for their academic career. Addit ionally, our school also offersstudents the opportunity to part icipate in the Dual Language Program where instruct ion is primarily given in Spanish. Ourgoal at Tracy is to prepare students to be successful in the 21st Century and to prepare them for the college or universityof their choice. Our school motto, "Believe, Achieve, and Succeed" is what drives our daily efforts in making every childachieve academic success.
Tracy Elementary13350 Tracy St.Baldw in Park, CA 91706-4798
Phone: 626-962-9718E-mail: [email protected]
About Our SchoolAbout Our School
ContactContact
Last updated: 1/26/2017
Last updated: 1/26/2017
About This School
Contact Information (School Year 2016-17)Contact Information (School Year 2016-17)
District Contact Information (School Year 2016-17)
District Name Baldw in Park Unified
Phone Number (626) 962-3311
Superintendent Froilan Mendoza
E-mail Address [email protected]
Web Site www.bpusd.net
School Contact Information (School Year 2016-17)
School Name Tracy Elementary
Street 13350 Tracy St.
City, State, Zip Baldw in Park, Ca, 91706-4798
Phone Number 626-962-9718
Principal Erika Valenzuela, Principal
E-mail Address [email protected]
Web Site http://te-bpusd-ca.schoolloop.com
County-District-School (CDS) Code
19642876011498
School Description and Mission Statement (School Year 2016-17)School Description and Mission Statement (School Year 2016-17)
Our Mission Statement:Tracy School prepares all learners for a successful future.
Our Vision:Tracy community collaborat ing to achieve innovat ive, global thinkers.
2015-16 SARC - Tracy Elementary
Page 2 of 28
Last updated: 1/26/2017
Last updated: 1/26/2017
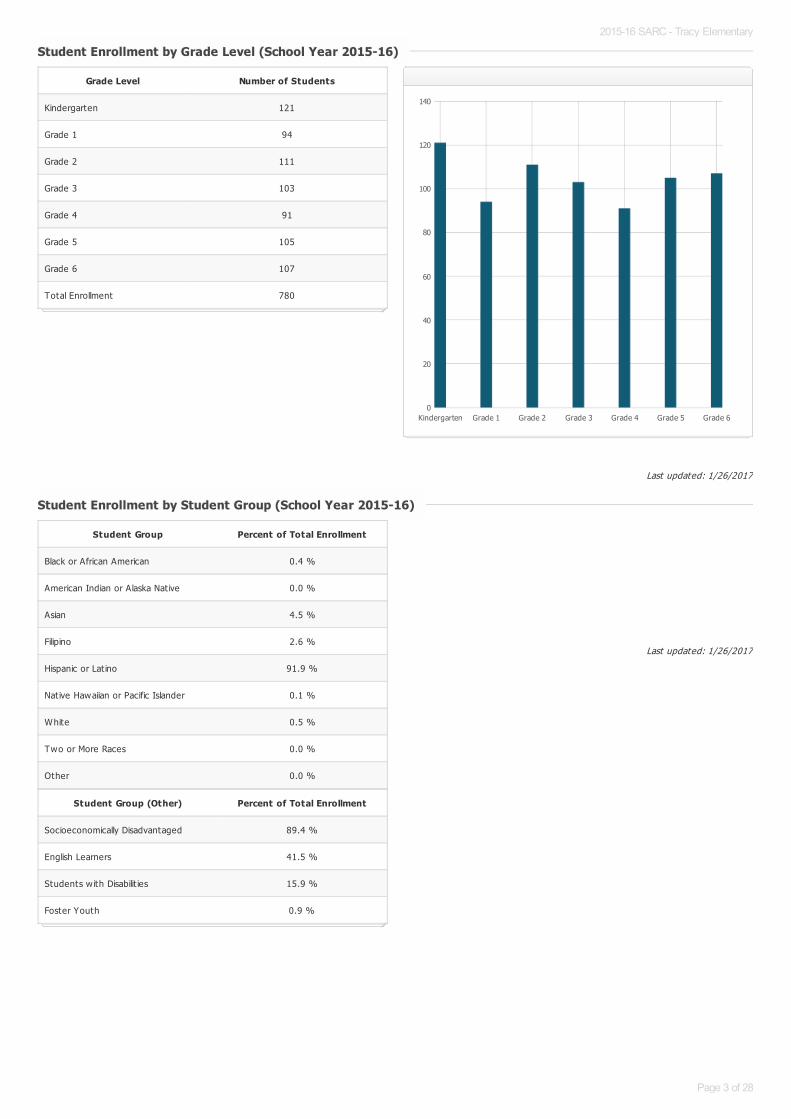
Student Enrollment by Grade Level (School Year 2015-16)Student Enrollment by Grade Level (School Year 2015-16)
Grade Level Number of Students
Kindergarten 121
Grade 1 94
Grade 2 111
Grade 3 103
Grade 4 91
Grade 5 105
Grade 6 107
Total Enrollment 780
Kindergarten Grade 1 Grade 2 Grade 3 Grade 4 Grade 5 Grade 60
20
40
60
80
100
120
140
Student Enrollment by Student Group (School Year 2015-16)Student Enrollment by Student Group (School Year 2015-16)
Student Group Percent of Total Enrollment
Black or African American 0.4 %
American Indian or Alaska Nat ive 0.0 %
Asian 4.5 %
Filipino 2.6 %
Hispanic or Lat ino 91.9 %
Native Hawaiian or Pacific Islander 0.1 %
White 0.5 %
Two or More Races 0.0 %
Other 0.0 %
Student Group (Other) Percent of Total Enrollment
Socioeconomically Disadvantaged 89.4 %
English Learners 41.5 %
Students w ith Disabilit ies 15.9 %
Foster Youth 0.9 %
2015-16 SARC - Tracy Elementary
Page 3 of 28
Last updated: 1/26/2017
Last updated: 1/26/2017
A. Conditions of Learning
State Priority: Basic
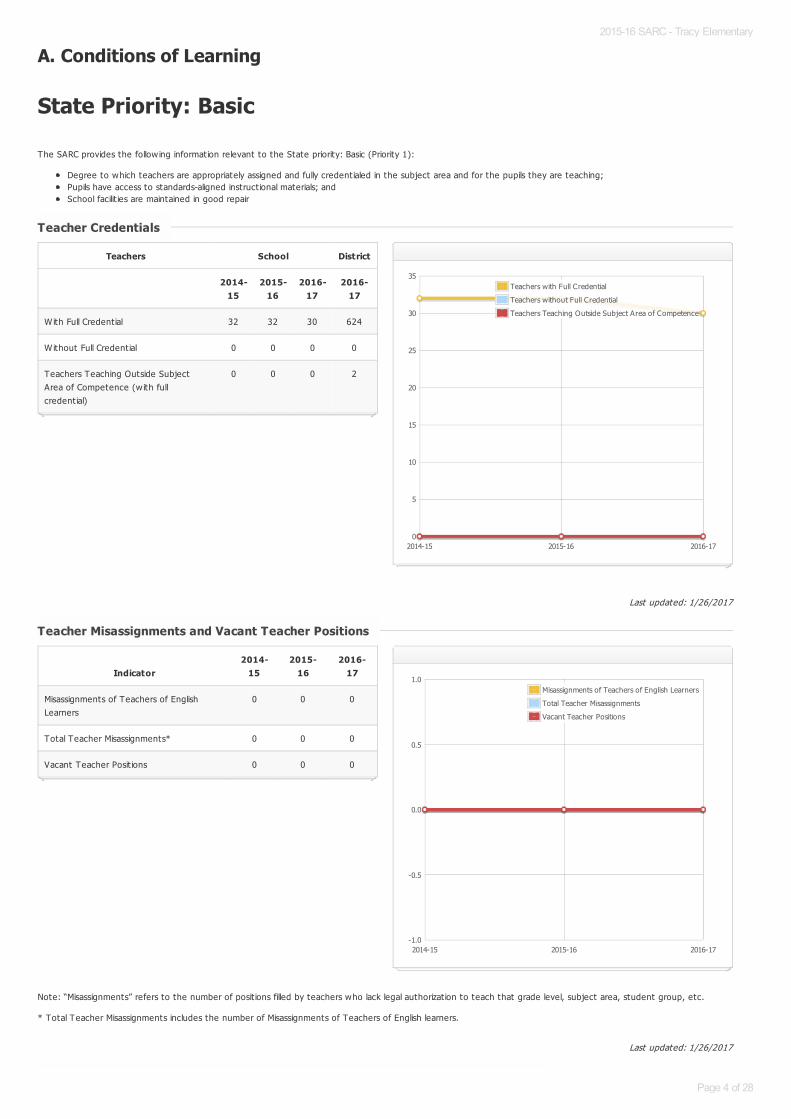
The SARC provides the follow ing information relevant to the State priority: Basic (Priority 1):
Degree to which teachers are appropriately assigned and fully credent ialed in the subject area and for the pupils they are teaching;Pupils have access to standards-aligned instruct ional materials; andSchool facilit ies are maintained in good repair
Note: “Misassignments” refers to the number of posit ions filled by teachers who lack legal authorizat ion to teach that grade level, subject area, student group, etc.
* Total Teacher Misassignments includes the number of Misassignments of Teachers of English learners.
Teacher CredentialsTeacher Credentials
Teachers School District
2014-15
2015-16
2016-17
2016-17
With Full Credent ial 32 32 30 624
Without Full Credent ial 0 0 0 0
Teachers Teaching Outside SubjectArea of Competence (w ith fullcredent ial)
0 0 0 2
2014-15 2015-16 2016-170
5
10
15
20
25
30
35Teachers with Full Credential
Teachers without Full Credential
Teachers Teaching Outside Subject Area of Competence
Teacher Misassignments and Vacant Teacher PositionsTeacher Misassignments and Vacant Teacher Positions
Indicator2014-
152015-
162016-
17
Misassignments of Teachers of EnglishLearners
0 0 0
Total Teacher Misassignments* 0 0 0
Vacant Teacher Posit ions 0 0 0
2014-15 2015-16 2016-17-1.0
-0.5
0.0
0.5
1.0Misassignments of Teachers of English Learners
Total Teacher Misassignments
Vacant Teacher Positions
2015-16 SARC - Tracy Elementary
Page 4 of 28
Last updated: 1/26/2017
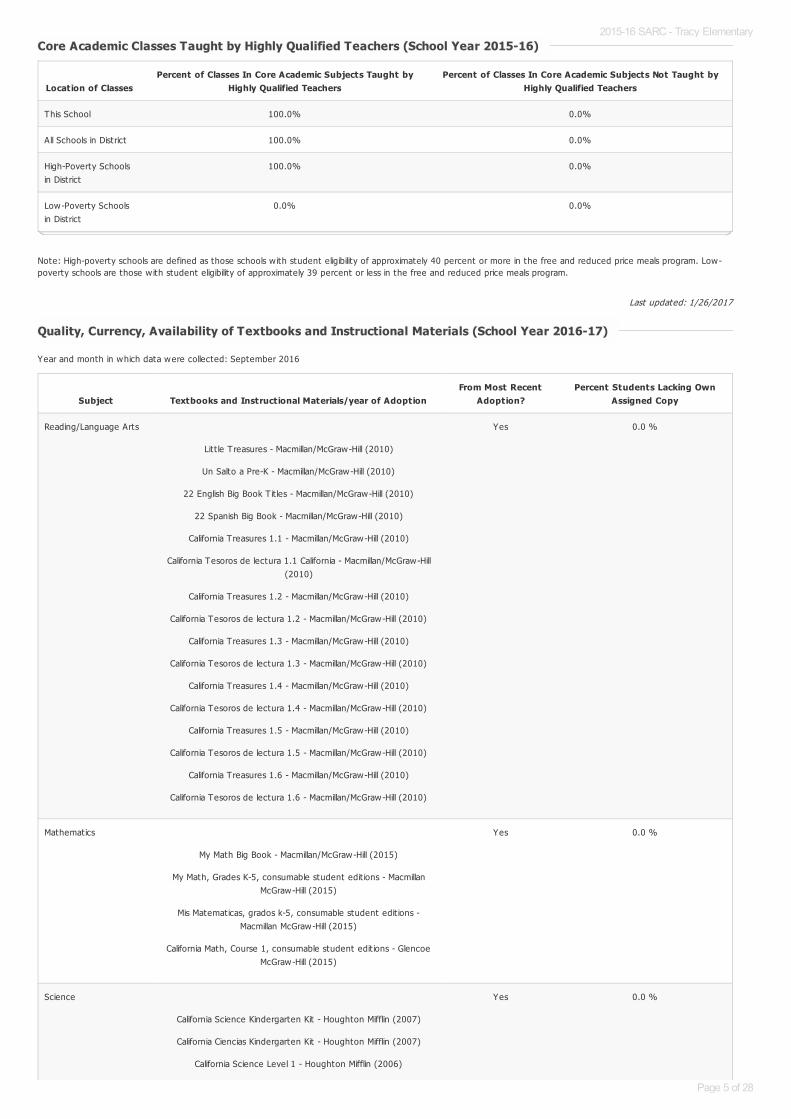
Note: High-poverty schools are defined as those schools w ith student eligibility of approximately 40 percent or more in the free and reduced price meals program. Low-poverty schools are those w ith student eligibility of approximately 39 percent or less in the free and reduced price meals program.
Year and month in which data were collected: September 2016
Core Academic Classes Taught by Highly Qualified Teachers (School Year 2015-16)Core Academic Classes Taught by Highly Qualified Teachers (School Year 2015-16)
Location of ClassesPercent of Classes In Core Academic Subjects Taught by
Highly Qualified TeachersPercent of Classes In Core Academic Subjects Not Taught by
Highly Qualified Teachers
This School 100.0% 0.0%
All Schools in District 100.0% 0.0%
High-Poverty Schoolsin District
100.0% 0.0%
Low-Poverty Schoolsin District
0.0% 0.0%
Quality, Currency, Availability of Textbooks and Instructional Materials (School Year 2016-17)Quality, Currency, Availability of Textbooks and Instructional Materials (School Year 2016-17)
Subject Textbooks and Instructional Materials/year of AdoptionFrom Most Recent
Adoption?Percent Students Lacking Own
Assigned Copy
Reading/Language Arts
Litt le Treasures - Macmillan/McGraw-Hill (2010)
Un Salto a Pre-K - Macmillan/McGraw-Hill (2010)
22 English Big Book T it les - Macmillan/McGraw-Hill (2010)
22 Spanish Big Book - Macmillan/McGraw-Hill (2010)
California Treasures 1.1 - Macmillan/McGraw-Hill (2010)
California Tesoros de lectura 1.1 California - Macmillan/McGraw-Hill(2010)
California Treasures 1.2 - Macmillan/McGraw-Hill (2010)
California Tesoros de lectura 1.2 - Macmillan/McGraw-Hill (2010)
California Treasures 1.3 - Macmillan/McGraw-Hill (2010)
California Tesoros de lectura 1.3 - Macmillan/McGraw-Hill (2010)
California Treasures 1.4 - Macmillan/McGraw-Hill (2010)
California Tesoros de lectura 1.4 - Macmillan/McGraw-Hill (2010)
California Treasures 1.5 - Macmillan/McGraw-Hill (2010)
California Tesoros de lectura 1.5 - Macmillan/McGraw-Hill (2010)
California Treasures 1.6 - Macmillan/McGraw-Hill (2010)
California Tesoros de lectura 1.6 - Macmillan/McGraw-Hill (2010)
Yes 0.0 %
Mathematics
My Math Big Book - Macmillan/McGraw-Hill (2015)
My Math, Grades K-5, consumable student edit ions - MacmillanMcGraw-Hill (2015)
Mis Matematicas, grados k-5, consumable student edit ions -Macmillan McGraw-Hill (2015)
California Math, Course 1, consumable student edit ions - GlencoeMcGraw-Hill (2015)
Yes 0.0 %
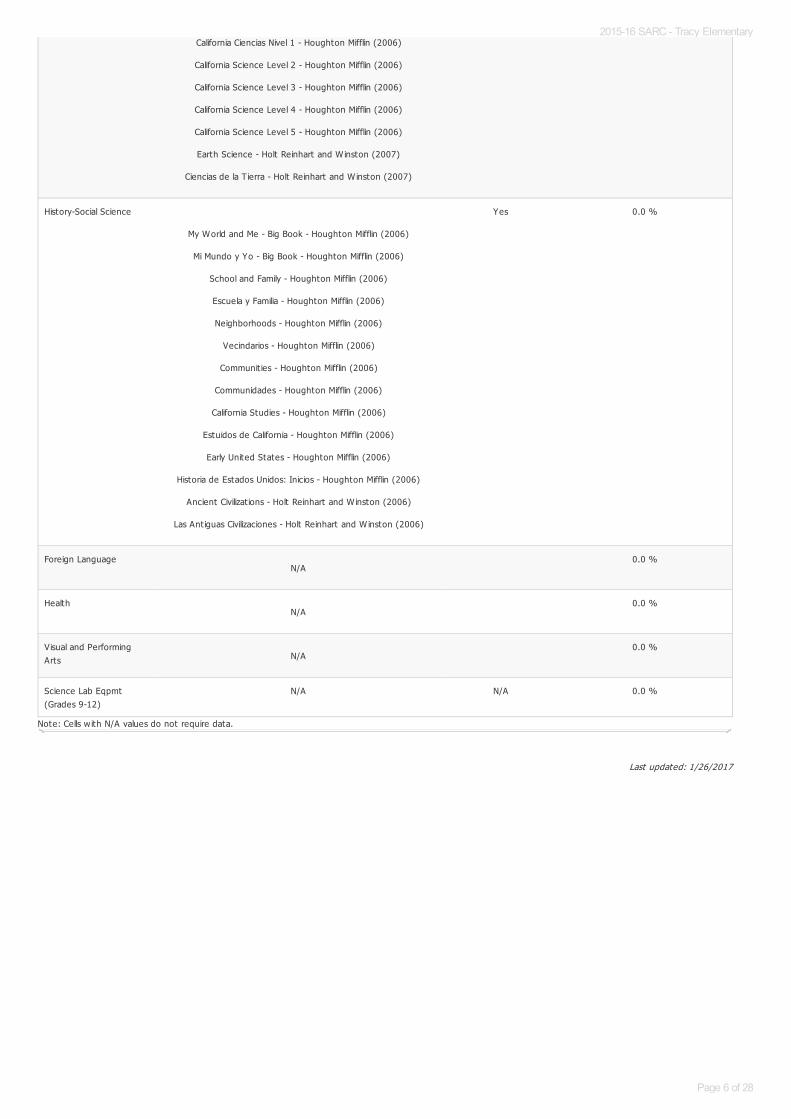
Science
California Science Kindergarten Kit - Houghton Mifflin (2007)
California Ciencias Kindergarten Kit - Houghton Mifflin (2007)
California Science Level 1 - Houghton Mifflin (2006)
Yes 0.0 %
2015-16 SARC - Tracy Elementary
Page 5 of 28
Last updated: 1/26/2017
Note: Cells w ith N/A values do not require data.
California Ciencias Nivel 1 - Houghton Mifflin (2006)
California Science Level 2 - Houghton Mifflin (2006)
California Science Level 3 - Houghton Mifflin (2006)
California Science Level 4 - Houghton Mifflin (2006)
California Science Level 5 - Houghton Mifflin (2006)
Earth Science - Holt Reinhart and W inston (2007)
Ciencias de la T ierra - Holt Reinhart and W inston (2007)
History-Social Science
My World and Me - Big Book - Houghton Mifflin (2006)
Mi Mundo y Yo - Big Book - Houghton Mifflin (2006)
School and Family - Houghton Mifflin (2006)
Escuela y Familia - Houghton Mifflin (2006)
Neighborhoods - Houghton Mifflin (2006)
Vecindarios - Houghton Mifflin (2006)
Communit ies - Houghton Mifflin (2006)
Communidades - Houghton Mifflin (2006)
California Studies - Houghton Mifflin (2006)
Estuidos de California - Houghton Mifflin (2006)
Early United States - Houghton Mifflin (2006)
Historia de Estados Unidos: Inicios - Houghton Mifflin (2006)
Ancient Civilizat ions - Holt Reinhart and W inston (2006)
Las Ant iguas Civilizaciones - Holt Reinhart and W inston (2006)
Yes 0.0 %
Foreign LanguageN/A
0.0 %
HealthN/A
0.0 %
Visual and PerformingArts N/A
0.0 %
Science Lab Eqpmt(Grades 9-12)
N/A N/A 0.0 %
2015-16 SARC - Tracy Elementary
Page 6 of 28
Last updated: 1/26/2017
Last updated: 1/26/2017
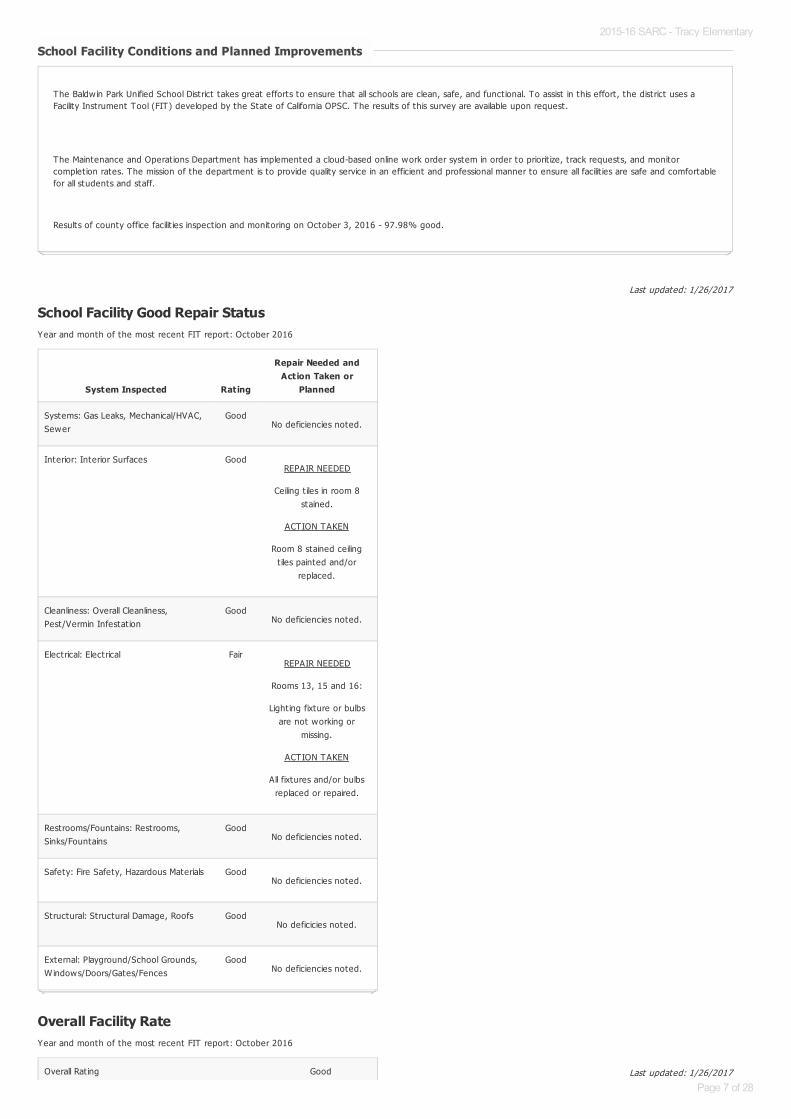
School Facility Good Repair StatusYear and month of the most recent FIT report: October 2016
Overall Facility RateYear and month of the most recent FIT report: October 2016
School Facility Conditions and Planned ImprovementsSchool Facility Conditions and Planned Improvements
The Baldw in Park Unified School District takes great efforts to ensure that all schools are clean, safe, and funct ional. To assist in this effort, the district uses aFacility Instrument Tool (FIT) developed by the State of California OPSC. The results of this survey are available upon request.
The Maintenance and Operat ions Department has implemented a cloud-based online work order system in order to priorit ize, track requests, and monitorcomplet ion rates. The mission of the department is to provide quality service in an efficient and professional manner to ensure all facilit ies are safe and comfortablefor all students and staff.
Results of county office facilit ies inspect ion and monitoring on October 3, 2016 - 97.98% good.
System Inspected Rating
Repair Needed andAction Taken or
Planned
Systems: Gas Leaks, Mechanical/HVAC,Sewer
GoodNo deficiencies noted.
Interior: Interior Surfaces GoodREPAIR NEEDED
Ceiling t iles in room 8stained.
ACTION TAKEN
Room 8 stained ceilingt iles painted and/or
replaced.
Cleanliness: Overall Cleanliness,Pest/Vermin Infestat ion
GoodNo deficiencies noted.
Electrical: Electrical FairREPAIR NEEDED
Rooms 13, 15 and 16:
Light ing fixture or bulbsare not working or
missing.
ACTION TAKEN
All fixtures and/or bulbsreplaced or repaired.
Restrooms/Fountains: Restrooms,Sinks/Fountains
GoodNo deficiencies noted.
Safety: Fire Safety, Hazardous Materials GoodNo deficiencies noted.
Structural: Structural Damage, Roofs GoodNo deficicies noted.
External: Playground/School Grounds,W indows/Doors/Gates/Fences
GoodNo deficiencies noted.
Overall Rat ing Good
2015-16 SARC - Tracy Elementary
Page 7 of 28

2015-16 SARC - Tracy Elementary
Page 8 of 28
Last updated: 1/26/2017
B. Pupil Outcomes
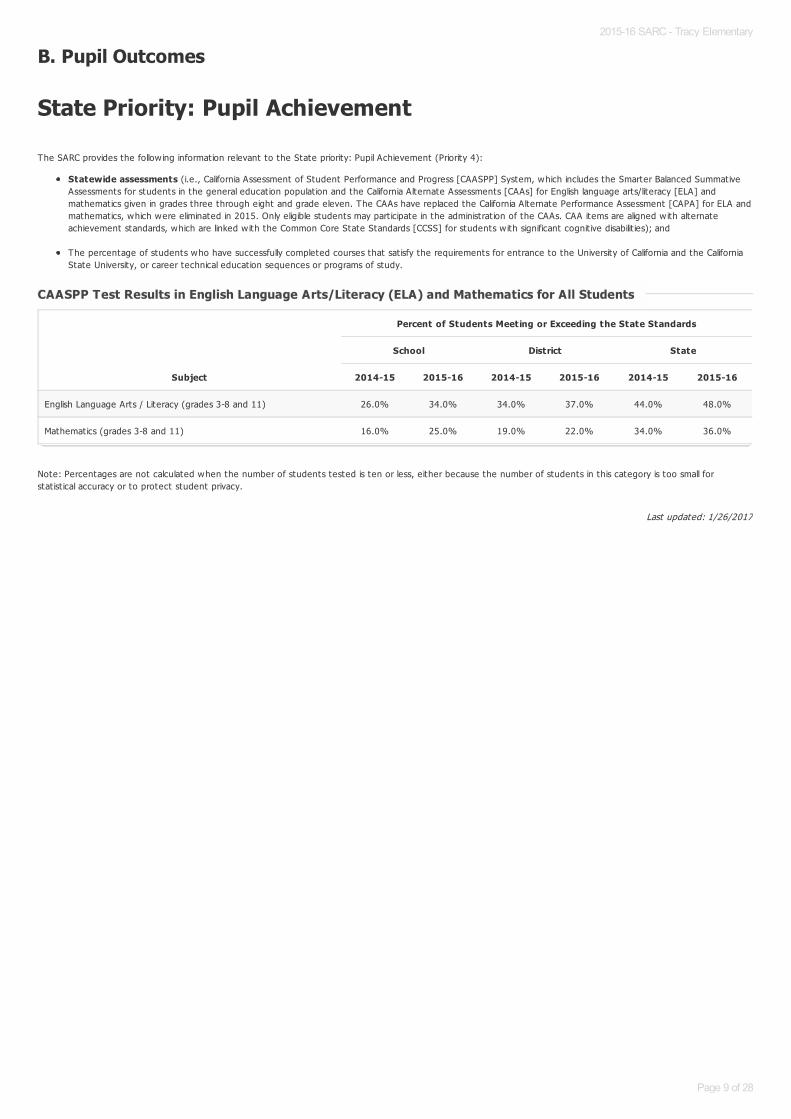
State Priority: Pupil Achievement
The SARC provides the follow ing information relevant to the State priority: Pupil Achievement (Priority 4):
Statewide assessments (i.e., California Assessment of Student Performance and Progress [CAASPP] System, which includes the Smarter Balanced SummativeAssessments for students in the general educat ion populat ion and the California Alternate Assessments [CAAs] for English language arts/literacy [ELA] andmathematics given in grades three through eight and grade eleven. The CAAs have replaced the California Alternate Performance Assessment [CAPA] for ELA andmathematics, which were eliminated in 2015. Only eligible students may part icipate in the administrat ion of the CAAs. CAA items are aligned w ith alternateachievement standards, which are linked w ith the Common Core State Standards [CCSS] for students w ith significant cognit ive disabilit ies); and
The percentage of students who have successfully completed courses that sat isfy the requirements for entrance to the University of California and the CaliforniaState University, or career technical educat ion sequences or programs of study.
Note: Percentages are not calculated when the number of students tested is ten or less, either because the number of students in this category is too small forstat ist ical accuracy or to protect student privacy.
CAASPP Test Results in English Language Arts/Literacy (ELA) and Mathematics for All StudentsCAASPP Test Results in English Language Arts/Literacy (ELA) and Mathematics for All Students
Subject
Percent of Students Meeting or Exceeding the State Standards
School District State
2014-15 2015-16 2014-15 2015-16 2014-15 2015-16
English Language Arts / Literacy (grades 3-8 and 11) 26.0% 34.0% 34.0% 37.0% 44.0% 48.0%
Mathematics (grades 3-8 and 11) 16.0% 25.0% 19.0% 22.0% 34.0% 36.0%
2015-16 SARC - Tracy Elementary
Page 9 of 28
Last updated: 1/24/2017
Note: ELA test results include the Smarter Balanced Summative Assessment and the CAA. The “Percent Met or Exceeded” is calculated by taking the total number ofstudents who met or exceeded the standard on the Smarter Balanced Summative Assessment plus the total number of students who met the standard on the CAAsdivided by the total number of students who part icipated in both assessments.
Double dashes (--) appear in the table when the number of students is ten or less, either because the number of students in this category is too small for stat ist icalaccuracy or to protect student privacy.
Note: The number of students tested includes all students who part icipated in the test whether they received a score or not; however, the number of students testedis not the number that was used to calculate the achievement level percentages. The achievement level percentages are calculated using only students who receivedscores.
CAASPP Test Results in ELA by Student Group CAASPP Test Results in ELA by Student Group
Grades Three through Eight and Grade Eleven (School Year 2015-16)Grades Three through Eight and Grade Eleven (School Year 2015-16)
ELA - Grade 3ELA - Grade 3
Student Group Total Enrollment Number Tested Percent Tested Percent Met or Exceeded
All Students 98 98 100.0% 22.5%
Male 47 47 100.0% 21.3%
Female 51 51 100.0% 23.5%
Black or African American -- -- -- --
American Indian or Alaska Nat ive -- -- -- --
Asian -- -- -- --
Filipino -- -- -- --
Hispanic or Lat ino 93 93 100.0% 21.5%
Native Hawaiian or Pacific Islander -- -- -- --
White -- -- -- --
Two or More Races -- -- -- --
Socioeconomically Disadvantaged 91 91 100.0% 20.9%
English Learners 36 36 100.0% 2.8%
Students w ith Disabilit ies 16 16 100.0% 12.5%
Students Receiving Migrant Educat ion Services -- -- -- --
Foster Youth -- -- -- --
2015-16 SARC - Tracy Elementary
Page 10 of 28
Last updated: 1/24/2017
Note: ELA test results include the Smarter Balanced Summative Assessment and the CAA. The “Percent Met or Exceeded” is calculated by taking the total number ofstudents who met or exceeded the standard on the Smarter Balanced Summative Assessment plus the total number of students who met the standard on the CAAsdivided by the total number of students who part icipated in both assessments.
Double dashes (--) appear in the table when the number of students is ten or less, either because the number of students in this category is too small for stat ist icalaccuracy or to protect student privacy.
Note: The number of students tested includes all students who part icipated in the test whether they received a score or not; however, the number of students testedis not the number that was used to calculate the achievement level percentages. The achievement level percentages are calculated using only students who receivedscores.
ELA - Grade 4ELA - Grade 4
Student Group Total Enrollment Number Tested Percent Tested Percent Met or Exceeded
All Students 105 103 98.1% 26.2%
Male 53 52 98.1% 17.3%
Female 52 51 98.1% 35.3%
Black or African American -- -- -- --
American Indian or Alaska Nat ive -- -- -- --
Asian -- -- -- --
Filipino -- -- -- --
Hispanic or Lat ino 96 94 97.9% 24.5%
Native Hawaiian or Pacific Islander -- -- -- --
White -- -- -- --
Two or More Races -- -- -- --
Socioeconomically Disadvantaged 89 87 97.8% 26.4%
English Learners 29 28 96.6% --
Students w ith Disabilit ies 19 19 100.0% --
Students Receiving Migrant Educat ion Services -- -- -- --
Foster Youth -- -- -- --
2015-16 SARC - Tracy Elementary
Page 11 of 28
Last updated: 1/24/2017
Note: ELA test results include the Smarter Balanced Summative Assessment and the CAA. The “Percent Met or Exceeded” is calculated by taking the total number ofstudents who met or exceeded the standard on the Smarter Balanced Summative Assessment plus the total number of students who met the standard on the CAAsdivided by the total number of students who part icipated in both assessments.
Double dashes (--) appear in the table when the number of students is ten or less, either because the number of students in this category is too small for stat ist icalaccuracy or to protect student privacy.
Note: The number of students tested includes all students who part icipated in the test whether they received a score or not; however, the number of students testedis not the number that was used to calculate the achievement level percentages. The achievement level percentages are calculated using only students who receivedscores.
ELA - Grade 5ELA - Grade 5
Student Group Total Enrollment Number Tested Percent Tested Percent Met or Exceeded
All Students 103 103 100.0% 43.7%
Male 53 53 100.0% 35.9%
Female 50 50 100.0% 52.0%
Black or African American -- -- -- --
American Indian or Alaska Nat ive -- -- -- --
Asian -- -- -- --
Filipino -- -- -- --
Hispanic or Lat ino 93 93 100.0% 40.9%
Native Hawaiian or Pacific Islander -- -- -- --
White -- -- -- --
Two or More Races -- -- -- --
Socioeconomically Disadvantaged 94 94 100.0% 40.4%
English Learners 14 14 100.0% --
Students w ith Disabilit ies 22 22 100.0% 4.6%
Students Receiving Migrant Educat ion Services -- -- -- --
Foster Youth -- -- -- --
2015-16 SARC - Tracy Elementary
Page 12 of 28

Last updated: 1/24/2017
Note: ELA test results include the Smarter Balanced Summative Assessment and the CAA. The “Percent Met or Exceeded” is calculated by taking the total number ofstudents who met or exceeded the standard on the Smarter Balanced Summative Assessment plus the total number of students who met the standard on the CAAsdivided by the total number of students who part icipated in both assessments.
Double dashes (--) appear in the table when the number of students is ten or less, either because the number of students in this category is too small for stat ist icalaccuracy or to protect student privacy.
Note: The number of students tested includes all students who part icipated in the test whether they received a score or not; however, the number of students testedis not the number that was used to calculate the achievement level percentages. The achievement level percentages are calculated using only students who receivedscores.
ELA- ELA- Grade 6Grade 6
Student Group Total Enrollment Number Tested Percent Tested Percent Met or Exceeded
All Students 114 112 98.3% 42.0%
Male 51 50 98.0% 30.0%
Female 63 62 98.4% 51.6%
Black or African American -- -- -- --
American Indian or Alaska Nat ive -- -- -- --
Asian -- -- -- --
Filipino -- -- -- --
Hispanic or Lat ino 103 101 98.1% 37.6%
Native Hawaiian or Pacific Islander -- -- -- --
White -- -- -- --
Two or More Races -- -- -- --
Socioeconomically Disadvantaged 103 101 98.1% 41.6%
English Learners 14 13 92.9% --
Students w ith Disabilit ies 19 19 100.0% 5.3%
Students Receiving Migrant Educat ion Services -- -- -- --
Foster Youth -- -- -- --
2015-16 SARC - Tracy Elementary
Page 13 of 28
Last updated: 1/24/2017
Note: Mathematics test results include the Smarter Balanced Summative Assessment and the CAA. The “Percent Met or Exceeded” is calculated by taking the totalnumber of students who met or exceeded the standard on the Smarter Balanced Summative Assessment plus the total number of students who met the standard onthe CAAs divided by the total number of students who part icipated in both assessments.
Double dashes (--) appear in the table when the number of students is ten or less, either because the number of students in this category is too small for stat ist icalaccuracy or to protect student privacy.
Note: The number of students tested includes all students who part icipated in the test whether they received a score or not; however, the number of students testedis not the number that was used to calculate the achievement level percentages. The achievement level percentages are calculated using only students who receivedscores.
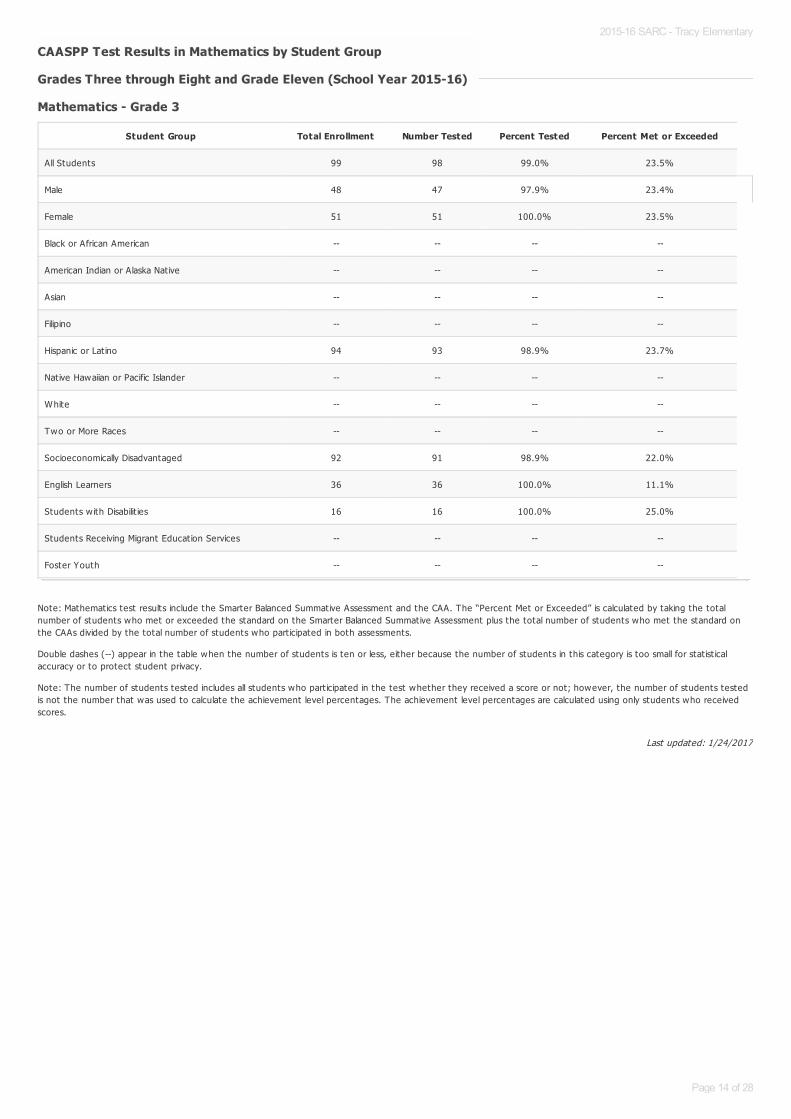
CAASPP Test Results in Mathematics by Student GroupCAASPP Test Results in Mathematics by Student Group
Grades Three through Eight and Grade Eleven (School Year 2015-16)Grades Three through Eight and Grade Eleven (School Year 2015-16)
Mathematics - Grade 3Mathematics - Grade 3
Student Group Total Enrollment Number Tested Percent Tested Percent Met or Exceeded
All Students 99 98 99.0% 23.5%
Male 48 47 97.9% 23.4%
Female 51 51 100.0% 23.5%
Black or African American -- -- -- --
American Indian or Alaska Nat ive -- -- -- --
Asian -- -- -- --
Filipino -- -- -- --
Hispanic or Lat ino 94 93 98.9% 23.7%
Native Hawaiian or Pacific Islander -- -- -- --
White -- -- -- --
Two or More Races -- -- -- --
Socioeconomically Disadvantaged 92 91 98.9% 22.0%
English Learners 36 36 100.0% 11.1%
Students w ith Disabilit ies 16 16 100.0% 25.0%
Students Receiving Migrant Educat ion Services -- -- -- --
Foster Youth -- -- -- --
2015-16 SARC - Tracy Elementary
Page 14 of 28

Last updated: 1/24/2017
Note: Mathematics test results include the Smarter Balanced Summative Assessment and the CAA. The “Percent Met or Exceeded” is calculated by taking the totalnumber of students who met or exceeded the standard on the Smarter Balanced Summative Assessment plus the total number of students who met the standard onthe CAAs divided by the total number of students who part icipated in both assessments.
Double dashes (--) appear in the table when the number of students is ten or less, either because the number of students in this category is too small for stat ist icalaccuracy or to protect student privacy.
Note: The number of students tested includes all students who part icipated in the test whether they received a score or not; however, the number of students testedis not the number that was used to calculate the achievement level percentages. The achievement level percentages are calculated using only students who receivedscores.
Mathematics - Grade 4Mathematics - Grade 4
Student Group Total Enrollment Number Tested Percent Tested Percent Met or Exceeded
All Students 106 103 97.2% 25.2%
Male 54 52 96.3% 19.2%
Female 52 51 98.1% 31.4%
Black or African American -- -- -- --
American Indian or Alaska Nat ive -- -- -- --
Asian -- -- -- --
Filipino -- -- -- --
Hispanic or Lat ino 96 94 97.9% 23.4%
Native Hawaiian or Pacific Islander -- -- -- --
White -- -- -- --
Two or More Races -- -- -- --
Socioeconomically Disadvantaged 90 87 96.7% 25.3%
English Learners 29 28 96.6% 3.6%
Students w ith Disabilit ies 19 19 100.0% --
Students Receiving Migrant Educat ion Services -- -- -- --
Foster Youth -- -- -- --
2015-16 SARC - Tracy Elementary
Page 15 of 28
Last updated: 1/24/2017
Note: Mathematics test results include the Smarter Balanced Summative Assessment and the CAA. The “Percent Met or Exceeded” is calculated by taking the totalnumber of students who met or exceeded the standard on the Smarter Balanced Summative Assessment plus the total number of students who met the standard onthe CAAs divided by the total number of students who part icipated in both assessments.
Double dashes (--) appear in the table when the number of students is ten or less, either because the number of students in this category is too small for stat ist icalaccuracy or to protect student privacy.
Note: The number of students tested includes all students who part icipated in the test whether they received a score or not; however, the number of students testedis not the number that was used to calculate the achievement level percentages. The achievement level percentages are calculated using only students who receivedscores.
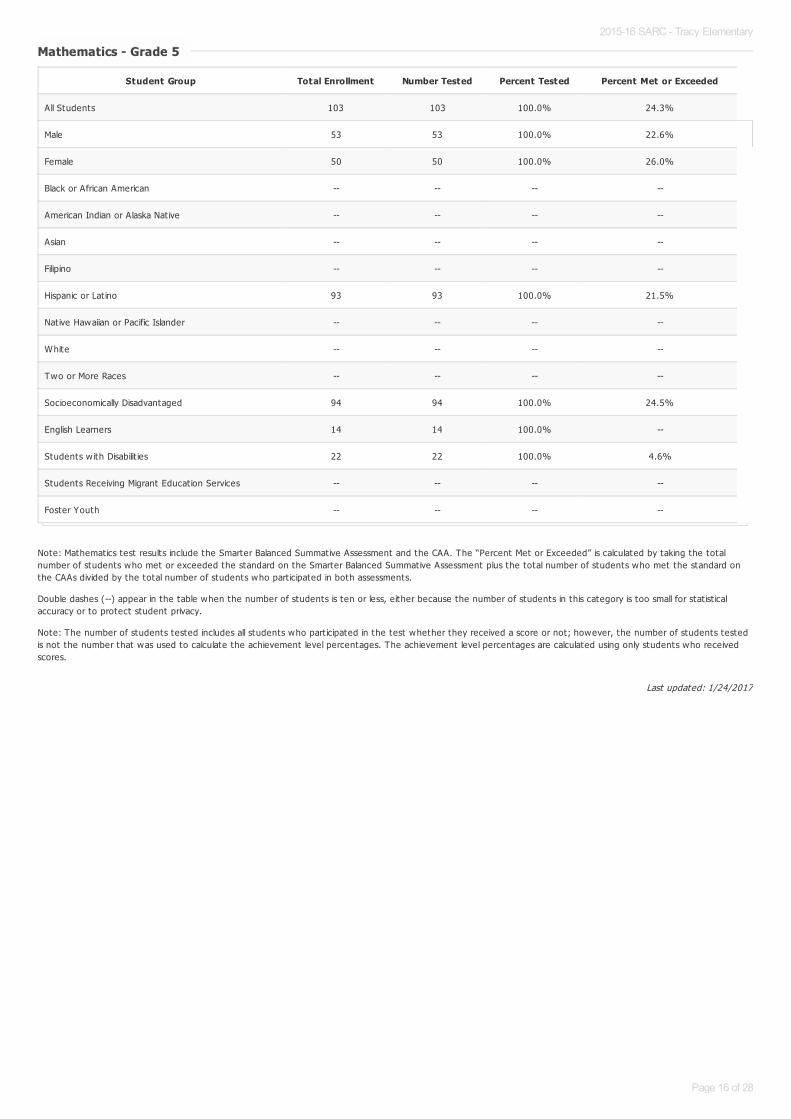
Mathematics - Grade 5Mathematics - Grade 5
Student Group Total Enrollment Number Tested Percent Tested Percent Met or Exceeded
All Students 103 103 100.0% 24.3%
Male 53 53 100.0% 22.6%
Female 50 50 100.0% 26.0%
Black or African American -- -- -- --
American Indian or Alaska Nat ive -- -- -- --
Asian -- -- -- --
Filipino -- -- -- --
Hispanic or Lat ino 93 93 100.0% 21.5%
Native Hawaiian or Pacific Islander -- -- -- --
White -- -- -- --
Two or More Races -- -- -- --
Socioeconomically Disadvantaged 94 94 100.0% 24.5%
English Learners 14 14 100.0% --
Students w ith Disabilit ies 22 22 100.0% 4.6%
Students Receiving Migrant Educat ion Services -- -- -- --
Foster Youth -- -- -- --
2015-16 SARC - Tracy Elementary
Page 16 of 28

Last updated: 1/24/2017
Note: Mathematics test results include the Smarter Balanced Summative Assessment and the CAA. The “Percent Met or Exceeded” is calculated by taking the totalnumber of students who met or exceeded the standard on the Smarter Balanced Summative Assessment plus the total number of students who met the standard onthe CAAs divided by the total number of students who part icipated in both assessments.
Double dashes (--) appear in the table when the number of students is ten or less, either because the number of students in this category is too small for stat ist icalaccuracy or to protect student privacy.
Note: The number of students tested includes all students who part icipated in the test whether they received a score or not; however, the number of students testedis not the number that was used to calculate the achievement level percentages. The achievement level percentages are calculated using only students who receivedscores.
Mathematics - Grade 6Mathematics - Grade 6
Student Group Total Enrollment Number Tested Percent Tested Percent Met or Exceeded
All Students 114 112 98.3% 26.8%
Male 51 50 98.0% 28.0%
Female 63 62 98.4% 25.8%
Black or African American -- -- -- --
American Indian or Alaska Nat ive -- -- -- --
Asian -- -- -- --
Filipino -- -- -- --
Hispanic or Lat ino 103 101 98.1% 22.8%
Native Hawaiian or Pacific Islander -- -- -- --
White -- -- -- --
Two or More Races -- -- -- --
Socioeconomically Disadvantaged 103 101 98.1% 26.7%
English Learners 14 13 92.9% 7.7%
Students w ith Disabilit ies 19 19 100.0% 5.3%
Students Receiving Migrant Educat ion Services -- -- -- --
Foster Youth -- -- -- --
2015-16 SARC - Tracy Elementary
Page 17 of 28
Last updated: 1/24/2017
Last updated: 1/24/2017
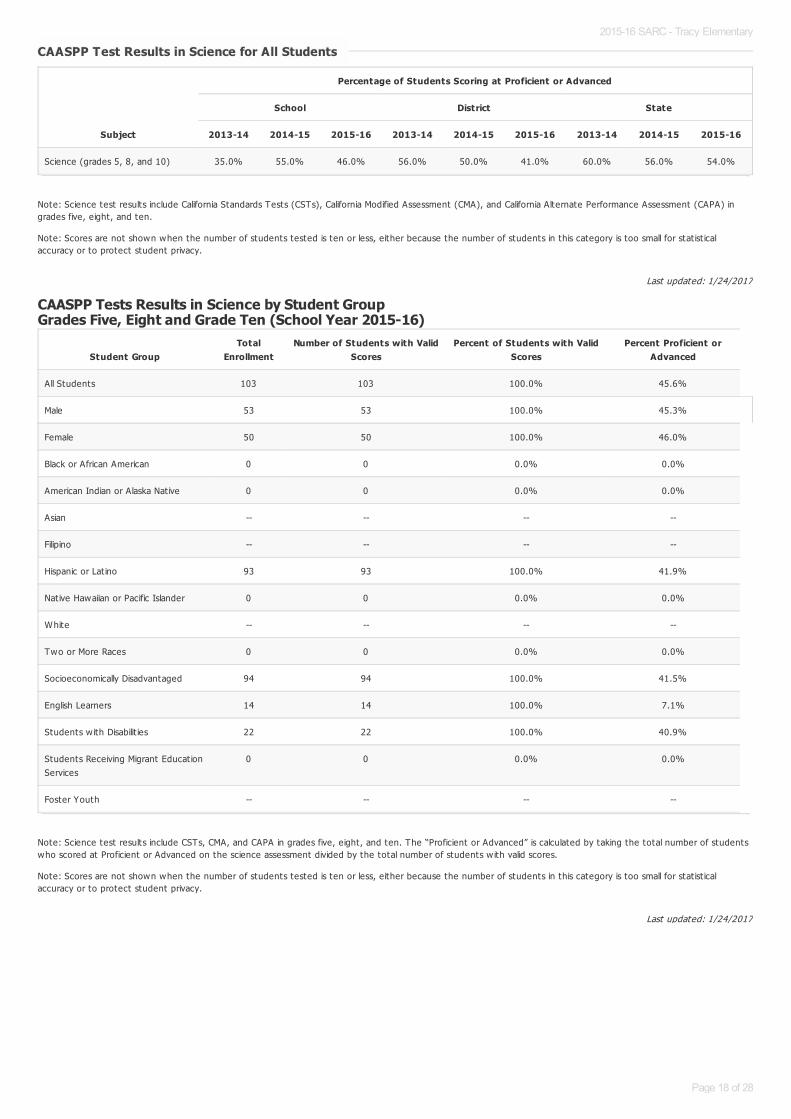
Note: Science test results include California Standards Tests (CSTs), California Modified Assessment (CMA), and California Alternate Performance Assessment (CAPA) ingrades five, eight, and ten.
Note: Scores are not shown when the number of students tested is ten or less, either because the number of students in this category is too small for stat ist icalaccuracy or to protect student privacy.
CAASPP Tests Results in Science by Student GroupGrades Five, Eight and Grade Ten (School Year 2015-16)
Note: Science test results include CSTs, CMA, and CAPA in grades five, eight, and ten. The “Proficient or Advanced” is calculated by taking the total number of studentswho scored at Proficient or Advanced on the science assessment divided by the total number of students w ith valid scores.
Note: Scores are not shown when the number of students tested is ten or less, either because the number of students in this category is too small for stat ist icalaccuracy or to protect student privacy.
CAASPP Test Results in Science for All StudentsCAASPP Test Results in Science for All Students
Subject
Percentage of Students Scoring at Proficient or Advanced
School District State
2013-14 2014-15 2015-16 2013-14 2014-15 2015-16 2013-14 2014-15 2015-16
Science (grades 5, 8, and 10) 35.0% 55.0% 46.0% 56.0% 50.0% 41.0% 60.0% 56.0% 54.0%
Student GroupTotal
EnrollmentNumber of Students with Valid
ScoresPercent of Students with Valid
ScoresPercent Proficient or
Advanced
All Students 103 103 100.0% 45.6%
Male 53 53 100.0% 45.3%
Female 50 50 100.0% 46.0%
Black or African American 0 0 0.0% 0.0%
American Indian or Alaska Nat ive 0 0 0.0% 0.0%
Asian -- -- -- --
Filipino -- -- -- --
Hispanic or Lat ino 93 93 100.0% 41.9%
Native Hawaiian or Pacific Islander 0 0 0.0% 0.0%
White -- -- -- --
Two or More Races 0 0 0.0% 0.0%
Socioeconomically Disadvantaged 94 94 100.0% 41.5%
English Learners 14 14 100.0% 7.1%
Students w ith Disabilit ies 22 22 100.0% 40.9%
Students Receiving Migrant Educat ionServices
0 0 0.0% 0.0%
Foster Youth -- -- -- --
2015-16 SARC - Tracy Elementary
Page 18 of 28
Last updated: 1/24/2017
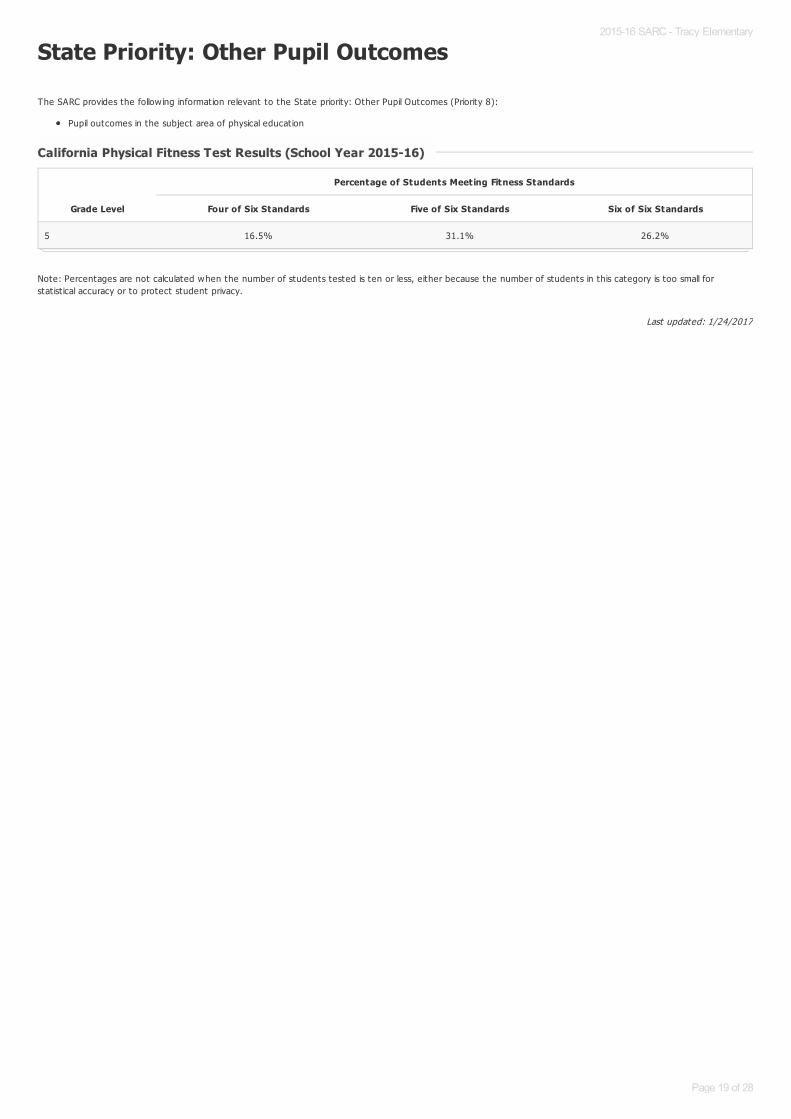
State Priority: Other Pupil Outcomes
The SARC provides the follow ing information relevant to the State priority: Other Pupil Outcomes (Priority 8):
Pupil outcomes in the subject area of physical educat ion
Note: Percentages are not calculated when the number of students tested is ten or less, either because the number of students in this category is too small forstat ist ical accuracy or to protect student privacy.
California Physical Fitness Test Results (School Year 2015-16)California Physical Fitness Test Results (School Year 2015-16)
Grade Level
Percentage of Students Meeting Fitness Standards
Four of Six Standards Five of Six Standards Six of Six Standards
5 16.5% 31.1% 26.2%
2015-16 SARC - Tracy Elementary
Page 19 of 28
Last updated: 1/26/2017
C. Engagement
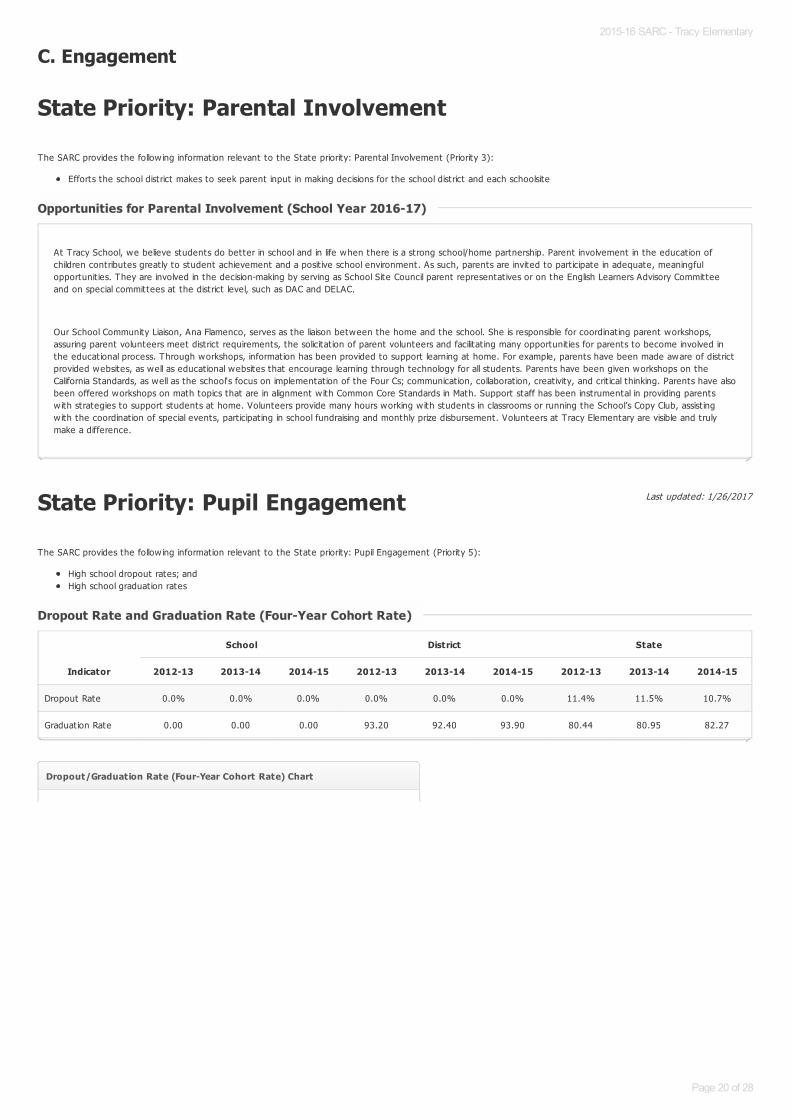
State Priority: Parental Involvement
The SARC provides the follow ing information relevant to the State priority: Parental Involvement (Priority 3):
Efforts the school district makes to seek parent input in making decisions for the school district and each schoolsite
State Priority: Pupil Engagement
The SARC provides the follow ing information relevant to the State priority: Pupil Engagement (Priority 5):
High school dropout rates; andHigh school graduat ion rates
Opportunities for Parental Involvement (School Year 2016-17)Opportunities for Parental Involvement (School Year 2016-17)
At Tracy School, we believe students do better in school and in life when there is a strong school/home partnership. Parent involvement in the educat ion ofchildren contributes great ly to student achievement and a posit ive school environment. As such, parents are invited to part icipate in adequate, meaningfulopportunit ies. They are involved in the decision-making by serving as School Site Council parent representat ives or on the English Learners Advisory Committeeand on special committees at the district level, such as DAC and DELAC.
Our School Community Liaison, Ana Flamenco, serves as the liaison between the home and the school. She is responsible for coordinat ing parent workshops,assuring parent volunteers meet district requirements, the solicitat ion of parent volunteers and facilitat ing many opportunit ies for parents to become involved inthe educat ional process. Through workshops, information has been provided to support learning at home. For example, parents have been made aware of districtprovided websites, as well as educat ional websites that encourage learning through technology for all students. Parents have been given workshops on theCalifornia Standards, as well as the school's focus on implementat ion of the Four Cs; communicat ion, collaborat ion, creat ivity, and crit ical thinking. Parents have alsobeen offered workshops on math topics that are in alignment w ith Common Core Standards in Math. Support staff has been instrumental in providing parentsw ith strategies to support students at home. Volunteers provide many hours working w ith students in classrooms or running the School’s Copy Club, assist ingw ith the coordinat ion of special events, part icipat ing in school fundraising and monthly prize disbursement. Volunteers at Tracy Elementary are visible and trulymake a difference.
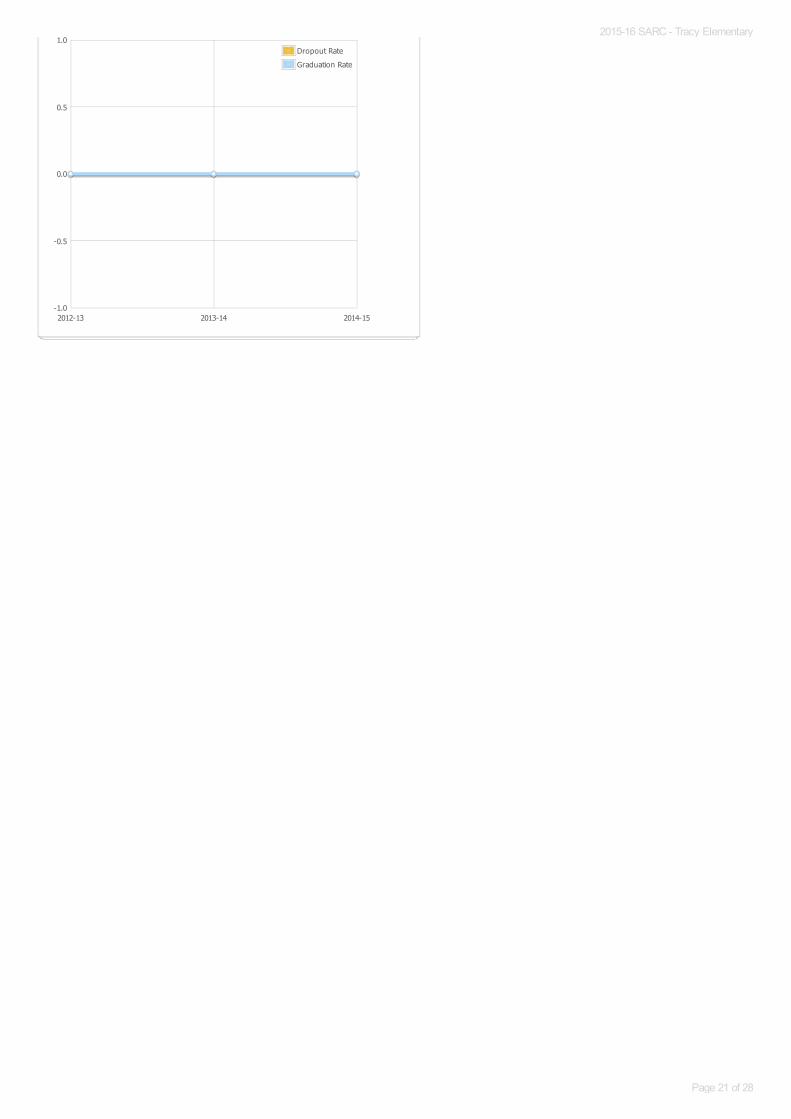
Dropout Rate and Graduation Rate (Four-Year Cohort Rate)Dropout Rate and Graduation Rate (Four-Year Cohort Rate)
Indicator
School District State
2012-13 2013-14 2014-15 2012-13 2013-14 2014-15 2012-13 2013-14 2014-15
Dropout Rate 0.0% 0.0% 0.0% 0.0% 0.0% 0.0% 11.4% 11.5% 10.7%
Graduat ion Rate 0.00 0.00 0.00 93.20 92.40 93.90 80.44 80.95 82.27
Dropout/Graduation Rate (Four-Year Cohort Rate) Chart
1.0
2015-16 SARC - Tracy Elementary
Page 20 of 28
2012-13 2013-14 2014-15-1.0
-0.5
0.0
0.5
1.0Dropout Rate
Graduation Rate
2015-16 SARC - Tracy Elementary
Page 21 of 28
Last updated: 1/31/2017
Last updated: 1/31/2017
Last updated: 1/26/2017
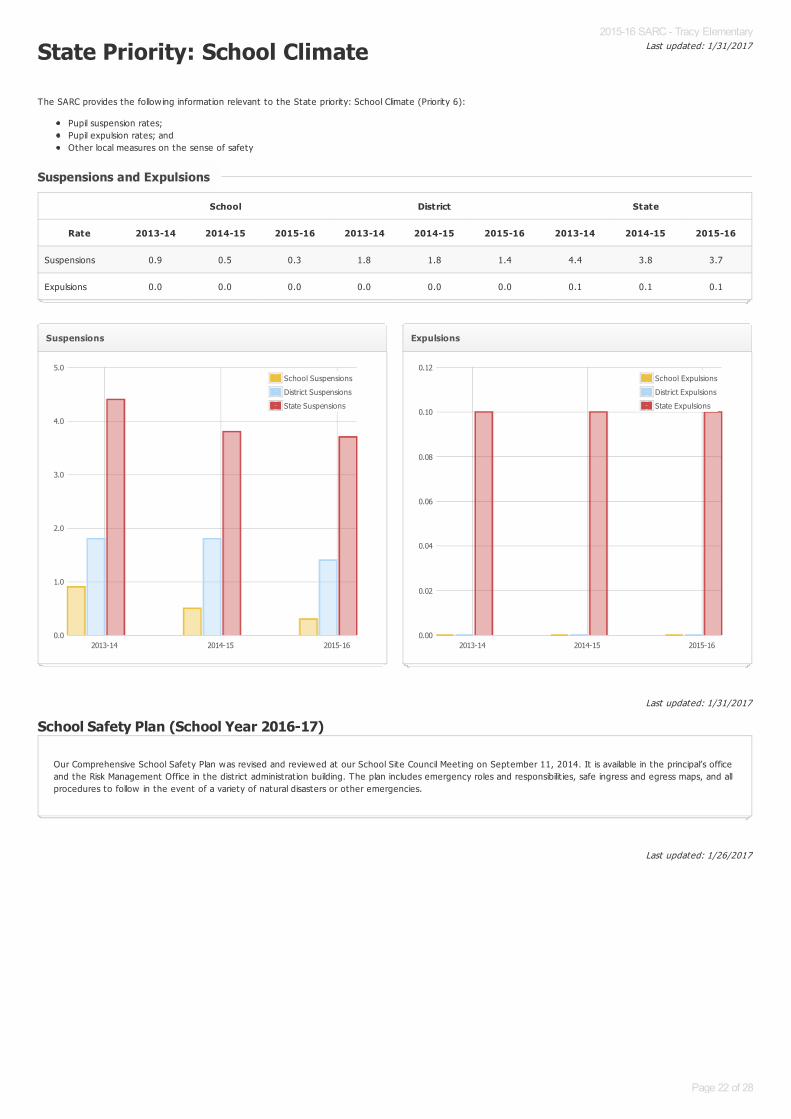
State Priority: School Climate
The SARC provides the follow ing information relevant to the State priority: School Climate (Priority 6):
Pupil suspension rates;Pupil expulsion rates; andOther local measures on the sense of safety
School Safety Plan (School Year 2016-17)
Suspensions and ExpulsionsSuspensions and Expulsions
School District State
Rate 2013-14 2014-15 2015-16 2013-14 2014-15 2015-16 2013-14 2014-15 2015-16
Suspensions 0.9 0.5 0.3 1.8 1.8 1.4 4.4 3.8 3.7
Expulsions 0.0 0.0 0.0 0.0 0.0 0.0 0.1 0.1 0.1
Suspensions
2013-14 2014-15 2015-160.0
1.0
2.0
3.0
4.0
5.0School Suspensions
District Suspensions
State Suspensions
Expulsions
2013-14 2014-15 2015-160.00
0.02
0.04
0.06
0.08
0.10
0.12School Expulsions
District Expulsions
State Expulsions
Our Comprehensive School Safety Plan was revised and reviewed at our School Site Council Meet ing on September 11, 2014. It is available in the principal’s officeand the Risk Management Office in the district administrat ion building. The plan includes emergency roles and responsibilit ies, safe ingress and egress maps, and allprocedures to follow in the event of a variety of natural disasters or other emergencies.
2015-16 SARC - Tracy Elementary
Page 22 of 28
Last updated: 1/26/2017
Last updated: 1/30/2017
D. Other SARC InformationThe information in this sect ion is required to be in the SARC but is not included in the state priorit ies for LCFF.
Note: Cells w ith NA values do not require data.
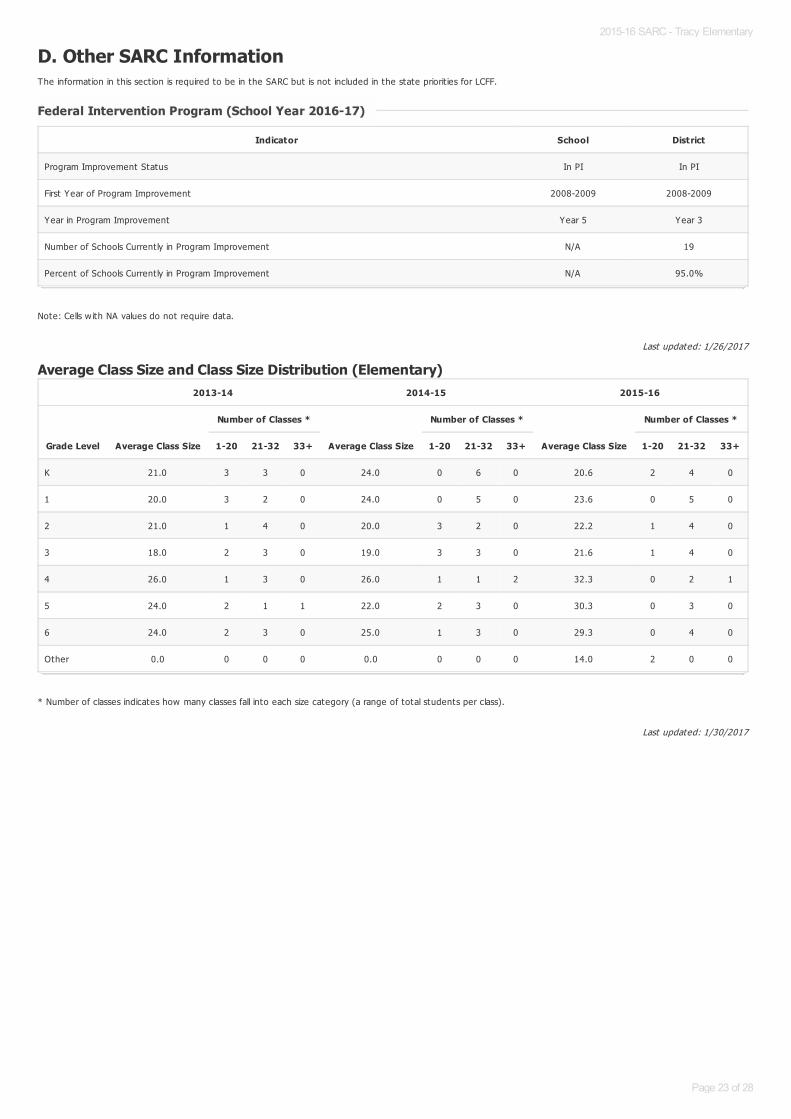
Average Class Size and Class Size Distribution (Elementary)
* Number of classes indicates how many classes fall into each size category (a range of total students per class).
Federal Intervention Program (School Year 2016-17)Federal Intervention Program (School Year 2016-17)
Indicator School District
Program Improvement Status In PI In PI
First Year of Program Improvement 2008-2009 2008-2009
Year in Program Improvement Year 5 Year 3
Number of Schools Current ly in Program Improvement N/A 19
Percent of Schools Current ly in Program Improvement N/A 95.0%
2013-14 2014-15 2015-16
Grade Level Average Class Size
Number of Classes *
Average Class Size
Number of Classes *
Average Class Size
Number of Classes *
1-20 21-32 33+ 1-20 21-32 33+ 1-20 21-32 33+
K 21.0 3 3 0 24.0 0 6 0 20.6 2 4 0
1 20.0 3 2 0 24.0 0 5 0 23.6 0 5 0
2 21.0 1 4 0 20.0 3 2 0 22.2 1 4 0
3 18.0 2 3 0 19.0 3 3 0 21.6 1 4 0
4 26.0 1 3 0 26.0 1 1 2 32.3 0 2 1
5 24.0 2 1 1 22.0 2 3 0 30.3 0 3 0
6 24.0 2 3 0 25.0 1 3 0 29.3 0 4 0
Other 0.0 0 0 0 0.0 0 0 0 14.0 2 0 0
2015-16 SARC - Tracy Elementary
Page 23 of 28
Last updated: 1/26/2017
Last updated: 1/27/2017
Last updated: 1/31/2017
* Number of classes indicates how many classrooms fall into each size category (a range of total students per classroom). At the secondary school level, this information isreported by subject area rather than grade level.
Academic Counselors and Other Support Staff (School Year 2015-16)
Note: Cells w ith N/A values do not require data.
*One Full T ime Equivalent (FTE) equals one staff member working full t ime; one FTE could also represent two staff members who each work 50 percent of full t ime.
Note: Cells w ith N/A values do not require data.
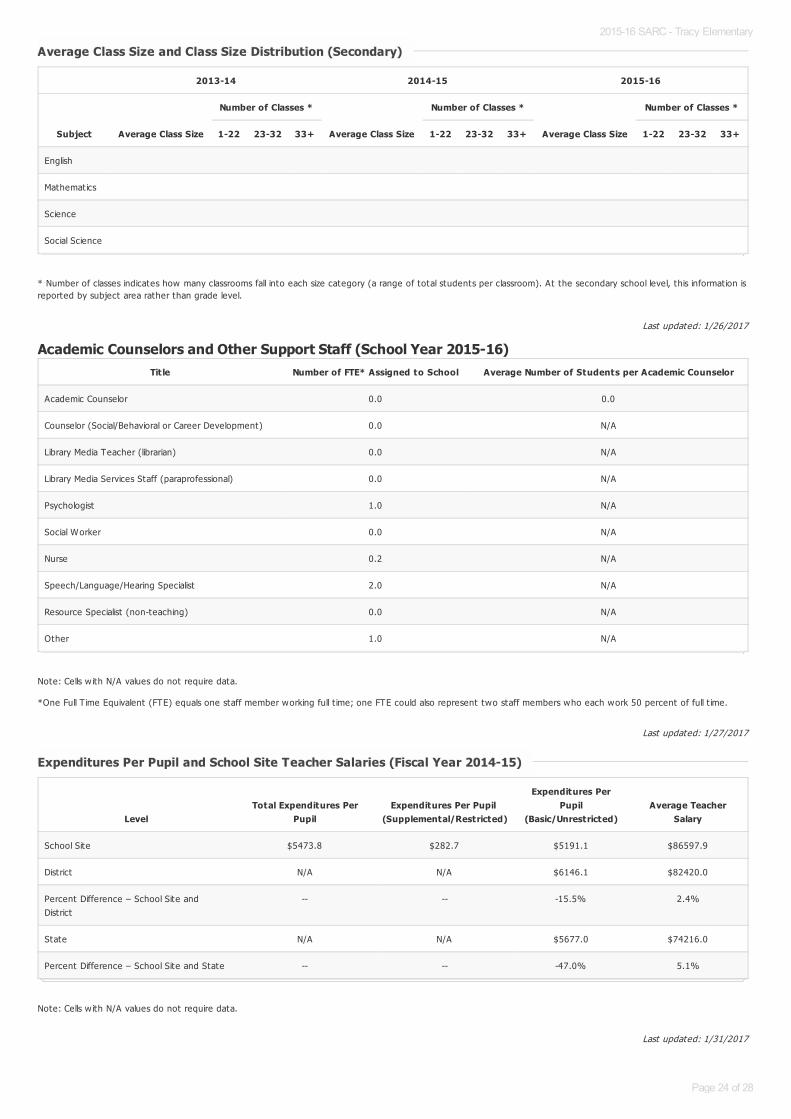
Average Class Size and Class Size Distribution (Secondary)Average Class Size and Class Size Distribution (Secondary)
2013-14 2014-15 2015-16
Subject Average Class Size
Number of Classes *
Average Class Size
Number of Classes *
Average Class Size
Number of Classes *
1-22 23-32 33+ 1-22 23-32 33+ 1-22 23-32 33+
English
Mathematics
Science
Social Science
Title Number of FTE* Assigned to School Average Number of Students per Academic Counselor
Academic Counselor 0.0 0.0
Counselor (Social/Behavioral or Career Development) 0.0 N/A
Library Media Teacher (librarian) 0.0 N/A
Library Media Services Staff (paraprofessional) 0.0 N/A
Psychologist 1.0 N/A
Social Worker 0.0 N/A
Nurse 0.2 N/A
Speech/Language/Hearing Specialist 2.0 N/A
Resource Specialist (non-teaching) 0.0 N/A
Other 1.0 N/A
Expenditures Per Pupil and School Site Teacher Salaries (Fiscal Year 2014-15)Expenditures Per Pupil and School Site Teacher Salaries (Fiscal Year 2014-15)
LevelTotal Expenditures Per
PupilExpenditures Per Pupil
(Supplemental/Restricted)
Expenditures PerPupil
(Basic/Unrestricted)Average Teacher
Salary
School Site $5473.8 $282.7 $5191.1 $86597.9
District N/A N/A $6146.1 $82420.0
Percent Difference – School Site andDistrict
-- -- -15.5% 2.4%
State N/A N/A $5677.0 $74216.0
Percent Difference – School Site and State -- -- -47.0% 5.1%
2015-16 SARC - Tracy Elementary
Page 24 of 28
Last updated: 1/26/2017
For detailed information on salaries, see the CDE Cert ificated Salaries & Benefits Web page at http://www.cde.ca.gov/ds/fd/cs/ .
Types of Services Funded (Fiscal Year 2015-16)Types of Services Funded (Fiscal Year 2015-16)
Local Control Funding Formula
The local control funding formula (LCFF) establishes base, supplemental, and concentrat ion funding. These fundings replace many of the former state categoricalprograms. Supplemental and Concentrat ion grants go to help high needs students: English Language Learners, low-income students and foster youth. Schooldistricts have greater flexibility, than in the past, to decide how to use the funds w ith input from their local communit ies. Budgets are t ied to improvement goalsin the district ’s Local Control and Accountability Plan (LCAP).
Federal – T it le I Schoolw ide Program
Tit le I funding is provided to ensure that all children have a fair, equal, and significant opportunity to obtain a high-quality educat ion and meet state standards.The T it le I Schoolw ide Program is based on the premise that comprehensive reform strategies rather than separate, add-on services are most effect ive in raisingacademic achievement for the lowest achieving students in a school.
Federal – T it le II
T it le II, Part A, Teacher and Principal Training and Recruit ing is a federal categorical program for the purpose of increasing the academic achievement of allstudents by helping schools and district (1) improve teacher and principal quality through professional development and other act ivit ies and (2) ensure all teachersare highly qualified.
Federal – T it le III
The main priority of T it le III is for limited-English-proficient (LEP) students (called English learners under California laws), including immigrant children and youths, toattain English proficiency and meet the same challenging academic content and achievement standards that other students are expected to meet.
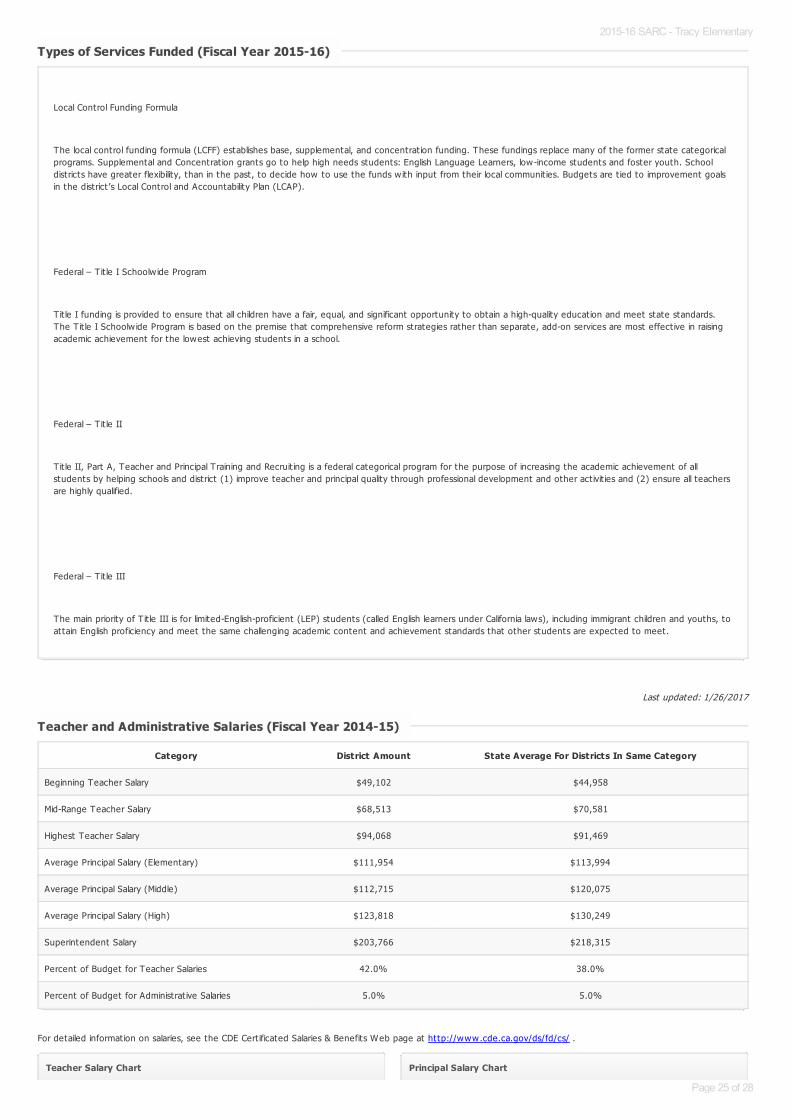
Teacher and Administrative Salaries (Fiscal Year 2014-15)Teacher and Administrative Salaries (Fiscal Year 2014-15)
Category District Amount State Average For Districts In Same Category
Beginning Teacher Salary $49,102 $44,958
Mid-Range Teacher Salary $68,513 $70,581
Highest Teacher Salary $94,068 $91,469
Average Principal Salary (Elementary) $111,954 $113,994
Average Principal Salary (Middle) $112,715 $120,075
Average Principal Salary (High) $123,818 $130,249
Superintendent Salary $203,766 $218,315
Percent of Budget for Teacher Salaries 42.0% 38.0%
Percent of Budget for Administrat ive Salaries 5.0% 5.0%
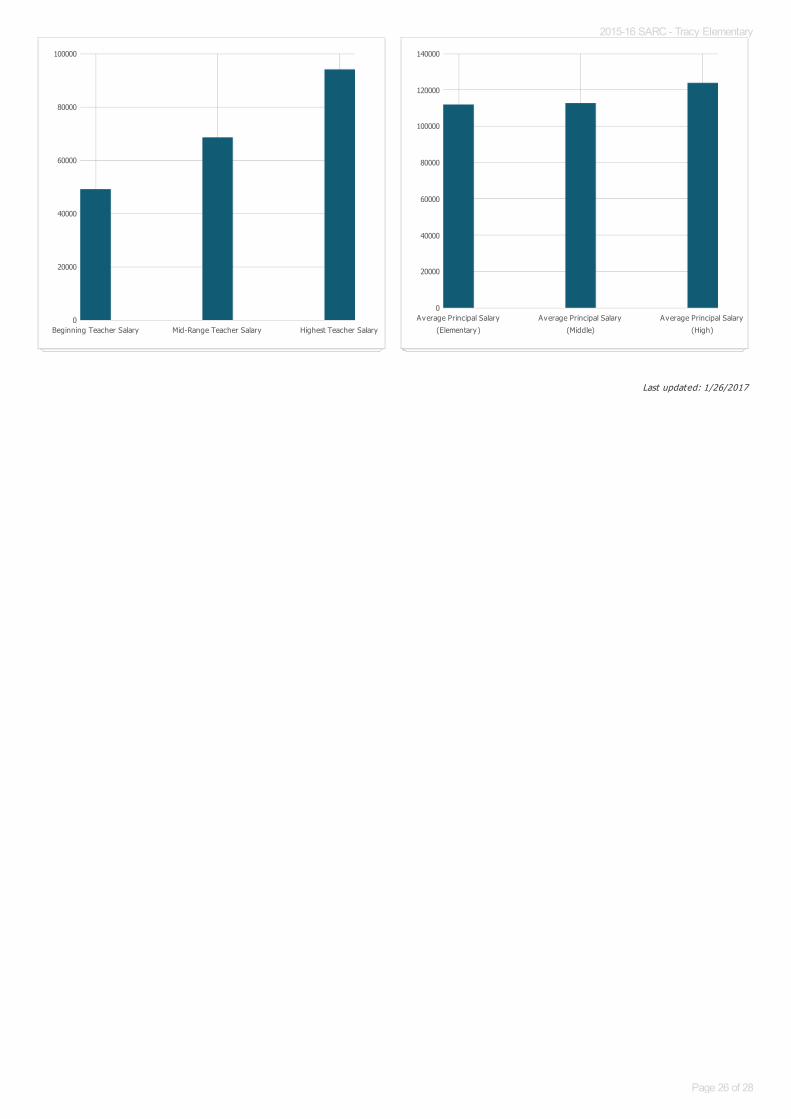
Teacher Salary Chart Principal Salary Chart
2015-16 SARC - Tracy Elementary
Page 25 of 28
Last updated: 1/26/2017
Beginning Teacher Salary Mid-Range Teacher Salary Highest Teacher Salary0
20000
40000
60000
80000
100000
Average Principal Salary
(Elementary)
Average Principal Salary
(Middle)
Average Principal Salary
(High)
0
20000
40000
60000
80000
100000
120000
140000
2015-16 SARC - Tracy Elementary
Page 26 of 28
Last updated: 1/26/2017
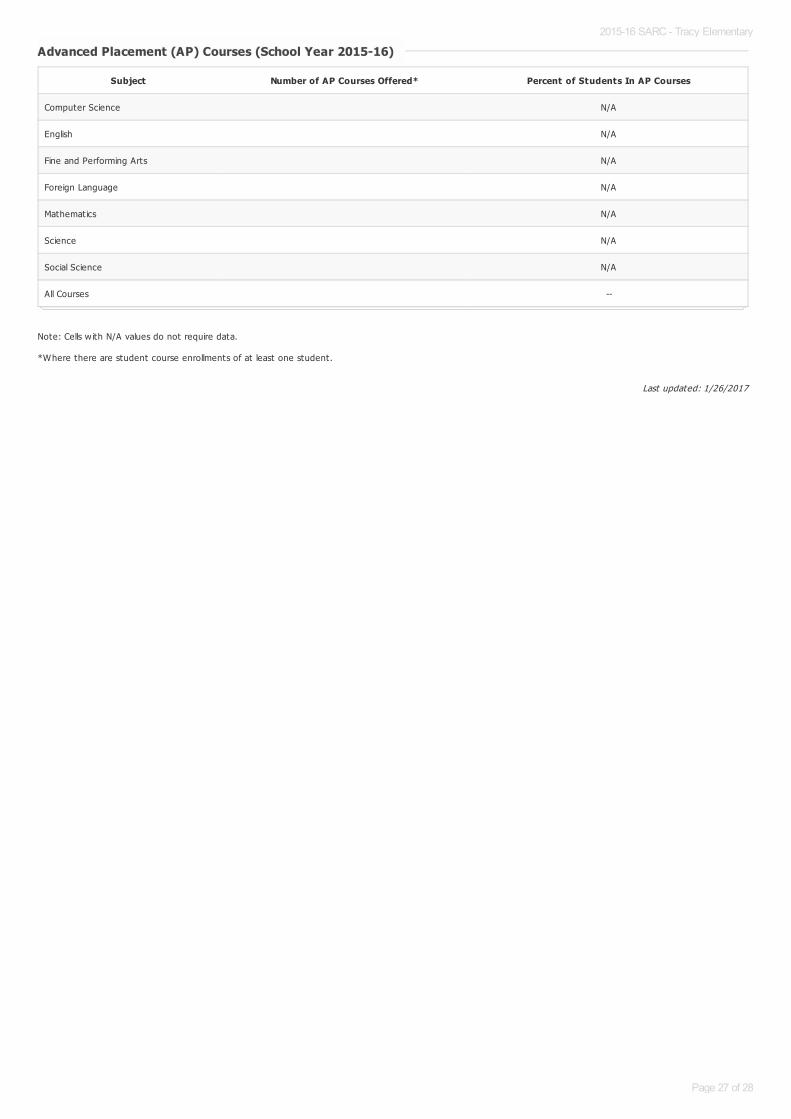
Note: Cells w ith N/A values do not require data.
*Where there are student course enrollments of at least one student.
Advanced Placement (AP) Courses (School Year 2015-16)Advanced Placement (AP) Courses (School Year 2015-16)
Subject Number of AP Courses Offered* Percent of Students In AP Courses
Computer Science N/A
English N/A
Fine and Performing Arts N/A
Foreign Language N/A
Mathematics N/A
Science N/A
Social Science N/A
All Courses --
2015-16 SARC - Tracy Elementary
Page 27 of 28
Last updated: 1/26/2017
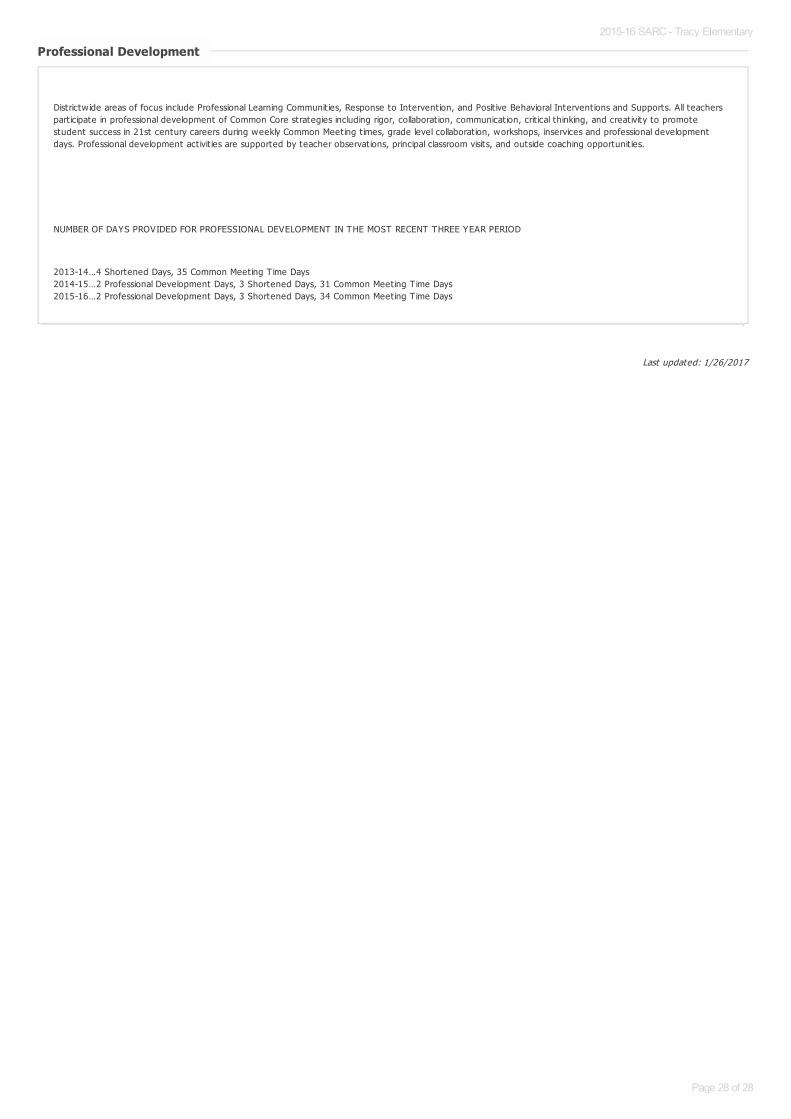
Professional DevelopmentProfessional Development
Districtw ide areas of focus include Professional Learning Communit ies, Response to Intervent ion, and Posit ive Behavioral Intervent ions and Supports. All teacherspart icipate in professional development of Common Core strategies including rigor, collaborat ion, communicat ion, crit ical thinking, and creat ivity to promotestudent success in 21st century careers during weekly Common Meeting t imes, grade level collaborat ion, workshops, inservices and professional developmentdays. Professional development act ivit ies are supported by teacher observat ions, principal classroom visits, and outside coaching opportunit ies.
NUMBER OF DAYS PROVIDED FOR PROFESSIONAL DEVELOPMENT IN THE MOST RECENT THREE YEAR PERIOD
2013-14…4 Shortened Days, 35 Common Meeting T ime Days2014-15…2 Professional Development Days, 3 Shortened Days, 31 Common Meeting T ime Days2015-16…2 Professional Development Days, 3 Shortened Days, 34 Common Meeting T ime Days
2015-16 SARC - Tracy Elementary
Page 28 of 28