Embed Size (px)
Citation preview

0
Falkland Islands Seabird Monitoring Programme
Annual Report 2020/2021 (SMP28)
Sarah Crofts & Andrew Stanworth
June 2021
Funded by the Falkland Islands Government

1
Recommended citation: Crofts, S. & Stanworth, A. 2021. Falkland Islands Seabird Monitoring Programme - Annual Report 2020/2021 (SMP28). Falklands Conservation, Stanley. Falklands Conservation, 41 Ross Road, Stanley, Falkland Islands Corresponding author: Sarah Crofts: [email protected] Falkland Islands Government Denise Blake (Environmental Officer): [email protected]
Falklands Conservation is a company limited by guarantee in England and Wales No. 3661322 and Registered Charity No. 1073859 Registered Office: 2nd Floor, Regis House, 45 King William Street, London, EC4R 9AN
Telephone: +44 (0)1767 679039, [email protected] Registered as an Overseas Company in the Falkland Islands

2
Summary
The Falkland Islands support seabird populations that are of global importance; both numerically,
and in terms of conservation status. Accordingly, fluctuations in local populations may substantially
affect the global conservation status of these species.
The Falkland Islands Seabird Monitoring Programme (FISMP) monitors Gentoo Penguin (Pygoscelis
papua) at 11 sites (17 colonies), Southern Rockhopper Penguin (Eudyptes c. chrysocome) at five
sites (14 colonies) and Magellanic Penguin (Spheniscus magellanicus) at one site (one colony). King
Penguin (Aptenodytes patagonicus) and Black-browed Albatross (Thalassarche melanophris) are
monitored at single, but key sites, in terms of population numbers. Southern Giant Petrel
(Macronectes giganteus) is monitored at one site (two colonies), Imperial Shag (Phalacrocorax
atriceps) at three sites (four colonies) and Brown Skua (Catharacta antarctica) at one site (four
colonies).
Summary results of FIMSP 2020
Breeding pair numbers of Gentoo Penguin and Southern Rockhopper Penguin at FISMP sites
continued to show no clear signs of a recovery following the significant drop in breeding pair
numbers in 2016 (when a strong El Niño Southern Oscillation event was in place). Breeding pair
numbers of Black-browed Albatross, Southern Giant Petrel, Magellanic Penguin, Brown Skua, and
King Penguin pre-fledged chicks at FISMP sites appeared stable or increasing. In general, breeding
success across the species was improved in 2020 when compared to the previous year.
Neutral El Niño Southern Oscillation (ENSO) and La Niña conditions dominated the period of
October 2020 to March 2021.
Gentoo Penguin breeding pair numbers at the FISMP sites showed a decrease of 6 % when
compared with 2019. Breeding pair numbers have remain relatively static following the significant
drop during 2016, and currently are at 36 % below the 2015 maximum value. In 2020, overall
breeding success (1.14 chicks/pair) was above the FIMSP long-term annual average (0.95
chicks/pair).

3
Southern Rockhopper Penguin breeding pair numbers decreased by 1 % when compared to 2019.
Breeding pair numbers have remain relatively unchanged following the significant drop during
2016, and currently are at 29 % below the 2015 maximum value. In 2020 breeding success was
highly variable between locations and overall performance remained below the long-term annual
average for the sixth consecutive year.
Magellanic Penguin burrow occupancy at Gypsy Cove was broadly associated with the extent of
tussac grass habitat. The 2020 occupancy rate of 32.4 % had increased from the previous year (27.7
%), and was just below the annual average for this monitored site (33.0 %).
King Penguin numbers of pre-fledged chicks at Volunteer Point was 866, an increase of 5 % when
compared with 2019, and the highest value recorded since monitoring began in 1980. The long-
term monitoring at this site shows periodic fluctuations with an overall upward trend.
Imperial Shag numbers continued to fluctuate seasonally at monitored sites. There was no clear
indication of a strong downward or upward trend.
Brown Skua numbers of Apparently Occupied Territories (AOT) at Steeple Jason increased by 8 %
and productivity (the ratio of eggs/chicks per adult territory) also increased when compared with
2019.
Black-browed Albatross breeding pair numbers at the monitoring sites at Steeple Jason showed an
overall decrease of 1 % when compared with 2019. Taking into account annual fluctuations, the
overall FISMP trend suggests a stable population. The overall breeding success in 2020 remained
below the annual average for the sixth consecutive year, although was improved when compared
with 2019.
Southern Giant Petrel breeding pair numbers at Steeple Jason increased by 6 % when compared
with 2019. The overall increase reflected the positive trend at the Neck colony, whereas the
Northwest colony continued to decline. In 2020, breeding success of 15 % was well below the long-
term annual average of 32 %.

4
Contents
Summary 2
Introduction 5
Materials and methods 7
Gentoo Penguin 8
Southern Rockhopper Penguin 8
Magellanic Penguin 8
King Penguin 9
Imperial Shag 9
Brown Skua 9
Black-browed Albatross & Southern Giant Petrel 9
Landowner counts 10
Count methods 10
Environment
Anthropogenic and other impacts at colonies
Results
12
12
13
Gentoo Penguin 13
Southern Rockhopper Penguin 18
Magellanic Penguin 21
King Penguin 23
Imperial Shag
Brown Skua
23
24
Black-browed Albatross 25
Southern Giant Petrel
Environment
Anthropogenic and other impacts at colonies
28
31
31
Discussion 33
Acknowledgements 38
References 38
Appendix 1: Count Information 40
Appendix 2: Gentoo Penguin count data 41
Appendix 3: Southern Rockhopper Penguin count data 42
Appendix 4: Magellanic Penguin survey data 43
Appendix 5: Black-browed Albatross and Southern Giant Petrel count data 44
Appendix 6: Marine plastics at FISMP sites 45

5
Introduction The Falkland Islands support seabird populations that are of global importance, both numerically,
and in terms of conservation status. An estimated 72 % of the global population of Black-browed
Albatross (Thalassarche melanophris) breeds in the Falkland Islands (ACAP 2017, BirdLife
International 2016). This species was down listed to ‘Least Concern’ on the IUCN Red List in 2017.
The Falklands are also home to approximately 36 % of the world’s population of Southern
Rockhopper Penguin (Eudyptes c. chrysocome) (Red Listed as ‘Vulnerable’) and approximately 30 %
of the world's population of Gentoo Penguin (Pygoscelis papua). The Gentoo Penguin was recently
down listed from ‘Near Threatened’ to ‘Least Concern’ (IUCN 2017). Accordingly, fluctuations in
local populations may substantially affect the global conservation status of these species.
Falklands Conservation initiated the Falkland Islands Seabird Monitoring Programme (FISMP) in
1989/90. Its initial purpose was to monitor the diet and population dynamics of Gentoo Penguin,
Magellanic Penguin (Spheniscus magellanicus), Southern Rockhopper Penguin, and Black-browed
Albatross. Diet sampling was discontinued in 2003. Since then, population monitoring has
continued on an annual basis with some changes taking place to the original format, such as the
addition and loss of some monitoring sites and the addition of other species.
Currently the FISMP monitors Gentoo Penguin (Pygoscelis papua) at 11 sites (17 colonies),
Southern Rockhopper Penguin (Eudyptes c. chrysocome) at five sites (14 colonies) and Magellanic
Penguin (Spheniscus magellanicus) at one site (one colony). King Penguin (Aptenodytes
patagonicus) and Black-browed Albatross (Thalassarche melanophris) are monitored at single, but
key sites, in terms of population numbers. Southern Giant Petrel (Macronectes giganteus) is
monitored at one site (two colonies), Imperial Shag (Phalacrocorax atriceps) at three sites (four
colonies) and Brown Skua (Catharacta antarctica) at one site (four colonies).
Based on the last Island Wide Census in 2010, monitored colonies made up approximately 18 % of
the Falklands’ breeding population of Gentoo Penguin (estimated at 132,000 breeding pairs; Baylis
et al. 2013a), approximately 2.6 % of the Falklands’ breeding population of Southern Rockhopper
Penguin (estimated to be 319,000 breeding pairs; Baylis et al. 2013b) and approximately 0.5 % –
0.6 % of the total Falklands’ breeding population of Black-browed Albatross (estimated to be
between 475,500 and 535,000 breeding pairs; Wolfaardt 2012). The monitoring site for Southern

6
Giant Petrel made up approximately 8.6 % of the total Falklands’ breeding population based on the
latest 2015/16 Island-wide census (Stanworth & Crofts 2017). The only population estimate for
Magellanic Penguin in the Falkland Islands is for 76,000 to 142,000 pairs (Woods and Woods 1997).
As a very rough estimate, the current monitoring site is likely to represent less than one percent of
this. Woods and Woods (1997) also provide the only population estimates for Imperial Shag
(45,000 – 85,000 pairs) and Brown Skua (5,000 – 9,000 pairs) for the Falkland Islands. On this basis
the FISMP monitors approximately between 2 % and 4 % of the Imperial Shag and Brown Skua
breeding populations. The current monitoring site for King Penguin at Volunteer Point is likely to
represent over 95 % of the breeding population in the Falklands. The relatively small numbers of
King Penguins at other locations are not systematically monitored.
The information gathered as a result of the FISMP has contributed to the identification of local,
regional and global conservation priorities and provides information necessary for IUCN Red Listing
assessments. The FISMP provides an important long-term data set on population trends and
breeding success, which further contributes to other areas of research.
This report details monitoring results from the 2020/2021 breeding year as well as contributed data
collected by landowners at Dunbar and Bleaker Island settlements.

7
Materials and methods
Within this report, breeding periods are referred to by the year in which they commenced, for
example; 2020 describes the 2020/2021 austral summer breeding period. ‘Location’ or ‘site’ refers
to a named geographical area, such as a settlement or ‘camp’, and this may support more than one
colony. For example, Johnsons Harbour has Gentoo Penguin colonies at Volunteer Green, Lagoon
Sands and at Cow Bay; Race Point has Gentoo Penguin colonies at Rookery Sands and Fanning
Harbour. ‘Colony’ refers to a group or groups (sub-colonies) of birds in close proximity, typically
within 50-100 m of each other and/or with the same or proximate access from the sea. Monitoring
locations are shown in Figure 1, exact grid references are provided in Appendices 2 to 5.
Fi
gure 1: Map of the FISMP monitoring locations.
The work was carried out by Falklands Conservation under Falkland Islands Government Research
Licence No: R40/2018.
In addition to those counts undertaken by Falklands Conservation (below), counts have also been
undertaken at Dunbar (Black-browed Albatross) and Bleaker Island (Southern Giant Petrel,
Southern Rockhopper and Gentoo Penguin) by the landowners. Any variation from the standard
methodology is reported in the text.

8
Gentoo Penguin
Apparently Occupied Nests (AON) of Gentoo Penguins were counted during egg-laying, over the
period 2 - 19 November 2020 to provide a breeding pair estimate. The number of chicks was
counted before fledging (Pre-Fledged Chicks (PFC)), during the period 4-20 January 2021, and used
to estimate breeding success. The monitoring locations (colonies in brackets if more than one)
were:
Johnsons Harbour (Volunteer Green, Cow Bay and Lagoon Sands);
Race Point (Fanning Harbour and Rookery Sands);
Sea Lion Island;
New Haven;
Bull Point (Bull Point and Bull Roads);
Motley Point;
Low Bay;
Bertha's Beach;
Fox Point;
Pleasant Roads; and
Steeple Jason (House and Neck).
Southern Rockhopper Penguin
Southern Rockhopper Penguin breeding pair counts (using AON) were performed from the
commencement of egg-laying during the period 27 October to 20 November 2020. Chick counts
(PFC) were carried out over 6-21 January 2021. A new study colony (Steeple Jason S5 Finger) was
added in 2019. The locations (colonies in brackets if more than one) were:
Steeple Jason (Northwest Flat, Northwest Ridge, S5Tip, Southeast Study and S5 Finger);
Sea Lion Island (Rockhopper Point);
Race Point (Fanning Head North and Fanning Head South);
Berkeley Sound (Diamond Cove, Rugged Hill and Eagle Hill); and
Port Stephens (Stephen’s Peak).
Magellanic Penguin
Transects were carried out every 100 m (approximately) from Engineer Point to the Car Park at
Gypsy Cove on 4 December 2020. Transects were 4 m wide, starting from the shore line, and
running perpendicular to it, for a distance 40 m further than the last burrow found. Using a pole
with torch attached, burrows within the transect were categorised as either ‘occupied’,
9
‘unoccupied’ or ‘unknown’ if it was not possible to determine occupancy. Burrow density was
derived from each transect as number of burrows in the transect area from the start of the
transect to as far as the last recorded burrow.
King Penguin
The majority (around 95 %) of the Falkland Islands population of King Penguins is found at
Volunteer Point. This population has been monitored annually since the onset of the FISMP, with
the first independent counts having been performed earlier, since 1980. A few individuals also
breed at nearby Lagoon Sands. The breeding cycle of King Penguins extends over a year and
consequently is not synchronised to summer breeding as with the other penguin species. The
chosen unit of measure for King Penguin is pre-fledged chicks (PFC) that have survived the winter.
This is not a measure of the total number of chicks produced (as some will have perished over the
winter), nor is it an exact indicator of the number of breeding pairs. The counts were conducted on
19 November 2020.
Imperial Shag
Counts of Imperial Shag (AON) were conducted at Motley Point (14 January 2021), Berkeley Sound
(Eagle Hill and Rugged Hill on 9 January 2021) and Steeple Jason (21 January 2021). Due to the
variable breeding times of Imperial Shag, numbers derived represented the numbers of active
nests during the January monitoring period.
Brown Skua
Brown Skua counts were initiated on Steeple Jason in 2016. Counts of Apparently Occupied
Territory (AOT) were conducted at Steeple Jason between 18 and 20 January 2021. Due to the
restricted monitoring window at Steeple Jason AOTs were classified by a territory with egg/s and or
chick/s observed or an adult sitting tightly on a nest and assumed to be incubating/brooding. All
territories were recorded with a GPS position.
Black-browed Albatross and Southern Giant Petrel
Counts of Black-browed Albatross and Southern Giant Petrel breeding pairs (AON) at Steeple Jason
were performed between 3 and 9 November 2020, and in order to estimate breeding success,
chicks (PFC) from these colonies were counted between 1 and 4 April 2021. Two colonies of
Southern Giant Petrel and six sub-colonies of Black-browed Albatross were monitored. Since 2019
the Black-browed Albatross Penthouse colony chick numbers were no longer incorporated into the

10
site average breeding success due to its small size, this was the case again in 2020. All counts since
2004 were re-calculated to exclude the Penthouse colony. A new study colony (Steeple Jason S5
Finger) for Black-browed Albatross was added in 2019.
Landowner Counts
Counts of Black-browed Albatross breeding pairs at Penguin Point South were not achieved in
2020. Counts were made at Bleaker Island by the landowner for Gentoo Penguin (10 November
20120 and 15 January 2021), Southern Rockhopper Penguin (25 November 2020 and 20 January
2021) and Southern Giant Petrel chicks (25 February 2021).
Count methods
Whenever possible, the total counts (using the above count units) were made at individual
locations, whilst in the field, by paired observers (Appendix 1). The decision to utilise photo
counting was made on an individual colony/sub-colony basis, where it was felt that a paired tally
count in the field would not provide a reliable estimate. This was generally due to the size of some
colonies (e.g. Steeple Jason Neck).
In some instances, for chick counting, large numbers of highly mobile chicks had merged sub-
colonies over large areas. Here again, it was felt, that reliable estimates could not be derived and
the decision was made to count the other sub-colonies that had remained distinct. These counts
still related to individual breeding pair numbers from the counts earlier in the summer, and from
this breeding success could be derived; in essence a sub-sampling technique. The various
methods, or combination of methods, employed for each location/colony are presented in
Appendices 2 to 5. Grid references of individual colonies (due south of the approximate centres,
5m from the colony edge) were taken where possible and are provided in Appendices 2 to 5.
Field counts
Whenever possible, counts were made at least three times by two or more observers using tally
counters in accordance with standard methods (Thompson & Riddy 1993). These counts (and
those few of reduced replication) were subsequently averaged to give estimates of breeding pair
and chick numbers. These counts are referred to as ‘Tally repeated’. Counts at Penguin Point
South, Dunbar and Bleaker Island were single counts by a single observer. In some instances,
groups or count unit numbers were so small that it was felt the number of count units could
confidently be counted without error on a single occasion. These counts are referred to as ‘Tally

11
agreed’. Breeding success is expressed on graphs as the number of chicks per breeding pair for
species with two or more chicks and as a percentage for those with one chick.
GoPro Counts
A GoPro HD Hero camera was pole mounted and held aloft from a vantage point to a height of
approximately 5 m whilst a minimum of three photos were taken in 1920x1080 resolution in jpeg
format giving a 127° field of view. Where colonies were too large to fit into a single photograph,
markers or natural features were used to subdivide the colonies into sections that could be
photographed. There was no evidence of disturbance in the colonies from using this technique.
Images were downloaded and counted using ImageJ software. Counts were repeated a minimum
of four times by two counters and the average taken. These are referred to in Tables as ‘GoPro
counts’.
Drone counts
DJI Phantom 4 drones were trialled in 2016 to capture aerial images of colonies under FIG Research
Licence No: R13/2016. All operations were conducted at a minimum launch distance of 15 m from a
colony and reaching a minimum flying altitude of 15 m when directly over colonies. Greater
caution was used when operating the drone at flying seabird colonies. Drone use is prohibited by
the landowner at Volunteer Point and therefore was not used at this site. The inbuilt camera
produces 4000×3000 resolution jpeg format images giving a 94° field of view. There was evidence
that birds were aware of the drone but no evidence to suggest disturbance of breeding birds in the
colonies using this method (Crofts 2017). Images were downloaded and counted using ImageJ
software. Counts were repeated a minimum of four times by two counters and the average taken.
These are referred to in Tables as ‘Drone counts’.
Comparison of differing counting methods
Multiple count data for the same colony using two or more of the methods were stored for future
comparative work. For the purpose of this report, where multiple counting methods exist for the
same colony, the data used were those that exhibited the least error between counts. Where
possible the same counting method was used to calculate breeding success for each colony.

12
Environment
Global environmental conditions and sea surface temperatures are influenced by the natural
climate phenomenon of the El Niño Southern Oscillation (ENSO). ENSO is the dominant feature of
climate variability on inter-annual timescales (for description see:
https://www.metoffice.gov.uk/research/climate/seasonal-to-decadal/gpc-outlooks/el-nino-la-
nina/enso-description). The ENSO is used to describe the environmental proxy for the FISMP
reporting period. Data and forecasts are taken from the Climate Prediction Center. Any atypical
oceanographic features observed at the Falkland Islands are sourced from personal
communications with the Falkland Islands Fisheries Department.
Anthropogenic and other impacts at colonies
The first measures of anthropogenic and other impacts were introduced to FISMP in 2017. The
measures currently involve recording:
1) Direct evidence of marine plastics observed in and around the colonies;
2) Any signs of oiling to seabirds;
3) Evidence of entanglement or ingestion of fishing gear or other items;
4) External signs or symptoms of disease.
13
Results
Gentoo Penguin
Breeding pairs
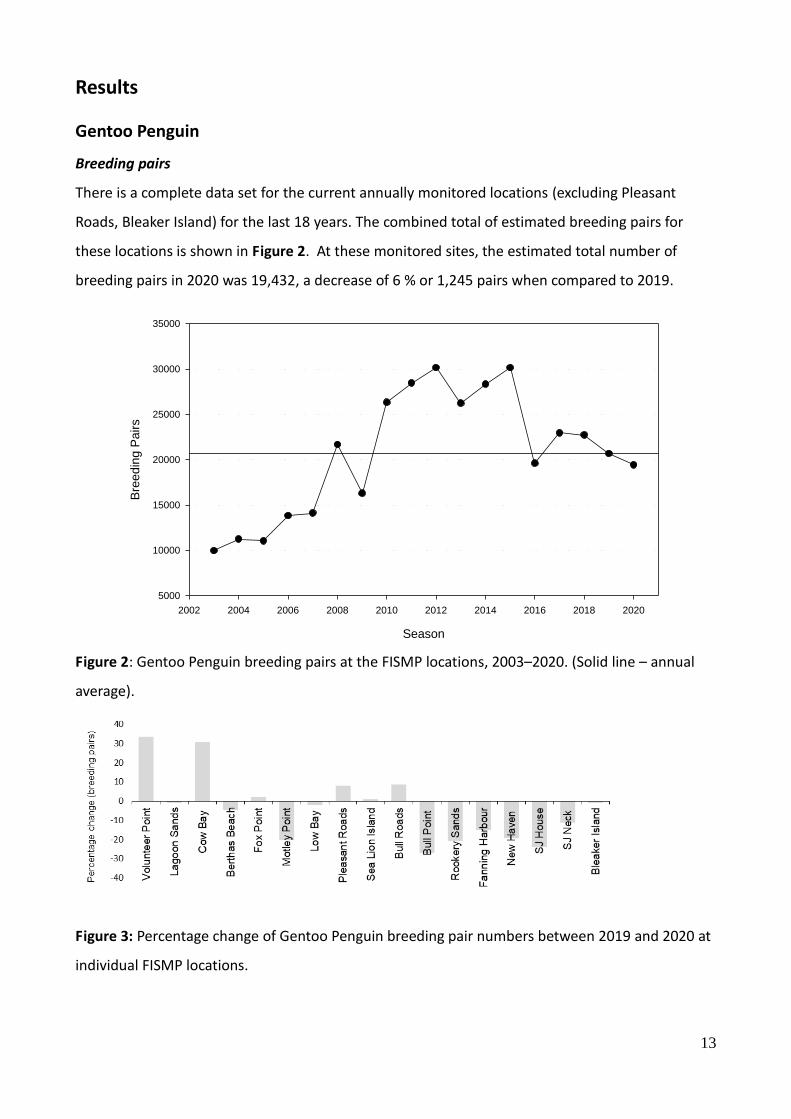
There is a complete data set for the current annually monitored locations (excluding Pleasant
Roads, Bleaker Island) for the last 18 years. The combined total of estimated breeding pairs for
these locations is shown in Figure 2. At these monitored sites, the estimated total number of
breeding pairs in 2020 was 19,432, a decrease of 6 % or 1,245 pairs when compared to 2019.
Season
2002 2004 2006 2008 2010 2012 2014 2016 2018 2020
Bre
edin
g P
airs
5000
10000
15000
20000
25000
30000
35000
Figure 2: Gentoo Penguin breeding pairs at the FISMP locations, 2003–2020. (Solid line – annual
average).
Figure 3: Percentage change of Gentoo Penguin breeding pair numbers between 2019 and 2020 at
individual FISMP locations.

14
Figure 4: Gentoo Penguin breeding pairs for
locations in Northeast Falkland.
Figure 5: Gentoo Penguin breeding pairs for
locations in Mideast Falkland.
Figure 6: Gentoo Penguin breeding pairs for
locations in Southeast Falkland.
Figure 7: Gentoo Penguin breeding pairs for
locations on Falkland Sound.
Season
2000 2005 2010 2015 2020
Bre
ed
ing
pa
irs
0
1000
2000
3000
4000
5000
6000
7000
Steeple Jason House
Steeple Jason Neck
Season
2000 2005 2010 2015 2020
Bre
edin
g P
airs
1000
1500
2000
2500
3000
3500
Figure 8: Gentoo Penguin breeding pairs for
locations on Steeple.
Figure 9: Gentoo Penguin breeding pairs for Bleaker
Island.

15
Of all the Gentoo Penguin colonies monitored (n=17), eleven (65 %) showed a decrease in breeding
pair numbers when compared with 2019. (Figure 3).
Regionally, two of the Gentoo Penguin colonies in the Northeast region showed a notable total
increase when compared to breeding pair numbers from 2019, with Volunteer Green increasing by
34 %, and Cow Bay by 31 % (Figure 4). Gentoo Penguin breeding pairs for locations in Mideast
Falkland varied with Pleasant Roads showing the largest increase at 8 %, and Motley Point showing
the largest decrease at 20 % when compared with 2019. (Figure 5). The largest change in pair
numbers within the Southeast Gentoo Penguin colonies was a decrease at Bull Point at 27 %. Bull
Roads increased by 8 % and Sea Lion Island by 1 %. Bleaker Island decreased marginally by 1 %
(Figure 6 and 9). Falkland Sound colonies all demonstrated notable decreases with Rookery Sands
down by 21 %, New Haven down by 19 %, and Fanning Harbour down by 15 % (Figure 7). Both
colonies at Steeple Jason decreased for a fourth consecutive year with the House down by 24 %
and the Neck by 11 % (Figure 8).
Breeding success
The average estimated breeding success for all colonies was 1.14 ± 0.21 chicks/pair in 2020; an
increase from 0.94 ± 0.32 chicks/pair in 2019. The 2020 breeding performance was above the
FISMP long-term annual average (0.95 chicks/pair) and had improved year on year from the 2017
low of 0.5 ± 0.21 chicks/pair (Figure 10).

16
Season
1992 1996 2000 2004 2008 2012 2016 2020
Bre
edin
g S
uccess (
chic
ks/p
air)
0.2
0.4
0.6
0.8
1.0
1.2
1.4
1.6
1.8
Figure 10: Gentoo Penguin breeding success at FISMP locations, 1990-2020.
(Solid line – annual average). Standard Error bars show error about the overall mean by site means,
and do not incorporate error about individual sites.
Breeding success varied between locations from a minimum of 0.79 chicks/pair at Steeple Jason
House and 0.80 chicks/pair at Rookery Sands and Steeple Jason Neck, to a maximum of 1.40
chicks/pair at New Haven (Figures 11 to 15). On the whole, breeding success for the majority of
the sites reflected an improvement when compared to the previous five seasons.
At Steeple Jason, the FIMSP data suggests an apparent long-term trend of decreasing breeding
success for both the Gentoo Penguin colonies between 2004 and 2018 (Figure 15). In 2020, the
average breeding success for Steeple Jason was 0.80 ± 0.01 chicks/pair; only the second year since
2012 that breeding success reflected the long-term annual average (0.8 chicks/ pair) for this site.

17
Season
1990 1995 2000 2005 2010 2015 2020
Bre
edin
g S
uccess (
chic
ks/p
air)
0.2
0.4
0.6
0.8
1.0
1.2
1.4
1.6
1.8
2.0Volunteer Green Lagoon Sands Cow Bay
Figure 11: Gentoo Penguin breeding success for
locations in Northeast Falkland.
Figure 12: Gentoo Penguin breeding success for
locations in Mideast Falkland.
Figure 13: Gentoo Penguin breeding success for
locations in Southeast Falkland.
Figure 14: Gentoo Penguin breeding success for
locations on Falkland Sound.
Season
2004 2006 2008 2010 2012 2014 2016 2018 2020
Bre
ed
ing
su
cce
ss (
ch
icks/p
air
)
0.0
0.5
1.0
1.5
2.0
Steeple Jason HouseSteeple Jason Neck
Figure 15: Gentoo Penguin breeding success for
locations on Steeple Jason.

18
Southern Rockhopper Penguin Breeding pairs
Five locations have been monitored annually since 2005 (Race Point, Steeple Jason Southeast,
Steeple Jason Northwest, Sea Lion Island and Berkeley Sound). At these sites, the combined total
estimate of the number of breeding pairs was 4,926 in 2020; this represented a decrease of 1 %
from the 4,984 breeding pairs estimated in 2019 (Figure 16).
Season
2004 2006 2008 2010 2012 2014 2016 2018 2020 2022
Bre
edin
g P
airs
3000
4000
5000
6000
7000
8000
Figure 16: Southern Rockhopper Penguin breeding pairs at FISMP locations 2005-2020. (Solid line –
annual average).
Figure 17: Percentage change of Southern Rockhopper Penguin breeding pair numbers between
2019 and 2020 at individual FISMP locations.

19
Of the ten monitored colonies, 5 showed decreased breeding pair numbers when compared to
2019; Fanning Head South (22 %) Steeple Jason Southeast (14 %), Steeple Jason S5Tip (6 %),
Steeple Jason S5 Finger (4 %), and Bleaker Island (2 %). The remaining 5 colonies showed increased
breeding numbers; Port Stephens (61 %), Steeple Jason Northwest (5 %) Fanning Head North (5 %),
Berkeley Sound (4 %) and Sea Lion Island (1 %) (Figure 17).
The largest increase in breeding pair numbers was seen at Port Stephens at 61 % (491 pairs). The
largest decreases in breeding pair numbers was 22 % (100 pairs) at Fanning Head South and
Steeple Jason Southeast at 14 % (111 pairs). For the remaining sites, values were similar to those of
2019. (Figures 18 to 21).
Season
1990 1995 2000 2005 2010 2015 2020
Bre
ed
ing
Pa
irs
0
500
1000
1500
2000
2500
3000
3500
4000
Fanning Head
Berkeley Sound
Figure 18: Southern Rockhopper Penguin breeding
pairs for locations in mainland East Falkland.
Figure 19: Southern Rockhopper Penguin breeding
pairs for locations on Steeple Jason
Season
1990 1995 2000 2005 2010 2015 2020
Bre
ed
ing P
airs
0
500
1000
1500
2000
2500
3000
3500
Sea Lion Island
Port Stephens
Season
2000 2005 2010 2015 2020
Bre
ed
ing
Pa
irs
600
650
700
750
800
850
900
Figure 20: Southern Rockhopper Penguin breeding
pairs for locations in South Falklands.
Figure 21: Southern Rockhopper Penguin breeding
pairs for Bleaker Island.
20
Breeding success
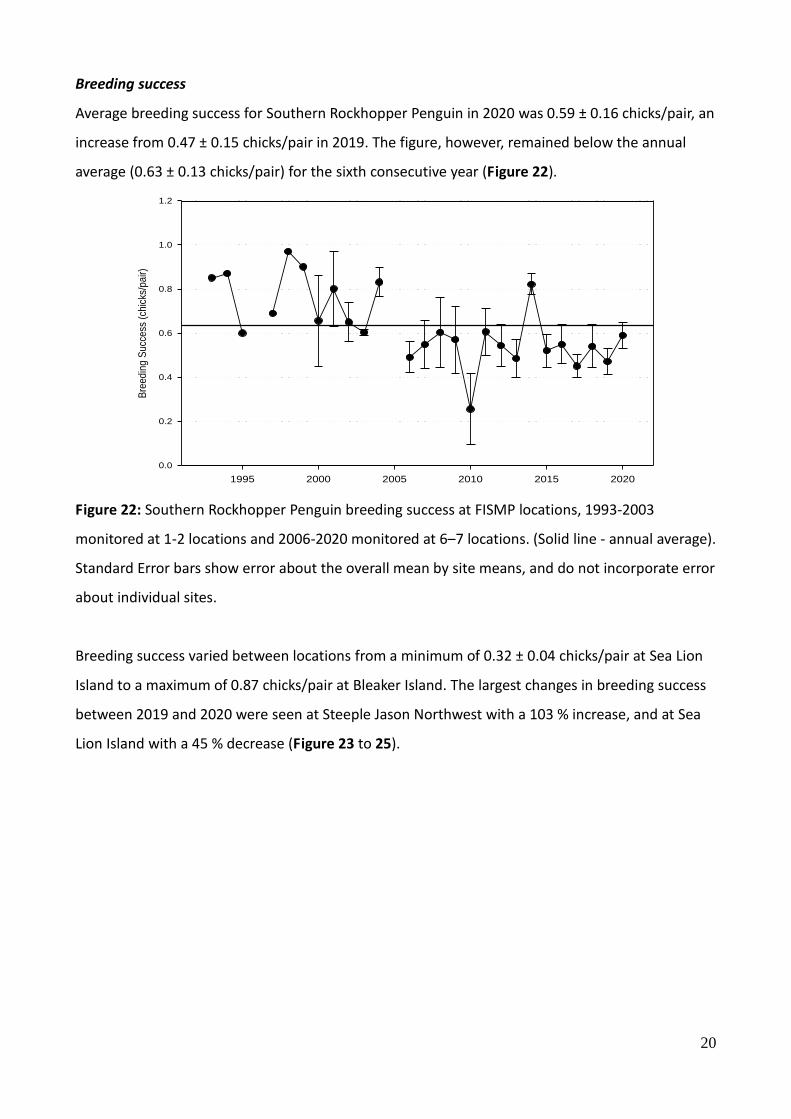
Average breeding success for Southern Rockhopper Penguin in 2020 was 0.59 ± 0.16 chicks/pair, an
increase from 0.47 ± 0.15 chicks/pair in 2019. The figure, however, remained below the annual
average (0.63 ± 0.13 chicks/pair) for the sixth consecutive year (Figure 22).
Season
1995 2000 2005 2010 2015 2020
Bre
ed
ing
Su
cce
ss (
chic
ks/p
air)
0.0
0.2
0.4
0.6
0.8
1.0
1.2
Figure 22: Southern Rockhopper Penguin breeding success at FISMP locations, 1993-2003
monitored at 1-2 locations and 2006-2020 monitored at 6–7 locations. (Solid line - annual average).
Standard Error bars show error about the overall mean by site means, and do not incorporate error
about individual sites.
Breeding success varied between locations from a minimum of 0.32 ± 0.04 chicks/pair at Sea Lion
Island to a maximum of 0.87 chicks/pair at Bleaker Island. The largest changes in breeding success
between 2019 and 2020 were seen at Steeple Jason Northwest with a 103 % increase, and at Sea
Lion Island with a 45 % decrease (Figure 23 to 25).

21
1990 1995 2000 2005 2010 2015 2020
Bre
ed
ing S
uccess (
chic
ks/p
air)
0.2
0.4
0.6
0.8
1.0
1.2
Fanning Head Berkeley Sound
Figure 23: Southern Rockhopper Penguin breeding
success for locations in mainland East Falkland.
Figure 24: Southern Rockhopper Penguin breeding
success for locations on Steeple Jason.
1995 2000 2005 2010 2015 2020 2025
Bre
ed
ing S
uccess (
chic
ks/p
air)
0.0
0.2
0.4
0.6
0.8
1.0
1.2
Sea Lion IslandPort Stephens
Figure 25: Southern Rockhopper Penguin breeding
success for locations in south Falklands.
Magellanic Penguin The location and extent of transects and the estimated occupied burrow densities at Gypsy Cove
are shown in Figure 26. Thirty transects were carried out between Engineer Point and the Car Park
at Gypsy Cove, of which, half (n = 15) contained occupied Magellanic Penguin burrows (yellow,
orange, dark orange and red coloured bars on Figure 26). Burrow distribution was closely
associated with tussac grass occurrence.
Where burrows occurred, estimated densities ranged from 6,750 to 48,866 occupied burrows
/km², with an average density of 9,220 ± 3,704 /km² - slightly higher than the previous year of
8,184 ± 6,529 /km². Taking all burrows for which there was no uncertainty over occupancy status (n
= 111), as per surveys prior to 2012, gave an occupancy rate of 32.4 %. This occupancy rate was
slightly below the seasonal average for the site (Figure 27).

22
Figure 26: Transect locations for the Magellanic Penguin survey at Gypsy Cove, 2020 (image from
Google Earth). Yellow (≥ 0 and ≤ 10,000 breeding pairs/km²), light orange (> 10,000 and ≤ 20,000
breeding pairs/km²), dark orange (> 20,000 and ≤ 30,000 breeding pairs/km²) and red (> 30,000
breeding pairs/km²) lines show minimum breeding pair densities between the shore and the
furthest burrow from the shore; light grey lines show the extent of each transect where no
burrows were present, dark grey lines where only unoccupied burrows were recorded.
Figure 27: Magellanic Penguin burrow occupancy rate at Gypsy Cove, 2002 -2020.

23
King Penguin The number of pre-fledged chicks at Volunteer Point in November 2020 was 866, this was a 5 %
increase from 824 chicks in 2019 (Figure 28). The numbers of pre-fledged chicks at Volunteer Point
continues to show an overall increasing trend, despite intermittent fluctuations.
Season
1980 1985 1990 1995 2000 2005 2010 2015 2020
Pre
-fle
dge
d c
hic
ks
0
200
400
600
800
1000
Figure 28: King Penguin pre-fledged chick numbers at Volunteer Point, 1980-2020.
Imperial Shag
Imperial Shag monitoring was initiated in 2013 at two colonies and expanded to four colonies in
2016. Numbers of Adult on Nests (AON) of Imperial Shags were counted in January 2021; the
results at the colonies continues to be variable over sites and seasons (Figure 29).
Season
2012 2014 2016 2018 2020
Adu
lts o
n n
ests
(Jan
)
0
100
200
300
400
500
600
700
Motley Point Eagle Hill Rugged Hill Steeple
Figure 29: Imperial shag Apparently Occupied Nests (AON), 2013-2020.

24
Brown Skua With 244 Apparently Occupied Territories (AOT) counted in 2020 there was an increase (8 %) in the
total numbers of Brown Skua AOT from 2019 at Steeple Jason. A broad measure of productivity
(the ratio of eggs/chicks per adult territory) was 1.45. This was higher than recorded in 2019
(Figure 30). In 2020, of the site total, the Northwest colony had the largest number of AOT (43 %)
followed by Neck (34 %), South (12 %), House (9 %) and South of Ridge (1%).
Figure 30: Brown Skua Apparently Occupied Territories (AOT) and productivity at Steeple Jason,
2016-2020.

25
Black-browed Albatross Breeding pairs
The estimated number of breeding pairs of Black-browed Albatross at five of the Steeple Jason sites
monitored since 2005 was 3,179 in 2020; this represented a 1 % decrease from 3,206 pairs in 2019
(Figure 31).
Figure 31: Black-browed Albatross breeding pairs at FIMSP sites, Steeple Jason, 2005-2020.
(Solid line – annual average).
Figure 32: Black-browed Albatross breeding pairs at individual FISMP sites at Steeple Jason, 2000-
2020.

26
Steeple Jason Finger, added in 2019, is now the largest monitored colony with 2,355 ± 1.4 breeding
pairs in 2020, and demonstrated a small decrease of pair numbers (3 %) when compared with
2019. Three of the long-term monitored colonies at Steeple Jason also showed decreases in
breeding pair numbers when compared with 2019; S5Tip (11 %), Northwest Ridge (10 %) and
Penthouse (3 %). The NW Flat and Study Area showed small increases in breeding pairs at 7 % and
3 % respectively (Figure 32).
Breeding success
Overall breeding success for the four long-term monitored colonies (excluding the Penthouse
colony) was 49 % ± 7.5 chicks/pair in 2020 (Figure 33). Breeding success remained below the
annual average (53 %) for the sixth consecutive year.
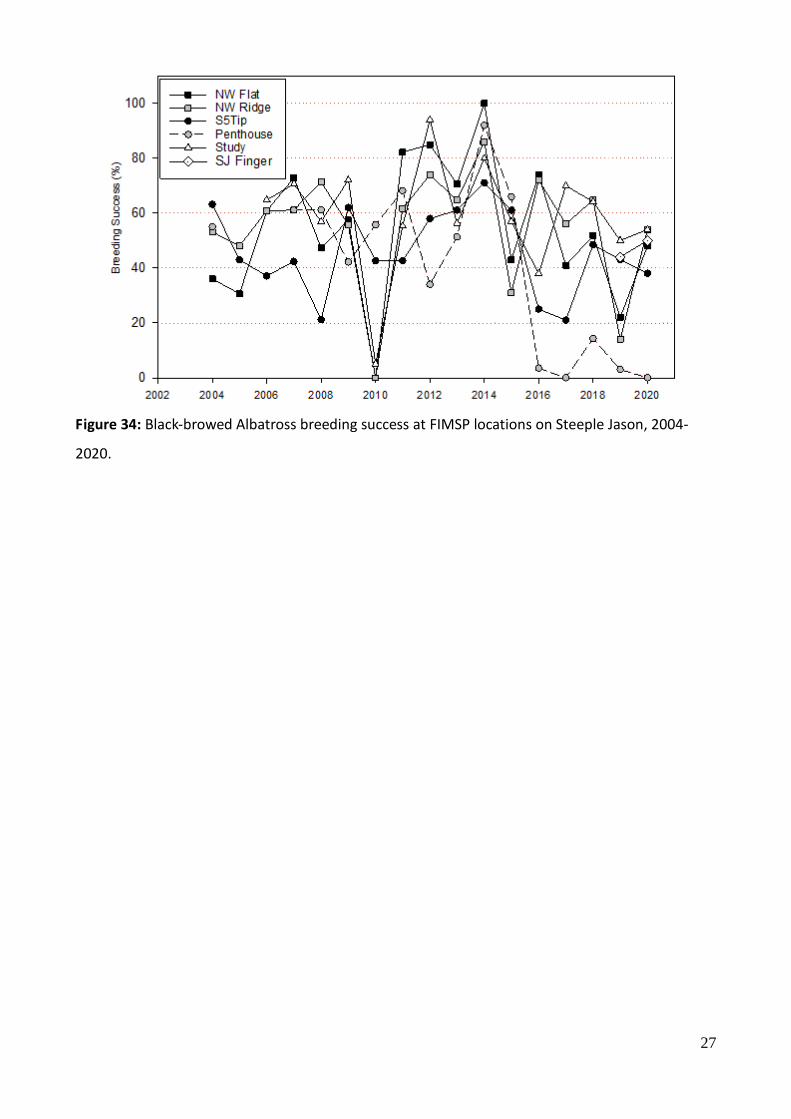
Breeding success was highly varied between the individual colonies; NW Ridge (54 %), SJ Finger (50
%), NW Flat (48 %), S5Tip (38 %) and the Penthouse (0 %) (Figure 34).
Breeding success at the Penthouse colony for the last 4 years has been notably low. In 2020 and
2017 the colony experienced complete breeding failure (0 %) and in 2016, 2018 and 2019 chick
success was 3.5 %, 14 % and 3 % respectively (Figure 34).
Figure 33: Black-browed Albatross breeding success at FISMP sites on Steeple Jason, 2004-2020
(excluding Penthouse colony for all years) and West Point and Saunders Island, 1989-2001.
Standard Error bars show error about the overall mean by colony means and do not incorporate
error about individual sites. (Solid line – annual average).
27
Figure 34: Black-browed Albatross breeding success at FIMSP locations on Steeple Jason, 2004-
2020.

28
Southern Giant Petrel Breeding pairs
The overall number of breeding pairs of Southern Giant Petrel at monitored colonies on Steeple
Jason increased by 6 % from an estimated 1,771 pairs in 2019 to 1,854 pairs in 2020. The Neck
colony increased by 17 %, whilst the NW colony decreased by 57 % when compared with 2019
(Figure 36).
Figure 36: Southern Giant Petrel breeding pair numbers at FISMP sites on Steeple Jason, 2000-
2020.
Breeding success
In 2020, average breeding success of the two colonies at Steeple Jason was 15 ± 19.8 % (Figure 37).
The Neck colony breeding success increased from 12 % in 2019 to 29 % in 2020, whilst the NW
colony decreased from 3 % to 1 %; the latter was very near to complete breeding failure, the fourth
time within five consecutive years (Figure 38). Overall breeding success for 2020 remained below
the long-term annual average (32 %) for this site.

29
Season
2002 2004 2006 2008 2010 2012 2014 2016 2018 2020
Bre
ed
ing
Su
cce
ss (
%)
0
20
40
60
80
100
Figure 37: Southern Giant Petrel average breeding success at FISMP sites on Steeple Jason, 2004-
2020. Standard Error bars show error about the overall mean by colony means and do not
incorporate error about individual sites. (Solid line – annual average).
Season
2002 2004 2006 2008 2010 2012 2014 2016 2018 2020
Bre
edin
g S
uccess (
%)
0
20
40
60
80
100
Steeple Jason NW Steeple Jason House Steeple Jason Neck
Figure 38: Southern Giant Petrel breeding success at FISMP sites on Steeple Jason, 2004-2020.
During 2020, six Southern Giant Petrel nests were observed from drone imagery near the Black-
browed Albatross Northwest Flat colony; this is the seventh year that Southern Giant Petrel have
nested in this area although all nests subsequently failed. A further twenty nests were observed
along the Northwest track (the historic House colony) with nine pre-fledged chicks observed in
April 2021.

30
Bleaker Island pre-fledged chick count
The number of Southern Giant Petrel chicks on Bleaker Island increased from 80 chicks in 2019 to
142 chicks in 2020 (Figure 39).
Season
2000 2005 2010 2015 2020
Nu
mb
er
of
ch
icks
50
100
150
200
250
300
350
Figure 39: Southern Giant Petrel chick counts at Bleaker Island, 2001-2020.

31
Environment
Neutral El Niño Southern Oscillation (ENSO) and La Niña conditions dominated the period of 2020
to 2021 (Figures 40). El Niño Southern Oscillation events (ENSO) and the subsequent opposite, La
Niña, have major climatic impacts, especially on oceanic habitats, affecting breeding success of
both land and seabirds. In 2015-16 a ‘Super’ El Niño event occurred and the FISMP subsequently
detected a decline in breeding numbers of seabirds, particularly Gentoo and Southern Rockhopper
Penguins. FIMSP monitoring between 2016 and 2020 revealed that the breeding pair numbers of
both Gentoo Penguin and Southern Rockhopper Penguins have remained broadly static under
subsequent fluctuating weak to moderate El Niño and El Niña conditions.
Figure 40: Multivariate ENSO Index
The multivariate ENSO index, abbreviated as MEI, is a method used to characterize the intensity of a South-ern Oscillation (ENSO) event. Given that ENSO arises from a complex interaction of a variety of climate sys-tems, MEI is regarded as the most comprehensive index for monitoring ENSO since it combines analysis of multiple meteorological and oceanographic components.
Anthropogenic and other impacts at colonies
Marine plastic
Marine plastic was observed at the Steeple Jason Black-browed Albatross NW Ridge and Study
Area, and the Gentoo Penguin colony at Lagoon Sands. Items included: blue plastic sheeting
(commercial fishing boat); various ropes/ twines (vessel) and plastic drinking bottles either near to,
or built within nests. For full details see Appendix 6.

32
Oiling
No oiled birds were observed at the FISMP sites in 2020
Marine entanglements
No marine entanglements were observed at the FISMP sites in 2020
Disease
Towards the end of the 2020 season (February-March) Avian Pox in Gentoo Penguin was reported,
and subsequently confirmed (APHA Laboratories, UK), at one site to the west and one site to the
south of the Falklands.

33
Discussion
The 2020 estimated numbers of breeding pairs of Gentoo Penguin at the FISMP sites showed a 6 %
decrease when compared with the previous year, and continued to represent a major reduction
(36 %) from the most recent breeding pair maximum estimate recorded in 2015. The 2020
breeding performance was above the FISMP long-term annual average and had improved year on
year from 2017.
The overall FISMP trend showed a steady increase of breeding pair numbers between 2003 and
2015 and reflecting an island-wide increase (105 %) between 2005 and 2010 (Baylis et. al 2013a).
In 2016, FIMSP reported a notable decrease in breeding pair numbers, likely (at least partially), due
to birds choosing to defer breeding under the unfavourable environmental conditions during a
period that coincided with a strong El Niño Southern Oscillation event (Crofts & Stanworth 2017).
In 2017 a partial recovery in breeding numbers was likely explained by birds re-entering the
breeding population as environmental conditions had improved. However, current estimates show
no clearly defined recovery period in breeding pair numbers since 2017. An unknown, but probably
significant, proportion of the adult and juvenile population were likely permanently lost through
mortality in 2016.
Globally, the Gentoo Penguin population have been growing, particularly along the Western
Antarctic Peninsula (Herman et al. 2020), with the Falklands comprising 30 % of the estimated
global population in 2010. As Gentoo Penguins at the Falkland Islands are resident all year around
and remain within the Falkland waters, localised parameters are reflected by the strong regional
variability of colony trends. In the northeast of the Islands, Volunteer Green and Cow Bay colonies
continue to show a less fluctuating more positive trajectory (aside from the 2016 drop which
affected most colonies markedly). Colonies in the south and east appear prone to more regular and
larger fluctuations.
The potentially complex influences of oceanographic parameters affecting prey availability on
breeding pair numbers (Baylis et al. 2011; Handley et al. 2016), as well as disease and predation
incidence may contribute to this regional variability, and indicate that some colonies more than
Gentoo Penguin: IUCN status: Least Concern (2018)
Falkland Islands breeding pair estimate: 132,321 ± 2,015 in 2010 (30 % of global population)
The FISMP 2020 annual change in breeding pair numbers: Decrease (6 %)

34
others may be vulnerable to declines. Gentoo Penguins exhibit adaptive traits including more
flexibility in breeding phenology, a high reproductive output with an early onset of breeding
maturity around the age of 3 years, and in a fluctuating environment these traits are likely to offer
some resilience and ability to recover from population declines (Pistorious et al. 2010). Overall
breeding performance of Gentoo Penguins at FISMP sites, had improved year on year from 2017 to
2020, a positive indication for the potential increase in numbers of young adults entering into the
breeding population in the upcoming seasons.
The estimated number of breeding pairs of Southern Rockhopper Penguin decreased marginally by
1 % from the 2019 estimate. This continued to represent a substantially lower population estimate
(29 % down) from the most recent breeding pair maximum estimate recorded in 2015.
The overall trend in estimated breeding pair numbers showed a steady increase over 12 seasons,
reaching a peak in 2015 before a significant drop in 2016 and a plateau from 2017 to 2020. During
March 2016, Southern Rockhopper Penguin mortality (due to starvation during the moult period)
was recorded at the Falklands (Crofts & Stanworth 2016, Morgenthaler et al. 2018), and an overall
decrease of 31 % in breeding numbers was recorded at the FISMP sites at the start of the next
breeding season. Current estimates show no clearly defined recovery in breeding pair numbers at
this point. It is unknown what the level of mortality was during 2016, and as with Gentoo Penguins,
breeding deferral is reported in Eudyptes penguins (Crawford et al. 2006). However, the FISMP
data, and lack of evidence of recovery therein, suggests that significant numbers of breeding
individuals had been permanently lost to the population at the Falklands Islands, and most likely at
a larger regional scale (Morgenthaler et al. 2018). The closest colonies of Southern Rockhopper
Penguins to the Falklands are Isla de los Estados, Tierra del Fuego (approx. 140,000 breeding pairs
in 2010; Reya Rey et al. 2014) and Isla Pingüino, Santa Cruz (1200 breeding pairs in 2015; Gandini
et al. 2015). Despite an observed reduction in numbers at Isla Pingüino after the starvation event
(Morgenthaler et al. 2018), there have been no further population estimates since at these sites.
Considering the breeding strategy of this species, with maturity reached from 4 years and onwards
of age, with typically only 1 out of a possible 2 chicks raised, and coupled with changes in
Southern Rockhopper Penguin: IUCN status: Vulnerable (2018)
Falkland Islands breeding pair estimate: 319,163 ± 24,820 in 2010 (36 % of global population)
The FISMP 2020 annual change in breeding pair numbers: Decrease (1 %)

35
oceanographic processes that negatively impact on sensitive periods such as the pre-moult,
retention of its status as the only IUCN Vulnerable listed seabird at the Falklands remains.
Continued and broader monitoring (i.e. Falkland Island-wide) is critical to understand the
population trajectory in the upcoming seasons.
At Gypsy Cove in 2020, breeding Magellanic Penguin burrow occupancy remained associated with
the extent of tussac grass habitat. The 2020 occupancy rate of 32.4 % had increased from the
previous year (27.7 %), and was just below the annual average (33.0 %). Although burrow density
data have only been collected since 2012, there is no indication from this data set that burrow
density is decreasing at the survey site over time. Hence, this broadly supports burrow occupancy
as a good proxy for breeding pair trends at the site. Globally this species is considered to be
exhibiting declines (Birdlife International 2020); however, in spite of occupancy rate fluctuations at
Gypsy Cove there is no indication of declines in the resident population. How much this site
reflects trends at other sites for this species in the Falkland’s remains unknown.
In November 2020 the number of pre-fledged chicks at Volunteer Point was 866, an increase of 5 %
when compared with 2019, and the highest value recorded since monitoring began in 1980. The
large global population of King Penguins (1 million annual breeding pairs) is thought to be stable
(BirdLife International 2021), with the relatively small Falklands’ population occupying the
northern limits of the global range for this species. The long-term monitoring at Volunteer Point
showing an overall steady increasing population may reflect either increased immigration (i.e. from
the large population at South Georgia) and/or improved feeding conditions (Pistorious et al. 2012).
Conversely, the population of King Penguins along the northern limits at Crozet Islands (Southern
Indian Ocean) have reportedly declined by more than 88 % over the last 35 years (Weimerskirch et
al. 2018).
Magellanic Penguin: IUCN status: Least Concern (2020)
Falkland Islands breeding pair estimate: 76,000 – 142,000 (1997) (<10 % of global population)
The FISMP 2020 annual change in burrow occupancy rate: Increase (14.7 %)
King Penguin: IUCN status: Least Concern (2018)
Falkland Islands breeding pair estimate: 1000-1500 (<1 % of global population)
The FISMP 2020 annual change in chick numbers: Increase (5 %)
36
The overall breeding pair numbers of Black-browed Albatross at Steeple Jason monitoring sites in
2020 showed a decrease of 1 % when compared with 2019. Given the annual fluctuations, the
overall FISMP trend continued to suggest a currently stable population at these monitored
colonies. The overall breeding success in 2020 remained below the annual average for the sixth
consecutive year.
The Falkland Islands hold 72 % of the global breeding population of Black-browed Albatrosses with
Steeple Jason the largest global breeding site. The overall Falkland Islands population has shown an
increase in breeding pair numbers between 2005 and 2017 (FC data in prep.), including at Steeple
Jason. In 2019, a new colony (S5 Finger), where expansion of the colony is not limited, was added
to the FIMSP to improve the annual monitoring in capturing the broader population trend at
Steeple Jason.
Overall breeding pair numbers of Southern Giant Petrel at Steeple Jason increased by 6 % from the
previous year. In spite of notable changes in breeding pair numbers at individual colonies at
Steeple Jason, including the complete decline of the House colony in 2011, the overall number of
pairs has steadily increased over the monitoring period. In 2020, breeding resumed at the House
colony, whilst the Northwest colony has declined steadily since 2015. It is difficult to account for
the re-distribution of pairs at Steeple Jason, and although the species is highly susceptible to
disturbance, changes do not appear to align with any potential human activity.
The breeding performance at Steeple Jason in 2020 was low. In 2004, the mean breeding success
was 59.8 % whereas in 2020 it was 15 ± 19.8 %. An apparent long-term decreasing trend in breed-
ing success at Steeple Jason is of concern for this site. An increasing breeding population and de-
creasing breeding success may point to limitations in food availability, given the species is a central
Black-browed Albatross: IUCN status: Least Concern (2018)
Falkland Islands breeding pair estimate: 475,000-535,000 in 2010 (72 % of global population)
The FISMP 2020 annual change in breeding pair numbers: Decrease (1 %)
Southern Giant Petrel: IUCN status: Least Concern (2018)
Falkland Islands breeding pair estimate: 20,970 ± 180 pairs in 2015 (43 % of global population)
The FISMP 2020 annual change in breeding pair numbers: Increase (6 %)

37
place forager and other large colonies also exist on adjacent Islands; however, the actual cause is
unknown.
As the Southern Giant Petrels breeding at the Falkland Islands represent 43 % of the global
population (Stanworth and Crofts 2017), continuation of declines in breeding success at Steeple
Jason (representing around 8 % of the Falklands breeding population) would be of international
concern. Opportunities to assess breeding performance at a broader scale for the Falklands’
population would be beneficial, as this may be a site specific issue.
Anthropogenic and other impacts at colonies
Marine plastics were recorded when they were either buried in or very close to the nests of
seabirds. In 2020 new debris was recorded at the Gentoo Penguin colony at Lagoon Sands. The
most common type of marine plastics found were plastic bottles, blue packaging/sheets, and
plastic strapping bands; most items recorded were those commonly associated with commercial
fishing vessels (Appendix 6).
Although in-depth disease screening is not within the current scope of the FISMP, highlighting
factors that may be contributing towards seabird breeding performance at an island-wide scale is
important to the context of the FISMP results. In March 2021, two Gentoo Penguin colonies in the
Falklands were confirmed to have avian pox. In-depth details are recorded separately to the FISMP.

38
Acknowledgements
The continuation of the FISMP is dependent on access to seabird colonies. Falklands Conservation
would like to thank the many landowners/managers who have allowed us to conduct fieldwork on
their land, including the Wildlife Conservation Society, Falkland Islands Government, Sea Lion
Island, Port Stephens, Fitzroy, Race Point, Johnsons Harbour, Goose Green, Walker Creek and
North Arm. We thank Michael McRae and Nikki Summers, Derek and Trudi Pettersson, and Rob
and Lorraine McGill for logistical support and the many volunteers who participated in data
collection, particularly Mike Morrison for his long-standing support. We would also like to thank
the landowners at Dunbar (Hugues and Marie-Paul Delignieres) and Bleaker Island (Mike, Phyl and
Nick Rendell) for providing their survey data and allowing it to be included within the report. Lastly,
thanks to Emmaleigh Middleton and Emma Harte for helping to count seabirds from drone images.
The FISMP is made possible with financial support of the Falkland Islands Government through the
Environmental Studies Budget.
References
Agreement on the Conservation of Albatrosses and Petrels. 2017. ACAP Species Assessment: Black-browed Albatross Thalassarche melanophris. Downloaded from http://www.acap.aq on 20 May 2017. Baylis, M.M.A., Zuur, A. F., Brickle, P. & Pistorious, P.A. 2011. Climate as a driver of population variability in breeding of Gentoo Penguin (Pygoscelis papua) at the Falkland Islands. Ibis 154(1): 30-41. Baylis, A. M.M., Crofts, S. & Wolfaardt, A. C. 2013a. Population trends of Gentoo Penguin (Pygoscelis papua) breeding at the Falkland Islands. Marine Ornithology 41: 1-5. Baylis, A. M.M., Wolfaardt, A. C., Crofts, S., Pistorius, P. A. & Ratcliffe, N. 2013b. Increasing trend in the number of Southern Rockhopper Penguins (Eudyptes c. chrysocome) breeding at the Falkland Islands. Polar Biology 36: 1007–1018.
BirdLife International. 2016. Species factsheet: Thalassarche melanophris. Downloaded from http://www.birdlife.org on 01/07/2016.
BirdLife International. 2021. Species factsheet: Aptenodyptes patagonicus. Downloaded from http://www.birdlife.org on 29/06/2021.
BirdLife International. 2020. Spheniscus magellanicus. The IUCN Red List of Threatened Species 2020: e.T22697822A157428850. https://dx.doi.org/10.2305/IUCN.UK.2020-3.RLTS.T22697822A157428850.en. Downloaded on 02 July 2021.

39
Crawford, R.J.M., Dyer, B.M., Cooper, J. & Underhill, L.G. 2006. Breeding numbers and success of Eudyptes penguins at Marion Island correlated with breeding success. African Journal of Marine Science 30: 185-188. Crofts, S. 2017. Trial of drones at wildlife sites in the Falkland Islands. Unpublished report. Falklands Conservation, Stanley. Crofts, S. & Stanworth, A. 2016. Falkland Islands Seabird Monitoring Programme - Annual Report 2015/2016 (SMP24). Falklands Conservation, Stanley. Crofts, S. & Stanworth, A. 2017. Falkland Islands Seabird Monitoring Programme - Annual Report 2016/2017 (SMP25). Falklands Conservation, Stanley. Gandini, P., Millones, A., Morenthaler, A. & Frere, E. 2017. Population trends of southern Rockhopper penguin (Eudyptes chrysocome chrysocome) at the northern limit of its breeding range: Isla Pingüino, Santa Cruz, Argentina. Polar Biology 40: 1023-1028. Handley, J.M.M., Baylis, M.M.A., Brickle, P. & Pistorious P. 2016. Temporal variation in the diet of gentoo penguins at the Falkland Islands. Polar Biology 39: 283-296. Herman, R., Borowicz, A., Lynch M., Trathan, P., Hart, T. & Lynch, H. 2020. Update on the global abundance and distribution of breeding Gentoo Penguins (Pygoscelis papua). Polar Biology 43: 1947-1965. IUCN Red List of Threatened Species. Version 2017-1. www.iucnredlist.org.
Morgenthaler, A., Frere, E., Raya Rey, A., Torlaschi, C., Cedrola, P. et al. 2018. Unusual number of Southern Rockhopper Penguins, Eudyptes chrysocome, molting and dying along the Southern Patagonian coast of Argentina: pre-molting dispersion event related to adverse oceanographic conditions? January 2018. Polar Biology 41: 1041-1047.
Pistorius, P.A., Huin, Nic. & Crofts, S. 2010. Population change and resilience in Gentoo Penguins Pygoscelis papua at the Falkland Islands. Marine Ornithology 38: 49-53.
Pistorius, P.A., Baylis, A. & Crofts, S. 2012. Population development and historical occurrence of king pen-guins at the Falkland Islands. Antarctic Science 24(5): 435-440.
Reya Rey, A., Rosciano, N., Liljestrhom, M., Saenz Samaniego, R. & Schiavini, A. 2014. Species-specific popu-lation trends detected for penguins, gulls and cormorants over 20 years in sub-Antarctic Fuegian Archipela-go. Polar Biology 37(9): 1343-1360.
Stanworth, A. & Crofts, S. 2017. Population status and trends of Southern Giant Petrels (Macronectes giganteus) in the Falkland Islands. Falklands Conservation, Stanley. Thompson, K.R. & Riddy, M.D. 1993. Falkland Islands Seabird Monitoring Programme. Manual of Information and Methods. Falklands Conservation, Stanley. Weimerskirch, H., Le Bouard, F., Ryan, P.G. & Bost, C.A. 2018. Massive decline of the world’s largest king penguin colony at Ile aux Cochons, Crozet. Antarctic Science 30 (4): 236-242. Wolfaardt, A. 2012. An assessment of the population trends and conservation status of Black-browed Albatrosses in the Falkland Islands. JNCC, Peterborough, UK. Woods, R.W. & Woods, A. 1997. Atlas of breeding birds of the Falkland Islands. Anthony Nelson, Oswestry, UK.

40
Appendix 1: Count information
Location Date of breeding pair
count
Counters Date of chick count Counters
Volunteer Green 19/11/2020 S. Crofts M. Tierney
08/01/2021 S. Crofts D. Higgins
Race Point 17/11/2020
S. Crofts M. Tierney
11/01/2021 S. Crofts M. Winnard
Sea Lion Island 12/11/2020 M. Morrison 09/01/2021 M. Morrison
New Haven 0611/2020 A. Stanworth P. Jelbes, D. Proud
15/01/2021 A. Stanworth S. Stashynsky, S. P-Robertson
Bull Roads & Bull Point
03/11/2020 A. Stanworth P. Jelbes, D. Proud
12/01/2021 A. Stanworth S. Stashynsky, S. P-Robertson
Cow Bay 19/11/2020 S. Crofts M. Tierney
08/01/2021 S. Crofts D. Higgins
Low Bay 04/11/2020 A. Stanworth P. Jelbes, D. Proud
13/01/2021 A. Stanworth S. Stashynsky, S. P-Robertson
Motley Point 05/11/2020 A. Stanworth P. Jelbes, D. Proud
14/01/2021 A. Stanworth S. Stashynsky, S. P-Robertson
Bertha's Beach 08/11/2020 M. Morrison 06/01/2021 M. Morrison
Fox Point 08/11/2020 M. Morrison 06/01/2021 M. Morrison
Pleasant Roads 07/11/2020 M. Morrison 04/01/2021 M. Morrison
Steeple Jason 02-09/11/20
S. Crofts M. Tierney A. Pollard
Gentoo and Rockhopper 18-21/01/21. Black-
browed and Giant Petrel 01-04/04/21
S. Crofts M. Winnard, S. Alazia
A. Stanworth, M. Anstee E. Harte, A. P. Jelbes
Lagoon Sands 19/11/2020 S. Crofts M. Tierney
08/01/2021 S. Crofts D. Higgins
Diamond Cove 20/11/2020 S. Crofts M. Tierney
06/01/2021 M. Tierney
Rugged Hill/Eagle Hill 20/11/2020 S. Crofts M. Tierney
09/01/2021 S. Crofts
Port Stephens 27/10/2020 S. Crofts T. Stenning
13/01/2021 S. Crofts
Penguin Point South Not done Not done
Bleaker Island Gentoo – 10/11/2020
Rockhopper – 25/11/2020
N. Rendell N. Rendell
Giant Petrel 25/02/2021
M. Rendell N. Rendell
Gypsy Cove 04/12/2020 A. Stanworth H. Jeffrey, R. Irvine
D. Blake, M. Winnard

41
Appendix 2: Gentoo Penguin count data
Location Colony Grid Ref. Breeding Pairs (Mean±1SD)
Breeding Success (Mean±1SD)
Count Count Type*
Count Count Type*
Bertha’s Beach Bertha’s Beach
-51.882233 -58.358916
506 ± 2 TR 1.14 ± 0.01 TR
Bull Point Bull Roads -52.309364 -59.398188
554 ± 21 TR 1.34 ± 0.04 D
Bull Point Bull Point -52.342591 -59.321461
1028 ± 6 D 0.84 ± 0.02 TR
Fox Point Fox Point -58.45 -51.92
381 ± 10 TR 1.15 ± 0.03 TR
Low Bay Low Bay -52.077608 -58.879630
324 ± 7 TR 1.36 ± 0.04 TR
Motley Point Motley Point
-52.108576 -58.643177
1250 ± 29 TR 1.26 ± 0.03 TR
New Haven New Haven
-51.742073 -59.222044
480 ± 3 TR 1.4 ± 0.03 TR
Pleasant Roads Pleasant Roads
-51.83 -58.24
201 ± 1 TR 1.31 ± 0.01 TR
Race Point Fanning Harbour
-51.464667 -59.087958
157 ± 2 TR 1.07 ± 0.08 TR
Race Point Rookery Sands
-51.434122 -59.106928
889 ± 1 D 0.8 ± 0.02 D
Sea Lion Island Sea Lion Island
-52.426578 -59.072513
3872 ± 17 TR 1.25 ± 0.01 TR
Steeple Jason
House -51.02018
-61.233113 2287 ± 4 D 0.79 ± 0.01 D
Steeple Jason Neck -51.034787 -61.214888
3201 ± 6 D 0.8 ± 0.01 D
Johnsons Harbour
Cow Bay -51.428572 -57.879051
1926 ± 3 D 1.29 ± 0.01 D
Johnsons Harbour
Lagoon Sands
-51.513702 -57.77581
796 ± 4 D 1.13 ± 0.01 D
Johnsons Harbour
Volunteer Green
-51.478494 -57.837858
1781 ± 18 TR 1.21 ± 0.02 GP
* TR – Tally Repeated, TA – Tally Agreed, GP – Go Pro image count, D – Drone image count

42
Appendix 3: Southern Rockhopper Penguin count data
Location Colony/Sub-colony Grid Ref. Breeding Pairs (Mean ± 1 SD)
Count Type*
Breeding Success (Mean ± 1 SD)
Count Type*
Berkeley Sound
Diamond Cove -51.538059 -57.923512
139 ± 0 TA 1.08 ± 0.01 TR
Eagle Hill East -51.544064 -57.785118
112 ± 0 TA 0.97 ± 0.03 TR
Eagle Hill -51.544497 -57.802981
792 ± 7 D 0.65 ± 0.06 TR
Eagle Hill West -51.545082 -57.810499
833 ± 7 D/TR 0.72 ± 0.01 D
Rugged Hill East -51.543674 -57.845031
410 ± 6 TA 1.22 ± 0.02 TR
Rugged Hill -51.5432 -57.85185
450 ± 8 D 0.82 ± 0.02 D
Rugged Hill West -51.543488 -57.851570
324 ± 0 D 0.98 ± 0.01 D
Port Stephens Stephen’s Peak -52.133803 -60.859281
1292 ± 12 TR 0.67 ± 0.01 TR
Race Point Fanning Head North
-51.460831 -59.141540
251 ± 8 TR 0.62 ± 0.08 TR
Fanning Head South
-51.469284 -59.137749
355 ± 4 TR 0.65 ± 0.02 TR
Sea Lion Island
Rockhopper Point -52.446667 -59.115501
374 ± 12 TR 0.32 ± 0.04 TR
Steeple Jason Northwest Flat -51.012810 -61.252682
106 ± 3 DR 0.57 ± 0.03 TA
Northwest Ridge -51.012939 -61.252884
97 ± 0 TA 0.61 ± 0 TA
S5Tip -51.037932 -61.220460
787 ± 7 D 0.51 ± 0 TA
South East -51.046215 -61.206635
684 ± 1 TA 0.56 ± 0 TA
S5Finger -51.031884 -61.231434
1012 ± 13 D 0.54 ± 0.01 TA
* TR – Tally Repeated, TA – Tally Agreed, GP – Go Pro image count, D – Drone image count

43
Appendix 4: Magellanic Penguin survey data
Transect Number of Burrows
Number of occupied burrows
Distance to last burrow (m)
Minimum Pair Density per Km²
T1 0 0 0 0
T2 0 0 0 0
T3 0 0 0 0
T4 0 0 0 0
T5 4 2 49.14 10175
T6 8 4 43.4 30722
T7 0 0 0 0
T8 0 0 0 0
T9 1 0 10.74 0
T10 0 0 0 0
T11 0 0 0 0
T12 0 0 0 0
T13 8 1 49.38 6750
T14 12 5 41.54 40122
T15 0 0 0 0
T16 12 2 61.72 8838
T17 5 3 48.2 25934
T18 0 0 0 0
T19 2 1 20.53 24355
T20 0 0 0 0
T21 0 0 0 0
T22 0 0 0 0
T23 1 1 22.16 11282
T24 32 8 104.33 19788
T25 15 2 87.08 9570
T26 16 4 43.52 22978
T27 9 1 46.2 9740
T28 5 1 12.79 48866
T29 6 1 33.38 7490
T30 0 0 0 0

44
Appendix 5: Black-browed Albatross and Southern Giant Petrel count data
Black-browed Albatross
Sub-colony Breeding Pairs (Mean ± 1 SD)
Count Type* Breeding Success (chicks/pair)
(Mean ± 1 SD)
Count Type*
Study Area Colony -51.046 -61.207
1768 ± 2 TR 0.54 ± 0 TA
S5Tip -51.037 -61.220
417 ± 2 D 0.38 ± 0.03 DR
Penthouse -51.031 -61.228
72 ± 0 TA 0 TA
Northwest Flat -51.012 -61.252
434 ± 7 D 0.48 ± 0.02 D
Northwest Ridge -51.012 -61.252
488 ± 3 TR 0.54 ± 0.02 D
S5Finger -51.031 -61.231
2355 ± 1 D 0.50 ± 0.01 D
* TR – Tally Repeated, TA – Tally Agreed, GP – Go Pro image count, D – Drone image count
Southern Giant Petrel
Colony Breeding Pairs (Mean ± 1 SD)
Count Type* Breeding Success (chicks/pair)
(Mean ± 1 SD)
Count Type*
Neck -51.042 -61.206
1722 ± 19 D 0.29 ± 0.02 D
Northwest (South of Ridge)
-51.024 -61.248
112 ± 2 TR 0.01 ± 0.02 TR
House (Northwest track)
-51.017 -61.241
20 ± 0 TA 0.45 ± 0 TA
Northwest Flat -51.012 -61.251
6 ± 0 TA 0 TA
* TR – Tally Repeated, TA – Tally Agreed, GP – Go Pro image count, D – Drone image count

45
Appendix 6: Marine plastics at FISMP sites
Serial Nest Date FISMP site Species Debris type Position of debris
1 1 05/11/2019 Steeple Study BBA 1 litre plastic drinking bottle Next to nest
1 2 05/11/2019 Steeple Study BBA 1 litre plastic drinking bottle Next to nest
3 3 05/11/2019 Steeple Study BBA 1 litre plastic drinking bottle Next to nest
4 4 05/11/2019 Steeple Study BBA 1 litre plastic drinking bottle Next to nest
5 5 05/11/2019 Steeple Study RHP 1 litre plastic drinking bottle Next to nest
6 6 06/11/2019 Steeple Study BBA 2 litre plastic drinking bottle Next to nest
7 6 06/11/2019 Steeple Study BBA 1 500 ml plastic drinking bottle (coca cola) Next to nest
8 6 06/11/2019 Steeple Study BBA Polystyrene sheet 30x30cm Next to nest
9 7 06/11/2019 Steeple Study BBA Plastic Blue bottle (other) <500ml Next to nest
10 8 06/11/2019 Steeple Study BBA 1 litre Plastic Yellow bottle (other) Next to nest
11 9 09/11/2019 Steeple NW Ridge BBA Plastic blue sheeting Built into nest
12 10 09/11/2019 Steeple NW Ridge BBA Plastic blue sheeting Next to nest
13 11 09/11/2019 Steeple NW Ridge BBA Green plastic twine Built into nest
14 12 09/11/2019 Steeple NW Ridge BBA Plastic blue sheeting Built into nest
15 13 09/11/2019 Steeple NW Ridge BBA Plastic blue foam piece Built into nest
16 14 09/11/2019 Steeple NW Ridge BBA Plastic blue sheeting Built into nest
17 15 05/11/2018 Steeple NW Ridge BBA Plastic blue sheeting Built into nest
18 16 05/11/2018 Steeple NW Ridge BBA Plastic blue sheeting Built into nest
19 17 09/11/2019 Steeple NW Ridge BBA Plastic bottle Next to nest
20 18 09/11/2019 Steeple NW Ridge BBA Plastic bottle Next to nest
21 19 09/11/2019 Steeple NW Ridge BBA Blue fishing line/nylon Built into nest
22 20 08/01/2021 Lagoon Sands Gentoo Pile of strapping bands Next to nest
23 21 08/01/2021 Lagoon Sands Gentoo Green string Built into nest
24 22 08/01/2021 Lagoon Sands Gentoo Black piping Next to nest
25 23 08/01/2021 Lagoon Sands Gentoo Green string In colony
26 24 08/01/2021 Lagoon Sands Gentoo Green piece mesh Built into nest
27 25 08/01/2021 Lagoon Sands Gentoo Plastic misc. small In colony


![Estcourt LJ, Stanworth S, Doree C, Trivella M, Hopewell S ... · [Intervention Review] Different doses of prophylactic platelet transfusion for preventing bleeding in people with](https://img.pdfslide.us/doc/110x75/5e1aebcb43638d597d2d0318/estcourt-lj-stanworth-s-doree-c-trivella-m-hopewell-s-intervention-review.jpg)