Embed Size (px)
Citation preview

SO
NO
MA
CO
UN
TY
HU
MA
N D
EV
EL
OP
ME
NT
RE
PO
RT
20
14
A P
OR
TRA
IT OF S
ON
OM
A CO
UN
TYSarah B
urd-Sharps and Kristen Lew
is
While many measures tell us how the county’s economy is doing, A Portrait of Sonoma County tells us how the county’s people are doing.
THE MEASURE OF AMERICA SERIES:
A PORTRAIT OF SONOMA COUNTY
Cop
yrig
ht ©
201
4 M
easu
re o
f Am
eric
a.
ABOUT THE REPORT
A Portrait of Sonoma County is an in-depth look at how residents of Sonoma County are faring in three fundamental areas of life: health, access to knowledge, and living standards. It examines disparities within the county among neighborhoods and along the lines of race, ethnicity, and gender. In partnership with over sixty organizations and elected officials, the Sonoma County Department of Health Services initiated this report to provide a holistic framework for understanding and addressing complex issues facing its constituency. For more information about the report and findings, please contact [email protected].
ABOUT THE DESIGN
Humantific is an internationally recognized SenseMaking for ChangeMaking firm located in New York and Madrid.
ABOUT THE AUTHORS
Sarah Burd-Sharps and Kristen Lewis are co-directors of Measure of America and co-authors of The Measure of America series of national, state, and county reports. They both previously worked on human development issues in countries around the world.
ABOUT THE PROJECT
Measure of America of the Social Science Research Council provides easy-to-use yet methodologically sound tools for understanding the distribution of well-being and opportunity in America and seeks to foster greater awareness of our shared challenges and more support for people-centered policies.
Map over 30 indicators for Sonoma County at www.measureofamerica.org/maps
www.measureofamerica.org
A full decade separates the life expectancies of the top and bottom
census tracts.
In Forestville, the school enrollment rate
is 54 percent, compared to 100 percent in Central
East Windsor.
Latino residents earn about $11,000 less than
Asian Americans and $15,000 less than whites.
East Bennett Valley has the highest well-
being levels, and nearby Roseland Creek has the lowest.
SONOMA COUNTY HUMAN DEVELOPMENT REPORT 2014
SONOMACOUNTY
MEASUREOFAMERIC Aof the Social Science Research Council
Sarah Burd-SharpsKristen Lewis
CHIEF STATISTICIAN
Patrick Nolan Guyer
RESEARCHER
Alex Powers
COMMISSIONED BY
County of Sonoma Department of Health Services
WWW.MEASUREOFAMERICA .ORG
A PORTRAIT OF
D47460_COVER_EN_CC14_v2.indd 1 5/12/15 11:25 AM

Acknowledgments ........................................................................................................2Foreword.......................................................................................................................5Pledge of Support .........................................................................................................6Key Findings ...........................................................................................................8
Understanding Human Development ...................................................................12
Introduction ................................................................................................................13How Is Human Development Measured? ..................................................................15Human Development: The Benefits of a New Approach ...........................................17
Sonoma County: What the Human Development Index Reveals ...........................20
Sonoma County in Context .........................................................................................21
A Long and Healthy Life........................................................................................30
Introduction ................................................................................................................31Analysis by Geography and Race and Ethnicity .........................................................32What Fuels the Gaps in Health? .................................................................................43
Access to Knowledge ............................................................................................46
Introduction ................................................................................................................47Analysis by Geography, Race and Ethnicity, and Gender ..........................................49What Fuels the Gaps in Access to Knowledge? .........................................................55
A Decent Standard of Living .................................................................................62
Introduction ................................................................................................................63Analysis by Geography, Gender, and Race and Ethnicity ..........................................67What Fuels the Gaps in Living Standards? ................................................................73
Agenda for Action .................................................................................................76
References ...........................................................................................................86
Sonoma County Human Development Indicators .....................................................87Methodological Notes ................................................................................................96Notes ...........................................................................................................................98Bibliography .............................................................................................................. 101Sonoma County Census Tract Reference Map
Contents
Copyright © 2014 Measure of America. All Rights Reserved. 55% Recycled Paper

2 THE MEASURE OF AMERICA SERIES
We must start by thanking the Sonoma County Department of Health Services for initiating this important project. In particular, we thank the Health Policy, Planning, and Evaluation Division, which has spearheaded a rich collaborative process for the development of this report and has provided critical data analysis. The Portrait of Sonoma Leadership Group includes:
Acknowledgments
Marlowe Allenbright, Healthy Healdsburg
Lisa Badenfort, Ag Innovations Network
Caluha Barnes, Department of Health Services
Ellen Bauer, Department of Health Services
Chris Bell, Unitarian Universalist Congregation, Santa Rosa
Dan Blake, Sonoma County Office of Education
Steve Bolman, Petaluma City School District
Beth Brown, Community Foundation Sonoma County
Davin Cardenas, North Bay Organizing Project
Louann Carlomango, Sonoma Valley Union High School District
Lauren Casey, Regional Climate Protection Authority
Susan Castillo, Department of Health Services
Tammy Chandler, Department of Health Services
Elisabeth Chicoine, Department of Health Services
Penny Cleary, Sutter Medical Center
Susan Cooper, Community Action Partnership
Angie Corwin, Department of Health Services
Beth Dadko, Department of Health Services
Richard Dale, Sonoma Ecology Center
Karin Demarest, Community Foundation Sonoma County
Nancy Dobbs, KRCB North Bay Public Media
Jeannie Dulberg, Kaiser Permanente
Jerry Dunn, Human Services Department
Kelly Elder, Department of Health Services
Jeane Erlenborn, Santa Rosa Junior College
Ramona Faith, Petaluma Health Care District
Omar Gallardo, Landpaths
Erin Hawkins, Community Health Initiatives in the Petaluma Area
Juan Hernandez, Sonoma Valley Health Roundtable
Ray Holley, Windsor Wellness Partnership
Matthew Ingram, St. Joseph Health–Sonoma County
Mike Kallhoff, United Way of the Wine Country
Mike Kennedy, Department of Health Services
Jen Lewis, Department of Health Services
Chelene Lopez, St. Joseph Health–Sonoma County
George Malachowski, Human Services Department
Khaalid Muttaqi, City of Santa Rosa
Kellie Noe, Department of Health Services
Liz Parra, Department of Health Services
Tim Reese, Community Action Partnership
Donna Roper, Russian River Area Resources and Advocates
Peter Rumble, County Administrator’s Office
Jo Sandersfeld, St. Joseph Health–Sonoma County
Rita Scardaci, Department of Health Services
Susan Shaw, North Bay Organizing Project
Socorro Shiels, Santa Rosa City School District
Brian Vaughn, Department of Health Services

3A PORTRAIT OF SONOMA COUNTY 2014
The Sonoma County Board of Supervisors deserve special gratitude for their support, leadership, and encouragement of this project. They are Efren Carrillo, Susan Gorin, Mike McGuire, David Rabbitt, and Shirlee Zane. We would also like to recognize the Health Action Council for their contribution to the genesis of this report and for their perspective on its actionable impacts. They include:
We are also deeply indebted to the following Sonoma County organizations for their collaboration and inputs throughout the process:
Bob Anderson, United Winegrowers for Sonoma County
Gina Belforte, Rohnert Park City Council
Ken Brown, Sonoma City Council
Tom Chambers, Healdsburg City Council
Oscar Chavez, Sonoma County Human Services
Don Chigazola, Community Volunteer
Frank Chong, Santa Rosa Junior College
Judy Coffey, Kaiser Permanente
Nancy Dobbs, KRCB North Bay Public Media
Ramona Faith, Petaluma Health Care District
Health Action Subcommittees
Committee for Healthcare Improvement
Cradle to Career Operations Team
Health Action Chapters
Community Health Initiatives in the Petaluma Area
Healthy Healdsburg
Russian River Area Resources and Advocates
Naomi Fuchs, Santa Rosa Community Health Centers
Debora Fudge, Town of Windsor Council
David Glass, Petaluma City Council
Bo Greaves, Santa Rosa Community Health Centers
Sarah Glade Gurney, Sebastopol City Council
Caryl Hart, Sonoma County Regional Parks
Susan Harvey, Cotati City Council
Herman J. Hernandez, Russian River Redevelopment Economic Task Force
Juan Hernandez, La Luz Center
Steve Herrington, Sonoma County Office of Education
Sebastopol Area Community Alliance
Sonoma Valley Health Roundtable
Windsor Wellness Partnership
Community Groups
Community Activity and Nutrition Coalition
Community Engagement and Healing Subcommittee of the Community and Local Law Enforcement Task Force
Mike Kallhoff, United Way of the Wine Country
Lisa Maldonado, North Bay Labor Council, AFL-CIO
Marrianne McBride, Council on Aging
Cynthia Murray, North Bay Leadership Council
Ernesto Olivares, Santa Rosa City Council
Mike Purvis, Sutter Medical Center of Santa Rosa
Carol Russell, Cloverdale City Council
Todd Salnas, St. Joseph Health
Rita Scardaci, Department of Health Services
Lisa Wittke Schaffner, John Jordan Foundation
Community Development Commission
Food System Alliance
Santa Rosa Interfaith Ministerial Association
Santa Rosa Mayor’s Gang Prevention Task Force
Social Advocates for Youth
Sonoma County Superintendent Council
Sonoma County Continuum of Care
Soccoro Shiels, Santa Rosa City Schools
Suzanne Smith, Sonoma County Transportation Authority/Regional Climate Protection Authority
Ben Stone, Sonoma County Economic Development Board
Mary Szecsey, West County Health Centers
Willie Tamayo, La Tortilla Factory
Lee Turner, Community Baptist Church
Alena Wall, Northern California Center for Well-Being
Shirlee Zane, Sonoma County Board of Supervisors
St. Joseph’s Health System Neighborhood Care Team
Tomorrow’s Leaders Today
United Way Community Solutions Team
Upstream Investments Policy Committee
Upstream Investments Portfolio Review Committee

4 THE MEASURE OF AMERICA SERIES
We give thanks to contributors who provided their professional expertise on a wide range of subjects. They are Marty Bennett of North Bay Jobs with Justice, Ginny Browne of the Participatory Budgeting Project, Daniel Carroll of the U.S. Department of Labor, and Joseph Hayes of the Public Policy Institute of California.We want to thank our Social Science Research Council colleagues Ira Katznelson and Mary McDonnell for their support of Measure of America as well as Jennifer Carroll Blackman, Rebecca Kershberg, Gail Kovach, Lauren McCay, Alyson Metzger, Fernando Rojas, Michael Simon, Lisa Yanoti, and Zach Zinn for essential administrative, communications, and website backstopping, consultant Brian Karfunkel for statistics, and interns Kristen Hackett and Ijeoma Anyanwu for their work on this report. Finally, thank you, Katharine Grantz, for your valuable cartography contributions.
It is always a pleasure working with the wonderful SenseMakers at Humantific | UnderstandingLab, who never fail to bring life and flair to our publications. This team includes Elizabeth Pastor, Garry K. VanPatter, Valentina Miosuro, and Jackie Closurdo. And we owe many thanks to Bob Land and Lisa Ferraro Parmelee for their precise and thorough editing under tight deadlines.
Lastly, we especially want to express enormous gratitude and respect for our dedicated Measure of America team of Patrick Guyer, Alex Powers, and Margaret Mattes, whose creativity and commitment to this work are unparalleled and whose patience with impossible deadlines, overambitious plans, and last-minute ideas are well beyond the call of duty.
thank you!

5A PORTRAIT OF SONOMA COUNTY 2014
We live in a thriving, beautiful county with unique natural resources, rich cultural diversity, and a robust entrepreneurial community. While every city and neighborhood in Sonoma has many assets that contribute to our county, not every individual has access to the same opportunities to meet their full potential to live long and healthy lives. A Portrait of Sonoma County is an important step in recognizing those assets as well as raising the difficult reality of disparities. A Portrait of Sonoma County is also a critical tool to identify avenues for addressing the underlying causes of disparities.
Our county has set its mission to invest in beautiful, thriving, sustainable communities for all, and by using A Portrait of Sonoma County, we will be better able to focus resources and attention to areas of need, leverage the tremendous assets of every neighborhood, and help our many community partners do the same. It is also imperative that our work not end with the publishing of the report. We plan to use the portrait to help build the resilience of our many neighborhoods and communities by enhancing existing collaborative efforts and forging new partnerships with community members, nonprofits, foundations, and public agencies. In doing this, we will support our community’s shared desire for a Sonoma County that is a healthy place to live, work, and play—a place where all residents thrive and achieve their life potential.
David Rabbitt Chair, Sonoma County Board of Supervisors
Greetings. On behalf of the Sonoma County Department of Health Services, I extend our sincere apprecia-tion to the Measure of America team for the comprehensive analysis in this report. This report would not have happened without the Sonoma County Board of Supervisors continued commitment to the Health Action vision and significant investments in prevention-focused approaches to health and community well-being. I would like to convey deep gratitude to the Health Action Council and our many community partners who contributed to the development of A Portrait of Sonoma County over the last year. This community-led report represents an opportunity for all of us to collectively address areas of unmet potential throughout our County in order to ensure a prosperous and healthy community for all.
Protecting the health and well-being of individuals, families, and the community is the primary responsibility of the Sonoma County Department of Health Services. Many factors play a role in the health of a community. The design and construction of our communities; educational attainment; affordable housing; economic sta-bility and employment opportunities; climate change; access to healthy and preferably locally produced food - all affect our ability to live, work, learn and play in Sonoma County.
We are committed to working collaboratively with the community and our partners to make Sonoma County the healthiest county in California.
Your opinions and views on how we can improve services and the health of our community are important. We invite you to participate in community meetings or lead discussions on this report in your own communities. For more information and to learn how you can be involved, please visit the Health Action website: www.sonomahealthaction.org.
Best regards,
Rita ScardaciDirector, Sonoma County Department of Health Services
Foreword

6 THE MEASURE OF AMERICA SERIES
The Pledge is a living document, and additional organizations and elected officials are welcome to pledge support after the initial release. The following organizations and elected officials voice support:
4Cs (Community Child Care Council of Sonoma County)
Action Network
Ag Innovations Network
Alliance Medical Center
Bischoff Performance Improvement Consulting
Child Care Planning Council
Child Parent Institute (CPI)
Catholic Charities of Santa Rosa
Ceres Community Project
Community Action Partnership Sonoma County
Community & Family Service Agency
Community Baptist Church
Community Foundation Sonoma County
Community Health Initiatives in the Petaluma Area (CHIPA)
Council on Aging
Daily Acts
First 5 Commission
Food for Thought
Food Systems Alliance
Healdsburg District Hospital
Healthy Community Consortium
Healthy Healdsburg
John Jordan Foundation
Kaiser Permanente
KRCB North Bay Public Media
La Luz Center
La Tortilla Factory
LandPaths
Leadership Institute for Ecology and the Economy
North Bay Children’s Center
North Bay Jobs with Justice
North Bay Labor Council
North Bay Leadership Council
North Bay Organizing Project
Northern California Center for Well-Being
Petaluma Coalition to Prevent Alcohol, Tobacco and Other Drug Problems
Petaluma Community Foundation
Petaluma Health Care District
Petaluma Health Center
Redwood Community Health Coalition
Regional Climate Protection Authority
Russian River Area Resources and Advocates
Santa Rosa Community Health Centers
Santa Rosa Junior College
Sebastopol Area Community Alliance
Social Advocates for Youth (SAY)
Sonoma County Agricultural Preservation and Open Space District
Sonoma County Continuum of Care
Sonoma County Commission on the Status of Women
Sonoma County Department of Health Services
Sonoma County Economic Development Board
Sonoma County Human Services Department
Sonoma County Library
Sonoma County Office of Education
Sonoma County Regional Parks
Sonoma County Transportation Authority
Sonoma Ecology Center
Sonoma State University
Sonoma Valley Health Roundtable
St. Joseph’s Health – Sonoma County
Sutter Medical Center of Santa Rosa
United Way of the Wine Country
Voices
West County Health Centers
Windsor Wellness Partnership
Workforce Investment Board (WIB)
***
Gina Belforte City of Rohnert Park Councilmember
Ken Brown Sonoma City Councilmember
Louann Carlomagno Sonoma Valley Unified School District Superintendent
Tom Chambers City of Healdsburg Councilmember
Julie Combs City of Santa Rosa Councilmember
Bob Cox City of Cloverdale Vice Mayor
John Dell’Osso City of Cotati Mayor
John Eder City of Sebastopol Councilmember
Deb Fudge Town of Windsor Councilmember
Laurie Gallian City of Sonoma Councilmember
David Glass City of Petaluma Mayor
Sarah Glade Gurney City of Sebastopol Councilmember
Susan Harvey City of Cotati Councilmember
Dr. Steve Herrington Sonoma County Superintendent of Schools
Robert Jacob City of Sebastopol Mayor
Steve Jorgensen Windsor Unified School District Superintendent
Mark Landman City of Cotati Councilmember
Keller McDonald West Sonoma County Union High School District Superintendent
Ernesto Olivares City of Santa Rosa Councilmember
Carol Russell City of Cloverdale Mayor
Socorro Shiels Santa Rosa City Schools Superintendent
Patrick Slayter City of Sebastopol Councilmember
A PORTRAIT OF SONOMA COUNTY 2014 7
Pledge of Support
We have the vision of being the healthiest county in the state of California. We recognize that in order to achieve this goal, we must work together in strategic, thoughtful, and engaging ways. Our Collective Impact efforts to date have led to cross-sector collaborative partnerships and broad awareness of the multiple factors that influence our health, such as access to education, jobs, housing, transportation, parks, nature, and safe neighborhoods. We are committed to significantly improving the health and well-being of all residents.
However, we know that not all residents have access to the same opportunities to meet their full potential and that health, education, and income disparities exist depending on where one lives in the county. We also know that these disparities have real individual and community impacts on long-term health and prosperity.
We, below, commit to using A Portrait of Sonoma County to better understand these gaps in opportunities and to partnering with community to identify the strengths and assets on which to build a comprehensive and inclusive response to this report. We commit to utilizing A Portrait of Sonoma County in the work of our organizations and our collaborative efforts. We aim to leverage resources, empower communities, share best practices, and strategically focus our efforts in order to creatively contribute to a new and innovative discussion of health equity in our county. We recognize that only by working together as equal partners with a shared vision and common agenda can we hope to achieve our long-term goals of making Sonoma County the healthiest county in the state for all our residents to work, live, and play.
6 THE MEASURE OF AMERICA SERIES
SONOMA COUNTY
CALIFORNIA

7
The Pledge is a living document, and additional organizations and elected officials are welcome to pledge support after the initial release. The following organizations and elected officials voice support:
4Cs (Community Child Care Council of Sonoma County)
Action Network
Ag Innovations Network
Alliance Medical Center
Bischoff Performance Improvement Consulting
Child Care Planning Council
Child Parent Institute (CPI)
Catholic Charities of Santa Rosa
Ceres Community Project
Community Action Partnership Sonoma County
Community & Family Service Agency
Community Baptist Church
Community Foundation Sonoma County
Community Health Initiatives in the Petaluma Area (CHIPA)
Council on Aging
Daily Acts
First 5 Commission
Food for Thought
Food Systems Alliance
Healdsburg District Hospital
Healthy Community Consortium
Healthy Healdsburg
John Jordan Foundation
Kaiser Permanente
KRCB North Bay Public Media
La Luz Center
La Tortilla Factory
LandPaths
Leadership Institute for Ecology and the Economy
North Bay Children’s Center
North Bay Jobs with Justice
North Bay Labor Council
North Bay Leadership Council
North Bay Organizing Project
Northern California Center for Well-Being
Petaluma Coalition to Prevent Alcohol, Tobacco and Other Drug Problems
Petaluma Community Foundation
Petaluma Health Care District
Petaluma Health Center
Redwood Community Health Coalition
Regional Climate Protection Authority
Russian River Area Resources and Advocates
Santa Rosa Community Health Centers
Santa Rosa Junior College
Sebastopol Area Community Alliance
Social Advocates for Youth (SAY)
Sonoma County Agricultural Preservation and Open Space District
Sonoma County Continuum of Care
Sonoma County Commission on the Status of Women
Sonoma County Department of Health Services
Sonoma County Economic Development Board
Sonoma County Human Services Department
Sonoma County Library
Sonoma County Office of Education
Sonoma County Regional Parks
Sonoma County Transportation Authority
Sonoma Ecology Center
Sonoma State University
Sonoma Valley Health Roundtable
St. Joseph’s Health – Sonoma County
Sutter Medical Center of Santa Rosa
United Way of the Wine Country
Voices
West County Health Centers
Windsor Wellness Partnership
Workforce Investment Board (WIB)
***
Gina Belforte City of Rohnert Park Councilmember
Ken Brown Sonoma City Councilmember
Louann Carlomagno Sonoma Valley Unified School District Superintendent
Tom Chambers City of Healdsburg Councilmember
Julie Combs City of Santa Rosa Councilmember
Bob Cox City of Cloverdale Vice Mayor
John Dell’Osso City of Cotati Mayor
John Eder City of Sebastopol Councilmember
Deb Fudge Town of Windsor Councilmember
Laurie Gallian City of Sonoma Councilmember
David Glass City of Petaluma Mayor
Sarah Glade Gurney City of Sebastopol Councilmember
Susan Harvey City of Cotati Councilmember
Dr. Steve Herrington Sonoma County Superintendent of Schools
Robert Jacob City of Sebastopol Mayor
Steve Jorgensen Windsor Unified School District Superintendent
Mark Landman City of Cotati Councilmember
Keller McDonald West Sonoma County Union High School District Superintendent
Ernesto Olivares City of Santa Rosa Councilmember
Carol Russell City of Cloverdale Mayor
Socorro Shiels Santa Rosa City Schools Superintendent
Patrick Slayter City of Sebastopol Councilmember
A PORTRAIT OF SONOMA COUNTY 2014 7
Pledge of Support
We have the vision of being the healthiest county in the state of California. We recognize that in order to achieve this goal, we must work together in strategic, thoughtful, and engaging ways. Our Collective Impact efforts to date have led to cross-sector collaborative partnerships and broad awareness of the multiple factors that influence our health, such as access to education, jobs, housing, transportation, parks, nature, and safe neighborhoods. We are committed to significantly improving the health and well-being of all residents.
However, we know that not all residents have access to the same opportunities to meet their full potential and that health, education, and income disparities exist depending on where one lives in the county. We also know that these disparities have real individual and community impacts on long-term health and prosperity.
We, below, commit to using A Portrait of Sonoma County to better understand these gaps in opportunities and to partnering with community to identify the strengths and assets on which to build a comprehensive and inclusive response to this report. We commit to utilizing A Portrait of Sonoma County in the work of our organizations and our collaborative efforts. We aim to leverage resources, empower communities, share best practices, and strategically focus our efforts in order to creatively contribute to a new and innovative discussion of health equity in our county. We recognize that only by working together as equal partners with a shared vision and common agenda can we hope to achieve our long-term goals of making Sonoma County the healthiest county in the state for all our residents to work, live, and play.
6 THE MEASURE OF AMERICA SERIES
SONOMA COUNTY
CALIFORNIA

8 THE MEASURE OF AMERICA SERIES
Key FindingsA Portrait of Sonoma County is an in-depth look at how residents of Sonoma County are faring in three fundamental areas of life: health, access to knowledge, and living standards. While these metrics do not measure the county’s breathtaking vistas, the rich diversity of its population, or the vibrant web of community organizations engaged in making it a better place, they capture outcomes in areas essential to well-being and opportunity. This report examines disparities within the county among neighborhoods and along the lines of race, ethnicity, and gender. It makes the case that population-based approaches, the mainstay of public health, offer great promise for longer, healthier, and more rewarding lives for everyone and that place-based approaches offer a way to address the multiple and often interlocking disadvantages faced by families who are falling behind. Only by building the capabilities of all residents to seize opportunities and live to their full potential will Sonoma County thrive.
The Sonoma County Department of Health Services (DHS) commissioned Measure of America to prepare this report to provide a holistic framework for understanding and addressing complex issues facing its constituency. It will inform the work of the Department’s Health Action initiative. Unlike many other health initiatives, Health Action aims to move beyond a narrowly defined focus on sickness and medical care to take into account a wide range of vital determinants of well-being and health, such as economic opportunities; living and working conditions in homes, schools, and workplaces; community inclusion; and levels of stigma and isolation. DHS has sought to engage a broad spectrum of stakeholders and pinpoint root causes of health disparities, all in the service of Health Action’s goal: to make Sonoma the healthiest county in California.
The hallmark of this work is the American Human Development Index, a supplement to Gross Domestic Product and other money metrics that tells the story of how ordinary Americans are faring. The American Human Development Index uses official government data in health, education, and income and allows for well-being rankings of states, congressional districts, counties, census tracts, women and men, and racial and ethnic groups. The Index can empower communities with a tool to identify priorities and track progress over time.
Measure of America, a project of the Social Science Research Council, provides easy-to-use yet methodologically sound tools for understanding well-being and opportunity in America and seeks to foster greater awareness of our shared challenges and more support for people-centered policies.

9A PORTRAIT OF SONOMA COUNTY 2014
KEY FINDINGS
How Does Sonoma County Fare on the American Human Development Index?The American Human Development Index combines fundamental well-being indicators into a single score expressed as a number between 0 and 10. It is based on the Human Development Index of the United Nations, the global gold standard for measuring the well-being of large population groups. This report is Measure of America’s second exploration of well-being within a single county; A Portrait of Marin was published in 2012. Both county reports build upon a 2011 study of the state as a whole, A Portrait of California.
KEY FINDINGS: AMERICAN HUMAN DEVELOPMENT INDEX
• The most extreme disparities in basic health, education, and earnings outcomes are often found within small geographical areas. Of the county’s ninety-nine census tracts, top-ranking East Bennett Valley, with an index value of 8.47, is only five miles away from bottom-ranking Roseland Creek, with an index value of 2.79. The former has a Human Development Index value above that of top-ranked state Connecticut, while the well-being outcomes of the latter are well below those of Mississippi, the lowest-ranked state on the American Human Development Index.
• The ranking of well-being levels by race and ethnicity in Sonoma County follows that of California, with Asian Americans at the top, followed by whites, African Americans, and Latinos. But the gap in human development between the highest- and lowest-ranked racial and ethnic groups is smaller in Sonoma County than it is in California and nationally.
• Sonoma County’s females edge out males in human development. They outlive males by just over four years, adult women are slightly more likely to have completed high school and college, and girls’ school enrollment is higher than boys’. Yet women’s median earnings lag behind men’s by $8,628 per year.
KEY FINDINGS: HEALTH
• Sonoma County residents have an average life expectancy of 81.0—two years longer than the national average of 79.0 but just under California’s life expectancy of 81.2.
• An entire decade separates the life expectancies in the top and bottom census tracts.
The most extreme disparities in basic health, education, and earnings outcomes are often found within small geographical areas.

10 THE MEASURE OF AMERICA SERIES
• The top five tracts are Central Bennett Valley (85.7 years), Sea Ranch/Timber Cove and Jenner/Cazadero (both 84.8 years), Annadel/South Oakmont and North Oakmont/Hood Mountain (both 84.3 years), and West Sebastopol/Graton (84.1 years). The bottom five are Bicentennial Park (77.0 years), Sheppard (76.6 years), Burbank Gardens (76.0 years), Downtown Santa Rosa (75.5 years), and Kenwood/Glen Ellen (75.2 years).
• Analysis of Sonoma County’s ninety-nine tracts shows a clear positive correlation between life expectancy and education: people in neighborhoods with higher educational attainment and enrollment have longer lives.
• Asian Americans in Sonoma County live the longest compared to other major racial and ethnic groups (86.2 years), followed by Latinos (85.3 years), whites (80.5 years), and African Americans (77.7 years).
KEY FINDINGS: EDUCATION
• Variation in educational outcomes by census tract in Sonoma County is significant and meaningful. The range in the percentage of adult residents with less than a high school diploma is huge, going from a low of 0.4 percent in North Oakmont/Hood Mountain to a high of 46.1 percent in Roseland Creek. The range in school enrollment is likewise vast, from 53.8 percent in Forestville to 100 percent in Central East Windsor.
• In Sonoma County, as in most metro areas and states as well as nationally, educational attainment follows a similar pattern: Asian Americans have the highest score, followed by whites, African Americans, and Latinos. The Education Index is measured by combining the highest degree attained by adults 25 and older and school enrollment of all kids and young adults ages 3 to 24.
• The Census Bureau–defined category “Asian” encompasses U.S.-born citizens who trace their heritage to a wide range of Asian countries, as well as Asian immigrants. The high level of average attainment for this broad group obscures the education struggles of some. While 59.7 percent of Asian Indians in Sonoma County have at least a bachelor’s degree, only 17.5 percent of Vietnamese residents do.
KEY FINDINGS: EARNINGS
• Median earnings, the main gauge of material living standards in this report, are $30,214 annually in Sonoma County, which is roughly on par with earnings in California and the country as a whole.
An entire decade separates the life expectancies in the top and bottom census tracts.

11A PORTRAIT OF SONOMA COUNTY 2014
KEY FINDINGS
Of the three indicators analyzed in this report—unemployment, child poverty, and housing burden—Sonoma falls near the middle of the pack compared to its peer counties in California.
• Significant disparities in earnings separate census tracts within Sonoma County; annual earnings range from $14,946 in Rohnert Park B/C/R Section, which is below the federal poverty line for a two-person household, to $68,967 in East Bennett Valley, more than double the county median.
• In Sonoma County, whites earn the most money, $36,647 annually, followed by Asian Americans ($32,495), African Americans ($31,213), and Latinos ($21,695). This is found in California as a whole as well, although Asian Americans are the top-earning group in the country overall.
• Men in Sonoma County earn about $8,500 more than women. This wage gap is similar to the gap between men and women at the state level, although it is around $1,000 smaller than at the national level.
• Level of education is the single biggest predictor of earnings for racial and ethnic groups and for census tracts in Sonoma County.
Conclusion—Pledge of SupportSonoma County is rich in organizations dedicated to improving life for its residents, particularly those who face high barriers to living freely chosen lives of value and opportunity. Working together, these public and private organizations can make a real difference. Thus, this report not only ends with an Agenda for Action—a set of recommendations in health, education, and income that scholarly research and well-documented experience have shown will be essential to boosting Index scores—but also a Pledge of Support from these community actors.
Over sixty organizations and elected officials have committed thus far to using A Portrait of Sonoma County to better understand gaps in opportunities and to partner with community organizations and agencies to identify the strengths and assets on which to build a comprehensive and inclusive response to the report. This list will grow as the report is released, understood, and shared across the county, and communities will play a critical role in owning the data and creating solutions moving forward. Those who have signed the Pledge of Support aim to leverage resources, empower communities, share best practices, and strategically focus their efforts in order to creatively contribute to a new and innovative discussion of health equity in Sonoma County. Recognizing that only by working together as equal partners with a shared vision and common agenda, these groups and individuals hope to achieve their long-term goal of making Sonoma County the healthiest county in the state for all residents to work, live, and play.
Over sixty organizations and elected officials have committed thus far to using A Portrait of Sonoma County to better understand gaps in opportunities and to build a comprehensive and inclusive response to the report.

Understanding Human Development

13A PORTRAIT OF SONOMA COUNTY 2014
UNDERSTANDING HUMAN DEVELOPMENT
IntroductionSonoma County is a leading producer of wine grapes and, after suffering negative impacts from the Great Recession, is seeing renewed vigor in the tourism industry. The county now ranks as a very competitive place to do business.1 We know this from frequently collected and closely tracked economic metrics that provide an important account of how the economy is doing in U.S. states and counties. For a more complete story of how people are doing, however, in Sonoma County and elsewhere, we need human metrics, which tend to be lower on the list of information-gathering priorities. For example, health data on something as basic as how long people are living in our states and counties, as well as by race and ethnicity within our communities, are rarely calculated. They are, however, incorporated—along with other important indicators on education and earnings—into the American Human Development Index.
Telling a more complete story has been a goal of the Sonoma County Department of Health Services (DHS) for several years. In 2007, DHS convened a major initiative called Health Action to improve health in Sonoma County and achieve the vision of making the county the healthiest in California. Unlike many other health initiatives at the time, the goal was to move beyond a narrowly defined focus on sickness and medical care to take into account a wide range of vital determinants of well-being and health, such as economic opportunities; living and working conditions in homes, schools, and workplaces; community inclusion; and levels of stigma and isolation. In doing so, DHS sought to engage a broad spectrum of stakeholders and pinpoint root causes of health problems rather than focusing solely on disease and illness. BOX 1 outlines the county’s vibrant response to bringing about systemic change in people’s lives.
For a more complete story of how people are doing, we need human metrics.
BOX 1 Sonoma County’s Goal to Bring About Health Equity for All
Sonoma County aspires to be the healthiest county in California. Health Action, Sonoma County’s collective impact initiative to improve the health and well-being of all residents, has established a cross-sector approach to meet this vision. Ten broad goals and target outcomes guide strategic planning to address major determinants of health, with a strong focus on eliminating health disparities in those communities that experience the most negative health outcomes as a result of poor access to opportunity and prosperity. In order to meet the county’s goals of health equity for all, the Health Action Council, a group of forty-seven leaders committed to this vision, is focusing on three broad priority areas: educational attainment, economic security, and health system improvement, in line with the 2013–2016 Action Plan
approved by the Sonoma County Board of Supervisors in 2012. Subcommittees of Health Action, including Cradle to Career and the Committee for Healthcare Improvement, in collaboration with a host of other initiatives, assess local data to identify issues across a spectrum of areas that affect health. These subcommittees recommend specific actions, drawing from evidence-based and prevention-focused programs promoted by the Upstream Investments Policy. The initiatives all rely on strong partnerships with nonprofit organizations, government agencies, foundations, businesses, local community groups—including place-based Health Action Chapters—and other sectors across the county to maximize resources and impact.

14 THE MEASURE OF AMERICA SERIES
During the course of this work, DHS became acquainted with the human development approach, which had been applied in well-being reports on California and Marin County, and saw that it might be useful to its work on the social determinants of health. The connection led to the commissioning of this report.
Human development is formally defined as the process of improving people’s well-being and expanding their freedoms and opportunities—in other words, it is about what people can do and be. The human development approach puts people at the center of analysis and looks at the range of interlocking factors that shape their opportunities and enable them to live lives of value and choice. People with high levels of human development can invest in themselves and their families and live to their full potential; those without find many doors shut and many choices and opportunities out of reach.
The human development concept is the brainchild of the late economist Mahbub ul Haq. In his work at the World Bank in the 1970s, and later as minister of finance in his own country of Pakistan, Dr. Haq argued that existing measures of human progress failed to account for the true purpose of development: to improve people’s lives. In particular, he believed the commonly used measure of Gross Domestic Product (GDP) was an inadequate measure of well-being.
Dr. Haq often cited the example of Vietnam and Pakistan. In the late 1980s, both had the same GDP per capita—around $2,000 per year—but the Vietnamese, on average, lived a full eight years longer than Pakistanis and were twice as likely to be able to read. In other words, money alone did not tell the whole story; the same income was “buying” two dramatically different levels of well-being. Working with Harvard professor and Nobel laureate Amartya Sen and other gifted economists, Dr. Haq published the first Human Development Report in 1990 with the sponsorship of the UN Development Programme.
The Human Development Report is widely known as a useful analysis of the well-being of large populations. In addition to the global edition that comes out annually, reports have been produced in more than 160 countries in the last fifteen years, with an impressive record of spurring public debate and political engagement. Today, the Human Development Report with its trademark Human Development Index is a global gold standard and a well-known vehicle for change.
Measure of America (MOA), a project of the nonprofit Social Science Research Council, is built upon the UN Human Development Index. MOA keeps the same conceptual framework and areas of focus but uses data more relevant to an affluent democracy such as the United States, rather than those applicable to the full range of conditions found in the 183 United Nations member states. Since MOA introduced a modified American Human Development Index in 2008, organizations and communities across the country have used it to understand community needs and shape evidence-based policies and people-centered investments.
Measure of America Publications
COUNTY REPORTSA Portrait of Marin: Marin Human Development Report 2012
THEMATIC REPORTSHalve The Gap: Youth Disconnection in America’s Cities 2013
NATIONAL REPORTSThe Measure of America 2010–2011: Mapping Risks & Resilience
STATE REPORTSA Portrait of California: California Human Development Report 2011

15A PORTRAIT OF SONOMA COUNTY 2014
UNDERSTANDING HUMAN DEVELOPMENT
How Is Human Development Measured? The human development concept is broad: it encompasses the economic, social, legal, psychological, cultural, environmental, and political processes that define the range of options available to people. The Human Development Index, however, measures just three fundamental human development dimensions: a long and healthy life, access to knowledge, and a decent standard of living. The threecomponents are weighted equally on the premise that each is equally important forhuman well-being. People around the world value these as core building blocks of a life of freedom and dignity, and good proxy indicators are available for each. The index is the start of a conversation about well-being and access to opportunity and a useful summary measure that allows for reliable comparisons of groups and areas. Once disparities in these basic outcomes have been brought to light through the use of objective data, the next task is to examine the underlying conditions and choices that have led to them by exploring a whole host of other indicators.
In broad terms, the first steps for calculating the index are to compile or calculate the four indicators that comprise it: life expectancy, school enrollment, educational degree attainment, and median personal earnings. Because these indicators use different scales (years, dollars, percent), they must be put on a common scale so that they can be combined. Three sub-indexes, one for each of the three dimensions that make up the index—health, education, and earnings—are created on a scale of 0 to 10. The process requires the selection of minimum and maximum values—or “goalposts”—for each of the four indicators. These goalposts are determined based on the range of the indicator observed from the data and also taking into account possible increases and decreases in years to come. For life expectancy, for example, the goalposts are ninety years at the high end and sixty-six years at the low end. The three sub-indexes are then added together and divided by three to yield the American Human Development Index value. (See FIGURE 1; also, a detailed technical description of how the index is calculated is contained in the Methodological Note on page 96.)
The American Human Development Index is sensitive to changes in the indicators that constitute it and therefore responsive to changes in well-being within the populations it is used to measure. For example, if life expectancy at birth in Sonoma County were to increase by one year while all other indicators remained the same, the index value for the county would increase from 5.42 to 5.56. To achieve a similar increase in the county’s index score holding health and education indicators constant, median personal earnings would need to grow by $1,900.
The Human Development Index measures three fundamental human development dimensions: a long and healthy life, access to knowledge, and a decent standard of living.

16 THE MEASURE OF AMERICA SERIES
CAPABILITIES
A DecentStandard of Living
Access toKnowledge
A Long andHealthy Life
THREE DIMENSIONS
AmericanHuman Development
INDEX
3
HealthINDEX
+ +Education
INDEXIncomeINDEX
INDICATORS
Life expectancyat birth
Medianearnings
Schoolenrollment
Educationaldegree attainment
equality before the law
respect of others
digital access self-expression
physical safety family and community
political participation voice and autonomy
religious freedom
sustainable environment
A Long and Healthy Life is measured using life expectancy at birth. It is calculated using mortality data from the Death Statistical Master Files of the California Department of Public Health and population data from the U.S. Census Bureau for 2005–11.
Access to Knowledge is measured using two indicators: school enrollment for the population 3 to 24 years of age and educational degree attainment for those 25 and older. A one-third weight is applied to the enrollment indicator and a two-thirds weight to the degree attainment indicator. Both are from the U.S. Census Bureau’s 2012 American Community Survey.
A Decent Standard of Living is measured using median earnings of all full- and part-time workers age 16 and older from the same 2012 American Community Survey.
FIGURE 1 Human Development: From Concept to Measurement
17A PORTRAIT OF SONOMA COUNTY 2014
UNDERSTANDING HUMAN DEVELOPMENT
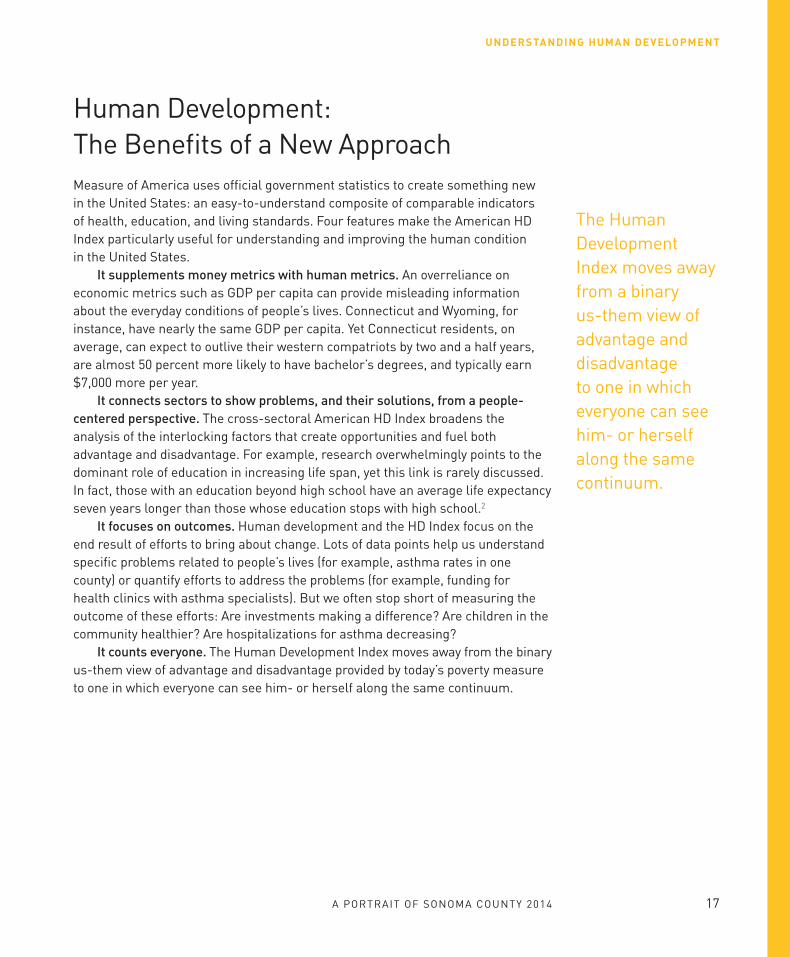
Human Development: The Benefits of a New Approach Measure of America uses official government statistics to create something new in the United States: an easy-to-understand composite of comparable indicators of health, education, and living standards. Four features make the American HD Index particularly useful for understanding and improving the human condition in the United States.
It supplements money metrics with human metrics. An overreliance on economic metrics such as GDP per capita can provide misleading information about the everyday conditions of people’s lives. Connecticut and Wyoming, for instance, have nearly the same GDP per capita. Yet Connecticut residents, on average, can expect to outlive their western compatriots by two and a half years, are almost 50 percent more likely to have bachelor’s degrees, and typically earn $7,000 more per year.
It connects sectors to show problems, and their solutions, from a people-centered perspective. The cross-sectoral American HD Index broadens the analysis of the interlocking factors that create opportunities and fuel both advantage and disadvantage. For example, research overwhelmingly points to the dominant role of education in increasing life span, yet this link is rarely discussed. In fact, those with an education beyond high school have an average life expectancy seven years longer than those whose education stops with high school.2
It focuses on outcomes. Human development and the HD Index focus on the end result of efforts to bring about change. Lots of data points help us understand specific problems related to people’s lives (for example, asthma rates in one county) or quantify efforts to address the problems (for example, funding for health clinics with asthma specialists). But we often stop short of measuring the outcome of these efforts: Are investments making a difference? Are children in the community healthier? Are hospitalizations for asthma decreasing?
It counts everyone. The Human Development Index moves away from the binary us-them view of advantage and disadvantage provided by today’s poverty measure to one in which everyone can see him- or herself along the same continuum.
The Human Development Index moves away from a binary us-them view of advantage and disadvantage to one in which everyone can see him- or herself along the same continuum.

307people
PER SQUARE MILE
Four hundred eighty-threethousand, eight hundred
seventy-eight people
Who Are We?KEY FACTS ABOUT THE POPULATION OF SONOMA COUNTY
GENDER URBAN | RURAL
AGE
16%Rural
84%Urban
49%Male
51%Female
83%NativeBorn
17%Foreign
Born
BIRTHPLACE
HOME OWNERSHIP
40%Rent
60%Own
0–19 20–44 45–64 65–84 85+
25% 32% 29%12%
2%
RACE & ETHNICITY
66.1%White
24.9%Latino
3.9%Some other race/races
3.7%Asian American
1.4%African American
NATIVITY BY RACE
Asian American
27% Native Born
73% Foreign Born
87%Native Born
13% Foreign Born
Some Other Race/Races
97% Native Born
3%Foreign Born
White
58% Native Born
42% Foreign Born
Latino
80% Native Born
20% Foreign Born
African American
EMPLOYMENT
Information 1.9%
3.0%Transportation,Warehousing, Utilities
3.7%Agriculture, Forestry,Fishing, Hunting, Mining
3.8%Public Administration
Other Services(except Public Administration) 5.7%
Finance, Insurance,Real Estate 6.1%
Construction 7.4%
Manufacturing 10.3%
Entertainment, Arts,Recreation, Accommodation 11.0%
Services (professional, scientific,management, etc.) 12.2%
14.9%Trade(wholesale, retail)
Education, Health Care,Social Assistance 20%
Total population
483,878
THE MEASURE OF AMERICA SERIES18

307people
PER SQUARE MILE
Four hundred eighty-threethousand, eight hundred
seventy-eight people
Who Are We?KEY FACTS ABOUT THE POPULATION OF SONOMA COUNTY
GENDER URBAN | RURAL
AGE
16%Rural
84%Urban
49%Male
51%Female
83%NativeBorn
17%Foreign
Born
BIRTHPLACE
HOME OWNERSHIP
40%Rent
60%Own
0–19 20–44 45–64 65–84 85+
25% 32% 29%12%
2%
RACE & ETHNICITY
66.1%White
24.9%Latino
3.9%Some other race/races
3.7%Asian American
1.4%African American
NATIVITY BY RACE
Asian American
27% Native Born
73% Foreign Born
87%Native Born
13% Foreign Born
Some Other Race/Races
97% Native Born
3%Foreign Born
White
58% Native Born
42% Foreign Born
Latino
80% Native Born
20% Foreign Born
African American
EMPLOYMENT
Information 1.9%
3.0%Transportation,Warehousing, Utilities
3.7%Agriculture, Forestry,Fishing, Hunting, Mining
3.8%Public Administration
Other Services(except Public Administration) 5.7%
Finance, Insurance,Real Estate 6.1%
Construction 7.4%
Manufacturing 10.3%
Entertainment, Arts,Recreation, Accommodation 11.0%
Services (professional, scientific,management, etc.) 12.2%
14.9%Trade(wholesale, retail)
Education, Health Care,Social Assistance 20%
Total population
483,878
Note: Population data by gender, urban/rural, and age are from 2010; all other data are from 2012. Totals may not equal 100 due to rounding. Sources: U.S. Census Bureau, Census 2010 and American Community Survey 2012.
A PORTRAIT OF SONOMA COUNTY 2014 19

IN T
HIS
SE
CT
ION
Sonoma County: What the Human Development Index Reveals
Sonoma County in Context
Variation by Race and Ethnicity
Variation by Gender
Variation by Geography: Census Tracts

21A PORTRAIT OF SONOMA COUNTY 2014
SONOMA COUNTY: WHAT THE HUMAN DEVELOPMENT INDEX REVEALS
Sonoma County in ContextWhile the American Human Development Index does not measure Sonoma County’s breathtaking vistas, the rich diversity of its population, or the vibrant web of community organizations engaged in making it a better place, it captures outcomes in three areas essential to well-being and access to opportunity. Encapsulated within these three broad areas are many others: for example, life expectancy is affected by the quality of the air we breathe, the amount of stress in our daily lives, the presence or absence of occupational hazards, and many other factors.
Sonoma County’s Human Development Index value is 5.42 out of a possible total of 10. This score is well above the U.S. index value of 5.07 and slightly above California’s value of 5.39. Relative to seven other California counties that share some important socioeconomic characteristics with it, Sonoma County ranks sixth on the index, below Marin, Santa Cruz, San Luis Obispo, Ventura, and Napa Counties, but above both Santa Barbara and Monterey Counties (see SIDEBAR). These counties were selected for this analysis because the Sonoma County Economic Development Board uses them as a benchmark against which to assess the county in the areas of business and jobs. As discussed below, Sonoma County falls toward the middle of this group on education and earnings but is at the bottom in terms of life expectancy.3
Sonoma County is made up of ninety-nine inhabited areas (or neighborhoods) designated by the U.S. Census Bureau as census tracts. Each contains an average of 5,000 inhabitants, enabling comparisons of neighborhoods with roughly the same population size. Together they encompass all the land within the county boundaries, including tribal lands. In sixty-nine tracts, or two-thirds of the county’s census-defined neighborhoods, well-being and access to opportunity fall above the U.S. average of 5.07.
The following is an exploration of the state of well-being within Sonoma County. It presents and analyzes index scores based on a number of indicators for the major racial and ethnic groups, for women and men, and for the county’s census tracts, which contain the smallest place-based population groups for which reliable, comparable data on these indicators are available from the U.S. Census Bureau.
Sonoma and Comparable Counties on the HD Index
Marin(7.73)
Santa Cruz(5.79)
San Luis Obispo(5.60)
Ventura(5.59)
Napa(5.43)
Sonoma(5.42)
Santa Barbara(5.06)
Monterey(4.47)
Sources: Measure of America analysis of data from the California Department of Public Health 2005–2012, and U.S. Census Bureau, American Community Survey, 2012.

22 THE MEASURE OF AMERICA SERIES
VARIATION BY RACE AND ETHNICITY
The American Human Development Index scores of Sonoma County’s major racial and ethnic groups vary significantly. The groups we examine are defined by the White House Office of Management and Budget, although we cannot include Native Americans in the index, as they make up less than 1 percent of Sonoma County’s population. The report does discuss issues concerning Native American well-being, however.
The ranking of well-being levels by race and ethnicity in Sonoma County follows that of California, with Asian Americans at the top, followed by whites, African Americans, and Latinos. A similar pattern holds nationwide, although Latinos fare better than African Americans at the national level, and Native Americans have the lowest score.4 Even so, Sonoma County differs from the state and nation in some surprising ways. One considerable difference is the gap in human development between the highest- and lowest-ranked racial and ethnic groups, which is smaller in Sonoma County (2.83) than in California (3.25). Given the increasing evidence that extreme racial disparities in terms of income and other factors can be detrimental to many aspects of well-being, this is indeed very good news for Sonoma.5
A second difference concerns the well-being of Asian Americans, who are the only major racial or ethnic group with an HD Index value lower in Sonoma County than in the United States, even though they are ranked first overall in Sonoma. This lower Asian American value is in marked contrast to that of African Americans, with an index value in Sonoma a surprising 23 percent higher than for African Americans nationally; likewise, the index value is 5 percent greater for Sonoma’s Latinos than the national Latino average and 11 percent greater for whites. The following are some notable strengths of and challenges for each of these groups in Sonoma County:
Sonoma County’s racial and ethnic well-being gap is smaller than that of California.
Source: Race and ethnic group estimates for California are from Lewis and Burd-Sharps (2013). Remainder are from Measure of America analysis of data from the California Department of Public Health 2005–2011, and U.S. Census Bureau, American Community Survey, 2012.
10
9
8
7
6
5
4
3
2
1
0
AsianAmericans
(7.30)
Latinos(4.05)
CALIFORNIAHD INDEX
AsianAmericans
(7.10)
Latinos(4.27)
SONOMAHD INDEX
FIGURE 2 Human Development Outcomes among Sonoma County’s Major Racial and Ethnic Groups Vary Significantly
Whites(6.01 OVERALL HD)
African Americans(4.68 OVERALL HD)
0
2
4
6
8
10
5.926.056.06
2.37
8.03
2.43
5.23INCOME INDEX
8.44HEALTH INDEX
7.64EDUCATION INDEX
Asian Americans(7.10 OVERALL HD)
Latinos(4.27 OVERALL HD)
4.864.25
4.95
Source: Measure of America analysis of California Department of Public Health, Death Statistical Master File, 2005–2011, and U.S. Census Bureau, American Community Survey, 2012.

23A PORTRAIT OF SONOMA COUNTY 2014
SONOMA COUNTY: WHAT THE HUMAN DEVELOPMENT INDEX REVEALS
Asian Americans, who make up 3.7 percent of Sonoma County’s population, have the highest well-being score in Sonoma, at 7.10. Their strongest dimension is health: Asian Americans live longer than members of any other racial and ethnic group, 86.2 years. The high educational attainment of Sonoma County’s Asian American adults is also impressive; 44.4 percent have at least a bachelor’s degree, as compared to whites at 38 percent. One area in which the group lags, though, is high school completion; nearly 13 percent of Sonoma’s Asian American adults age 25 and older did not complete high school or an equivalency diploma. One factor to consider when looking at these data is that the Census Bureau–defined category “Asian” is extremely broad. It encompasses U.S.-born citizens who trace their heritage to a wide range of Asian countries as well as Asian immigrants who arrive in the United States from extraordinarily diverse circumstances (see SIDEBAR). This split record on educational attainment can be traced to the differing educational opportunities of immigrants and their children. But like immigrant groups before them, the second generation tends to have far higher levels of educational attainment than their parents. While overall educational outcomes of Asian Americans are higher than those of whites, median personal earnings, or the wages and salaries of the typical worker in Sonoma County, are considerably lower, with a gap of over $4,000 ($32,495 for Asian Americans, as compared to $36,647 for whites). Earnings are explored in greater depth in the chapter on Standard of Living. Whites, who make up 66.1 percent of Sonoma County’s population, have an index score of 6.01, the second-highest among the racial and ethnic groups. Whites can expect to live 80.5 years, which is on par with the California and Sonoma life expectancies; over 95 percent of adults have completed high school; and earnings are $36,647, well above California’s median of $30,500, but considerably lower than other nearby counties. Whites in Santa Cruz, Ventura, and Napa Counties, for example, earn roughly $40,000, $42,000, and $39,500, respectively. African Americans, who make up 1.4 percent of Sonoma County’s population, rank third with an index score of 4.68. African Americans fare better in Sonoma County than in California as a whole, and while they are below Latinos in the national HD Index ranking, their score in the county is higher than Latinos’. African Americans also have rates of college attainment and median personal earnings at or above Sonoma County’s average. Yet, as in the nation and in California, they have the shortest life expectancy at birth. An African American baby born today in Sonoma County can expect to live eight and a half years less than an Asian American baby and seven and a half years less than a Latino baby. Latinos, who make up 24.9 percent of Sonoma County’s population, have the lowest score on the index, 4.27. Yet Latinos in Sonoma County do better in terms of human well-being than they do in the state as a whole (the Latino statewide score is 4.05). As discussed below, Latino life expectancy in Sonoma County is very high; Latinos outlive whites, on average, by nearly half a decade.
Major Asian Subgroups in Sonoma County
Source: U.S. Census Bureau. American Community Survey, 2012, 5-year estimates.
23%
18%
13%
9%
8%
6%
5%
5%
4%
FILIPINO
CHINESE (Except Taiwanese)
VIETNAMESE
ASIAN INDIAN
JAPANESE
OTHER ASIAN
KOREAN
CAMBODIAN
LAOTIAN

24 THE MEASURE OF AMERICA SERIES
Education and income indicators are far behind, however. Nearly 44 percent of Latino adults did not complete high school, and their median earnings are only about $21,500, which is below the poverty line for a family of four.
In the chapters that follow, the distribution of well-being by race and ethnicity in health, education, and earnings are explored further.
VARIATION BY GENDER
Sonoma County’s females edge out males in human development by a small margin; their score is 5.41, as compared with 5.30. Females outlive males by just over four years, women are slightly more likely to have completed high school and college than men, and girls’ school enrollment is higher than boys’.6 Females age 16 years and older in the workforce, however, lag behind males in earnings by an annual amount of $8,628 (see SIDEBAR). The difference in life expectancy between men and women can largely be attributed to biological genetic factors—the world over, females have an average four- to five-year advantage in life span over males, though differing patterns of health and risk behaviors play a role as well. In the United States, women have taken to heart the notions that education is an assured route to expanding options beyond traditional low-paying “female” occupations and that competing in today’s globalized knowledge economy requires higher education; girls and young women today are graduating high school and college at higher rates than men across the nation. Yet, as the numbers show, higher educational achievement has not automatically translated into higher earnings. The earnings gap between men and women remains stubbornly persistent.7 Median personal earnings include both full- and part-time workers, so part of the difference is a higher proportion of Sonoma County’s women than men working part time.8 These gaps are also explained in part by the wage “penalty” women pay if they leave the workforce to raise children; in part by women’s predominance in such low-wage occupations as child-care providers and home health aides; and in part by the persistence of wage discrimination—even in a female-dominated field like education, where two in three workers are women, men earn $17,000 more per year.9
In Sonoma, women live longer and have more education, but men earn more.
Source: Measure of America analysis of data from the California Department of Public Health 2005-2011, and U.S. Census Bureau, American Community Survey, 2012, 1-year estimates.
EDUCATION
HEALTH
EARNINGS
Men78.9years
Men85%with
at least ahigh school
diploma
Men$34K
per year
Women$26K
per year
Women83.0years
Women89%with
at least ahigh school
diploma

25A PORTRAIT OF SONOMA COUNTY 2014
SONOMA COUNTY: WHAT THE HUMAN DEVELOPMENT INDEX REVEALS
VARIATION BY GEOGRAPHY: CENSUS TRACTS
A look at the Sonoma County human development map does not reveal any particular geographical pattern to well-being outcomes (see MAP 1). High human development areas are found in the north as well as the south and in cities as well as rural areas. What is clear, however, as is true across America, is that the most extreme disparities in basic social and economic outcomes are often found within small geographical areas. At the top of the Sonoma County well-being scale are three census tracts in and around the city of Santa Rosa: East Bennett Valley, Fountain Grove, and Skyhawk. Three Santa Rosa neighborhoods are also at the bottom: Sheppard, Roseland, and Roseland Creek (see SIDEBAR). Top-ranking East Bennett Valley, with an index value of 8.47, is five miles east of bottom-ranking Roseland Creek, with an index value of 2.79. The former has a Human Development Index value above that of top-ranked-state Connecticut, while the well-being outcomes of the latter are well below those of Mississippi, the lowest-ranked state on the American HD Index.
In East Bennett Valley, a baby born today can expect to live 82 years. Virtually every adult living in this tract has completed high school, and nearly three in five have at least a bachelor’s degree. Median personal earnings ($68,967) are more than double those of the typical Sonoma County worker. East Bennett Valley is 90 percent white, 5 percent Latino, 3 percent Asian, and less than 1 percent African American.
In contrast, life expectancy at birth in Roseland Creek is only 77.1 years, and educational outcomes are alarmingly low, with nearly half (46 percent) of adults today lacking the barebones minimum of a high school diploma. The typical worker in Roseland Creek earns $21,699, about the same as the earnings of an American worker in the late 1960s (in inflation-adjusted dollars). Roseland Creek is 60 percent Latino, 30 percent white, 5 percent Asian American, and 2 percent African American.
Sonoma County vs. United States
10
9
8
7
6
5
4
3
2
1
0
Connecticut(6.17)
Mississippi(3.81)
U.S.HD INDEX
SONOMAHD INDEX
RoselandCreek(2.79)
East Bennett Valley(8.47)
Sources: Lewis and Burd-Sharps (2013) and Measure of America analysis of data from the California Department of Public Health 2005–2011, and US Census Bureau, American Community Survey, 2012, 5-year estimates.

26 THE MEASURE OF AMERICA SERIES
MAP 1 Human Development in Sonoma County by Census Tract
HD INDEX
5.79–6.57
6.58–8.47
5.44–5.78
4.32–5.43
2.79–4.31
SantaRosa
Petaluma
101
1
116
12
128
121
37
29
175
116
12
101
101
Sea Ranch Lake Sonoma
Cloverdale
Geyserville
Healdsburg
Windsor
Calistoga
Santa Rosa
Guerneville
Bodega Bay
TomalesPetaluma
Novato
SonomaCotati
Rohnert Park
20 Miles100

27A PORTRAIT OF SONOMA COUNTY 2014
SONOMA COUNTY: WHAT THE HUMAN DEVELOPMENT INDEX REVEALS
TABLE 1 Human Development in Sonoma County by Census Tract
HD INDEX
LIFE EXPECTANCY
AT BIRTH (years)
LESS THAN HIGH SCHOOL
(%)
AT LEAST BACHELOR’S
DEGREE (%)
GRADUATE OR PROFESSIONAL
DEGREE(%)
SCHOOL ENROLLMENT
(%)
MEDIAN EARNINGS
(2012 dollars)
California 5.39 81.2 18.5 30.9 11.3 78.5 30,502
Sonoma County 5.42 81.0 13.1 31.8 11.7 77.9 30,214
1 East Bennett Valley 8.47 82.0 0.5 58.6 24.0 90.2 68,967
2 Fountain Grove 8.35 82.0 4.2 56.6 24.6 88.7 67,357
3 Skyhawk 7.78 83.1 3.6 57.8 22.5 84.1 50,633
4 Annadel/South Oakmont 7.71 84.3 3.1 54.3 21.2 86.5 45,441
5 Old Quarry 7.71 82.5 3.7 57.5 26.5 93.1 43,919
6 Rural Cemetery 7.67 83.6 3.4 48.0 25.7 92.5 43,240
7 Central Bennett Valley 7.63 85.7 6.3 40.8 15.8 89.4 44,564
8 Sea Ranch/Timber Cove 7.35 84.8 1.1 65.4 40.8 86.7 31,552
9 Cherry Valley 7.18 81.1 5.6 40.1 15.7 90.6 47,536
10 Sonoma Mountain 7.16 81.2 4.3 39.8 7.7 87.3 51,590
11 Windsor East 7.06 83.3 7.2 40.5 13.7 81.9 45,526
12 Meadow 7.00 81.2 4.5 39.1 15.1 85.5 47,368
13 Petaluma Airport/Arroyo Park 6.98 82.4 5.0 36.9 8.4 88.3 44,504
14 Downtown Sonoma 6.95 80.4 4.3 52.3 19.7 86.1 42,835
15 Southwest Sebastopol 6.94 81.5 6.5 41.9 15.6 85.5 44,669
16 Gold Ridge 6.94 83.4 5.4 51.4 21.5 77.5 40,151
17 Arnold Drive/East Sonoma Mountain 6.77 82.6 5.1 50.9 13.8 78.7 40,369
18 Central East Windsor 6.71 83.3 9.5 21.2 8.4 100.0 38,783
19 Larkfield-Wikiup 6.62 81.2 6.4 36.2 9.9 81.9 44,643
20 Sonoma City South/Vineburg 6.57 80.4 5.4 32.0 13.3 90.1 41,168
21 Southern Junior College Neighborhood 6.56 81.9 4.0 49.5 18.1 79.7 37,055
22 Jenner/Cazadero 6.55 84.8 4.7 35.9 12.1 80.2 35,000
23 Occidental/Bodega 6.47 81.7 5.0 51.5 25.5 83.4 32,468
24 Fulton 6.46 81.2 12.2 30.2 7.1 89.2 41,465
25 Spring Hill 6.45 77.1 8.2 45.7 15.3 86.4 46,214
26 Casa Grande 6.42 82.4 7.6 38.4 12.6 84.7 35,987
27 Montgomery Village 6.38 82.0 3.8 32.7 10.8 86.4 36,101
28 Hessel Community 6.37 81.3 7.7 34.0 12.1 83.1 39,743
29 Rohnert Park F/H Section 6.22 81.6 6.3 31.1 8.8 87.0 35,610
30 West Bennett Valley 6.17 81.6 6.6 47.5 18.8 72.4 36,145
31 Carneros Sonoma Area 6.15 81.7 8.3 39.6 12.1 92.3 30,052
32 Northeast Windsor 6.15 83.3 12.2 23.2 5.7 81.9 37,289
33 North Healdsburg 6.11 81.7 12.0 41.9 18.4 81.8 32,928
34 Windsor Southeast 6.11 79.6 11.1 16.6 5.6 94.2 40,145
35 Southeast Sebastopol 6.10 79.2 7.3 36.0 15.0 78.9 41,014
36 West Windsor 6.07 82.0 15.0 32.0 8.2 80.6 37,695
37 North Oakmont/Hood Mountain 5.98 84.3 0.4 44.2 18.9 95.0 20,406
38 North Sebastopol 5.84 82.1 8.0 39.5 16.4 75.1 31,627
39 East Cotati/Rohnert Park L Section 5.79 80.6 11.2 24.7 7.0 83.6 35,880
40 Sonoma City North/West Mayacamas Mountain 5.78 81.8 7.3 43.1 15.3 73.0 31,649
41 Grant 5.77 80.5 6.6 44.1 15.6 65.3 37,279
42 West Cloverdale 5.76 80.1 13.2 25.9 9.1 79.4 38,292
43 Rohnert Park M Section 5.75 81.9 5.9 28.3 7.0 85.0 30,179
44 Alexander Valley 5.73 82.1 17.8 32.1 13.2 79.2 32,303
45 Sunrise/Bond Parks 5.72 81.2 12.9 29.8 10.4 78.4 34,621
46 Piner 5.71 82.7 11.2 19.0 3.9 74.0 36,774
47 Laguna de Santa Rosa/Hall Road 5.69 82.0 18.4 30.6 9.3 81.5 32,231
48 Boyes Hot Springs West/El Verano 5.68 83.0 26.0 29.8 11.5 85.3 29,824
49 McKinley 5.66 80.6 17.3 30.6 8.9 78.1 36,114
50 Shiloh South 5.62 81.9 11.8 34.4 13.3 74.0 31,909

TABLE 1 Human Development in Sonoma County by Census Tract
HD INDEX
LIFE EXPECTANCY
AT BIRTH (years)
LESS THAN HIGH SCHOOL
(%)
AT LEAST BACHELOR’S
DEGREE (%)
GRADUATE OR PROFESSIONAL
DEGREE(%)
SCHOOL ENROLLMENT
(%)
MEDIAN EARNINGS
(2012 dollars)
California 5.39 81.2 18.5 30.9 11.3 78.5 30,502
Sonoma County 5.42 81.0 13.1 31.8 11.7 77.9 30,214
51 Middle Rincon South 5.61 80.3 7.3 28.7 10.3 85.4 30,568
52 Miwok 5.59 80.9 16.7 26.2 5.1 82.1 34,119
53 Spring Lake 5.59 81.4 11.6 33.3 14.1 75.5 31,683
54 La Tercera 5.58 78.8 16.4 25.9 4.7 86.9 36,216
55 West Sebastopol/Graton 5.58 84.1 14.4 45.1 16.1 61.2 30,518
56 Two Rock 5.55 82.4 9.6 32.3 12.0 72.2 30,949
57 Boyes Hot Springs/Fetters Springs/Agua Caliente East 5.55 81.8 14.2 40.4 17.3 72.6 30,164
58 Dry Creek 5.55 81.9 11.5 45.0 20.5 67.0 30,375
59 Rohnert Park SSU/J Section 5.50 80.4 13.5 33.2 9.6 80.5 31,638
60 Old Healdsburg 5.43 82.4 8.3 37.0 15.6 66.2 29,912
61 Schaefer 5.39 78.2 13.3 22.8 5.8 75.1 40,322
62 Guerneville/Rio Nido 5.29 80.1 11.1 32.4 15.6 65.1 34,547
63 West Cotati/Penngrove 5.25 80.6 16.3 26.1 7.6 77.3 31,499
64 Northern Junior College Neighborhood 5.25 80.0 5.3 33.0 9.2 70.3 31,860
65 Rohnert Park D/E/S Section 5.21 81.4 12.6 21.2 7.9 83.4 27,294
66 Pioneer Park 5.20 81.2 15.0 19.1 5.4 71.1 34,083
67 Russian River Valley 5.19 79.9 8.2 37.1 16.5 68.1 30,431
68 Brush Creek 5.15 79.5 15.1 32.2 10.8 74.7 31,334
69 Cinnabar/West Rural Petaluma 5.10 78.9 9.5 32.3 9.8 67.5 34,010
70 Central Rohnert Park 4.96 78.0 10.8 28.4 7.0 71.8 33,509
71 Kenwood/Glen Ellen 4.95 75.2 11.9 36.8 12.8 62.5 41,137
72 Wright 4.91 79.4 21.5 20.8 6.4 76.1 32,046
73 Central Windsor 4.84 79.6 17.2 22.4 8.5 73.2 30,436
74 Middle Rincon North 4.83 77.1 8.1 28.0 9.7 72.7 31,947
75 Olivet Road 4.82 80.5 12.3 22.0 7.4 78.2 26,118
76 Bellevue 4.66 81.0 25.4 13.0 4.6 78.5 27,511
77 Monte Rio 4.64 79.9 5.8 28.0 14.0 67.9 25,553
78 Lucchesi/McDowell 4.60 78.5 17.7 24.2 7.9 79.8 26,597
79 Forestville 4.57 79.7 7.2 35.0 15.6 53.8 26,561
80 Downtown Cotati 4.31 77.8 14.3 24.7 9.2 70.1 27,108
81 Kawana Springs 4.20 80.9 26.8 22.1 5.4 78.6 21,510
82 Central Healdsburg 4.14 79.3 22.7 23.0 9.3 67.1 25,463
83 Railroad Square 4.12 79.7 21.7 14.0 5.9 78.0 22,908
84 Downtown Rohnert Park 4.09 79.5 10.0 18.6 3.9 60.1 26,630
85 Coddingtown 4.08 78.9 21.4 16.5 4.7 75.6 24,114
86 Burbank Gardens 4.03 76.0 16.1 29.8 14.8 79.0 22,421
87 Rohnert Park B/C/R Section 3.97 80.4 10.0 28.7 8.3 85.9 14,946
88 Comstock 3.90 78.0 33.0 8.4 3.2 81.2 25,000
89 Taylor Mountain 3.90 77.1 23.2 13.1 2.9 71.3 27,688
90 Downtown Santa Rosa 3.89 75.5 8.4 30.1 7.4 75.2 22,628
91 East Cloverdale 3.79 80.1 30.3 12.4 2.9 63.5 25,721
92 Rohnert Park A Section 3.75 77.9 22.0 14.2 3.7 76.4 22,522
93 Bicentennial Park 3.73 77.0 26.6 21.5 5.0 71.2 24,760
94 West End 3.51 78.7 35.7 12.9 3.6 73.2 22,294
95 West Junior College 3.44 79.3 17.1 22.7 7.0 65.3 18,919
96 Fetters Springs/Agua Caliente West 3.41 81.8 45.4 17.1 5.8 67.8 19,444
97 Sheppard 2.98 76.6 41.8 8.2 3.6 71.7 22,068
98 Roseland 2.95 77.1 40.8 14.4 4.1 65.4 21,883
99 Roseland Creek 2.79 77.1 46.1 8.6 4.3 66.2 21,699
Sources: Measure of America analysis of data from the California Department of Public Health, Death Statistical Master File, 2005–2011, and U.S. Census Bureau, American Community Survey, 2012 and 2008–2012.

29A PORTRAIT OF SONOMA COUNTY 2014
SONOMA COUNTY: WHAT THE HUMAN DEVELOPMENT INDEX REVEALS
The three chapters that follow examine gaps in Sonoma County in three basic areas vital to well-being and access to opportunity—health, education, and earnings.
They explore the distribution of well-being through several lenses, including geography, focusing primarily on census tracts, and demography, focusing primarily on race and ethnicity, and gender. Both geography and demography affect human development outcomes, and the ways in which they interact also influence the range of people’s choices and opportunities.
PAGE 30 PAGE 62PAGE 46

A Long and Healthy LifeIN
TH
IS S
EC
TIO
N
Introduction
Analysis by Geography and Race and Ethnicity
What Fuels the Gaps in Health?

31A PORTRAIT OF SONOMA COUNTY 2014
A LONG AND HEALTHY LIFE
IntroductionThe topic of health has been high on the national agenda in recent years as a result of the passage of the Patient Protection and Affordable Care Act. At the local level, attention has begun to shift to an aspect of health that lies beyond the singular focus on doctors and medicine that has characterized much of the debate: the conditions in our communities—whether we have access to healthy food, clean air, safe places to play and get exercise, secure jobs that reduce the chronic stress of economic uncertainty, good schools, and other important advantages. The impacts on our health of the conditions in which we grow up, work, and grow old are largely underappreciated by the general public. Yet a look at today’s leading causes of death, in Sonoma County as in the nation, shows that many of the chronic diseases that cause premature death come from factors that are often preventable through changes in social and environmental conditions. These so-called social determinants of health (see SIDEBAR) are the main drivers of disparities within our communities. Sonoma County has dedicated itself to addressing social determinants of health and has set a bold goal: to be the healthiest county in the state by 2020.
Why does life expectancy at birth figure as one-third of the American Human Development Index? It is because advancing human development requires, first and foremost, expanding people’s real opportunities to live long and healthy lives. The index uses the indicator of life expectancy at birth as a proxy measure for its health dimension. Defined as the number of years that a baby born today can expect to live if current patterns of mortality continue throughout that baby’s life, it is calculated using mortality data from the California Department of Public Health and population data from the U.S. Census Bureau for 2005–2011.
Life expectancy does not, of course, tell the full story of our health. Some people go about their lives with ruddy good health, few restrictions on their physical activity, and little protracted pain. Others struggle with chronic pain or disease, disability, or even lack of dental care—often overlooked as a health issue—all of which undeniably affect daily quality of life. Life expectancy is, nonetheless, an important gauge for indicating which groups are living long lives and which are experiencing conditions that cause premature death, and it helps to focus investigations on a whole range of other information necessary for understanding why. This chapter examines the disparities that exist in this summary measure in Sonoma County and uses additional data to explore some important issues further.
Social Determinants of Health These are defined as the circumstances in which people are born, grow up, live, work, and age, as well as the systems put in place to deal with illness. These circumstances are in turn shaped by a wider set of forces: economics, social policies, and politics.
World Health Organization
Healthy Communities Have:
• Parks• Sidewalks and bike paths• Affordable housing
• Fresh produce stores• High-quality schools• Affordable health care• Accessible public
transportation
• Jobs with decent wages• Work/life balance• A diverse economy
• Equality under the law• Accountable government• Affordable, safe childcare• Safety and security

32 THE MEASURE OF AMERICA SERIES
Analysis by Geography and Race and EthnicityVARIATION BY GEOGRAPHY: SONOMA COUNTY IN CONTEXT
Sonoma County’s residents can expect to live to an average age of 81 years—two years longer than the national average of 79 but just slightly shorter than California’s life expectancy of 81.2. If we judge only by how long people are living, seven of the eight peer counties have very similar mortality outcomes. Marin stands apart with a life expectancy of 84.2 years, with the rest grouped in a narrow range from Monterey, at 82.4 years, to Sonoma, at 81 (see SIDEBAR).10 A look at a set of interrelated factors that contribute to long lives, or conversely, to premature deaths, yields some interesting observations about Sonoma County in comparison to this set of seven counties. They are as follows: Absence of health risk behaviors. Most premature death today stems from preventable health risks, chiefly smoking, poor diet, physical inactivity, and excessive alcohol use. As TABLE 2 illustrates, Sonoma County is on the higher side in each of these areas among the eight counties. It has the highest rate of smoking among adults, 14.3 percent. In contrast, Napa County’s much lower smoking rate is 8.7 percent of adults.11 Reducing exposure to these “fatal four” health risks through policy actions can go a long way toward improving the average life span in Sonoma County. Access to health care. Sonoma County falls in the middle of the eight-county pack in terms of both access to doctors and health insurance (although 15 percent lacking insurance is clearly suboptimal). In terms of disease screenings, Sonoma is faltering. Screenings for diabetes or cancer and other forms of preventive care have an important impact on lowering premature death rates and are far less costly than dealing with full-blown disease at a later stage. Economic security. Low income and the chronic stress of economic insecurity make people more susceptible to health risks such as poor diet and smoking and take a toll on the cardiovascular system.12 Sonoma County’s unemployment rate is relatively low, at 6 percent (as compared with around 9 percent in Santa Cruz and Monterey), and the proportion of people living in poverty in the county is 12.1 percent, which is far better than the high of over 18 percent in Monterey but much higher than the 8–9 percent range in Marin and Napa Counties. Safe neighborhoods. The damaging effects of high rates of crime and violence on health include causing chronic stress, discouraging outdoor exercise, and, at worst, resulting in injury or death. Sonoma County’s rate of 412 violent crimes per 100,000 residents is roughly double Marin’s rate and far higher than those of Ventura and San Luis Obispo Counties, but it is below the rates in Napa and Monterey, which have nearly 500 violent crimes per 100,000 residents.
Sonoma County in Context
LIFE EXPECTANCY IN YEARS
79.0years
81.2years
CaliforniaU.S.
81.0years
Sonoma
Source: Measure of America analysis of data from the California Department of Public Health 2005–2012, Centers for Disease Control and Prevention WONDER 2010, and U.S. Census Bureau.

33A PORTRAIT OF SONOMA COUNTY 2014
A LONG AND HEALTHY LIFE
Education. As discussed below, people across the United States who have more education live longer than those who have less.13 Sonoma County’s educational outcomes fall well below those of Marin County, but they compare favorably to both Monterey and Napa.
Life Expectancy at Birth in Sonoma (years)
Source: Measure of America analysis of data from California Department of Public Health 2005–2012, and U.S. Census Bureau.
86
84
82
80
78
76
74
LIFE EXPECTANCY IN PEER COUNTIES
Sonoma(81.0 years)
MontereyVenturaSanta BarbaraSanta CruzNapaSan Luis Obispo
Marin(84.2 years)
TABLE 2 Health-Related Indicators in Sonoma and Seven Peer Counties
Health risk behaviors
COUNTIES
OBESITY (% of adults with
Body Mass Index 30 or above)
SMOKING (% of adults)
PHYSICAL INACTIVITY (% 20 and older with no activity)
EXCESSIVE DRINKING
(%)
Marin 15.3 9.6 12.6 24.6
Monterey 22.4 13.1 15.9 15.0
Napa 22.2 8.7 15.5 22.9
San Luis Obispo 21.7 10.3 14.6 19.5
Santa Barbara 19.9 11.1 16.0 18.4
Santa Cruz 19.8 9.6 12.4 17.6
Sonoma 22.9 14.3 14.5 21.5Ventura 23.3 12.3 17.0 17.5
Access to health care
COUNTIES
PRIMARY CAREPHYSICIANS
(ratio to population)
DIABETIC MONITORING
(% of Medicare diabetics receiving annual screening)
MAMMOGRAPHY SCREENINGS
(% of female Medicare patients screened
in past 2 years)
NO HEALTH
INSURANCE (% of population)
Marin 1:712 80.1 69.5 8.9
Monterey 1:1,595 82.2 66.9 21.0
Napa 1:1,189 81.7 66.5 14.8
San Luis Obispo 1:1,280 85.7 70.8 13.1
Santa Barbara 1:1,252 86.6 69.0 18.6
Santa Cruz 1:1,047 83.2 69.4 14.4
Sonoma 1:1,070 79.8 66.3 15.0Ventura 1:1,458 82.4 65.6 16.0
Economic security & safe neighborhoods
COUNTIES
UNEMPLOYMENT RATE(%)
BELOW POVERTY LEVEL
(%)
SUPPLEMENTAL NUTRITION ASSISTANCE PROGRAM
(% of households receiving benefits)
VIOLENT CRIME (per 100,000 population)
Marin 4.6 7.9 3.9 212.9
Monterey 9.1 18.4 8.8 498.8
Napa 6.0 8.9 5.9 511.4
San Luis Obispo 6.1 13.7 5.5 274.2
Santa Barbara 6.4 16.3 6.8 437.8
Santa Cruz 8.7 13.4 7.9 493.9
Sonoma 6.0 12.1 7.5 412.4Ventura 7.3 11.5 7.5 243.8
Sources: Measure of America (life expectancy); Bureau of Labor Statistics, Local Area Unemployment Statistics, November 2013 (unemployment); Measure of America analysis of U.S. Census Bureau, American Community Survey 2012 (insurance, poverty level, SNAP); County Health Rankings 2013 (remaining indicators).

34 THE MEASURE OF AMERICA SERIES
VARIATION BY GEOGRAPHY: CENSUS TRACTS
These main drivers of longevity in Sonoma County make it one of a set of very healthy counties in a state with very good health outcomes; California has the third-highest life expectancy in the continental United States. Nonetheless, work remains to be done (see MAP 2). An entire decade separates the life expectancies of the top and bottom census tracts among the ninety-nine that make up the county. The top five tracts are Central Bennett Valley (85.7 years), Sea Ranch/Timber Cove and Jenner/Cazadero (both 84.8 years), Annadel/South Oakmont and North Oakmont/Hood Mountain (both 84.3 years), and West Sebastopol/Graton (84.1 years). The bottom five are Bicentennial Park (77.0 years), Sheppard (76.6 years), Burbank Gardens (76.0 years), Downtown Santa Rosa (75.5 years), and Kenwood/Glen Ellen (75.2 years). See SIDEBAR.
What characteristics do the census tracts with higher life expectancies have in common? While many Americans believe income and health rise and fall in tandem, the situations in these neighborhoods challenge that assumption. The typical currently employed worker in Central Bennett Valley and Annadel/South Oakmont earns in the range of $45,000, while his or her counterparts in Sea Ranch/Timber Cove and Jenner/Cazadero have median earnings of $31,500 and $35,000, respectively; all are among the top five census tracts for life expectancy. In marked contrast, the tracts with the highest earnings, Fountain Grove and East Bennett Valley, rank twenty-fourth and twenty-fifth in terms of life expectancy. In fact, studying the relationship between earnings and health across all ninety-nine of Sonoma County’s census tracts shows only a weak positive correlation. In other words, knowing about the wages and salaries in Sonoma’s neighborhoods gives you little of the information necessary to predict life span.
What, then, does matter for health outcomes?One very important, and undervalued, factor in a long and healthy life is education. Analysis of Sonoma County’s ninety-nine tracts shows a clear positive correlation between life expectancy and education: people in neighborhoods with higher educational attainment and enrollment have longer lives. This is in part because better-educated people have more access to health care and are more likely to comply with treatment regimens, use safety devices such as seat belts and smoke detectors, and embrace new laws and technologies.14 But low educational attainment also chips away at life expectancy in ways less obviously linked with health. It both causes and is caused by low socioeconomic status, circumscribes career options, results in low-wage jobs and limited benefits, and often results in families living in neighborhoods with poorer schools and higher crime, all of which contribute to chronic stress that damages the heart and blood vessels.
Top and Bottom Five Census Tracts for Life Expectancy in Sonoma County
Source: Measure of America analysis of data from the California Department of Public Health, 2005–2011, and population data from the U.S. Census Bureau.
Kenwood/Glen Ellen
Bicentennial ParkSheppard
86
84
82
80
78
76
74
LIFE EXPECTANCY IN SONOMA COUNTY
Sea Ranch/Timber CoveJenner/CazaderoAnnadel/South OakmontNorth Oakmont/Hood Mountain
Burbank GardensDowntownSanta Rosa
CentralBennettValley

35A PORTRAIT OF SONOMA COUNTY 2014
A LONG AND HEALTHY LIFE
MAP 2 Life Expectancy in Sonoma County by Census Tract
LIFE EXPECTANCY
81.7 – 82.4 years
82.5 – 85.7 years
80.5 – 81.6 years
79.2 – 80.4 years
75.2 – 79.1 years
SantaRosa
Petaluma
101
101
101
1
116
116
12
128
121
37
29
175
12
Sea Ranch Lake Sonoma
Cloverdale
Geyserville
Healdsburg
Windsor
Calistoga
Santa Rosa
Guerneville
Bodega Bay
TomalesPetaluma
Novato
SonomaCotati
Rohnert Park
20 Miles100

36 THE MEASURE OF AMERICA SERIES
BOX 2 A Tale of Two Neighborhoods
CENTRAL BENNETT VALLEYLIFE EXPECTANCY: 85.7 YEARS
SHEPPARDLIFE EXPECTANCY: 76.6 YEARS
12
Residents of Central Bennett Valley in eastern Santa Rosa have an average life expectancy of 85.7 years, at the top of Sonoma County’s longevity scale. Toward the bottom of this scale is Sheppard, a neighborhood within the same city and only about two miles away. Here, the average resident has a life expectancy at birth of 76.6 years. What are some of the factors that may be contributing to this life expectancy gap of over nine years? Central Bennett Valley, a top-ten tract in terms of overall human development, is a small neighborhood of 0.6 square miles,15 located in eastern Santa Rosa in a verdant area that is close by hundreds of acres of state parkland. The neighborhood’s ethnic makeup is about four-fifths white, with a small (10.8 percent) Latino population. Four in ten adults here have at least a bachelor’s degree. The tract is home to Strawberry Park, with nearly six acres of open space and sports facilities, and the smaller Matanzas Park.16 The poverty rate is low (6.6 percent), and only 8.6 percent of residents lack health insurance. Of the major occupational categories (defined by the U.S. Bureau of Labor Statistics), Central Bennett Valley has a very high proportion of workers in management-type work (60 percent). It has few service jobs (11 percent) and even fewer jobs in agriculture, construction, manufacturing, and other manual labor–based trades. Sheppard ranks ninety-seventh of the county’s ninety-nine tracts in human development. It is roughly the same size as Central Bennett Valley17 but flanked by two highways. Sheppard’s population is two-thirds Latino—over six times the Latino population share of Central Bennett Valley—and one-third white. Fewer than one in twelve adults has a bachelor’s degree or higher. One six-acre park lies within the tract boundaries, but only one acre is developed, and the park has walking areas but no recreational facilities.18 Sheppard’s poverty rate is nearly three times that of Central Bennett Valley, and triple the proportion of residents lack health insurance. Sheppard has fewer than a third of the proportion of workers of Central Bennett Valley in relatively higher-paying
management and related occupations (16.9 percent) and over triple the proportion (19.2 percent) doing work that revolves largely around manual labor: agriculture, construction, maintenance, or repair. Finally, while in most Sonoma County census tracts, including Central Bennett Valley, women outnumber men in the population, largely due to their longer life expectancy, the reverse is true in Sheppard. Although data on the undocumented are hard to obtain, a recent study by the Public Policy Institute of California found that in the zip code that encompasses Sheppard and the other Southwest Santa Rosa neighborhoods, more than one in four residents is an undocumented immigrant.19 Health outcomes in this neighborhood are very low, all the more worrisome because, as discussed below, Latinos in Sonoma County outlive whites, on average, by just under half a decade. The portraits of these two small neighborhoods are not exhaustive—in part because health risk behaviors data are lacking for very small populations. But they cover some important social, economic, demographic, and environmental health determinants. The daily conditions for healthful behaviors in these two neighborhoods are worlds apart, as are the educational backgrounds, jobs, and access to services of their residents. And the outcomes speak for themselves. In the neighborhood with ample parks and clean air, where the majority of adults have relatively high levels of education and work in management jobs with minimal exposure to hazards, and where poverty rates are low, the life expectancy of a baby born there today is longer than that of a baby born in any other Sonoma County tract on the same day. In the neighborhood where the risk of work-related injury and the stress of economic insecurity that is so damaging to health are far higher, and where access to health insurance and opportunities for recreation and exercise are more limited, life expectancy is about the same as it was in the United States in the mid-1990s, nearly two decades ago.20

37A PORTRAIT OF SONOMA COUNTY 2014
A LONG AND HEALTHY LIFE
BOX 2 CONTINUED A Tale of Two Neighborhoods
HEALTH HEALTH
CENTRAL BENNETT VALLEY SHEPPARD
EDUCATION EDUCATION
STANDARD OF LIVING STANDARD OF LIVING
OCCUPATIONAL BREAKDOWN
Management &Related
Sales &Office
Service
Natural Resources,Construction, Maintenance
Production, Transportation,& Material Moving
60%17%
11%6%6%
OCCUPATIONAL BREAKDOWN
89.4%school enrollment
40.8%have at least abachelor’s degree
71.7%school enrollment
8.2%have at least abachelor’s degree
8.6%without healthinsurance
6.6%living in poverty
18.7%living in poverty
25.9%without healthinsurance
Management &Related
Sales &Office
Service
Natural Resources,Construction, Maintenance
Production, Transportation,& Material Moving
17%27%
23%19%
14%
$22,068median earnings
$44,564median earnings
85.7years lifeexpectancy
76.6years lifeexpectancy
3,563Total Population
80.8%White
10.8%Latino
8.4%Other
Race/Ethnicity
23.2%White
66.4%Latino
10.4%Other
Race/Ethnicity
Ratio of Men to Women
.93Man
1Woman
: 5,742Total Population Ratio of Men to Women
1.11Men
1Woman
:
Sources: U.S. Census Bureau, Census 2010, and American Community Survey 2008–2012.

38 THE MEASURE OF AMERICA SERIES
BOX 3 Dating and Domestic Violence: Public Health Challenges in Sonoma County
According to the California Department of Justice, 147 homicides from domestic violence were committed in 2011—nearly 12 percent of the state’s homicides. While gang- and robber-related homicides were on the decline, domestic violence killings in California went up by 30 percent from 2008 to 2011.21 The tragedy of death resulting from domestic violence is only part of the destruction it wreaks. Domestic violence has devastating psychological, physical, and economic consequences on those who experience it—and on the children who are exposed to it. In the health realm, beyond the immediate injuries, victims often suffer from a host of longer-term physical health problems, including sleep and eating disorders, and frequently experience devastating psychological distress, such as depression, anxiety, and sometimes suicide. Young people who are victims of teen dating violence can also experience these health symptoms; are more likely to engage in health risk behaviors such as smoking, excessive drinking, and drug use; and are at a higher risk of being victims of intimate partner violence in adulthood. Domestic violence also exacts a high cost to society at large—medical costs, justice system costs, reduced workforce productivity, and reduced capabilities of future generations. Dating and domestic violence are pervasive public health issues that continue to impact communities nationwide, including Sonoma County. In 2012, the rate of domestic violence–related calls to law enforcement in Sonoma County was 4.7 per one thousand residents ages 18 to 64, lower than the state rate of 6.6 per one thousand. Yet some areas in the county are seeing higher rates, ranging from fewer than four
calls to law enforcement per 1,000 residents in some cities and towns to nearly twenty calls in others.22 However, care must be taken in comparing and interpreting these data due to possible differences in how local law enforcement agencies define, collect, and record domestic violence–related calls. Standardization of definitions and data collection practices are essential to understanding the relative magnitude of the problem. A look at teens who have experienced dating violence in the county shows that the rate is slightly below the California average for all but nontraditional students, but is nonetheless a problem that affects hundreds of Sonoma’s young people (see below). The percentage of students who have been intentionally physically hurt by a boyfriend or girlfriend in the past year in Sonoma County public schools ranges from 4.1 percent among seventh graders to 5.7 percent in ninth grade, and climbs to 5.8 percent by eleventh grade. Both dating and domestic violence are typically underreported, especially among certain populations, such as people who are undocumented. These data, therefore, may be an underestimation of the extent of dating and domestic violence in Sonoma County. The Sonoma County Department of Health Services is developing a Violence Profile, due out in 2014, as part of an effort to move away from a focus on individual causes to one that frames violence as a public health issue. The next step will be the development of a full-scale initiative with targeted efforts to better understand and address the community, environmental, and social factors that contribute to violence in Sonoma County.
Dating Violence among Youth in California and Sonoma County, 2008–2010 School Years
0
10
20
30
40
50
60
7thgrade
9thgrade
11thgrade
7thgrade
9thgrade
11thgrade
Nontraditionalstudents
4.14.4
13.3
43.844.5
51.2 49.2 51.7
41.5
28.9
52.1 51.1
43.1
Nontraditionalstudents
52.8
Experienced dating violence in past year (%) No dating violence in past year (%) No boyfriend/girlfriend in past year (%)
CALIFORNIA SONOMA COUNTY
13.9
33.3
5.8
45.0
57.8
48.0 46.3
6.8 5.7 5.8
Source: California Department of Education, California Healthy Kids Survey (WestEd) http://www.kidsdata.org/. Notes: Nontraditional students are students enrolled in community day schools or continuing education. They make up about 7 percent of the sampled student body on this survey question. Values may not sum to 100 due to rounding.

39A PORTRAIT OF SONOMA COUNTY 2014
A LONG AND HEALTHY LIFE
VARIATION BY RACE AND ETHNICITY
The life expectancy of Sonoma County’s population varies considerably by race and ethnicity, reflecting that of the state and nation as a whole, but with a smaller gap between the longest- and shortest-lived groups (see FIGURE 3).
Asian Americans in Sonoma County live longest, with an average life expectancy of 86.2 years. This is very close to the state and national average for this group. As discussed above, education is an important determinant of health, and in Sonoma County, Asian American educational outcomes are indeed impressive. Nearly three-fourths of Sonoma County Asians were born overseas,23
and one way in which they differ from Asian Americans statewide is that they include a larger proportion of immigrants from Cambodia and Thailand.24 Many Cambodian immigrants in California are refugees from years of civil war, whose psychologically traumatic experiences and physical deprivations, including periods of starvation, have led to exceedingly poor health compared to other Asian immigrants.25 More research is needed on the health of this population to better meet their needs. Yet despite the particular challenges of refugee populations in Sonoma County, health outcomes for Asian Americans overall top the chart. Latinos have the second-highest life expectancy in Sonoma County, 85.3 years—only about one year less than Asian Americans. Sonoma County’s Latinos outlive whites, on average, by nearly half a decade.
The life expectancy of Sonoma County’s population varies considerably by race and ethnicity.
FIGURE 3 The Gap between the Longest- and Shortest-Lived Groups in Sonoma County Is Smaller Than the U.S. or California Gap.
70
75
80
85
90
AsianAmerican
86.5
Latino
82.8
White
78.9
AfricanAmerican
74.6
UNITEDSTATES
AsianAmerican
86.2
Latino
85.3
White
80.5
AfricanAmerican
77.7
SONOMACOUNTY
CALIFORNIA
AfricanAmerican
75.1
AsianAmerican
86.3
Latino
83.2
White
79.8
11.9yeargap
11.2yeargap
8.5yeargap
Sources: Measure of America analysis of data from the California Department of Public Health, Death Statistical Master File and U.S. Census Bureau, 2005–2011. U.S. and California estimates are from Lewis and Burd-Sharps (2013).
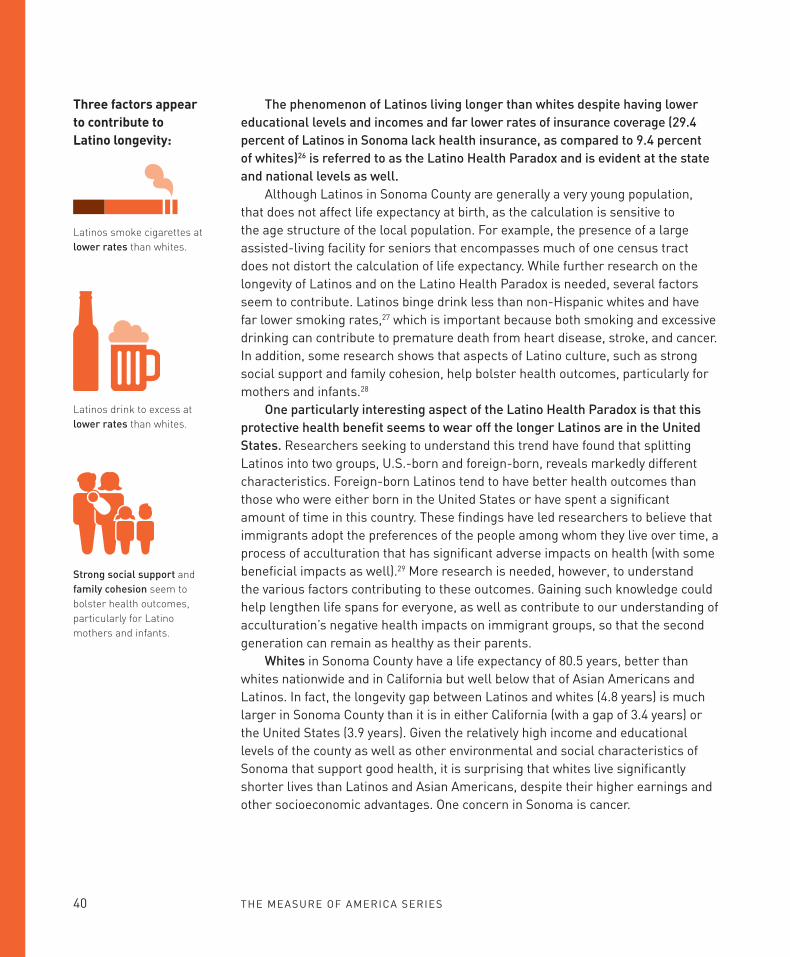
40 THE MEASURE OF AMERICA SERIES
The phenomenon of Latinos living longer than whites despite having lower educational levels and incomes and far lower rates of insurance coverage (29.4 percent of Latinos in Sonoma lack health insurance, as compared to 9.4 percent of whites)26 is referred to as the Latino Health Paradox and is evident at the state and national levels as well. Although Latinos in Sonoma County are generally a very young population, that does not affect life expectancy at birth, as the calculation is sensitive to the age structure of the local population. For example, the presence of a large assisted-living facility for seniors that encompasses much of one census tract does not distort the calculation of life expectancy. While further research on the longevity of Latinos and on the Latino Health Paradox is needed, several factors seem to contribute. Latinos binge drink less than non-Hispanic whites and have far lower smoking rates,27 which is important because both smoking and excessive drinking can contribute to premature death from heart disease, stroke, and cancer. In addition, some research shows that aspects of Latino culture, such as strong social support and family cohesion, help bolster health outcomes, particularly for mothers and infants.28 One particularly interesting aspect of the Latino Health Paradox is that this protective health benefit seems to wear off the longer Latinos are in the United States. Researchers seeking to understand this trend have found that splitting Latinos into two groups, U.S.-born and foreign-born, reveals markedly different characteristics. Foreign-born Latinos tend to have better health outcomes than those who were either born in the United States or have spent a significant amount of time in this country. These findings have led researchers to believe that immigrants adopt the preferences of the people among whom they live over time, a process of acculturation that has significant adverse impacts on health (with some beneficial impacts as well).29 More research is needed, however, to understand the various factors contributing to these outcomes. Gaining such knowledge could help lengthen life spans for everyone, as well as contribute to our understanding of acculturation’s negative health impacts on immigrant groups, so that the second generation can remain as healthy as their parents. Whites in Sonoma County have a life expectancy of 80.5 years, better than whites nationwide and in California but well below that of Asian Americans and Latinos. In fact, the longevity gap between Latinos and whites (4.8 years) is much larger in Sonoma County than it is in either California (with a gap of 3.4 years) or the United States (3.9 years). Given the relatively high income and educational levels of the county as well as other environmental and social characteristics of Sonoma that support good health, it is surprising that whites live significantly shorter lives than Latinos and Asian Americans, despite their higher earnings and other socioeconomic advantages. One concern in Sonoma is cancer.
Three factors appear to contribute to Latino longevity:
Latinos smoke cigarettes at lower rates than whites.
Latinos drink to excess at lower rates than whites.
Strong social support and family cohesion seem to bolster health outcomes, particularly for Latino mothers and infants.

41A PORTRAIT OF SONOMA COUNTY 2014
A LONG AND HEALTHY LIFE
Sonoma County has higher incidence and death rates from cancer than the state averages,30 but the death rate is significantly higher still for white residents than for other racial and ethnic groups. Whereas the Latino and Asian American cancer rates are in the range of 100 to 110 deaths per 100,000 population, for whites, the death rate is nearly 177 per 100,000. (Cancer death rates for African Americans in Sonoma County cannot be estimated due to the small size of this population).31 A focus on reducing Sonoma’s relatively high smoking rates would be one important effort for reducing cancer in the county. African Americans have a life expectancy of 77.7 years, the shortest life span of the four major racial and ethnic groups in Sonoma County. The concerning life expectancy gap of 8.5 years between this shortest- and the longest-lived racial or ethnic group in Sonoma County is nevertheless smaller than that observed in either the United States (12 years) or California (11 years). While the African American population in Sonoma is quite small (around 7,000), one in five is foreign born,32 which represents a far higher proportion of immigrants than the national average among African Americans.33 In California, foreign-born African Americans have a slight life expectancy edge over U.S.-born African Americans.34
A comparison between the education levels of African Americans in Sonoma County and those nationally reveals important health-giving advantages in the county. Sonoma’s African Americans are far more likely to have bachelor’s degrees (31.4 percent versus 17.9 percent) and twice as likely to have graduate or professional degrees. In addition, this population is more integrated across Sonoma census tracts than in many other cities and counties across America.
FIGURE 4 African Americans in Sonoma County
California
Sonoma
LIFEEXPECTANCY
AT LEAST ABACHELOR’S DEGREE
GRADUATEDEGREE
74.6years
75.1years
77.7years
17.9%
21.4%
31.4%
6.3%
7.6%
12.5%
United States
Source: Lewis and Burd-Sharps (2013), Measure of America analysis of the California Department of Public Health, Death Statistical Master File, 2005–2011, and U.S. Census Bureau, American Community Survey, 2012.
African Americans have a life expectancy of 77.7 years, the shortest life span of the four major racial and ethnic groups in Sonoma County.

42 THE MEASURE OF AMERICA SERIES
Our research has shown that residential segregation by race often leads to concentrations of poverty and disconnection as well as islands of affluence, which affects local revenue streams and in turn has an impact on public services, including school funding and quality, and public transportation options.35 Also very important is segregation’s effects on access to the strong social networks and connections so vital to job and mentorship opportunities and for neighborhood safety and trust.36 Each of these sets of community conditions, in turn, affect health. Native Americans make up less than 1 percent of the Sonoma County population, with a total of about 3,500 residents whose full heritage is Native American, plus 9,800 others who make some claim to Native American identity.Unlike in many other American communities, Native Americans live in almost every Sonoma city and town. No Sonoma County neighborhood is more than 3.8 percent Native American, however, and only three neighborhoods (Sheppard, Wright, and West Windsor) have over 100 people who identify as Native American.37 Health care for this population is provided by a variety of services, including the federally funded Sonoma County Indian Health Project, plus local clinics and providers. The result is that nearly three in four Native American adults (73.5 percent) and nearly all children (99.1 percent) have health insurance. This compares favorably to 88.3 percent of Latino children and 95.1 percent of white children.38 Another respect in which Sonoma’s Native American population is faring comparatively well is in terms of the prevalence of cancer. Coupled with Alaska Natives, the Native American population has the lowest cancer rates of the county’s five major racial and ethnic groups, almost half that of whites (250 as compared to 482 cases per 100,000).39 Native Americans face other health challenges, however, one of which is the very high rate of unintentional injuries related to poisoning, firearms, falls, motor vehicle accidents, fires, drowning, and work. In 2009, they had a startling rate of 2,158 unintentional injuries per 100,000 population, more than double the African American rate and nearly triple that of whites. Latinos also have a relatively high rate of unintentional injury, but it is still considerably lower, at 1,374 per 100,000.40
Two other areas of concern regard children. A lower proportion of Native American mothers receives early prenatal care (71 percent) than mothers in any other racial or ethnic group, and the rate of child abuse is 20.6 cases per 1,000 children, as compared to 3.9 per 1,000 for Asian Americans, 4.9 per 1,000 for Latinos, 5.3 per 1,000 for whites, and 15 per 1,000 children for African Americans.41
Native Americans face a very high rate of unintentional injuries related to poisoning, firearms, falls, motor vehicle accidents, fires, drowning, and work.

43A PORTRAIT OF SONOMA COUNTY 2014
A LONG AND HEALTHY LIFE
What Fuels the Gaps in Health?Action to address the following three priority areas is key to boosting index scores for all residents of Sonoma County and to narrowing the gaps in health outcomes between groups and neighborhoods. In each case, they emphasize a focus on creating the conditions for preventing problems before they start, which is in almost every instance less expensive and more effective than delaying action until a crisis is full-blown.
UNEVEN NEIGHBORHOOD CONDITIONS
The life expectancy gaps that separate groups in Sonoma County—over a decade by neighborhood, eight and a half years by race and ethnicity—are not predestined, nor are they rooted only in genetic makeup. They are largely avoidable. But reducing these gaps requires distributing health resources far more evenly than they are distributed today.
Doctors, treatments, and medicines are essential, especially when a person is already sick. But progress in health at the population level can only be made by going beyond the systems put in place to deal with illness to address the wide set of economic, social, and political forces shaping the conditions in which people are born and grow up.
What are the resources for health in Sonoma County? They are safe and affordable opportunities for recreation and fitness, places to get nutritious food, reliable transportation systems, high-quality schools, safe neighborhoods, jobs that offer dignity and economic security, decent housing, and a voice in decisions that affect people’s lives. And they are an absence of such health risks as exposure to toxic substances, policing policies that target specific groups, zoning and private-sector lending and credit practices that segregate neighborhoods, aggressive marketing of cigarettes and alcohol in low-income neighborhoods, and many others.
In some Sonoma County neighborhoods and among some groups, resources for health are plentiful, and their value is clearly evident in the people’s health outcomes. For others, the social determinants of health that shape daily routines result in shorter, less healthy lives. The good news, however, is where we started: extreme health disparities are largely preventable. Collaborative efforts by government, businesses, nonprofit organizations, and individuals themselves aimed at prevention offer a path to healthier, longer lives and fewer public health-care dollars spent on treating preventable illness.
The life expectancy gaps that separate groups in Sonoma County are largely preventable.

44 THE MEASURE OF AMERICA SERIES
SMOKING—A MAJOR HEALTH RISK BEHAVIOR
The tremendous reduction in smoking rates between 1965, when 42 percent of American adults smoked, to 2000, when 23 percent did, ranks among the greatest U.S. public health victories of the twentieth century.42 Smoking declined because people’s desire to quit was supported by a whole range of actions that made smoking difficult (such as indoor and outdoor antismoking policies and ordinances), expensive (such as cigarette taxes and fees), and less socially acceptable (through social marketing and health promotion campaigns). A wide range of proven tools is available to reduce death and disease from tobacco use and exposure to secondhand smoke. Sonoma County has been active in using many of them, including an ordinance passed in 2011 pertaining to secondhand smoke and smoking in certain public places. But the battle against smoking is not yet won. Over 14 percent of county residents smoke, a higher percentage than residents of any of the other seven counties in this analysis, though differences are not all statistically significant. Where will antismoking efforts bring the greatest benefits? Local data on smoking rates are particularly important for tailoring them. According to calculations from the California Healthy Kids Survey for 2008–10, a higher percentage of eleventh-grade boys smoked at least once during the thirty days before the survey than girls (19.0 percent compared with 14.7 percent), and African American youth were the most likely among racial and ethnic groups to have smoked in the past thirty days (see SIDEBAR). Among the nine school districts surveyed, smoking rates ranged from 11.3 percent of eleventh graders in Cotati-Rohnert Park Unified School District to more than double that (23.0 percent) in Petaluma Joint Unified School District (see FIGURE 5). The 2014 report card of the American Lung Association in California shows much room for improvement in many parts of Sonoma County with respect to smoke-free housing and restricting outdoor smoking and gives the county low marks for restricting tobacco sales at pharmacies and within a certain distance of parks and schools as well as for curtailing sampling of tobacco products.43
Finally, despite the strong deterrence value of cost to smoking, especially among teenagers, California has one of the lowest cigarette tax rates per pack in the nation—87 cents—as compared with $4.35 in New York State, $3.51 in Massachusetts, and $3.03 in Washington State.44 Although state law prohibits municipalities from levying their own cigarette taxes, one local mechanism Sonoma County could investigate, though it does require a community vote, is imposing an additional regulatory fee per pack for cigarette litter cleanup, as San Francisco has done.45 Redoubling all these efforts would help chip away at the annual county toll from cancer, which amounted to 933 deaths in 2012 alone.46
Adolescent Smoking Rates by Race and Ethnicity in SonomaSmoked a Cigarette during Past 30 Days (% of 7th, 9th, 11th graders)
Adolescent Smoking Rates by Gender in SonomaSmoked a Cigarette during Past 30 Days (% of 7th, 9th, 11th graders)
Source: Measure of America calculations from California Department of Education, California Healthy Kids Survey (WestEd), 2008–10. Data for 7th, 9th, and 11th graders are combined to provide more reliable estimates.
Source: Measure of America calculations from California Department of Education, California Healthy Kids Survey (WestEd), 2008–10.
13.9%AFRICAN AMERICANS
11.1%WHITES
9.9%LATINOS
4.4%ASIAN AMERICANS
19%14.7%
MaleFemale

45A PORTRAIT OF SONOMA COUNTY 2014
A LONG AND HEALTHY LIFE
LATINO HEALTH ADVANTAGES
Common wisdom holds that higher incomes can buy better health, and, certainly, groups with higher education levels tend to be healthier and to live longer the world over. Yet Latinos in Sonoma County, many of whom face disproportionate economic and social challenges, outlive Sonoma County whites by half a decade. As discussed in subsequent chapters, the typical Latino worker earns only $21,695 a year, compared to $36,647 for the typical white worker. And less than 5 percent of white adults have never completed high school, compared to 44 percent of Latino adults.47 What factors might explain this conundrum? We have some indications about what Latinos are doing right: they engage in fewer health risks like smoking and drinking, and their communities and families are more supportive of healthy behaviors. In addition, some researchers have conjectured that the Latino immigrant population is a statistically biased sample because only relatively healthy individuals are willing to undergo the risks and uncertainties of emigration (the “healthy migrant” hypothesis), or that Latino immigrants disproportionately return home when they are ill to die in their countries of origin and are thus not counted in U.S. mortality statistics (the “salmon bias” hypothesis). But tests of these hypotheses have been inconclusive or contradictory.48 Much more investigation is needed to learn from Latinos how we might lengthen life spans for everyone and help second-generation Latinos avoid the negative health impacts of acculturation.
FIGURE 5 Teenage Smoking Rates Vary Widely by School District
West Sonoma County Union High
Petaluma Joint Unified (Petaluma Joint Union High)
Cloverdale Unified
Santa Rosa High
Sonoma Valley Unified
Windsor Unified
Healdsburg Unified
Cotati-Rohnert Park Unified
5 10 15 20 25
CALIFORNIA
13.2SONOMACOUNTY
16.7
15.7
15.7
15.1
11.3
23.0
18.2
17.5
12.9
0
Source: Measure of America calculations from California Department of Education, California Healthy Kids Survey (WestEd), 2008–10. Data for Geyserville Unified not available.
Latinos in Sonoma County, many of whom face disproportionate economic and social challenges, outlive Sonoma County whites by half a decade.

Access to KnowledgeIN
TH
IS S
EC
TIO
N
Introduction
Analysis by Geography and Race and Ethnicity
What Fuels the Gaps in Access to Knowledge?

47A PORTRAIT OF SONOMA COUNTY 2014
ACCESS TO KNOWLEDGE
Introduction For individuals, access to knowledge is a critical determinant of long-term well-being and is essential to self-determination, self-sufficiency, and the real freedom a person has to decide what to do and who to be. More than just allowing for the acquisition of skills and credentials, education builds confidence, confers status and dignity, and broadens the horizons of the possible. More education is associated with better physical and mental health and a longer life, greater marital stability and ability to adjust to change, better job prospects, and higher income. For society as a whole, a more educated population correlates to less crime, greater tolerance, public savings on remedial education and the criminal justice system, and increased voting rates and civic participation. There’s no human development “silver bullet,” but education comes the closest.
Education is not only key to human development more broadly; it is also, as has been shown, a fundamental social determinant of health. For adults ages 35 and up, every additional year of education is associated with 1.7 additional years of life expectancy.49 Why? Because well-educated people have greater access to and understanding of health-related information. They tend to practice fewer health risk behaviors like smoking and are more likely to exercise regularly and eat a healthy diet. They are better able to understand and comply with medical instructions and make well-informed decisions about their health. In addition, educated people tend to have more stable interpersonal relationships and a greater range of healthy coping behaviors, both of which mitigate health-eroding chronic stress. And because more education typically leads to better jobs and higher wages, better-educated people are more likely to have health insurance and more money and time to take care of themselves and less likely to live in stress-inducing neighborhoods—specifically, concentrated-poverty areas with high crime rates and comparatively few opportunities for physical activity.
Education is also the surest route to economic competitiveness, for people and places alike. Globalization and technological change have made it extraordinarily difficult for poorly educated Americans to achieve the economic self-sufficiency, peace of mind, and self-respect enabled by a secure livelihood. The diverging fortunes of well- and poorly-educated workers in the Great Recession illustrates the economic benefits of education, especially in a tight labor market. In 2010, California’s unemployment rate approached 13 percent—but the rate for the state’s college graduates (6.7 percent) was less than half that for Californians who never completed high school (16.1 percent).50 Economic competitiveness is at risk when the workforce lacks the technical skills and credentials a knowledge-based economy requires. Sonoma County has made concerted efforts to diversify its economy, targeting in particular knowledge-based sectors, in part by luring tech companies north through promotion of its numerous lifestyle amenities.
There’s no human development “silver bullet,” but education comes the closest.

48 THE MEASURE OF AMERICA SERIES
Continuing to attract such businesses and ensuring that the residents of Sonoma County can compete for the higher-wage jobs they bring requires real investment on the part of the county, schools, and young people themselves in developing higher-order skills.
Access to knowledge in the American Human Development Index is measured using two indicators that are combined into an Education Index. The first is school enrollment for the population between the ages of 3 and 24 years; this indicator captures everyone who is currently in school, from preschool-age toddlers to 24-year-olds in college or graduate school. The second indicator is educational degree attainment for the population age 25 and older. This indicator presents a snapshot of education in a place or among a group at one point in time. (Keep in mind that the share of the population with high school degrees refers only to adults over 25; it is not a measure of the current high school graduation rate. The graduation rate of today’s high schoolers is an important indicator discussed in this chapter, but it is not part of the index.)
The school enrollment indicator counts for one-third the weight of the education dimension of the Human Development Index, and the degree attainment indicator counts for the remaining two-thirds; these relative proportions reflect the difficulty of, as well as the payoff for, completing an education as compared to simply enrolling in school. Data for both indicators come from the annual American Community Survey of the U.S. Census Bureau.
Finally, while access to education is critical, so is the quality of that education. Unfortunately, no comparable, reliable indicators of quality are available across the country, so none are included in the American Human Development Index. Such measures are incorporated into the analysis when they exist.
FIGURE 6 The Benefits of Education Go Well beyond Better Jobs and Bigger Paychecks.
If we were to wave a magic wand and every Sonoma County adult without a high school diploma suddenly had one, trends suggest the following would happen:
Life expectancy would increase
by 4 months
352 fewer people would
be unemployed
4,426 fewer people would live in poverty
10,359 more residents
would vote
Source: Measure of America, Common Good Forecaster. measureofamerica.org/forecaster.
Access to knowledge is measured using two indicators: school enrollment and educational degree attainment.

49A PORTRAIT OF SONOMA COUNTY 2014
ACCESS TO KNOWLEDGE
Analysis by Geography and Race and EthnicityVARIATION BY GEOGRAPHY: SONOMA COUNTY IN CONTEXT
Sonoma County outpaces the rest of California in terms of the share of adults who have at least a high school diploma. In Sonoma County, nearly 87 percent of adults over age 25 have high school diplomas, compared to just under 82 percent in California as a whole. When it comes to today’s young people, the county is on par with the state. In Sonoma County, 79.3 percent of those in the graduating class of 2011–2012 finished on time or within four years, compared to 78.9 percent statewide. Sonoma County’s 2011–2012 on-time graduation rate was up appreciably from the county’s rate in 2009–2010, which was 75 percent.51 Sonoma County is similar to the rest of the state on other education indicators. The percentage of adults with college and graduate or professional degrees is roughly the same as it is in the rest of California (see TABLE 3). Likewise, Sonoma school enrollment is on par with that of California as a whole, at 77.9 percent versus 78.5 percent, respectively. But both of these figures top the U.S. average of 77.5 percent. In fact, Sonoma County is equal to or modestly better than the nation on all education indicators covered in this report.52 Sonoma County compares favorably on education with the seven peer counties identified by its Economic Development Board. Its share of adults without high school diplomas, 13.1 percent, is smaller than those of all its peers except San Louis Obispo and Marin. On the other indicators, Sonoma County tends to be in the middle of the pack. Neighboring Marin County, with the best educational score among these California counties, throws the curve for the whole state, registering much higher rates of educational attainment and enrollment than the others in this group, including Sonoma County.
ADULTS WHO COMPLETED HIGH SCHOOL
86% 82%CaliforniaU.S.
87%Sonoma
TABLE 3 Education in Sonoma County and Seven Peer Counties
RANK COUNTYEDUCATIONINDEX
LESS THAN HIGH SCHOOL
(%)
AT LEAST HIGH SCHOOL DIPLOMA (%)
AT LEAST BACHELOR’S DEGREE (%)
GRADUATE OR PROFESSIONAL
DEGREE (%)
SCHOOL ENROLLMENT
(%)
California 5.04 18.5 81.5 30.9 11.3 78.5
1 Marin 8.09 6.8 93.2 55.8 24.5 87.3
2 Santa Cruz 5.94 14.0 86.0 38.3 15.2 80.6
3 San Luis Obispo 5.91 8.7 91.3 33.5 11.8 81.6
4 Sonoma 13.1 86.9 31.8 11.7 77.95 Ventura 5.15 17.3 82.7 31.6 11.1 78.8
6 Santa Barbara 5.12 20.8 79.2 30.2 12.5 80.2
7 Napa 4.93 18.3 81.7 30.3 9.2 78.5
8 Monterey 3.92 30.1 69.9 24.0 8.7 76.6
Source: Measure of America analysis of data from the U.S. Census Bureau, American Community Survey, 2012.
Source: U.S. Census Bureau, American Community Survey, 2012.
5.28

50 THE MEASURE OF AMERICA SERIES
For instance, nearly twice the percentage of Marin’s adults over 25 have graduate or professional degrees, and the share of adults with at least a bachelor’s degree is nearly 25 percentage points higher than in California (see TABLE 3).
VARIATION BY GEOGRAPHY: CENSUS TRACTS
Despite Sonoma County’s above-average educational statistics at the county level, variation is significant and meaningful among its census tracts. The range in the percentage of residents with less than a high school diploma is huge, going from a low of 0.4 percent to a high of 46.1 percent. The share of the adult population with graduate degrees goes from 2.9 percent to 40.8 percent, and the range in school enrollment is tremendous, from 53.8 percent in Forestville to 100 percent in Central East Windsor.
The top five geographical areas on the Education Index are Sea Ranch/Timber Cove, Old Quarry, East Bennett Valley, Rural Cemetery, and Fountain Grove. (See MAP 3 for Education in Sonoma County and TABLE 4 for Top Tracts for Education.) In all five neighborhoods, less than 5 percent of adults lack high school diplomas, and between 48 percent and 65 percent have bachelor’s degrees; enrollment rates top 85 percent. In Sea Cove/Timber Ranch, nearly all adults completed high school, and two in three have at least a bachelor’s degree. In Old Quarry, East Bennett Valley, and Fountain Grove, nearly six in ten have bachelor’s degrees, and about one in four has a graduate degree. To put this high level of educational achievement in perspective, no U.S. state or metro area comes close to the Education Index scores of these five neighborhoods; their scores, which range from 8.38 to 9.21, are near the top of the education scale, higher even than Marin County overall. Of the bottom five neighborhoods on the Education Index, Roseland Creek has the lowest score, followed by Roseland, East Cloverdale, Fetters Springs/Agua Caliente West, and Sheppard. The values for all five tracts are comparable to those found in areas that register some of the country’s lowest human development levels—California neighborhoods in the Fresno area and South Los Angeles and counties in the Mississippi Delta and Appalachia. In Sheppard, Roseland Creek, Roseland, and Fetters Springs/Agua Caliente West, four in ten adults lack high school diplomas. The school enrollment rates in East Cloverdale (63.5 percent), Roseland (65.4 percent), Roseland Creek (66.2 percent), and Fetters Springs/Agua Caliente West (67.8 percent) bode poorly for the future; they are between 10 and 14 percentage points below the rate for Sonoma County overall. This is particularly concerning because Roseland, Roseland Creek, and Fetters Springs/Agua Caliente West are three of the top four census tracts in terms of share of the population under age 18; in these neighborhoods, more than three in every ten people are children.
Education Index Stack-Up
10
9
8
7
6
5
4
3
1
2
0
EDUCATION INDEX IN SONOMA COUNTY
SheppardFetters Springs/Agua Caliente WestEast CloverdaleRoseland
Sea Ranch/Timber CoveOld QuarryEast Bennett ValleyRural CemeteryFountain Grove
Roseland Creek
Source: Measure of America analysis of data from the U.S. Census Bureau, American Community Survey, 2008–2012.

51A PORTRAIT OF SONOMA COUNTY 2014
ACCESS TO KNOWLEDGE
MAP 3 Education in Sonoma County by Census Tract
EDUCATION INDEX
5.89–6.85
6.86–9.21
5.02–5.88
4.08–5.01
1.33–4.07
101
1
116
116
12
12
128
121
37
29
175
101
101
Sea Ranch Lake Sonoma
Cloverdale
Geyserville
Healdsburg
Windsor
Calistoga
Santa Rosa
Guerneville
Bodega Bay
TomalesPetaluma
Novato
SonomaCotati
Rohnert Park
20 Miles100
SantaRosa
Petaluma

52 THE MEASURE OF AMERICA SERIES
VARIATION BY RACE AND ETHNICITY AND GENDER
In most states, educational attainment follows a similar pattern: Asian Americans have the highest score, followed by whites, African Americans, and Latinos (see TABLE 5). This is also the ranked order at the national level, as well as in most metro areas.53 Sonoma County follows this pattern.
Asian Americans have an Education Index score of 7.64, by far the highest of any of the major racial and ethnic groups in this analysis. As explained earlier in the health section, the Census Bureau–defined category “Asian” encompasses U.S.-born citizens who trace their heritage to a wide range of Asian countries, as well as Asian immigrants. The high level of average attainment for this broad group obscures the educational struggles of some. Although 44.4 percent of Asian American adults in Sonoma County hold bachelor’s degrees or more—nearly 40 percent higher than the county average—almost 13 percent lack the bare-bones minimum of a high school diploma (see FIGURE 7). A look at the educational attainment of the five largest Asian subgroups sheds light on this dichotomy: while six in ten Sonoma residents of Asian Indian descent and nearly as many of Chinese descent have bachelor’s degrees, only about one in six of Vietnamese heritage do. The astonishingly high enrollment rate of Asian Americans ages 3 to 24 in Sonoma County, 95.5 percent, demonstrates that the county’s young people of Asian descent stay in high school through graduation and continue their educations
TABLE 4 Top- and Bottom-Five Census Tracts for Education in Sonoma County
RANK TRACT NAMEEDUCATIONINDEX
LESS THAN HIGH SCHOOL
(%)
AT LEAST HIGH SCHOOL DIPLOMA (%)
AT LEAST BACHELOR'S DEGREE (%)
GRADUATE OR PROFESSIONAL
DEGREE (%)
SCHOOL ENROLLMENT
(%)HD
INDEX
California 5.04 18.5 81.5 30.9 11.3 78.5 5.39
Sonoma County 5.28 13.1 86.9 31.8 11.7 77.9 5.42
Top Five Census Tracts for Education
1 Sea Ranch/Timber Cove 9.21 1.1 98.9 65.4 40.8 86.7 7.35
2 Old Quarry 8.94 3.7 96.3 57.5 26.5 93.1 7.71
3 East Bennett Valley 8.75 0.5 99.5 58.6 24.0 90.2 8.47
4 Rural Cemetery 8.44 3.4 96.6 48.0 25.7 92.5 7.67
5 Fountain Grove 8.38 4.2 95.8 56.6 24.6 88.7 8.35
Bottom Five Census Tracts for Education
95 Sheppard 2.00 41.8 58.2 8.2 3.6 71.7 2.98
96 Fetters Springs/Agua Caliente West 1.96 45.4 54.6 17.1 5.8 67.8 3.41
97 East Cloverdale 1.89 30.3 69.7 12.4 2.9 63.5 3.79
98 Roseland 1.75 40.8 59.2 14.4 4.1 65.4 2.95
99 Roseland Creek 1.33 46.1 53.9 8.6 4.3 66.2 2.79
Source: Measure of America analysis of data from the California Department of Public Health, Death Statistical Master File, 2005–2011, and U.S. Census Bureau, American Community Survey, 2012 and 2008–2012.
Asian Americans have the highest score, followed by whites, African Americans, and Latinos.

53A PORTRAIT OF SONOMA COUNTY 2014
ACCESS TO KNOWLEDGE
beyond high school at much higher rates, regardless of their parents’ academic credentials, than do white, Latino, or African American young people in Sonoma County. Asian Americans in Sonoma not only do better on this indicator than young people of other racial and ethnic groups in the county, they also surpass Asian Americans in the rest of the state. The enrollment rate for Asian Americans in California as a whole (already better than that of all other ethnic groups) is nearly 10 percentage points less, 86 percent.
Whites have the second highest Education Index score in Sonoma County, 5.92. Only 4.7 percent lack high school diplomas, giving this group the highest score in high school completion. More than one in three have bachelor’s degrees, and about one in seven has a graduate degree. The white educational enrollment rate, however, is essentially on par with the overall county rate.
African Americans score 4.25 on the Education Index. The share of adults with bachelor’s and graduate degrees is roughly the same as in the county as a whole. Pulling down this group’s score is the high proportion of adults who lack high school degrees, just about one in four. This rate is 10 percentage points higher than the Sonoma County rate and twice the rate for African Americans in California. African Americans’ school enrollment also lags the Sonoma County average by 6 percentage points.
Latino educational attainment in Sonoma County, as in the state and country, lags that of other groups significantly. Four in ten Latino adults did not complete high school, and less than one in ten completed a bachelor’s degree. Part of the explanation is the difference in educational attainment between native-born and foreign-born residents. Overall, U.S.-born residents have higher educational attainment levels than foreign-born residents, who are seven and a half times as likely to lack high school degrees. Eighty-eight percent of Latino immigrants to Sonoma County hail from Mexico, and many arrive with limited education; 42 percent of Sonoma’s Latino population today is foreign born.54
FIGURE 7 Asian American Educational Attainment Varies Widely by SubgroupPOPULATION WITH AT LEAST A
HIGH SCHOOL DIPLOMAPOPULATION WITH AT LEAST A
BACHELOR’S DEGREE
40%
20%
0
60%
80%
100%
VietnameseJapaneseFilipinoChinese(except
Taiwanese)
AsianIndian
VietnameseJapaneseFilipinoChinese(except
Taiwanese)
AsianIndian
59.7% 57.6%43.1%
93.8% 92.9% 88.7%
64.6%
92.8%
51.4%
17.5%
Source: U.S. Census Bureau, American Community Survey, 2006–2010 (Table DP02).

54 THE MEASURE OF AMERICA SERIES
Interestingly, while more than half of foreign-born Latino adults in California today did not complete high school, the percentage of native-born Latino adults who hold high school diplomas is virtually the same as the rate for all Californians, about 80 percent.55 This generational change, which has U.S.-born children ending up with higher levels of educational attainment than their immigrant parents, is certainly not unique to Mexican Americans but rather reflects the typical experience of most waves of immigrants to the United States. Finally, in the United States as a whole, women outpace men in educational attainment and enrollment, and this pattern holds in Sonoma County, where they are more likely to have completed high school. As discussed in great detail below, the gender gap in high school completion among today’s young people is actually larger than the gap among adults over age 25.
TABLE 5 Educational Attainment by Gender and Race and Ethnicity
POPULATION GROUPEDUCATIONINDEX
LESS THAN HIGH SCHOOL
(%)
AT LEAST HIGH SCHOOL DIPLOMA (%)
AT LEAST BACHELOR'S DEGREE (%)
GRADUATE OR PROFESSIONAL
DEGREE (%)
SCHOOL ENROLLMENT
(%)
California 5.04 18.5 81.5 30.9 11.3 78.5
Sonoma County 5.28 13.1 86.9 31.8 11.7 77.9
GenderWomen 5.59 11.2 88.8 33.0 11.8 79.7
Men 4.96 15.2 84.8 30.6 11.7 76.1
Race/EthnicityAsian Americans 7.64 12.9 87.1 44.4 15.4 95.5
Whites 5.92 4.7 95.3 38.0 14.0 76.7
African Americans 4.25 23.8 76.2 31.4 12.5 71.8
Latinos 2.37 43.6 56.4 7.7 1.9 77.4
Source: Measure of America analysis of data from the U.S. Census Bureau, American Community Survey, 2012.
Women outpace men in educational attainment and enrollment.

55A PORTRAIT OF SONOMA COUNTY 2014
ACCESS TO KNOWLEDGE
What Fuels the Gaps in Access to Knowledge? Society often seems to expect schools to solve all its problems. To be sure, throughout American history, schools have been instrumental in creating a productive and cohesive society, helping to assimilate waves of young immigrants and the children of immigrants, fostering a collective identity as Americans, developing shared norms around citizenship, and providing a ladder out of poverty for academically able young people. Yet in the past, there was not the same expectation that schools would be able to create equality of outcomes; even equality of opportunity in schools wasn’t on the table a generation ago. Girls were shut out of athletics and certain types of coursework, and African Americans faced legal segregation, the most blatant example of educational inequity in our country’s history. In 1970, only 52 percent of American adults had even completed high school, and just 11 percent had bachelor’s degrees.56 The difference between then and now was that equal opportunity for everyone, women and people of color included, was not yet a salient concept in American society. In addition, unionized jobs in manufacturing and the trades paid middle-class wages to people, mostly men, with limited academic skills; educational credentials weren’t a requirement for a family’s basic economic security. In today’s globalized, knowledge-based economy, such jobs are few and far between. In addition, society has rightly rejected the idea that school success is for the few. Schools are expected to graduate “college- and career-ready” young people, and to be able to do so for all students—including children whose young, single parents did not graduate high school and struggle to make ends meet as well as those whose affluent, college-educated parents read to them every night; neglected children from chaotic, abusive homes as well as cherished children from stable, loving ones; and everyone in between. This is a worthy aim, but to believe just saying it is so will make it so is magical thinking. In reality, educating children from disadvantaged backgrounds requires greater resources, human and financial, than educating more privileged ones. Making the required investments in disadvantaged children is imperative, not only for reasons of basic fairness and social justice, but also to ensure America’s continued competitiveness in the global economy.
Sonoma County Public Schools
70,600 students
12%receiving specialeducation services
48%economically
disadvantaged
22%learningEnglish
42%Latino
40 school districts (K–12)
182public schools107 Elementary
25 Alternative
24 Middle/Junior High
19 High
7 Independent Study
Source: Sonoma County Office of Education, About Sonoma County Schools, 2014.

56 THE MEASURE OF AMERICA SERIES
UNEQUAL RESOURCES FOR EDUCATION
States and communities tend to invest less in educating low-income students than in educating middle-class and affluent ones. Education budgets in California, as across the United States, are derived from a hyper-complex set of formulas; in California, funding comes from the federal government (about 11 percent of a school’s budget), the state (about 57 percent), local property taxes (about 31 percent), and the lottery (about 1 percent),57 supplemented by volunteer hours and contributions from parents and the private sector. Differences in property values, which underpin local educational budgets, have a big impact on the funds available to different school districts. Widening the gap are parental efforts. Because families in affluent communities have more disposable income and extensive parental social networks that include the business community, PTA fundraising efforts there can yield tens of thousands of dollars, resources sufficient to hire an art or music teacher, or funding for a year’s worth of culturally enriching field trips—thus expanding opportunities for students whose families may already pay for private music lessons or belong to local museums.
Because incomes of Latinos in the state are disproportionately low, this group is often on the losing end of the funding equation. In California, the proportion of low-income Latino students attending overcrowded schools is twice that of white students. Latino high school students are four times as likely as white high schoolers to attend schools designated “low performing,” and over twice as likely as white or Asian students to attend schools with severe shortages of qualified teachers.58 Previous Measure of America research in Los Angeles County and Marin County has found strong evidence that schools with predominantly Latino or African American students from low-income families have fewer resources at their disposal than those whose mostly white students come from more privileged circumstances. Research also shows that educational funding alone is not enough to overcome the out-of-school challenges and barriers low-income children face.59
How is Sonoma County doing on this score? One way to judge is to look at two specific schools with similarly sized but socioeconomically distinct populations. BOX 4 takes a closer look at two elementary schools.
57% State of California
31% Local Property Taxes
11% Federal Government
1% Lottery
Where do California school resources come from?
Source: “Education Budget—CalEdFacts.”

57A PORTRAIT OF SONOMA COUNTY 2014
ACCESS TO KNOWLEDGE
BOX 4 A Tale of Two Schools
ENGLISH LEARNERS
2%
67%
RACE/ETHNICITY
82%WHITE
7%LATINO
11%OTHER
76%LATINO
18%WHITE
6%OTHER
FAMILY BACKGROUND
About eight in every tencome from disadvantaged
backgrounds (84%)
About one in every tencomes from disadvantaged
background (13%)
STANDARDIZED TESTS
PROFICIENT IN ENGLISH
21%PROFICIENT IN MATH
27%PROFICIENT IN SCIENCE
40%
PROFICIENT IN ENGLISH
75%PROFICIENT IN MATH
78%PROFICIENT IN SCIENCE
83%GRANT
ELEMENTARY
EL VERANOSCHOOL
A dismaying pattern has emerged in other Measure of America studies: schools that serve the most disadvantaged students tend to have the fewest resources, and schools that serve the most advantaged students tend to have the most resources. Two Sonoma County schools buck this counterproductive trend. Grant Elementary in Petaluma enrolls 402 children. The average parental educational attainment is college graduate, and most families live in single-family homes they own. Most students enter Grant in kindergarten or first grade after one or two years of preschool and remain through sixth grade. Eighty-two percent are white, and 7 percent are Latino. Thirteen percent come from disadvantaged backgrounds, but less than 2 percent are English-language learners. On the 2012–2013 California Standardized Tests, Grant students performed very well.60
El Verano School in Sonoma Valley Unified district enrolls 437 children in kindergarten through fifth grade. Students are drawn chiefly from an area with low index scores and a poverty rate double the county average. Over eight in every ten children come from disadvantaged backgrounds, and nearly seven in ten are English-language learners. On the 2012–2013 state tests, only 21 percent of the children scored at least “proficient” in English language arts (not unexpectedly, given the large number of English-language learners).61
Grant and El Verano spend approximately the same per pupil, teacher pay and qualifications are on par, and average class size is comparable. Both schools have beautiful student murals, thriving outdoor garden plots, space for outdoor play, and warm, vibrant environments for learning. Both are also sparing in their use of suspension and expulsion, with almost no cases over the last three reporting cycles. Both schools also offer a rich array of afterschool activities, though they differ in their focus, funding, and operation. At Grant, for instance, the PTA chair manages a host of
enrichment programs, which vary by semester and are paid for by individual parents. Options for fall 2013 included chess, Spanish, art, jewelry making, and a music troupe. El Verano also offers afterschool classes like ballet, art, and yoga. In addition, the school offers a range of programs, all free of charge, that directly address out-of-school barriers to school success. A program run by the Boys & Girls Clubs of Sonoma Valley every school day from dismissal until 6:00 p.m. offers healthy snacks, homework assistance, and enrichment activities. An innovative partnership with a science museum in San Francisco combines science and English-language instruction. El Verano runs a preschool program funded by the California Department of Education and local foundations;62 a high-quality preschool is particularly vital for English-language learners, who are not only adjusting to school but also learning a new language. The school’s Universidad de Padres provides parents with a forum to talk about their needs, concerns, and hopes. A recent activity was a trip for nineteen parents to the University of California/Davis. None had attended college, and the excursion allowed them to tour the campus and learn about requirements for admission, financial aid, and college life. Although El Verano students don’t perform as well as Grant students on the state tests, the future looks bright for them. El Verano is taking steps that decades of research have shown help to close the achievement gaps opened by socioeconomic inequality. But leveling the playing field is not something that schools can do on their own; true equal opportunity requires greater investment in young children and their parents from all parts of society.
Sources: School Accountability Report Card: Grant Elementary 2012-2013 and School Accountability Report Card: El Verano Elementary School 2012-2013.

58 THE MEASURE OF AMERICA SERIES
POVERTY AND EDUCATIONAL ATTAINMENT OF PARENTS
Gaps in educational achievement in Sonoma County stem largely from poverty and parental education levels. These interacting challenges, coupled with language barriers and issues related to immigration status, particularly affect Latino families and children.
Low levels of educational attainment among parents are associated with less verbally rich environments for very young children, which has serious consequences for school readiness and success. A famous study by Betty Hart and Todd R. Risley of the University of Kansas found that poor children were exposed to about 600 spoken words per hour, while working-class children heard 1,200 words per hour and children from professional families 2,100 words per hour. By age three, a poor child had heard 30 million fewer words than one from a professional family—a huge gap separating poor children from their peers before they even entered school. The researchers found correlations between the number of words and both IQ and eventual school performance.63 In other words, children in poverty start school behind and too often do not catch up. The good news is that high-quality, center-based preschools can address this problem as well as allow children to build the noncognitive skills they will need to succeed in school (like persistence and impulse control). Unfortunately, in California, the children who would benefit most—low-income children and those at highest risk of school failure—are least likely to attend preschool.64 In Sonoma County, only 39 percent of Latino 3- and 4-year-olds attend preschool, compared to 65 percent of white 3- and 4-year-olds.65 Research by, among others, University of Chicago economist and Nobel Laureate James Heckman shows that a quality preschool experience has a higher return than any other educational investment. The cost of preschool is a barrier for low-income families, as is a lack of programs that meet the needs of the youngest English-language learners and their parents. Once in school, children living in poverty face many barriers to academic success. Some were mentioned above in the section on unequal school resources. A frequently overlooked issue is the frequency of moves. Research shows that children who change schools typically suffer “psychologically, socially, and academically from mobility,” and that “students who changed high schools even once were less than half as likely as stable students to graduate from high school, even controlling for other factors that influence high school completion.”66 While three-quarters of California students make unscheduled school changes between first grade and the senior year of high school, national patterns reveal that low-income students make more moves, especially in high school,67 than high-income students, and high-minority schools tend to have high mobility rates.68
More obviously, low levels of parental education make it more difficult for parents to help their children with homework and may make them feel intimidated when dealing with schools and teachers. Language barriers, work hours, and concerns about immigration status may make even meeting with teachers difficult.
In Sonoma County, only 39 percent of Latino 3- and 4-year-olds attend preschool, compared to 65 percent of white 3- and 4-year-olds.

59A PORTRAIT OF SONOMA COUNTY 2014
ACCESS TO KNOWLEDGE
DIFFERENCES IN HIGH SCHOOL COMPLETION BY GENDER AND ETHNICITY
Completing high school is the bare-bones minimum educational credential in today’s global economy. Yet in Sonoma County, as in the nation as a whole, only four in every five high school students graduate in four years. Failing to complete high school is associated with a variety of poor outcomes, the most obvious being economic. High school dropouts face far higher unemployment rates than better-educated adults—the rate for adults 25 and older without high school diplomas in 2013 was 11 percent, compared to 5 percent for people with associate degrees and 4 percent for those with bachelor’s degrees. Even when they are working, poorly educated Americans in our increasingly knowledge-based economy are unlikely ever to earn more than poverty wages. Average weekly earnings for full-time workers over 25 without high school diplomas are just $472—compared to $827 for all full-time workers.69
Yet the impacts of lacking a high school diploma go well beyond the pocketbook effects. The life expectancy gap between high school dropouts and high school graduates has been increasing over the past generation; today the former live seven years fewer than the latter.70 One in eleven male high school dropouts between the ages of 16 and 24 is behind bars—a figure that jumps to nearly one in four for young African American men who dropped out. People without high school diplomas are less likely to marry and more likely to have children as teenagers.71
Students who live in poverty, have recently immigrated to the United States, struggle with English, are parents, or have disabilities are all more likely to drop out of school than students without these challenges.72
Keeping young people in school is easier than luring them back. The early warning signs of dropping out of high school appear well before ninth grade and are well known. Students who fail core courses in English or math, achieve low grades, score poorly on assessments, exhibit attendance or discipline problems, or are held back are more likely to drop out. By identifying and engaging with students who exhibit a critical mass of dropout factors, stakeholders can intervene while the students are still likely to benefit from it. For early warning systems to be effective, student monitoring must begin early, as must intensive services to help at-risk children overcome the obstacles they face, from learning differences to health problems to difficult family situations. In addition, schools need to be aware of the economic situations different families are facing; young people who see their families struggling economically may feel compelled to leave school and enter the labor market, a short-term stopgap that exposes them to lifelong economic insecurity.73 Helping young people to balance their responsibilities to their families with their schoolwork and to see staying in school as a long-term investment that will pay off for everyone in the long term is vital.
U.S. weekly earnings for full-time workers over 25
WORKERSwithout a
high schooldiploma
ALLWORKERS
$827
$472
Source: U.S. Bureau of Labor Statistics, Earnings and Unemployment Rates by Educational Attainment, 2013.

60 THE MEASURE OF AMERICA SERIES
Sonoma County high schools do as well as those in the state overall in graduating students in four years, with one exception—at Cloverdale Unified, 71 percent of students graduate on time, less than the state and county averages, which straddle 79 percent. Yet a great deal of variation lies below the averages. In looking at the numbers, it is important to keep in mind the main message of this chapter: school performance is conditioned by the challenges children face outside the classroom, not just by what happens inside.74 The following are some of the key differences we found among students in Sonoma County:
• Girls in Sonoma County are considerably more likely than boys to graduate high school in four years—83.7 percent as compared to 75.0 percent. The gender gap in Cloverdale Unified is even larger, nearly 20 percentage points. In no Sonoma County district do boys “outgraduate” girls.
• At the county level, Asian American students are the most likely to graduate on time (87.8 percent do), followed by whites (84.7 percent), Latinos (72.8 percent), and African Americans (66.1 percent).
• In Cotati–Rohnert Park Unified, only 54.6 percent of African American students graduate high school on time, the lowest rate for any racial or ethnic group in any of the Sonoma County high schools.
• In West Sonoma County Union High, 79 percent of Asian American students graduate on time—about 9 percentage points lower than the rate for Asian Americans in the county as a whole.
• Healdsburg Unified, Sonoma Valley Unified, and West Sonoma County Union High have the highest rates of on-time graduation for Latino young people, between 87.3 percent and 89.7 percent. The lowest rate for Latinos among the school districts is in Santa Rosa High, where only 72.3 percent graduate in four years.
• The white rate of on-time graduation (69.8 percent) is below the Latino rate (74.1 percent) in only one district, Cloverdale.75
Sonoma County On-Time High School Graduation (percent of ninth graders who graduate from high school four years later)
GENDER
RACE/ETHNICITY
Girls
83.7%Boys
75.0%
AsianAmerican
87.8%
White
84.7%
Latino
72.8%AfricanAmerican
66.1%Source: Measure of America analysis of California Department of Education, DataQuest, 2011–2012 school year.

61A PORTRAIT OF SONOMA COUNTY 2014
ACCESS TO KNOWLEDGE
TABLE 6 Percentage of Ninth Graders Who Graduate from High School Four Years Later, by Sonoma County School District, Gender, and Race and Ethnicity
RANK SCHOOL DISTRICT OVERALL MALE FEMALE ASIAN
AMERICAN WHITE LATINOAFRICAN
AMERICAN
California 78.9 74.9 83.0 91.1 86.6 73.7 66.0
Sonoma County 79.3 75.0 83.7 87.8 84.7 72.8 66.1
1 Petaluma Joint Unified (Petaluma Joint Union High) 91.0 88.4 93.4 96.4 94.3 84.6 —
2 West Sonoma County Union High 90.8 89.8 91.8 78.6 92.3 87.3 —
3 Healdsburg Unified 90.4 87.5 93.8 — 93.1 87.3 —
4 Sonoma Valley Unified 90.3 87.7 92.9 — 90.7 89.7 —
5 Windsor Unified 88.7 87.4 90.2 — 93.0 81.4 84.6
6 Santa Rosa High 80.6 77.6 83.5 90.6 87.5 72.3 77.1
7 Cotati-Rohnert Park Unified 79.2 74.3 84.2 95.5 82.5 74.4 54.6
8 Cloverdale Unified 71.2 63.1 82.6 — 69.8 74.1 —
Source: Measure of America analysis of California Department of Education, DataQuest. Data for Geyserville are not available.Note: Where data are missing, there are too few students for reliable analysis.

IN T
HIS
SE
CT
ION
A Decent Standardof Living
Introduction
Analysis by Geography, Gender, and Race and Ethnicity
What Fuels the Gaps in Living Standards?

63A PORTRAIT OF SONOMA COUNTY 2014
A DECENT STANDARD OF LIVING
Introduction Income is essential to meeting basic needs like food, shelter, health care, and education—and to moving beyond these necessities to a life of genuine choice and freedom. Income provides valuable options and alternatives, and its absence can limit life chances, restrict access to many opportunities, lead to untenable tradeoffs among necessities, and cause tremendous stress. Income is an important means to a host of vital ends, including good health, a decent education, a safe living environment, security in illness and old age, social inclusion, and a say in the decisions that affect one’s life. Money isn’t everything, but it’s something quite important.
As the many organizations in Sonoma County that are concerned with people’s health and well-being know, material resources are an important social determinant of health. Adequate earnings allow people to afford to live in safe neighborhoods with places to exercise and generally enable access to healthy foods, clean air, and high-quality medical care. They allow families to avoid many of the situations that cause stress, such as living in overcrowded apartments or dangerous neighborhoods or having to work two jobs. Sufficient earnings free people from the chronic anxiety of not being able to make ends meet, thus protecting their health from toxic stress and stress-induced health-risk behaviors. And aside from monetary compensation, jobs themselves can (if they’re good) provide meaning, emotional support, and social capital, which boost mental health and protect physical health.
The continuation of Sonoma County’s recovery from the Great Recession, with sharp improvements in recent years across a range of economic indicators, is thus good news for human well-being. The most recent monthly unemployment figure available for the county (November 2013) was 6 percent, better than the national average and down significantly from the November 2010 rate of 10.3 percent.76 According to the Sonoma County Economic Development Board, employment grew three times faster in Sonoma, than in the nation as a whole in 2012, the county enjoys a high growth rate in business establishment, and tourism is surpassing its prerecession level.77 A recent report by the National Association of Counties reports that Sonoma County’s 2013 GDP (the total value of all goods and services produced) was $23.7 billion, and its 2012–2013 economic growth rate was 2.9 percent, close to what it had been before the 2007 crash.78
More worrisome economic trends in Sonoma County relate to persistent poverty, still-high housing costs, and stagnation—even backsliding—in the economic fortunes of middle- and low-wage workers. About one in eight people (12 percent) in the county live below the poverty line. Nearly half of all households (46 percent) spend more than 30 percent of their income on housing. Although the recession-sparked decline in median housing prices has made homeownership more affordable to new buyers than it was during the real estate bubble, that is
An overview of Sonoma County’s economic improvements and challenges
PERSISTENTPOVERTY
HIGH HOUSING
COSTSINCOME
STAGNATION
CHALLENGES
IMPROVEMENTS
ECONOMIC GROWTH
REBOUNDING TOURISM
LOWUNEMPLOYMENT
RATES
SonomaCounty

64 THE MEASURE OF AMERICA SERIES
of little comfort to those homeowners who saw the value of their largest asset plummet over the course of 2008. Median household income declined $2,500 between 2009 and 2011.79 Also concerning are the economic prospects of a large group of young people; the rate of youth disconnection (that is, the proportion of people ages 16 to 24 who are neither working nor in school) in Sonoma County increased from 10.4 percent in 2009 to 11.8 percent in 2011.80
These larger trends provide the backdrop for considerable variation by neighborhood, race, ethnicity, and gender. Some groups within Sonoma County have high living standards, while others struggle with low-wage, insecure jobs, overcrowded or unaffordable housing, and inadequate transportation (see BOX 5).
BOX 5 Commuting: Most Sonoma County Commuters Go It Alone
An overwhelming majority of Sonoma County residents, over 81 percent, drive to and from work alone; 11 percent carpool; 3.5 percent walk; and about 4 percent either use public transit or another form of transportation (see figure below). American workers over age 16 spend, on average, 25.4 minutes commuting each way; the mean commute time for Sonoma County workers is identical. This is lower than the California average of 27.1 minutes, but the average commute time for those in Sonoma using public transportation (55.3 minutes) is significantly longer than the national and California averages (47.9 and 47.3 minutes, respectively).81
Some 10 percent of Sonoma County workers commute more than an hour each way.82 Lengthy commutes have serious downsides. Long drives fuel climate change, for one. Both health and happiness suffer as the result of less sleep, decreased family time, stress over commuting standbys like timeliness, traffic congestion, and other drivers, and environmental stressors, such as noise, crowds, and pollution. The resulting ill effects may include less exercise, higher levels of stress, increased blood pressure, worse cardiorespiratory fitness, risk of neck pain, higher Body Mass Index, musculoskeletal disorders, diminished cognitive performance, and increased chances of divorce.83
81.3%DRIVE ALONE
(173,336 workers)
11.1%CARPOOL
(23,632 workers)
1.8%PUBLIC
TRANSPORTATION(3,878 workers)
3.5%WALK
(7,505 workers)
0.9%BICYCLE
(1,819 workers)
1.4%TAXI,
MOTORCYCLE,OR OTHER
(3,015 workers)
Source: U.S. Census Bureau, American Community Survey, 2012.

65A PORTRAIT OF SONOMA COUNTY 2014
A DECENT STANDARD OF LIVING
Agriculture is a cornerstone of the Sonoma County economy and was the source of over 10 percent of county earnings in 2008.84 Sonoma County agriculture enjoyed a banner year in 2012: agricultural products like crops, livestock, vineyards, and nurseries yielded over $820 million, an increase of about 41 percent from 2011. Wine grapes alone contributed 71 percent of the total 2012 value.85 With some 450 vineyards in Sonoma County, this bounty has been and remains a magnet for tourists, who spent $1.5 billion within the county in 2011.86 Residents also benefit from the availability of many different locally grown foods. Although data about the agricultural workforce in Sonoma County specifically are limited, nearly all (96 percent) of California’s farmworkers are from Mexico.87 (A study of Sonoma County agricultural workers currently under way will provide much needed information on this group.) Working conditions can be difficult. The most recent Department of Labor agricultural survey found that the typical Californian farmworker puts in forty-five hours a week and earns between $12,500 and $15,000 per year, which leaves the families of one in every four farmworkers in poverty. Over half of California farmworkers are under 35 years of age and, despite their youth, face serious barriers to working their way up either in or out of the industry. More than 62 percent cannot speak English at all, and fewer than one in ten speak it “somewhat” or “well.” In addition, most (seven in ten) are not citizens and are not authorized to work in the United States.88 Vineyard workers are more highly skilled than other agricultural workers because producing grapes for premium wines involves a series of specialized tasks (pruning, suckering, leaf removal, shoot positioning, and harvesting), many of which must be done by hand and require expertise and experience. Thus, vineyard workers in Sonoma County and neighboring Napa County tend to earn more than farmworkers elsewhere in the state, though their wages are still on the low end of the wage distribution.89 In addition, unlike farms growing crops that require tending by many workers at harvest time and almost none the rest of the year, vineyards have work to be done nine or ten months a year. Thus, some vineyard workers have as many challenges in common with low-wage workers in the service sector (low pay, the need to find long-term affordable housing and transport, no set work schedule) as they do with traditional migrant workers (the need for temporary housing, problems arising from undocumented status, physically arduous labor, exposure to pesticides and other workplace risks, and so forth).90 The wages and working conditions of farmworkers have long been an area of concern in California. Though earnings and conditions have improved, most farmworkers—the people on whom key parts of Sonoma County’s economy, particularly wine and tourism, depend—still earn too little for a life of dignity, security, and self-determination.
Agriculture is a cornerstone of the Sonoma County economy and was the source of over 10 percent of county earnings in 2008.

66 THE MEASURE OF AMERICA SERIES
BOX 6 Measuring Living Standards in the Human Development Index
Many different measures can be used to gauge people’s material standard of living. The American Human Development Index uses the median personal earnings of all full- and part-time workers 16 years of age and older; the data come from the U.S. Census Bureau’s American Community Survey. The median earnings figures in this report may strike some as unexpectedly low. News outlets and others talking about economic issues often refer to the average (or mean) incomes of households rather than the median earnings of individuals, and median household incomes in Sonoma County, which top $60,000, are about double the county’s median personal earnings. Average household incomes are higher still. What accounts for the large differences among apparently similar measures? Earnings versus income. Earnings are the wages or salaries people earn from their paid jobs. Income is a broader category; it includes earnings, which make up the largest share of income for most Americans, and it also includes pensions and Social Security benefits, child support payments, public assistance, annuities, stock dividends, funds generated from rental properties, and interest. Earnings figures thus are lower than income figures in most cases. Personal earnings versus household earnings. Actual and potential earnings have a significant impact on the range of options a person has and the decisions he or she makes about family and work life. Referring to personal earnings—rather than household earnings—allows us to compare the relative
command women and men have over economic resources. While many households are headed jointly by married couples, who typically share their incomes, more than half are not. The share of married-couple households has been falling since the 1970s; it passed the halfway mark in 2011 and is continuing a downward trend. In addition, not all married couples stay that way, and cohabitating couples who share resources also often part company.
Median versus average. The median gives a better indication than the average does of how the ordinary worker is faring. The median earnings figure is the midpoint of the earnings distribution—that is, half the population is earning more than that amount and half is earning less. In contrast, averages can be misleading in situations of high inequality; the presence of a few people taking home whopping sums will pull the average far above what the vast majority are actually earning. For example, in Sonoma County, the mean household income is nearly $84,000—almost $20,000 above the median.91
Part-time workers. The earnings of part-time workers are included in median personal earnings. While some workers prefer not to or don’t need to work full-time, others work part-time because they cannot find full-time jobs or affordable child care, or they have responsibilities, such as elder care, that make full-time work impossible. Thus, all workers are included in the median personal earnings indicators, whereas other indicators may only include full-time workers.
What About Wealth? Neither earnings nor income include wealth. Wealth (or net worth) is the value of everything a person owns—a house or other real estate, savings, investments, businesses, cars, and more—minus any liabilities or debts, such as unpaid mortgage principal. Wealth has a major impact on current well-being and future opportunities, and wealth disparities eclipse income or earnings disparities.
Unfortunately, wealth is extremely hard to measure, in part because the value of assets like stocks and real estate are constantly in flux, and also because the very wealthiest are likely to be missed in random sampling or decline to participate in surveys. The Federal Reserve Board produces reliable wealth data on the United States as a whole every three years through the Survey of Consumer Finances. The data are not available for states, counties, or congressional districts, however, much less census tracts, and thus cannot be incorporated into the American Human Development Index.

67A PORTRAIT OF SONOMA COUNTY 2014
A DECENT STANDARD OF LIVING
Analysis by Geography, Gender, and Race and EthnicityVARIATION BY GEOGRAPHY: SONOMA COUNTY IN CONTEXT
Median earnings, the main gauge of material living standards in this report, are $30,214 in Sonoma County, which is roughly on par with those of California and the country as a whole.
Sonoma County’s economic conditions look slightly less rosy, though, when compared with Marin County, whose residents earn more than those of any other California county to which Sonoma often compares itself. In Marin, median earnings are $45,052, nearly $15,000 more than in Sonoma County. Sonoma County earnings are quite similar, however, to those in neighboring Napa County as well as in Ventura, Santa Cruz, and San Luis Obispo Counties, and significantly higher than in Santa Barbara County ($24,561) and Monterey County ($22,433).
The three indicators below—unemployment, child poverty, and rent burden—track some very important risk factors that can pose direct threats to people’s capability to enjoy a decent standard of living. Sonoma County has an unemployment rate lower than both the nation and the state and lower than most of its peer counties. On child poverty, Sonoma falls in the middle of the group, though this still represents about 15,400 of the county’s children under 18 who are living in households with incomes below the poverty line. Finally, all of the counties in this group have housing cost burdens above the U.S. average. Nearly 46 percent of Sonoma’s households pay 30 percent or more of their monthly income on housing.
Earnings in Sonoma and Seven Peer Counties
Source: U.S. Census Bureau, American Community Survey, 2012.
$50K
$45K
$40K
$35K
$30K
$25K
$20K
Monterey$22,433
Santa Barbara
Marin$45,052
NapaVenturaSanta CruzSonomaSan Luis Obispo
TABLE 7 Economic Challenges in Sonoma and Seven Peer Counties
TRACT NAMEUNEMPLOYED
(% age 16 and older)CHILD POVERTY
(% under 18)SPEND 30% OR MORE OF INCOME ON HOUSING (%)
United States 7.0 22.6 35.9
California 8.4 23.8 46.8
Marin 4.6 9.1 41.7
Monterey 9.1 28.2 47.4
Napa 6.0 10.9 41.2
San Luis Obispo 6.1 15.1 44.2
Santa Barbara 6.4 20.5 46.5
Santa Cruz 8.7 14.0 45.1
Sonoma 6.0 14.9 45.7Ventura 7.3 17.7 46.4
Source: Bureau of Labor Statistics, Current Population Survey and Local Area Unemployment Statistics, non–seasonally adjusted county figures and seasonally adjusted state and national figures for November 2013 (unemployment); U.S. Census Bureau, American Community Survey, 2012 tables S1701 (child poverty) and DP04 (rent).
MEDIAN EARNINGS(2012 DOLLARS)
$30,502California
$30,155U.S.
$30,214Sonoma

68 THE MEASURE OF AMERICA SERIES
VARIATION BY GEOGRAPHY: CENSUS TRACTS
Significant disparities in median earnings separate census tracts within Sonoma County; earnings range from $14,946, which is below the federal poverty line for a two-person household, to $68,967, more than double the county median (see MAP 4).
The five top-earning tracts are East Bennett Valley, Fountain Grove, Sonoma Mountain, Skyhawk, and Cherry Valley (see TABLE 8). Earnings in all these neighborhoods surpass those in top-ranked Marin County and are, at least in two, more than twice as high as the California median. In top-earning East Bennett Valley, nearly nine in ten residents are white, and over six in ten work in the occupational category “management, business, science, and arts occupations,” which includes executives and managers in business and other fields, as well as professionals in computer and life sciences, law, medicine, and architecture. The poverty rate is 1 percent, and 92 percent of housing units are owner-occupied rather than rented. Nearly all adults have at least a high school diploma, six out of every ten have bachelor’s degrees, and school enrollment is very high.
TABLE 8 Top- and Bottom-Five Tracts for Earnings in Sonoma County
RANK TRACT NAME
MEDIAN EARNINGS(2012 dollars)
HDINDEX
California $30,502 5.39
Sonoma County $30,214 5.42
Top-Five Census Tracts for Earnings
1 East Bennett Valley $68,967 8.47
2 Fountain Grove $67,357 8.35
3 Sonoma Mountain $51,590 7.16
4 Skyhawk $50,633 7.78
5 Cherry Valley $47,536 7.18
Bottom-Five Census Tracts for Earnings
95 Kawana Springs $21,510 4.20
96 North Oakmont/Hood Mountain $20,406 5.98
97 Fetters Springs/Agua Caliente West $19,444 3.41
98 West Junior College $18,919 3.44
99 Rohnert Park B/C/R Section $14,946 3.97
Source: Measure of America analysis of data from the California Department of Public Health, Death Statistical Master File, 2005–2011, and U.S. Census Bureau, American Community Survey, 2012 and 2008–2012.
Median Earnings: Top and Bottom Five Tracts
$70K
$60K
$50K
$40K
$30K
$20K
$10K
Rohnert Park B/C/R Section$14,946
EARNINGS INSONOMA COUNTY
East Bennett Valley$68,967Fountain Grove
Sonoma Mountain
Skyhawk
Cherry Valley
Kawana Springs
North Oakmont/Hood Mountain
Fetters Springs/Agua Caliente West
West Junior College
Source: U.S. Census Bureau, American Community Survey, 2008–2012.

69A PORTRAIT OF SONOMA COUNTY 2014
A DECENT STANDARD OF LIVING
MAP 4 Median Earnings in Sonoma County by Census Tract
MEDIAN EARNINGS
$35,610–$41,136
$41,137–$68,967
$31,552–$35,609
$26,561–$31,551
$14,946–$26,560
SantaRosa
Petaluma
101
101
101
1
116
116
12
128
121
37
29
175
12
Sea Ranch Lake Sonoma
Cloverdale
Geyserville
Healdsburg
Windsor
Calistoga
Santa Rosa
Guerneville
Bodega Bay
TomalesPetaluma
Novato
SonomaCotati
Rohnert Park
20 Miles100

70 THE MEASURE OF AMERICA SERIES
The five lowest-earning census tracts in Sonoma County are Rohnert Park B/C/R Section, followed by West Junior College, Fetters Springs/Agua Caliente West, North Oakmont/Hood Mountain, and Kawana Springs. The low earnings in two of these, however, are most likely due less to financial struggles than to stage-of-life realities:
• The Rohnert Park–area tract is home to Sonoma State University and its student housing. Wages there are pulled down because a large share of the population are students, and students who are working are disproportionately likely to be in part-time and lower-paying jobs.
• North Oakmont/Hood Mountain is home to the 4,200-person planned retirement community of Oakmont, developed in 1963 for adults 55 years old and up.92 Nearly two-thirds of the residents of this tract are 65 or older, and many are no longer working. Furthermore, the relatively few Oakmont residents still in the job market may be working only part-time, relying in part on savings, pensions, and Social Security, none of which would show up as earnings. That Oakmont is a retirement community explains why 23.8 percent of residents—nearly one in four—have some form of disability and also clears up some contradictory findings, such as the coexistence of low earnings with a high share of bachelor’s and graduate degree holders.
The other three Sonoma County communities at the bottom of the earnings table, two of which are in Santa Rosa, have low concentrations of workers in management and related professions. Between four and five out of every ten residents are renters, and approximately one in four lives in poverty.
In Fetter Springs/Agua Caliente, 26.9 percent of residents lack health insurance, which, coupled with such low earnings, leaves families in this area particularly vulnerable to economic shocks like unexpected illness or injury. Rental housing in Fetter Springs/Agua Caliente is crowded; it ties Sheppard as the census tract with the largest household size among those who are renting their homes—4.5 people—compared to 2.6 people Sonoma County–wide. And 45 percent of adults here did not graduate high school. Both Fetter Springs/Agua Caliente and Kawana Springs are predominately Latino, 60 percent and 51 percent, respectively.
Communities at the bottom of the earnings table have low concentrations of workers in management and related professions.

71A PORTRAIT OF SONOMA COUNTY 2014
A DECENT STANDARD OF LIVING
VARIATION BY RACE AND ETHNICITY AND GENDER
In Sonoma County, whites earn the most money, $36,647, followed by Asian Americans ($32,495), African Americans ($31,213), and Latinos ($21,695). This earnings ranking is found in California as a whole as well, although Asian Americans are the top-earning group in the country overall. The following are more particulars about earnings by race and ethnicity in Sonoma County:
• Asian Americans in Sonoma County earn about $3,500 less than Asian Americans at the national level, whereas whites in Sonoma earn about $3,500 more than whites in the country as a whole.93
• Median personal earnings for African Americans in Sonoma County are on par with earnings for all African Americans in the state ($32,837) and higher than the national median for African Americans ($26,299).94
• The overall earnings gap in Sonoma County between whites and Latinos is about $15,000. This is about $3,500 smaller than the gap at the state level.
Men in Sonoma County earn about $8,500 more than women. This wage gap is similar to the gap between men and women at the state level, although it is around $1,000 smaller than at the national level.
The gender gap in earnings is the result of several factors, but lack of education is not one of them. As discussed above, women in Sonoma outperform their male counterparts at every educational level; they are more likely than men to hold high school, college, and graduate degrees and to be enrolled in school.
TABLE 9 Earnings by Race and Ethnicity
POPULATION GROUP
MEDIAN EARNINGS(2012 dollars)
HD INDEX
California $30,502 5.39
Sonoma County $30,214 5.42
Whites $36,647 6.01
Asian Americans $32,495 7.10
African Americans $31,213 4.68
Latinos $21,695 4.27
Source: Measure of America analysis of data from the California Department of Public Health, DeathStatistical Master File, 2005–2011, and U.S. Census Bureau, American Community Survey, 2012.
Men in Sonoma County earn about $8,500 more per year than women.
Source: U.S. Census Bureau, American Community Survey, 2012.
Men
$34,219
Women
$25,519

72 THE MEASURE OF AMERICA SERIES
Several other factors are behind the gap:
• Part-time work. Among women in Sonoma County, 42.4 percent work part time, a larger percentage than men.95 This contributes to lower median earnings.
• Responsibilities for caretaking labor. Social norms around work in and outside the home have changed significantly over the past generation, but the change has been dramatic in one direction and lackluster, at best, in the other. Women have joined men in the paid workforce in droves, but men have been slower to take over an equal share of caretaking responsibilities. As a result, women still shoulder the majority of the child and elder care, domestic work, and emotional labor required by family life. Depending upon life stage and family circumstances, handling the bulk of these tasks alongside a demanding, high-paying job is extremely difficult.
• Motherhood penalty. Women pay a wage penalty for leaving the marketplace to care for children, and evidence indicates employers discriminate more against mothers than women in general in hiring and promotion decisions.96 This is in part because the United States has not adopted family-friendly policies similar to those of all other affluent democracies, ranging from mandatory paid maternity and paternity leave, sick leave, and annual leave to care for children or elderly relatives to universal, affordable child care. The smaller wage gap in California and Sonoma County relative to the country as a whole may have something to do with the paid maternity leave mandate in the state.
• Wage discrimination. Evidence shows women across the United States are hired less frequently than men in high-wage firms and receive less training and fewer promotions. Even when working in the same occupational category, and even in female-dominated occupations like nursing, men tend to earn more than women.97
• Women work different jobs. Women are concentrated in lower-paying occupations and industries, in part because of their choices of fields of study. Fewer women major in science and engineering, for example, than in education or social work, fields with lower economic payoffs.
• Low-skills jobs pay men more. The low-wage jobs where women predominate, such as child care provider and home health aide, virtually always pay less than occupations dominated by men with similarly low educational attainment levels, such as security guard or parking attendant.98
Even in professions where women predominate, men earn more.
Source: Measure of America analysis of data from the Bureau of Labor Statistics, Current Population Survey, 2013.
Predominantly Female
Professions
Men’sWeekly MedianEarnings over
Women’s
Human Resources Manager72% FEMALE
+$100
+$122
+$150
+$160
+$296
Office and Administrative
Support76.8% FEMALE
Nurse88.8% FEMALE
Lab Technician
73.6% FEMALE
Social Worker79.7% FEMALE

73A PORTRAIT OF SONOMA COUNTY 2014
A DECENT STANDARD OF LIVING
What Fuels the Gaps in Living Standards? Gaps in living standards among different groups in Sonoma County stem from a variety of factors:
EDUCATION LEVELS
Level of education is the single biggest predictor of earnings for racial and ethnic groups and for census tracts in Sonoma County. The county’s Latino residents earn the least by a huge margin—about $9,500 less than African Americans, $11,000 less than Asian Americans, and $15,000 less than whites.99 They are also the furthest behind in terms of educational attainment, with four in ten adults lacking high school diplomas. Educational attainment rates for Latinos in California are pulled down by the lower attainment of new immigrants; in the state as a whole, U.S.-born Latino adults are as likely as other Californians to have completed high school. Enrollment rates for Sonoma County Latinos are on par with those of the county as a whole, which bodes well for improved earnings in the next generation. In terms of neighborhoods, educational attainment and enrollment strongly and positively correlate with earnings; in other words, as a census tract’s average education levels rise, so, too, do median earnings. Unlike the national story, the fact that Asian American residents have the highest education score doesn’t translate into their having the highest earnings. One likely contributing factor is that although 44 percent of Sonoma County Asian Americans have bachelor’s degrees, nearly 13 percent of the overall group lack high school diplomas (compared to only 4.7 percent of whites). This is discussed further below.
IMMIGRATION PATTERNS
Immigration patterns influence earnings largely because of the education levels of new arrivals. The vast majority of Latino migrants come from Mexico and arrive with low levels of education, giving them few options outside low-wage jobs in the service, construction, and agricultural sectors. Although immigrants from Asia tend to arrive with higher levels of education, generalizations about this large and extremely diverse population can obscure important subgroup distinctions. For instance, the county’s Laotian Lua population struggles with low English proficiency, low levels of educational attainment, high unemployment, and many health problems that stem from their often traumatic experiences as refugees fleeing war and reprisals.100
Level of education is the single biggest predictor of earnings for racial and ethnic groups and for census tracts in Sonoma County.

74 THE MEASURE OF AMERICA SERIES
HOLLOWED-OUT MIDDLE
The decline in manufacturing has made middle-class jobs less available, not just in Sonoma County, but in the state and country as well. People at the bottom of the wage ladder can’t climb it as easily as in the past because there are fewer middle rungs on the ladder. Projected job growth is primarily at the top and bottom of the income scale (see BOX 7). This bifurcated job market leads to sharp divides in living standards; the bottom fifth of Sonoma taxpayers take home only 2.5 percent of the county’s total income, while the share of the top fifth is twenty-four times higher, at 60 percent.101 The wages earned by 6 percent of all working residents of Sonoma—about 14,000 workers—are insufficient to lift them above poverty.102 The split is starkly evident in earnings at the top and bottom of the Sonoma County census tract scale. In Fountain Grove, for instance, 56 percent of workers have jobs in management-type occupations and 11 percent work in the service sector; median earnings here are over $67,000. In Fetters Springs/Agua Caliente West, only 16 percent of workers have management jobs, whereas 38 percent are in the service sector; in The Springs, median earnings are about $19,500. In Sonoma County as in the rest of the state, the boundaries of these distinct worlds of work fall along ethnic lines.
WEALTH DISPARITIES
Although wealth is not part of the American Human Development Index, it is too consequential to ignore. Wealth matters because financial assets allow families to invest in futures—to buy homes in safe neighborhoods with good schools, to invest in businesses, to pay for college, to help grown children with mortgages, and to leave behind inheritances that can translate into higher living standards for children and grandchildren. Wealth also matters because it is closely linked to the distribution of power; affluent people are more likely to be elected to public office and to influence the political process through access to social and professional networks than are the poor and middle class, and elected officials are more responsive to the preferences of the rich.103 In emergencies, assets can enable people to cushion the effects of job loss, death or divorce, or natural disasters. Because, unlike most jobs, wealth can be transferred from one generation to the next, the wealth divide is more dramatic than the earnings divide. The stark wealth differences that drive the disparities in living standards today lay the foundation for still more disparities tomorrow.
The top fifth of Sonoma County taxpayers take home 60% of Sonoma’s total income.The bottom fifth take home 2.5%.
SON
OM
A C
OU
NTY
INC
OM
E
INC
OM
E D
ISTR
IBU
TIO
N B
Y Q
UIN
TILE
BOTTOM Fifth
TOP Fifth
60%
2.5%
$
Source: Measure of America analysis of Sonoma County income tax statistics from California Franchise Tax Board 2011 Annual Report.

75A PORTRAIT OF SONOMA COUNTY 2014
A DECENT STANDARD OF LIVING
BOX 7 The Earnings Hourglass
The decline in middle-wage jobs like construction, coupled with the growth in jobs at the top and bottom of the earnings scale, creates an hourglass-shaped labor market in Sonoma County that mirrors broader national trends. Sonoma County has a workforce of 250,000, employed across a wide range of sectors.104 About two-thirds are employed by private companies; 13 percent work for local, state, or federal government entities; and much smaller percentages work for nonprofit organizations or are self-employed.105 One in five working county residents has a job in education or health care, with almost 29,000 employed in health care and social assistance alone. The next largest industry is the retail sector; one in eight employed county residents works in retail, one of the lowest-paying job categories. The typical retail worker earns only $21,500 per year, a sum that falls short of the Sonoma County self-sufficiency standard of $26,065 for just one person—and is just a fraction of the more than $53,700 a worker with two school-age children needs to make ends meet in Sonoma. The self-sufficiency standard, developed by Diana Pierce in the mid-1990s, “defines the amount of income necessary to meet basic needs (including taxes) without public subsidies (e.g., public housing, food stamps, Medicaid or child care) and
without private/informal assistance (e.g., free babysitting by a relative or friend, food provided by churches or local food banks, or shared housing).”106 Sonoma County has seen major shifts in its employment picture in recent years. From 2000 to 2011, employment declined in sectors like manufacturing and construction, where in the past middle-wage jobs were plentiful. Job growth has been strong at the top in the well-paying professional sectors, including business services, education, and health.107 Among the highest earning are business executives and medical specialists, such as psychiatrists, internists, physicians, and surgeons, all of whom earn upwards of $90 per hour, on average.108 At the opposite end of the earnings distribution are workers in a range of service and agricultural occupations—among them farm workers, graders and sorters of agricultural products, waiters and waitresses, dishwashers, and fast-food cooks—who typically earn between $9 and $12 per hour.109 Job growth has been strong in the lower-wage leisure and hospitality sectors, fueled to some degree by burgeoning interest in the farm-to-table movement and “agri-tourism,” as well as large increases in the incomes of “the top 1 percent” from the larger Bay Area and beyond, who have plenty of resources for travel.
Large and fast-growing job categories are clustered at the bottom of the earnings scale.
Jobs in the middleare shrinking.
ME
DIA
N H
OU
RL
Y W
AG
E
HIGH WAGEOCCUPATIONS
$
LOW WAGEOCCUPATIONS
$ Waiters andwaitresses
$11/HOUR
Chiefexecutives
$93/HOUR
Payroll andtimekeeping clerks
$22/HOUR
Physicians and surgeons
$113/HOUR
Personal andhome care aides
$12/HOUR
Softwaredevelopers
$56/HOUR
Restaurant andfast-food cooks
$10–12/HOUR
Engineeringtechnicians
$34/HOUR
Industrial machinerymechanics
$25/HOUR
Jobs at the bottomare growing.
Source: Mean hourly wage from California Employment Development Department, High Wage Occupations in Santa Rosa-Petaluma Metro Statistical Area, first quarter 2013.

Agenda for Action
Population-Based Interventions• Make Universal Preschool a Reality • Redouble Antismoking Efforts
Place-Based Interventions• Improve Neighborhood Conditions to
Facilitate Healthy Behaviors
• Mend the Holes in the Safety Net for Undocumented Immigrants
• Address Inequality at Education’s Starting Gate
• Prioritize On-Time High School Graduation
• Reduce Youth Disconnection
• Take a Two-Pronged Approach to Raising Earnings: Boost Education and Improve Pay
What concrete actions can the Sonoma County Department
of Health Services and its allies across a wide range of
sectors take to shore up the foundations of well-being for
all the county’s people and build the capabilities of those
groups that lag behind?

77A PORTRAIT OF SONOMA COUNTY 2014
AGENDA FOR ACTION
Sonoma County is home to some communities in which most residents have the tools they need to live healthy, productive, freely chosen lives; neighborhoods in Bennett Valley, the Sonoma Mountain and Arroyo Park area, and Southwest Sebastopol are good examples. The rich and diverse sets of capabilities and conditions people in these and similar Sonoma County communities tend to have—from educational credentials, well-paying jobs, and strong social networks to safe neighborhoods, secure housing, and a voice in the decisions that affect their lives—are reflected in their communities’ high scores on the American Human Development Index. This is not to say people living in neighborhoods that score on the high end of the index scale (from roughly 6.50 upward) are on easy street; they work hard and are certainly not immune to the reversals and sorrows that are part and parcel of the human condition. Nonetheless, the foundational building blocks they require to realize their potential and invest in their families’ futures are firmly in place.
Sonoma County is also home to neighborhoods in which people face many obstacles to discovering, developing, and deploying their unique gifts and talents, and where necessity too often demands that human flourishing take a backseat to human survival. In the lowest-scoring tracts—those that fall in the high 2.00 to low 4.00 range—fewer capabilities translates into fewer choices and opportunities, as well as greater economic insecurity. In Southwest Santa Rosa, East Cloverdale, and other low-scoring Sonoma County communities, adults must direct the lion’s share of their time and energy to securing the basics—essentials like nutritious food, medical care, and a place to live. The struggle to stretch low wages far enough to make ends meet and to navigate the daily challenges of life in high-poverty neighborhoods exacts a high cost: the chronic stress of insecurity causes excessive wear and tear on the heart and blood vessels, weakens immunity, frays relationships, and erodes psychological health. And the effects of prolonged poverty, particularly in the early years, on children’s well-being are grave and long-lasting.
Between these high- and low-scoring neighborhoods are ones that score in the high-4.00 to mid-6.00 range. The people living in these communities experience a mixture of security and insecurity. Their health, levels of education, and earnings range from near the national average to well above it. But, like many in California’s statistical middle, they lack the security Americans have long associated with middle-class status. Too frequently they face high housing costs, have limited assets, have too little saved for higher education and retirement costs, and are particularly affected by the erosion of middle-class jobs and benefits. Many have yet to recover fully from the effects of the Great Recession.
As this report reaches its conclusion, the question we need to ask is this: What concrete actions can the Sonoma County Department of Health Services and its allies across a wide range of sectors take to shore up the foundations of well-being for all the county’s people and build the capabilities of those groups that lag behind?
Sonoma County is home to some communities in which most residents have the tools they need to live healthy, productive, freely chosen lives and others in which people face many obstacles to discovering, developing, and deploying their unique gifts and talents.

78 THE MEASURE OF AMERICA SERIES
Two sets of actions offer promise. The first comprises population-based interventions targeted at Sonoma County as a whole; they are aimed at promoting the overall well-being of the county and will benefit communities all along the human development spectrum. The second includes place-based interventions that target specific neighborhoods.
Population-Based Interventions
Make Universal Preschool a Reality A mountain of evidence shows that disadvantaged children who benefit from a high-quality preschool experience are less likely to repeat grades and more likely to graduate from high school and college, marry, earn more, and be healthier as adults than those who do not. They are also less likely to have children when they are teenagers, receive public assistance, and spend time behind bars.110 National research has consistently shown that quality matters—poor-quality programs don’t help disadvantaged children and may harm them—and that the most disadvantaged children attend the lowest-quality preschools.111
Today, only about half of Sonoma County’s 3- and 4-year-olds are enrolled in preschool and, among Latinos, the rate falls to 39 percent. In 2012, the average annual full-time cost in licensed child care/preschool centers was $9,500131 for preschool-age children – equivalent to about one-third of the median annual personal earnings for the county. This high price puts preschool out of reach not just for low-income families but for many middle-income families as well. Fewer than 3,200131 spots in licensed centers were available for 3- and 4-year-olds in 2012. Even if all spots went to subsidy-eligible children, we would still have a shortage of almost 2,000132 spots for subsidy-eligible children, not to mention the remaining 6,000 of 3-4 year olds in the county.112 A commitment among municipalities, the county, the business community, the school system, and the philanthropic community to meet the need for subsidized preschool would help secure a life of choice and value for today’s Sonoma County children. As quality is fundamental to the benefit of preschooling, raising the wages of preschool personnel to attract teachers with early childhood expertise is important. The California Employment Development Department estimates Sonoma County has about 1,800 child care workers, and, in the Santa Rosa–Petaluma Metro Area, their median hourly wages are just $11.52.113 Attaching a preschool to an existing elementary school, as El Verano School has done, is an excellent approach to build strong bonds between families and the school from the start.
Today, only about half of Sonoma County’s 3- and 4-year-olds are enrolled in preschool and, among Latinos, the rate falls to 39 percent.

79A PORTRAIT OF SONOMA COUNTY 2014
AGENDA FOR ACTION
Redouble Antismoking EffortsMost premature death today stems from preventable health risks, chief among which is smoking. Among its peer counties, Sonoma County has the highest rate of adults who smoke, 14.3 percent. The county also has higher incidence and death rates from cancer than are average for California, particularly among whites.114 Given that tobacco is highly addictive and most people who smoke began in their teens,115 the best way to lower smoking rates is to prevent teenagers from picking up the habit in the first place. Since most smokers want to quit, helping them do so is also vital; quitting by age thirty-five reduces most of the risk of premature death, and quitting by forty returns an astonishing nine years of life expectancy to a former smoker.116 Sonoma County has a range of approaches in place to address both adults and teens, including an ordinance prohibiting smoking in certain public places, active public health campaigns, and free and low-cost smoking cessation programs. Yet adult and teen smoking rates in Sonoma remain stubbornly high.117 California’s cigarette tax, at 87 cents per pack, is among the lowest in the country.118 Raising cigarette prices could have an immediate impact on young smokers in particular, who respond quickly to price increases.119 Another important strategy would be enforcing ID laws and restricting sales in pharmacies, particularly near parks and schools, to limit teens’ access to cigarettes. Building upon the ample evidence about what works to lower smoking rates can make a real difference to longevity in Sonoma County.
Most premature death today stems from preventable health risks, chief among which is smoking.

80 THE MEASURE OF AMERICA SERIES
Place-Based InterventionsPlace matters to psychological and physical health and is a fulcrum of educational and economic opportunity. Our well-being and life paths are profoundly shaped by the characteristics of the places where we are born, spend our earliest years, attend school, make friends, fall in love, make the transition from adolescence to adulthood, work, start families, and age. Neighborhoods can be bridges, or barriers, to lives of freedom and opportunity.
The American Human Development Index allows us to identify areas whose populations face interlocking health, education, and income impediments to human flourishing. In Sonoma County, the census tracts with the lowest scores should be the focus of a place-based approach to improving people’s well-being. The challenges these communities face are well beyond what any single institution—whether a school, a health clinic, or a municipal or county agency—can meaningfully address on its own. A place-based approach views a neighborhood, its people, and their assets and challenges as a holistic system and brings to bear on their needs the concerted, coordinated efforts of a wide variety of actors from the business community, local government, schools, hospitals, community-based organizations, faith communities, and the philanthropic sector. Place-based approaches, which also fall within the rubric of “collective impact,” ideally ensure that a set of actions becomes more than the sum of its parts and does so in a way that empowers communities to identify their own priorities and solutions.
Index results suggest that the areas discussed in BOX 8 , many of which comprise contiguous census tracts, would benefit from a place-based approach.
In some low-scoring Sonoma County census tracts, the data show clearly the basic areas where the lag is most significant and where concerted effort could make a real difference to overall human development levels. East Cloverdale, for instance, has fallen behind in terms of education, not just of adults over age 25, but in terms of today’s young people as well; education would, therefore, appear to be a good place to start. The Springs lags in education and income, but already has put in place education policies and approaches that are helping to close the gap between Latino and white students, as evidenced by the near parity between these two groups in rates of on-time graduation from Sonoma Valley High School; the improvement already in progress has set in place a strong foundation for further place-based initiatives. But in areas like Southwest Santa Rosa, all major indicators badly trail the county average. From health and housing to health insurance and income, people in these neighborhoods face major constraints from all quarters in terms of their ability to live freely chosen lives of value. To impose a hierarchy of needs or list of priorities for action from outside would only serve to disempower these communities further.
Place matters to psychological and physical health and is a fulcrum of educational and economic opportunity.

81A PORTRAIT OF SONOMA COUNTY 2014
AGENDA FOR ACTION
Bolstering the ability of existing organizations to take a lead role in the development of priorities for place-based initiatives, or supporting the creation of new mechanisms, is a critical first step.
Although each community will identify a set of issues that call for intervention based on people’s most pressing concerns, the analysis done for this report suggests that making real progress toward higher levels of well-being and expanded opportunity requires taking the actions outlined below. This list can serve as a launching point for community-led identification of priorities.
BOX 8 Sonoma County Priority Places
Southwest and Southeast Santa RosaThree census tracts in Southwest Santa Rosa, adjacent to one another in the area bounded by Highway 12 and Route 101, have the county’s lowest human development levels. Index scores in Roseland Creek, Roseland, and Sheppard, which range from 2.79 to 2.98, are similar to those that prevailed in the country as a whole in the late 1970s. The struggles here are many: life expectancies are among the county’s lowest (around 77 years); four in ten adults lack high school diplomas; school enrollment rates are well below the county average; and earnings are roughly $22,000 per year—the median wage that prevailed in the United States in the late 1960s. Six in ten housing units are rented, and the average size of households living in rental housing is among the county’s highest, suggesting overcrowded living conditions. Just across Route 101 lie two Southeast Santa Rosa tracts, Kawana Springs and Taylor Mountain, which rank eighty-first and eighty-ninth, respectively, on the index among the ninety-nine Sonoma County census tracts. Their low scores place Southeast Santa Rosa at high priority for intervention.
Northwest Santa RosaThe scores of the eight tracts to the north of Highway 12 that straddle Route 101 in Santa Rosa range from 3.50 to a bit over 4.00, which are typical of the country in the early 1990s. The neighborhoods of West End, Bicentennial Park, Downtown Santa Rosa, Comstock, Burbank Gardens, West Junior College, Coddingtown, and Railroad Square, all of which are among the twenty lowest-scoring tracts, together represent a large area of concentrated disadvantage.
The SpringsThe Springs in Sonoma Valley (Fetters Springs/Agua Caliente West) has the lowest score outside Southwest Santa Rosa. This comparatively compact area lies amid census tracts with much higher scores. Although life expectancy in this community is higher than the county average, 45 percent of its adults lack high school diplomas and its median personal earnings are third from last among Sonoma’s ninety-nine tracts. The relatively small population (just over 5,000); the fact that this community is not adjacent to other high-poverty, low-human-development areas; and the strong positive community role played by the area’s schools (see BOX 4 ) give a place-based approach to the area a high likelihood of success.
East CloverdaleEast Cloverdale ranks ninety-first among the ninety-nine Sonoma County census tracts. This north Sonoma tract struggles in particular with education. Three in ten adults lack high school diplomas, and just 12 percent hold bachelor’s degrees (compared to 31.8 percent for Sonoma County as a whole). School enrollment, at 63.5 percent, is in the bottom five for the county, and the rate for on-time graduation from high school in the Cloverdale Unified school district is fewer than three in four students (71.2 percent)—the lowest in the county. The situation with boys is particularly worrisome; less than two-thirds (63.1 percent) graduate high school in four years.

82 THE MEASURE OF AMERICA SERIES
Improve Neighborhood Conditions to Facilitate Healthy BehaviorsBetter health and longevity are largely the result of the conditions of our daily lives, the levels of stress we habitually experience, the scores of small decisions we make about what to put in our bodies, and how well we are able to avoid the “fatal four” risk factors for premature death: smoking, drinking to excess, poor diet, and physical inactivity. Efforts to improve neighborhood conditions should focus on creating a safe environment with more sidewalks, more streetlights, more parks, convenient, full-service grocery stores, accessible physical and mental health care, and other amenities conducive to healthy behaviors. They should also focus on eliminating risk factors, such as easily available tobacco, pervasive alcohol advertising, or concentrations of fast-food outlets.
Mend the Holes in the Safety Net for Undocumented ImmigrantsRecent estimates show Sonoma County has roughly 41,000 undocumented immigrants, constituting 8.8 percent of the population—the tenth-highest rate among California’s counties.120 Undocumented immigrants and their children, including children who are U.S. citizens, face significant challenges in getting access to vital services and are often unaware of what services actually exist. Despite Sonoma County efforts and policies to improve the well-being of this population, including the Sanctuary County designation for driving and the promotion of the health insurance program Healthy Kids, the undocumented and their families face numerous and varied barriers to living productive, fulfilling lives of value and dignity.
Address Inequality at Education’s Starting GateUniversal preschool in Sonoma County would benefit all families, and particularly low-income families. But those with the greatest challenges, such as deep poverty, domestic instability, and low levels of parental education, also need intervention at an earlier stage. The first three years are critical to the emotional, social, cognitive, and linguistic development of young children, and responsive, warm, and appropriately stimulating interactions with consistent caregivers provide the primary pathway for this development. Well-tested and proven programs, such as the Nurse-Family Partnership, that target infants and young children in the 0–3 age range and their parents are associated with greatly improved child health outcomes and school performance and more effective parenting strategies.121
Longevity is largely the result of the conditions of our daily lives.

83A PORTRAIT OF SONOMA COUNTY 2014
AGENDA FOR ACTION
Prioritize On-Time High School GraduationA high school diploma is the barebones minimum educational credential in today’s increasingly knowledge-based economy; the costs of dropping out of high school are extremely high in terms of health, relationships, employment, and wages. On-time graduation rates vary widely by school district in Sonoma County, from over 90 percent of ninth graders finishing high school on time in Petaluma Joint Unified, West Sonoma County, Healdsburg Unified, and Sonoma Valley Unified, to fewer than three in four in Cloverdale Unified.122 The early-warning signs that typically precede a child’s dropping out of high school are now well established, allowing for the development of systems to identify, monitor, and engage at-risk youth. Vigorous efforts to support students at risk of dropping out can pay dividends not only to the students and their schools but to all county residents, as high school dropouts are four times as likely as high school graduates to be unemployed123 and eight times as likely to be incarcerated.124
Reduce Youth Disconnection The years between ages 16 and 24 are extremely important for a person’s life trajectory—a time for gaining educational credentials, work experience, and the social and emotional skills required for a productive, rewarding adulthood. Yet in Sonoma County, 11.8 percent of people in this age group, comprising nearly 7,000 teens and young adults, were “disconnected” in 2011—that is, neither working nor in school—up from 10.4 percent in 2009.125 Young people of color are disproportionately likely to be disconnected.126 Periods of disconnection as a young person reverberate in adulthood in the form of lower wages, lower marriage rates, and higher unemployment rates. Offering narrow interventions late in the game, such as an unpaid high school summer internship, cannot turn around a situation years in the making. The large majority of disconnected young people come from communities with entrenched poverty, where the adults in their lives also tend to be disconnected from mainstream institutions as they struggle with limited education, frequent periods of unemployment, and limited social networks.127 Preventing youth disconnection thus requires improving the conditions and opportunities in today’s high-disconnection communities. It also requires the creation of meaningful pathways—such as career and technical education programs in high school linked to postsecondary certificate programs and work experience—that connect school and work for students whose interests and aspirations are not best served by traditional bachelor’s degree programs. Another important priority is helping low-income young people with the financial costs of attending college and certificate programs.128
The costs of dropping out of high school are extremely high in terms of health, relationships, employment, and wages.

84 THE MEASURE OF AMERICA SERIES
Take a Two-Pronged Approach to Raising Earnings: Boost Education and Improve Pay When families earn too little to make ends meet, a host of well-being outcomes suffer. The impact on children is particularly pronounced: research shows that deep poverty in early childhood has immediate and lifelong adverse effects, including worse health, lower levels of educational attainment, and a greater chance of living in poverty in adulthood.129 Two pathways are open to higher earnings, and ideally Sonoma County will pursue both:
• Help more people bypass or exit low-paying sectors by getting more education. Sonoma County should focus on boosting educational outcomes, starting with providing universal preschool and raising rates of high school completion, to make livelihoods more secure and improve health.
• Ensure that all jobs, including those that do not require a college degree, pay wages that afford workers the dignity of self-sufficiency and the peace of mind of economic security. Not everyone has an interest in higher education or the opportunity, preparation, or aptitude for it, and not everyone has the wherewithal to enter higher-paying fields. As discussed earlier, fewer mid-level jobs are available today than in the past, and the low-wage service sector is the country’s fastest-growing job category. While a job as a farmworker, a cleaner in a hotel or inn, or a laborer on a construction site may be a stepping-stone for some, for many, jobs like these are long-term careers. Improving the pay and quality of such jobs, which employ many working adults in Sonoma County’s poorest tracts, is central to improving well-being in those communities.
California’s minimum wage will rise to $9 per hour in July 2014, and to $10 in January 2016. In addition, several municipalities in Sonoma County have introduced ordinances that raise the wage floor further. These important steps should be built upon. In addition, the onus should not rest solely on the government but also on employers to make all jobs “good jobs.” Also central to well-being is improving the quality of these jobs, not just by providing benefits like sick leave, but by reducing the variability of work schedules. Many low-wage workers not only work too few hours at one job to make ends meet; they also have work schedules that change weekly. Some are even subject to “on-call” schedules, where they call in to see if they should come to work each day. This variability makes it impossible to take second jobs or make financial plans, wreaks havoc on child care scheduling needs, and feels disrespectful and disempowering—all factors that contribute to health-eroding chronic stress.
When families earn too little to make ends meet, a host of well-being outcomes suffer.

85A PORTRAIT OF SONOMA COUNTY 2014
AGENDA FOR ACTION
ConclusionSonoma County is rich in organizations dedicated to improving life for its residents, particularly those who face high barriers to living freely chosen lives of value and opportunity. Working together, these public and private organizations can make a real difference. Population-based approaches, the mainstay of public health, offer great promise for longer, healthier, and more rewarding lives for everyone. Making universal preschool a reality and redoubling antismoking efforts are high-impact priorities that enjoy widespread popular support; setting concrete, realistic-but-ambitious targets could galvanize collective action. Place-based approaches offer a way to address the multiple and often interlocking disadvantages faced by families living in low-scoring communities. Having as a starting point a process in which residents themselves identify their top priorities and organizations and then join together to help address them is an empowering approach that makes meaningful, lasting results more likely.

ReferencesIN
TH
IS S
EC
TIO
N
Sonoma County Human Development Indicators
Methodological Notes
Notes
Bibliography
Sonoma County Census Tract Reference Map

87A PORTRAIT OF SONOMA COUNTY 2014
REFERENCES
HD Index by Race/Ethnicity and Gender
Sonoma County Human Development IndicatorsThe following indicator tables were prepared using the latest available data on Sonoma County. All data are standardized to ensure comparability. To create customized maps and interactive data charts for these indicators, go to: www.measureofamerica.org/maps.
HDINDEX
LIFEEXPECTANCY
AT BIRTH(years)
LESS THAN HIGH SCHOOL
(%)
AT LEASTBACHELOR’S
DEGREE(%)
GRADUATE OR PROFESSIONAL
DEGREE(%)
SCHOOLENROLLMENT
(%)
MEDIANEARNINGS
(2012 dollars)HEALTHINDEX
EDUCATIONINDEX
INCOMEINDEX
California 5.39 81.2 18.5 30.9 11.3 78.5 30,502 6.35 5.04 4.79
Sonoma County 5.42 81.0 13.1 31.8 11.7 77.9 30,214 6.26 5.28 4.72
GENDER
1 Women 5.41 83.0 11.2 33.0 11.8 79.7 25,591 7.08 5.59 3.57
2 Men 5.30 78.9 15.2 30.6 11.7 76.1 34,219 5.36 4.96 5.59
RACE/ETHNICITY
1 Asian Americans 7.10 86.2 12.9 44.4 15.4 95.5 32,495 8.44 7.64 5.23
2 Whites 6.01 80.5 4.7 38.0 14.0 76.7 36,647 6.05 5.92 6.06
3 African Americans 4.68 77.7 23.8 31.4 12.5 71.8 31,213 4.86 4.25 4.95
4 Latinos 4.27 85.3 43.6 7.7 1.9 77.4 21,695 8.03 2.37 2.43
HD Index for Peer Counties
HDINDEX
LIFEEXPECTANCY
AT BIRTH(years)
LESS THAN HIGH SCHOOL
(%)
AT LEASTHIGH SCHOOL
DIPLOMA(%)
AT LEASTBACHELOR’S
DEGREE(%)
GRADUATE OR PROFESSIONAL
DEGREE(%)
SCHOOLENROLLMENT
(%)
MEDIANEARNINGS
(2012 dollars)HEALTHINDEX
EDUCATIONINDEX
INCOMEINDEX
United States 5.07 79.0 13.6 86.4 29.1 10.9 77.5 30,155 5.43 5.06 4.71
California 5.39 81.2 18.5 81.5 30.9 11.3 78.5 30,502 6.35 5.04 4.79
RANK
1 Marin County 7.73 84.2 6.8 93.2 55.8 24.5 87.3 45,052 7.60 8.09 7.49
2 Santa Cruz County 5.79 81.9 14.0 86.0 38.3 15.2 80.6 30,525 6.63 5.94 4.79
3 San Luis Obispo County 5.60 81.1 8.7 91.3 33.5 11.8 81.6 29,582 6.30 5.91 4.58
4 Ventura County 5.59 82.3 17.3 82.7 31.6 11.1 78.8 30,738 6.79 5.15 4.84
5 Napa County 5.43 81.4 18.3 81.7 30.3 9.2 78.5 31,074 6.43 4.93 4.92
6 Sonoma County 5.42 81.0 13.1 86.9 31.8 11.7 77.9 30,214 6.26 5.28 4.72
7 Santa Barbara County 5.06 82.2 20.8 79.2 30.2 12.5 80.2 24,561 6.77 5.12 3.29
8 Monterey County 4.47 82.4 30.1 69.9 24.0 8.7 76.6 22,433 6.84 3.92 2.66
Sources: HD Index: Measure of America analysis of California Department of Public Health, Death Statistical Master File, 2005–2011, and U.S. Census Bureau, American Community Survey, 2012. Demographic Indicators by Census Tract: U.S. Census Bureau, Census 2010. Tract all or partially within City: Missouri Census Data Center, MABLE/Geocorr12: Geographic Correspondence Engine. All other indicators: U.S. Census Bureau, American Community Survey, 2012 and 2008–2012.
Note: The “Tract all or partially within City” column on pages 92-93 identifies which incorporated city the tract is all or partially within the boundaries of, if any. Tracts straddling one or more cities were grouped with the city in which the largest share of their population lives. A blank cell indicates that the tract is in an unincorporated part of the county or is part of a town.

88 THE MEASURE OF AMERICA SERIES
HD Index by Census Tract
HDINDEX
LIFEEXPECTANCY
AT BIRTH(years)
LESS THAN HIGH
SCHOOL (%)
AT LEASTBACHELOR’S
DEGREE(%)
GRADUATE OR PROFES-
SIONAL DEGREE
(%)
SCHOOLENROLL-
MENT(%)
MEDIANEARNINGS
(2012 dollars)HEALTHINDEX
EDUCATIONINDEX
INCOMEINDEX
TOTAL POPULATION
MALE POPULATION
FEMALE POPULATION
POPULATION UNDER 18
(%)
POPULATION 65 AND OLDER
(%)
AFRICAN AMERICAN
POPULATION (%)
ASIAN AMERICAN
POPULATION(%)
LATINO POPULATION
(%)
TWO OR MORE RACES
OR SOME OTHER RACE
(%)
WHITE POPULATION
(%)
California 5.39 81.2 18.5 30.9 11.3 78.5 30,502 6.35 5.04 4.79 California 37,253,956 18,517,830 18,736,126 25.0 11.4 5.8 12.8 37.6 3.6 40.1
Sonoma County 5.42 81.0 13.1 31.8 11.7 77.9 30,214 6.26 5.28 4.72 Sonoma County 483,878 237,902 245,976 22.0 13.9 1.4 3.7 24.9 3.9 66.1
1 East Bennett Valley 8.47 82.0 0.5 58.6 24.0 90.2 68,967 6.67 8.75 10.00 1 East Bennett Valley 3,572 1,757 1,815 18.1 20.5 0.3 2.9 4.9 2.4 89.5
2 Fountain Grove 8.35 82.0 4.2 56.6 24.6 88.7 67,357 6.68 8.38 10.00 2 Fountain Grove 10,001 4,829 5,172 19.1 22.9 0.8 7.1 6.7 3.2 82.3
3 Skyhawk 7.78 83.1 3.6 57.8 22.5 84.1 50,633 7.12 7.93 8.30 3 Skyhawk 8,365 4,156 4,209 22.6 17.2 0.6 4.9 7.2 3.1 84.2
4 Annadel/South Oakmont 7.71 84.3 3.1 54.3 21.2 86.5 45,441 7.61 7.96 7.55 4 Annadel/South Oakmont 3,324 1,451 1,873 6.0 60.3 0.2 1.8 3.1 1.4 93.6
5 Old Quarry 7.71 82.5 3.7 57.5 26.5 93.1 43,919 6.86 8.94 7.32 5 Old Quarry 4,552 2,251 2,301 22.2 15.4 0.6 2.7 7.5 3.2 86.0
6 Rural Cemetery 7.67 83.6 3.4 48.0 25.7 92.5 43,240 7.35 8.44 7.21 6 Rural Cemetery 4,329 1,928 2,401 17.5 26.2 0.5 2.1 6.3 3.3 87.8
7 Central Bennett Valley 7.63 85.7 6.3 40.8 15.8 89.4 44,564 8.21 7.26 7.42 7 Central Bennett Valley 3,563 1,721 1,842 20.3 19.3 1.8 2.3 10.8 4.3 80.8
8 Sea Ranch/Timber Cove 7.35 84.8 1.1 65.4 40.8 86.7 31,552 7.83 9.21 5.02 8 Sea Ranch/Timber Cove 1,720 848 872 9.2 39.5 0.9 1.0 9.2 2.3 86.5
9 Cherry Valley 7.18 81.1 5.6 40.1 15.7 90.6 47,536 6.31 7.37 7.86 9 Cherry Valley 3,350 1,634 1,716 19.4 13.9 0.5 1.5 9.9 4.3 83.9
10 Sonoma Mountain 7.16 81.2 4.3 39.8 7.7 87.3 51,590 6.32 6.74 8.43 10 Sonoma Mountain 5,369 2,656 2,713 29.3 8.6 1.2 9.4 14.1 3.7 71.6
11 Windsor East 7.06 83.3 7.2 40.5 13.7 81.9 45,526 7.22 6.40 7.56 11 Windsor East 3,861 1,899 1,962 27.2 12.1 0.4 2.6 16.0 3.7 77.3
12 Meadow 7.00 81.2 4.5 39.1 15.1 85.5 47,368 6.32 6.86 7.84 12 Meadow 4,004 1,963 2,041 27.7 8.1 1.9 5.6 17.2 3.5 71.8
13 Petaluma Airport/Arroyo Park 6.98 82.4 5.0 36.9 8.4 88.3 44,504 6.82 6.71 7.41 13 Petaluma Airport/Arroyo Park 4,325 2,137 2,188 23.8 10.5 0.6 4.9 15.4 4.0 75.1
14 Downtown Sonoma 6.95 80.4 4.3 52.3 19.7 86.1 42,835 5.99 7.71 7.14 14 Downtown Sonoma 3,678 1,659 2,019 17.9 23.6 0.3 2.8 14.4 2.1 80.4
15 Southwest Sebastopol 6.94 81.5 6.5 41.9 15.6 85.5 44,669 6.47 6.92 7.43 15 Southwest Sebastopol 4,011 1,875 2,136 19.5 17.7 0.8 1.7 9.5 3.5 84.5
16 Gold Ridge 6.94 83.4 5.4 51.4 21.5 77.5 40,151 7.23 6.89 6.69 16 Gold Ridge 3,684 1,847 1,837 16.6 17.4 0.7 1.6 10.3 2.9 84.6
17 Arnold Drive/East Sonoma Mountain 6.77 82.6 5.1 50.9 13.8 78.7 40,369 6.94 6.66 6.73 17 Arnold Drive/East Sonoma Mountain 4,170 1,907 2,263 10.8 40.4 0.2 2.0 9.3 2.2 86.3
18 Central East Windsor 6.71 83.3 9.5 21.2 8.4 100.0 38,783 7.22 6.45 6.45 18 Central East Windsor 3,288 1,545 1,743 24.8 15.5 1.0 2.9 26.8 3.8 65.6
19 Larkfield-Wikiup 6.62 81.2 6.4 36.2 9.9 81.9 44,643 6.35 6.07 7.43 19 Larkfield-Wikiup 5,271 2,619 2,652 21.9 16.5 0.6 2.7 20.5 4.3 72.0
20 Sonoma City South/Vineburg 6.57 80.4 5.4 32.0 13.3 90.1 41,168 5.99 6.86 6.87 20 Sonoma City South/Vineburg 4,505 2,040 2,465 18.1 29.6 0.6 2.7 13.9 2.1 80.8
21 Southern Junior College Neighborhood 6.56 81.9 4.0 49.5 18.1 79.7 37,055 6.60 6.93 6.14 21 Southern Junior College Neighborhood 3,527 1,596 1,931 14.8 17.0 1.8 1.9 11.8 4.2 80.3
22 Jenner/Cazadero 6.55 84.8 4.7 35.9 12.1 80.2 35,000 7.83 6.07 5.74 22 Jenner/Cazadero 2,400 1,249 1,151 14.3 18.8 0.3 1.5 12.3 6.6 79.4
23 Occidental/Bodega 6.47 81.7 5.0 51.5 25.5 83.4 32,468 6.54 7.65 5.22 23 Occidental/Bodega 3,747 1,909 1,838 14.1 18.8 0.4 2.2 8.3 3.7 85.4
24 Fulton 6.46 81.2 12.2 30.2 7.1 89.2 41,465 6.34 6.12 6.92 24 Fulton 5,234 2,569 2,665 23.8 10.4 2.5 6.0 19.5 4.1 67.8
25 Spring Hill 6.45 77.1 8.2 45.7 15.3 86.4 46,214 4.62 7.08 7.67 25 Spring Hill 4,994 2,398 2,596 20.8 15.8 0.6 2.5 14.8 2.8 79.3
26 Casa Grande 6.42 82.4 7.6 38.4 12.6 84.7 35,987 6.82 6.50 5.93 26 Casa Grande 4,067 2,031 2,036 26.3 9.0 1.8 6.7 31.3 4.2 56.0
27 Montgomery Village 6.38 82.0 3.8 32.7 10.8 86.4 36,101 6.68 6.50 5.96 27 Montgomery Village 5,219 2,427 2,792 19.5 14.4 1.2 2.6 12.0 5.0 79.2
28 Hessel Community 6.37 81.3 7.7 34.0 12.1 83.1 39,743 6.37 6.13 6.62 28 Hessel Community 4,319 2,142 2,177 16.5 17.8 0.8 1.7 10.9 3.3 83.3
29 Rohnert Park F/H Section 6.22 81.6 6.3 31.1 8.8 87.0 35,610 6.50 6.28 5.86 29 Rohnert Park F/H Section 5,174 2,579 2,595 22.7 9.9 1.3 5.9 15.3 4.6 72.9
30 West Bennett Valley 6.17 81.6 6.6 47.5 18.8 72.4 36,145 6.50 6.06 5.96 30 West Bennett Valley 6,591 3,026 3,565 19.7 16.9 1.4 3.3 13.2 4.4 77.6
31 Carneros Sonoma Area 6.15 81.7 8.3 39.6 12.1 92.3 30,052 6.55 7.22 4.68 31 Carneros Sonoma Area 2,322 1,165 1,157 17.9 19.9 0.1 1.9 16.6 2.7 78.7
32 Northeast Windsor 6.15 83.3 12.2 23.2 5.7 81.9 37,289 7.22 5.04 6.18 32 Northeast Windsor 3,239 1,610 1,629 26.8 11.8 0.7 3.1 26.9 3.4 65.8
33 North Healdsburg 6.11 81.7 12.0 41.9 18.4 81.8 32,928 6.56 6.44 5.32 33 North Healdsburg 5,421 2,649 2,772 22.7 17.1 0.8 2.1 25.8 2.9 68.4
34 Windsor Southeast 6.11 79.6 11.1 16.6 5.6 94.2 40,145 5.66 5.97 6.69 34 Windsor Southeast 4,336 2,106 2,230 26.4 13.7 0.7 2.8 28.8 4.6 63.1
35 Southeast Sebastopol 6.10 79.2 7.3 36.0 15.0 78.9 41,014 5.50 5.97 6.84 35 Southeast Sebastopol 3,840 1,806 2,034 17.2 18.0 0.7 1.7 8.9 3.6 85.1
36 West Windsor 6.07 82.0 15.0 32.0 8.2 80.6 37,695 6.65 5.31 6.26 36 West Windsor 9,648 4,862 4,786 30.2 7.2 0.7 3.3 35.9 4.2 55.9
37 North Oakmont/Hood Mountain 5.98 84.3 0.4 44.2 18.9 95.0 20,406 7.61 8.34 2.00 37 North Oakmont/Hood Mountain 2,901 1,217 1,684 7.1 64.5 0.6 1.4 5.8 1.5 90.7
38 North Sebastopol 5.84 82.1 8.0 39.5 16.4 75.1 31,627 6.69 5.79 5.04 38 North Sebastopol 6,131 2,854 3,277 21.6 14.3 1.0 1.3 12.4 2.9 82.4
39 East Cotati/Rohnert Park L Section 5.79 80.6 11.2 24.7 7.0 83.6 35,880 6.06 5.38 5.91 39 East Cotati/Rohnert Park L Section 5,130 2,508 2,622 22.2 8.1 1.3 3.3 18.5 4.4 72.5
40 Sonoma City North/West Mayacamas Mountain 5.78 81.8 7.3 43.1 15.3 73.0 31,649 6.58 5.73 5.04 40 Sonoma City North/West Mayacamas Mountain 5,103 2,413 2,690 17.1 22.7 0.5 2.3 17.3 2.6 77.2
41 Grant 5.77 80.5 6.6 44.1 15.6 65.3 37,279 6.05 5.08 6.18 41 Grant 4,609 2,352 2,257 19.0 11.3 1.1 3.0 20.1 4.1 71.7
42 West Cloverdale 5.76 80.1 13.2 25.9 9.1 79.4 38,292 5.86 5.04 6.36 42 West Cloverdale 5,994 2,963 3,031 22.4 18.9 0.2 1.4 23.7 3.2 71.5
43 Rohnert Park M Section 5.75 81.9 5.9 28.3 7.0 85.0 30,179 6.61 5.91 4.71 43 Rohnert Park M Section 6,382 3,122 3,260 22.2 4.2 1.6 7.5 16.4 4.6 70.1
44 Alexander Valley 5.73 82.1 17.8 32.1 13.2 79.2 32,303 6.72 5.27 5.19 44 Alexander Valley 3,729 2,003 1,726 18.3 16.0 0.3 0.6 29.6 2.2 67.3
45 Sunrise/Bond Parks 5.72 81.2 12.9 29.8 10.4 78.4 34,621 6.32 5.19 5.67 45 Sunrise/Bond Parks 4,465 2,032 2,433 21.7 21.0 1.0 5.8 24.4 3.1 65.7
46 Piner 5.71 82.7 11.2 19.0 3.9 74.0 36,774 6.97 4.08 6.08 46 Piner 5,095 2,536 2,559 24.1 9.8 1.9 5.3 24.2 4.4 64.2
47 Laguna de Santa Rosa/Hall Road 5.69 82.0 18.4 30.6 9.3 81.5 32,231 6.66 5.23 5.17 47 Laguna de Santa Rosa/Hall Road 6,669 3,273 3,396 22.8 14.1 1.3 5.1 24.5 4.2 64.9
48 Boyes Hot Springs West/El Verano 5.68 83.0 26.0 29.8 11.5 85.3 29,824 7.10 5.31 4.63 48 Boyes Hot Springs West/El Verano 6,158 3,061 3,097 26.2 10.6 0.2 1.6 40.1 2.8 55.2
49 McKinley 5.66 80.6 17.3 30.6 8.9 78.1 36,114 6.08 4.93 5.96 49 McKinley 4,904 2,416 2,488 23.2 9.6 1.5 1.9 31.0 3.6 62.1
50 Shiloh South 5.62 81.9 11.8 34.4 13.3 74.0 31,909 6.62 5.15 5.10 50 Shiloh South 5,242 2,643 2,599 24.7 11.1 1.5 3.6 23.5 4.6 66.7

89A PORTRAIT OF SONOMA COUNTY 2014
REFERENCES
HDINDEX
LIFEEXPECTANCY
AT BIRTH(years)
LESS THAN HIGH
SCHOOL (%)
AT LEASTBACHELOR’S
DEGREE(%)
GRADUATE OR PROFES-
SIONAL DEGREE
(%)
SCHOOLENROLL-
MENT(%)
MEDIANEARNINGS
(2012 dollars)HEALTHINDEX
EDUCATIONINDEX
INCOMEINDEX
TOTAL POPULATION
MALE POPULATION
FEMALE POPULATION
POPULATION UNDER 18
(%)
POPULATION 65 AND OLDER
(%)
AFRICAN AMERICAN
POPULATION (%)
ASIAN AMERICAN
POPULATION(%)
LATINO POPULATION
(%)
TWO OR MORE RACES
OR SOME OTHER RACE
(%)
WHITE POPULATION
(%)
California 5.39 81.2 18.5 30.9 11.3 78.5 30,502 6.35 5.04 4.79 California 37,253,956 18,517,830 18,736,126 25.0 11.4 5.8 12.8 37.6 3.6 40.1
Sonoma County 5.42 81.0 13.1 31.8 11.7 77.9 30,214 6.26 5.28 4.72 Sonoma County 483,878 237,902 245,976 22.0 13.9 1.4 3.7 24.9 3.9 66.1
1 East Bennett Valley 8.47 82.0 0.5 58.6 24.0 90.2 68,967 6.67 8.75 10.00 1 East Bennett Valley 3,572 1,757 1,815 18.1 20.5 0.3 2.9 4.9 2.4 89.5
2 Fountain Grove 8.35 82.0 4.2 56.6 24.6 88.7 67,357 6.68 8.38 10.00 2 Fountain Grove 10,001 4,829 5,172 19.1 22.9 0.8 7.1 6.7 3.2 82.3
3 Skyhawk 7.78 83.1 3.6 57.8 22.5 84.1 50,633 7.12 7.93 8.30 3 Skyhawk 8,365 4,156 4,209 22.6 17.2 0.6 4.9 7.2 3.1 84.2
4 Annadel/South Oakmont 7.71 84.3 3.1 54.3 21.2 86.5 45,441 7.61 7.96 7.55 4 Annadel/South Oakmont 3,324 1,451 1,873 6.0 60.3 0.2 1.8 3.1 1.4 93.6
5 Old Quarry 7.71 82.5 3.7 57.5 26.5 93.1 43,919 6.86 8.94 7.32 5 Old Quarry 4,552 2,251 2,301 22.2 15.4 0.6 2.7 7.5 3.2 86.0
6 Rural Cemetery 7.67 83.6 3.4 48.0 25.7 92.5 43,240 7.35 8.44 7.21 6 Rural Cemetery 4,329 1,928 2,401 17.5 26.2 0.5 2.1 6.3 3.3 87.8
7 Central Bennett Valley 7.63 85.7 6.3 40.8 15.8 89.4 44,564 8.21 7.26 7.42 7 Central Bennett Valley 3,563 1,721 1,842 20.3 19.3 1.8 2.3 10.8 4.3 80.8
8 Sea Ranch/Timber Cove 7.35 84.8 1.1 65.4 40.8 86.7 31,552 7.83 9.21 5.02 8 Sea Ranch/Timber Cove 1,720 848 872 9.2 39.5 0.9 1.0 9.2 2.3 86.5
9 Cherry Valley 7.18 81.1 5.6 40.1 15.7 90.6 47,536 6.31 7.37 7.86 9 Cherry Valley 3,350 1,634 1,716 19.4 13.9 0.5 1.5 9.9 4.3 83.9
10 Sonoma Mountain 7.16 81.2 4.3 39.8 7.7 87.3 51,590 6.32 6.74 8.43 10 Sonoma Mountain 5,369 2,656 2,713 29.3 8.6 1.2 9.4 14.1 3.7 71.6
11 Windsor East 7.06 83.3 7.2 40.5 13.7 81.9 45,526 7.22 6.40 7.56 11 Windsor East 3,861 1,899 1,962 27.2 12.1 0.4 2.6 16.0 3.7 77.3
12 Meadow 7.00 81.2 4.5 39.1 15.1 85.5 47,368 6.32 6.86 7.84 12 Meadow 4,004 1,963 2,041 27.7 8.1 1.9 5.6 17.2 3.5 71.8
13 Petaluma Airport/Arroyo Park 6.98 82.4 5.0 36.9 8.4 88.3 44,504 6.82 6.71 7.41 13 Petaluma Airport/Arroyo Park 4,325 2,137 2,188 23.8 10.5 0.6 4.9 15.4 4.0 75.1
14 Downtown Sonoma 6.95 80.4 4.3 52.3 19.7 86.1 42,835 5.99 7.71 7.14 14 Downtown Sonoma 3,678 1,659 2,019 17.9 23.6 0.3 2.8 14.4 2.1 80.4
15 Southwest Sebastopol 6.94 81.5 6.5 41.9 15.6 85.5 44,669 6.47 6.92 7.43 15 Southwest Sebastopol 4,011 1,875 2,136 19.5 17.7 0.8 1.7 9.5 3.5 84.5
16 Gold Ridge 6.94 83.4 5.4 51.4 21.5 77.5 40,151 7.23 6.89 6.69 16 Gold Ridge 3,684 1,847 1,837 16.6 17.4 0.7 1.6 10.3 2.9 84.6
17 Arnold Drive/East Sonoma Mountain 6.77 82.6 5.1 50.9 13.8 78.7 40,369 6.94 6.66 6.73 17 Arnold Drive/East Sonoma Mountain 4,170 1,907 2,263 10.8 40.4 0.2 2.0 9.3 2.2 86.3
18 Central East Windsor 6.71 83.3 9.5 21.2 8.4 100.0 38,783 7.22 6.45 6.45 18 Central East Windsor 3,288 1,545 1,743 24.8 15.5 1.0 2.9 26.8 3.8 65.6
19 Larkfield-Wikiup 6.62 81.2 6.4 36.2 9.9 81.9 44,643 6.35 6.07 7.43 19 Larkfield-Wikiup 5,271 2,619 2,652 21.9 16.5 0.6 2.7 20.5 4.3 72.0
20 Sonoma City South/Vineburg 6.57 80.4 5.4 32.0 13.3 90.1 41,168 5.99 6.86 6.87 20 Sonoma City South/Vineburg 4,505 2,040 2,465 18.1 29.6 0.6 2.7 13.9 2.1 80.8
21 Southern Junior College Neighborhood 6.56 81.9 4.0 49.5 18.1 79.7 37,055 6.60 6.93 6.14 21 Southern Junior College Neighborhood 3,527 1,596 1,931 14.8 17.0 1.8 1.9 11.8 4.2 80.3
22 Jenner/Cazadero 6.55 84.8 4.7 35.9 12.1 80.2 35,000 7.83 6.07 5.74 22 Jenner/Cazadero 2,400 1,249 1,151 14.3 18.8 0.3 1.5 12.3 6.6 79.4
23 Occidental/Bodega 6.47 81.7 5.0 51.5 25.5 83.4 32,468 6.54 7.65 5.22 23 Occidental/Bodega 3,747 1,909 1,838 14.1 18.8 0.4 2.2 8.3 3.7 85.4
24 Fulton 6.46 81.2 12.2 30.2 7.1 89.2 41,465 6.34 6.12 6.92 24 Fulton 5,234 2,569 2,665 23.8 10.4 2.5 6.0 19.5 4.1 67.8
25 Spring Hill 6.45 77.1 8.2 45.7 15.3 86.4 46,214 4.62 7.08 7.67 25 Spring Hill 4,994 2,398 2,596 20.8 15.8 0.6 2.5 14.8 2.8 79.3
26 Casa Grande 6.42 82.4 7.6 38.4 12.6 84.7 35,987 6.82 6.50 5.93 26 Casa Grande 4,067 2,031 2,036 26.3 9.0 1.8 6.7 31.3 4.2 56.0
27 Montgomery Village 6.38 82.0 3.8 32.7 10.8 86.4 36,101 6.68 6.50 5.96 27 Montgomery Village 5,219 2,427 2,792 19.5 14.4 1.2 2.6 12.0 5.0 79.2
28 Hessel Community 6.37 81.3 7.7 34.0 12.1 83.1 39,743 6.37 6.13 6.62 28 Hessel Community 4,319 2,142 2,177 16.5 17.8 0.8 1.7 10.9 3.3 83.3
29 Rohnert Park F/H Section 6.22 81.6 6.3 31.1 8.8 87.0 35,610 6.50 6.28 5.86 29 Rohnert Park F/H Section 5,174 2,579 2,595 22.7 9.9 1.3 5.9 15.3 4.6 72.9
30 West Bennett Valley 6.17 81.6 6.6 47.5 18.8 72.4 36,145 6.50 6.06 5.96 30 West Bennett Valley 6,591 3,026 3,565 19.7 16.9 1.4 3.3 13.2 4.4 77.6
31 Carneros Sonoma Area 6.15 81.7 8.3 39.6 12.1 92.3 30,052 6.55 7.22 4.68 31 Carneros Sonoma Area 2,322 1,165 1,157 17.9 19.9 0.1 1.9 16.6 2.7 78.7
32 Northeast Windsor 6.15 83.3 12.2 23.2 5.7 81.9 37,289 7.22 5.04 6.18 32 Northeast Windsor 3,239 1,610 1,629 26.8 11.8 0.7 3.1 26.9 3.4 65.8
33 North Healdsburg 6.11 81.7 12.0 41.9 18.4 81.8 32,928 6.56 6.44 5.32 33 North Healdsburg 5,421 2,649 2,772 22.7 17.1 0.8 2.1 25.8 2.9 68.4
34 Windsor Southeast 6.11 79.6 11.1 16.6 5.6 94.2 40,145 5.66 5.97 6.69 34 Windsor Southeast 4,336 2,106 2,230 26.4 13.7 0.7 2.8 28.8 4.6 63.1
35 Southeast Sebastopol 6.10 79.2 7.3 36.0 15.0 78.9 41,014 5.50 5.97 6.84 35 Southeast Sebastopol 3,840 1,806 2,034 17.2 18.0 0.7 1.7 8.9 3.6 85.1
36 West Windsor 6.07 82.0 15.0 32.0 8.2 80.6 37,695 6.65 5.31 6.26 36 West Windsor 9,648 4,862 4,786 30.2 7.2 0.7 3.3 35.9 4.2 55.9
37 North Oakmont/Hood Mountain 5.98 84.3 0.4 44.2 18.9 95.0 20,406 7.61 8.34 2.00 37 North Oakmont/Hood Mountain 2,901 1,217 1,684 7.1 64.5 0.6 1.4 5.8 1.5 90.7
38 North Sebastopol 5.84 82.1 8.0 39.5 16.4 75.1 31,627 6.69 5.79 5.04 38 North Sebastopol 6,131 2,854 3,277 21.6 14.3 1.0 1.3 12.4 2.9 82.4
39 East Cotati/Rohnert Park L Section 5.79 80.6 11.2 24.7 7.0 83.6 35,880 6.06 5.38 5.91 39 East Cotati/Rohnert Park L Section 5,130 2,508 2,622 22.2 8.1 1.3 3.3 18.5 4.4 72.5
40 Sonoma City North/West Mayacamas Mountain 5.78 81.8 7.3 43.1 15.3 73.0 31,649 6.58 5.73 5.04 40 Sonoma City North/West Mayacamas Mountain 5,103 2,413 2,690 17.1 22.7 0.5 2.3 17.3 2.6 77.2
41 Grant 5.77 80.5 6.6 44.1 15.6 65.3 37,279 6.05 5.08 6.18 41 Grant 4,609 2,352 2,257 19.0 11.3 1.1 3.0 20.1 4.1 71.7
42 West Cloverdale 5.76 80.1 13.2 25.9 9.1 79.4 38,292 5.86 5.04 6.36 42 West Cloverdale 5,994 2,963 3,031 22.4 18.9 0.2 1.4 23.7 3.2 71.5
43 Rohnert Park M Section 5.75 81.9 5.9 28.3 7.0 85.0 30,179 6.61 5.91 4.71 43 Rohnert Park M Section 6,382 3,122 3,260 22.2 4.2 1.6 7.5 16.4 4.6 70.1
44 Alexander Valley 5.73 82.1 17.8 32.1 13.2 79.2 32,303 6.72 5.27 5.19 44 Alexander Valley 3,729 2,003 1,726 18.3 16.0 0.3 0.6 29.6 2.2 67.3
45 Sunrise/Bond Parks 5.72 81.2 12.9 29.8 10.4 78.4 34,621 6.32 5.19 5.67 45 Sunrise/Bond Parks 4,465 2,032 2,433 21.7 21.0 1.0 5.8 24.4 3.1 65.7
46 Piner 5.71 82.7 11.2 19.0 3.9 74.0 36,774 6.97 4.08 6.08 46 Piner 5,095 2,536 2,559 24.1 9.8 1.9 5.3 24.2 4.4 64.2
47 Laguna de Santa Rosa/Hall Road 5.69 82.0 18.4 30.6 9.3 81.5 32,231 6.66 5.23 5.17 47 Laguna de Santa Rosa/Hall Road 6,669 3,273 3,396 22.8 14.1 1.3 5.1 24.5 4.2 64.9
48 Boyes Hot Springs West/El Verano 5.68 83.0 26.0 29.8 11.5 85.3 29,824 7.10 5.31 4.63 48 Boyes Hot Springs West/El Verano 6,158 3,061 3,097 26.2 10.6 0.2 1.6 40.1 2.8 55.2
49 McKinley 5.66 80.6 17.3 30.6 8.9 78.1 36,114 6.08 4.93 5.96 49 McKinley 4,904 2,416 2,488 23.2 9.6 1.5 1.9 31.0 3.6 62.1
50 Shiloh South 5.62 81.9 11.8 34.4 13.3 74.0 31,909 6.62 5.15 5.10 50 Shiloh South 5,242 2,643 2,599 24.7 11.1 1.5 3.6 23.5 4.6 66.7

90 THE MEASURE OF AMERICA SERIES
HD Index by Census Tract (continued)
HDINDEX
LIFEEXPECTANCY
AT BIRTH(years)
LESS THAN HIGH
SCHOOL (%)
AT LEASTBACHELOR’S
DEGREE(%)
GRADUATE OR PROFES-
SIONAL DEGREE
(%)
SCHOOLENROLL-
MENT(%)
MEDIANEARNINGS
(2012 dollars)HEALTHINDEX
EDUCATIONINDEX
INCOMEINDEX
TOTAL POPULATION
MALE POPULATION
FEMALE POPULATION
POPULATION UNDER 18
(%)
POPULATION 65 AND OLDER
(%)
AFRICAN AMERICAN
POPULATION (%)
ASIAN AMERICAN
POPULATION(%)
LATINO POPULATION
(%)
TWO OR MORE RACES
OR SOME OTHER RACE
(%)
WHITE POPULATION
(%)
California 5.39 81.2 18.5 30.9 11.3 78.5 30,502 6.35 5.04 4.79 California 37,253,956 18,517,830 18,736,126 25.0 11.4 5.8 12.8 37.6 3.6 40.1
Sonoma County 5.42 81.0 13.1 31.8 11.7 77.9 30,214 6.26 5.28 4.72 Sonoma County 483,878 237,902 245,976 22.0 13.9 1.4 3.7 24.9 3.9 66.1
51 Middle Rincon South 5.61 80.3 7.3 28.7 10.3 85.4 30,568 5.97 6.05 4.80 51 Middle Rincon South 4,178 1,994 2,184 24.1 9.4 1.8 4.4 16.8 4.9 72.1
52 Miwok 5.59 80.9 16.7 26.2 5.1 82.1 34,119 6.22 4.97 5.56 52 Miwok 4,089 2,101 1,988 25.9 11.2 2.3 4.9 32.9 2.7 57.2
53 Spring Lake 5.59 81.4 11.6 33.3 14.1 75.5 31,683 6.41 5.29 5.05 53 Spring Lake 6,978 3,218 3,760 20.4 19.2 1.8 3.4 18.0 5.3 71.5
54 La Tercera 5.58 78.8 16.4 25.9 4.7 86.9 36,216 5.35 5.42 5.98 54 La Tercera 4,307 2,143 2,164 21.1 14.6 1.5 3.8 19.6 3.0 72.1
55 West Sebastopol/Graton 5.58 84.1 14.4 45.1 16.1 61.2 30,518 7.54 4.41 4.79 55 West Sebastopol/Graton 5,327 2,647 2,680 17.6 16.8 0.4 1.5 14.2 2.9 81.0
56 Two Rock 5.55 82.4 9.6 32.3 12.0 72.2 30,949 6.85 4.93 4.89 56 Two Rock 5,151 2,674 2,477 21.9 12.1 1.2 1.2 14.5 3.2 79.8
57 Boyes Hot Springs/Fetters Springs/Agua Caliente East 5.55 81.8 14.2 40.4 17.3 72.6 30,164 6.59 5.35 4.71 57 Boyes Hot Springs/Fetters Springs/Agua Caliente East 4,107 2,019 2,088 22.6 10.4 0.3 1.7 36.4 2.2 59.4
58 Dry Creek 5.55 81.9 11.5 45.0 20.5 67.0 30,375 6.61 5.29 4.76 58 Dry Creek 2,597 1,367 1,230 16.2 21.1 0.4 1.0 18.1 2.2 78.3
59 Rohnert Park SSU/J Section 5.50 80.4 13.5 33.2 9.6 80.5 31,638 5.99 5.48 5.04 59 Rohnert Park SSU/J Section 4,865 2,395 2,470 19.8 10.5 1.1 4.3 15.1 4.4 75.1
60 Old Healdsburg 5.43 82.4 8.3 37.0 15.6 66.2 29,912 6.85 4.78 4.65 60 Old Healdsburg 3,760 1,819 1,941 19.5 16.4 0.5 0.7 19.5 1.9 77.4
61 Schaefer 5.39 78.2 13.3 22.8 5.8 75.1 40,322 5.10 4.34 6.72 61 Schaefer 5,547 2,797 2,750 22.9 7.8 1.6 5.3 21.0 5.8 66.3
62 Guerneville/Rio Nido 5.29 80.1 11.1 32.4 15.6 65.1 34,547 5.86 4.35 5.65 62 Guerneville/Rio Nido 3,728 2,022 1,706 14.7 13.7 0.8 1.0 12.8 5.2 80.3
63 West Cotati/Penngrove 5.25 80.6 16.3 26.1 7.6 77.3 31,499 6.10 4.65 5.01 63 West Cotati/Penngrove 6,855 3,351 3,504 19.1 12.1 1.2 2.7 19.6 4.6 71.9
64 Northern Junior College Neighborhood 5.25 80.0 5.3 33.0 9.2 70.3 31,860 5.82 4.84 5.09 64 Northern Junior College Neighborhood 3,846 1,844 2,002 18.0 7.3 3.1 3.3 18.3 5.2 70.1
65 Rohnert Park D/E/S Section 5.21 81.4 12.6 21.2 7.9 83.4 27,294 6.42 5.18 4.02 65 Rohnert Park D/E/S Section 4,796 2,221 2,575 16.3 19.3 1.5 5.0 14.5 4.2 74.8
66 Pioneer Park 5.20 81.2 15.0 19.1 5.4 71.1 34,083 6.34 3.70 5.56 66 Pioneer Park 4,037 1,926 2,111 23.7 11.5 3.0 5.9 27.0 4.3 59.7
67 Russian River Valley 5.19 79.9 8.2 37.1 16.5 68.1 30,431 5.77 5.02 4.77 67 Russian River Valley 4,092 2,015 2,077 15.9 16.5 0.7 1.1 10.9 3.5 83.8
68 Brush Creek 5.15 79.5 15.1 32.2 10.8 74.7 31,334 5.63 4.86 4.97 68 Brush Creek 6,763 3,188 3,575 22.6 18.6 2.1 4.1 17.9 5.8 70.1
69 Cinnabar/West Rural Petaluma 5.10 78.9 9.5 32.3 9.8 67.5 34,010 5.36 4.39 5.54 69 Cinnabar/West Rural Petaluma 3,483 1,731 1,752 19.4 16.1 0.3 1.9 14.8 3.5 79.5
70 Central Rohnert Park 4.96 78.0 10.8 28.4 7.0 71.8 33,509 4.99 4.44 5.44 70 Central Rohnert Park 3,636 1,749 1,887 19.0 12.8 2.1 4.2 19.3 5.3 69.1
71 Kenwood/Glen Ellen 4.95 75.2 11.9 36.8 12.8 62.5 41,137 3.85 4.14 6.86 71 Kenwood/Glen Ellen 5,283 2,692 2,591 13.6 17.2 1.1 2.5 11.7 2.8 81.9
72 Wright 4.91 79.4 21.5 20.8 6.4 76.1 32,046 5.59 4.01 5.13 72 Wright 11,010 5,638 5,372 26.5 6.4 3.6 8.2 37.9 4.9 45.3
73 Central Windsor 4.84 79.6 17.2 22.4 8.5 73.2 30,436 5.66 4.09 4.77 73 Central Windsor 4,251 2,098 2,153 25.8 13.3 0.8 1.3 43.4 2.9 51.7
74 Middle Rincon North 4.83 77.1 8.1 28.0 9.7 72.7 31,947 4.63 4.75 5.11 74 Middle Rincon North 3,603 1,753 1,850 22.0 18.0 1.8 3.4 15.7 5.0 74.2
75 Olivet Road 4.82 80.5 12.3 22.0 7.4 78.2 26,118 6.03 4.71 3.71 75 Olivet Road 7,286 3,461 3,825 22.8 14.4 1.6 4.6 29.0 4.1 60.7
76 Bellevue 4.66 81.0 25.4 13.0 4.6 78.5 27,511 6.27 3.64 4.07 76 Bellevue 7,522 3,800 3,722 29.8 5.6 2.8 8.6 49.2 4.4 35.0
77 Monte Rio 4.64 79.9 5.8 28.0 14.0 67.9 25,553 5.77 4.58 3.56 77 Monte Rio 3,490 1,867 1,623 11.4 15.6 0.4 1.3 7.7 4.8 85.8
78 Lucchesi/McDowell 4.60 78.5 17.7 24.2 7.9 79.8 26,597 5.20 4.75 3.84 78 Lucchesi/McDowell 7,249 3,542 3,707 21.1 17.5 1.2 3.3 32.9 3.0 59.6
79 Forestville 4.57 79.7 7.2 35.0 15.6 53.8 26,561 5.72 4.15 3.83 79 Forestville 3,536 1,800 1,736 16.7 14.1 0.8 1.5 11.3 3.6 82.8
80 Downtown Cotati 4.31 77.8 14.3 24.7 9.2 70.1 27,108 4.91 4.05 3.97 80 Downtown Cotati 3,413 1,641 1,772 20.4 10.1 1.6 4.0 18.6 5.1 70.8
81 Kawana Springs 4.20 80.9 26.8 22.1 5.4 78.6 21,510 6.21 4.03 2.37 81 Kawana Springs 7,306 3,690 3,616 29.8 4.9 2.8 6.6 51.0 4.2 35.4
82 Central Healdsburg 4.14 79.3 22.7 23.0 9.3 67.1 25,463 5.56 3.32 3.54 82 Central Healdsburg 4,147 2,128 2,019 24.9 11.1 0.3 0.7 49.8 2.3 46.9
83 Railroad Square 4.12 79.7 21.7 14.0 5.9 78.0 22,908 5.71 3.86 2.80 83 Railroad Square 5,502 2,729 2,773 26.0 7.7 2.3 3.8 42.1 4.2 47.5
84 Downtown Rohnert Park 4.09 79.5 10.0 18.6 3.9 60.1 26,630 5.63 2.79 3.85 84 Downtown Rohnert Park 5,405 2,607 2,798 22.3 10.0 2.2 3.7 36.0 4.7 53.4
85 Coddingtown 4.08 78.9 21.4 16.5 4.7 75.6 24,114 5.38 3.69 3.16 85 Coddingtown 6,594 3,226 3,368 26.5 8.6 2.7 4.9 42.7 5.7 43.9
86 Burbank Gardens 4.03 76.0 16.1 29.8 14.8 79.0 22,421 4.15 5.30 2.65 86 Burbank Gardens 3,158 1,503 1,655 17.1 16.3 2.5 2.1 25.0 5.1 65.4
87 Rohnert Park B/C/R Section 3.97 80.4 10.0 28.7 8.3 85.9 14,946 6.01 5.89 0.00 87 Rohnert Park B/C/R Section 6,143 2,670 3,473 13.2 4.2 2.1 6.4 16.6 5.5 69.4
88 Comstock 3.90 78.0 33.0 8.4 3.2 81.2 25,000 5.02 3.29 3.41 88 Comstock 5,114 2,574 2,540 30.2 7.2 4.2 7.6 52.7 4.2 31.2
89 Taylor Mountain 3.90 77.1 23.2 13.1 2.9 71.3 27,688 4.62 2.97 4.12 89 Taylor Mountain 9,177 4,543 4,634 28.0 7.9 2.5 4.7 49.4 4.4 38.9
90 Downtown Santa Rosa 3.89 75.5 8.4 30.1 7.4 75.2 22,628 3.98 4.97 2.72 90 Downtown Santa Rosa 2,079 1,114 965 18.3 4.9 2.5 3.3 26.0 6.3 62.0
91 East Cloverdale 3.79 80.1 30.3 12.4 2.9 63.5 25,721 5.86 1.89 3.61 91 East Cloverdale 3,925 2,017 1,908 23.8 12.1 0.7 0.7 43.4 3.3 52.0
92 Rohnert Park A Section 3.75 77.9 22.0 14.2 3.7 76.4 22,522 4.97 3.59 2.69 92 Rohnert Park A Section 4,587 2,310 2,277 22.6 6.9 2.6 3.2 32.0 4.5 57.7
93 Bicentennial Park 3.73 77.0 26.6 21.5 5.0 71.2 24,760 4.58 3.28 3.34 93 Bicentennial Park 6,807 3,372 3,435 24.6 9.9 3.5 5.0 43.3 5.9 42.4
94 West End 3.51 78.7 35.7 12.9 3.6 73.2 22,294 5.30 2.63 2.61 94 West End 6,827 3,550 3,277 26.8 7.4 2.1 2.4 53.2 3.7 38.6
95 West Junior College 3.44 79.3 17.1 22.7 7.0 65.3 18,919 5.55 3.29 1.48 95 West Junior College 3,004 1,765 1,239 13.6 10.8 3.5 4.7 22.7 5.3 63.8
96 Fetters Springs/Agua Caliente West 3.41 81.8 45.4 17.1 5.8 67.8 19,444 6.59 1.96 1.67 96 Fetters Springs/Agua Caliente West 5,282 2,727 2,555 30.4 6.9 0.4 1.0 60.3 2.0 36.3
97 Sheppard 2.98 76.6 41.8 8.2 3.6 71.7 22,068 4.41 2.00 2.54 97 Sheppard 5,742 3,019 2,723 30.5 6.5 1.8 4.5 66.4 4.1 23.2
98 Roseland 2.95 77.1 40.8 14.4 4.1 65.4 21,883 4.61 1.75 2.49 98 Roseland 4,046 2,192 1,854 31.4 4.9 1.3 2.8 65.2 3.2 27.5
99 Roseland Creek 2.79 77.1 46.1 8.6 4.3 66.2 21,699 4.61 1.33 2.43 99 Roseland Creek 4,716 2,414 2,302 30.8 5.6 1.9 4.9 59.2 4.2 29.9

91A PORTRAIT OF SONOMA COUNTY 2014
REFERENCES
HDINDEX
LIFEEXPECTANCY
AT BIRTH(years)
LESS THAN HIGH
SCHOOL (%)
AT LEASTBACHELOR’S
DEGREE(%)
GRADUATE OR PROFES-
SIONAL DEGREE
(%)
SCHOOLENROLL-
MENT(%)
MEDIANEARNINGS
(2012 dollars)HEALTHINDEX
EDUCATIONINDEX
INCOMEINDEX
TOTAL POPULATION
MALE POPULATION
FEMALE POPULATION
POPULATION UNDER 18
(%)
POPULATION 65 AND OLDER
(%)
AFRICAN AMERICAN
POPULATION (%)
ASIAN AMERICAN
POPULATION(%)
LATINO POPULATION
(%)
TWO OR MORE RACES
OR SOME OTHER RACE
(%)
WHITE POPULATION
(%)
California 5.39 81.2 18.5 30.9 11.3 78.5 30,502 6.35 5.04 4.79 California 37,253,956 18,517,830 18,736,126 25.0 11.4 5.8 12.8 37.6 3.6 40.1
Sonoma County 5.42 81.0 13.1 31.8 11.7 77.9 30,214 6.26 5.28 4.72 Sonoma County 483,878 237,902 245,976 22.0 13.9 1.4 3.7 24.9 3.9 66.1
51 Middle Rincon South 5.61 80.3 7.3 28.7 10.3 85.4 30,568 5.97 6.05 4.80 51 Middle Rincon South 4,178 1,994 2,184 24.1 9.4 1.8 4.4 16.8 4.9 72.1
52 Miwok 5.59 80.9 16.7 26.2 5.1 82.1 34,119 6.22 4.97 5.56 52 Miwok 4,089 2,101 1,988 25.9 11.2 2.3 4.9 32.9 2.7 57.2
53 Spring Lake 5.59 81.4 11.6 33.3 14.1 75.5 31,683 6.41 5.29 5.05 53 Spring Lake 6,978 3,218 3,760 20.4 19.2 1.8 3.4 18.0 5.3 71.5
54 La Tercera 5.58 78.8 16.4 25.9 4.7 86.9 36,216 5.35 5.42 5.98 54 La Tercera 4,307 2,143 2,164 21.1 14.6 1.5 3.8 19.6 3.0 72.1
55 West Sebastopol/Graton 5.58 84.1 14.4 45.1 16.1 61.2 30,518 7.54 4.41 4.79 55 West Sebastopol/Graton 5,327 2,647 2,680 17.6 16.8 0.4 1.5 14.2 2.9 81.0
56 Two Rock 5.55 82.4 9.6 32.3 12.0 72.2 30,949 6.85 4.93 4.89 56 Two Rock 5,151 2,674 2,477 21.9 12.1 1.2 1.2 14.5 3.2 79.8
57 Boyes Hot Springs/Fetters Springs/Agua Caliente East 5.55 81.8 14.2 40.4 17.3 72.6 30,164 6.59 5.35 4.71 57 Boyes Hot Springs/Fetters Springs/Agua Caliente East 4,107 2,019 2,088 22.6 10.4 0.3 1.7 36.4 2.2 59.4
58 Dry Creek 5.55 81.9 11.5 45.0 20.5 67.0 30,375 6.61 5.29 4.76 58 Dry Creek 2,597 1,367 1,230 16.2 21.1 0.4 1.0 18.1 2.2 78.3
59 Rohnert Park SSU/J Section 5.50 80.4 13.5 33.2 9.6 80.5 31,638 5.99 5.48 5.04 59 Rohnert Park SSU/J Section 4,865 2,395 2,470 19.8 10.5 1.1 4.3 15.1 4.4 75.1
60 Old Healdsburg 5.43 82.4 8.3 37.0 15.6 66.2 29,912 6.85 4.78 4.65 60 Old Healdsburg 3,760 1,819 1,941 19.5 16.4 0.5 0.7 19.5 1.9 77.4
61 Schaefer 5.39 78.2 13.3 22.8 5.8 75.1 40,322 5.10 4.34 6.72 61 Schaefer 5,547 2,797 2,750 22.9 7.8 1.6 5.3 21.0 5.8 66.3
62 Guerneville/Rio Nido 5.29 80.1 11.1 32.4 15.6 65.1 34,547 5.86 4.35 5.65 62 Guerneville/Rio Nido 3,728 2,022 1,706 14.7 13.7 0.8 1.0 12.8 5.2 80.3
63 West Cotati/Penngrove 5.25 80.6 16.3 26.1 7.6 77.3 31,499 6.10 4.65 5.01 63 West Cotati/Penngrove 6,855 3,351 3,504 19.1 12.1 1.2 2.7 19.6 4.6 71.9
64 Northern Junior College Neighborhood 5.25 80.0 5.3 33.0 9.2 70.3 31,860 5.82 4.84 5.09 64 Northern Junior College Neighborhood 3,846 1,844 2,002 18.0 7.3 3.1 3.3 18.3 5.2 70.1
65 Rohnert Park D/E/S Section 5.21 81.4 12.6 21.2 7.9 83.4 27,294 6.42 5.18 4.02 65 Rohnert Park D/E/S Section 4,796 2,221 2,575 16.3 19.3 1.5 5.0 14.5 4.2 74.8
66 Pioneer Park 5.20 81.2 15.0 19.1 5.4 71.1 34,083 6.34 3.70 5.56 66 Pioneer Park 4,037 1,926 2,111 23.7 11.5 3.0 5.9 27.0 4.3 59.7
67 Russian River Valley 5.19 79.9 8.2 37.1 16.5 68.1 30,431 5.77 5.02 4.77 67 Russian River Valley 4,092 2,015 2,077 15.9 16.5 0.7 1.1 10.9 3.5 83.8
68 Brush Creek 5.15 79.5 15.1 32.2 10.8 74.7 31,334 5.63 4.86 4.97 68 Brush Creek 6,763 3,188 3,575 22.6 18.6 2.1 4.1 17.9 5.8 70.1
69 Cinnabar/West Rural Petaluma 5.10 78.9 9.5 32.3 9.8 67.5 34,010 5.36 4.39 5.54 69 Cinnabar/West Rural Petaluma 3,483 1,731 1,752 19.4 16.1 0.3 1.9 14.8 3.5 79.5
70 Central Rohnert Park 4.96 78.0 10.8 28.4 7.0 71.8 33,509 4.99 4.44 5.44 70 Central Rohnert Park 3,636 1,749 1,887 19.0 12.8 2.1 4.2 19.3 5.3 69.1
71 Kenwood/Glen Ellen 4.95 75.2 11.9 36.8 12.8 62.5 41,137 3.85 4.14 6.86 71 Kenwood/Glen Ellen 5,283 2,692 2,591 13.6 17.2 1.1 2.5 11.7 2.8 81.9
72 Wright 4.91 79.4 21.5 20.8 6.4 76.1 32,046 5.59 4.01 5.13 72 Wright 11,010 5,638 5,372 26.5 6.4 3.6 8.2 37.9 4.9 45.3
73 Central Windsor 4.84 79.6 17.2 22.4 8.5 73.2 30,436 5.66 4.09 4.77 73 Central Windsor 4,251 2,098 2,153 25.8 13.3 0.8 1.3 43.4 2.9 51.7
74 Middle Rincon North 4.83 77.1 8.1 28.0 9.7 72.7 31,947 4.63 4.75 5.11 74 Middle Rincon North 3,603 1,753 1,850 22.0 18.0 1.8 3.4 15.7 5.0 74.2
75 Olivet Road 4.82 80.5 12.3 22.0 7.4 78.2 26,118 6.03 4.71 3.71 75 Olivet Road 7,286 3,461 3,825 22.8 14.4 1.6 4.6 29.0 4.1 60.7
76 Bellevue 4.66 81.0 25.4 13.0 4.6 78.5 27,511 6.27 3.64 4.07 76 Bellevue 7,522 3,800 3,722 29.8 5.6 2.8 8.6 49.2 4.4 35.0
77 Monte Rio 4.64 79.9 5.8 28.0 14.0 67.9 25,553 5.77 4.58 3.56 77 Monte Rio 3,490 1,867 1,623 11.4 15.6 0.4 1.3 7.7 4.8 85.8
78 Lucchesi/McDowell 4.60 78.5 17.7 24.2 7.9 79.8 26,597 5.20 4.75 3.84 78 Lucchesi/McDowell 7,249 3,542 3,707 21.1 17.5 1.2 3.3 32.9 3.0 59.6
79 Forestville 4.57 79.7 7.2 35.0 15.6 53.8 26,561 5.72 4.15 3.83 79 Forestville 3,536 1,800 1,736 16.7 14.1 0.8 1.5 11.3 3.6 82.8
80 Downtown Cotati 4.31 77.8 14.3 24.7 9.2 70.1 27,108 4.91 4.05 3.97 80 Downtown Cotati 3,413 1,641 1,772 20.4 10.1 1.6 4.0 18.6 5.1 70.8
81 Kawana Springs 4.20 80.9 26.8 22.1 5.4 78.6 21,510 6.21 4.03 2.37 81 Kawana Springs 7,306 3,690 3,616 29.8 4.9 2.8 6.6 51.0 4.2 35.4
82 Central Healdsburg 4.14 79.3 22.7 23.0 9.3 67.1 25,463 5.56 3.32 3.54 82 Central Healdsburg 4,147 2,128 2,019 24.9 11.1 0.3 0.7 49.8 2.3 46.9
83 Railroad Square 4.12 79.7 21.7 14.0 5.9 78.0 22,908 5.71 3.86 2.80 83 Railroad Square 5,502 2,729 2,773 26.0 7.7 2.3 3.8 42.1 4.2 47.5
84 Downtown Rohnert Park 4.09 79.5 10.0 18.6 3.9 60.1 26,630 5.63 2.79 3.85 84 Downtown Rohnert Park 5,405 2,607 2,798 22.3 10.0 2.2 3.7 36.0 4.7 53.4
85 Coddingtown 4.08 78.9 21.4 16.5 4.7 75.6 24,114 5.38 3.69 3.16 85 Coddingtown 6,594 3,226 3,368 26.5 8.6 2.7 4.9 42.7 5.7 43.9
86 Burbank Gardens 4.03 76.0 16.1 29.8 14.8 79.0 22,421 4.15 5.30 2.65 86 Burbank Gardens 3,158 1,503 1,655 17.1 16.3 2.5 2.1 25.0 5.1 65.4
87 Rohnert Park B/C/R Section 3.97 80.4 10.0 28.7 8.3 85.9 14,946 6.01 5.89 0.00 87 Rohnert Park B/C/R Section 6,143 2,670 3,473 13.2 4.2 2.1 6.4 16.6 5.5 69.4
88 Comstock 3.90 78.0 33.0 8.4 3.2 81.2 25,000 5.02 3.29 3.41 88 Comstock 5,114 2,574 2,540 30.2 7.2 4.2 7.6 52.7 4.2 31.2
89 Taylor Mountain 3.90 77.1 23.2 13.1 2.9 71.3 27,688 4.62 2.97 4.12 89 Taylor Mountain 9,177 4,543 4,634 28.0 7.9 2.5 4.7 49.4 4.4 38.9
90 Downtown Santa Rosa 3.89 75.5 8.4 30.1 7.4 75.2 22,628 3.98 4.97 2.72 90 Downtown Santa Rosa 2,079 1,114 965 18.3 4.9 2.5 3.3 26.0 6.3 62.0
91 East Cloverdale 3.79 80.1 30.3 12.4 2.9 63.5 25,721 5.86 1.89 3.61 91 East Cloverdale 3,925 2,017 1,908 23.8 12.1 0.7 0.7 43.4 3.3 52.0
92 Rohnert Park A Section 3.75 77.9 22.0 14.2 3.7 76.4 22,522 4.97 3.59 2.69 92 Rohnert Park A Section 4,587 2,310 2,277 22.6 6.9 2.6 3.2 32.0 4.5 57.7
93 Bicentennial Park 3.73 77.0 26.6 21.5 5.0 71.2 24,760 4.58 3.28 3.34 93 Bicentennial Park 6,807 3,372 3,435 24.6 9.9 3.5 5.0 43.3 5.9 42.4
94 West End 3.51 78.7 35.7 12.9 3.6 73.2 22,294 5.30 2.63 2.61 94 West End 6,827 3,550 3,277 26.8 7.4 2.1 2.4 53.2 3.7 38.6
95 West Junior College 3.44 79.3 17.1 22.7 7.0 65.3 18,919 5.55 3.29 1.48 95 West Junior College 3,004 1,765 1,239 13.6 10.8 3.5 4.7 22.7 5.3 63.8
96 Fetters Springs/Agua Caliente West 3.41 81.8 45.4 17.1 5.8 67.8 19,444 6.59 1.96 1.67 96 Fetters Springs/Agua Caliente West 5,282 2,727 2,555 30.4 6.9 0.4 1.0 60.3 2.0 36.3
97 Sheppard 2.98 76.6 41.8 8.2 3.6 71.7 22,068 4.41 2.00 2.54 97 Sheppard 5,742 3,019 2,723 30.5 6.5 1.8 4.5 66.4 4.1 23.2
98 Roseland 2.95 77.1 40.8 14.4 4.1 65.4 21,883 4.61 1.75 2.49 98 Roseland 4,046 2,192 1,854 31.4 4.9 1.3 2.8 65.2 3.2 27.5
99 Roseland Creek 2.79 77.1 46.1 8.6 4.3 66.2 21,699 4.61 1.33 2.43 99 Roseland Creek 4,716 2,414 2,302 30.8 5.6 1.9 4.9 59.2 4.2 29.9

92 THE MEASURE OF AMERICA SERIES
Occupations by Census Tract
HD INDEX
TRACT ALL OR PARTIALLY
WITHIN CITY
MANAGEMENT AND RELATED
OCCUPATIONS (%)
SERVICE OCCUPATIONS
(%)
SALES AND OFFICE
OCCUPATIONS (%)
NATURAL RESOURCES,
CONSTRUCTION, AND MAINTENANCE
OCCUPATIONS (%)
PRODUCTION, TRANSPORTATION,
AND MATERIAL MOVING OCCUPATIONS (%)
California 5.39 36.8 19.0 24.1 9.1 11.1
Sonoma County 5.42 33.4 21.3 25.4 10.1 9.8
1 East Bennett Valley 8.47 Santa Rosa 61.1 7.0 25.6 4.8 1.5
2 Fountain Grove 8.35 Santa Rosa 56.3 11.4 22.5 3.0 6.8
3 Skyhawk 7.78 Santa Rosa 57.7 9.7 21.5 2.3 8.9
4 Annadel/South Oakmont 7.71 Santa Rosa 50.3 14.4 23.3 4.7 7.3
5 Old Quarry 7.71 Petaluma 56.4 13.0 20.9 3.2 6.6
6 Rural Cemetery 7.67 Santa Rosa 51.6 11.5 24.5 5.7 6.7
7 Central Bennett Valley 7.63 Santa Rosa 59.6 10.7 17.5 6.0 6.1
8 Sea Ranch/Timber Cove 7.35 58.2 20.5 16.1 4.2 1.1
9 Cherry Valley 7.18 Petaluma 52.3 8.0 26.0 8.9 4.8
10 Sonoma Mountain 7.16 Petaluma 42.3 16.6 25.4 8.0 7.7
11 Windsor East 7.06 34.3 22.3 21.0 13.2 9.2
12 Meadow 7.00 Petaluma 37.8 22.7 24.3 4.3 11.0
13 Petaluma Airport/Arroyo Park 6.98 Petaluma 40.9 12.6 29.6 10.8 6.1
14 Downtown Sonoma 6.95 Sonoma 52.5 16.1 23.0 4.6 3.8
15 Southwest Sebastopol 6.94 Sebastopol 52.3 11.5 19.7 9.2 7.2
16 Gold Ridge 6.94 54.6 7.8 25.2 8.4 4.0
17 Arnold Drive/East Sonoma Mountain 6.77 40.9 13.0 38.7 3.9 3.5
18 Central East Windsor 6.71 40.0 21.8 24.3 8.9 4.9
19 Larkfield-Wikiup 6.62 40.3 13.4 33.0 5.8 7.5
20 Sonoma City South/Vineburg 6.57 Sonoma 39.0 15.0 32.7 10.9 2.4
21 Southern Junior College Neighborhood 6.56 Santa Rosa 54.5 6.4 32.6 4.7 1.8
22 Jenner/Cazadero 6.55 40.3 12.2 23.6 16.0 7.9
23 Occidental/Bodega 6.47 50.1 20.2 16.2 7.4 6.1
24 Fulton 6.46 Santa Rosa 36.4 9.8 29.7 8.4 15.7
25 Spring Hill 6.45 Petaluma 46.3 10.4 27.0 12.1 4.2
26 Casa Grande 6.42 Petaluma 27.4 20.9 33.5 9.8 8.4
27 Montgomery Village 6.38 Santa Rosa 38.8 12.2 35.7 6.1 7.2
28 Hessel Community 6.37 41.5 18.4 19.6 12.0 8.4
29 Rohnert Park F/H Section 6.22 Rohnert Park 30.8 20.4 30.9 7.2 10.6
30 West Bennett Valley 6.17 Santa Rosa 43.4 21.1 26.8 5.2 3.6
31 Carneros Sonoma Area 6.15 46.8 13.5 27.6 6.9 5.1
32 Northeast Windsor 6.15 27.1 24.9 29.6 11.6 6.7
33 North Healdsburg 6.11 Healdsburg 46.4 17.9 18.2 14.1 3.4
34 Windsor Southeast 6.11 30.8 17.7 26.1 15.1 10.4
35 Southeast Sebastopol 6.10 Sebastopol 41.4 18.4 22.4 11.4 6.4
36 West Windsor 6.07 39.8 15.1 24.9 9.5 10.7
37 North Oakmont/Hood Mountain 5.98 Santa Rosa 38.4 24.3 33.4 0.2 3.7
38 North Sebastopol 5.84 Sebastopol 43.3 18.5 23.4 6.0 8.8
39 East Cotati/Rohnert Park L Section 5.79 Cotati 37.5 15.4 29.7 10.0 7.4
40 Sonoma City North/West Mayacamas Mountain 5.78 Sonoma 35.9 27.9 24.8 6.4 5.0
41 Grant 5.77 Petaluma 40.8 17.4 27.8 8.1 6.0
42 West Cloverdale 5.76 Cloverdale 33.5 19.0 20.6 16.0 11.0
43 Rohnert Park M Section 5.75 Rohnert Park 34.7 21.4 27.8 5.6 10.3
44 Alexander Valley 5.73 33.5 14.6 21.0 21.7 9.3
45 Sunrise/Bond Parks 5.72 Petaluma 33.1 21.6 30.4 9.3 5.6
46 Piner 5.71 Santa Rosa 32.2 19.1 27.5 10.9 10.4
47 Laguna de Santa Rosa/Hall Road 5.69 Santa Rosa 31.4 23.5 28.8 8.0 8.2
48 Boyes Hot Springs West/El Verano 5.68 31.5 35.1 16.7 8.4 8.3
49 McKinley 5.66 Petaluma 31.2 23.9 22.3 15.4 7.2
50 Shiloh South 5.62 43.3 18.5 21.2 9.9 7.1

93A PORTRAIT OF SONOMA COUNTY 2014
REFERENCES
HD INDEX
TRACT ALL OR PARTIALLY
WITHIN CITY
MANAGEMENT AND RELATED
OCCUPATIONS (%)
SERVICE OCCUPATIONS
(%)
SALES AND OFFICE
OCCUPATIONS (%)
NATURAL RESOURCES,
CONSTRUCTION, AND MAINTENANCE
OCCUPATIONS (%)
PRODUCTION, TRANSPORTATION,
AND MATERIAL MOVING OCCUPATIONS (%)
California 5.39 36.8 19.0 24.1 9.1 11.1
Sonoma County 5.42 33.4 21.3 25.4 10.1 9.8
51 Middle Rincon South 5.61 Santa Rosa 34.1 10.7 32.6 8.3 14.3
52 Miwok 5.59 Petaluma 27.2 23.7 28.3 10.9 9.8
53 Spring Lake 5.59 Santa Rosa 31.7 20.3 24.7 5.8 17.5
54 La Tercera 5.58 Petaluma 30.7 22.4 22.5 17.8 6.7
55 West Sebastopol/Graton 5.58 40.2 11.8 25.2 9.8 12.9
56 Two Rock 5.55 36.8 15.2 25.5 16.0 6.6
57 Boyes Hot Springs/Fetters Springs/Agua Caliente East 5.55 35.9 22.3 21.2 14.7 5.9
58 Dry Creek 5.55 Healdsburg 45.7 12.3 15.5 15.7 10.9
59 Rohnert Park SSU/J Section 5.50 Rohnert Park 32.9 16.6 29.8 14.8 6.0
60 Old Healdsburg 5.43 Healdsburg 36.8 23.1 23.9 11.0 5.2
61 Schaefer 5.39 Santa Rosa 30.3 20.0 25.6 8.8 15.3
62 Guerneville/Rio Nido 5.29 39.5 19.9 22.4 11.8 6.4
63 West Cotati/Penngrove 5.25 Rohnert Park 37.3 17.3 25.3 11.8 8.3
64 Northern Junior College Neighborhood 5.25 Santa Rosa 29.3 27.5 23.6 9.4 10.2
65 Rohnert Park D/E/S Section 5.21 Rohnert Park 30.4 25.2 24.6 12.6 7.1
66 Pioneer Park 5.20 Santa Rosa 32.6 12.1 30.5 12.7 12.0
67 Russian River Valley 5.19 37.3 16.9 28.1 11.2 6.5
68 Brush Creek 5.15 Santa Rosa 33.9 18.1 29.2 5.8 13.0
69 Cinnabar/West Rural Petaluma 5.10 Petaluma 40.4 14.6 23.2 11.7 10.0
70 Central Rohnert Park 4.96 Rohnert Park 27.9 27.8 32.1 5.7 6.5
71 Kenwood/Glen Ellen 4.95 38.8 15.0 24.1 13.2 9.0
72 Wright 4.91 Santa Rosa 29.1 17.1 26.0 14.3 13.4
73 Central Windsor 4.84 34.4 23.1 27.1 8.7 6.6
74 Middle Rincon North 4.83 Santa Rosa 30.5 26.3 26.8 6.5 10.0
75 Olivet Road 4.82 Santa Rosa 35.0 16.8 27.6 7.7 12.9
76 Bellevue 4.66 Santa Rosa 20.0 23.5 26.2 17.3 13.0
77 Monte Rio 4.64 41.2 20.3 17.6 12.7 8.2
78 Lucchesi/McDowell 4.60 Petaluma 26.2 26.3 24.0 10.6 12.8
79 Forestville 4.57 33.8 24.3 25.4 6.1 10.3
80 Downtown Cotati 4.31 Cotati 35.1 15.6 23.8 14.6 10.8
81 Kawana Springs 4.20 Santa Rosa 22.7 32.7 23.4 5.5 15.7
82 Central Healdsburg 4.14 Healdsburg 21.7 21.7 23.3 14.7 18.7
83 Railroad Square 4.12 Santa Rosa 19.4 31.5 21.1 16.1 11.9
84 Downtown Rohnert Park 4.09 Rohnert Park 24.5 28.6 28.4 14.8 3.8
85 Coddingtown 4.08 Santa Rosa 19.5 29.2 26.8 14.8 9.8
86 Burbank Gardens 4.03 Santa Rosa 40.2 19.9 20.3 12.3 7.3
87 Rohnert Park B/C/R Section 3.97 Rohnert Park 33.2 22.4 26.8 9.2 8.4
88 Comstock 3.90 Santa Rosa 15.0 30.1 26.6 13.6 14.7
89 Taylor Mountain 3.90 Santa Rosa 21.2 23.0 26.2 20.4 9.4
90 Downtown Santa Rosa 3.89 Santa Rosa 21.3 28.6 26.8 12.6 10.7
91 East Cloverdale 3.79 Cloverdale 19.8 33.4 15.1 15.8 15.9
92 Rohnert Park A Section 3.75 Rohnert Park 23.4 28.9 27.9 6.2 13.6
93 Bicentennial Park 3.73 Santa Rosa 23.4 36.0 14.2 10.6 15.9
94 West End 3.51 Santa Rosa 18.5 22.4 28.7 12.4 18.0
95 West Junior College 3.44 Santa Rosa 29.8 22.4 22.3 9.2 16.3
96 Fetters Springs/Agua Caliente West 3.41 15.8 37.8 21.6 10.0 14.9
97 Sheppard 2.98 Santa Rosa 16.9 23.3 26.9 19.2 13.7
98 Roseland 2.95 Santa Rosa 17.2 13.5 26.2 27.6 15.6
99 Roseland Creek 2.79 Santa Rosa 11.3 24.2 26.0 14.3 24.2

94 THE MEASURE OF AMERICA SERIES
Housing and Transportation by Census Tract
HOUSING UNITS OCCUPIED BY OWNER
(%)
HOUSING UNITS OCCUPIED
BY RENTERS (%)
AVERAGE HOUSEHOLD SIZE
(Renter-Occupied Housing)
AVERAGE HOUSEHOLD SIZE
(Owner-Occupied Housing)
COMMUTE 60 MINUTES OR MORE
(% of workers 16 and older)
California 54.0 46.0 3.0 2.9 10.5
Sonoma County 59.9 40.1 2.6 2.7 11.2
1 East Bennett Valley 92.0 8.0 2.0 2.5 9.4
2 Fountain Grove 76.9 23.1 1.9 2.5 7.0
3 Skyhawk 81.8 18.2 2.4 2.5 10.3
4 Annadel/South Oakmont 85.1 14.9 1.9 1.8 12.2
5 Old Quarry 75.9 24.1 2.8 2.7 17.1
6 Rural Cemetery 71.1 28.9 2.0 2.3 4.0
7 Central Bennett Valley 80.8 19.2 2.9 2.2 8.8
8 Sea Ranch/Timber Cove 78.7 21.3 1.7 1.9 9.4
9 Cherry Valley 72.8 27.2 2.1 2.3 10.7
10 Sonoma Mountain 78.3 21.7 2.7 3.1 21.3
11 Windsor East 84.2 15.8 2.8 3.0 6.3
12 Meadow 80.0 20.0 3.6 2.7 8.7
13 Petaluma Airport/Arroyo Park 68.9 31.1 2.5 2.8 8.5
14 Downtown Sonoma 56.5 43.5 2.1 2.4 14.7
15 Southwest Sebastopol 67.5 32.5 2.0 2.6 5.0
16 Gold Ridge 71.0 29.0 1.9 2.6 8.1
17 Arnold Drive/East Sonoma Mountain 85.9 14.1 2.0 1.8 8.0
18 Central East Windsor 62.5 37.5 1.9 2.7 7.7
19 Larkfield-Wikiup 78.1 21.9 2.6 2.3 6.7
20 Sonoma City South/Vineburg 52.5 47.5 1.8 2.3 14.6
21 Southern Junior College Neighborhood 39.7 60.3 1.9 2.3 6.9
22 Jenner/Cazadero 72.1 27.9 2.0 2.1 14.7
23 Occidental/Bodega 78.7 21.3 2.2 2.0 13.2
24 Fulton 69.7 30.3 2.6 2.5 9.8
25 Spring Hill 57.0 43.0 2.2 2.4 15.8
26 Casa Grande 66.8 33.2 2.7 2.8 19.8
27 Montgomery Village 64.4 35.6 2.3 2.6 11.0
28 Hessel Community 80.4 19.6 2.4 2.3 12.4
29 Rohnert Park F/H Section 76.8 23.2 2.9 2.8 12.0
30 West Bennett Valley 58.1 41.9 2.3 2.3 10.3
31 Carneros Sonoma Area 67.8 32.2 2.8 2.5 7.7
32 Northeast Windsor 86.4 13.6 2.9 3.1 12.0
33 North Healdsburg 68.9 31.1 2.3 2.5 6.1
34 Windsor Southeast 77.7 22.3 3.6 2.5 2.6
35 Southeast Sebastopol 64.9 35.1 2.0 2.6 10.3
36 West Windsor 75.2 24.8 3.4 3.2 6.7
37 North Oakmont/Hood Mountain 70.5 29.5 1.4 1.6 5.3
38 North Sebastopol 50.7 49.3 2.1 2.3 8.0
39 East Cotati/Rohnert Park L Section 56.5 43.5 2.5 2.4 9.5
40 Sonoma City North/West Mayacamas Mountain 64.7 35.3 1.9 2.3 13.8
41 Grant 38.1 61.9 2.0 2.4 9.6
42 West Cloverdale 77.3 22.7 2.6 2.6 7.2
43 Rohnert Park M Section 60.2 39.8 2.7 2.9 12.1
44 Alexander Valley 73.2 26.8 2.8 2.5 8.1
45 Sunrise/Bond Parks 76.2 23.8 3.0 2.2 22.8
46 Piner 55.1 44.9 3.2 2.7 8.5
47 Laguna de Santa Rosa/Hall Road 83.1 16.9 4.3 2.6 5.4
48 Boyes Hot Springs West/El Verano 48.5 51.5 3.0 2.6 6.8
49 McKinley 48.2 51.8 2.6 2.7 11.6
50 Shiloh South 56.8 43.2 2.6 2.6 7.1

95A PORTRAIT OF SONOMA COUNTY 2014
REFERENCES
HOUSING UNITS OCCUPIED BY OWNER
(%)
HOUSING UNITS OCCUPIED
BY RENTERS (%)
AVERAGE HOUSEHOLD SIZE
(Renter-Occupied Housing)
AVERAGE HOUSEHOLD SIZE
(Owner-Occupied Housing)
COMMUTE 60 MINUTES OR MORE
(% of workers 16 and older)
California 54.0 46.0 3.0 2.9 10.5
Sonoma County 59.9 40.1 2.6 2.7 11.2
51 Middle Rincon South 46.7 53.3 2.5 2.6 2.8
52 Miwok 72.6 27.4 3.6 2.6 10.9
53 Spring Lake 43.2 56.8 2.4 2.3 4.4
54 La Tercera 88.7 11.3 3.9 2.8 21.6
55 West Sebastopol/Graton 74.2 25.8 2.4 2.3 15.9
56 Two Rock 59.0 41.0 2.6 2.6 10.2
57 Boyes Hot Springs/Fetters Springs/Agua Caliente East 69.8 30.2 2.8 2.3 12.6
58 Dry Creek 71.0 29.0 2.9 2.2 9.1
59 Rohnert Park SSU/J Section 73.3 26.7 2.0 3.0 11.3
60 Old Healdsburg 61.5 38.5 2.9 2.3 5.5
61 Schaefer 70.3 29.7 3.1 2.7 7.8
62 Guerneville/Rio Nido 52.3 47.7 2.3 1.9 8.5
63 West Cotati/Penngrove 59.6 40.4 2.0 2.8 14.5
64 Northern Junior College Neighborhood 28.8 71.2 2.5 2.4 18.0
65 Rohnert Park D/E/S Section 53.2 46.8 2.4 2.6 16.7
66 Pioneer Park 58.6 41.4 2.0 2.5 3.0
67 Russian River Valley 79.7 20.3 2.2 2.2 6.3
68 Brush Creek 45.7 54.3 2.6 2.2 9.3
69 Cinnabar/West Rural Petaluma 60.4 39.6 2.5 2.6 17.8
70 Central Rohnert Park 59.9 40.1 2.7 2.1 17.2
71 Kenwood/Glen Ellen 66.5 33.5 1.9 2.1 16.1
72 Wright 58.0 42.0 3.1 3.1 10.6
73 Central Windsor 68.6 31.4 2.8 2.3 5.7
74 Middle Rincon North 72.5 27.5 2.8 2.3 8.6
75 Olivet Road 70.7 29.3 2.5 2.4 14.5
76 Bellevue 52.9 47.1 4.1 3.2 13.5
77 Monte Rio 52.5 47.5 1.9 2.1 16.3
78 Lucchesi/McDowell 60.2 39.8 2.4 2.9 14.8
79 Forestville 64.6 35.4 2.1 2.2 12.6
80 Downtown Cotati 56.4 43.6 2.3 2.4 11.2
81 Kawana Springs 47.4 52.6 3.4 3.5 7.1
82 Central Healdsburg 41.5 58.5 2.8 2.4 5.9
83 Railroad Square 48.3 51.7 3.2 2.5 14.5
84 Downtown Rohnert Park 29.2 70.8 2.2 2.5 5.7
85 Coddingtown 30.1 69.9 2.7 2.7 5.8
86 Burbank Gardens 39.3 60.7 2.4 2.3 4.7
87 Rohnert Park B/C/R Section 51.1 48.9 2.6 2.7 8.2
88 Comstock 43.5 56.5 4.1 3.0 11.0
89 Taylor Mountain 46.2 53.8 2.7 2.8 13.3
90 Downtown Santa Rosa 11.2 88.8 1.7 2.9 3.6
91 East Cloverdale 48.2 51.8 2.3 3.2 8.9
92 Rohnert Park A Section 44.4 55.6 2.6 3.5 11.6
93 Bicentennial Park 20.8 79.2 2.6 2.5 16.5
94 West End 55.2 44.8 3.2 2.8 6.9
95 West Junior College 59.6 40.4 2.8 2.0 12.6
96 Fetters Springs/Agua Caliente West 45.2 54.8 4.5 2.7 7.4
97 Sheppard 38.8 61.2 4.5 3.2 11.3
98 Roseland 40.7 59.3 4.0 3.0 3.5
99 Roseland Creek 42.1 57.9 3.7 3.8 6.2
96 THE MEASURE OF AMERICA SERIES
Human DevelopmentHuman development is about what people can do and be. It is formally defined as the process of improving people’s well-being and expanding their freedoms and opportunities. The human development approach emphasizes the everyday experiences of ordinary people, encompassing the range of factors that shape their opportunities and enable them to live lives of value and choice. People with high levels of human development can invest in themselves and their families and live to their full potential; those without find many doors shut and many choices and opportunities out of reach.
The human development concept was developed by the late economist Mahbub ul Haq. In his work at the World Bank in the 1970s, and later as minister of finance in his own country of Pakistan, Dr. Haq argued that existing measures of human progress failed to account for the true purpose of development—to improve people’s lives. In particular, he believed that the commonly used measure of Gross Domestic Product failed to adequately measure well-being. Working with Nobel laureate Amartya Sen and other gifted economists Dr. Haq published the first Human Development Report, commissioned by the United Nations Development Programme, in 1990.
The American Human Development Index The human development approach is extremely broad, encompassing the wide range of economic, social, political, psychological, environmental, and cultural factors that expand or restrict people’s opportunities and freedoms. But the American Human Development (HD) Index is comparatively narrow, a composite measure that combines a limited number of indicators into a single number. The HD Index is an easily understood numerical measure that reflects what most people believe are the very basic ingredients of human well-being: health, education, and income. The value of the HD Index varies between 0 and 10, with a score close to zero indicating a greater distance from the maximum possible that can be achieved on the aggregate factors that make up the index.
Data SourcesThe American Human Development Index for Sonoma County was calculated using two main datasets, mortality data from the California Department of Public Health and education, earnings, and population data from the U.S. Census Bureau. The American Community Survey (ACS), a product of the U.S. Census Bureau, is an ongoing survey that samples a representative percentage of the population every year using standard sampling methods.
Between 2008 and 2012, the time period of data used in this report, a sample of 33,718 people participated in the ACS from Sonoma County, about 7 percent of all residents. The Census Bureau does not publish response rates to the ACS for individual counties but in California overall response rates were at least 97.5 percent for the population in housing units and at or above 93.8 percent for the group quarters population each year of the survey.
For larger geographies, such as states and counties, the Census Bureau publishes one-year population estimates; hence any data on Sonoma County and California contained in this report are calculated using the most recent available data, 2012. However, for smaller geographies, such as census tracts, one-year estimates are not available due to small population sizes. In this report, all data for census tracts from the American Community Survey are from 2008–2012.
As with any data drawn from surveys, there is some degree of sampling and nonsampling error inherent in data from the ACS. Thus, not all differences between estimates for two places or groups may reflect a true difference between those places or groups. Comparisons between similar values on any indicator should be made with caution since these differences may not be statistically significant. Direct comparisons between estimates that are not statistically significant at a 90 percent confidence level have been noted in the text.
HealthA long and healthy life is measured using life expectancy at birth. Life expectancy at birth was calculated by Measure of America using data from the California Department of Public Health, Death Statistical Master File from 2005 to 2011 and population data from the U.S. Census Bureau. Life expectancy is calculated by Measure of America using abridged life tables based on the Chiang methodology.130
EducationAccess to education is measured using two indicators: net school enrollment for the population ages 3 to 24 and degree attainment for the population 25 years and older (based on the proportion of the adult population that has earned a high school diploma, a bachelor’s degree, and a graduate or professional degree). All educational attainment and enrollment figures come from Measure of America analysis of the U.S. Census Bureau, American Community Survey. Five-year estimates spanning 2008–2012 were used for census tracts, and single-year 2012 estimates were used for county and state estimates.
Methodological Notes
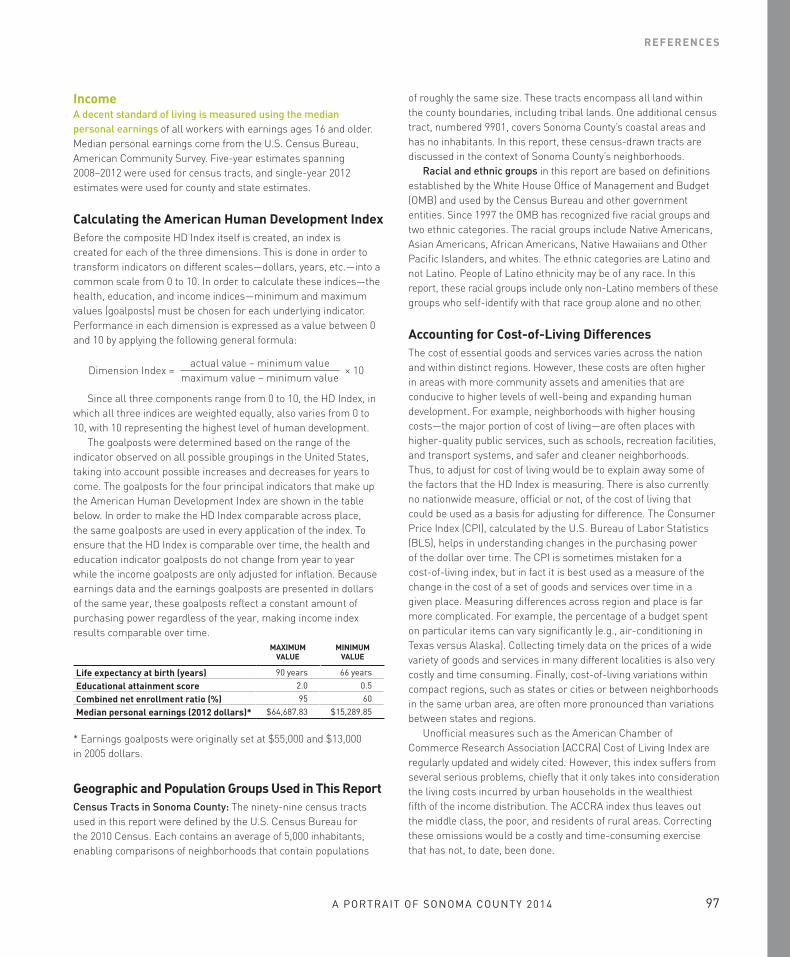
97
REFERENCES
A PORTRAIT OF SONOMA COUNTY 2014
IncomeA decent standard of living is measured using the median personal earnings of all workers with earnings ages 16 and older. Median personal earnings come from the U.S. Census Bureau, American Community Survey. Five-year estimates spanning 2008–2012 were used for census tracts, and single-year 2012 estimates were used for county and state estimates.
Calculating the American Human Development Index Before the composite HD Index itself is created, an index is created for each of the three dimensions. This is done in order to transform indicators on different scales—dollars, years, etc.—into a common scale from 0 to 10. In order to calculate these indices—the health, education, and income indices—minimum and maximum values (goalposts) must be chosen for each underlying indicator. Performance in each dimension is expressed as a value between 0 and 10 by applying the following general formula:
Dimension Index =actual value – minimum value
× 10maximum value – minimum value
Since all three components range from 0 to 10, the HD Index, in which all three indices are weighted equally, also varies from 0 to 10, with 10 representing the highest level of human development. The goalposts were determined based on the range of the indicator observed on all possible groupings in the United States, taking into account possible increases and decreases for years to come. The goalposts for the four principal indicators that make up the American Human Development Index are shown in the table below. In order to make the HD Index comparable across place, the same goalposts are used in every application of the index. To ensure that the HD Index is comparable over time, the health and education indicator goalposts do not change from year to year while the income goalposts are only adjusted for inflation. Because earnings data and the earnings goalposts are presented in dollars of the same year, these goalposts reflect a constant amount of purchasing power regardless of the year, making income index results comparable over time.
MAXIMUM VALUE
MINIMUM VALUE
Life expectancy at birth (years) 90 years 66 years
Educational attainment score 2.0 0.5
Combined net enrollment ratio (%) 95 60
Median personal earnings (2012 dollars)* $64,687.83 $15,289.85
* Earnings goalposts were originally set at $55,000 and $13,000 in 2005 dollars.
Geographic and Population Groups Used in This Report Census Tracts in Sonoma County: The ninety-nine census tracts used in this report were defined by the U.S. Census Bureau for the 2010 Census. Each contains an average of 5,000 inhabitants, enabling comparisons of neighborhoods that contain populations
of roughly the same size. These tracts encompass all land within the county boundaries, including tribal lands. One additional census tract, numbered 9901, covers Sonoma County’s coastal areas and has no inhabitants. In this report, these census-drawn tracts are discussed in the context of Sonoma County’s neighborhoods.
Racial and ethnic groups in this report are based on definitions established by the White House Office of Management and Budget (OMB) and used by the Census Bureau and other government entities. Since 1997 the OMB has recognized five racial groups and two ethnic categories. The racial groups include Native Americans, Asian Americans, African Americans, Native Hawaiians and Other Pacific Islanders, and whites. The ethnic categories are Latino and not Latino. People of Latino ethnicity may be of any race. In this report, these racial groups include only non-Latino members of these groups who self-identify with that race group alone and no other.
Accounting for Cost-of-Living DifferencesThe cost of essential goods and services varies across the nation and within distinct regions. However, these costs are often higher in areas with more community assets and amenities that are conducive to higher levels of well-being and expanding human development. For example, neighborhoods with higher housing costs—the major portion of cost of living—are often places with higher-quality public services, such as schools, recreation facilities, and transport systems, and safer and cleaner neighborhoods. Thus, to adjust for cost of living would be to explain away some of the factors that the HD Index is measuring. There is also currently no nationwide measure, official or not, of the cost of living that could be used as a basis for adjusting for difference. The Consumer Price Index (CPI), calculated by the U.S. Bureau of Labor Statistics (BLS), helps in understanding changes in the purchasing power of the dollar over time. The CPI is sometimes mistaken for a cost-of-living index, but in fact it is best used as a measure of the change in the cost of a set of goods and services over time in a given place. Measuring differences across region and place is far more complicated. For example, the percentage of a budget spent on particular items can vary significantly (e.g., air-conditioning in Texas versus Alaska). Collecting timely data on the prices of a wide variety of goods and services in many different localities is also very costly and time consuming. Finally, cost-of-living variations within compact regions, such as states or cities or between neighborhoods in the same urban area, are often more pronounced than variations between states and regions.
Unofficial measures such as the American Chamber of Commerce Research Association (ACCRA) Cost of Living Index are regularly updated and widely cited. However, this index suffers from several serious problems, chiefly that it only takes into consideration the living costs incurred by urban households in the wealthiest fifth of the income distribution. The ACCRA index thus leaves out the middle class, the poor, and residents of rural areas. Correcting these omissions would be a costly and time-consuming exercise that has not, to date, been done.

98 THE MEASURE OF AMERICA SERIES
1 Sonoma County Indicators 2013 Abridged Edition.
2 Meara, Richards, and Cutler, “The Gap Gets Bigger.”3 Measure of America calculations of life expectancy at birth for Sonoma County and tracts within it use data for 2005–2011; calculations for other California counties use data for 2010–2012.4 Lewis and Burd-Sharps, The Measure of America 2013–2014.
5 Pickett and Wilkinson, The Spirit Level.
6 With the exception of high school completion, these differences are not statistically significant.7 Drake, “Women Make Significant Gains in the Workplace and Educational Attainment, but Lag in Pay.”8 Measure of America analysis of data from the U.S. Census Bureau, American Community Survey, 2012, 5-year estimates, table C23022.9 Measure of America analysis of data from the U.S. Census Bureau, American Community Survey, 2012, 1-year estimates, table S2403.10 Measure of America calculations of life expectancy at birth for Sonoma County and tracts within it use data for 2005–2011 while calculations for other California counties use data for 2010–2012.11 The difference in the incidence of adult smoking between Sonoma and Napa is not statistically significant.12 Lewis and Burd-Sharps, The Measure of America 2010–2011.
13 Lleras-Muney, The Relationship between Education and Adult Mortality in the United States.
14 Cutler and Lleras-Muney, Education and Health.
15 “California Healthcare Atlas.”
16 “Parks & Facility Guide.”17 “California Healthcare Atlas.”18 “Parks & Facility Guide.”19 Hill and Johnson, Unauthorized Immigrants in California.
20 Lewis and Burd-Sharps, The Measure of America 2010–2011.
21 Homicide in California 2011.
22 “California Department of Justice, Criminal Justice Statistics Center, Office of the Attorney General.”23 Measure of America analysis of data from the U.S. Census Bureau, American Community Survey 2012 PUMS Microdata.24 Measure of America analysis of data from the U.S. Census Bureau, American Community Survey, 2012, 5-year estimates, table B02006.25 Wong et al., “The Unusually Poor Physical Health Status of Cambodian Refugees Two Decades after Resettlement.”26 Measure of America analysis of data from the U.S. Census Bureau, American Community Survey, 2012, 1-year estimates, table S2701.27 “Cigarette Smoking in the United States.”28 Abraído-Lanza et al., “The Latino Mortality Paradox.”29 Abraído-Lanza, Chao, and Flórez, “Do Healthy Behaviors Decline with Greater Acculturation?”30 Selected Cancer Facts—Sonoma County.
31 Chronic Disease Fact Sheet: Cancer.
32 Measure of America analysis of data from the U.S. Census Bureau, American Community Survey 2012 PUMS Microdata.33 Measure of America analysis of data from the U.S. Census Bureau, 2012 American Community Survey 5-year estimates, table B05003B.
34 Lewis and Burd-Sharps, A Portrait of California 2011.
35 Lewis and Burd-Sharps, The Measure of America 2010–2011.
36 Lewis and Burd-Sharps, Halve the Gap by 2030.
37 Measure of America analysis of data from the U.S. Census Bureau; American Community Survey 2012 PUMS Microdata; U.S. Census Bureau, American Community Survey, 2012, 5-year estimates, table B02010.38 “Disparities Dashboard.”39 Ibid.40 Sonoma County Health Snapshot.
41 “Disparities Dashboard.”42 Giovino, “Epidemiology of Tobacco Use in the United States.”43 State of Tobacco Control: California Local Grades.
44 “State Cigarette Excise Tax Rates.”45 Tobacco Laws Affecting California.
46 Data from Sonoma County Department of Health Services.47 Measure of America analysis of data from the U.S. Census Bureau, American Community Survey, 2012. 48 Acevedo-Garcia and Bates, “Latino Health Paradoxes.”49 Lleras-Muney, The Relationship between Education and Adult Mortality in the United States.
50 U.S. Census Bureau, American Community Survey, 2010, 1-year estimates, table S2301.51 California Department of Education; California Longitudinal Pupil Achievement Data System (CALPADS); Cohort Outcome Summary Reports.
Notes

99
REFERENCES
A PORTRAIT OF SONOMA COUNTY 2014
52 Measure of America analysis of data from the U.S. Census Bureau, American Community Survey, 2012.53 Lewis and Burd-Sharps, The Measure of America 2013–2014.
54 Measure of America analysis of data from the U.S. Census Bureau, American Community Survey, 2012, table C05006; American Community Survey 2012 PUMS Microdata.55 Lewis and Burd-Sharps, A Portrait of California 2011.
56 Lewis and Burd-Sharps, The Measure of America 2013–2014.
57 “Education Budget—CalEdFacts.” 58 Oakes et al., Latino Educational Opportunity Report.
59 Betts, Rueben, and Danenberg, Equal Resources, Equal Outcomes?
60 “Data Dashboard”; School Accountability Report Card: Grant Elementary 2012–2013; “California Department of Education—DataQuest.”
61 School Accountability Report Card: El Verano Elementary School 2012–2013; “California Department of Education—DataQuest.”62 “El Verano to Expand Preschool Program | Sonoma Valley Sun.”63 Hart and Risley, “The Early Catastrophe”64 Karoly, Preschool Adequacy and Efficiency in California.
65 U.S. Census Bureau, American Community Survey, 2012, 5-year estimates.66 Rumberger et al., “The Hazards of Changing Schools for California Latino Adolescents.”
67 Ibid.68 Kerbow, “Patterns of Urban Student Mobility and Local School Reform.”69 “Earnings and Unemployment Rates by Educational Attainment.”70 Meara, Richards, and Cutler, “The Gap Gets Bigger.”71 Sum, Khatiwada, and McLaughlin, “The Consequences of Dropping Out of High School.”72 Bloom, “Programs and Policies to Assist High School Dropouts in the Transition to Adulthood”; Swanson, Special Education in America; Bridgeland, DiIulio, and Morison, The Silent Epidemic; Barton, “One-Third of a Nation”; Harding, “Counterfactual Models of Neighborhood Effects.”73 Bridgeland, DiIulio, and Morison, The Silent Epidemic.
74 Measure of America analysis from “California Department of Education—DataQuest.”75 “California Healthy Kids Survey (WestEd).”76 “Local Area Unemployment Statistics Map.” Rates are not seasonally adjusted.77 Sonoma County Indicators 2013 Abridged Edition; Sonoma County Indicators 2014 Abridged Edition.
78 “County Tracker 2013.”79 Measure of America analysis completed for the 2013 Opportunity Index, www .opportunityindex.org.80 Ibid.81 Measure of America analysis of data from the U.S. Census Bureau, American Community Survey, 2012, 5-year estimates, table S0802.
82 Ibid.83 Brody, “Commuting’s Hidden Cost”; Sandow, “On the Road”; Stutzer and Frey, “Stress That Doesn’t Pay.”84 Sonoma County 2010–11 Economic and Demographic Profile.
85 Sonoma County 2012 Crop Report.
86 “Statistics”; “Sonoma County Wine Facts from Sonoma County Vintners.”87 Measure of America analysis of National Agricultural Workers Survey.
88 Ibid.89 “Occupation Profile, California LaborMarketInfo.”90 Hayes, “If We Plant It, Will They Come?”91 Measure of America analysis of data from the US Census Bureau, American Community Survey, 2012, 5-year estimates, Table S1902.92 Reber Hart, “Oakmont Grows with the Times.”93 Only the difference in white earnings is statistically significant.94 Median earnings for African Americans in Sonoma are not, however, significantly different from African American earnings in California or the nation.95 Measure of America analysis of data from the US Census Bureau, American Community Survey, 2012, 1-year estimates, table B23022.96 Budig and England, “The Wage Penalty for Motherhood.”97 Baron and Bielby, “A Woman’s Place Is With Other Women”; Williams, “Hidden Advantages for Men in Nursing.”98 Macpherson and Hirsch, “Wages and Gender Composition: Why Do Women’s Jobs Pay Less?”

100 THE MEASURE OF AMERICA SERIES
99 The difference between the median personal earnings of African Americans and Latinos is not statistically significant.100 Judson et al., “Improving Care for the Lua Community.”101 Measure of America analysis of income tax statistics for Sonoma County from the California Franchise Tax Board 2011 Annual Report. Data are for tax year 2010.102 Measure of America analysis of U.S. Census Bureau, American Community Survey, 2012, 1-year estimates, table B17005.103 Bartels, “Economic Inequality and Political Representation.”104 U.S. Census Bureau and U.S. Bureau of Labor Statistics estimates of the Sonoma labor force differ slightly.105 Measure of America analysis of U.S. Census Bureau, American Community Survey, 2012, 5-year estimates, table DP03.106 From “What is the self-sufficiency standard?” at “The Center for Women’s Welfare (CWW), The Self-Sufficiency Standard.” Sonoma County thresholds were calculated at “Self-Sufficiency Standard for California.”107 Sonoma County Indicators 2013 Abridged Edition.
108 “Physicians and Surgeons, All Other.”109 California Employment Development Department, High Wage Occupations in Santa Rosa-Petaluma Metro Statistical Area, first quarter 2013.110 Heckman and Masterov, “The Productivity Argument for Investing in Young Children”; Campbell et al., “Early Childhood Investments Substantially Boost Adult Health”; Karoly and Bigelow, The Economics of Investing in Universal Preschool Education in California.
111 Espinoza, High-Quality Preschool.
112 “California Healthy Kids Survey (WestEd)”; Sonoma County Child Care Trends.
113 “Occupation Profile, California LaborMarketInfo”; “Estimates from the Occupational Employment Statistics Survey.”114 “Adult Smoking Data – from the Behavioral Risk Factor Surveillance System”; Selected Cancer Facts - Sonoma County.
115 Turnock, Public Health, Third Edition.
116 Doll et al., “Mortality in Relation to Smoking.”117 “California Health Interview Survey”118 State Excise Tax Rates on Cigarettes.
119 Carpenter and Cook, “Cigarette Taxes and Youth Smoking.”120 Hill and Johnson, Unauthorized Immigrants in California.
121 Olds, “Preventing Crime with Prenatal and Infancy Support of Parents”; Howard and Brooks-Gunn, “The Role of Home-Visiting Programs in Preventing Child Abuse and Neglect.”122 Community Health Assessment Local Indicators calculated by Measure of America from California Longitudinal Pupil Achievement Data System (CALPADS), “California Department of Education—DataQuest.”123 Lewis et al., Goals for the Common Good: Exploring the Impact of Education.
124 Bridgeland, DiIulio, and Morison, The Silent Epidemic: Perspectives of High School Dropouts.
125 Measure of America calculations using U.S. Census Bureau, American Community Survey, 2011, 5-year estimates and 2005–2009 PUMS microdata.126 Lewis and Burd-Sharps, Halve the Gap by 2030: Youth Disconnection in America’s Cities.
127 Ibid. 128 Ibid. 129 Harper, Marcus, and Moore, “Enduring Poverty and the Conditions of Childhood”; Duncan and Brooks-Gunn, “Family Poverty, Welfare Reform, and Child Development.”130 See Chiang, The Life Table and Its Applications and Toson and Baker, “Life Expectancy at Birth: Methodological Options for Small Populations,” for more information.131 2013 Child Care Portfolio, California Child Care Resource & Referral Network
132 American Institutes for Research’s Early Learning Needs Assessment Tool 2012

101
REFERENCES
A PORTRAIT OF SONOMA COUNTY 2014
Abraído-Lanza, Ana F., Maria T. Chao, and Karen R. Flórez. “Do Healthy Behaviors Decline with Greater Acculturation? Implications for the Latino Mortality Paradox.” Social Science & Medicine 61, no. 6 (September 2005): 1243–55.
Abraído-Lanza, Ana F., Bruce P. Dohrenwend, Daisy S. Ng-Mak, and J. Blake Turner. “The Latino Mortality Paradox: A Test of the ‘Salmon Bias’ and Healthy Migrant Hypotheses.” American Journal of Public Health 89, no. 10 (October 1999): 1543–48.
Acevedo-Garcia, Dolores, and Lisa M. Bates. “Latino Health Paradoxes: Empirical Evidence, Explanations, Future Research, and Implications.” In Latinas/os in the United States: Changing the Face of América, edited by Havidán Rodríguez, Rogelio Sáenz, and Cecilia Menjívar, 101–13. Springer, 2008.
“Adults Having Five or More Alcoholic Beverages in 1 Day.” Centers for Disease Control and Prevention. Accessed March 26, 2014. http://www .cdc.gov/features/ds5drinks1day/.
Baron, James N., and William T. Bielby. “A Woman’s Place Is With Other Women: Sex Segregation Within Organizations.” In Sex Segregation in the Workplace: Trends, Explanations, Remedies. National Academies Press, 1984.
Bartels, Larry M. “Economic Inequality and Political Representation.” In The Unsustainable American State, edited by Lawrence Jacobs, 167–96. New York: Oxford University Press, 2009.
Barton, Paul E. “One-Third of a Nation: Rising Dropout Rates and Declining Opportunities.” Educational Testing Service, 2005.
Betts, Julian, Kim Rueben, and Anne Danenberg. Equal Resources, Equal Outcomes? The Distribution of School Resources and Student Achievement in California. San Francisco: Public Policy Institute of California, 2000.
Bloom, Dan. “Programs and Policies to Assist High School Dropouts in the Transition to Adulthood.” The Future of Children 20, no. 1 (2010): 89–108.
Bridgeland, John M., John J. DiIulio, and Karen Burke Morison. The Silent Epidemic: Perspectives of High School Dropouts. Washington, D.C.: Civic Enterprises, 2006.
Brody, Jane. “Commuting’s Hidden Cost.” New York Times, October 28, 2013. http://well.blogs.nytimes .com/2013/10/28/commutings-hidden-cost/.
Budig, Michelle J., and Paula England. “The Wage Penalty for Motherhood.” American Sociological Review 66, no. 2 (April 1, 2001): 204–25.
“California Department of Education—DataQuest.” Accessed April 11, 2014. http://data1.cde.ca.gov/dataquest/.
“California Department of Justice, Criminal Justice Statistics Center, Office of the Attorney General.” Accessed March 25, 2014. http://ag.ca.gov/cjsc/misc/mfrs.php.
California Department of Public Health, Center for Health Statistics. “Death Statistical Master File 2005–2012.” Accessed by special arrangement with the California Department of Public Health.
California Franchise Tax Board, 2011 Annual Report. https://www.ftb.ca.gov/aboutFTB/Tax_Statistics/2011 .shtml#PIT
“California Health Interview Survey.” UCLA Center for Health Policy Research. Accessed April 17, 2014. http://ask .chis.ucla.edu/main/default.asp.
“California Healthcare Atlas.” Accessed March 25, 2014. http://gis.oshpd .ca.gov/atlas/.
“California Healthy Kids Survey (WestEd).” Kidsdata: Data and Resources about the Health of Children. Accessed April 11, 2014. http://www.kidsdata.org/.
Campbell, Frances, Gabriella Conti, James J. Heckman, Seong Hyeok Moon, Rodrigo Pinto, Elizabeth Pungello, and Yi Pan. “Early Childhood Investments Substantially Boost Adult Health.” Science 343, no. 6178 (March 28, 2014): 1478–85.
Carpenter, Christopher, and Philip J. Cook. “Cigarette Taxes and Youth Smoking: New Evidence from National, State, and Local Youth Risk Behavior Surveys.” Journal of Health Economics 27, no. 2 (March 2008): 287–99.
Centers for Disease Control and Prevention (CDC), National Center for Health Statistics (NCHS), Compressed Mortality File (CMF) on CDC WONDER Online Database. CMF 1999-2010, Series 20, No. 2P, 2013. Accessed March 4th, 2014. http://wonder.cdc .gov/mortsql.html
Chiang, Chin Long. The Life Table and Its Applications. Malabar, FL: Robert E. Krieger, 1984.
Chronic Disease Fact Sheet: Cancer. Sonoma County Department of Health Services, 2014.
“Cigarette Smoking in the United States.” Centers for Disease Control and Prevention. Accessed March 26, 2014. http://www.cdc.gov/tobacco/campaign/tips/resources/data/cigarette-smoking-in-united-states.html.
Common Good Forecaster, created jointly by Measure of America and United Way Worldwide. www.measureofamerica .org/forecaster.
“County Tracker 2013.” National Association of Counties. Accessed March 27, 2014. http://www.uscounties.org/countytracker/index.html.
Cutler, David M., and Adriana Lleras-Muney. Education and Health: Evaluating Theories and Evidence. Working Paper. Cambridge, MA: National Bureau of Economic Research, July 2006.
Bibliography

102 THE MEASURE OF AMERICA SERIES
“Data Dashboard.” Sonoma County Department of Education, 2013. http://www.scoe.org/pub/htdocs/data-dashboard.html.
“Disparities Dashboard.” Healthy Sonoma. Accessed March 27, 2014. http://www.healthysonoma.org/modules.php?op=modload&name=NS-Indicator&file=index&topic=0&topic1=County&topic2=Sonoma&breakout=100®name=Sonoma.
Doll, Richard, Richard Peto, Jillian Boreham, and Isabelle Sutherland. “Mortality in Relation to Smoking: 50 Years’ Observations on Male British Doctors.” BMJ 328, no. 7455 (June 26, 2004): 1519.
Drake, Bruce. “Women Make Significant Gains in the Workplace and Educational Attainment, but Lag in Pay.” Pew Research Center, March 8, 2013. http://www.pewresearch .org/daily-number/women-make-significant-gains-in-the-workplace-and-educational-attainment-but-lag-in-pay/.
Duncan, Greg J., and Jeanne Brooks-Gunn. “Family Poverty, Welfare Reform, and Child Development.” Child Development 71, no. 1 (January 1, 2000): 188–96.
“Education Budget—CalEdFacts.” California Department of Education. Accessed April 8, 2014. http://www.cde.ca.gov/fg/fr/eb/cefedbudget.asp.
“El Verano to Expand Preschool Program | Sonoma Valley Sun.” Accessed April 21, 2014. http://news.sonomaportal .com/2011/10/11/el-verano-to-expand-preschool-program/.
Espinoza, Linda. High-Quality Preschool: Why We Need It and What It Looks Like. National Institute for Early Education Research, November 2002.
“Estimates from the Occupational Employment Statistics Survey.” Bureau of Labor Statistics. Accessed April 16, 2014. http://data.bls.gov/oes/datatype.do.
Giovino, Gary. “Epidemiology of Tobacco Use in the United States.” Oncogene 21, no. 48 (October 21, 2002): 7326–40.
Harding, David J. “Counterfactual Models of Neighborhood Effects: The Effect of Neighborhood Poverty on Dropping Out and Teenage Pregnancy.” American Journal of Sociology 109, no. 3 (2003): 676–719.
Harper, Caroline, Rachel Marcus, and Karen Moore. “Enduring Poverty and the Conditions of Childhood: Lifecourse and Intergenerational Poverty Transmissions.” World Development 31, no. 3. (March 2003): 535–54.
Hart, Betty, and Todd R. Risley. “The Early Catastrophe: The 30 Million Word Gap by Age 3.” American Educator 27, no. 1 (2003): 4–9.
Hayes, Sue. “If We Plant It, Will They Come? If We Hire Them, Will They Stay? Seasonal Labor in the Napa and Sonoma County Wine Industry.” Changing Face – UC Davis. Accessed April 22, 2014. https://migration .ucdavis.edu/cf/more.php?id=60_0_2_0.
Heckman, James J., and Dimitriy V. Masterov. “The Productivity Argument for Investing in Young Children.” Applied Economic Perspectives and Policy 29, no. 3 (September 21, 2007): 446–93.
Hill, Laura, and Hans Johnson. Unauthorized Immigrants in California: Estimates for Counties. Public Policy Institute of California, July 2011.
Homicide in California 2011. Sacramento: California Department of Justice, 2011.
Howard, Kimberly S., and Jeanne Brooks-Gunn. “The Role of Home-Visiting Programs in Preventing Child Abuse and Neglect.” The Future of Children 19, no. 2 (October 1, 2009): 119–46.
Judson, Leona, Kathryn D. Scott, Panna Lossy, and Mary Maddux-Gonzalez. “Improving Care for the Lua’ Community.” Sonoma Medicine 53, no. 3 (Summer 2003).
Karoly, Lynn A. Preschool Adequacy and Efficiency in California: Issues, Policy Options, and Recommendations. Vol. 889. Santa Monica: Rand Corporation, 2009.
Karoly, Lynn A., and James H. Bigelow. The Economics of Investing in Universal Preschool Education in California. Santa Monica: RAND Corporation, 2005.
Kerbow, David. “Patterns of Urban Student Mobility and Local School Reform.” Journal of Education for Students Placed at Risk (JESPAR) 1, no. 2 (1996): 147–69.
Lewis, Kristen, and Sarah Burd-Sharps. Halve the Gap by 2030: Youth Disconnection in America’s Cities. New York: Social Science Research Council, 2013.
———. The Measure of America 2010–2011: Mapping Risks and Resilience. New York: New York University Press, 2010.
———. The Measure of America 2013–2014. New York: Social Science Research Council, 2013.
———. A Portrait of California 2011. New York: American Human Development Project, 2011.
Lewis, Kristen, Sarah Burd-Sharps, Jeff Elder, and Eduardo Martins. Goals for the Common Good: Exploring the Impact of Education. New York: American Human Development Project, 2009.
Lleras-Muney, Adriana. The Relationship between Education and Adult Mortality in the United States. Working Paper. Cambridge, MA: National Bureau of Economic Research, June 2002.
“Local Area Unemployment Statistics Map.” Bureau of Labor Statistics. Accessed March 27, 2014. http://data.bls.gov/map/MapToolServlet.
Macpherson, David A., and Barry T. Hirsch. “Wages and Gender Composition: Why Do Women’s Jobs Pay Less?” Journal of Labor Economics 13, no. 3 (1995): 426.
Meara, Ellen, Seth Richards, and David Cutler. “The Gap Gets Bigger: Changes in Mortality and Life Expectancy by Education, 1981–2000.” Health Affairs 27, no. 2 (2008): 350–60.
Missouri Census Data Center, MABLE/Geocorr12 Version 1.2. Accessed January 3rd, 2014. http://mcdc.missouri.edu/websas/geocorr12.html
National Agricultural Workers Survey. United States Department of Labor, 2005, 2009.
Oakes, Jeannie, Siomara Valladares, Michelle Renee, Sophie Fanelli, David Medina, and John Rogers. Latino Educational Opportunity Report. Los Angeles: UCLA/UC, November 2007.
“Occupation Profile, California LaborMarketInfo.” California Employment Development Department. Accessed April 16, 2014. http://www.labormarketinfo.edd.ca.gov/cgi/databrowsing/occExplorerQSDetails.asp?searchCriteria=child+care&careerID=&menuChoic

103
REFERENCES
A PORTRAIT OF SONOMA COUNTY 2014
e=&geogArea=0604000097&soccode=399011&search=Explore+Occupation.
Olds, David L. “Preventing Crime with Prenatal and Infancy Support of Parents: The Nurse-Family Partnership.” Victims & Offenders 2, no. 2 (2007): 205–25.
“Parks & Facility Guide.” City of Santa Rosa Recreation & Parks, 2014.
“Physicians and Surgeons, All Other.” U.S. Bureau of Labor Statistics, accessed April 22, 2014. http://www.bls.gov/oes/CURRENT/oes291069.htm.
Pickett, Kate, and Richard Wilkinson. The Spirit Level: Why Greater Equality Makes Societies Stronger. New York: Bloomsbury, 2011.
Reber Hart, Dianne. “Oakmont Grows with the Times.” Accessed March 27, 2014. http://sonoma.towns.pressdemocrat.com/2013/08/news/oakmont-grows-with-the-times/.
Rumberger, Russell W., Katherine A. Larson, Gregory J. Palardy, Robert K. Ream, and Nina C. Schleicher. “The Hazards of Changing Schools for California Latino Adolescents.” CLPP Policy Report 1, no. 2 (October 1998).
Sandow, Erika. “On the Road: Social Aspects of Commuting Long Distances to Work,” 2011. http://www.diva-portal.org/smash/record.jsf?pid=diva2:415050.
School Accountability Report Card: El Verano Elementary School 2012–2013. Sonoma Valley Unified School District, 2013. http://sonoma-valley.schoolwisepress .com/reports/2013/pdf/sonoma-valley/sarce_en_49-70953-6052260e.pdf.
School Accountability Report Card: Grant Elementary 2012–2013. Petaluma City Elementary School District, 2013. http://www.petalumacityschools.org/perform/SARC2013/GrantElementary-English.pdf.
Selected Cancer Facts—Sonoma County. California Cancer Registry, October 2011.
“Self-Sufficiency Standard for California.” Insight Center for Community Economic Development. Accessed March 27, 2014. http://www.insightcced.org/index.php/insight-communities/cfess/calculator.
Sonoma County Child Care Trends. Sonoma County Office of Education, Spring 2013.
Sonoma County Health Snapshot. Sonoma Health Action, January 2008.
Sonoma County Indicators 2013 Abridged Edition. Sonoma County Economic Development Board, Spring 2013.
Sonoma County Indicators 2014 Abridged Edition. Sonoma County Economic Development Board, Spring 2014.
Sonoma County Office of Education, About Sonoma County Schools, accessed April 22, 2014. https://www.scoe .org/pub/htdocs/aboutschools.html
Sonoma County 2010–11 Economic and Demographic Profile. Chico, CA: Center for Economic Development, 2010.
Sonoma County 2012 Crop Report. Office of the Agricultural Commissioner, June 2013.
“Sonoma County Wine Facts from Sonoma County Vintners.” Accessed March 27, 2014. http://www.sonomawine.com/files/press/Sonoma-County-Wine-Facts.pdf.
“State Cigarette Excise Tax Rates.” Campaign for Tobacco-Free Kids. Accessed April 14, 2014. https://www.tobaccofreekids.org/research/factsheets/pdf/0097.pdf.
State Excise Tax Rates on Cigarettes. Washington, D.C.: Federation of Tax Administrators, January 2014.
State of Tobacco Control: California Local Grades. American Lung Association in California, 2014.
“Statistics.” Sonoma County. Accessed March 27, 2014. http://www.sonomacounty.com/articles/media/statistics.
Stutzer, Alois, and Bruno S. Frey. “Stress That Doesn’t Pay: The Commuting Paradox.” Scandinavian Journal of Economics 110, no. 2 (June 1, 2008): 339–66.
Sum, Andrew, Ishwar Khatiwada, and Joseph McLaughlin. “The Consequences of Dropping Out of High School: Joblessness and Jailing for High School Dropouts and the High Cost for Taxpayers.” Center for Labor Market Studies Publications, October 1, 2009.
Swanson, Christopher B. Special Education in America: The State of Students with Disabilities in the Nation’s High Schools. Editorial Projects in Education Research Center, 2008.
“The Center for Women’s Welfare (CWW), The Self-Sufficiency Standard.” Accessed March 27, 2014. http://www.selfsufficiencystandard.org/standard.html.
Tobacco Laws Affecting California. ChangeLab Solutions, 2012. http://changelabsolutions.org/sites/changelabsolutions.org/files/documents/2012_CALawsBooklet_FINAL_20120515.pdf.
Toson, Barbara, and Allan Baker. “Life Expectancy at Birth: Methodological Options for Small Populations.” National Statistics Methodological Series 33 (2003).
Turnock, Bernard J. Public Health: What It Is and How It Works. 3rd ed. Sudbury, MA: Jones and Bartlett, 2004.
University of Wisconsin Population Health Institute. “County Health Rankings 2013.” Accessed January 16, 2014. http://www.countyhealthrankings.org.
U.S. Bureau of Labor Statistics. “Earnings and Unemployment Rates by Educational Attainment.” Department of Labor, March 2014. http://www.bls .gov/emp/ep_chart_001.htm.
U.S. Census Bureau. American Community Survey. 2012, 1-year estimates and Public Use Microdata sample.
———. American Community Survey. 2006–2010, 5-year estimates.
———. American Community Survey. 2007–2011, 5-year estimates.
———. American Community Survey. 2008–2012, 5-year estimates.
———. American Community Survey. 2010, 1-year estimates.
———. Census 2000. Census Summary File 1 (SF 1) 100-Percent Data.
———. Census 2010. Census Summary File 1 (SF 1) 100-Percent Data.
Williams, Christine L. “Hidden Advantages for Men in Nursing.” Nursing Administration Quarterly 19, no. 2 (1995): 63–70.
Wong, Eunice C., Grant N. Marshall, Terry L. Schell, Marc N. Elliott, Susan H. Babey, and Katrin Hambarsoomian. “The Unusually Poor Physical Health Status of Cambodian Refugees Two Decades after Resettlement.” Journal of Immigrant and Minority Health / Center for Minority Public Health 13, no. 5 (October 2011): 876–82.

104 THE MEASURE OF AMERICA SERIES
HDINDEX
California 5.39Sonoma County 5.42
1 East Bennett Valley 8.472 Fountain Grove 8.353 Skyhawk 7.784 Annadel/South Oakmont 7.715 Old Quarry 7.716 Rural Cemetery 7.677 Central Bennett Valley 7.638 Sea Ranch/Timber Cove 7.359 Cherry Valley 7.1810 Sonoma Mountain 7.1611 Windsor East 7.0612 Meadow 7.0013 Petaluma Airport/Arroyo Park 6.9814 Downtown Sonoma 6.9515 Southwest Sebastopol 6.9416 Gold Ridge 6.9417 Arnold Drive/East Sonoma Mountain 6.7718 Central East Windsor 6.7119 Larkfield-Wikiup 6.6220 Sonoma City South/Vineburg 6.5721 Southern Junior College Neighborhood 6.5622 Jenner/Cazadero 6.5523 Occidental/Bodega 6.4724 Fulton 6.4625 Spring Hill 6.4526 Casa Grande 6.4227 Montgomery Village 6.3828 Hessel Community 6.3729 Rohnert Park F/H Section 6.2230 West Bennett Valley 6.1731 Carneros Sonoma Area 6.1532 Northeast Windsor 6.1533 North Healdsburg 6.1134 Windsor Southeast 6.1135 Southeast Sebastopol 6.1036 West Windsor 6.0737 North Oakmont/Hood Mountain 5.9838 North Sebastopol 5.8439 East Cotati/Rohnert Park L Section 5.7940 Sonoma City North/West Mayacamas Mountain 5.7841 Grant 5.7742 West Cloverdale 5.7643 Rohnert Park M Section 5.7544 Alexander Valley 5.7345 Sunrise/Bond Parks 5.7246 Piner 5.7147 Laguna de Santa Rosa/Hall Road 5.6948 Boyes Hot Springs West/El Verano 5.6849 McKinley 5.6650 Shiloh South 5.62
HDINDEX
51 Middle Rincon South 5.6152 Miwok 5.5953 Spring Lake 5.5954 La Tercera 5.5855 West Sebastopol/Graton 5.5856 Two Rock 5.5557 Boyes Hot Springs/Fetters Springs/Agua Caliente East 5.5558 Dry Creek 5.5559 Rohnert Park SSU/J Section 5.5060 Old Healdsburg 5.4361 Schaefer 5.3962 Guerneville/Rio Nido 5.2963 West Cotati/Penngrove 5.2564 Northern Junior College Neighborhood 5.2565 Rohnert Park D/E/S Section 5.2166 Pioneer Park 5.2067 Russian River Valley 5.1968 Brush Creek 5.1569 Cinnabar/West Rural Petaluma 5.1070 Central Rohnert Park 4.9671 Kenwood/Glen Ellen 4.9572 Wright 4.9173 Central Windsor 4.8474 Middle Rincon North 4.8375 Olivet Road 4.8276 Bellevue 4.6677 Monte Rio 4.6478 Lucchesi/McDowell 4.6079 Forestville 4.5780 Downtown Cotati 4.3181 Kawana Springs 4.2082 Central Healdsburg 4.1483 Railroad Square 4.1284 Downtown Rohnert Park 4.0985 Coddingtown 4.0886 Burbank Gardens 4.0387 Rohnert Park B/C/R Section 3.9788 Comstock 3.9089 Taylor Mountain 3.9090 Downtown Santa Rosa 3.8991 East Cloverdale 3.7992 Rohnert Park A Section 3.7593 Bicentennial Park 3.7394 West End 3.5195 West Junior College 3.4496 Fetters Springs/Agua Caliente West 3.4197 Sheppard 2.9898 Roseland 2.9599 Roseland Creek 2.79
HD Index by Census Tract

Sonoma County Census Tract Reference MapLabel numbers indicate rank on the American Human Development Index
SantaRosa
Petaluma
1011
116
12
128
121
37
29
175
116
101
12
101
20 Miles100
Sea Ranch Lake Sonoma
Cloverdale
Geyserville
Healdsburg
Windsor
Calistoga
Santa Rosa
Guerneville
Bodega Bay
TomalesPetaluma
Novato
SonomaCotati
Rohnert Park
22
8
42 91
24
47
7672
75
4688
93
85
9483
98
99 97 8981 30
2721
95 64
68
53
7
1
4
516
23
8690
66
44
58 8260
62 79
77 67
36
3233
1811
1973
342
3
7450
24
473855
723515
16
23
63
1310
1245
7854
5241
499
69
56
25 5
26
28 8465
8743
6380
56
59
71
17
5796
4840
25 13
20 14
315
10
78 2669
99
76 8929
81 1
30
37
4
HD INDEX
5.79–6.57
6.58–8.47
5.44–5.78
4.32–5.43
2.79–4.31
D47460_COVER_EN_CC14_v2.indd 2 5/12/15 11:25 AM

SO
NO
MA
CO
UN
TY
HU
MA
N D
EV
EL
OP
ME
NT
RE
PO
RT
20
14
A P
OR
TRA
IT OF S
ON
OM
A CO
UN
TYSarah B
urd-Sharps and Kristen Lew
is
While many measures tell us how the county’s economy is doing, A Portrait of Sonoma County tells us how the county’s people are doing.
THE MEASURE OF AMERICA SERIES:
A PORTRAIT OF SONOMA COUNTY
Cop
yrig
ht ©
201
4 M
easu
re o
f Am
eric
a.
ABOUT THE REPORT
A Portrait of Sonoma County is an in-depth look at how residents of Sonoma County are faring in three fundamental areas of life: health, access to knowledge, and living standards. It examines disparities within the county among neighborhoods and along the lines of race, ethnicity, and gender. In partnership with over sixty organizations and elected officials, the Sonoma County Department of Health Services initiated this report to provide a holistic framework for understanding and addressing complex issues facing its constituency. For more information about the report and findings, please contact [email protected].
ABOUT THE DESIGN
Humantific is an internationally recognized SenseMaking for ChangeMaking firm located in New York and Madrid.
ABOUT THE AUTHORS
Sarah Burd-Sharps and Kristen Lewis are co-directors of Measure of America and co-authors of The Measure of America series of national, state, and county reports. They both previously worked on human development issues in countries around the world.
ABOUT THE PROJECT
Measure of America of the Social Science Research Council provides easy-to-use yet methodologically sound tools for understanding the distribution of well-being and opportunity in America and seeks to foster greater awareness of our shared challenges and more support for people-centered policies.
Map over 30 indicators for Sonoma County at www.measureofamerica.org/maps
www.measureofamerica.org
A full decade separates the life expectancies of the top and bottom
census tracts.
In Forestville, the school enrollment rate
is 54 percent, compared to 100 percent in Central
East Windsor.
Latino residents earn about $11,000 less than
Asian Americans and $15,000 less than whites.
East Bennett Valley has the highest well-
being levels, and nearby Roseland Creek has the lowest.
SONOMA COUNTY HUMAN DEVELOPMENT REPORT 2014
SONOMACOUNTY
MEASUREOFAMERIC Aof the Social Science Research Council
Sarah Burd-SharpsKristen Lewis
CHIEF STATISTICIAN
Patrick Nolan Guyer
RESEARCHER
Alex Powers
COMMISSIONED BY
County of Sonoma Department of Health Services
WWW.MEASUREOFAMERICA .ORG
A PORTRAIT OF
D47460_COVER_EN_CC14_v2.indd 1 5/12/15 11:25 AM