Embed Size (px)
Citation preview
Lisbon ADDICTIONS Conference 2015 – Lisbon, 23‐25 September 2015
Sara Castiglioni Sara Castiglioni Mario Negri InstituteMario Negri Institute
Department of Environmental Health Sciences Department of Environmental Health Sciences Unity of Environmental BiomarkersUnity of Environmental Biomarkers

Rational of the approach
Almost all substances substances we consume consume are excretedare excreted
unchanged or as a
mixture of metabolites in urine in urine and/faeces and/faeces
Excreted substances end up in sewer sewer
networknetwork
Enter sewage treatment plants sewage treatment plants
Raw wastewater Raw wastewater represents anonymous urine samples of thousands of people containing
traces of excretion products
Raw wastewater Raw wastewater contains multiple information on human habitshuman habits
in a defined population

Wastewater -
Based Epidemiology ApproachA Large Urine Test
Mass spectrometric analyses Mass spectrometric analyses Concentrations of Target
Residues
Amount of target residues Amount of target residues entering a sewage treatment plant per day (g/day)
Daily flow rate
AmountsAmounts
of each parent substance parent substance consumed by the population served by the plant
Human metabolism
Collection of rawraw
wastewater wastewater samples
Composite 24 h samples
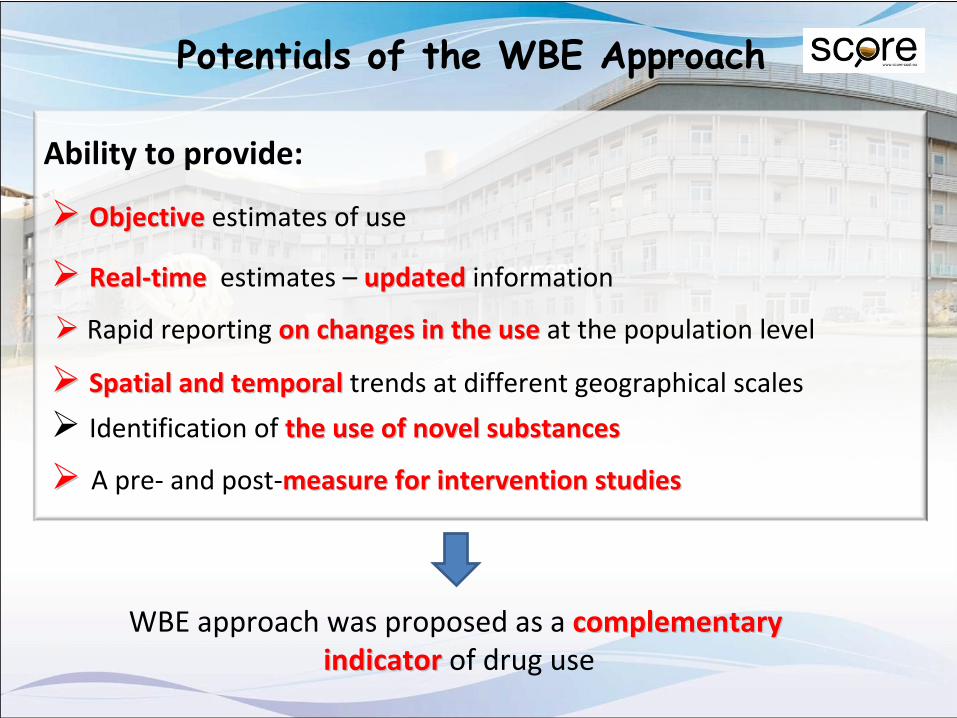
Ability to provide:
Objective Objective estimates of use
Rapid reporting on changes in the use on changes in the use at the population level
RealReal‐‐time time estimates –
updatedupdated
information
Identification of the use of novel substancesthe use of novel substances
A pre‐
and post‐measure for intervention studiesmeasure for intervention studies
Potentials of the WBE Approach
Spatial and temporal Spatial and temporal trends at different geographical scales
WBE approach was proposed as a complementary complementary indicator indicator of drug use

Objectives
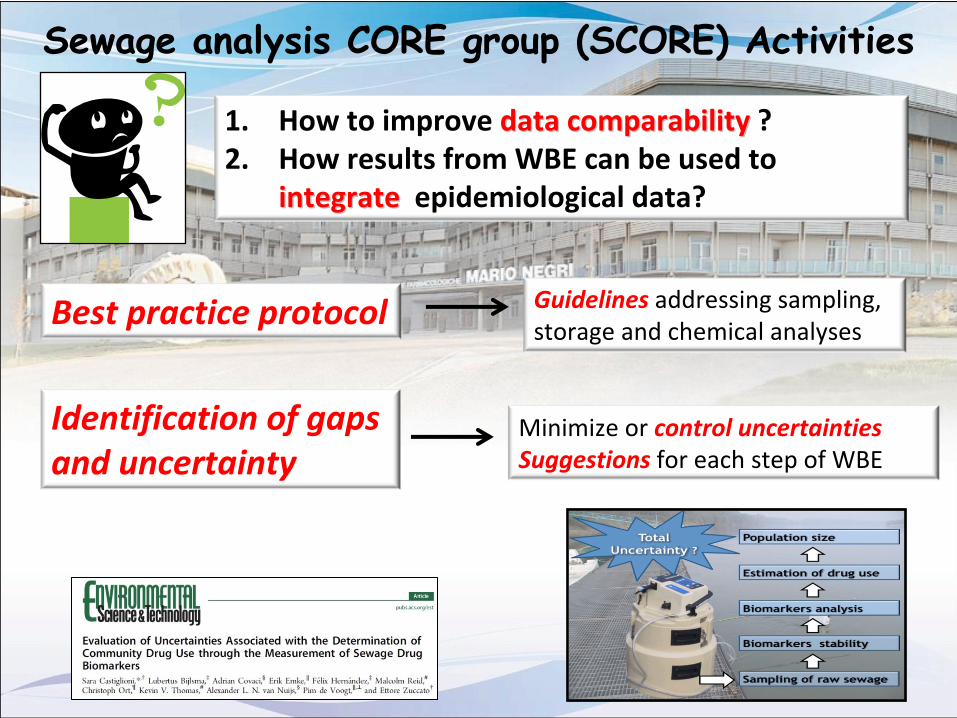
Sewage analysis CORE group (SCORE) Activities
2010 8 European Research Institutes joinedand a European Collaboration started
Organize the first Organize the first EuropeEurope‐‐wide monitoringwide monitoring
Establish a Establish a common protocolcommon protocol
Check the Check the performance of analysisperformance of analysis
through an through an interlaboratory studyinterlaboratory study
1.
How to improve data comparability data comparability ? 2.
How results from WBE can be used to
integrate integrate epidemiological data?
Sewage analysis CORE group (SCORE) Activities
Best practice protocol Guidelines
addressing sampling, storage and chemical analyses
Identification of gaps and uncertainty
Minimize or control uncertaintiesSuggestions
for each step of WBE
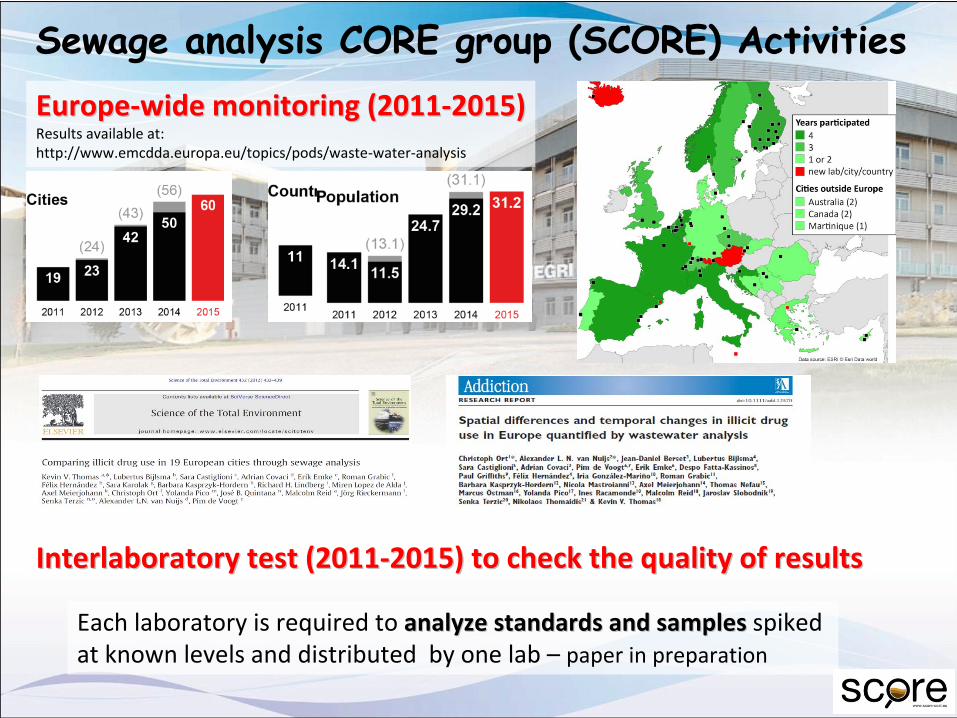
Sewage analysis CORE group (SCORE) Activities EuropeEurope‐‐wide monitoring (2011wide monitoring (2011‐‐2015)2015)Results available at:http://www.emcdda.europa.eu/topics/pods/waste‐water‐analysis
Interlaboratory test (2011Interlaboratory test (2011‐‐2015) to check the quality of results2015) to check the quality of results
Each laboratory is required to analyze standards and samples analyze standards and samples spiked at known levels and distributed by one lab –
paper in preparation
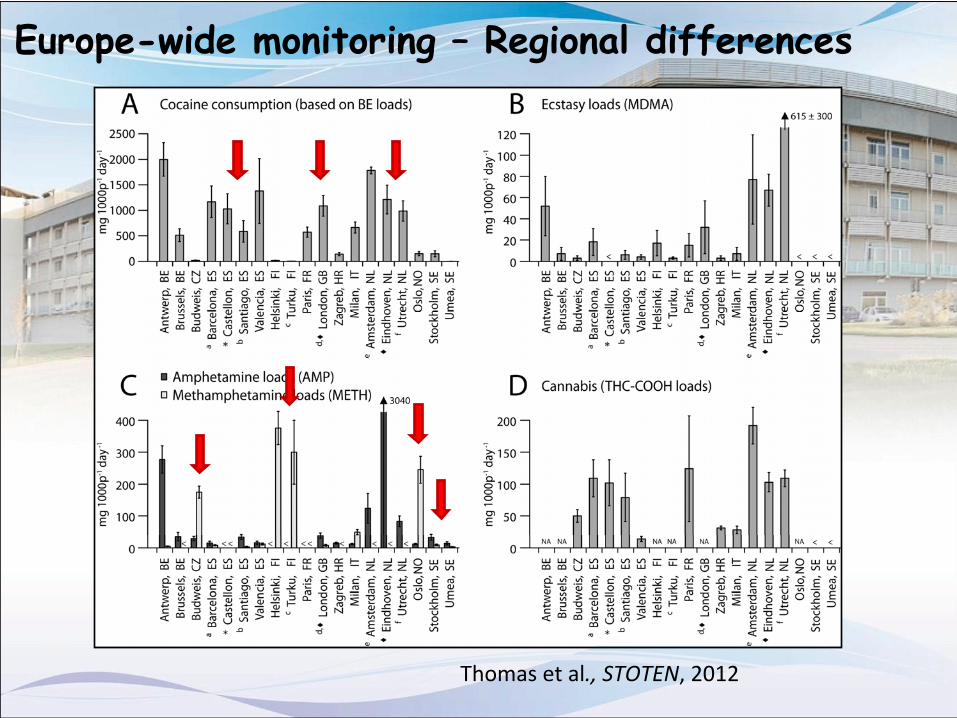
Europe-wide monitoring –
Regional differences
Thomas et al., STOTEN, 2012
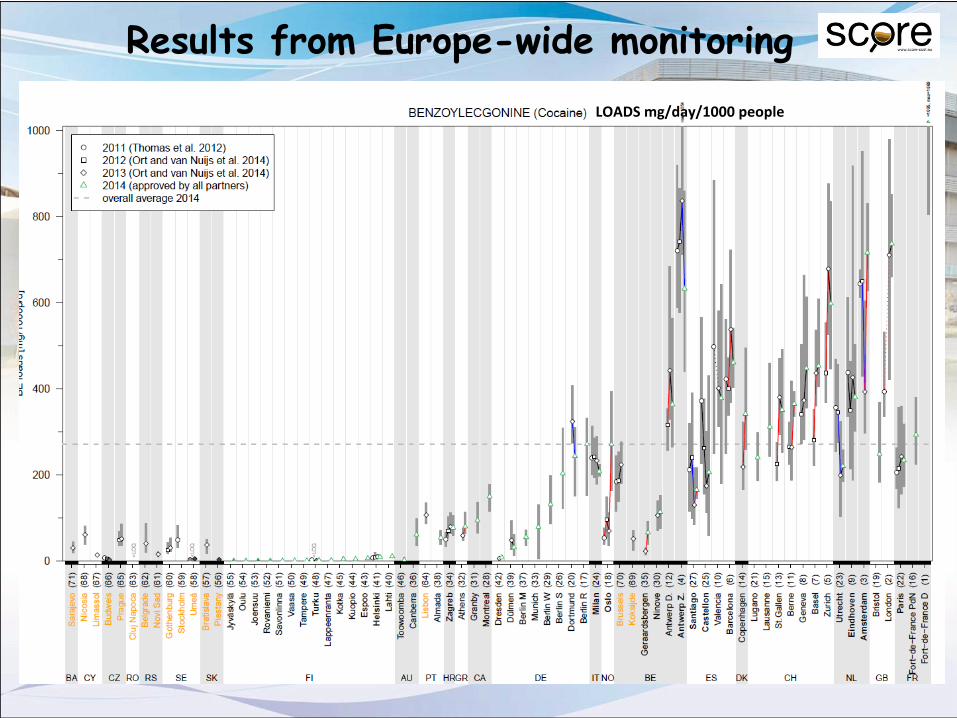
Results from Europe-wide monitoringLOADS mg/day/1000 people
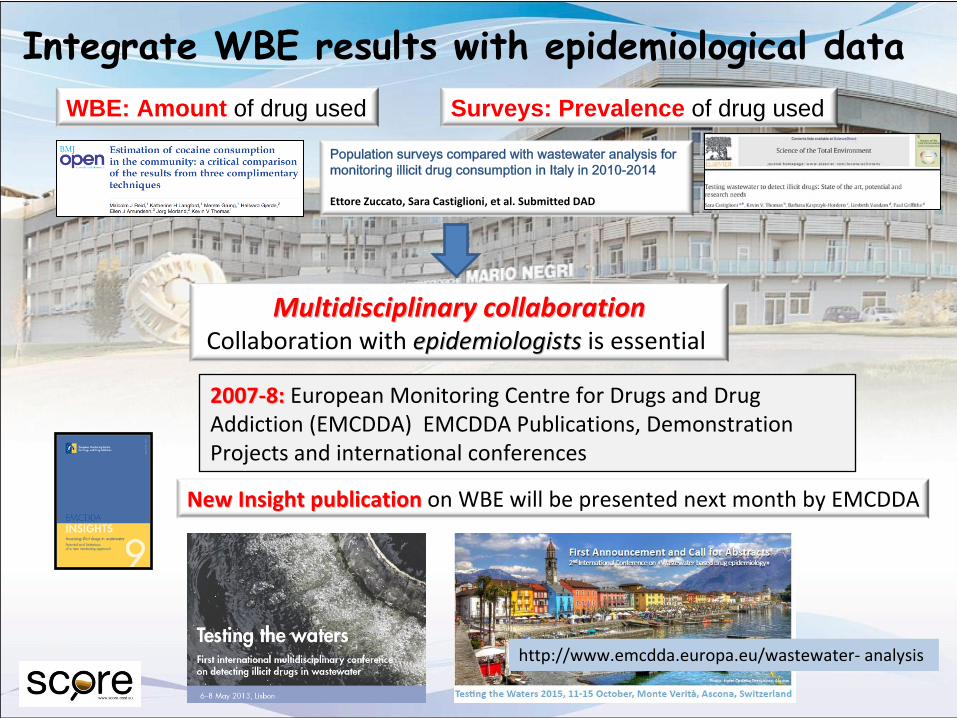
Integrate WBE results with epidemiological data
New Insight publication New Insight publication on WBE will be presented next month by EMCDDA
20072007‐‐8: 8: European Monitoring Centre for Drugs and Drug
Addiction (EMCDDA) EMCDDA Publications, Demonstration
Projects and international conferences
WBE: Amount of drug used Surveys: Prevalence of drug used
Population surveys compared with wastewater analysis for monitoring illicit drug consumption in Italy in 2010-2014
Ettore Zuccato, Sara Castiglioni, et al. Submitted DAD
Multidisciplinary collaborationMultidisciplinary collaborationCollaboration with epidemiologistsepidemiologists
is essential
http://www.emcdda.europa.eu/wastewater‐
analysis
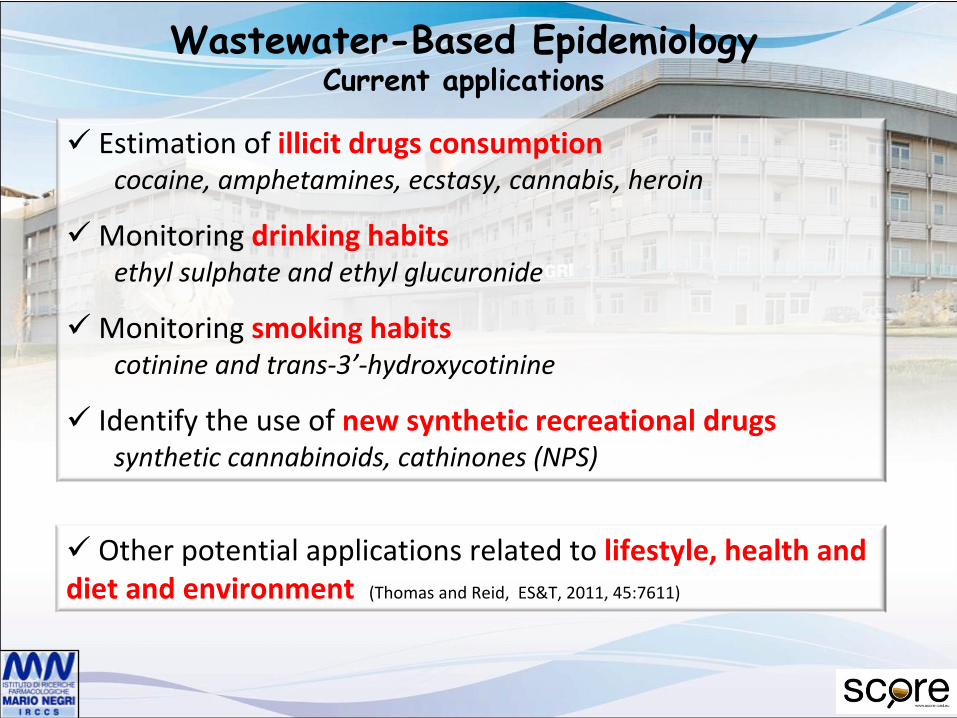
Estimation of illicit drugs consumptioncocaine, amphetamines, ecstasy, cannabis, heroin
Monitoring drinking habitsethyl sulphate and ethyl glucuronide
Monitoring smoking habitscotinine and trans‐3’‐hydroxycotinine
Identify the use of new synthetic recreational drugssynthetic cannabinoids, cathinones (NPS)
Wastewater-Based EpidemiologyCurrent applications
Other potential applications related to lifestyle, health and diet and environment
(Thomas and Reid, ES&T, 2011, 45:7611)
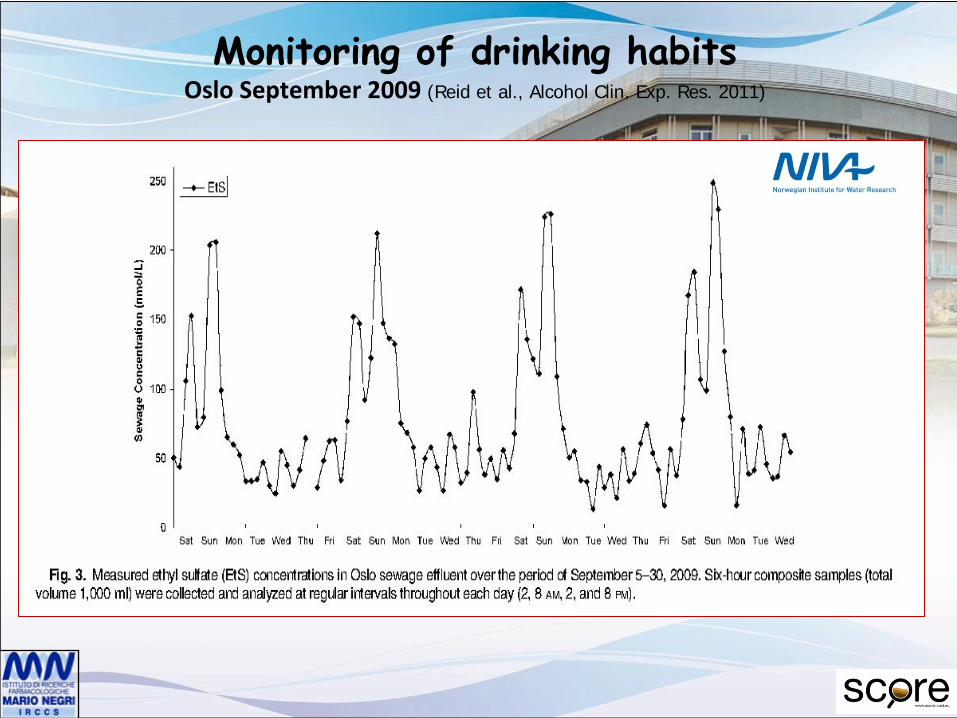
Monitoring of drinking habitsOslo September 2009 (Reid et al., Alcohol Clin. Exp. Res. 2011)
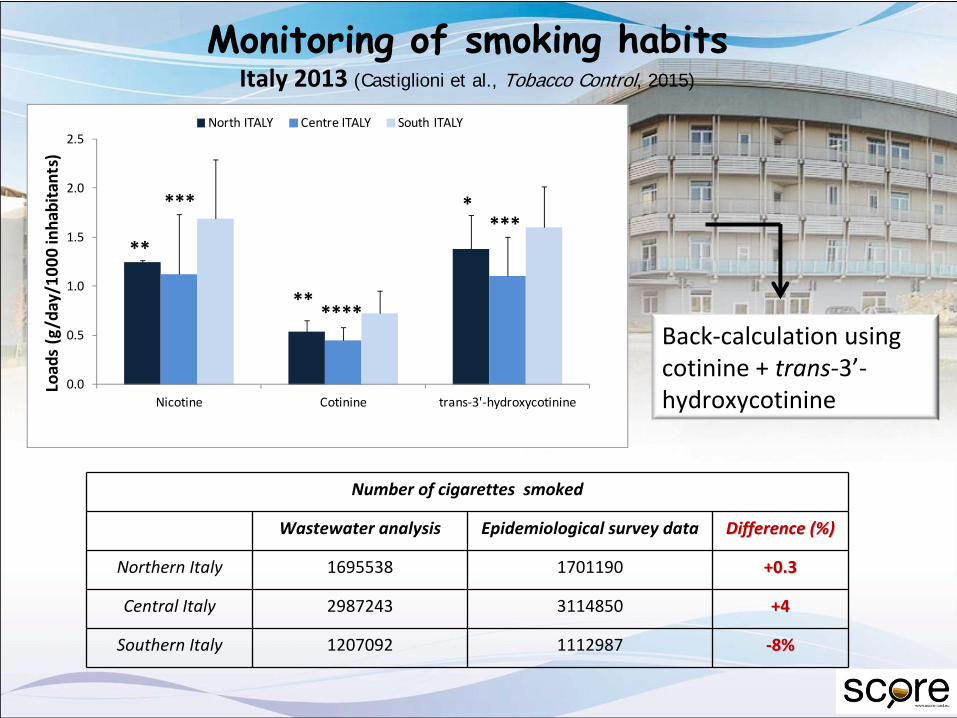
Monitoring of smoking habitsItaly 2013
(Castiglioni et al., Tobacco Control, 2015)
0.0
0.5
1.0
1.5
2.0
2.5
Nicotine Cotinine trans‐3'‐hydroxycotinine
Loads(g/day/100
0 inhabitants)
North ITALY Centre ITALY South ITALY
***
******
**
****
Number of cigarettes smoked
Wastewater analysis Epidemiological survey data Difference (%)Difference (%)
Northern Italy 1695538 1701190 +0.3+0.3
Central Italy 2987243 3114850 +4+4
Southern Italy 1207092 1112987 ‐‐8%8%
Back‐calculation using cotinine +
trans‐3’‐
hydroxycotinine

Novel synthetic stimulantsDrug Use in Adelaide, Australia
(Chen et al., Forensic Science International, 2013)
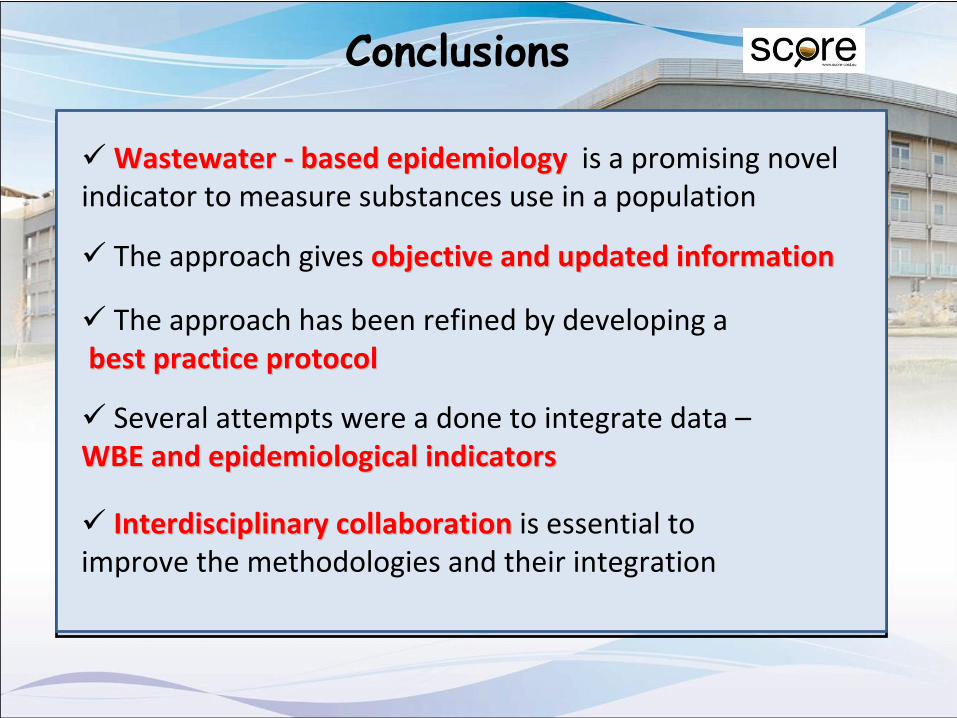
Conclusions
Wastewater Wastewater ‐‐
based epidemiology based epidemiology
is a promising novel indicator to measure substances use in a population
The approach gives objective and updated information objective and updated information
The approach has been refined by developing a best practice protocolbest practice protocol
Several attempts were a done to integrate data – WBE and epidemiological indicators WBE and epidemiological indicators
Interdisciplinary collaboration Interdisciplinary collaboration is essential to improve the methodologies and their integration

Thanks
Thanks for your attention!Thanks for your attention!
SCORE GroupSCORE GroupSara Castiglioni
Lubertus Bijlsma, Adrian Covaci,
Erik EmkeFélix Hernández,
Malcolm Reid, Christoph Ort,
Kevin V Thomas, Alexander LN van Nuijs,
Pim de Voogt, Ettore Zuccato
EMCDDAEMCDDAPaul Griffith,
Jane Mounteney, Danica Thanki, Liesbeth Vandam
COST Action ES1307
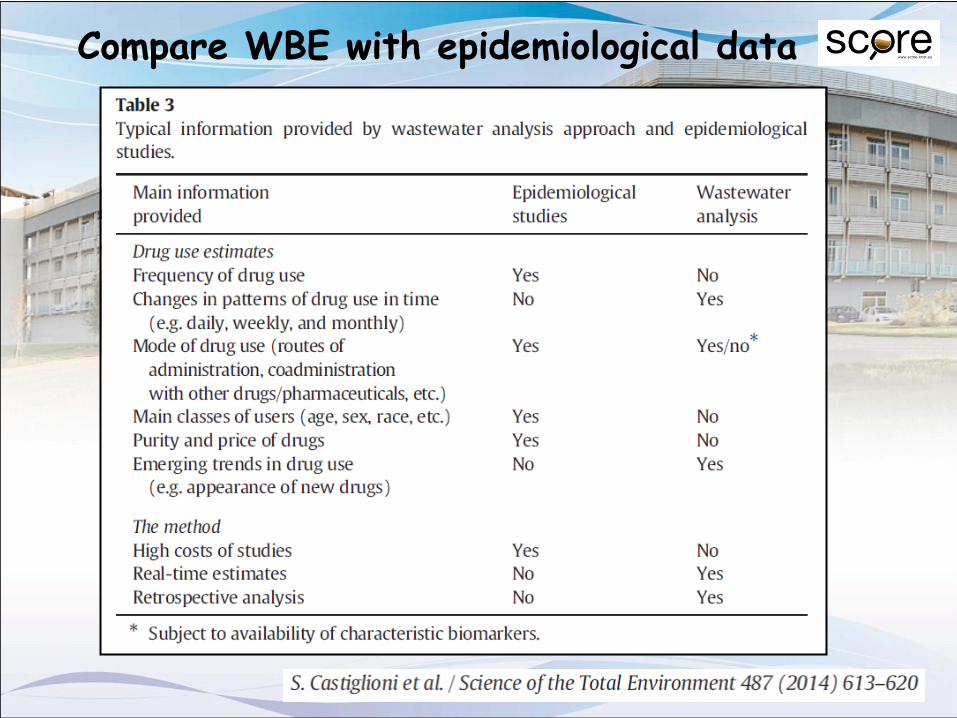
Compare WBE with epidemiological data
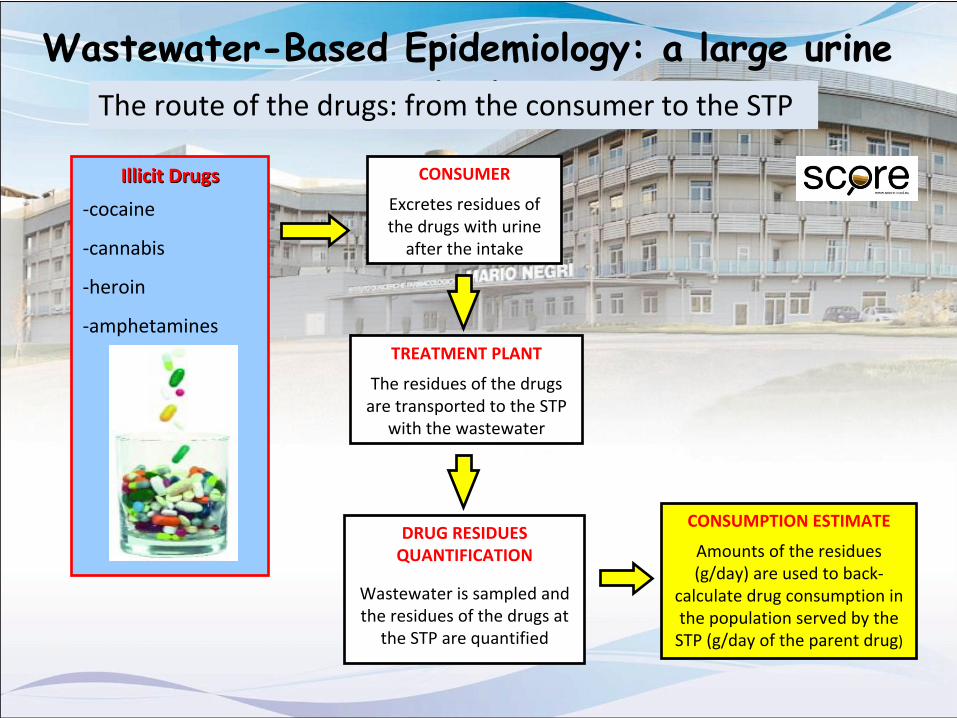
Wastewater-Based Epidemiology: a large urine testThe route of the drugs: from the consumer to the STP
CONSUMPTION ESTIMATE
Amounts of the residues
(g/day) are used to back‐
calculate drug consumption in
the population served by the
STP (g/day of the parent drug)
Illicit DrugsIllicit Drugs
‐cocaine
‐cannabis
‐heroin
‐amphetamines
CONSUMER
Excretes residues of
the drugs with urine
after the intake
TREATMENT PLANT
The residues of the drugs
are transported to the STP
with the wastewater
DRUG RESIDUES
QUANTIFICATION
Wastewater is sampled and
the residues of the drugs at
the STP are quantified