Embed Size (px)
Citation preview

SAP Working Capital Analytics Overview
SAP Business Suite – Application Innovation January 2014

Additional Information – SAP HANA Live
SAP Working Capital Analytics – Introduction
SAP Working Capital Analytics – Why Using HANA?
SAP Working Capital Analytics – HANA Model Overview
SAP Working Capital Analytics Overview
SAP Business Suite – Application Innovation

Additional Information – SAP HANA Live
SAP Working Capital Analytics – Introduction
SAP Working Capital Analytics – Why Using HANA?
SAP Working Capital Analytics – HANA Model Overview
SAP Working Capital Analytics Overview
SAP Business Suite – Application Innovation

© 2014 SAP AG or an SAP affiliate company. All rights reserved. 4
SAP Working Capital Analytics Definition of Working Capital
= Current Assets – Current Liabilities A measure of both a company's efficiency and its short-term financial health.
Inventory
Accounts Receivable
Cash
Other Liquid Assets
Accounts Payable
Wor
king
Cap
ital
Cur
rent
Ass
ets
Other Short Term
Liabilities
Cur
rent
Lia
bilit
ies
Working Capital
Represents the value of all assets that are reasonably expected to be converted into cash within one year in the normal course of business.
Current Assets
Current Liabilities A company's debts or obligations that are due within one year.

© 2014 SAP AG or an SAP affiliate company. All rights reserved. 5
SAP Working Capital Analytics Performance Indicator Relations and Influencing Factors
Cash Conversion Cycle (CCC)
Days Sales Outstanding
(DSO)
Days Inventory Held
(DIH)
Days Payables Outstanding
(DPO)
Inventory
Cost of Goods Sold (COGS)
Net Sales
Accounts Receivable (AR)
Accounts Payable (AP)
Operating Cycle (OC)
Influencing Factors Performance Indicators
+
-
Days Sales Outstanding
(DSO)

© 2014 SAP AG or an SAP affiliate company. All rights reserved. 6
SAP Working Capital Analytics Performance Indicator Relations and Influencing Factors
Cash Conversion Cycle (CCC)
Days Sales Outstanding
(DSO)
Days Inventory Held
(DIH)
Days Payables Outstanding
(DPO)
Inventory
Cost of Goods Sold (COGS)
Net Sales
Accounts Receivable (AR)
Accounts Payable (AP)
Operating Cycle (OC)
Influencing Factors Performance Indicators
+
-
Days Sales Outstanding
(DSO)
SAP Working Capital Analytics 1.0 features Web applications and content to analyze aspects relevant for
• Days Sales Outstanding (DSO)
• Days Payables Outstanding (DPO)

© 2014 SAP AG or an SAP affiliate company. All rights reserved. 7
SAP Working Capital Analytics Business Context
Business Context / Use Case • In today's volatile financial markets a company’s
efficiency and financial health is more important than ever.
• Influencing working capital is of high significance in this context, especially in a global environment with major regional differences, e.g. with regards to payment terms.
• SAP Working Capital Analytics provides a new, intuitive and easy to use way to analyze Days Sales Outstanding (DSO), Days Payables Outstanding (DPO) and related KPIs.
• SAP Working Capital Analytics allows users to interactively build up flexible drill-down analysis paths to analyze complex data on a detailed level.

© 2014 SAP AG or an SAP affiliate company. All rights reserved. 8
SAP Working Capital Analytics Product Overview
What’s this all about?
An analytics application that helps companies
• analyze all aspects of days sales outstanding and days payables outstanding
• explore root causes of working capital changes
• optimize strategies to improve the company’s liquidity, efficiency and overall financial health
Key Product Features
• Analytics for receivables and payables based on real-time ERP data powered by SAP HANA
• Analysis paths can be saved and reused • Multidimensional drill-down opportunities to
interactively explore data
• Drill-down to line item level to fine-tune tactics regarding receivables and payables

© 2014 SAP AG or an SAP affiliate company. All rights reserved. 9
SAP Working Capital Analytics Customer Value
Value of SAP Working Capital Analytics Improvements in DSO-related and DPO-related KPIs • increase the efficiency of receivables
collections • support better payment term negotiations with
customers and suppliers • improve the payment behavior towards
suppliers • increase liquidity • give CFOs more flexibility regarding
investments, using own cash instead of loans • improve credit ratings
Limitations of Competing Solutions • Key-date-dependent views on data only • Loss of detail, information and precision, due
to calculations on aggregated data • Limited drill-down capabilities only
© 2014 SAP AG or an SAP affiliate company. All rights reserved. 10
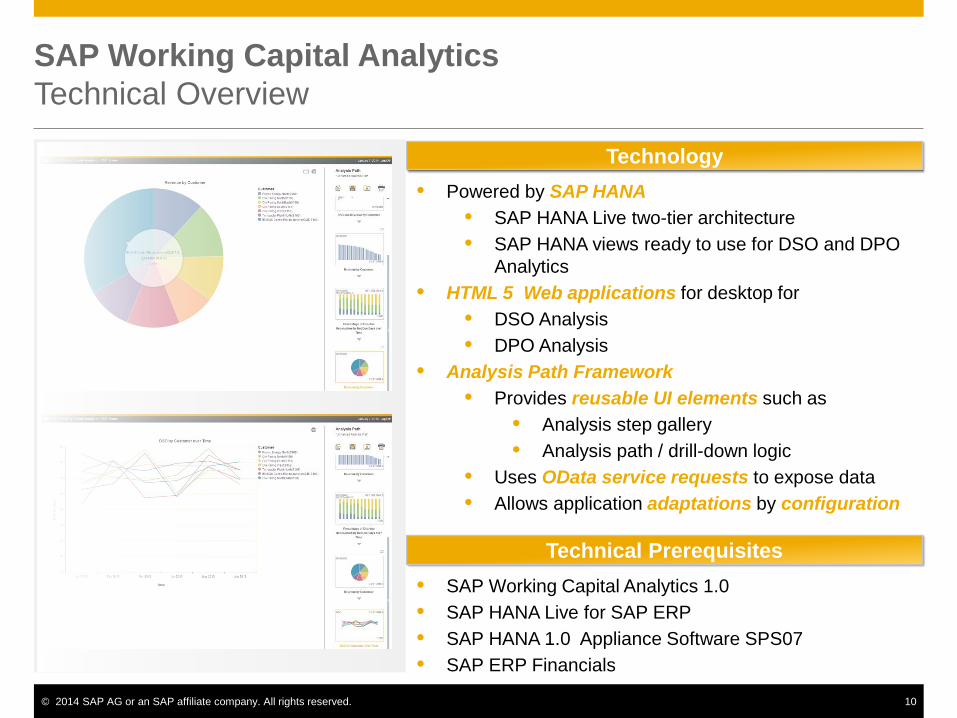
SAP Working Capital Analytics Technical Overview
Technology • Powered by SAP HANA
• SAP HANA Live two-tier architecture • SAP HANA views ready to use for DSO and DPO
Analytics • HTML 5 Web applications for desktop for
• DSO Analysis • DPO Analysis
• Analysis Path Framework • Provides reusable UI elements such as
• Analysis step gallery • Analysis path / drill-down logic
• Uses OData service requests to expose data • Allows application adaptations by configuration
Technical Prerequisites • SAP Working Capital Analytics 1.0 • SAP HANA Live for SAP ERP • SAP HANA 1.0 Appliance Software SPS07 • SAP ERP Financials

© 2014 SAP AG or an SAP affiliate company. All rights reserved. 11
SAP Working Capital Analytics DSO Analysis
Target Roles Corporate / regional controller Regional CFOs Country manager
Analysis Area Days Sales Outstanding (DSO) /
Receivables
Business Questions How is the DSO performance of my countries ,
customers or sales organizations? What is the DSO / overdue DSO trend over time? How is the payment discipline of customers ? Which business partners do not pay on time? Which receivables are overdue and have significant
business volume? What is the aging structure of receivables?
Metrics and KPIs DSO Best possible DSO Overdue DSO Revenue Receivables Overdue receivables Open receivables Cleared receivables
Categories and Drill-Down Options Time Company code Country of company
Code Customer Country of customer Customer group
Sales organization Distribution channel Division Sales district Aging Net due days Days in arrears Receivables
Mandatory Analysis Settings Company code Analysis time frame Currency

© 2014 SAP AG or an SAP affiliate company. All rights reserved. 12
SAP Working Capital Analytics DPO Analysis
Target Roles Corporate / regional controller Regional CFOs / purchasers Country manager
Analysis Area Days Payables Outstanding (DPO) /
Payables
Business Questions How is the DPO performance of my countries ? What is the DPO / overdue DPO trend over time? How is the payment discipline towards my suppliers? What are the countries with high expenses / a high
impact on DPO? Which payables are not paid on time? What is the aging structure of payables? How do payments terms (net due days) change over
time?
Metrics and KPIs DPO Best possible DPO Overdue DPO Expenses Payables Overdue payables Open payables Cleared payables
Categories and Drill-down options Time Company code Country of company
Code Vendor Country of vendor
Aging Net due days Days in arrears Payables
Mandatory Analysis Settings Company code Analysis time frame Currency

Additional Information – SAP HANA Live
SAP Working Capital Analytics – Introduction
SAP Working Capital Analytics – Why Using HANA?
SAP Working Capital Analytics – HANA Model Overview
SAP Working Capital Analytics Overview
SAP Business Suite – Application Innovation

© 2014 SAP AG or an SAP affiliate company. All rights reserved. 14
SAP Working Capital Analytics Example: Calculation Methods for DSO
SAP Working Capital Analytics allows analysts to calculate relevant measures based on financial line items (referred to as direct method).
The following slides provide details about typical calculation methods in comparison to the direct calculation based on financial line items.
The calculation methods are explained by looking at a calculation example for DSO.
The example is based on a simulation as outlined on the next slide.
Calculation: Introduction

© 2014 SAP AG or an SAP affiliate company. All rights reserved. 15
Date Revenue DSO Clearing Date Receivables
01.06.2011 999,41 € 15 16.06.2011 11.878,96 € 02.06.2011 992,26 € 15 17.06.2011 12.417,71 € 03.06.2011 977,11 € 15 18.06.2011 12.886,84 € 04.06.2011 954,28 € 15 19.06.2011 13.276,78 € 05.06.2011 924,23 € 15 20.06.2011 13.579,59 € 06.06.2011 887,58 € 15 21.06.2011 13.789,09 € 07.06.2011 845,07 € 15 22.06.2011 13.901,03 € 08.06.2011 797,56 € 15 23.06.2011 13.913,11 € 09.06.2011 746,03 € 15 24.06.2011 13.825,10 € 10.06.2011 691,53 € 15 25.06.2011 13.638,78 € 11.06.2011 635,16 € 15 26.06.2011 13.357,95 € 12.06.2011 578,07 € 15 27.06.2011 12.988,34 € 13.06.2011 521,43 € 15 28.06.2011 12.537,47 € 14.06.2011 466,39 € 15 29.06.2011 12.014,53 € 15.06.2011 414,07 € 15 30.06.2011 11.430,17 € 16.06.2011 365,54 € 15 01.07.2011 10.796,31 € 17.06.2011 321,79 € 15 02.07.2011 10.125,84 € 18.06.2011 283,71 € 15 03.07.2011 9.432,44 € 19.06.2011 252,07 € 15 04.07.2011 8.730,23 € 20.06.2011 227,52 € 15 05.07.2011 8.033,51 € 21.06.2011 210,55 € 15 06.07.2011 7.356,49 € 22.06.2011 201,53 € 15 07.07.2011 6.712,95 € 23.06.2011 200,62 € 15 08.07.2011 6.116,00 € 24.06.2011 207,84 € 15 09.07.2011 5.577,81 € 25.06.2011 223,06 € 15 10.07.2011 5.109,35 € 26.06.2011 245,95 € 15 11.07.2011 4.720,14 € 27.06.2011 276,06 € 15 12.07.2011 4.418,14 € 28.06.2011 312,77 € 15 13.07.2011 4.209,48 € 29.06.2011 355,33 € 15 14.07.2011 4.098,43 € 30.06.2011 402,88 € 15 15.07.2011 4.087,23 €
SAP Working Capital Analytics Example: Calculation Methods for DSO
• Each day a certain amount of revenue is generated.
• Revenue always results in a corresponding accounts receivable position.
• Customers always pay after 15 days.
Obviously, the DSO is 15 days!
Simulation Example
The table shows revenue and receivables for June 2011.
The graphic above illustrates how revenue and receivables are distributed over time, assuming that positions are cleared after 15 days. .

© 2014 SAP AG or an SAP affiliate company. All rights reserved. 16
SAP Working Capital Analytics Indirect Calculation Method for DSO (classical)
DSOt = x 30* Receivablest
Revenue of last 30 days* * Could also be any other number of days
In a first step, the “classical” DSO calculation (indirect method) is explained in more detail.
DSOt = x 30 4.087,23 €
Receivables as of June 30, 2011: 4.087,23 €
Revenue June 1 – June 30, 2011: 15.517,40 €
15.517,40 €
DSOt = 7,9 days
DSO Calculation Example Indirect Method “classical”
DSO Formula Indirect Method “classical”
days
Result
Although the DSO should be 15 days, we see that the ‚classical‘ approach to calculate DSO results in considerable variations of DSO values (e.g. DSO June 03: 19,3 days/ DSO June 30: 7,9 days), depending on when the calculation is performed. This effect even increases in case of seasonal fluctuations.
DSO variations resulting from calculation method

© 2014 SAP AG or an SAP affiliate company. All rights reserved. 17
SAP Working Capital Analytics Indirect Calculation Method for DSO (rolling avg. receivables) The following example shows how DSO is calculated using rolling averages.
DSOt = x 30 5.764,15 €
Avg. Receivables June 19 – June 30, 2011: 5.764,15 €
Revenue June 1 – June 30, 2011: 15.517,40 €
15.517,40 € DSOt = 11,1 days
DSO Calculation Example Indir. Method ‚Rolling avg. Receiv.‘
DSO Formula Indirect Method ‚Rolling avg. Receivables‘
DSOt = x 30* Rol. Av. Receivables 12 days**
Revenue of last 30 days* * Could also be any other number of days ** Could also be a rolling average over other perdiod
days
Result
Using rolling averages to calculate DSO decreases variations to some degree. However, DSO values are only approximations that are subject to certain assumptions.
DSO variations slightly decreased

© 2014 SAP AG or an SAP affiliate company. All rights reserved. 18
SAP Working Capital Analytics Direct Calculation Method for DSO
This slide outlines how DSO is calculated based on original documents (direct method).
DSOt =
Doc.1: posted June 1, cleared June 16, 2011: 999,41 €
Doc. 2: posted June 2, cleared June 17, 2011: 992,26 €
1.991,67 DSOt = 15,0 days
DSO Calculation Example Direct Method
DSO Formula Direct Method
days
DSOt = Σ (CD – PD) * AR
Σ AR AR = Accounts Receivable Amount CD = Clearing Date PD = Posting Date
((06/16/11 – 06/01/11) * 999,41) + ((06/17/11 – 06/02/11) * 992,26)
Result
A DSO calculation based on document details allows you to derive DSO values that reflect real movements and developments without making any assumptions.
True DSO, no variation

© 2014 SAP AG or an SAP affiliate company. All rights reserved. 19
SAP Working Capital Analytics Formulas for DSO / DPO Calculation
The following slides depict the formulas provided with SAP Working Capital Analytics to calculate the KPIs DSO and DPO.
Important note: By default, SAP Working Capital Analytics uses the direct calculation method based on financial line items for DSO and DPO.
You can change the configuration so that calculations are performed using the indirect method instead.
For more information how to switch the calculation method see the SAP Working Capital Analytics documentation, chapter Enhancing SAP Working Capital Analytics, available at http://help.sap.com/hba.
Formulas Provided with the Application

© 2014 SAP AG or an SAP affiliate company. All rights reserved. 20
SAP Working Capital Analytics DSO Definitions
DSO Indicates the average number of days that it takes a company to collect its outstanding accounts receivable.
Overdue DSO Indicates the average number of days that an invoice has been overdue.
Best Possible DSO The DSO that can be reached if payment is always made on the due date.

© 2014 SAP AG or an SAP affiliate company. All rights reserved. 21
Σ (Line Item Clearing Date – Line Item Net Due Date) * Line Item Amount
Σ Line Item Amount
SAP Working Capital Analytics Direct Calculation of DSO
Σ (Line Item Clearing Date – Line Item Posting Date) * Line Item Amount
Σ Line Item Amount DSO =
Σ (Line Item Net due Date – Line Item Posting Date) * Line Item Amount
Σ Line Item Amount Best Possible DSO
Overdue DSO =
=

© 2014 SAP AG or an SAP affiliate company. All rights reserved. 22
Average Overdue AR Balance of last X Months*
Average Monthly Revenues of last Y Months**
SAP Working Capital Analytics Indirect Calculation of DSO – Calculation per Month
Average Accounts Receivable Balance of last X Months*
Average Monthly Revenues of last Y Months** DSO = x 30
Overdue DSO x 30
* Parameter X: can be any positive number of months (Default parameter = 1)
** Parameter Y: can be any positive number of months (Default parameter = 1)
Best Possible DSO
=
= DSO – Overdue DSO

© 2014 SAP AG or an SAP affiliate company. All rights reserved. 23
Average Overdue AR Balance of Analysis Time Frame
Average Monthly Revenues of Analysis Time Frame
SAP Working Capital Analytics Indirect Calculation of DSO – Overall Calculation
Average Accounts Receivable Balance of Analysis Time Frame
Average Monthly Revenues of Analysis Time Frame DSO = x 30
Overdue DSO x 30
Best Possible DSO = DSO – Overdue DSO
=

© 2014 SAP AG or an SAP affiliate company. All rights reserved. 24
SAP Working Capital Analytics DPO Definitions
DPO Indicates the average number of days that it takes a company to pay its suppliers.
Overdue DPO Indicates the average number of days that an invoice from a supplier has been overdue.
Best Possible DPO The DPO that can be reached if payment is always made on the due date.

© 2014 SAP AG or an SAP affiliate company. All rights reserved. 25
SAP Working Capital Analytics Direct Calculation of DPO
Σ (Line Item Clearing Date – Line Item Posting Date) * Line Item Amount
Σ Line Item Amount DPO =
Σ (Line Item Clearing Date – Line Item Net Due Date) * Line Item Amount
Σ Line Item Amount
Σ (Line Item Net due Date – Line Item Posting Date) * Line Item Amount
Σ Line Item Amount
Best Possible DPO
Overdue DPO =
=

© 2014 SAP AG or an SAP affiliate company. All rights reserved. 26
Average Overdue AP Balance of last X Months*
Average Monthly Expenses of last Y Months**
SAP Working Capital Analytics Indirect Calculation of DPO – Calculation per Month
Average Accounts Payable Balance of last X Months*
Average Monthly Expenses of last Y Months** DPO = x 30
Overdue DPO
x 30
* Parameter X: can be any positive number of months (Default parameter = 1)
** Parameter Y: can be any positive number of months (Default parameter = 1)
Best Possible DPO = DPO – Overdue DPO
=

© 2014 SAP AG or an SAP affiliate company. All rights reserved. 27
Average Overdue AP Balance of Analysis Time Frame
Average Monthly Expenses of Analysis Time Frame
SAP Working Capital Analytics Indirect Calculation of DPO – Overall Calculation
Average Accounts Payable Balance of Analysis Time Frame
Average Monthly Expenses of Analysis Time Frame DPO = x 30
Overdue DPO
x 30
Best Possible DPO = DPO – Overdue DPO
=

© 2014 SAP AG or an SAP affiliate company. All rights reserved. 28
SAP Working Capital Analytics Characteristics of Calculation Methods for DSO / DPO
Direct Calculation Indirect Calculation
Calculation Approach
Direct calculation of time span between posting date and clearing date (true DSO / DPO) per line item
Indirect calculation by deriving DSO/ DPO from influencing factors (receivables balance and revenue for DSO; payables balance and expenses for DPO)
Calculation Level
granular per line item aggregated
Relevant Documents
cleared line items (cleared receivables/ cleared payables)
receivables/ payables: line items posted before end of analysis time frame and open at end of analysis time frame revenue/ expenses: posted within analysis time frame

© 2014 SAP AG or an SAP affiliate company. All rights reserved. 29
SAP Working Capital Analytics Pros and Cons of Calculation Methods for DSO / DPO
Direct Calculation Indirect Calculation Pros • More precise
• Independent from calculation effects caused by seasonal business or big scale transactions.
• Less affected by a high proportion of special business transactions such as credit memos, invoice pooling, partial payments.
Cons Effects in case of special business transactions: • Unexpected effects in case of a high
proportion of credit memos. • Lower values in case of invoice pooling or
partial payments.
• Highly key date dependent, that is, KPI calculations are more affected by influences and assumptions causing considerable KPI variations with limited informative value.
• Effects can be reduced to some degree using rolling averages.

Additional Information – SAP HANA Live
SAP Working Capital Analytics – Introduction
SAP Working Capital Analytics – Why Using HANA?
SAP Working Capital Analytics – HANA Model Overview
SAP Working Capital Analytics Overview
SAP Business Suite – Application Innovation

© 2014 SAP AG or an SAP affiliate company. All rights reserved. 31
SAP Working Capital Analytics HANA Model Architecture, DSO Analysis

© 2014 SAP AG or an SAP affiliate company. All rights reserved. 32
ECC Database Tables
Reuse and Private Views
Query Views
SAP Working Capital Analytics HANA Model Architecture, DSO Analysis

© 2014 SAP AG or an SAP affiliate company. All rights reserved. 33
SAP Working Capital Analytics HANA Model Architecture, DPO Analysis

© 2014 SAP AG or an SAP affiliate company. All rights reserved. 34
ECC Database Tables
Reuse and Private Views
Query Views
SAP Working Capital Analytics HANA Model Architecture, DPO Analysis

Additional Information – SAP HANA Live
SAP Working Capital Analytics – Introduction
SAP Working Capital Analytics – Why Using HANA?
SAP Working Capital Analytics – HANA Model Overview
SAP Working Capital Analytics Overview
SAP Business Suite – Application Innovation

© 2014 SAP AG or an SAP affiliate company. All rights reserved. 36
SAP HANA Live Unified View of Business Processes Across Organizational Functions
Instantaneous transactions - results-to-actions
Empowerment for front-line employees
Unified view of operations without delay
Out-of-the-Box
Custom-built
Open Interface
Customer Extensions
Personalized Views
Personalized Views
Personalized Views
Private Views
Reuse Views
Physical Tables
SAP- delivered
Query Views
SAP HANA Live (VDM)
Multi-channel Unified User Experience
SAP Business Suite
SAP NetWeaver
SAP
Net
Wea
ver
BW
New
SA
P A
pps
Part
ner
App
s
SAP HANA PLATFORM
Database Services
Synchronizations Services
Application Services Operational Reporting
* SAP HANA Live is a separate package for SAP Business Suite

© 2014 SAP AG or an SAP affiliate company. All rights reserved. 37
SAP HANA Live Architecture Foundation for new Class of Applications
Atomic data set for detailed drill-down information
Pre-defined models across entire suite
Operational data available instantaneously
HTTP(S), HTML, CSS, JS, …
HTML5-based (web & Mobile) Other SAP Solutions SAP BusinessObjects BI
XS Engine Application Services
Web Resource
oData Service
Database Layer Physical Tables
SAP HANA PLATFORM
Customer Extensions
Personalized Views
Personalized Views
Personalized Views
Private Views
Reuse Views
SAP- delivered
Query Views
SAP HANA Live
Virtu
al D
ata
Mod
el
3rd Party
Open Interfaces: https | oData | SQL | MDX

© 2014 SAP AG or an SAP affiliate company. All rights reserved. 38
SAP HANA Live for SAP Business Suite Differentiation Through Real-time Business Intelligence
Open Access via standard interfaces, especially SQL Access with any client
Uniform One approach for all Business Suite applications Analyze cross application boundaries
Intuitive Data models are made simple Customizing dependencies are hidden
Fast Reporting performance powered by SAP HANA Rapid implementation times
Real-Time Cycle time from recording to reporting is zero Built on replication or embedded
Extensible Adjust to industry or customer language Easily enrich with non-SAP data Easily include customer modifications
SAP HANA Live
SAP HANA PLATFORM
SAP Business Suite
SAP NetWeaver
Real-Time Business Intelligence

© 2014 SAP AG or an SAP affiliate company. All rights reserved. 39
Existing Stack
SAP HANA Live Deployment Options
Customers can add new analytics capabilities immediately without disruption to their existing landscape. Any investment today will be valid for SAP Business Suite powered by SAP HANA.
SAP Business Suite
(ERP, CRM, SCM,…)
SAP Frontend
SAP HANA
Sidecar Approach
AnyDB
SAP Business Suite
(ERP, CRM, SCM,…)
SAP Frontend
Replication
BOBJ
HTML 5
Any frontend
SAP HANA Live
Integrated Stack
BOBJ
HTML 5
Any frontend
SAP HANA
SAP HANA Live

© 2014 SAP AG or an SAP affiliate company. All rights reserved. 40
© 2014 SAP AG or an SAP affiliate company. All rights reserved.
No part of this publication may be reproduced or transmitted in any form or for any purpose without the express permission of SAP AG or an SAP affiliate company.
SAP and other SAP products and services mentioned herein as well as their respective logos are trademarks or registered trademarks of SAP AG (or an SAP affiliate company) in Germany and other countries. Please see http://global12.sap.com/corporate-en/legal/copyright/index.epx for additional trademark information and notices.
Some software products marketed by SAP AG and its distributors contain proprietary software components of other software vendors.
National product specifications may vary.
These materials are provided by SAP AG or an SAP affiliate company for informational purposes only, without representation or warranty of any kind, and SAP AG or its affiliated companies shall not be liable for errors or omissions with respect to the materials. The only warranties for SAP AG or SAP affiliate company products and services are those that are set forth in the express warranty statements accompanying such products and services, if any. Nothing herein should be construed as constituting an additional warranty.
In particular, SAP AG or its affiliated companies have no obligation to pursue any course of business outlined in this document or any related presentation, or to develop or release any functionality mentioned therein. This document, or any related presentation, and SAP AG’s or its affiliated companies’ strategy and possible future developments, products, and/or platform directions and functionality are all subject to change and may be changed by SAP AG or its affiliated companies at any time for any reason without notice. The information in this document is not a commitment, promise, or legal obligation to deliver any material, code, or functionality. All forward-looking statements are subject to various risks and uncertainties that could cause actual results to differ materially from expectations. Readers are cautioned not to place undue reliance on these forward-looking statements, which speak only as of their dates, and they should not be relied upon in making purchasing decisions.