Embed Size (px)
Citation preview

Thomas Schneider
SAP® Performance Optimization Guide
Bonn � Boston
368 Book_M.indb 3 10/4/10 12:08:24 PM

Contents at a Glance
1 Performance Management of an SAP Solution ............... 33
2 Monitoring Hardware, Databases, and SAP Basis ........... 73
3 Workload Analysis ........................................................... 151
4 Identifying Performance Problems in ABAP and Java Programs .................................................................. 201
5 Hardware Sizing and System Distribution ....................... 247
6 Workload Distribution and Interfaces ............................. 281
7 SAP GUI and Internet Connection ................................... 329
8 Memory Management ..................................................... 375
9 SAP Buffering ................................................................... 413
10 Locks ................................................................................ 455
11 Optimizing SQL Statements ............................................ 479
12 Optimizing Queries to SAP NetWeaver Business Warehouse ....................................................................... 541
13 Optimizing Search Queries Using TREX .......................... 595
A Performance Analysis Roadmaps and Checklists ............ 641
B Database Monitors, Buffers, and SQL Execution Plans .... 663
C Performance-Relevant Configuration Parameters and Key Figures ............................................................... 715
D Selected Transaction Codes ............................................. 737
E Review Questions and Answers ....................................... 741
F Glossary ........................................................................... 757
G Information Sources ........................................................ 767
368 Book_M.indb 5 10/4/10 12:08:25 PM

7
Contents
Foreword .................................................................................... 17Acknowledgments ....................................................................... 19Introduction ................................................................................. 21
1 Performance Management of an SAP Solution ........... 33
1.1 SAP Solution Architecture ............................................. 341.1.1 SAP Solutions and SAP Components ................ 341.1.2 Client/Server Architecture ................................ 38
1.2 Monitoring and Optimization Plan for an SAP Solution ... 451.2.1 Requirements of a Monitoring and
Optimization Plan ............................................ 451.2.2 Service Level Management ............................... 491.2.3 Plan for Continuous Performance Optimization ... 561.2.4 Tools and Methods for the Monitoring and
Optimization Plan ............................................ 601.2.5 SAP Solution Manager ...................................... 63
1.3 Summary ...................................................................... 69
2 Monitoring Hardware, Databases, and SAP Basis ...... 73
2.1 Basic Terms ................................................................... 742.2 Hardware Monitoring ................................................... 75
2.2.1 Analyzing a Hardware Bottleneck (CPU and Main Memory) ................................................. 77
2.2.2 Identifying Read/Write (I/O) Problems ............. 842.2.3 Other Checks with the Operating System
Monitor ........................................................... 852.2.4 Summary .......................................................... 85
2.3 Database Monitoring .................................................... 872.3.1 Analyzing the Database Buffer .......................... 902.3.2 Identifying and Analyzing Expensive SQL
Statements ....................................................... 942.3.3 Identifying Read/Write (I/O) Problems ............. 1002.3.4 Other Database Checks .................................... 101
368 Book_M.indb 7 10/4/10 12:08:25 PM

8
Contents
2.3.5 Summary .......................................................... 1082.4 Analyzing SAP Memory Configuration ........................... 109
2.4.1 Analyzing SAP Buffers ....................................... 1102.4.2 Analyzing SAP Extended Memory, SAP
Heap Memory, and SAP Roll Memory .............. 1122.4.3 Displaying Allocated Memory ........................... 1142.4.4 Other Monitors in the Memory Configuration
Monitor ........................................................... 1162.4.5 Summary .......................................................... 117
2.5 Analyzing SAP Work Processes ...................................... 1182.5.1 Work Process Overview Fields .......................... 1192.5.2 Analyzing Work Processes ................................ 1212.5.3 System-Wide Work Process Overview .............. 1252.5.4 Monitoring the Dispatcher Queue .................... 1272.5.5 Summary .......................................................... 127
2.6 Analyzing Java Virtual Machine (JVM) Memory Management and Work Processes ................................. 1292.6.1 Analyzing Garbage Collection ........................... 1292.6.2 Analyzing Work Processes ................................ 1332.6.3 Summary .......................................................... 137
2.7 Analysis of the Internet Communication Manager (ICM) ... 1382.8 Continuous Monitoring Using CCMS ............................. 139
2.8.1 Working with the Alert Monitor ....................... 1402.8.2 Arranging Monitoring Trees .............................. 1442.8.3 Arranging Automatic Alert Messaging ............. 1472.8.4 Graphical User Interface in SAP Solution
Manager .......................................................... 1472.8.5 Summary .......................................................... 148
2.9 Summary ...................................................................... 148
3 Workload Analysis ....................................................... 151
3.1 Basics of Workload Analysis and Runtime Analysis ........ 1523.1.1 ABAP Server Statistics ...................................... 1533.1.2 SAP J2EE Engine Statistics ................................ 1553.1.3 SAP Strategy for an End-to-End-Workload
and Runtime Analysis ....................................... 1563.2 Workload Monitor ........................................................ 157
3.2.1 Functions and Availability ................................. 157
368 Book_M.indb 8 10/4/10 12:08:25 PM

9
Contents
3.2.2 Working with the Workload Monitor ............... 1583.2.3 Technical Settings for the Workload Monitor .... 161
3.3 Workload Analysis ........................................................ 1613.3.1 Transaction Step Cycle ...................................... 1623.3.2 Interpreting Response Times ............................ 1653.3.3 Activity, Throughput, and Load ........................ 168
3.4 Performing Workload Analyses ...................................... 1693.4.1 Analyzing General Performance Problems ......... 1703.4.2 Analyzing Specific Performance Problems ......... 177
3.5 Application Monitor ..................................................... 1813.5.1 User Profile ...................................................... 1813.5.2 Load per SAP Application Module .................... 1823.5.3 SAP Buffer ........................................................ 183
3.6 Central Workload Monitor ............................................ 1843.7 The Java Workload Monitor in SAP Solution Manager
and the Introscope Monitor .......................................... 1893.7.1 Working with the Java Workload Monitor in
SAP Solution Manager ...................................... 1903.7.2 Working with WebView and the Wily
Introscope Workstation ................................... 1923.8 Performing Workload Analysis for the SAP J2EE Engine ... 1943.9 Summary ...................................................................... 197
4 Identifying Performance Problems in ABAP and Java Programs .............................................................. 201
4.1 Single-Record Statistics ................................................. 2014.2 Central Single-Record Statistics ..................................... 2064.3 Performance Trace ........................................................ 208
4.3.1 Activating a Performance Trace ......................... 2094.3.2 Evaluating an SQL Trace ................................... 2114.3.3 Other Tools in the SQL Trace ............................ 2154.3.4 Evaluating a Buffer Trace .................................. 2174.3.5 Evaluating an RFC Trace .................................... 2184.3.6 Evaluating an HTTP Trace ................................. 2194.3.7 Evaluating an Enqueue Trace ............................ 220
4.4 Performance Analysis with ABAP Trace (Runtime Analysis) ........................................................ 2214.4.1 Activating an ABAP Trace ................................. 222
368 Book_M.indb 9 10/4/10 12:08:25 PM

10
Contents
4.4.2 Evaluating an ABAP Trace ................................. 2234.4.3 Using Function Variations ................................. 2244.4.4 Activating the Runtime Analysis for BSP
and Web Dynpro ABAP Applications ................ 2264.4.5 Outlook: Single Transaction Analysis ................. 2274.4.6 Using Single-Transaction Analysis ...................... 228
4.5 Analyzing Memory Usage with ABAP Debugger and in the Memory Inspector .............................................. 230
4.6 Code Inspector ............................................................. 2344.7 Introscope Trace ........................................................... 2364.8 End-to-End Runtime Analysis in SAP Solution Manager ... 238
4.8.1 Activating the Runtime Analysis ....................... 2384.8.2 Displaying an End-to-End Runtime Analysis
in SAP Solution Manager .................................. 2414.9 Summary ...................................................................... 242
5 Hardware Sizing and System Distribution .................. 247
5.1 Initial Hardware Sizing .................................................. 2485.1.1 Overview of the Project for Initial Sizing ........... 2495.1.2 Implementing a Sizing Project in Detail ............ 2555.1.3 SAP Standard Application Benchmarks ............. 258
5.2 Sizing to Deal with Increased Workload, Change of Release, or Migration .................................................... 2635.2.1 Overview of a Sizing Project in the Environment
of an Installation that is Already Used .............. 2635.2.2 Implementing Sizing in the Environment of
Installations Used in Production ....................... 2655.3 Planning the System Landscape .................................... 272
5.3.1 Distribution of SAP Application Instances ......... 2735.3.2 Hardware Consolidation ................................... 2745.3.3 System and Database Consolidation ................. 276
5.4 Summary ...................................................................... 278
6 Workload Distribution and Interfaces ........................ 281
6.1 Services of the SAP NetWeaver Application Server ........ 2826.2 Load Distribution Within the ABAP Application
Instances ...................................................................... 288
368 Book_M.indb 10 10/4/10 12:08:25 PM

11
Contents
6.2.1 Distributing Message, Enqueue, and ATP Services ............................................................ 290
6.2.2 Distributing Dialog, Background, and Spool Work Processes ................................................ 290
6.2.3 Distributing Users and Work Processes over CPU Resources ......................................... 291
6.2.4 Dynamic User Distribution: Configuring Logon Groups .................................................. 294
6.2.5 Limiting Resources per User ............................. 2976.2.6 Planning Operation Modes ............................... 2986.2.7 Update ............................................................. 298
6.3 Remote Function Calls (RFCs) ....................................... 3066.3.1 Concepts .......................................................... 3066.3.2 RFC Cycle ......................................................... 3086.3.3 Configuring and Testing RFC Destinations ......... 3116.3.4 Monitoring Inbound and Outbound Loads ....... 3156.3.5 Configuring Parallel Processes with
Asynchronous RFCs .......................................... 3206.3.6 Monitoring Data Transfer with
Transactional RFCs ............................................ 3206.4 SAP Virtual Machine Container ..................................... 3226.5 Summary ...................................................................... 324
7 SAP GUI and Internet Connection ............................... 329
7.1 SAP GUI ....................................................................... 3297.1.1 Interaction Model and Measuring Performance ... 3307.1.2 Analyzing and Optimizing the Performance
of GUI Communication ..................................... 3337.2 SAP NetWeaver Application Server ............................... 338
7.2.1 Planning the Use of Web UI and the SAP GUI ... 3407.2.2 HTTP Trace in the Internet Communication
Manager .......................................................... 3417.3 Analyses on the Presentation Server .............................. 342
7.3.1 Presentation Server Trace for Web Applications ... 3437.3.2 Operating System Performance Tools ................ 3467.3.3 Continuously Monitoring Web Applications ..... 347
7.4 Internet Transaction Server ........................................... 3487.4.1 ITS Fundamentals ............................................. 348
368 Book_M.indb 11 10/4/10 12:08:25 PM

12
Contents
7.4.2 Configuring ITS ................................................. 3527.4.3 ITS Administration Tools ................................... 3567.4.4 Performing a Bottleneck Analysis for the ITS ..... 356
7.5 Business Server Pages (BSPs), Web Dynpro for ABAP, and Integrated ITS ........................................................ 3577.5.1 Fundamentals of Business Server Pages
and Web Dynpro for ABAP ............................... 3577.5.2 Fundamentals of the Integrated ITS .................. 3617.5.3 Fundamentals of ABAP Web Services ............... 3627.5.4 Implementing the Performance Analysis of
ABAP Web Services (BSPs, Web Dynpro for ABAP, and ITS Applications) ............................. 363
7.5.5 Monitoring Web Service Calls ........................... 3667.6 JavaServer Pages and Web Dynpro for Java ................... 367
7.6.1 Fundamentals of the SAP J2EE Engine, Portal, and Web Dynpro for Java ................................. 367
7.6.2 Analyzing Java Applications .............................. 3707.7 Summary ...................................................................... 370
8 Memory Management ................................................. 375
8.1 Memory Management Fundamentals ............................ 3758.1.1 Basic Terms ...................................................... 3768.1.2 SAP Roll Memory, SAP Extended Memory,
and SAP Heap Memory .................................... 3788.1.3 SAP EG Memory and SAP Paging Memory ........ 387
8.2 Configuring and Monitoring SAP Memory Areas ........... 3898.2.1 Monitoring Swap Space .................................... 3918.2.2 Address Space Restrictions (32-Bit and 64-Bit
Architecture) .................................................... 3938.2.3 Configuring and Monitoring SAP Memory
Areas ................................................................ 3998.2.4 Assistance with Troubleshooting ....................... 403
8.3 Summary ...................................................................... 409
9 SAP Buffering ............................................................... 413
9.1 Preliminary Remarks Concerning Chapters 9, 10, and 11 .......................................................................... 415
368 Book_M.indb 12 10/4/10 12:08:25 PM

13
Contents
9.2 Table Buffering Fundamentals ....................................... 4169.2.1 Buffering Types ................................................. 4169.2.2 Buffer Accessing ............................................... 4199.2.3 Buffer Synchronization ...................................... 4209.2.4 Activating Buffering .......................................... 4249.2.5 Which Tables Should Be Buffered? .................... 425
9.3 Monitoring Table Buffering on the ABAP Server ............ 4289.3.1 Table Access Statistics ...................................... 4299.3.2 Analyzing Buffered Tables ................................. 4329.3.3 Analyzing Tables that Are Currently Not
Buffered ........................................................... 4379.3.4 Detailed Table Analysis ..................................... 4399.3.5 Monitoring Buffer Synchronization (DDLOG
Entries) ............................................................ 4429.3.6 SQL Statistics and SQL Trace ............................ 443
9.4 Monitoring the Table Buffering on the SAP J2EE Engine .......................................................................... 444
9.5 Monitoring Object-Oriented Application Buffers ........... 4479.6 Summary ...................................................................... 452
10 Locks ............................................................................ 455
10.1 Database Locks and SAP Enqueues ............................... 45510.1.1 Exclusive Lock Waits ........................................ 45610.1.2 SAP Enqueues .................................................. 457
10.2 Monitoring Locks .......................................................... 45910.2.1 Exclusive Lock Waits ........................................ 45910.2.2 SAP Enqueues .................................................. 463
10.3 Number Range Buffering ............................................... 46510.3.1 Fundamentals of Number Range Buffering ........ 46510.3.2 Activating Number Range Buffering .................. 46910.3.3 Monitoring Number Range Buffering ................ 470
10.4 ATP Server .................................................................... 47110.4.1 ATP Server Fundamentals ................................. 47210.4.2 Configuring the ATP Server ............................... 47410.4.3 Monitoring the ATP Server ............................... 476
10.5 Summary ...................................................................... 477
368 Book_M.indb 13 10/4/10 12:08:25 PM

14
Contents
11 Optimizing SQL Statements ........................................ 479
11.1 Identifying and Analyzing Expensive SQL Statements .... 48011.1.1 Preliminary Analysis .......................................... 48011.1.2 Detailed Analysis .............................................. 483
11.2 Optimizing SQL Statements Through Secondary Indexes ......................................................................... 48711.2.1 Database Organization Fundamentals ............... 48711.2.2 Administration for Indexes and Table Access
Statistics ........................................................... 49811.2.3 Reorganizing Tables and Indexes ...................... 50311.2.4 Rules for Creating or Changing Secondary
Indexes ............................................................ 50511.3 Optimizing SQL Statements in the ABAP Program ......... 514
11.3.1 Rules for Efficient SQL Programming ................ 51411.3.2 Example of Optimizing an SQL Statement in
an ABAP Program ............................................. 51911.3.3 Presetting Field Values in Report Transactions ... 529
11.4 Expensive SQL Statements Due to Incorrect Buffer Settings and Administration Tools ................................. 534
11.5 Summary ...................................................................... 536
12 Optimizing Queries to SAP NetWeaver Business Warehouse ................................................................... 541
12.1 Fundamentals of SAP NetWeaver Business Warehouse ... 54212.1.1 Overview of the Most Important Concepts
in SAP NetWeaver BW ..................................... 54212.1.2 InfoCube and Extended Star Schema ................ 54612.1.3 Overview of the Options for Performance
Optimization ................................................... 55512.1.4 Overview of the SAP NetWeaver BW
Administration Tools ....................................... 55812.2 Analysis of Expensive BW Queries ................................. 56012.3 Technical Optimization Options in Detail ...................... 566
12.3.1 Managing Indexing ........................................... 56812.3.2 Settings on Data Selection ................................ 57412.3.3 Compressing the Fact Table .............................. 57512.3.4 Monitoring the OLAP Cache ............................ 576
368 Book_M.indb 14 10/4/10 12:08:25 PM

15
Contents
12.3.5 Precalculation of Reports ................................. 58012.3.6 Aggregates ....................................................... 582
12.4 Summary ...................................................................... 592
13 Optimizing Search Queries Using TREX ...................... 595
13.1 Fundamentals and Architecture of TREX Considering Performance Aspects ..................................................... 59613.1.1 Data Compression in TREX ............................... 59713.1.2 Search Techniques ............................................ 59913.1.3 Architecture of TREX ........................................ 60113.1.4 Specific Characteristics of SAP NetWeaver
BW Accelerator ................................................ 60513.1.5 Overview of TREX Administration Tools ........... 607
13.2 Implementing the Performance Analysis on TREX ......... 60913.2.1 Monitoring the Utilization of the TREX Servers ... 61013.2.2 Creating and Evaluating the Python Trace ......... 615
13.3 Technical Optimization Options in Detail ...................... 61613.3.1 Dividing Indexes ............................................... 61713.3.2 Reorganizing TREX ........................................... 61813.3.3 Using Delta Indexes .......................................... 61913.3.4 Using Master and Slave Index Servers ............... 62113.3.5 Configuring Queue Servers ............................... 62413.3.6 Distributing the Preprocessing (Configuring
the Preprocessor) ............................................. 62713.4 Indexing InfoCubes in SAP NetWeaver BW Accelerator ... 62913.5 Summary ...................................................................... 634
Appendices ........................................................................ 639
A Performance Analysis Roadmaps and Checklists ...................... 641A.1 Roadmaps ..................................................................... 641A.2 Overview of the Times in Statistics Records and
Workload Monitor ........................................................ 648A.3 Checklists ..................................................................... 650
B Database Monitors, Buffers, and SQL Execution Plans ............ 663B.1 IBM DB2 for Linux, UNIX, and Windows ...................... 665B.2 IBM DB2 for IBM i ....................................................... 670B.3 IBM DB2 for z/OS ......................................................... 674
368 Book_M.indb 15 10/4/10 12:08:26 PM

16
Contents
B.4 IBM Informix Dynamic Server ....................................... 676B.5 SAP MaxDB .................................................................. 680B.6 Oracle ........................................................................... 686B.7 Microsoft SQL Server .................................................... 686B.8 Execution Plans for SQL Statements .............................. 689B.9 Local Database Monitors and SQL Trace in the
SAP J2EE Engine ........................................................... 711C Performance-Relevant Configuration Parameters and
Key Figures ............................................................................ 715C.1 ABAP Server ................................................................. 715C.2 Internet Communication Manager ................................ 728C.3 Java Virtual Machine and SAP J2EE Engine ................... 730C.4 Java Virtual Machine Container (VMC) ......................... 731C.5 Internet Transaction Server (Integrated Version) ............ 732C.6 Internet Transaction Server (Independent Installation) ... 732C.7 Operating System ......................................................... 734C.8 Database ...................................................................... 735
D Selected Transaction Codes .................................................... 737E Review Questions and Answers .............................................. 741F Glossary ................................................................................. 757G Information Sources ............................................................... 767
Index ........................................................................................... 781
368 Book_M.indb 16 10/4/10 12:08:26 PM

281
Workload Distribution 6 and Interfaces
To achieve optimal performance, it is necessary to distribute SAP system load across the CPU resources of all available servers. This helps the CPU resources cope with demands on the system, for example, the number of users and their activities and the number of background programs. In addition to improving performance, optimizing workload distribution also protects performance-critical processes and gives these processes priority in accessing resources.
In the first section of this chapter, we’ll present the services of SAP NetWeaver Application Server and the two central services for distribut-ing requests: the message server and the SAP Web Dispatcher. The second section is dedicated to options available for distributing the load within ABAP application instances.
RFCs are used for implementing interfaces to external systems, paralleliz-ing within a system, and communicating with frontend services. After a general introduction to RFC technology, the third section of this chapter will present the options for performance optimization for the first two application areas mentioned. The next chapter then deals with frontend technologies.
This chapter concludes with a brief introduction to the Virtual Machine Container, the second SAP Java technology.
When Should You Read this Chapter?
You should read this chapter if you want detailed suggestions for opti-mizing workload distribution within the SAP system and interfaces to external systems.
368 Book_M.indb 281 10/4/10 12:09:27 PM

282
6 Workload Distribution and Interfaces
Services of the SAP NetWeaver 6.1 Application Server
An important task of an SAP system is the creation and processing of business documents such as sales orders and financial documents. There are four ways that documents are found and processed in the system:
Processing by dialog (or online) usersEE Users logged on to the SAP system create or process documents in dialog mode. An example of this type of processing is a call center, where employees take orders from customers over the telephone and enter them directly into the system. Here, the SAP system can be accessed via the SAP GUI or web browser.
Processing by background programsEE With this type of processing, documents are created or processed by programs that work without continuous communication with dialog users — hence the term background. For example, during multiple background-processing of delivery notes, all existing sales orders are analyzed, and deliveries are automatically created for these orders within the specified time. A second example of a background pro-gram is automatic salary calculation, which is based on personal master data stored in the system and time data entered by employees. Background processing, therefore, is characterized by a correspond-ing program that reads data already in the system and uses this information to create new documents — in our examples, delivery notes and pay slips.
Background input processing (batch input)EE Often, data needed for the SAP system to create documents is already in electronic form, for example, as existing files. It would make no sense for dialog users to manually reenter this data. Rather, with the SAP system, this data can be imported into the system using interface programs that run in the background. This type of processing is also referred to as batch input and is a special type of background process-ing. It is often used as a communication interface between the SAP system and external data processing systems. Take, for example, a project in which sales orders are created and saved in decentralized computers with local software. When required, these computers send
Creation and processing of business documents
368 Book_M.indb 282 10/4/10 12:09:27 PM

283
Services of the SAP NetWeaver Application Server 6.1
orders to a central office, where these files are imported into the SAP system as a batch input.
Processing using interfacesEE An SAP system can not only communicate with another IT system indirectly via files, as previously described, but there can also be direct data exchange. This takes place via remote function calls (RFCs) or Web services. RFCs and Web services can exchange data between SAP sys-tems, and between an SAP system and an external system, provided that the latter can handle the corresponding protocol. With this type of processing, an external DP system can transfer data into the SAP system and remotely execute a program there, and vice versa. With RFCs or Web services, for example, a warehouse management system can be linked to the SAP system. The SAP system creates the transfer orders for stock movements and sends this transfer order to an exter-nal system via RFC or Web services. When the warehouse management system has carried out the transfer order, it executes a transaction by RFC or Web services to inform the SAP system of the movement of goods.
Processes of the SAP NetWeaver Application Server
The SAP NetWeaver Application Server provides logical services for pro-cessing the workload mapped through operation system processes (see Figure 6.1).
These include the dispatcher and work processes of the ABAP server, which are each implemented on UNIX derivatives as separate operat-ing system processes (disp+work.exe) and on Windows operating systems through what are known as threads within a process. The work processes of the ABAP server are configured to provide one of the following ser-vices: dialog service, background service, update service, spool service, or enqueue service. In addition, the work process can also offer avail-able-to-promise (ATP) or VMC services.
The SAP J2EE Engine also provides a dispatcher process and one or mul-tiple work processes (server processes), which process the requests. They are implemented as Java processes (dispatcher.exe and server.exe) that scale internally via multiple threads.
Services on the Java side
368 Book_M.indb 283 10/4/10 12:09:27 PM

284
6 Workload Distribution and Interfaces
This is supplemented by database service processes and (optionally) by SAP liveCache and TREX.
Furthermore, additional services are available in the SAP NetWeaver Application Server that are implemented in their own operating system processes: Internet Communication Manager (ICM) service (icman.exe), message service, gateway service, and SAP Web Dispatcher service.
Figure 6.1 shows an overview of all SAP NetWeaver Application Server processes. It displays a consolidated double-stack installation in which ABAP and Java run on one instance. You can also install Java and ABAP individually; in this case, however, the respective other part is missing.
DatabaseProcess
Net
wo
rk
Net
wo
rkPres.Server SAP NetWeaver Application Server Database
Server
Web Browser
Dis
patc
her
DatabaseBuffer
Inte
rnet
Com
mun
icat
ion
Man
ager
(IC
M)
Work Process
Work Process
Work Process
ExternalITS
J2EE
D
ispa
tche
r J2EE Server
J2EE Server
J2EE Server
ITS Requests
ABAP WS Requests· BSP· Web DynproABAP
· Internal ITS· WS RT
Java WSRequests
· Portal· Web Dynpro
Java · Content
Mgmt.
Java Connector (JCo)
SAPGUI
Web
Se
rver
SAP GUI Requests
Web ServiceClient
Ext. System
Message Server
SAP
Web
Dis
patc
her
Overview of all SAP NetWeaver Application Server ProcessesFigure 6.1
Dispatch methods distribute the inbound load to all available processes; they are supposed to ensure an optimal load distribution on the system. The SAP Web Dispatcher (for Web requests) and message server (for dialog, background, and update requests) are responsible for the dis-
Operating system processes
Dispatch methods
368 Book_M.indb 284 10/4/10 12:09:28 PM

285
Services of the SAP NetWeaver Application Server 6.1
patching and the dispatcher processes of the respective Java or ABAP application instances.
Within an SAP NetWeaver Application Server, there is a message server located on one SAP NetWeaver AS computer. The message server con-trols communication between the different instances of an SAP Basis system and places free process resources on the SAP instance level. The individual application instances constantly inform the message server about their availability and current load so that the message server can carry out its work. The message server is responsible for dispatching the following request types:
Online users that have logged on via SAPEE GUI Distributed to an ABAP application instance once upon logon. By default, the message server considers the current average dialog response time for distribution. This mechanism can be influenced via configuration parameters. For more details, refer to Section 6.2.4, Dynamic User Distribution: Configuring Logon Groups.
RFC requestsEE Distributed like online users. As long as the RFC client keeps the con-nection, all other RFCs are processed on the same instance. If a client closes the connection, the next request is newly distributed.
Background requestsEE Distributed according to free background work processes.
Update requestsEE Distributed according to free update work processes. For more infor-mation, see the section on updates later in this chapter.
Web requestsEE You can also distribute Web requests via the message server. For this purpose, the browser sends a request to the SAP system’s message server. This distributes the load and sends the browser the logon address of the application server. If a user has logged on once to an application server with his browser, he remains logged on until the end of the session. This procedure is very similar to logon balancing with the SAP GUI. However, it has several disadvantages and is there-fore not recommended by SAP.
Message server
368 Book_M.indb 285 10/4/10 12:09:28 PM

286
6 Workload Distribution and Interfaces
SAP recommends distributing Web requests via the SAP Web Dispatcher. The SAP Web Dispatcher is based on the same technology as the Internet Communication Manager (ICM) but offers additional functionality. It can be installed as separate SAP software for Web dispatching.
The SAP Web Dispatcher provides the following functions:
Distribution of requests to ABAP or Java application instances, both EE
for HTTP and HTTPS requests.
Request filtering: The SAP Web Dispatcher can deny unwanted EE
requests.
Buffering of Web requests.EE
Unchangeable Web addresses: Independent of the application EE
instance’s name, the SAP Web Dispatcher ensures that users can always access the system via one address.
Security: Provided that security restrictions between the Internet and EE
SAP NetWeaver Application Server require a demilitarized zone (DMZ) that is bordered by two firewalls, the SAP Web Dispatcher runs within this DMZ.
For distributing requests, the SAP Web Dispatcher initially checks whether the request already belongs to a transactional context that can be referred to as stateful; in this case, the request is sent to the applica-tion instance on which the transaction context already exists. Then the SAP Web Dispatcher checks whether the request is intended for a Java or ABAP application instance. The SAP Web Dispatcher selects an instance from a list of available Java or ABAP application instances and sends the request to the ICM of the corresponding instance. The SAP Web Dis-patcher provides different methods for dispatching; for example, you can specify that certain URLs are only distributed to specific instances, or you can assign capacities to the instances that are considered for distribu-tion. The SAP Web Dispatcher receives information about the available ABAP and Java application instances from the message server and the individual instances. For further details, refer to Section 6.2.4, Dynamic User Distribution: Configuring Logon Groups.
The distribution concept for Web requests differs from the dialog requests from the SAP GUI. For the SAP GUI, user requests are processed without
SAP Web Dispatcher
Functions
Process
368 Book_M.indb 286 10/4/10 12:09:28 PM

287
Services of the SAP NetWeaver Application Server 6.1
any further dispatching in the application instance to which the user was assigned during logon. When Web requests are dispatched, instance processing is only ensured for one transaction for that instance; a new transaction may already be processed on another instance. Moreover, requests without transactional context, also referred to as stateless, are always newly distributed.
Java and ABAP application instances differ in their architectures, but there are also similarities. Table 6.1 presents the most important similari-ties and differences.
ABAP Application Instances J2EE Application Instances (SAP J2EE Engine)
SAP ABAP system. J2EE cluster (SAP Java system).
ABAP application instance. J2EE server (Java application instance).
ABAP work process. Work thread (Java work process).
Message server (one per system) and dispatcher (one per instance).
J2EE dispatcher (one per system).
User contexts are in the shared memory of an SAP instance; that is, users are “tied” to an instance.
User contexts are in the local memory of a J2EE server; that is, users are “tied” to a server.
SAP GUI or web browser as presentation server.
Web browser as presentation server.
Upon logon, user requests are distributed by the message server to an instance with a low load (if logon balancing is activated). Then the presentation server and the SAP instance communicate with each other.
User requests are distributed to a server by the J2EE dispatcher. If a user context already exists, then users are distributed to the same server that has that user context. The presentation server and J2EE server basically communicate with each other only via the dispatcher.
Comparison of ABAP and Java Application InstancesTable 6.1
If a request has reached the J2EE server, it is processed by one of its threads. You can configure the maximum number of threads. If this maxi-mum number has been reached, the J2EE server sends an error message; queuing (that is, the temporary storage of requests) is not possible.
Java and ABAP application instances
368 Book_M.indb 287 10/4/10 12:09:28 PM

288
6 Workload Distribution and Interfaces
The ABAP application instance, however, provides specialized work pro-cesses that enable fine-tuned control of the load and queuing of requests. The next section will deal with these methods in greater detail.
Load Distribution6.2 Within the ABAP Application Instances
The services listed in Table 6.2 exist on the ABAP application instance level. An ABAP instance can fulfill several functions, such as a message, enqueue, dialog, or server update, all at the same time.
Service Number of Processes per SAP System
Number of Processes per ABAP Application Instance
Message 1 0 or 1
Enqueue ≥1 on one ABAP instance 0 or ≥1 on one ABAP instance
Dialog ≥ 2, or equal or greater than the sum of nondialog work processes
≥2
Background ≥1 ≥0
Update (V1 and V2)
≥1 ≥0
Batch ≥1 ≥0
Spool ≥1 ≥0
Dispatcher 1 per SAP application instance
1
Gateway 1 per application server 1
Rules for the Type and Number of ABAP Application Instance ProcessesTable 6.2
The enqueue service manages SAP locks (SAP enqueues). It is provided by one ABAP instance. The instance containing the enqueue service is often called the enqueue server. On this instance (usually one, or in exceptional cases, multiple), enqueue work processes are installed. Enqueue manage-ment in Java has been available since SAP Web AS 6.30, which means the locks are centrally set via the enqueue service of the ABAP instance.
Enqueue service
368 Book_M.indb 288 10/4/10 12:09:28 PM

289
Load Distribution Within the ABAP Application Instances 6.2
With this, at least you can avoid the inconsistency problems regarding the locks in Java and ABAP. You will find further details on SAP enqueues and the ATP server in Chapter 10, Locks.
Dialog, update, background, and spool services are provided by one or sev-eral SAP work processes. These services can be distributed over several ABAP instances. If update or background processing takes place on only one SAP instance, this is referred to as a central update or background pro-cessing. If they are located on more than one SAP instance, we refer to a distributed update (or again, background processing). The service provided by each SAP work process is determined by the dispatcher of the cor-responding SAP instance. The dispatcher process coordinates the work of the other work processes and, therefore, the services they offer. Each ABAP instance has just one dispatcher. The dispatcher coordinates the work done within each ABAP instance, whereas the message server man-ages communication between the ABAP instances.
How should the SAP services be represented in a hardware landscape? In a central installation, the database instance and all SAP services (in particu-lar, message, enqueue, dialog, update, background, and spool services) are configured on a single computer. This type of installation is typically found in development, testing, and small production systems (with up to around 100 active users).
In a distributed installation, the services are distributed over several serv-ers. The following sections describe how this should be done with regard to high availability of the SAP system and performance.
The workload monitor (Transaction ST03N or ST03), the logon groups monitor (Transaction SMLG), and the work process overview (Transaction SM66 or SM50) are tools available for monitoring workload distribution. In Chapter 2, Section 2.5, Analyzing SAP Work Processes, and Chapter 3, Section 3.4.1, Analyzing General Performance Problems, you will find descriptions of the analyses that you can use to check whether or not the workload is optimally distributed over the system. If you find a bottle-neck in the workload distribution, redistributing work processes can be an effective way to solve the problem. In the following sections, you will find detailed recommendations for distributing work processes.
Dialog, update, background, spool
SAP services and hardware landscape
Monitoring tools
368 Book_M.indb 289 10/4/10 12:09:28 PM

290
6 Workload Distribution and Interfaces
Distributing Message, Enqueue, and ATP Services6.2.1
Message, enqueue, and ATP services work closely together. For perfor-mance reasons, they should always be run on the same instance. The corresponding SAP profile parameters are:
rdisp/mshostEE : <Server>
rdisp/enqnameEE : <Server>_<Instance>_<Nr>
rdisp/atp_serverEE : <Server>_<Instance>_<Nr>
From the point of view of system availability (high availability), the criti-cal points in an SAP system are the message, enqueue, and ATP services and the database instance (called single points of failure, or SPOFs). In gen-eral, these services cannot be distributed over several servers. If a server with one of these services goes down, then the entire SAP system goes down. Therefore, mainly for reasons of availability, the database and central SAP instances (with message, enqueue, and ATP services) should be operated on the same computer and should be specifically protected by a failover solution, which almost all hardware providers offer. For very large installations, however, for performance reasons you should config-ure the database and central SAP instances on separate servers.
If you use the ATP server or locking with quantity in the availability check, you should configure at least five dialog work processes on the enqueue server, even if no dialog users are working on this server. You can find more detailed information on locking with quantities and the ATP server in Chapter 10, Section 10.4, ATP Server.
Distributing Dialog, Background, and Spool Work 6.2.2 Processes
In a distributed SAP system, dialog, background, and spool services are distributed to the application server. In practice, an error is frequently made: Although the dialog work processes are configured on separate application servers, the background work processes are kept on the data-base server. The following observations explain why you should not run background work processes on the database server:
368 Book_M.indb 290 10/4/10 12:09:29 PM

291
Load Distribution Within the ABAP Application Instances 6.2
The load generated by background programs can fluctuate greatly at EE
different times, for example, because of background programs that run on particular days or at the end of the month. This may result in a temporary CPU bottleneck on the database server if several back-ground programs are started at the same time. By distributing the background work processes on the application server, you can control these high load peaks more easily.
Dialog and background load often complement each other; for exam-EE
ple, dialog workload occurs during the day, whereas background load is scheduled to run overnight. If in this situation all background work processes are configured on the central server; the application servers (on which dialog work processes are configured) remain unused at night, while at the same time, there may be a CPU bottleneck caused by parallel-running background programs on the central server.
System administrators sometimes find that background programs run EE
much faster on the database server than on the application server (sometimes reported to be only half as fast or less). However, this is not a valid argument for leaving background work processes on the database server. Rather, it points to a network problem between the database and application servers, which must be resolved. (For exam-ple, SAP Notes 72638 and 31514 describe these kinds of problems with the TCP/IP connection between SAP instances and an Oracle database.)
Distributing Users and Work Processes6.2.3 over CPU Resources
How many work processes should be configured in an SAP system, and how should they be distributed over the application servers? Two ratios are relevant here:
Number of users to number of dialog work processesEE
Number of work processes to number of processorsEE
The first ratio is calculated from the think time and the response time:
Number of users:number of dialog work processes = (think time + response time) ÷ response time
368 Book_M.indb 291 10/4/10 12:09:29 PM

292
6 Workload Distribution and Interfaces
The response time is the average time that the SAP system requires to process a user request. The think time is the time one user takes to enter data into the presentation server and interpret it; pauses by the user are included. It is difficult to provide a general rule for these activities. They depend on the user’s activities, the SAP applications and mod-ules installed, the SAP release, and the CPU type (that is, the amount of processor power installed), which all vary from one SAP system to another.
Please note that in this formula, the response time to the presentation server is included. In the workload monitor, however, we measure the response time of the application server. The difference between these is the network time needed to transfer data between the application server and the presentation server. This network time should be low: <10% of the response time of the application server.
The optimal ratio of number of work processes to number of proces-sors should be individually determined for each SAP system. There is no one valid guideline value for all SAP systems. The ratio of the number of work processesto the number of processors is determined from the response time and the CPU time:
Number of work processes:number of processors = response time ÷ CPU time
So, if we assume that the CPU time should be at least 20% (or one-fifth) of the response time, then a maximum of five work processes should be configured per CPU.
When should we configure more or fewer work processes? The argu-ment for a high number of work processes is obvious: If users have to wait in the SAP dispatcher queue for work processes, then the tempta-tion to make more work processes available is strong so that more users can work at the same time. This is the case if work processes are being blocked by wait situations, which actually incur no CPU load, for exam-ple, when work processes are running in PRIV-Mode (explained in detail in Chapter 8) or are often blocked by lock situations on the database. On the other hand, “pumping up” the number of work processes may not help much if resources are scarce at a lower level. Adding more work processes only eases the symptoms, but it generally does not resolve the performance problem.
Dispatcher wait time
368 Book_M.indb 292 10/4/10 12:09:29 PM

293
Load Distribution Within the ABAP Application Instances 6.2
Having too few SAP work processes leads to dispatcher wait times, which are indicated in the workload monitor. However, the reverse does not apply; a dispatcher wait time does not automatically mean there are too few work processes. You must first carry out a comprehensive bottleneck analysis to find out if other performance problems are blocking the work processes.
A high number of SAP work processes makes it possible to process many user requests at the same time. If the number of simultaneous processes is significantly higher than the number of processors, then this causes wait situations in the operating system queue. Because work processes receive CPU time more or less concurrently (or, to be more precise, in time slices), the number of context switches on the operating-system level increases with the number of work processes. (Note: Here we are talking about the rotation of process contexts in the processor from one SAP work process to the next. This should not be confused with SAP context switching, that is, the roll-in and roll-out of user contexts in SAP work processes.) Each context switch increases the load on the operating system by consuming processor time and memory for context informa-tion. However, waiting in the SAP dispatcher queue does not use CPU resources. Taking all of this into consideration, we can see that if all available CPU resources are in use, it is better to tolerate dispatcher wait times and allow fewer work processes, than to burden the operating sys-tem with too many work processes and the numerous context switches involved. Benchmark measurements, in fact, show that if all available CPU resources are in use, reducing the number of work processes actu-ally improves performance.
The CPU wait time is not explicitly indicated in the workload monitor. However, high CPU wait time leads to increased processing time. By comparing processing time and CPU time, you can determine if there are wait situations on the CPU. You can find a more detailed description in Chapter 3, Section 3.3, Workload Analysis.
Other situations that suggest reducing the ratio of work processes to CPU processors include the following:
In contrast to UNIX, with Windows, the context switch puts consider-EE
able load on the operating system. Therefore (and particularly for
CPU wait time
368 Book_M.indb 293 10/4/10 12:09:29 PM

294
6 Workload Distribution and Interfaces
Windows NT), we recommend having a small number of work pro-cesses per CPU processor. (See also SAP Note 68544.)
Reducing the number of work processes also reduces the number of EE
database processes and the need for main memory. This is of particu-lar advantage for databases in which each SAP work process has only one database process assigned to it.
Therefore, you should only increase the number of SAP work processes if neither the CPU nor the server memory are being fully utilized. If a CPU or main memory bottleneck already exists, as well as high processing time on an application server, reducing the number of work processes can improve performance.
Dynamic User Distribution:6.2.4 Configuring Logon Groups
Logon groups are used to dynamically distribute the load being pro-cessed by the dialog work processes. These include:
Online requests via SAP GUI (dialog request)EE
Online Web requests that are directly intended for the ABAP part of EE
the SAP NetWeaver AS (HTTP and HTTPS requests)
Online Web requests that are first processed by the external ITS or the EE
SAP J2EE Engine, and in turn log on to the ABAP server via RFC to implement the business logic
RFC request of external systems (RFC load that is internally generated EE
in the system and not controlled via logon groups)
Previously in this chapter, we discussed the difference between user dis-tribution in the SAP GUI and Web logons. Once a user has logged on to an SAP system via the SAP GUI, he works on a particular ABAP instance until logging off. There is no feature to enable a dynamic, load-related switch to another ABAP instance during a user session. Only by logging off and logging on again can the user switch the application instance in the SAP GUI. When you log on via a web browser, each request is freshly distributed, whereas requests belonging to a transaction are re-sent to the same instance.
368 Book_M.indb 294 10/4/10 12:09:29 PM

295
Load Distribution Within the ABAP Application Instances 6.2
To achieve a dynamic distribution of dialog users on the ABAP instances, you can set up logon groups (or work groups), to which one or more ABAP instances can be allocated. The user chooses a particular logon group when logging on to the SAP system, or a Web request is dis-tributed via these groups. From among the allocated SAP instances, the system automatically selects the one with the best performance statistics or the least users.
Use the following transaction to set logon groups (Transaction SMLG): Tools • CCMS • Configuration • Logon groups. Additional informa-tion on this transaction is available in SAP Online Help.
The simplest variant is to set one logon group over all SAP instances, thereby achieving a uniform distribution of users. Alternatively, users can be distributed according to the following criteria:
Logon groups according to SAP applicationEE You can set logon groups such as FI/CO, HR, SD/MM, and so on. The advantage of this method is that, for example, only the programs of the assigned SAP applications are loaded in the program buffer of a particular instance. As a result, the program buffer requires less mem-ory, and this helps avoid displacements.
Logon groups according to language, country, or company divi-EE
sion If you operate an SAP system for several countries or languages, you can set up the logon groups accordingly, for example, Austria, Poland, and Czech Republic. This way, only text and data relating to the spe-cific country are loaded into the buffers of the corresponding SAP instances, and less memory is required for the table buffer.
Logon groups for certain user groupsEE You can set up a special logon group for, say, employees in telesales, because their work is particularly performance-critical. The corre-sponding SAP instances should operate with a particularly high level of performance (for example, with no background or update work processes, few users per server, very fast processors, or a dedicated network). Another example of a user-specific logon group is one for employees in controlling, who draw up time-consuming reports in dialog mode. For this group, you should assign an SAP instance for
368 Book_M.indb 295 10/4/10 12:09:30 PM

296
6 Workload Distribution and Interfaces
which the SAP profile parameter rdisp/max_wprun_time (which limits the runtime of an ABAP program in dialog mode) is set particularly high. In addition, setting a low value for this parameter on all other instances means these lengthy reports will not be run on those instances, where they could cause performance problems for other users. In this way, you can separate performance-critical applications (such as order entry in telesales) from less critical (albeit resource-intensive) applications such as controlling.
Logon groups for SAP Internet Transaction Server or for the SAP EE
J2EE Engine SAP ITS or the SAP J2EE Engine can be logged on to the application level using either a dedicated SAP application instance (with data on the application server and the instance number) or with a logon group (data on the message server and a logon group). For optimal availabil-ity and workload distribution, you should use a logon group. It makes sense to set up a separate logon group for logons via SAP ITS or the SAP J2EE Engine.
Logon groups for theEE SAP Web Dispatcher You can set up one or more logon groups that the SAP Web Dispatcher can use for direct ABAP Web service requests. If you don’t configure logon groups for the SAP Web Dispatcher, the load is distributed to all ABAP instances on which ICM is configured. You can also determine that certain groups of requests are distributed to dedicated logon groups based on their URLs.
Logon groups for ALE/RFCEE Asynchronous RFCs (aRFCs) are used to run applications in parallel. If the degree of parallelizing is not limited, however, it can result in a snowballing of RFCs, which can bring the application level to a stand-still for the user (all work processes are busy). To avoid these situations, it is useful to define specific SAP instances with a special logon group for incoming RFC load, so work processes for RFCs are kept separate from work processes for online users, and users are not restricted in their work.
When setting up logon groups, you should bear the following guidelines in mind:
Guidelines
368 Book_M.indb 296 10/4/10 12:09:30 PM

297
Load Distribution Within the ABAP Application Instances 6.2
After assigning instances to logon groups, check to see if the instances EE
are evenly distributed or if any group has too many or too few resources assigned to it.
If there are temporary load peaks, for example, increased activity in EE
the FI/CO group toward the end of the month or financial year, bot-tlenecks might occur on the corresponding instances. On the other hand, this can be useful for ensuring that resources will be available for other users such as those in telesales.
If an application server hangs, or if you temporarily disconnect an EE
application server, the users must be redistributed.
Bearing all of the above in mind, at least two SAP instances should be EE
assigned to each logon group.
To sum up, setting up logon groups involves extra administration and monitoring work. You should therefore not set up unnecessarily large numbers of logon groups.
Limiting Resources per User6.2.5
Using SAP profile parameters, you can limit the resources available to users on the SAP application instances. These include:
Automatic logoff of inactive users. The time after which an inactive EE
user is logged off should be at least one to two hours; otherwise the frequent logging on can, itself, generate unnecessary load.
Limiting the runtime of programs. This should not be less than the EE
default value of 300 seconds; it should also be possible to execute longer-running programs on some instances.
Apportioning memory consumption. A more detailed description can EE
be found in Chapter 8, Memory Management. If you want to put strict limits on memory use for some instances, configure individual instances so that programs with a high memory use can also be fin-ished on them.
Limiting multiple logons and the use of parallel sessions. Normally, EE
this should not be done.
368 Book_M.indb 297 10/4/10 12:09:30 PM

298
6 Workload Distribution and Interfaces
You will find profile parameters for entering the corresponding settings in Appendix C.
The resources available to users should only be limited to a useful extent. The main focus of your work should be on optimizing programs, tuning instances, and training users in the correct use of programs. An intense limiting of resources obstructs users’ work and is often perceived by them as spoon-feeding, which can lead to user dissatisfaction.
Planning Operation Modes6.2.6
The demands made on an SAP system vary over the course of 24 hours. During the day, for example, many dialog users are working with the sys-tem, whereas the demands made on the system by background programs usually increase at night. To adapt the number of SAP work processes to changing demands, the SAP system allows you to define different opera-tion modes for daytime and nighttime operation. A certain number and type of work processes are assigned to an operation mode. The SAP sys-tem automatically adjusts the operation mode according to the time.
You can define operation modes using the following transaction: Tools • CCMS • Configuration • OP modes and servers. You can set the times for changing the operation mode by using the following transaction: Tools • CCMS • Configuration • OP modes timetable.
You can find more detailed information on setting and monitoring opera-tion modes in SAP Online Help.
Update6.2.7
If you need to make changes to a database table in an SAP transaction, they are first collected in the main memory, and when the transaction is completed, they are bundled and asynchronously updated. Figure 6.2 shows the steps involved in an update.
In our example, the characteristics of a material need to be changed. For this, a change is necessary in the table MARA, among other things. In the dialog part of the transaction, however, the MARA table is not directly changed in the database; rather, the information to change is temporarily stored in special database tables known as update tables. This
368 Book_M.indb 298 10/4/10 12:09:30 PM

299
Load Distribution Within the ABAP Application Instances 6.2
is shown in Figure 6.2, step 1, which shows an Insert operation (Insert) in the update table VBMOD and represents other update tables, such as VBHDR and VBDATA. On completion of the dialog part of the transac-tion, the dialog work process selects an application server with update work processes and sends a message to the message server (2). This in turn forwards the update request to the corresponding dispatcher of the application server (3). The latter allocates the request to an update work process (4). The update work process reads the information from the update tables (Select in step 5) and finally changes the application table with an update operation — the MARA table in Figure 6.2 (Update in step 6). This process is known as an asynchronous update.
MS
Dispatcher
DIA DIAUPD UPD
VBMOD...MARA
Database
1Ins Se
l Upd
2
3
4
5
6
SAP Instance A SAP Instance B
Dispatcher
Update Step Cycle (Figure 6.2 DIA, dialog work process; UPD, update work process; MS, message service)
In an SQL trace, you can identify the end of a transaction’s dialog part with the help of Insert statements on the VBMOD, VBHDR, and VBDATA tables. The start of an update step is indicated by Select state-ments on this table.
Monitoring Update Requests
If update processing is terminated (status Err), you must manually restart or delete the request. If you cannot start the processing of an update request, for example, because the update process was deactivated or
368 Book_M.indb 299 10/4/10 12:09:30 PM

300
6 Workload Distribution and Interfaces
because of an error, there is no application server with update work processes; the request status remains as Init. If the SAP profile param-eter rdisp/vbstart is set to the default of 1 (one) when the SAP system is restarted, the update request will be tried again. Each application instance only updates the update requests that were assigned to it when it stopped. If rdisp/vbstart < > 1 or if the repeat fails to update the request, you must manually restart or delete the update.
Interrupted or unexecuted updates lead to a situation where documents entered or changed by users are not saved in the corresponding applica-tion table and are therefore “nonexistent” for the user. The daily check of updating tasks is therefore an important task for the SAP system admin-istrator. If interrupted updates are not investigated immediately, there is little chance of finding the cause of the error after a few days have passed.
A monitor is available for controlling update records via Tools • Admin-istration • Monitor • Update. Alternatively, you can enter Transaction SM13.
If an update request is correctly completed, the corresponding entries in the update tables are deleted. The update tables should therefore be empty (including erroneous requests and requests currently being pro-cessed). If the update tables grow considerably because of erroneous, incorrectly processed requests, this will soon lead to massive perfor-mance problems.
The update tables VBMOD, VBHDR, and VBDATA are among the most frequently modified tables in the SAP system. If bottlenecks arise with hard drive access to these tables, it may be helpful to partition or distrib-ute these tables over several hard drives. For some database systems, it can be useful to change the order of the key fields in these tables. How-ever, this should only be carried out by a specialist with knowledge of database and SAP tuning or based on recommendations from SAP. You can find further information in the documentation on the SAP profile parameter rdisp/vb_key_comp or in SAP Notes on this parameter.
VBMOD, VBHDR, VBDATA
368 Book_M.indb 300 10/4/10 12:09:31 PM

301
Load Distribution Within the ABAP Application Instances 6.2
Distributing Update Work Processes
In small SAP installations, the update work processes, along with database instances and message, enqueue, and ATP services, are all configured on a single machine. In medium and large SAP installations, updates should not be configured centrally on the database server. There is some debate as to whether or not a central update server should be set up in this case (an SAP instance dedicated solely to updates) or if the update tasks should be distributed symmetrically over all application servers. Here are some good reasons why you should use a distributed arrangement:
The failure of a central update server would cause system activity to EE
come to a standstill. With distributed update work processes, this problem would not occur.
A symmetrical configuration of application servers enables you to add EE
or remove application servers to or from the SAP system without needing to readjust the workload distribution.
Distributed update work processes can handle temporary load peaks EE
better than a single server.
Therefore, for a large SAP installation, there are good arguments for distributing not only background work processes, but also update work processes equally over the application servers.
You activate the dispatching of update requests by setting the SAP pro-file parameter rdisp/vb_dispatching to 1 (one) in the default profile. The SAP system ensures that all instances receive update requests that are proportional to the number of update work processes configured on them. This normally guarantees a balanced workload distribution. However, the system does not actually check the load distribution. If, for example, an SAP instance has only one update work process, which entails a very long-running update request, the dialog work process con-tinues to send update requests to this instance despite the free update work processes available on other instances. We recommend, therefore, that you never configure just one update work process on an instance. You should configure at least two.
As described here, update dispatching is the standard solution for all applications. Only in special cases and with the specific recommendation
Dispatching update requests
368 Book_M.indb 301 10/4/10 12:09:31 PM

302
6 Workload Distribution and Interfaces
of SAP should you use the local update method or update multiplexing, which we do not explain in this book.
As a rule of thumb, you can configure update work processes at a ratio of 1 to 4 for dialog work processes, based on the total of all SAP instances.
Selecting Types of Update
To enable the prioritization of update requests (and in so doing, distri-bution of workload over time), there are different types of updates. We differentiate between the asynchronous V1, V2, and V3 updates and the synchronous and local updates. In general, SAP sets the update type when your software is delivered. You only have to decide on the update type yourself in certain individual cases and or when there are customer developments.
To enable you to distribute or prioritize update requests, the update function modules are classified as V1, V2, and V3. A V1 update is the “normal” type of update, as was previously described.
V2 function modules differ from the V1 type in two aspects: First, they are processed without enqueue locks (for more information on locks, see Chapter 10, Locks), and second, they are given lower priority. The fol-lowing rules apply for priority decisions between V1 and V2 updates:
The standard update work processes (task type Upd) process V1 mod-EE
ules with complete priority, which means no V2 module will be processed as long as there are V1 modules waiting to be processed (if V2 update work processes have been configured).
This workload distribution rule can mean that in extreme situations, EE
absolutely no V2 functions are being processed. This obstructs V2-type update work processes, which are processed as V2 functions. To ensure that V2 functions are also processed during times of high workload, you should also always configure V2 update work pro-cesses. As a rule, allow a ratio of one V2 update work process for every four V1 update processes.
Modules that are absolutely necessary for operation are classified as V1. Modules can be classified as V2 if they can be processed during times of
V1, V2, and V3 updates
368 Book_M.indb 302 10/4/10 12:09:31 PM

303
Load Distribution Within the ABAP Application Instances 6.2
lower workload and without the protection of enqueue locks (such as updating statistics).
Interfaces for the maintenance of statistic systems, such as the SAP Logis-tics Information System (LIS), are generally carried out by V2 function modules (however, in customizing , you can select between V1, V2, and V3).
V3 function modules are also processed without enqueue locks. As with V1 and V2 modules, at the end of the dialog part of the trans-action, entries are written to the update tables; however, the update is not started. The update requests remain in the update tables until a background job explicitly processes them. This background job is appli-cation-specific. It may contain its own application logic, which could be, for example, to accumulate update requests in the main memory and only write the prepared data to the database afterward. For tables with frequently changing values, this can mean a considerable reduction in database changes. The information about whether a business processes can be updated in V3 can be found in the corresponding documentation or in customizing.
With V3 updates, you can separate the update workload from the dialog workload when it comes to processing time, by starting updates dur-ing times of low dialog activity. Yet, because no locks are held with V3 updates, their use is limited. One case where V3 updates can be used is in maintaining the SAP NetWeaver Business Warehouse interface.
You can see the update type in the Function Builder (Transaction SE37) on the Attributes screen. Under Processing type • Update module, the entry Start Immediately or Immediate Start, No Restart (or: V1 update), Start Delayed (V2) or Collective Run (V3) is activated. A change to this characteristic is considered an object modification.
As previously described, updates in update work processes are usually asynchronous, which means the dialog work process does not wait until the update task has concluded its work. Rather, once the data has been temporarily stored in the update tables, the users are informed that the transaction has been completed so that they can continue with their work, although the update task is still running. However, synchronous updating is also possible; here, the dialog work process waits for the
Synchronous update
368 Book_M.indb 303 10/4/10 12:09:31 PM

304
6 Workload Distribution and Interfaces
update work to finish. (In the work process monitor, Transaction SM50 or SM66, this situation is displayed with the status Stopped and reason Upd). Synchronous updating is activated with the AND WAIT clause for the ABAP statement COMMIT WORK.
However, synchronous updating has hardly any advantages and is there-fore practically never used. Rather, in cases where immediate updating is necessary, local updating is used, as described below.
The third type of updating is to carry out the update directly in the dia-log or background work process, which means no update work process is enlisted. This method is known as local update. With this method, the update data is not stored in update tables in the database; rather, it is stored in the main memory of the application server. The update is executed directly after completion of the dialog part of the transaction in the dialog work process (or in the background work process if it is a background process). Local updating is activated in the program using the ABAP statement SET UPDATE TASK LOCAL.
What are the advantages of local updates? The concept behind asynchro-nous updates is that the total response time for processing a transaction is divided into a dialog response time (which the user sees directly) and an update time (which runs without the user being aware of it). To achieve this, additional work is involved, that is, writing and reading the update tables. With local updates, both parts of the transaction occur one after the other, but the additional work of writing to the update tables is avoided. Local updates are mainly used for background pro-cesses with mass updates and for interface programming with massive parallel asynchronous RFCs. In both cases, the advantage lies in the fact that entries do not have to be written to the update table. This is pre-ferred with mass updates because bottlenecks can occur in I/O channels to the update tables. Furthermore, the updates are started immediately, and as a result, they are not affected by potential overloading of the update work processes.
Table 6.3 provides an overview of update types and their most important properties.
Local update
368 Book_M.indb 304 10/4/10 12:09:31 PM

305
Load Distribution Within the ABAP Application Instances 6.2
Update Type Method With Enqueue
Advantages Limitations Example of Use
Asynchronous V1 Asynchronous in update WP
Yes Standard
Asynchronous V2 Asynchronous in V2 update WP
No Prioritizing, because V2 WPs are configured
No locks Statistical data (can be selected for LIS interfaces)
Asynchronous V3 Started by background job, then asynchronous in V2 update WP
No Prioritizing, because V2 WPs are configured; load distributed over time because of update planning; performance advantage because of accumulation of changes in background program
No locks Statistical data (can be selected for LIS interfaces, standard for BW interfaces)
Synchronous Synchronous in update WP (dialog or background WP stops)
Yes Reliable confirmation to user
Longer dialog response time
None
Local Directly in dialog or background WP
Yes Reliable confirmation to user; no entries in VB tables, resulting in lower database workload
Longer dialog response time
Background processing, tRFC, and qRFC processing
Abbreviations: WP, work process; LIS, SAP Logistics Information System; BW, SAP NetWeaver Business Warehouse
Overview of Update TypesTable 6.3
368 Book_M.indb 305 10/4/10 12:09:31 PM

306
6 Workload Distribution and Interfaces
Remote Function Calls (RFCs)6.3
Remote function calls (RFCs) allows one program to execute another program remotely, that is, from a different location.
Concepts6.3.1
RFCs are used for the following purposes:
Communication between different systems, such as between two SAP EE
systems or between an SAP system and an external system.
Within an SAP system:EE
Communication between application instances or between the EE
application level and the presentation level (GUI communication).
EE Parallelizing processes: Because one program after another can start several RFCs asynchronously without waiting for processing to fin-ish, RFCs are used to parallelize processes and dynamically distribute workload over the different servers within an SAP system.
With RFCs, SAP systems (for instance, SAP ERP, SAP APO, and SAP NetWeaver BW) of different versions can be linked, or SAP systems can be linked with external systems, for example, an SAP ERP system with an external warehouse management system, where the SAP ERP system creates the transfer orders for stock movements and sends them to an external system via RFC. When the warehouse management system has carried out a transfer order, it executes a transaction using RFC to inform the SAP ERP system of the movement of goods.
How the business processes of an enterprise are distributed over dif-ferent SAP components is of critical importance for the subsequent administration of the system. An advantage of a distributed, linked sys-tem landscape is that the individual parts of the system can be handled more flexibly in all contexts (for example, build, upgrade, administra-tion, organization, and so on). With interfaces, which have to be built and operated, the total expense for building and administration (and hardware requirements) is greater than in a large, integrated system.
With RFCs, the system can be linked in two ways. We differentiate between types of coupling:
Parallelization
Coupling types
368 Book_M.indb 306 10/4/10 12:09:31 PM

307
Remote Function Calls (RFCs) 6.3
Hard couplingEE , in which one system relies on the partner system being available. If communication is interrupted, for example, as the result of a network malfunction or because the partner system is not work-ing, the other system can continue working. However, the functions that use the RFCs will be terminated with an error.
Soft couplingEE does not require this reciprocal availability of the sys-tems. Rather, the systems exchange data periodically. If one system is temporarily unavailable, the other system can continue to work with-out any problems. An example of soft coupling is ALE (application link enabling) coupling.
The process that starts the RFC is called the sender or client, and the process in which the RFC is executed is the recipient or server. We dif-ferentiate between four types of RFCs: synchronous, asynchronous, transactional, and queued.
A EE synchronous RFC is characterized by the sender waiting while the RFC runs in the recipient process.
With an EE asynchronous RFC, the sender does not wait until the RFC recipient process has been completed. Rather, when the RFC has started, the sender can continue working. Therefore, a sender can start several asynchronous RFCs at the same time. (With a synchro-nous call, on the other hand, only one RFC can run at a time, because the sender has to wait until processing has finished.)
A EE transactional RFC is an asynchronous RFC that runs under special security conditions. We’ll discuss details on this later in this chapter.
A EE queued RFC (qRFC) is a transactional RFC for which the processing sequence in the destination system complies with the call sequence in the source system (for all qRFCs in a particular queue).
You can recognize an RFC in an ABAP program by the syntax CALL FUNC-TION <function name> DESTINATION <connection name> .... The variable <connection name> contains the name of the RFC connection, also called the destination.
If the function call contains the clause STARTING NEW TASK, it is an asyn-chronous RFC; the clause IN BACKGROUND TASK indicates a transactional RFC. If the call only contains the clause DESTINATION, but neither START-
RFC types
ABAP coding
368 Book_M.indb 307 10/4/10 12:09:31 PM
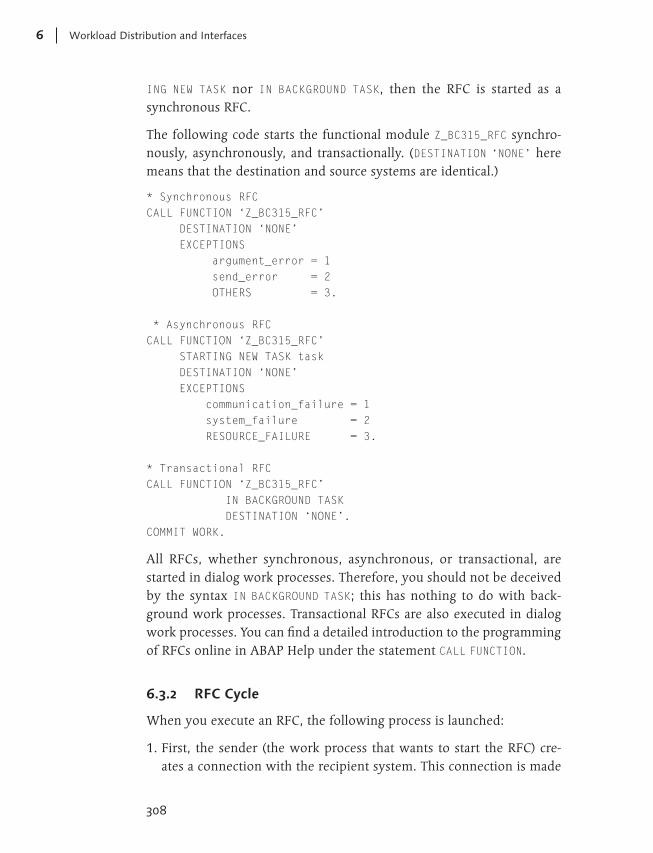
308
6 Workload Distribution and Interfaces
ING NEW TASK nor IN BACKGROUND TASK, then the RFC is started as a synchronous RFC.
The following code starts the functional module Z_BC315_RFC synchro-nously, asynchronously, and transactionally. (DESTINATION ‘NONE’ here means that the destination and source systems are identical.)
* Synchronous RFC CALL FUNCTION ‘Z_BC315_RFC’ DESTINATION ‘NONE’ EXCEPTIONS argument_error = 1 send_error = 2 OTHERS = 3. * Asynchronous RFC CALL FUNCTION ‘Z_BC315_RFC’ STARTING NEW TASK task DESTINATION ‘NONE’ EXCEPTIONS communication_failure = 1 system_failure = 2 RESOURCE_FAILURE = 3. * Transactional RFC CALL FUNCTION ‘Z_BC315_RFC’ IN BACKGROUND TASK DESTINATION ‘NONE’. COMMIT WORK.
All RFCs, whether synchronous, asynchronous, or transactional, are started in dialog work processes. Therefore, you should not be deceived by the syntax IN BACKGROUND TASK; this has nothing to do with back-ground work processes. Transactional RFCs are also executed in dialog work processes. You can find a detailed introduction to the programming of RFCs online in ABAP Help under the statement CALL FUNCTION.
RFC Cycle6.3.2
When you execute an RFC, the following process is launched:
First, the sender (the work process that wants to start the RFC1. ) cre-ates a connection with the recipient system. This connection is made
368 Book_M.indb 308 10/4/10 12:09:32 PM
309
Remote Function Calls (RFCs) 6.3
using the gateway services of the two systems involved (initializing phase). The dispatcher on the recipient system looks for a free dialog work process that can execute the RFC. In the work process overview (Transaction SM50 or SM66), the sender work process is in Stopped status during this time, with CPIC as the reason. The Action/Reason for waiting column shows the entry CMINIT.
When the connection between the sender work process and the recip-2. ient work process has been set up, the data necessary for executing the RFC is transferred. Now, in the work process overview for both the sender work process and the recipient work process, the status Stopped is displayed, with CPIC as the reason, and Action/Reason for Waiting is CMSEND. After the entry CMSEND, there is a number. This is known as the communication ID.
After this point, synchronous and asynchronous RFCs are treated dif-3. ferently. Once all necessary data has been transferred, and the RFC has been started on the recipient side, with asynchronous RFCs the connection is broken, and the program on the sender side continues working without waiting for the end of the RFC. This type of process-ing means, for example, that another RFC can now be started, which will then run parallel to the first.
With synchronous RFCs, the sender side waits until the RFC has 4. finished processing. During the wait time, the user context on the sender side is rolled out of the work process so that it is available to other users. In the work process overview on the sender side, there is nothing to be seen of the running RFC and the waiting program. On the sender side, the waiting program can only be seen as a session in the user monitor (Transaction SM04) and as an open communica-tion connection in the gateway monitor (Transaction SMGW). On the recipient side, the running RFC creates a status entry of Running in the work process overview. In the user monitor (Transaction SM04), the incoming RFC can be identified by the terminal entry APPC-TM. Beginning with SAP Basis 4.6, there is a special column in the user monitor for user type (Type). For an RFC connection, you will see the entry RFC.
Once the recipient side has closed the processing of the synchronous 5. RFC, the waiting context on the sender side has to be “awakened,”
368 Book_M.indb 309 10/4/10 12:09:32 PM

310
6 Workload Distribution and Interfaces
that is, rolled in to a work process. During the subsequent data trans-fer from recipient to sender, in the work process overview, both work processes display the status Stopped, with CPIC as the reason and CMRECEIVE as Action/Reason for Waiting.
Finally, the connection is closed. The recipient work process is free 6. again, and the sender work process continues with its work.
In this procedure, creating the connection (the CMINIT phase) should only take a few milliseconds. If you find this status often in the work process overview, there may be an overload in the recipient system. (We’ll cover further details on this in the next section.) The duration of the CMSEND and CMRECEIVE phases depends mainly on the amount of data to be transferred and the speed of the network. No time data can be given for these phases.
Figure 6.3 illustrates the course and measured times of a synchronous RFC, which are displayed in the single-record statistics (Transaction STAD or STAT), and in the workload monitor (Transaction ST03 or ST03N).
Processing Time (1)
Wait Time, Roll-In Time, Load Time
Processing Time (2)
Response Time
Roll-Out Time
Roll-In Time
Roll Wait Time
RFC Start
RFC Time
RFC End
Program Rolls Out After RFC is Started
CPI/C Communication
= Program not in Work Process
Presentation Application Database
Net
wor
k
Net
wor
k
Net
wor
kExternal System
Transaction Step Cycle with Synchronous RFC and the Times MeasuredFigure 6.3
Duration
368 Book_M.indb 310 10/4/10 12:09:32 PM
311
Remote Function Calls (RFCs) 6.3
While the sending program is waiting for the response to the synchro-nous RFC, the user context is rolled out of the work process to make it available for other users. When the RFC has ended in the recipient system, there is a roll-in to a work process, and the transaction step is continued. During an RFC call, the response time for the calling program is still growing. In an analysis of the lost time (see Chapter 3, Section 3.3, Workload Analysis) the roll wait time has to be subtracted from the total response time, because during this time, the calling system does not require any CPU resources. In a single statistical record for a transaction step with a synchronous RFC, a roll wait time is also listed. (However, for very short RFCs with a response time of less than 500 ms, there is no roll-out.) You will find no roll wait time for an asynchronous RFC, because the program is not rolled out; rather, it continues working.
The total time for the RFC appears in the RFC+CPIC Time field of the single statistical record and the workload monitor. For asynchronous RFCs, this includes phases 1 to 3 of the previous list. As a rule of thumb, the RFC time here should not be longer than 50 ms per call. For synchro-nous RFCs, the RFC time includes phases 1 to 6. It is clear that the RFC time here must be greater than the roll wait time.
Configuring and Testing RFC Destinations6.3.3
RFC connections (also called destinations) can be set in the transaction Display and Maintenance of RFC Destinations (Transaction SM59). You can access this transaction via the menu path Tools • Administration • Administration • Network • RFC Destinations.
In this transaction, all available RFC destinations are first presented in a tree structure. Table 6.4 describes the four possible types of RFC destinations.
Double-click a destination to select it, and you are taken to a screen with details on that destination. The layout of this screen will differ according to the destination type. Figure 6.4 shows one example.
Roll wait time
RFC time
Setting up destinations
368 Book_M.indb 311 10/4/10 12:09:32 PM

312
6 Workload Distribution and Interfaces
Destination Type Description
Internal destination
RFC connections to all SAP application instances are on the same SAP system. These connections are automatically generated when you install the SAP system in the form <server name>_<SAP system name>_<instance number>. Here, you will also fi nd the destination NONE, which always indicates the current instance.
R/3 destinations RFC connections are to other SAP systems, such as connections in the form TMSADM@<System 1>DOMAIN_<System 2>. These are needed by the Transport Management System (TMS) and are generated during the build.
TCP/IP destinations
These are connections to non-SAP systems. Many standard destinations are already preconfi gured here.
Destinations via ABAP drivers
Not of interest here.
RFC Destination TypesTable 6.4
Confi guration of an External RFC Connection (Transaction SM59Figure 6.4 )
368 Book_M.indb 312 10/4/10 12:09:33 PM

313
Remote Function Calls (RFCs) 6.3
In addition to details on the configuration of the RFC destination, in the list of buttons, you will find the function Test Connection. Execute this function now if you anticipate problems with a connection. It logs on to the recipient system and transfers some test data. Then it shows the response time for the data transfer or an error message if the logon was not successful.
The response time for the transfer of test data depends on the network used. Ideally, the response time should be between 10 and 100 millisec-onds. If you execute the connection test at times of both high and low system load, you can determine whether the connection has a capacity overload when there is high workload.
High response times can be due to three things:
The network connection is generally slow or overloaded.EE
The recipient system is physically overloaded.EE
Too few processes are configured in the recipient system to receive EE
RFCs.
Table 6.5 provides a list of possible sources of problems when setting up connections.
Destination Type
Connection Test Result
Measures To Be Taken
R/3 Error message “TCP/IP Timeout”
The recipient system cannot be contacted. Check the availability of the recipient system and the network connection.
High response times (>100 ms) for a connection to an SAP system
Check the network connection to the external system EE
with the help of the ping command or using the net-work provider’s tools. Optimal ping response times are within hundredths of a second.
Log on and performance-test the recipient system. EE
Are all work processes busy?
TCP/IP Error message “Partner program not registered”
Begin the corresponding recipient process.
Sources of Problems When Setting Up ConnectionsTable 6.5
Testing
Response time
368 Book_M.indb 313 10/4/10 12:09:33 PM

314
6 Workload Distribution and Interfaces
Destination Type
Connection Test Result
Measures To Be Taken
Error message “TCP/IP Timeout”
Check the network connection between the SAP gateway process in question and the other side. If the gateway needs to be maintained, view information on it by clicking the Gateway button. If this is not the case, the local gateway of the SAP application server will always be used. If you still want to change subsequent gateway settings, do so via the menu Destination • Gateway options. (This is always done on both sides.)
High response times (>100 ms) for a connection to an external system
Check the network connection to the external system EE
with the help of the ping command or using the net-work provider’s tools. Optimal ping response times are within hundredths of a second.
Check to see how many parallel recipient processes EE
are started on the other side to receive the IDocs. If high load develops on the recipient side, it can be useful to increase the number of processes.
Please refer to SAP Notes 63930 and 44844 on RFC EE
connections with SAP Gateway registration.
Table 6.5 Sources of Problems When Setting Up Connections (Cont.)
Depending on the recipient system, you can configure different param-eters for the connection. If the recipient is an SAP system, first decide if logon should be done via logon groups or directly via a set application server. You can make this choice by setting the Load Distribution option. If the load distribution is activated, the message server and the corre-sponding logon group have to be reported to the recipient system. If the connection is made without load distribution, the data on the applica-tion server (Target Machine field) and instance number (System Number field) are requested.
You should log on using a logon group. This procedure has two advan-tages over direct logon to a dedicated application server:
Several application servers can be assigned to a logon group. If one EE
server is down, another server can process the incoming RFCs (high availability aspect).
SAP system as recipient
368 Book_M.indb 314 10/4/10 12:09:33 PM
315
Remote Function Calls (RFCs) 6.3
There is logon balancing; that is, the workload is distributed among EE
the instances, which averts a capacity overload (performance optimi-zation aspect).
You can continuously monitor the availability of important RFC con-nections with the central CCMS monitor (Transaction RZ20). For more detailed information on how to activate this monitoring, see the docu-ment “Monitoring RFC Destinations and Services,” which you will find in the SAP Service Marketplace under System Monitoring and Alert Management, Media Library.
Monitoring Inbound6.3.4 and Outbound Loads
You can monitor the inbound and outbound workloads created by RFCs in the RFC profile in the workload monitor. You will find this in SAP Basis 4.6 (from Basis support package 22) in the new workload monitor (Transaction ST03N) or in the old workload monitor (Transaction ST03) by following the menu path Goto • Profiles • RFC profile.
The profiles under the menu options Clients and Client Destinations correspond to the outbound RFCs (the local system is the sender or cli-ent). Under Server or Server Destinations, you can see the load created by inbound RFCs (the local system is the recipient or server). Tables 6.6, 6.7, and 6.8 show the different RFC profiles (Client Destinations, Server Destinations, Clients, and Server) of the performance indicators and the different views specified in the RFC profiles.
Profile Description
Client Destinations and Server Destinations
The single-record statistics write total statistics records to each transaction step, with data on everything that has been executed for each RFC destination. In these profiles, you will find the total workload generated by RFCs.
Warning: Data on the function module name and the corresponding view (see Table 6.8) is of no significance (and is no longer displayed in the new workload monitor).
Clients and Server
The single-record statistics write the function module name of the five most expensive function modules (this can be changed using the parameter stat/rfcrec) in a transaction step to the statistical record. In these profiles, you will find the workload of these five expensive function modules. These statistics are particularly useful for an introduction to application analysis, because with them, you can see which functions create the highest workloads.
RFC ProfilesTable 6.6
Continuous monitoring of RFC connections
368 Book_M.indb 315 10/4/10 12:09:33 PM

316
6 Workload Distribution and Interfaces
Field Explanation
Quantity Number of remote function calls (RFCs).
Call Time Response time for the RFCs, measured in the sender system. The difference between call time and execution time is the time it takes to make the connection and transfer data between the sender and recipient systems. As a rule of thumb, this time should not be more than 20% of the call time. If this value is exceeded, look for a bottleneck in the connection between sender and recipient.
Execution Time Response time for the RFCs, measured in the recipient system. The execution time is the net time for the execution of the RFCs in the recipient system.
Sent Data Quantity of data sent.
Received Data Quantity of data received.
Fields in the RFC Profile in the Workload Monitor (Transaction ST03/Table 6.7 ST03N)
View Button Remarks
Transaction codes
Transaction Code
User names User Names This view is useful if a user name is associated with a particular transfer channel. For example, you can set up your RFC connection so that sales orders are sent in your system under a user RFC_SALES.
RFC function modules
Function Modules
This view is suitable mainly for application analysis, because it enables you to identify the functions that create the highest workload. This view is of no consequence in the profiles Client Destinations and Server Destinations.
External RFC destinations
Remote Destinations
You can enter remote SAP instances as remote destinations, for example, or as names of servers that run programs with which the local SAP system communicates via RFC.
Local RFC destinations
Local Destinations
Distribution of the RFC load over the instances in the local SAP system.
Views in the RFC Profile of the Workload MonitorTable 6.8
To evaluate the RFC profile, proceed as follows:
Sort the RFC profile according to the Call Time column. The functions 1. or destinations with the longest processing times are at the top of the list. Note: In some SAP kernel versions, for software imports (program
Evaluating profiles
368 Book_M.indb 316 10/4/10 12:09:34 PM

317
Remote Function Calls (RFCs) 6.3
tp) incorrect times are calculated for call time, so extremely high times are given for the server from which the software import was started. However, in the profile, these can be recognized immediately.
Compare the values given for Call Time and Execution Time. As a 2. rule of thumb, the difference between them should not be greater than 20%. If you do this comparison in the different views, you can identify destinations, function modules, or users for which there may be a problem with communication between the sender and recipient. Analyze the connection and data transfer by testing the relevant con-nection, and generate an RFC trace for the corresponding program.
You can then sort the RFC profile according to Execution Time, Sent 3. Data, and Received Data to identify the function modules with the highest workloads.
In the Interface Load section of the SAP EarlyWatch Alert report, you can get a weekly overview of the most important destinations and function modules called as RFCs. The tables in the SAP EarlyWatch Alert report are a compressed version of the RFC statistics.
To correctly interpret the statistical information on RFCs included in the workload monitor (Transaction ST03N) and in the single-record statistics (Transaction STAD), you need to understand how these statistics are gen-erated. Otherwise, it is easy to draw the wrong conclusions. We’ll now describe how RFC statistics are generated and what you should bear in mind when interpreting them.
Let’s assume that in a transaction step, RFCs are sent to several destina-tions — destinations A, B, C, and so on. The RFCs sent to destination A will be called A1, A2, A3,… and those sent to B will be B1, B2, and so on. For performance reasons, it is not possible to write statistics for all RFCs. The statistics are created as follows:
On the sender (client) side, detailed statistical information is saved for EE
the five most expensive RFCs (in one transaction step). The informa-tion saved includes user, destination, sender and recipient instances, name of the function module, time called, time executed, and volume of data transferred. These statistics are referred to as the client statis-tics records. The RFC client profile is generated from these statistics.
SAP EarlyWatch Alert
How are RFC statistics generated?
368 Book_M.indb 317 10/4/10 12:09:34 PM

318
6 Workload Distribution and Interfaces
Also on the sender side, detailed statistical information is saved on EE
the five most expensive destinations, which in turn contains the total of all RFCs sent to these destinations. The information saved includes user, destination, sender and recipient instances, call number, time called, time executed, and volume of data transferred. The name of the function module is not included here, because these statistics are the total for all RFCs to a destination, so all function modules are combined. These statistics are referred to as the client destination sta-tistics records. The RFC client destination profile is generated from these statistics.
On the recipient (server) side, similar statistics are generated and are EE
known as the server statistics records and the server destination statistics records.
From the rules described thus far, we can see that the RFC profile in the workload monitor does not cover the entire RFC load, because statistics are only collected for the five most expensive destinations and the five most expensive calls (per transaction step). You can, however, change the limit for how many destinations and calls should be included, using the profile parameter stat/rfcrec. If you do not change these param-eters, the default value is five. In practice, this standard setting covers 50 to 90% of the RFC load (depending on the size of the system). Raising the stat/rfcrec parameter causes a greater load for the statistics collec-tor and may lead to performance problems. In general, therefore, you should not change the default setting.
When analyzing RFC statistics on the recipient or server system, in the workload monitor (Transaction ST03N), or in the single-record analysis (Transaction STAD), select task type RFC to analyze the load generated by inbound RFCs. Further analyses related to shares of CPU time, database response time, and so on can then take place, just as with transaction steps in the dialog task. Be careful, however, of two special situations that can sometimes lead to confusion:
The first occurs when an RFC calls another RFC. In this case, the time 1. taken for the execution of the second RFC is not added to that of the first, so the response time for the first RFC only takes into account the time that it is actually in the work process. The roll wait time (that is,
Changing the profile parameters
stat/rfcrec
Interpreting the RFC server
statistics
368 Book_M.indb 318 10/4/10 12:09:34 PM

319
Remote Function Calls (RFCs) 6.3
the time it spends waiting for the second RFC to finish its work) is not included in the response time. This provision was set to avoid “mul-tiple counting” of RFC times. (Note: The calculation is different for transaction steps in the dialog task. If an RFC is started from the dia-log task, the response time does include the time for the RFC execu-tion, even if the work process is rolled out. It has been set in this way because response time in a dialog task should reflect the time that a user spends waiting in front of the screen.)
The second situation arises when the sender does not close the con-2. nection to the recipient. Here is an example: Assume that a sender executes an RFC in a recipient system (an SAP system) and for per-formance reasons, does not close the connection after execution. This procedure is often followed when several RFCs are sent one after the other, because performance suffers each time a connection is set up. Also assume that each RFC is very fast — that each execution takes, for example, 20 ms. How does the recipient system respond in this case?
After execution of the first RFC, the RFC server work process waits 500 ms. If the sender calls the recipient system again before the end of this wait time, then the RFC is executed in the same work process. As a result, the user context does not have to be rolled in and rolled out. If no other RFC is executed within the 500 ms, then the user con-text is rolled out of the work process, which is then available for requests from other users. (The user context and the CPIC connection still exist; they are just rolled out of the work process.) A statistics record is created at roll-out. The response time shown in this statistics record is the time during which the work process was occupied. Let’s say, for example, that four RFCs were executed in close succession, with a response time of 20 ms each. Then the work process waits another 500 ms. The response time for the RFC call would show as about 600 ms. You can find the response times for the four RFCs in the details of the statistics records.
To summarize, we can say that the response time in the dialog task reflects the time that a user spends waiting for a response. This includes both the time it takes for the request to be processed in the work process and the time the request has to wait for any external RFCs. The response
368 Book_M.indb 319 10/4/10 12:09:34 PM

320
6 Workload Distribution and Interfaces
time in the RFC task, on the other hand, reflects the time that an RFC has been in a work process.
Configuring Parallel Processes with Asynchronous RFCs6.3.5
As we have already seen, asynchronous RFCs are used to parallelize appli-cations, because the sender side does not have to wait for an RFC to be finished; it can send other RFCs immediately. If the degree of paral-lelizing is not limited, however, it can result in a snowballing of RFCs, which can bring the application level to a standstill for the user (all work processes are busy).
There are two ways to avoid this situation: You can create your own SAP instances with a dedicated logon group, as explained in Section 6.2.4, Dynamic User Distribution: Configuring Logon Groups. In addition, the resources for RFC processing can be limited for each SAP instance. In this way, a certain share of the resources can be reserved for dialog applica-tions. For asynchronous RFCs (ABAP keyword STARTING NEW TASK <Task Name> DESTINATION IN GROUP <Group>), the load information is evalu-ated on the recipient side. As many aRFCs are sent to each application instance as there are resources available. If an application instance has no more free resources available, then no more aRFCs are sent to it. The request for resources is repeated until all aRFCs have been processed.
Resources available for aRFC processing are set in profile parameters. With the help of the program RSARFCLD the quotas can be configured dynamically. You can find further information on profile parameters in Appendix C, Performance-Relevant Configuration Parameters and Key Figures, and in SAP Note 74141.
Quotas are only effective for aRFCs using RFC server groups and for qRFCs, but not for synchronous RFCs and aRFCs without using RFC server groups.
Monitoring Data Transfer with Transactional RFCs6.3.6
A transactional RFC is an asynchronous RFC that runs under special security conditions. Transactional RFCs (tRFCs) are not executed imme-diately; rather, the calls are first gathered in an internal table. On the
Limiting RFC resources
368 Book_M.indb 320 10/4/10 12:09:34 PM

321
Remote Function Calls (RFCs) 6.3
next COMMIT WORK statement, all calls are processed in order of sequence. If update records are also generated before the COMMIT WORK statement, then the transactional RFCs are only executed if the update modules can be processed without error. The transactional RFCs of a transaction form a logical unit of work (LUW) for each destination.
All tRFCs are displayed on the sender side in the tables ARFCSSTATE and ARFCSDATA. Each LUW is identified with a universally unique ID. On COMMIT WORK, the call bearing this ID is executed on the corresponding target system. If a call error occurs, all executed database operations from the previous calls are revoked (ROLLBACK), and a relevant error message is written to the ARFCSSTATE table. If an LUW is successfully executed on the target system, this is confirmed in the target system. The correspond-ing entries in the ARFCSSTATE and ARFCSDATA tables are deleted on the sender side. You can evaluate error messages regarding tRFCs with the help of Transaction SM58.
Interrupted or unexecuted tRFCs lead to inconsistencies between sys-tems and considerably impair the business process. The daily checking of errors in interface processing (Transaction SM58) is therefore an impor-tant task of the SAP system administrator.
If the target system cannot be reached because, for example, the connec-tion is currently not active, by default, a background job is planned for each failed tRFC so that the tRFC will be started again at regular intervals (report RSARFCSE with the ID of the tRFC as a parameter).
If a lot of tRFCs are transferred for a particular connection, which is then interrupted, the sending SAP system might be inundated with back-ground jobs that will continue trying to send tRFCs to the unavailable system, with no success. This can lead to considerable performance prob-lems in the sender system if the recipient system is not available over a certain period of time. We therefore recommend that for connections in which more than 50 tRFCs have to be transferred each day, you deacti-vate the scheduling of background jobs in the event of error. To do this, select the destination in question in Transaction SM59: Destination • TRFC Options. In the next screen, activate the option Suppress Batch Job in the Event of Communication Error and confirm your entry with the function Continue. Now, in the event of error, no background jobs
Dealing with tRFC errors
368 Book_M.indb 321 10/4/10 12:09:34 PM

322
6 Workload Distribution and Interfaces
will be created and processed for the tRFC. Instead of these individual jobs, you must now schedule the report RSARFCEX to run regularly (about every 30 minutes) with the destinations in question and with the current date as the variant (explicit parameter for variants). The program now searches the ARFCSSTATE table sequentially for tRFCs that have not yet been sent and tries to send them. This adjustment should only be carried out and tested by an experienced system consultant.
If errors occur when you’re sending tRFCs, the corresponding entries in ARFCSSTATE and ARFCSDATA tables are not deleted. As a result, these tables have to be reorganized at regular intervals. For this pur-pose, you should schedule RSARFC01 to run at least once a week as a background job. Otherwise, performance problems might occur with the ARFCSSTATE and ARFCSDATA tables. You can find additional notes on undeleted tRFC protocol entries in SAP Note 375566, Many Entries in the tRFC and qRFC Tables.
SAP Virtual Machine Container6.4
SAP Basis 7.00 provides two different Java runtime environments: the J2EE Engine and the Virtual Machine Container (VMC). Whereas the J2EE Engine can be operated with Java Virtual Machines (JVM) by Sun, IBM, HP, and (as of SAP Basis 7.10) the SAP JVM, the VMC exclusively runs on the JVM by SAP. The performance analysis of the J2EE Engine has already been discussed in other chapters; therefore, we’ll now take a closer look at the performance analysis of the VMC.
The VMC component enables the operation of a Java Virtual Machine (JVM) within the classical SAP work processes, along with the ABAP runtime environment. For this purpose, a pool of JVMs is created in the shared memory of the ABAP instance, and (if required) a JVM is taken from this pool and displayed in the address space of the ABAP work process. When a transaction step is complete, the JVM is hidden from the address space and returned to the pool. The user data accu-mulated in the Java part of the application (session) is also stored in the shared memory; however, they are copied to another part of the shared
Reorganization of tRFC tables
VMC technology
368 Book_M.indb 322 10/4/10 12:09:34 PM

323
SAP Virtual Machine Container 6.4
memory. Therefore, in the next transaction step, the user data can be processed in another work process by another JVM (by copying the user data from the shared memory). At the end of the transaction, the user data is released. Memory management of the VMC is basically identi-cal to memory management of the ABAP runtime environment and is no longer similar to a “normal” Java runtime environment in which the user data is maintained in the local memory of the JVM and cannot be moved easily from one JVM to another. The benefit of the VMC is higher stability due to the processing of only one transaction step and one work process at a time in the JVM. However, this stability has a con-siderably high price within Java development, because the Java-side user data must meet specific requirements so it can be copied by the VMC to shared closures of the shared memory at the end of a transaction step.
Java applications based on the VMC include pricing, tax calculation, and configuration, that is, applications known as Internet Pricing and Configu-ration (IPC). IPC was ported in SAP Basis 7.00, for example, by means of SAP CRM 5.0 to the VMC.
Why do these applications use a “special” technology? Initially during the development of SAP CRM, the need arose to provide functions such as pricing, tax calculation, and configuration both as applications for PCs (mobile clients) and as server applications. Therefore, Java was selected as the programming language. Debates over performance reasons argue against implementation based on the SAP J2EE Engine; therefore, the first SAP CRM versions included a separate IPC application with its own software logistics and administration. As of SAP Basis 7.10, it was inte-grated into the ABAP runtime environment.
You can find most of the critical performance key figures of the VMC in the workload monitor (Transaction ST03N) and in the single-record sta-tistics (Transaction STAD). Table 6.9 shows the most critical key figures.
If you determine that there is a problem in the VMC, based on the performance key figures, you can monitor it using the VMC monitors (Transactions SM52 and SM53) and via central CCMS monitoring (Trans-action RZ20).
VMC applications
Performance analysis
368 Book_M.indb 323 10/4/10 12:09:34 PM

324
6 Workload Distribution and Interfaces
Field Explanation
VMC Time The time the work process required in the VMC. This time is part of the processing time in the statistical main record. If the processing time is high, it is worth checking whether it was caused by high VMC times.
VMC CPU Time
CPU time required by the VMC. This time is part of the CPU time in the statistical main record.
Garbage Collection Time
Time that was used by the VMC for garbage collection. This time is part of the VMC time. As a rule of thumb, this time should not exceed 5% of the VMC time.
Memory Allocated
The memory used by the VMC.
Memory Transferred to Shared Memory
The memory copied to the shared memory by the VMC. This typically includes the amount of user data that has been copied to the user area of the shared memory at the end of the transaction step after garbage collection.
VMC Statistic Fields in the Workload Monitor (Transaction ST03N) and in Table 6.9 the Single-Record Statistics (Transaction STAD)
Summary6.5
The most important method for optimizing workload distribution in an SAP system is the configuration of work processes. The number of work processes to be set up depends on the demands made on the SAP system and the CPU resources available. Important considerations are: Is the system to be used mainly for OLTP (online transaction processing) or for OLAP (online analytical processing) applications? Will there be more dialog processing or more background processing?
You should take the following guidelines into account:
About 10 to 30% of CPU requirements for the entire system is nor-EE
mally consumed by the database service. Ensure that any SAP instances residing on the database server do not consume too much CPU capac-ity. Too many work processes on a database server can lead to CPU bottlenecks, which in turn lead to higher database times and inconve-nience for all users.
368 Book_M.indb 324 10/4/10 12:09:35 PM

325
Summary 6.5
About 10 to 20% of CPU requirements for the entire SAP system is EE
normally consumed by the SAP update service.
In comparison to SAP GUI scenarios, the use of a web browser as the EE
presentation server requires an additional CPU capacity of approxi-mately 10 to 30% for preparing the screen pages in HTML. Depending on the technology used, this preparation is performed by the ABAP application instances, the Java application instances, or the external ITS (see also Chapter 7, SAP GUI and Internet Connection).
The SAP Web Dispatcher is used for distributing Web requests to Java or ABAP application instances. The message server is deployed for distrib-uting SAP GUI, background, and update requests.
We recommend the following procedure for distributing work processes on the ABAP instances:
Message, enqueue, and ATP services should be on one ABAP instance EE
(known as the central SAP instance). There should be at least five dialog work processes on this instance. For small and medium installations, this central SAP instance is configured on the database server. For large installations, it is located on a separate application server.
Dialog, background, update, and spool work processes should be EE
equally distributed on the remaining application servers in a sym-metrical manner. You must take into account the CPU capacity of individual servers when configuring the work processes. If you con-figure the update service on one instance, at least two update work processes should be configured there.
Additional techniques for system load management include:
Central update server and background serverEE
Update types (V1/V2/V3 and local update), dedicated updates, and EE
update multiplexing
Logon groups for dynamic user distributionEE
System parameters for automatic logoff, prohibiting double logons, EE
and restricting the runtime of programs (time-out)
368 Book_M.indb 325 10/4/10 12:09:35 PM

326
6 Workload Distribution and Interfaces
However, please note that these techniques involve higher administra-tion and monitoring effort. The rule of thumb is that the system should be configured as symmetrically as possible and as asymmetrically as necessary.
There is no rule for how many SAP work processes per processor can be configured. A guideline value is 5 to 10 work processes per processor. Often, SAP administrators and consultants make the mistake of increas-ing the number of work processes to solve any type of performance problem. This can lead to problems that are as serious asthe initial prob-lem and in some cases even worse.
Interfaces are a core element of the SAP technology. Remote function calls (RFCs) constitute the most important interface technology.
You can proactively eliminate RFC interface performance problems with appropriate configurations of the RFC connection and recipient instance. If performance problems still occur, there are some good analysis tools that you can use, such as the work process overview, the RFC profile in the workload monitor, single-record statistics, performance trace (RFC trace), and the transaction for configuring RFC connections.
Communication between ABAP work processes and the Virtual Machine Container is also done via RFC. The VMC runtimes can be found in the single-record statistics and the workload monitor and therefore are the starting points for performance analysis.
Important Concepts in this Chapter
After reading this chapter, you should be familiar with the following concepts:
Load distributionEE
SAP Web Dispatcher, message serverEE
Logon groupsEE
Update dispatchingEE
Update: V1, V2, V3, and local updatesEE
Remote function calls: RFC, aRFC, tRFC, and qRFCEE
368 Book_M.indb 326 10/4/10 12:09:35 PM

327
Summary 6.5
Roll wait time and RFC timeEE
RFC profile in the workload monitorEE
Virtual Machine ContainerEE
Questions
Where should background work processes be configured?1.
a) Background work processes should always be configured on the database server. Otherwise, the runtime of background programs will be negatively affected by network problems between the data-base server and the application server.
b) If background work processes are not located on the database server, they must all be set up on a dedicated application server, known as the background server.
c) Background work processes can be distributed evenly over all of the application servers.
How should you configure and monitor the dynamic user distribu-2. tion?
a) By setting the appropriate SAP profile parameter, for example rdisp/wp_no_dia
b) By using Transaction User Overview (SM04)
c) By using Transaction Maintain Logon Groups (SMLG).
You will find questions on the RFC topic at the end of Chapter 7, SAP GUI and Internet Connection.
368 Book_M.indb 327 10/4/10 12:09:35 PM
781
Index
32-bit architecture, 39532-bit technology, 37764-bit, 37764-bit architecture, 39564-bit technology, 377
A
A004, 436ABAP, 483, 485, 757
dictionary, 757Web services, 362
ABAP application instance, 74, 287ABAP Class Builder, 450ABAP Class Library, 738ABAP coding, 307ABAP debugger, 230, 231, 243ABAP Dictionary, 498, 521ABAP Dictionary tables, 738ABAP Editor, 408, 531, 738abap/heap_area_dia, 380, 385, 406, 408abap/heap_area_nondia, 380, 384, 406, 409abap/heap_area_total, 380, 393, 406abap/heaplimit, 177, 381ABAP List Viewer Control, 330ABAP program, 201, 514, 519ABAP program termination, 403ABAP Repository Browser, 533ABAP Repository information system, 738ABAP runtime analysis, 221, 222, 223, 243, 366, 514
BSP applications, 226Web Dynpro applications, 226
ABAP runtime error analysis, 739ABAP server
statistics, 153ABAP statistics, 153ABAP trace summary, 228ABAP Workbench, 460, 738
BSP development, 360Access log, 356Access plan, 667ACID, 757Action profile, 186Activating buffering, 424Active users, 168Activity, 160, 178Adaptive Computing Controller, 275Addressable memory, 356Address space, 376, 393, 757Administration for indexes, 498Administration for table access statistics, 498Administration tools
DB, 535AGate, 348, 353AGate and WGate, 348Agate log, 356Agent private memory, 665Aggregate, 582, 589
compression, 591create, 586creation on suggestion, 587criteria for creation, 585indexing, 589vs. BWA, 629vs. index, 584
Aggregate functions, 515AL11, 737AL12, 737ALE administration and monitoring, 737Alert, 141Alert Monitor, 139, 140, 347, 757
status indicators, 139Alert server, 602, 608, 618Allocated memory, 114, 115ALV Control, 330American National Standards Institute, 757Analysis of a hardware bottleneck, 77Analytical applications, 542
368 Book_M.indb 781 10/4/10 12:10:52 PM

782
Index
Analyze Java applications, 370ANSI, 757APO server, 277Application analysis—statistics relating to business document volume, 739Application buffer
object-oriented, 413Application buffer, object-oriented
monitor, 447Application error, 405Application level, 38Application link enabling (ALE), 757Application monitor, 62, 181, 739Application optimization, 22Application server, 73, 350, 757Application service providing, ASP, 25Application support layer, 665Application tuning, 31, 59Architecture of SAP applications, 33Archiver stuck, 106, 172Array fetch, 213Asynchronous RFC, 296, 307, 320Asynchronous RFC error log, 738Asynchronous update, 299ATAB, 444, 535ATP check, 449ATP logic, 455, 471ATP server, 290, 471, 472, 474, 476ATP service, 283, 290Attribute, 543, 549, 555Attribute index, 42Automatic alert messaging, 147Availability, 186Available address space, 394Available memory, 391, 394Average response time, 179
B
Background job overview, 738Background load, 173Background processing, 757Background programs, 462Background service, 283, 289, 290Backup, 51Backup index server, 621
BALE, 737BAPI, 757Batch input, 757Benchmark, 261, 757Bitmap indexes, 534, 573Blocks, 90Bottleneck analysis, 151, 356Browser, 757BSP applications
runtime analysis, 226B* trees, 570Buffer, 716
analysis, 660displacements, 660
Buffer accessing, 419Buffered objects, 446Buffered tables, 432, 437Buffer get, 482Buffer hierarchy, 43Buffering type, 416Buffer pool, 665Buffer quality, 90Buffer setting, 111, 534, 535Buffer status, 431Buffer synchronization, 420, 442, 446Buffer trace, 209, 217Buffer types, 413Business Application Programming Interface (BAPI), 757Business Connector, 757Business Server Pages (BSP), 39Business Server Pages (BSPs), 329, 339, 357Button, 757BW Accelerator Monitor, 737BW Administrator Workbench, 737BW aggregate maintenance, 737BWA index
for Polestar, 632maintain, 633
BW check reports, 737BW query, 542, 545
analysis, 560background print, 581
BW statisticsfields, 562
368 Book_M.indb 782 10/4/10 12:10:52 PM

783
Index
C
Cache mechanisms, 354Caches, 42Calendar buffer, 718CALL, 378Catalog buffer (catalog cache), 445Catalog cache, 665, 680CATT, 757CBO, 104, 493, 495CCMS, 30, 35, 61, 139, 725
alert, 142monitoring tree, 144
CCMS monitor, 315CCMS System Component Repository (SCR), 185Central installation, 289Central monitoring, 48Central SAP monitor, 62, 738Central single-record statistics, 206Central workload monitor, 185Change and Transport Organizer (CTO), 758Change run, 591, 634Changes, 430, 438Changes and commits, 172Changing secondary indexes, 505Characteristic, 543, 549, 555Checkpoint, 93Client, 758Client destination statistics records, 318Client/server architecture, 38Client statistics records, 317Clustered index, 709Code Inspector, 234, 243, 420Column-based data retention, 635Column-based data storage, 596Common Programming Interface Communication (CPI-C), 758Completed processes, 123Compression, 596, 597Computer, 73Computer Aided Test Tool (CATT), 757Computing Center Management System (CCMS), 758COM routine, 164
Concordance search, 600Condition tables, 427, 444Container-Managed Persistence, 369Context switch, 78, 758Context switching, 377Continuous performance optimization, 56Control panel for operation modes and server status, 737Cost-based optimizer (CBO), see CBO, 493Coupling
hard, 307soft, 307
CPU, 78CPU bottleneck, 79, 651
database server, 656CPU load, 80, 175CPU resources, 291CPU time, 165, 167, 170, 176, 292, 649CPU wait time, 293CPU workload, 77, 266Creating secondary indexes, 505Crystal Reports, 545CUA buffer, 717CUM package, 673Cursor, 214Customer interaction center, 232Customer program optimization, 68Customizing, 758Customizing data, 426Customizing Organizer (CO), 758
D
D010S, 535Data archiving, 758Database, 73, 196, 758
analysis, 656buffer, 42performance key figures, 735
Database Administrator (DBA), 758Database buffer, 90, 657Database consolidation, 272, 276Database error log file, 103, 669
368 Book_M.indb 783 10/4/10 12:10:52 PM

784
Index
Database global memory, 665Database heap, 665Database indexes, 658Database indices
missing, 415Database instance, 73, 401, 758
logical processors, 657Database level, 40Database lock, 101, 456, 459, 668, 711, 758
exclusive, 102IBM DB2 for z/OS, 675Informix, 678MaxDB, 684too long, 656
Database lock monitor, 121, 459Database Monitor, 61, 87, 656, 663Database monitoring, 73, 87Database not responding, 105Database operation, 212Database Optimizer, 689, 104, 489, 490, 492, 511, 689, 758, 762
statistics not available, 658Database performance monitor, 88, 115, 459, 657, 739Database performance problem, 175Database process monitor, 94, 121, 671, 675, 678, 681, 688, 711Database processor, 103Database response times
high, 654Databases, 30Database server, 73, 758
CPU bottleneck, 656Database system, 455Database times, 163, 170, 175, 176, 649
differences in, 659Database view, 691, 696, 698, 700, 703, 707, 710Data browser for displaying table contents, 738Data buffer, 90, 91, 665, 674, 676Data cache, 90, 680, 686, 687Data Control Language (DCL), 758Data Definition Language (DDL), 758
Data Manipulation Language (DML), 759Data mining, 542Data model–oriented buffer, 42DataStore object, 543, 544, 555
indexing, 573DB01, 89, 101, 459, 477, 656, 663DB02, 89, 495, 663, 737DB2 for IBM i
execution plans, 699DB2 for LUW, 665, 666DB05, 737DB12, 89, 663, 737DB13, 89, 500, 663, 737DB13C, 500DB13C, 89, 663DB20, 737DB20, 503DB21, 501DB24, 89, 663DB50, 680, 681DBA Cockpit, 88, 121, 459, 499, 500, 656, 663, 666, 680, 737
DB2 for IBM i, 671DBA logs, 737DB Analyzer, 685DBA Planning Calendar, 500, 737DBDIFF, 500DBDIFFVIEW, 500DBIF_RSQL_NO_MEMORY, 409DB procedure calls, 164DB procedure subrecord, 164DB procedure time, 164, 649dbs/io_buf_size, 213DBSTATC, 501, 503DDLOG, 421, 442, 450DDNTF, 437, 535DDNTT, 437, 535Deactivated update service, 122Deadlock, 462, 759Decomposition
vertical, 605Delta index, 598, 617
activate, 620create in SAP NetWeaver BW Accelerator, 633
368 Book_M.indb 784 10/4/10 12:10:52 PM
785
Index
merge, 621Delta index, 619Demilitarized zone, 41Dequeue module, 457Detailed table analysis, 439Developer logs, 407Developer trace, 130Development Workbench, 35DIAG protocol, 759Dialog load, 173Dialog service, 283, 289, 290Dialog work process, 759Dictionary coding, 597Difference coding, 597Dimension ID, 546Dimension table, 546
index, 571Direct read, 212, 690, 692, 696, 699, 702, 706, 709Disk read, 482Dispatcher, 289, 759Dispatcher log, 356Dispatcher process, 283Dispatcher queue, 127, 162Dispatcher wait time, 162, 170, 176, 292Displacements (swaps), 111, 423, 428Display ABAP Dictionary, 738Display and delete locks, 738Display attribute, 550Display developer traces, 739Display or maintain operating modes, 738Display SAP directories, 737Display statistics on table accesses (table call statistics), 739Display table buffer (buffer synchronization), 737Display update records, 738disp+work, 283Distributed installation, 289Distributed statistics records, DSR, 152Double-stack installation, 276dpmon, 641Drill down, 544Drive space, 357DSWP, 132, 190, 192, 236, 241
DWDM, 330Dynamic SQL, 369Dynamic statement cache, 674Dynamic user distribution, 286, 294Dynpro, 759
E
Easy Web Transaction (EWT), 349, 361, 759EDM pool, 675Efficient SQL programming, 514EJB-CMP, 369Electronic Data Interchange (EDI), 759em/address_space_MB, 386, 396Embedded scenario, 599em/blocksize_KB, 380em/initial_size_MB, 113, 122, 380, 395, 401, 406em/max_size_MB, 385End-to-end diagnostics, 65, 67End-to-end (E2E) trace, 342, 711End-to-end runtime analysis, 156, 238, 241, 243, 244End-to-end workload analysis, 156, 190Enqueue module, 457Enqueues, 759Enqueue service, 283, 288, 290Enqueue table, 463Enqueue trace, 209, 220Enterprise File Search (EFS), 599Enterprise IMG, 759Enterprise JavaBeans, 40Enterprise resource planning, 24Entity, 759Escalation procedure, 54ETL process, 546Exclusive database locks, 102Exclusive lock wait, 101, 108, 128, 150, 459, 477, 675, 742
SQL Server, 688Execute external operating system commands, 738Execute tests to analyze background processing, 738Execution plan, 489, 490, 689, 759
368 Book_M.indb 785 10/4/10 12:10:52 PM

786
Index
DB2 for IBM i, 699DB2 for LUW, 697IBM DB2 for z/OS, 701Informix, 705MaxDB, 695Microsoft SQL Server, 709Oracle, 692
Executive Information System (EIS), 541Expensive SQL statements, 94, 98, 668Expert monitors for performance analysis, 61Explain, 490Export/import buffer, 413, 447, 453, 473, 718Export/import SHM buffer, 405, 413, 447Export/import SHM buffer, 453, 718EXPORT_NO_SHARED_MEMORY, 405EXSORT_NOT_ENOUGH_MEMORY, 409Extended global memory, 387Extended memory, 406, 759
too small, 660Extended memory area (EM), 405Extensible Markup Language (XML), 766External sessions, 378Extracting, 546
F
Fact table, 546compress, 575, 634index, 571
Failover recovery, 275Failover solution, 290FE Net Time, 331Fetch, 430Fetch operation, 212, 523Fiber Distributed Data Interchange (FDDI), 759Field description buffer, 716, 717File system cache, 83Firewall, 353, 759Fixed allocated memory (HEAP), 405Flow, 543
FOR ALL ENTRIES, 523, 525, 527Fragmentation of indexes, 503, 534Frontend time, 331, 649Full buffering, 417Full table scan, 491, 497, 506, 569, 690Fundamentals of RFC, 306
G
Garbage collection, 196, 759, 769full, 655JVM, 129
Gateway monitor, 309Gateway service, 284General performance problem, 169Generate table access statistics, 737Generation time, 163Generic buffering, 417Generic key table buffer, 718Generic region, 417Generic table buffer (TABL), 413Global cache hit ratio, 675Globally Unique Identifier (GUID), 759GoingLive Check, 26Graphical user interface (GUI), 759GUI communication, 333GUI controls, 329GUI time, 331, 334, 649
H
Hard disk monitor, 684, 688Hardware, 196Hardware bottleneck, 80, 357Hardware capacity, 175Hardware consolidation, 272, 274Hardware landscape, 289Hardware monitoring, 73Hardware partner, 252Hardware resources, 651Hardware sizing, 247, 248, 474Hardware tuning, 30Harmonization, 272Heap, 377
368 Book_M.indb 786 10/4/10 12:10:53 PM

787
Index
Heap memory, 759HIER, 181Hierarchy, 552, 555High availability, 290, 759Hints, 511Hit ratio, 90/HMUSA, 231Horizontal scalability, 45Hot spots, 100, 679, 689HTML business templates, 362HTML Control, 330HTTP call, 366HTTP time, 649HTTP trace, 243, 341Hub scenario, 599HybridProviders, 544Hypertext Markup Language (HTML), 760Hypertext Transfer Protocol (HTTP), 760
I
IBM DB2 for IBM i, 670IBM DB2 for LUW, execution plans, 697IBM DB2 for z/OS, 674, 676
execution plans, 701IBM Informix Dynamic Server, 676
execution plans, 705ICM monitor, 61, 341, 363, 728Identical selects, 216IDoc type, 760Implementation Guide (IMG), 578, 760Inbound load, 315Index
divide, 616, 617vs. aggregate, 584
Index fragmentation, 503Indexing, 568Index quality, 504Index range scan, 491, 497Index scan, 569Index server, 602, 621Index unique scan, 490Index update, 625InfoCube, 543, 546, 555
index in SAP NetWeaver BW Accelerator, 629optimization, 566tables, 553
InfoCube overview, 737InfoObject, 542InfoProvider, 543, 555Informix, 676Initial record buffer, 717Initial sizing, 249, 254In-memory computing, 635Insert-only approach, 636Instance, 760Integrated ITS, 387Interaction model, 330Interface management, 68Interfaces, 281Internal Document (IDoc), 760Internal sessions, 378International Demo and Education System (IDES), 760Internet Application Component (IAC), 349, 760Internet Communication Framework (ICF), 358, 361Internet Communication Manager (ICM), 138, 284, 339, 341, 357, 358, 602
Configuration parameters, 728Internet Communication Manager Monitor, 738Internet connection, 329Internet Pricing and Configurator (IPC), 277, 323, 395Internet Transaction Server (ITS), 296, 339, 352, 395, 761
analysis, 660Independent, 732integrated, 361, 387, 732, 738integrated versus nonintegrated, 277performance analysis, 363
Interprocess Communication (IPC), 761Intranet, 760Introscope, 62, 155, 189Introscope trace, 236Introscope workstation, 192
368 Book_M.indb 787 10/4/10 12:10:53 PM

788
Index
Invalidation, 111, 423I/O bottleneck, 84, 100, 658iSeries, 386ITS
integrated, 361performance analysis, 363
ITS administration tools, 356ITS Fundamentals, 348ITS instance, 353ITS Monitor, 61ITS status monitor, 362ITS work process, 354, 356iView, 38, 368
J
J2EE Engine, 444, 763analysis, 655
Java, 761Java application instance, 74, 287Java Application Request Measurement (JARM), 156, 761Java Connector (JCo), 369Java dictionary, 369, 413Java program, 201JavaServer Pages, 40, 329, 339, 367Java servlets, 40, 329, 367Java statistics, 155Java threads
occupied, 655Java trace, 62Java Virtual Machine Container, 731Java Virtual Machine (JVM), 129, 761, 765
configuration parameters, 730garbage collection, 129work processes, 133
Java workload monitor, 189JDBC, 369Job analysis, 738Job overview, 591Job scheduling monitor, 737Join, 569
K
KAPOL, 432, 444Key figure, 543Knowledge management (KM), 599
L
LAN check, 85Landscape reorganization, 616, 618Leafs, 570Line item dimensions, 556Linguistic analysis, 600LISTCUBE, 560, 737List of servers, 738liveCache, 277, 284, 663Load, 168, 178Load and generation time, 649Load distribution, 174, 175, 196, 281
ABAP, 288nonoptimal, 80, 654
Load from external systems, 186Loading, 546Load per SAP Application Module, 182Load time, 163Local Area Network (LAN), 44, 761Local memory, 376, 761Local update, 304Lock concept, 455Lock escalation, 684Locking with quantities, 290, 474, 475, 476Lock list, 665Lock objects, 457Locks, 455, 471, 761
monitoring, 459Lock transactions, 738Logical analysis, 415Logical read accesses, 90Logical unit of work (LUW), 761Logistic Information System (LIS), 541Logon group, 286, 294, 353Logon groups monitor, 289Logon load balancing monitor, 726
368 Book_M.indb 788 10/4/10 12:10:53 PM

789
Index
Log onto the SAP Service Marketplace, 737Long database response times, 122Low-speed connection, 337LRU, 761
M
Main memory, 376Main memory bottleneck, 79, 652Main memory buffering, 466Main memory requirements, 265, 399Main memory workload, 78Maintain ABAP Dictionary, 738Maintain external operating system commands, 738Maintain logon groups, 739Maintain profile parameters (by parameter), 737Maintain profile parameters (by profile), 737Maintain SAP instances, 737Master data, 426Master data table
indexing, 572Master index server, 617, 621MaxDB, 735MaxDB command monitor, 682MaxDB resource monitor, 684ME57, 530memlimits, 397, 398Memory allocation, 381Memory configuration monitor, 109, 406, 436, 449, 451, 476, 578, 660, 715, 739Memory extract, 231Memory Inspector, 230, 231Memory management, 113, 375, 386, 719, 761
analysis, 660J2EE Engine, 132
Memory pipes, 138Memory profile, 177Merge, 619Message portion, 677
Message server, 281, 285Message service, 284, 290Microsoft SQL Server, 488
execution plans, 709Migration, 271Missing database indices, 105Missing database objects and space requirements, 737Missing index, 499Mobile Client, 37Mode list, 402Model View Controller (MVC) design pattern, 357Monitor for buffer synchronization, 442Monitoring agent, 145, 146, 206Monitoring concept, 45Monitoring locks, 459Monitoring SAP Basis, 73Monitoring tree, 144Multilinguism, 555MultiProvider, 555MultiProviders, 544Multithreaded CPU, 78MVC, 357
N
Name server, 602Native JDBC, 369Navigation attribute, 550, 555Nested loop join, 528, 569Netscape Server API (NSAPI), 762Net Time, 331Network, 85, 215, 292Network Alert monitor, 739Network Graphics for SAP Instances, 737Network monitor, 739Network problem, 659Network problems, 215Network tuning, 30Nondialog work processes, 383Nonoptimal load distribution, 80, 124NRIV, 459, 465, 471NRIV_LOKAL, 467
368 Book_M.indb 789 10/4/10 12:10:53 PM

790
Index
Number range, 465Number range buffer, 413Number range buffering, 415, 465, 469, 470Number range interval, 465Number range level, 470Number range object, 465
O
Object linking and embedding (OLE), 762Object-oriented application buffer, 42, 413OLAP, 262, 542OLAP cache, 449, 556
configuration, 577monitor, 576
OLAP cache configuration, 737OLAP cache monitor, 578, 737
fields, 580OLAP processor, 556OLTP, 262, 542Online analytical processing (OLAP), 277, 762Online transaction processing (OLE), 762Online transaction processing (OLTP), 277Open, 430Open object, 687Open SQL for Java, 369Operating mode, 298, 762Operating system, 375, 410
buffer, 42performance key figures, 734
Operating system limit, 406Operating system monitor, 61, 75, 77, 84, 335, 670, 739
process overview, 120Operating system (OS), 762Operating system paging, 377Operating system processes, 735Operating system restrictions, 389Optimization plan, 45
Optimizer, 490cost-based, 104
Optimizing SQL statements, 479Oracle, 91, 686OS06, 75OS06N, 75OS07, 75OS07N, 75OSS1, 737Outbound load, 315Outsourcing, 25
P
Package cache, 665Package dimension, 552Pages, 90Paging, 762Paging file, 389, 410Parameter change, 85Parameter maintenance, 341Parse, 490Partial table buffer (TABLP), 413Partitioning, 605Passport, 152, 206Pending period, 422PERFMON, 346Performance, 762Performance analysis checklists, 641, 650Performance analysis roadmaps, 641Performance Aspects, 383Performance forum, 70Performance indicators, 139Performance key figures
ABAP server, 725ICM, 729independent ITS, 733J2EE Engine, 730JVM, 730VMC, 731
Performance-limiting factors, 355Performance log, 356Performance management, 33Performance measurement, 330
368 Book_M.indb 790 10/4/10 12:10:53 PM

791
Index
Performance monitor, 728Performance overview monitor, 725Performance-relevant configuration parameters, 715Performance trace, 208, 209, 334, 565Permanent performance problem, 171Physical main memory (RAM), 375, 376, 389, 410Physical memory, 115Physical read accesses, 90PHYS_MEMSIZE, 385, 400Pivoting, 544Planning application, 542Pool size, 628Pop-up window, 762Prepare, 214Preparsed templates, 362Preprocessing
distribute, 617, 627Preprocessor, 602, 603, 617
capacity, 628configure, 627modes, 627
Presentation level, 38Presentation server
analyses, 342Presentation server trace, 343Primary index, 488, 499Private mode, 382, 653PRIV mode, 122, 382, 383, 402Proactive performance management, 23Probes, 155Procedure cache, 688Process
external, 82Process after input (PAI), 762Process before output (PBO), 762Process ID, 120Processing time, 165, 167, 170, 649Processor, 78Profile parameter, 407Profiles, 190Program buffer, 413, 717Program Global Area (PGA), 91Program termination, 403PTF package, 673
PXA_NO_SHARED_MEMORY, 404Python trace, 615
Q
Quantity structure, 251Query Monitor, 737Queued RFC (qRFC), 307Queue server, 602
configure, 617, 624Quick Sizer, 249, 410Quick Sizer project, 256
R
R/3, 762Ranking list, 600RBO, 493, 495rdisp/atp_server, 290, 474rdisp/bufrefmode, 422rdisp/bufreftime, 422rdisp/enqname, 290rdisp/max_wprun_time, 296rdisp/mshost, 290rdisp/PG_MAXFS, 388rdisp/PG_SHM, 388rdisp/ROLL_MAXFS, 379, 406rdisp/ROLL_SHM, 113, 379rdisp/vb_dispatching, 301rdisp/vbstart, 300Read access, 472Read random hit ratio, 674Read/write (I/O) problems, 84, 100, 668Recovery, 51, 275Recursive call, 92Redundant array of independent disks (RAID), 762Relational database management system (RDBMS), 762Remote function call (RFC), 37, 306, 308, 762Reopen operation, 212Reorganize indexes, 503Reorganize table, 503
368 Book_M.indb 791 10/4/10 12:10:54 PM

792
Index
Replication, 622trigger, 623
Reporting, 541precalculation, 580
Request, 430, 437, 438RESB, 59, 472, 504, 534Reset or check the number range buffer, 738Resource requirement, 771Response time, 165, 292, 649Response time distribution, 186RFC client profile, 317RFC destinations, 311, 738
monitoring, 315RFC load, 173RFC statistics, 317RFC time, 311, 649RFC trace, 209, 218, 219Roll buffer, 400Roll-in, 163, 379Roll-in time, 649Roll memory, 406Roll-out, 163, 379, 763Rollup, 544Roll wait time, 311, 331, 648, 649Roundtrip, 331Row cache, 92Row ID, 489RSA1, 558, 559, 561, 571, 574, 588, 630, 737RSCUSTV14, 737rsdb/max_blocking_factor, 526rsdb/obj/buffersize, 474rsdb/obj/max_objects, 474RSDDBWAMON, 609, 620, 737RSDDV, 559, 609, 631, 632, 737RSRCACHE, 578RSRT, 560, 561, 565, 577, 609, 632, 737RSRV, 634, 737RSSNR0A1, 468rstr/file, 210rstr/max_diskspace, 210Runtime analysis, 152Runtime too high, 654RZ01, 737RZ02, 737RZ03, 737
RZ04, 737RZ10, 715, 737RZ11, 341, 716, 737RZ12, 737RZ20, 62, 141, 315, 323, 737
S
SAP Advanced Planning & Optimization (SAP APO), 34SAP application instance, 74SAP Application Performance Standard, 260SAP Basis, 35SAP BEx Web analyzer, 341, 545SAP buffer, 110, 183, 400, 409SAP buffering, 413, 518SAP Business ByDesign, 595SAP Business Connector (SAP BC), 757SAP BusinessObjects, 545SAP BusinessObjects Enterprise, 545SAP BusinessObjects Polestar, 546, 632SAP BusinessObjects Voyager, 546SAP BusinessObjects Web Intelligence, 546SAP BusinessObjects Xcelsius Enterprise, 546SAP Business Suite, 34SAPCCMSR, 206SAP components, 34SAP Customer Relationship Management (SAP CRM), 34, 761SAPDBA, 502SAPDBA, 502SAP EarlyWatch Alert, 67, 173, 183, 264, 317SAP EarlyWatch Service, 26, 68, 263SAP Easy Access menu, 338SAP EG memory, 362, 387SAP enqueue, 456, 457, 463, 464SAP enqueue monitor, 477SAP ERP, 34SAP extended memory, 112, 378, 379, 383, 400, 401, 410SAP GoingLive Check, 249, 252, 264
368 Book_M.indb 792 10/4/10 12:10:54 PM
793
Index
SAP GoingLive Functional Upgrade Check, 264SAP GoingLive Migration Check, 264SAP GUI, 219, 329, 340, 763
controls, 329SAP GUI for HTML, 37, 349, 352SAP GUI for Java environment, 37SAP GUI for Windows, 37SAP GUI response time, 649SAP heap memory, 112, 378, 380, 397, 406, 410SAP HTTP plug-in, 239, 243, 343, 346SAP Implementation Guide (IMG), 739SAP instance, 73, 74, 273, 399SAP Internet Transaction Server (SAP ITS), 35, 39, 329, 761SAP J2EE Engine, 35, 74, 329, 367, 663, 664
analyzing applications, 370SQL trace, 711statistics, 155
SAP kernel, 407SAP liveCache, 35, 395, 763SAP logical unit of work (SAP LUW), 457SAP Management Console (SAP MC), 61SAP MaxDB, 488, 680
execution plan, 695SAP memory area, 389, 399SAP memory configuration, 109, 122SAP memory configuration monitor, 61, 109SAP memory management, 177SAP NetWeaver, 35SAP NetWeaver 7.10, 31, 731SAP NetWeaver Administrator, 61, 664SAP NetWeaver Application Server, 38, 338
Java, 35processes, 283
SAP NetWeaver BW, 26, 35, 341, 449, 541, 763
administration tools, 558data selection, 574frontend, 545high database response times, 564indexing, 568
load profiles, 564optimization, 566performance optimization, 555
SAP NetWeaver BW Accelerator, 555, 558, 605, 763
column-based data retention, 635create index, 630delta index, 633index InfoCubes, 629sizing, 607
SAP NetWeaver BW Accelerator Index, 630
check and switch off, 632SAP NetWeaver BW Administrator Workbench, 558, 559, 571, 574, 588, 630SAP NetWeaver BW detailed statistics, 560SAP NetWeaver BW statistics, 561
in the workload monitor, 563SAP NetWeaver BW workload statistics, 559SAP NetWeaver Enterprise Search, 36, 595, 599, 763SAP NetWeaver Portal, 36, 38, 368SAP NetWeaver Process Integration, 35, 757SAP notes, 773saposcol, 77SAP paging, 377SAP paging memory, 387, 410, 451SAP parameter changes, 116SAP Performance Menu, 739SAP Product Lifecycle Management (SAP PLM), 34SAP R/3, 24SAP R/3 Enterprise, 34SAP Repository Browser, 738SAP roll buffer, 379SAP roll file, 379SAP roll memory, 112, 378, 410SAProuter, 763SAPS, 260, 763SAP service, 282, 289SAP Service Marketplace, 410SAP Solution Manager, 55, 63, 65, 66, 67, 132, 135, 238, 241, 711
368 Book_M.indb 793 10/4/10 12:10:54 PM

794
Index
SAP solutions, 34SAP Standard Application Benchmark, 247, 258SAP Supplier Relationship Management (SAP SRM), 34SAP Supply Chain Management (SAP SCM), 34SAP system, 74
definition, 34SAP System Identifier (SID), 764SAP system service, 763SAP system trace, 739SAP transaction, 457SAP Web Dispatcher, 281, 284, 286, 296SAP work process, 41, 118, 400, 410SAP work process overview, 118Savepoint, 93, 134Scalability, 763
architecture, 44Screen buffer, 717/SDF/E2E_TRACE, 240SE11, 521, 573, 738SE12, 220, 738SE14, 498, 738SE15, 738SE16, 561, 738SE24, 235, 738SE30, 62, 222, 233, 366SE37, 235, 303SE38, 235, 408, 460, 531, 738SE80, 738Search Engine Service (SES), 599Secondary index, 487, 489, 498, 500SELECT * clause, 523Semaphore, 121Sequential read, 213, 497, 690, 692, 693, 695, 696, 697, 699, 700, 701, 703, 706, 707, 709Server, 73, 74, 763Server consolidation, 272, 275Server destination statistics records, 318Server profile, 176Service-level management (SLM), 49, 50, 67, 763Service-level reporting, 54Service maintenance, 226, 363, 366Session, 378
Session failover, 129Session manager, 763SET_PARAMETER_MEMORY_OVERFLOW, 404SET UPDATE TASK LOCAL, 304SEU, 533, 738Shared cursor cache, 92, 97Shared enqueues, 474Shared memory, 376, 450, 764Shared objects
area monitor, 451buffering, 413, 453
Shared Objects, 447, 719area configuration, 450buffering, 449
Shared pool, 91, 92Shared SQL area, 97, 428Shared SQL cache, 97SHMA, 450SHMM, 450, 451Short nametab, 717SICF, 226, 363SID, 550Simulation application, 542Single-record buffering, 416, 418Single-record statistics, 62, 201, 310, 323, 333, 366, 428, 560, 648, 659Single-record table buffer, 413, 718Single statistical record, 201, 242Single statistics, 739Single-transaction analysis, 227SITSMON, 738SITSPMON, 61, 362Sizing, 247, 355
initial, 249, 254throughput-based, 251T-shirt, 249user-based, 250
Sizing process, 248Skeleton, 674Slave index server, 617, 621Slice and dice, 544SM01, 738SM02, 738SM04, 309, 738SM12, 464, 477, 738SM13, 107, 122, 300, 653, 738
368 Book_M.indb 794 10/4/10 12:10:54 PM

795
Index
SM21, 107, 122, 381, 738SM24, 450SM30, 500SM36, 738SM37, 591, 738SM39, 738SM49, 738SM50, 61, 118, 230, 289, 304, 309, 363, 407, 460, 652, 659, 681, 738SM51, 75, 118, 127, 738SM56, 470, 738SM58, 321, 738SM59, 311, 312, 321, 738SM63, 738SM65, 738SM66, 119, 125, 289, 304, 309, 363, 459, 652, 681, 738SM69, 738S_MEMORY_INSPECTOR, 231SMGW, 309SMICM, 61, 138, 341, 363, 728, 738SMLG, 124, 289, 295, 654, 738Snapshot, 622SNRO, 469Solution monitoring, 63, 67Sort heap, 665Special performance problem, 170, 177Spool service, 283, 289, 290SPRO, 578, 739SQL code, 523SQLJ, 369SQL Query Engine Plan Cache, 671SQL Server, 686SQL statement, 94, 96, 479, 487, 508, 514, 523
expensive, 657SQL statement optimization, 68SQL statistics, 96, 98, 443, 480, 482, 711
analysis, 99DB2, 667, 668DB2 for IBM i, 671Informix, 678MaxDB, 682, 688
SQL trace, 62, 99, 209, 211, 215, 243, 443, 480, 482, 485, 519, 520, 659, 739SQL-Trace
J2EE, 711ST01, 739ST02, 61, 109, 265, 392, 401, 405, 436, 449, 451, 476, 578, 660, 715, 739ST03, 61, 157, 177, 185, 289, 310, 315, 739ST03G, 61, 155, 157, 185ST03N, 61, 154, 157, 177, 185, 267, 289, 310, 315, 323, 364, 559, 561, 563, 648ST04, 61, 89, 115, 121, 480, 663, 739ST05, 62, 99, 209, 334, 480, 565, 659, 739ST06, 61, 75, 80, 84, 100, 104, 116, 120, 265, 335, 658, 670, 739ST06N, 75ST07, 62, 181, 739ST08, 739ST09, 739ST10, 659, 739ST11, 739ST12, 223, 227, 228ST14, 62, 739ST22, 403, 739STAD, 154, 185, 202, 310, 317, 323, 333, 335, 366, 648ST-A/PI, 227Star join execution plan, 568Star Schema, 546STAT, 202, 310, 428, 659, 739Statement cache, 687Statistical record, 202Statistics records, 152, 335, 648
distributed, 152STATTRACE, 155, 185, 206Stemming, 600STMS, 739Stock, 543Stopped work processes, 123STORAGE_PARAMETERS_WRONG_SET, 397, 403, 406, 409Storage subsystem
buffer, 42Storage subsystem optimization, 68Stored Procedure, 687Structured Query Language (SQL), 764STUN, 61, 739
368 Book_M.indb 795 10/4/10 12:10:54 PM

796
Index
SUBMIT, 378Support package, 764Swap space, 78, 376, 389, 391, 410, 764SWNCMONI, 161SXMB_MONI, 739Synchronous RFC, 307Synchronous update, 303System administration, 68System buffer, 413System consolidation, 272, 276System Global Area (SGA), 91System landscape, 272, 764System log, 738System messages, 738SYSTEM_NO_MORE_PAGING, 388SYSTEM_NO_ROLL, 404System-wide work process overview, 125, 738
T
TABL, 418Table access statistics, 429, 500, 659Table analysis, 737Table buffer, 42, 205, 413, 418, 445Table buffering, 369, 416
ABAP, 428Java, 444
Table call statistics, 429Table definition buffer, 716Table locks, 462Table maintenance, 500Table size, 438Table statistics, 104, 495TABLP, 418Tags, 359Task type, 161TCURR, 440Technical analysis, 415Technical optimization, 22Technical tuning, 59Temporary performance problem, 171Temporary sequential objects (TemSe), 764Textedit Control, 330Text search, 599
Think time, 292Thread, 678Throughput, 160, 168Time dependency, 551, 555Time dimension, 552Time-flow hierarchy, 227Time profile, 186Trace level, 240Training, 768Transaction, 457, 765Transactional RFC, 307, 320, 765Transaction code, 765Transaction data, 426Transaction profile, 178Transaction-specific dialog monitor, 727Transaction step, 159, 162Transaction variants, 532Transferred data volume, 331Transforming, 546Transmission Control Protocol/Internet Protocol, 764Transport, 765Transport domain, 765Transport Domain Controller (TDC), 764Transport management system, 739Transport Management System (TMS), 765Transport Organizer (TO), 765Tree, 570TREX, 26, 36, 284, 763, 765
applications, 599architecture, 601compression, 597distributed installation, 617fundamentals, 596monitor server utilization, 610performance analysis, 609process of a query, 602Python trace, 615reorganize, 618replication, 622SAP NetWeaver BW Accelerator, 605search functions, 600server overview, 611, 612sizing, 604tools, 607workload overview file, 614
368 Book_M.indb 796 10/4/10 12:10:54 PM

797
Index
TREX, 42, 595optimization, 616
TREXADMIN, 121, 607, 612, 618, 623, 739TREX administration, 739tRFC table, 322T-shirt sizing, 249TSV_TNEW_PAGE_ALLOC_FAILED, 403TSV_TNEW_PG_CREATE_FAILED, 388TU02, 739Tune summary, 109
U
Unicode, 269, 270, 377, 400Uniform Resource Locator (URL), 765Unit dimension, 552UNIX, 32, 83, 394, 397Update, 107, 298Update request, 299Update service, 283, 289
deactivated, 653Update types, 302Update work process, 301Upgrade, 269User-based sizing, 250User call, 92User connection, 37User context, 163, 378, 765User exits, 254User kernel thread (UKT), 680User list, 738User Management Engine (UME), 368User monitor, 309User profile, 181, 186
V
V1 update, 302V2 update, 302V3 update, 302VA01, 178, 181, 203VA03, 178Value per unit, 543VBBE, 472
VBDATA, 300VBHDR, 300, 438, 503VBMOD, 300Vertical scalability, 44Virtual Machine Container (VMC), 277, 281, 322, 765Virtual main memory, 410Virtual memory, 376, 765Virtual memory required, 392Virtual portion, 677VL01N, 203VMC, 322VMC service, 283
W
Wait situations, 455Wait time, 648Web application, 340, 347Web Dynpro, 765Web Dynpro for ABAP, 40, 329, 339, 357, 363
runtime analysis, 226Web Dynpro for Java, 329, 339, 367, 368Web reporting, 545WebRFC, 349, 352Web services, 37, 339
ABAP, 362monitor calls, 366
Web templateprecalculation, 581
Web UI, 340WebView, 192WGate, 348, 353Where clause, 517Wide area network (WAN), 44, 765Windows, 32, 83, 396, 398Workbench Organizer (WBO), 765Work center, 368Workload analysis, 151, 152, 161, 169Workload distribution log, 356Workload monitor, 61, 153, 154, 157, 161, 177, 289, 310, 323, 364, 560, 648, 739
central, 184, 185
368 Book_M.indb 797 10/4/10 12:10:55 PM

798
Index
Loren Heilig
Understanding SAP NetWeaver Identity Management
Whether you’re thinking about an identity management solution for yourcompany, are currently implementing one, or are already working with SAP NetWeaver Identity Management, this book covers all important aspects for the selection, implementation, and operation of the solution.Take advantage of proven concepts and tips from the authors, and learnSAP NetWeaver IdM from A to Z.
300 pp., 2010, 69,95 Euro / US$ 69.95
ISBN 978-1-59229-338-4
>> www.sap-press.com
Provides all functional details on the successor of CUA
Describes integration with SAP NetWeaver and SOA landscapes
Includes two detailed real-life scenarios
www.sap-press.com
Java, 189Workload overview, 186Work process, 121, 124, 283, 291, 766
analysis, 652insufficient, 655JVM, 133private mode, 653terminated, 652
Work process monitor, 304, 363Work process overview, 61, 118, 289, 309, 459, 460, 681, 738Work process overview, 659Work process time, 648Work process types, 159Work set, 368
World Wide Web (WWW), 766WRKSYSSTS, 670
Z
Zero Administration Memory Management, 113, 385, 410ztta/roll_area, 379, 384ztta/roll_extension, 380, 384, 402, 406ztta/roll_first, 381, 383, 384
368 Book_M.indb 798 10/4/10 12:10:55 PM