Embed Size (px)
DESCRIPTION
Social Assistance Programs: Cost, Coverage, Targeting and Poverty Impact
Citation preview
September, 2009
Social Assistance Programs: Cost, Coverage, Targeting and
Poverty Impact
Human Development Sector Unit
BULGARIA
i
Report No. 47793-BG
BULGARIA: Social Assistance Programs: Cost, Coverage, Targeting and Poverty Impact September, 2009 Human Development Sector Unit Europe and Central Asia Region The World Bank
i
CURRENCY AND EQUIVALENT UNITS
Currency unit = Bulgarian leva (BGN) US$1 = BGN 1.50
(On March 9, 2008)
FISCAL YEAR January 1–December 31
ACRONYMS AND ABBREVIATIONS
ALMP active labor market programs BEEPS Bank Environment and Enterprise Performance Survey BGN Bulgarian-denominated leva ECA Europe and Central Asia EU European Union EUR Euro (€) GDP gross domestic product GMI guaranteed minimum income HBS Household Budget Survey ILO International Labor Organization LFP labor force participation LFS Labor Force Survey MES Ministry of Education and Science MLSP Ministry of Labor and Social Policy MOF Ministry of Finance MTHS Multitopic Household Survey NGO nongovernmental organization NMS new member state NSI National Statistical Institute OECD Organization for Economic Co-operation and Development PMT proxy means testing SAA Social Assistance Agency
Vice President: Country Director:
Sector Director: Sector Manager:
Task Team Leader:
Philippe H. Le Houerou Theodore O. Ahlers Tamar Manuelyan-Atinc Jesko Hentschel Lire Ersado
ii
TABLE OF CONTENTS
Table Of Contents ............................................................................................................... iiFIGURES ............................................................................................................................ iiTABLES ............................................................................................................................ iii
Acknowledgements ................................................................................................................... ivExecutive Summary .................................................................................................................... vI. Introduction .................................................................................................................... 1II. Description and Administrative Costs of the Social Assistance System ........................ 3
Guaranteed Minimum Income (GMI) ................................................................................ 3Heating Allowance (HA) .................................................................................................... 4Child Allowance ................................................................................................................. 5Monthly Supplement for Social Integration (MSSI) .......................................................... 6Budget Allocations and Administrative Costs ................................................................... 6Administrative Cost per Beneficiary .................................................................................. 7
III. Coverage, Targeting, Adequacy and Poverty Impact ..................................................... 8Coverage: How Many People Receive Social Protection Benefits? .................................. 8Targeting Accuracy: What Share of the Benefits Reach the Poor? .................................. 13What explains superb targeting performance by the GMI and HA? ................................ 14Adequacy: Are the Benefits Large Enough to Alleviate Poverty? ................................... 16Poverty Impact .................................................................................................................. 17Comparison of Targeting Accuracy Based on Income and Consumption ....................... 20
IV. GMI and Labor Market Incentives ............................................................................... 21Characteristics of GMI Beneficiaries ................................................................................ 22Minimum Wage and GMI Benefit Size ............................................................................ 25Active Labor Market Policies ........................................................................................... 25
Annex A: Statistical Tables of Results .................................................................................... 27REFERENCES ......................................................................................................................... 40
FIGURES
Figure 1 Bulgaria’s public spending on social assistance programs in comparison to OECD and ECA countries ..................................................................................................................... viFigure 2 Coverage of the main social welfare programs ........................................................ viiiFigure 3 Targeting Accuracy of GMI and HA in international comparison ............................ ixFigure 3. 1 Coverage of the main noncontributory social support programs ............................. 9Figure 3. 2 Coverage of Bulgaria's GMI and HA in international comparison ........................ 10Figure 3. 3 Coverage of the Contributory Social Insurance Programs ..................................... 11Figure 3. 4 Targeting Performance of Bulgaria’s Main Noncontributory Programs ............... 14Figure 3. 5 Targeting Accuracy of GMI and HA in International Comparison ....................... 15Figure 3. 6 Benefit Adequacy: Transfers as Share of Household Expenditures, 2007 ............ 17Figure 3. 7 Poverty Reduction Efficiency ................................................................................ 20Figure 3. 8 Targeting Performance of GMI Using Income and Consumption Expenditures ... 21Figure 3. 9 Targeting Performance of HA Using Income and Consumption Expenditures ..... 21Figure 4. 1 GMI Beneficiaries and Active Labor Market Policies .......................................... 26
iii
TABLES
Table 1. 1 Public Spending on Social Insurance and Assistance Programs, 2007 ..................... 2Table 2. 1 Public Spending on and Costs of the Four Targeted Social Assistance Programs, 2007 ............................................................................................................................................ 6Table 2. 2 Total Estimated Program Cost per Beneficiary, 2007 .............................................. 8Table 3. 1 Child Allowance and School Enrolment ................................................................. 10Table 3. 2: Poverty impact of social transfers .......................................................................... 18Table 4. 1 Characteristics of GMI recipients in 2003 and 2007 ............................................... 22Table 4. 2 Education and Labor Market Outcomes .................................................................. 23Table 4. 3 Ethnic Groups and Labor Market Participation ...................................................... 24Table 4. 4 Reasons Given for Inactivity among Working Age Women Not in School or Retirement ................................................................................................................................ 24Table A. 1 Coverage: Income Deciles ..................................................................................... 27Table A. 2 Coverage: Consumption Deciles ........................................................................... 27Table A. 3 Benefit Incidence: Income Deciles ........................................................................ 28Table A. 4 Benefit Incidence: Consumption Deciles .............................................................. 28Table A. 5 Adequacy: Income Deciles .................................................................................... 29Table A. 6 Adequacy: Consumption Deciles .......................................................................... 29Table A. 7 Cost Benefit Analysis: Income Deciles ................................................................. 30Table A. 8 Cost-Benefit Ratios: Consumption Deciles ........................................................... 31Table A. 9 Undercoverage and Leakage: Per capita Income .................................................. 32Table A. 10 Undercoverage and Leakage (per capita consumption) ...................................... 33
iv
ACKNOWLEDGEMENTS This report on the effectiveness of the social welfare programs in Bulgaria is a product of the Bulgaria Programmatic Poverty Monitoring task. The report is prepared by the task team led by Lire Ersado and comprising Rasmus Heltberg and Phillippe Leite. The discussions on the administrative costs of social programs relied on a background paper by George Shopov (Consultant). The report benefited from Gordon betcherman, Christian Bodewig and Boryana Gotcheva who read an earlier draft and provided useful comments. The task was undertaken under the guidance of of Orsalia Kalantzopoulos (former Country Director, Eastern Europe and the Balkans), Florian Fichtl (Country Manager, Bulgaria), Tamar Manuelyan Atinc (sector director, ECSHD) and Gordon Betcherman (former sector manager, ECSHD). Regina Nesiama provided able assistance with formatting and production of the report.
v
EXECUTIVE SUMMARY The main objective of this report is to provide an assessment of the effectiveness of Bulgaria’s main social welfare and child protection programs in terms of their coverage and targeting of the intended beneficiaries, adequacy and poverty impact. The report reviews the administrative costs associated with and cost-benefit effectiveness of each of the main social welfare and child protection programs. The report highlights the significance of safeguarding adequate and effective social assistance programs aimed at social inclusion in light of the current global economic crisis, Bulgaria’s large ethnic minority groups and prevalence significant pockets of poverty.1
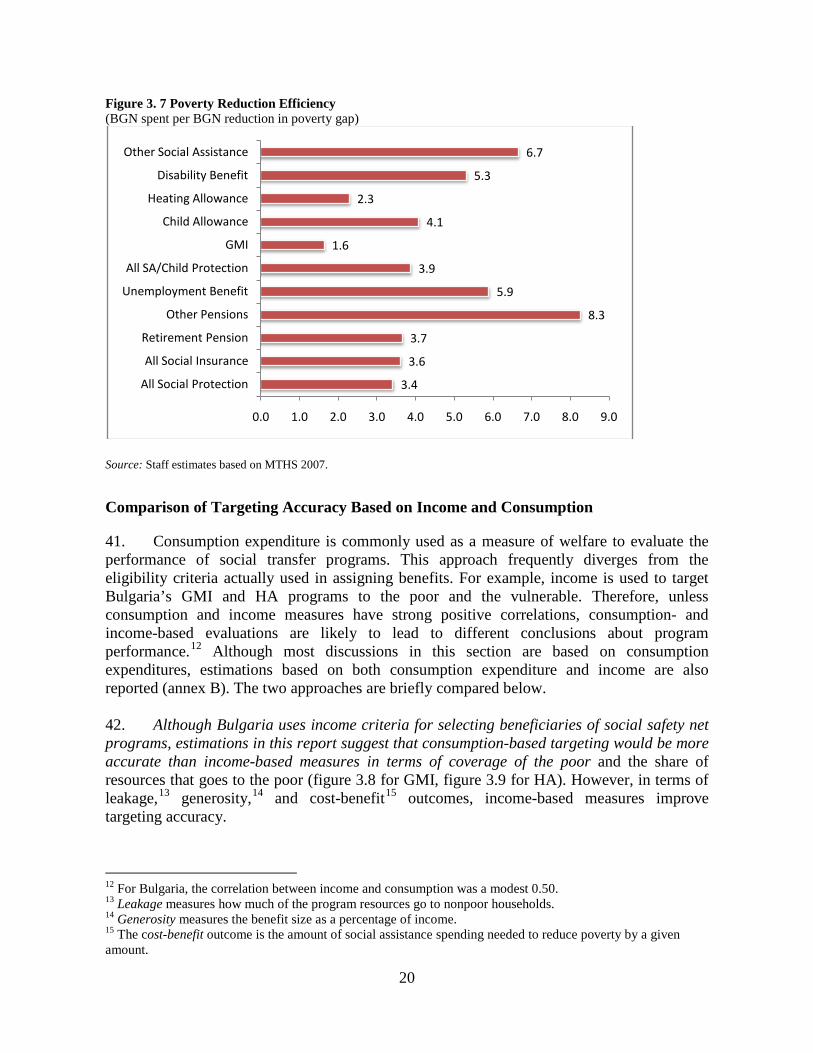
This is essential not only to ensure that the limited resources for targeted social welfare programs are spent well and reach those who need them, but also to improve incentives for enhanced labor market participation and lessen future dependency on social assistance.
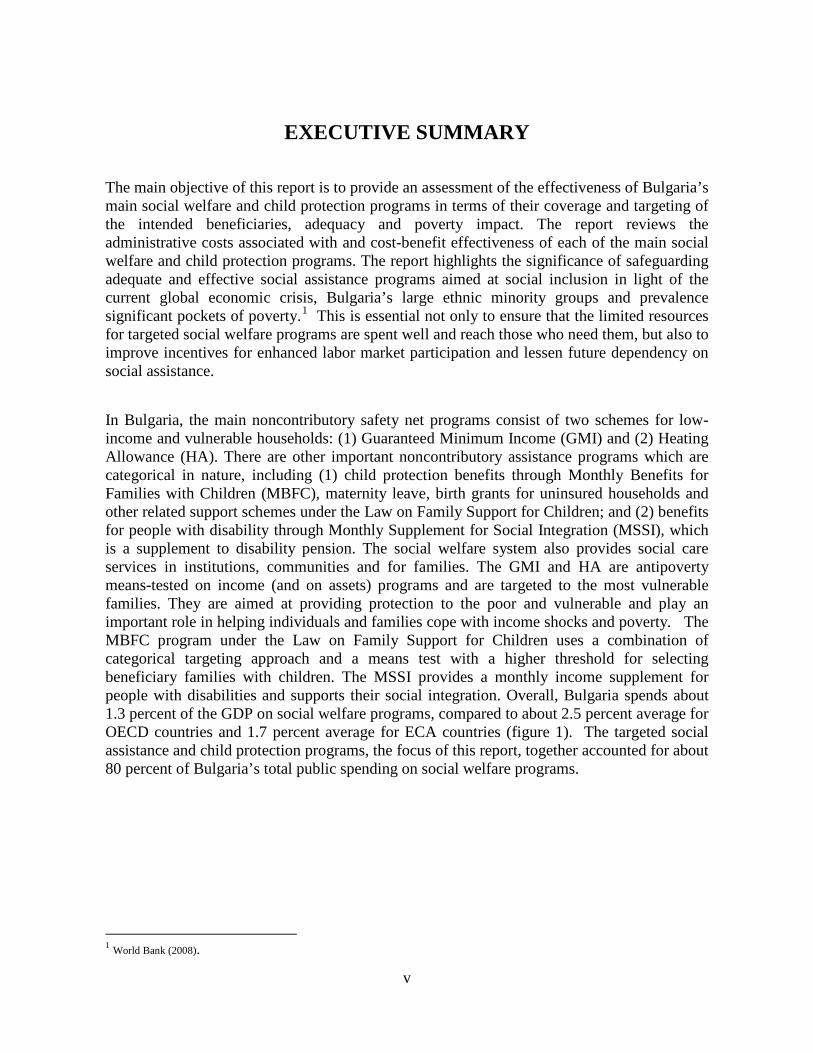
In Bulgaria, the main noncontributory safety net programs consist of two schemes for low-income and vulnerable households: (1) Guaranteed Minimum Income (GMI) and (2) Heating Allowance (HA). There are other important noncontributory assistance programs which are categorical in nature, including (1) child protection benefits through Monthly Benefits for Families with Children (MBFC), maternity leave, birth grants for uninsured households and other related support schemes under the Law on Family Support for Children; and (2) benefits for people with disability through Monthly Supplement for Social Integration (MSSI), which is a supplement to disability pension. The social welfare system also provides social care services in institutions, communities and for families. The GMI and HA are antipoverty means-tested on income (and on assets) programs and are targeted to the most vulnerable families. They are aimed at providing protection to the poor and vulnerable and play an important role in helping individuals and families cope with income shocks and poverty. The MBFC program under the Law on Family Support for Children uses a combination of categorical targeting approach and a means test with a higher threshold for selecting beneficiary families with children. The MSSI provides a monthly income supplement for people with disabilities and supports their social integration. Overall, Bulgaria spends about 1.3 percent of the GDP on social welfare programs, compared to about 2.5 percent average for OECD countries and 1.7 percent average for ECA countries (figure 1). The targeted social assistance and child protection programs, the focus of this report, together accounted for about 80 percent of Bulgaria’s total public spending on social welfare programs.
1 World Bank (2008).
vi
Figure 1 Bulgaria’s public spending on social assistance programs in comparison to OECD and ECA countries
Source: Social Assistance Agency data for Bulgaria; Various World Bank Public Expenditure Reviews; OCED Social Spending Database Five Key Messages. The following five main messages emerge from the analysis and supporting evidence presented in this report:
1. The two main anti-poverty programs of Bulgaria, the Guaranteed Minimum Income (GMI) and the Heating Allowance (HA) are well targeted and among the best performers globally. According to the 2007 household survey data, the lion’s share of the programs resources reach the poor and the majority of the beneficiaries are the poor and vulnerable population and ethnic minorities, particularly the Roma. However, the size of the benefits and their coverage of the poor are quite limited.
2. While the two anti-poverty programs (i.e., GMI and HA) provide significant cushion to the poor and vulnerable, their impact on poverty incidence is rather small. The size of the benefits is not large enough to lift the beneficiaries above the poverty or even extreme poverty thresholds. As a result, their superb targeting performance is not translated into significant poverty reduction.
- 0.50 1.00 1.50 2.00 2.50 3.00 3.50 4.00 4.50 5.00
TajikistanAzerbaijan
TurkeyGeorgiaPoland
Albania Kazakhstan
RomaniaSerbia
KosovoKyrgyzstan
BulgariaLithuania
BelarusEstonia
LatviaArmeniaMoldova
RussiaMacedoniaUzbekistan
OECDUkraine
HungaryBosnia-Herzegovina
Croatia

vii
3. Efforts made to raise employment incentives for beneficiaries of GMI by reducing the
maximum eligibility time for the benefit to 18 months and further down to 12 months in 2008 appear ineffective in placing people into jobs even in times of a buoyant labor market. The measures has raised poverty risks and are contrary to the last resort nature of the GMI program. Moreover, the measures undermine the ability of the GMI program to act as a basic response to the economic crisis for the poorest Bulgarian households.
4. Although not an anti-poverty program, Child Allowance is an important part of the social safety net for poor households. However, there are many poor households with children eligible for benefit but not receiving it.
5. Overall, Bulgaria’s noncontributory social welfare programs are cost effective with administrative costs comprising less than 10 percent of the program resources. However, GMI and HA appear relatively costlier programs to administer due to combinations of factors, including less generous benefit levels, growing scaling-down of the programs, and the means-testing and verification requirements. As such, there may be scope to merge the programs to reduce the cost.
6. GMI and HA can be very effective instruments to leverage government responses to mitigate the impact on the poor of the current global economic crisis. Given the benefit size and coverage are low, but the programs are extremely well targeted, they can be scaled up as temporary policy measures by: (a) expanding coverage and (b) increasing the size of the benefits.
1. Administrative Cost and Cost-Effectiveness. The combined administrative costs of GMI, heating benefit, child allowance, and disability integration supplement accounted for about 9 percent of the total resources for these programs in 2007. Grosh et al. (2008), after examining available studies and various cash transfer programs around the world, conclude that the administrative costs of well-executed programs range from 8 to 15 percent of total costs. With the exception of GMI, all social assistance and child welfare programs of Bulgaria are within this range. The GMI program is slightly outside of the range with the administrative costs accounting for 16 percent of the total cost, making it the most costly program to run. However, it should be noted that the relatively high share of administrative cost of GMI is at least partly explained by its less generous benefit levels and the growing scaling-down of the program with no appreciable changes in fixed administrative costs. Another factor that may be driving the cost up was the large number of application-declarations for the GMI: nearly 357,000 applications were received in 2007. Although only 36.6 percent of the applicants were granted the benefit, the social workers had to verify the eligibility of every applicant before deciding “to pay or not to pay.”
viii
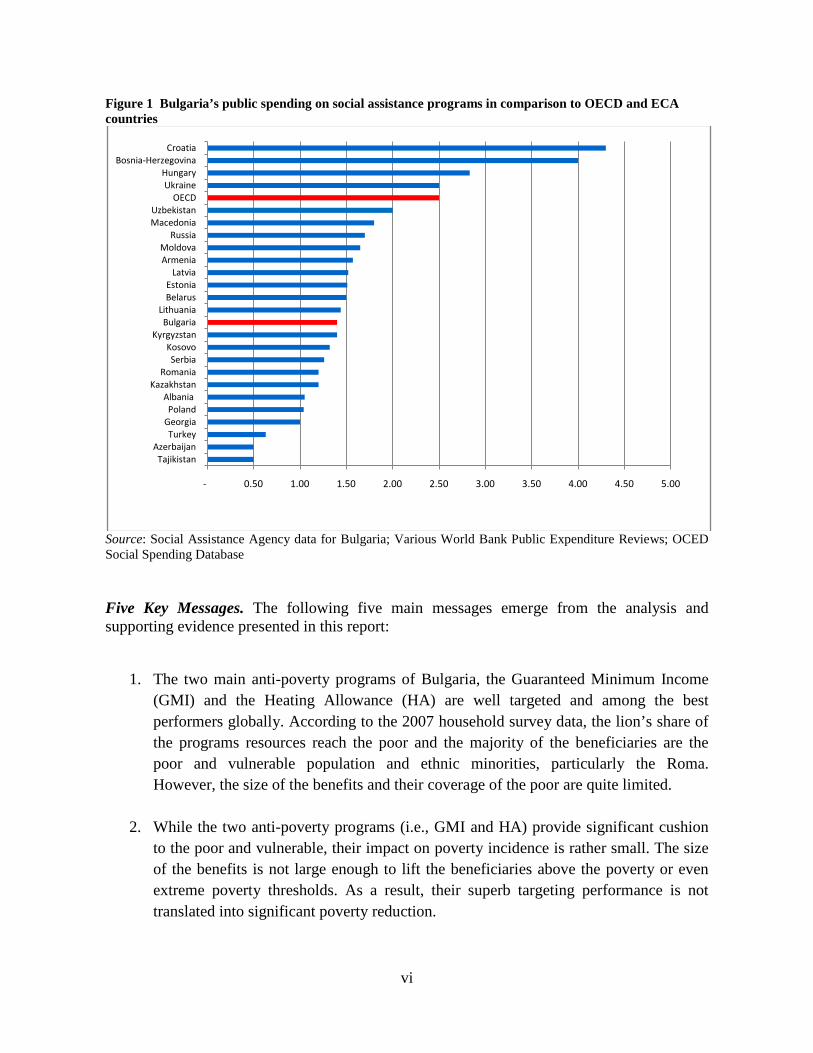
The share of administrative costs for the child allowance was about 4 percent, the lowest administrative costs of the all targeted programs. The cost of running the heating program was a little more than 12 percent of the total budget allocated for the program. Similarly to the GMI program, the need for targeting and verification of eligibility of applicants makes the heating allowance the second most costly program to run. Coverage. The four noncontributory programs reach about 38 percent of all the households with at least one member receiving either one of the benefits: GMI, HA, MBFC, or MSSI. Among these programs, the child protection benefit has the highest coverage (19.6 percent of households have a member receiving it). The disability benefit at about 16 percent coverage of the households is the next highest. Based on self-reported disability status, about 70 percent of people with severe disabilities (in excess of 70 percent) were covered by the disability benefit. The HA and GMI benefits, the main anti-poverty programs, have low coverage at 4.2 percent and 3.8 percent, respectively. However, the programs’ coverage of the poor, the very poor and the bottom 20 percent of the population is impressive. For example, GMI and HA, despite very low coverage of the overall population, they reach about 36 and 33 percent of the very poor, due to their impressive targeting performance (see next section). Similarly child allowance reaches over 60 percent of the bottom quintile and about 36 percent of the poor. The overall social welfare program benefits reach over 83 percent of the very poor and about 70 percent of the bottom quintile. Figure 2 Coverage of the main social welfare programs
Source: MTHS 2007
83.3
61.1
37.4
35.5
32.7
69.9
41.4
30.4
15.8
15.5
66.0
36.2
33.9
11.4
12.1
32.6
19.6
14.0
0.9
2.0
38.4
23.1
16.2
3.8
4.2
0.0 10.0 20.0 30.0 40.0 50.0 60.0 70.0 80.0 90.0
All SA/Child Allowance
Child Allowance
Disability Benefit
GMI
Heating Allowance
All Nonpoor Poor Bottom 20% Very Poor
ix
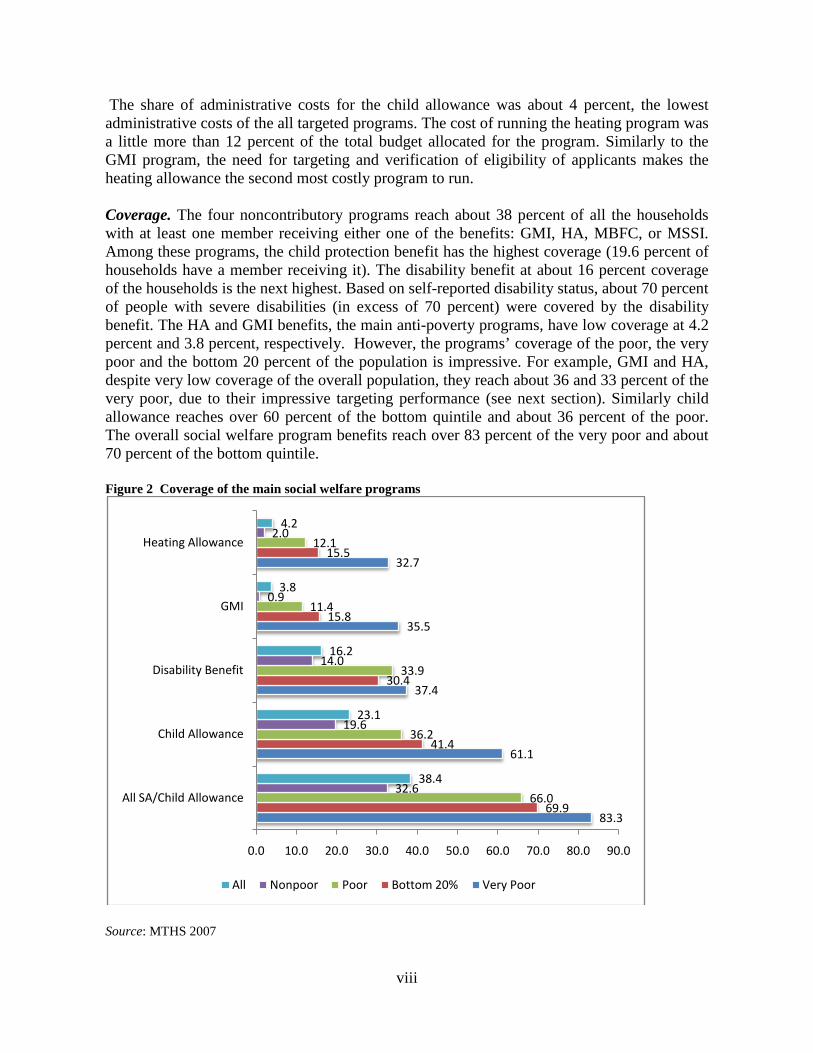
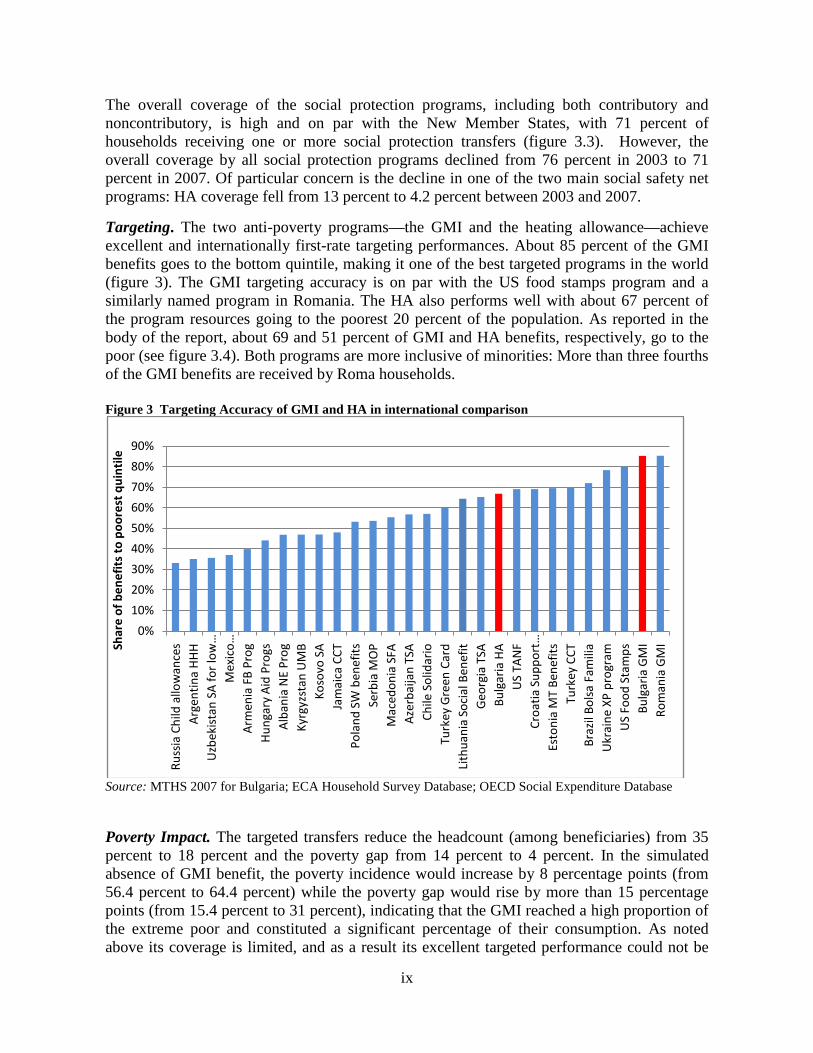
The overall coverage of the social protection programs, including both contributory and noncontributory, is high and on par with the New Member States, with 71 percent of households receiving one or more social protection transfers (figure 3.3). However, the overall coverage by all social protection programs declined from 76 percent in 2003 to 71 percent in 2007. Of particular concern is the decline in one of the two main social safety net programs: HA coverage fell from 13 percent to 4.2 percent between 2003 and 2007. Targeting. The two anti-poverty programs—the GMI and the heating allowance—achieve excellent and internationally first-rate targeting performances. About 85 percent of the GMI benefits goes to the bottom quintile, making it one of the best targeted programs in the world (figure 3). The GMI targeting accuracy is on par with the US food stamps program and a similarly named program in Romania. The HA also performs well with about 67 percent of the program resources going to the poorest 20 percent of the population. As reported in the body of the report, about 69 and 51 percent of GMI and HA benefits, respectively, go to the poor (see figure 3.4). Both programs are more inclusive of minorities: More than three fourths of the GMI benefits are received by Roma households. Figure 3 Targeting Accuracy of GMI and HA in international comparison
Source: MTHS 2007 for Bulgaria; ECA Household Survey Database; OECD Social Expenditure Database Poverty Impact. The targeted transfers reduce the headcount (among beneficiaries) from 35 percent to 18 percent and the poverty gap from 14 percent to 4 percent. In the simulated absence of GMI benefit, the poverty incidence would increase by 8 percentage points (from 56.4 percent to 64.4 percent) while the poverty gap would rise by more than 15 percentage points (from 15.4 percent to 31 percent), indicating that the GMI reached a high proportion of the extreme poor and constituted a significant percentage of their consumption. As noted above its coverage is limited, and as a result its excellent targeted performance could not be
0%
10%
20%
30%
40%
50%
60%
70%
80%
90%
Russ
ia C
hild
allo
wan
ces
Arg
entin
a H
HH
Uzb
ekis
tan
SA fo
r lo
w …
Mex
ico …
Arm
enia
FB
Prog
Hun
gary
Aid
Pro
gsA
lban
ia N
E Pr
ogKy
rgyz
stan
UM
BKo
sovo
SA
Jam
aica
CCT
Pola
nd S
W b
enef
itsSe
rbia
MO
PM
aced
onia
SFA
Aze
rbai
jan
TSA
Chile
Sol
idar
ioTu
rkey
Gre
en C
ard
Lith
uani
a So
cial
Ben
efit
Geo
rgia
TSA
Bulg
aria
HA
US
TAN
FCr
oatia
Sup
port
…Es
toni
a M
T Be
nefit
sTu
rkey
CCT
Braz
il Bo
lsa
Fam
ilia
Ukr
aine
XP
prog
ram
US
Food
Sta
mps
Bulg
aria
GM
IRo
man
ia G
MISh
are
of b
enef
its
to p
oore
st q
uint
ile
x
translated into substantial reduction in overall poverty. Moreover, even for those families receiving the targeted anti-poverty benefits, their impact on poverty reduction is limited given small benefit sizes. A small increase in the benefit size, particularly of the GMI and HA, could have a substantial impact on poverty headcount and poverty gap reduction. For example, if GMI benefits were increased by 50 percent, the poverty rate among GMI beneficiaries would decline from 56 percent to only 20 percent. Labor Market Implications. The Bulgarian authorities have introduced measures to tighten eligibility for able-bodied adult GMI beneficiaries. Despite the recent sustained decline in unemployment, working age persons with little education have particular difficulties in finding jobs and are often economically inactive. GMI beneficiaries are among the least educated, with an average of 6.3 years of completed schooling in 2007, almost half the average for non-GMI beneficiaries. Therefore, the chance of finding a gainful employment for individuals currently receiving GMI benefits are rather low, in light of their low educational attainment. Further tightening the GMI benefit could therefore put beneficiaries at heightened risk of deep and severe poverty, without inducing much labor market participation.
1
I. INTRODUCTION 2. Bulgaria has a long record of social protection programs and institutional arrangements for delivering income support and other benefits to the population. Both contributory social insurance schemes and noncontributory social assistance benefits and social services are in common use: (1) social insurance programs, including pensions; (2) passive and active labor market measures; and (3) the noncontributory safety net and social service programs. Bulgaria’s social protection system plays an important role in helping individuals and families cope with income shocks and poverty. The coverage of the social protection system is broad: more than 71 percent of the population benefited from some form of social protection transfer in 2007, either directly or indirectly through the sharing of benefits within the household. The fact that Bulgaria has significant ethnic minority groups and large pockets of poverty adds to the significance of having adequate and effective social assistance programs and policies aimed at social inclusion and more equitably shared growth.2
Membership in the European Union (EU) has also lent urgency to such programs as important elements of the social inclusion agenda for member states.
3. The contributory social insurance benefits include pensions, unemployment benefits, and short-term insurance-based benefits in case of temporary incapacity to work. They are conditional on formal employment and social insurance contribution compliance. Contributions are made, as in the other EU member states, by employers, employees, and the state. Apart from the contributory pensions, the pension system allows the provision of several types of “no work-related pensions” such as survivor’s pensions, civil and military disability pension, old age social pension, pension for special merits, social disability pension, and personal pension. 4. The social assistance and child protection programs, on the other hand, are noncontributory in nature. The noncontributory safety net programs consist of two main anti-poverty schemes for low-income and vulnerable households: (1) Guaranteed Minimum Income (GMI) and (2) Heating Allowance (HA).There are noncontributory support programs which are categorical in nature, including (1) child protection benefits through Monthly Benefits for Families with Children (MBFC), maternity leave, birth grants for uninsured households and other related support schemes under the Law on Family Support for Children; and (2) benefits for people with disability through Monthly Supplement for Social Integration (MSSI), which is a supplement to disability pensions. The social assistance system also provides social care services in institutions, communities and for families. The GMI and HA are means-tested on income (and on assets) and are targeted to the most vulnerable families. The MBFC program under the Law on Family Support for Children uses a combination of categorical targeting approach and a means test with a higher threshold for selecting beneficiaries. The MSSI provides a monthly income supplement for people with disabilities
2 World Bank (2008).
2
and supports their social integration. Thus, the mix of noncontributory social support programs in Bulgaria is similar to that of OECD countries, with an emphasis on family allowances (child allowances, birth grants, etc.), social pensions, heating and housing allowances, and targeted anti-poverty “last-resort” programs.
5. According to data from Social Assistance Agency (SAA), Bulgaria spent about BGN 623 million on all social assistance programs in 2007 from which the core programs described above accounted for more than 81 percent (table 1.1)3
In other words, they accounted for almost 2.5 percent of total public spending and 1 percent of GDP in 2007. While the bulk of public spending on overall social protection programs goes to pensions, the targeted social assistance programs nevertheless provide a vitally needed cushion against poverty and vulnerability and represent a nonnegligible amount of total public spending. The main role of Bulgaria’s main social assistance programs is to close the income gap for the poor, as well as to help beneficiaries’ join the labor market or to give them access to essential basic services (e.g., to improve access to health care centers for families without health insurance).
Table 1. 1 Public Spending on Social Insurance and Assistance Programs, 2007
Social insurance and assistance categories
Spending (BGN
million)
Spending as percent of
Total public spending
Spending as percent of Total social insurance, social assistance, and social care spending
Social spending
as percent of GDP
Pensions 4,691 22.9 64.8 8.3 The four targeted social assistance and child protection programs 504.6 2.5 7.0 0.9 Other social insurance, social assistance and social care 2,039 10.0 28.2 3.6 Social insurance, social assistance, and social care (total) 7,235 35.3 100.0 12.8
Source: Staff estimations based on data from the Ministry of Finance, Social Assistance Agency of the Ministry of Labor and Social Policy, and the National Statistics Institute (NSI).
6. The two main means-tested programs (the GMI and the HA), due to their targeted nature, are amenable to objective assessment of their efficiency and impact on poverty reduction. Because the Bulgarian authorities face the challenge of ensuring the protection of the poor and adequate work incentives, understanding the effectiveness of these benefit programs has become imperative. It is important to understand, for example, how tightening the GMI would affect the incidence of poverty among families and individuals, particularly those with no viable chance in the labor market. This report attempts to provide a broad picture of these programs and their coverage, targeting effectiveness, adequacy, and poverty impact, as well as the administrative costs associated with each of the programs. Understanding these issues is essential not only to ensure that the limited resources for targeted social assistance are spent well and reach those who need them, but also to improve incentives for enhanced labor market participation and lessen future dependency on social welfare handouts.
3 See section 2 for detailed breakdown by targeted social assistance programs.
3
7. The report uses data from the Multitopic Household Survey (MTHS) of 2003 and 2007. In addition to these nationally representative and comparable household survey data, the following sources of information are used: (1) sociological survey of the administration and implementation of the four targeted social assistance programs at local, regional, and national level in 2007; and (2) administrative data from the SAA and budget allocations for these targeted programs in 2007. The report is unique not only because it is based on comparable household data over a period of time that straddled Bulgaria’s EU accession, but also because it brings together administrative, qualitative, and quantitative data.
II. DESCRIPTION AND ADMINISTRATIVE COSTS OF THE SOCIAL ASSISTANCE SYSTEM
8. Bulgaria has made significant progress in poverty reduction, but pockets of poverty still persist—among household with many children, the unemployed, the less-educated, and the Roma ethnic minority communities (World Bank, 2008). The country has a long record of social assistance programs and institutional arrangements for delivering income support and other benefits to the poor. Since 2003, all social assistance programs have been fully financed by the state budget, with clear division of responsibilities for planning and implementation of the benefits and services between the state and local authorities. The Ministry of Labor and Social Protection has been put in charge of the planning, design, and monitoring of these programs. Program delivery (including identification of beneficiaries, application of the targeting methods, and verification of eligibility) is delegated to the SAA within the MLSP. The successful delivery of social assistance benefits also depends on other institutions and agencies such those in charge of the personal identification registry, civil registry, income and property tax collection, registration of the unemployed, registration of labor contracts, cadastre and land register, as well as the national statistics, banking, and postal services which provide channels for payment of benefits and collection of statistical data as well as capacity to monitor needs of individuals and families.
Guaranteed Minimum Income (GMI)
9. The objective of the GMI, income source of last resort, is the protection of the poor and vulnerable. It was introduced in 1991 to assist individuals and families who fell below a certain income level and to provide a cash benefit. The benefit is intended to fill the gap between household income and the program threshold established by the Council of Ministers (usually annually) as the cost of a basket of essential food (hence guaranteed minimum income). It is set below the minimum wage, social pension or lowest unemployment benefit. 10. The GMI program is means and income tested. Determination of eligibility is based on the incomes of the beneficiaries (persons or families), their assets, family size, health and
4
employment status, age, and other observed circumstances. The normative income used to estimate the income gap is adjusted by age, family size, composition, and other circumstances using a set of coefficients (differentiated minimum income). The actual monthly GMI benefit equals the difference between the differentiated minimum income or the sum of the differentiated minimum incomes and the actual incomes received by the beneficiary during the month preceding the application. The GMI program covers all persons and families whose income is lower than the normative minimum income and who meet other social assistance requirements stipulated in the Social Assistance Act. GMI support is provided after the applicant completes a detailed social status questionnaire and a social worker verifies the information provided, taking into consideration other findings established during the social inquiry.
Heating Allowance (HA)
11. Also means-tested, the HA or energy benefit is intended to mitigate increases in energy and heating prices during the heating season. The targeting mechanism is similar to and based on the GMI. Individual eligibility is defined with differentiated minimum income for heating which—as in the case of the differentiated minimum income for monthly social assistance—is the GMI multiplied by a coefficient reflecting: household type; the beneficiary’s age, ability to work, and disability status; and the presence in the household of children, their ages and disability status, and so forth. The monthly amount of the energy benefit is determined based on norms of minimum consumption of electricity, district heating, wood, or coal in the heating season (November to April). The administrative costs of the HA were about 12 percent of its total cost, making it slightly cheaper to administer than the GMI. However, similarly to the GMI, the costs increased between 2004 and 2007 due to high demand—357,000 applications in 2007—of which 58,000 were rejected during the verification process. The HA uses the same GMI certification process, which includes documentation verification and home visits. Because 42 percent of HA beneficiaries also received GMI, the coordination of the programs could save staff time and program costs. The Ministry of Labor and Social Policy has introduced measures to strengthen design and delivery of the heating benefit. The new measures, implemented with the winter season 2008/2009 were in part due to high administrative cost of the program which was previously delivered in kind and recipient feedback on delays of the supply with heating materials, low quality of the heating materials and the undesirable existence of a secondary market of heating vouchers. The most important changes in the design and delivery of the Energy Benefit program are as follows: (i) all eligible energy benefit beneficiaries now are entitled to, and receive only cash support for the heating season irrespective of the type of heating they use; (ii) the benefit is extended as a lump-sum, which is paid at once before the beginning of the heating season; (iii) all eligible beneficiaries receive the same/uniform amount of the benefit. Further changes include the harmonization of the income threshold determination methodology with that for the GMI benefit. Unfortunately, the current study will not be able to analyze the impact of these measures as it is based on an earlier 2007 household survey.
5
Child Allowance
12. The child protection programs cover over 1 million children. Households with children receive benefits under the Family Support for Children Act of 2002. Bulgaria had child allowances before 2002, but the previous entitlements, under legislation enacted in 1968, were universal in nature. With the Family Support for Children Act, a set of five child benefits was introduced to promote the investment in children by supplementing the income of low- and middle-income families and raising school attendance. The benefits are:
• Monthly child allowance for children up to the age of 18 (20 if attending school). Determination of eligibility is based on an income test—only families with monthly income below a per capita income threshold set in accordance with the State Budget Act for the respective year and adjusted annually.4
• An income-tested monthly allowance for rearing children up to one year of age. If the child is born with disabilities, the allowance is extended irrespective of income and until the child becomes 2 years old. Eligible are mothers with incomes below the set threshold who are looking after a young child and are not entitled to social insurance for maternity. The benefit could be provided in cash or in-kind, upon the decision of the social worker.
The monthly child allowance is a conditional cash transfer-type program, paid if the child attends school, and attendance is verified monthly by the SAA Offices.
• A one-time, targeted allowance for first graders from poor families to compensate for expenditures associated with preparing for school. The benefit is income tested and conditional on verification of the child’s enrolment in first grade.
• A one-time, income-tested allowance for pregnancy and child birth, which is aimed at compensating for loss of income in the 45 days immediately before giving birth. It is given to pregnant women and mothers who have no social insurance for maternity and with per capita income below a certain threshold.
• A universal grant for giving birth to a child.
• Monthly allowance for children aged between 3 and 6 years of age if they have to be looked after at home because of lack of kindergarten capacity.
13. According to Shopov (2008), annual staff working time on child allowance is similar to the time spent on the GMI and the HA. However, the time spent on activities under the “targeting accuracy” group was 75 percent lower than the GMI. The determination of eligibility absorbed about 20 percent of the administrative time of both the GMI and child allowance. However, the time spent for home visits, monitoring, and evaluation was much lower for child allowance than for GMI. Estimations based on the 2007 MTHS show that the coverage of the child allowance among the poorest 10 percent and 20 percent of households with children is much lower than for both GMI and HA programs.
4 For example, in 2002 it was BGN 150; in 2008 it increased to BGN 300.
6
Monthly Supplement for Social Integration (MSSI)
14. The MSSI assistance for people with disabilities covered about 500,000 persons in 2007. Administrative cost took up 10 percent of the total program spending. Due to the nature of the program, this cost is explained by the need for home visits and higher time spent on monitoring and control of beneficiaries. Applicants need to prove their disability through documentation. Then social workers define the size of the benefit to be received by each applicant, according to their needs. The social worker can divide the benefit into three groups: transportation, nutrition and medicines, training, and treatment and rehabilitation. The program is not income targeted but categorical in that a specific population group is the target group and the benefit is defined to fill the applicant’s needs gap in each of the three groups. 15. Social assistance for people with disabilities includes a monthly income supplement for their social integration and targeted monthly support for the families of disabled children. The monthly income supplement for social integration is part of the package of social and economic support for disabled individuals and their families to facilitate their social and labor market integration. The integration component of the disability benefit, introduced in 2005 under the Act on Integration of People with Disabilities, complements the disability pension or other income received by disabled persons. It covers expenses for transportation, information and telecommunication services, training, rehabilitation, dietary food, medicines, access to information, and other needs. The supplement for social integration is categorical and based on individual needs. The monthly support for the families with children with permanent disabilities is categorical (extended for all children with disabilities up to the age of 18, or 20 if attending school) and fixed at 70 percent of the minimum age. 16. Finally, all of the core noncontributory social benefit programs briefly described above have three common features. First, they are targeted to concentrate the state’s flow of limited resources (social schemes) on the poor, children, and the disabled. The GMI and the HA apply means-testing,5
while the integration benefit and the child allowance combine income testing with a categorical approach (e.g., age, disability level). Second, they have the same source of financing, the state budget from general tax revenue. Finally, they are centrally administered, executed, and monitored by the MLSP through its SAA.
Budget Allocations and Administrative Costs
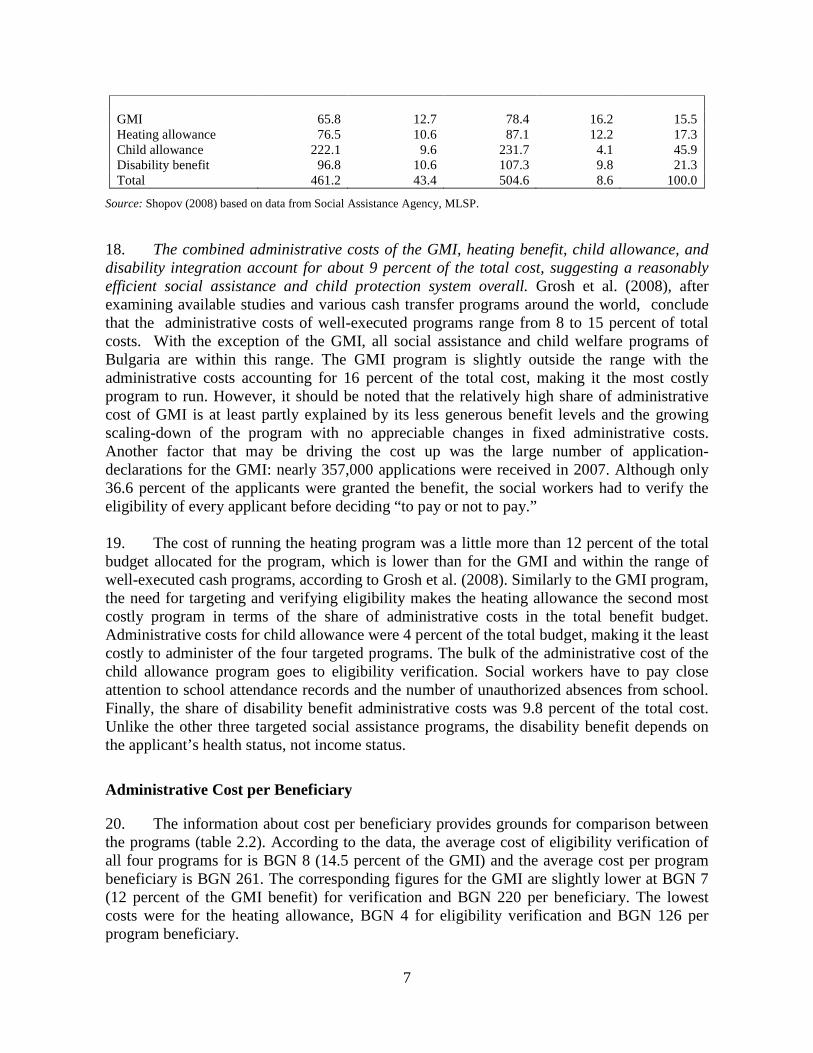
17. More than four fifth of Bulgaria’s social assistance benefits are targeted, that is, directed to specific groups of beneficiaries and paid if the requirements set by law are met (Shopov, 2008). The total budgetary allocations for the core social assistance programs in 2007 amounted to BGN 504.6 million, slightly more than 81 percent of all social assistance outlays by the SAA (table 2.1). Table 2. 1 Public Spending on and Costs of the Four Targeted Social Assistance Programs, 2007
Social Assistance
Payment to beneficiaries
(BGN million) (1)
Administrative cost
(BGN million) (2)
Total allocation (BGN million)
(1) + (2)
Share of administrative
cost (%) (2) / (1 + 2)
Share of total targeted
spending (%)
5 Except the monthly supplements for social integration of people with disabilities which are not income-tested.
7
GMI 65.8 12.7 78.4 16.2 15.5 Heating allowance 76.5 10.6 87.1 12.2 17.3 Child allowance 222.1 9.6 231.7 4.1 45.9 Disability benefit 96.8 10.6 107.3 9.8 21.3 Total 461.2 43.4 504.6 8.6 100.0
Source: Shopov (2008) based on data from Social Assistance Agency, MLSP.
18. The combined administrative costs of the GMI, heating benefit, child allowance, and disability integration account for about 9 percent of the total cost, suggesting a reasonably efficient social assistance and child protection system overall. Grosh et al. (2008), after examining available studies and various cash transfer programs around the world, conclude that the administrative costs of well-executed programs range from 8 to 15 percent of total costs. With the exception of the GMI, all social assistance and child welfare programs of Bulgaria are within this range. The GMI program is slightly outside the range with the administrative costs accounting for 16 percent of the total cost, making it the most costly program to run. However, it should be noted that the relatively high share of administrative cost of GMI is at least partly explained by its less generous benefit levels and the growing scaling-down of the program with no appreciable changes in fixed administrative costs. Another factor that may be driving the cost up was the large number of application-declarations for the GMI: nearly 357,000 applications were received in 2007. Although only 36.6 percent of the applicants were granted the benefit, the social workers had to verify the eligibility of every applicant before deciding “to pay or not to pay.” 19. The cost of running the heating program was a little more than 12 percent of the total budget allocated for the program, which is lower than for the GMI and within the range of well-executed cash programs, according to Grosh et al. (2008). Similarly to the GMI program, the need for targeting and verifying eligibility makes the heating allowance the second most costly program in terms of the share of administrative costs in the total benefit budget. Administrative costs for child allowance were 4 percent of the total budget, making it the least costly to administer of the four targeted programs. The bulk of the administrative cost of the child allowance program goes to eligibility verification. Social workers have to pay close attention to school attendance records and the number of unauthorized absences from school. Finally, the share of disability benefit administrative costs was 9.8 percent of the total cost. Unlike the other three targeted social assistance programs, the disability benefit depends on the applicant’s health status, not income status. Administrative Cost per Beneficiary
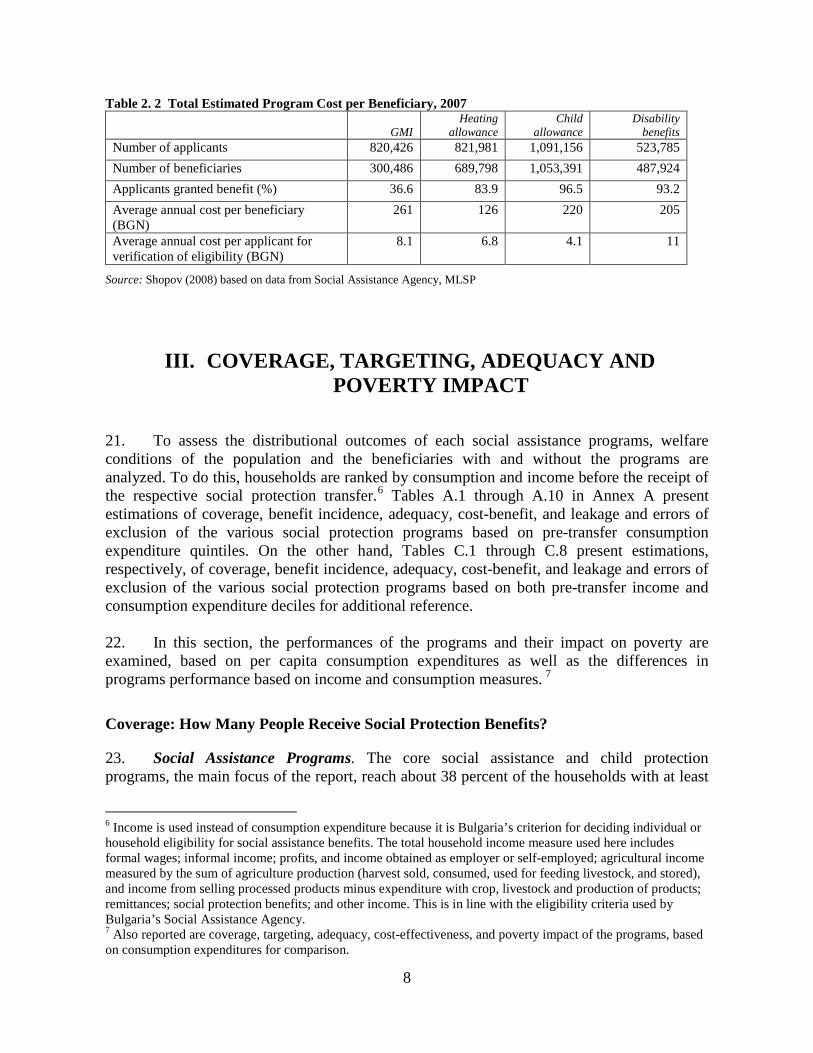
20. The information about cost per beneficiary provides grounds for comparison between the programs (table 2.2). According to the data, the average cost of eligibility verification of all four programs for is BGN 8 (14.5 percent of the GMI) and the average cost per program beneficiary is BGN 261. The corresponding figures for the GMI are slightly lower at BGN 7 (12 percent of the GMI benefit) for verification and BGN 220 per beneficiary. The lowest costs were for the heating allowance, BGN 4 for eligibility verification and BGN 126 per program beneficiary.
8
Table 2. 2 Total Estimated Program Cost per Beneficiary, 2007
GMI Heating
allowance Child
allowance Disability
benefits Number of applicants 820,426 821,981 1,091,156 523,785 Number of beneficiaries 300,486 689,798 1,053,391 487,924 Applicants granted benefit (%) 36.6 83.9 96.5 93.2 Average annual cost per beneficiary (BGN)
261 126 220 205
Average annual cost per applicant for verification of eligibility (BGN)
8.1 6.8 4.1 11
Source: Shopov (2008) based on data from Social Assistance Agency, MLSP
III. COVERAGE, TARGETING, ADEQUACY AND POVERTY IMPACT
21. To assess the distributional outcomes of each social assistance programs, welfare conditions of the population and the beneficiaries with and without the programs are analyzed. To do this, households are ranked by consumption and income before the receipt of the respective social protection transfer.6
Tables A.1 through A.10 in Annex A present estimations of coverage, benefit incidence, adequacy, cost-benefit, and leakage and errors of exclusion of the various social protection programs based on pre-transfer consumption expenditure quintiles. On the other hand, Tables C.1 through C.8 present estimations, respectively, of coverage, benefit incidence, adequacy, cost-benefit, and leakage and errors of exclusion of the various social protection programs based on both pre-transfer income and consumption expenditure deciles for additional reference.
22. In this section, the performances of the programs and their impact on poverty are examined, based on per capita consumption expenditures as well as the differences in programs performance based on income and consumption measures. 7
Coverage: How Many People Receive Social Protection Benefits?
23. Social Assistance Programs. The core social assistance and child protection programs, the main focus of the report, reach about 38 percent of the households with at least
6 Income is used instead of consumption expenditure because it is Bulgaria’s criterion for deciding individual or household eligibility for social assistance benefits. The total household income measure used here includes formal wages; informal income; profits, and income obtained as employer or self-employed; agricultural income measured by the sum of agriculture production (harvest sold, consumed, used for feeding livestock, and stored), and income from selling processed products minus expenditure with crop, livestock and production of products; remittances; social protection benefits; and other income. This is in line with the eligibility criteria used by Bulgaria’s Social Assistance Agency. 7 Also reported are coverage, targeting, adequacy, cost-effectiveness, and poverty impact of the programs, based on consumption expenditures for comparison.
9
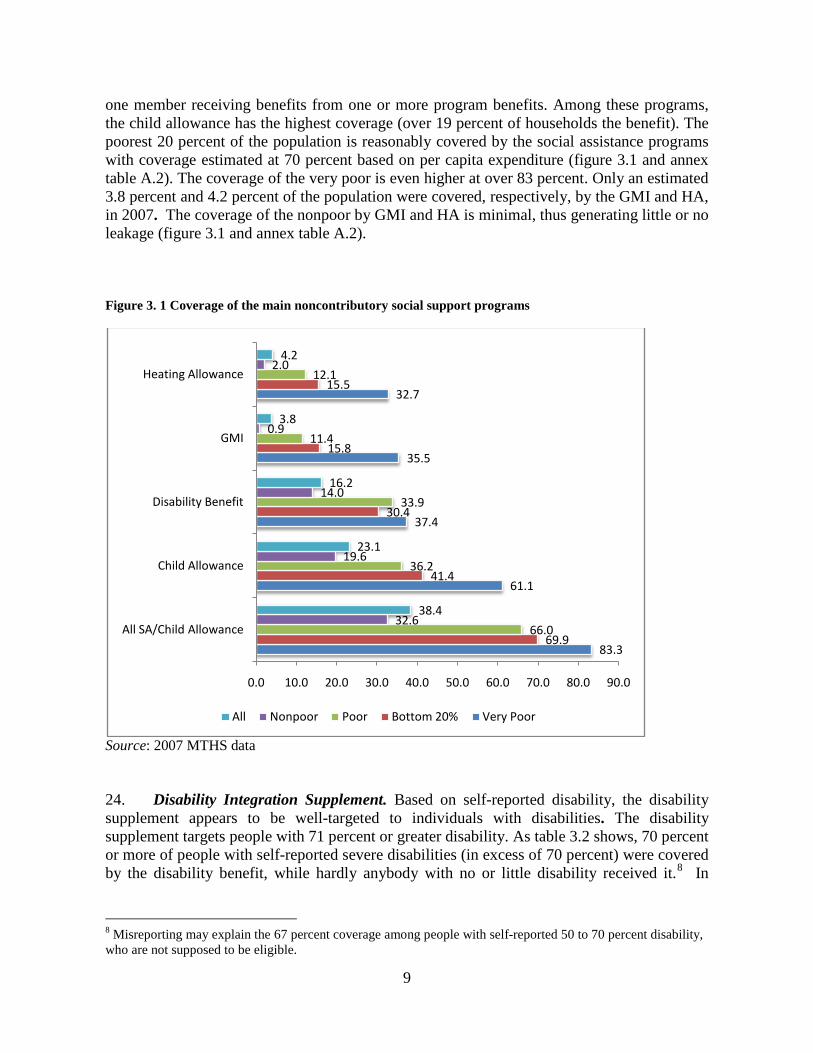
one member receiving benefits from one or more program benefits. Among these programs, the child allowance has the highest coverage (over 19 percent of households the benefit). The poorest 20 percent of the population is reasonably covered by the social assistance programs with coverage estimated at 70 percent based on per capita expenditure (figure 3.1 and annex table A.2). The coverage of the very poor is even higher at over 83 percent. Only an estimated 3.8 percent and 4.2 percent of the population were covered, respectively, by the GMI and HA, in 2007. The coverage of the nonpoor by GMI and HA is minimal, thus generating little or no leakage (figure 3.1 and annex table A.2). Figure 3. 1 Coverage of the main noncontributory social support programs
Source: 2007 MTHS data 24. Disability Integration Supplement. Based on self-reported disability, the disability supplement appears to be well-targeted to individuals with disabilities. The disability supplement targets people with 71 percent or greater disability. As table 3.2 shows, 70 percent or more of people with self-reported severe disabilities (in excess of 70 percent) were covered by the disability benefit, while hardly anybody with no or little disability received it.8
8 Misreporting may explain the 67 percent coverage among people with self-reported 50 to 70 percent disability, who are not supposed to be eligible.
In
83.3
61.1
37.4
35.5
32.7
69.9
41.4
30.4
15.8
15.5
66.0
36.2
33.9
11.4
12.1
32.6
19.6
14.0
0.9
2.0
38.4
23.1
16.2
3.8
4.2
0.0 10.0 20.0 30.0 40.0 50.0 60.0 70.0 80.0 90.0
All SA/Child Allowance
Child Allowance
Disability Benefit
GMI
Heating Allowance
All Nonpoor Poor Bottom 20% Very Poor
10
terms of consumption poverty, the coverage of the program is large, and about 35 percent of the poorest 10 percent are covered by the program (annex table A.2). 25. Child Allowance and School Attendance. While significant share of the poor are covered by child allowance, the coverage of the nonpoor is also large at over 40 percent. This is largely due to the categorical nature of this program and the benefit entails demographic objectives (e.g., increase birth rates) other than poverty alleviation. And, in recent years, child allowance has been linked to school attendance, making the child allowance program a de facto conditional cash transfer. There is some evidence that this conditionality may have resulted in increases in school enrolment. For girls aged 6-14, school enrolment is 7.6 percent-age points higher among beneficiaries than among nonbeneficiaries; for boys the corresponding figure is 1.7. In logit regressions of the determinants of attendance / enrolment that control for other factors, being in receipt of child allowance has a significant positive impact on enrolment in school. Table 3. 1 Child Allowance and School Enrolment School enrolment. In % of relevant age group.
Girls age 6-14
Boys age 6-14
All children age 6-14
Girls age 15-18
Boys age 15-18
All children age 15-
18
Nonbeneficiary 90.6 92.1 91.3 73.6 74.7 74.2 Beneficiary of child allowance 98.2 93.8 95.8 73.3 94.4 84.8 Difference 7.6 1.7 4.5 -0.3 19.7 10.6
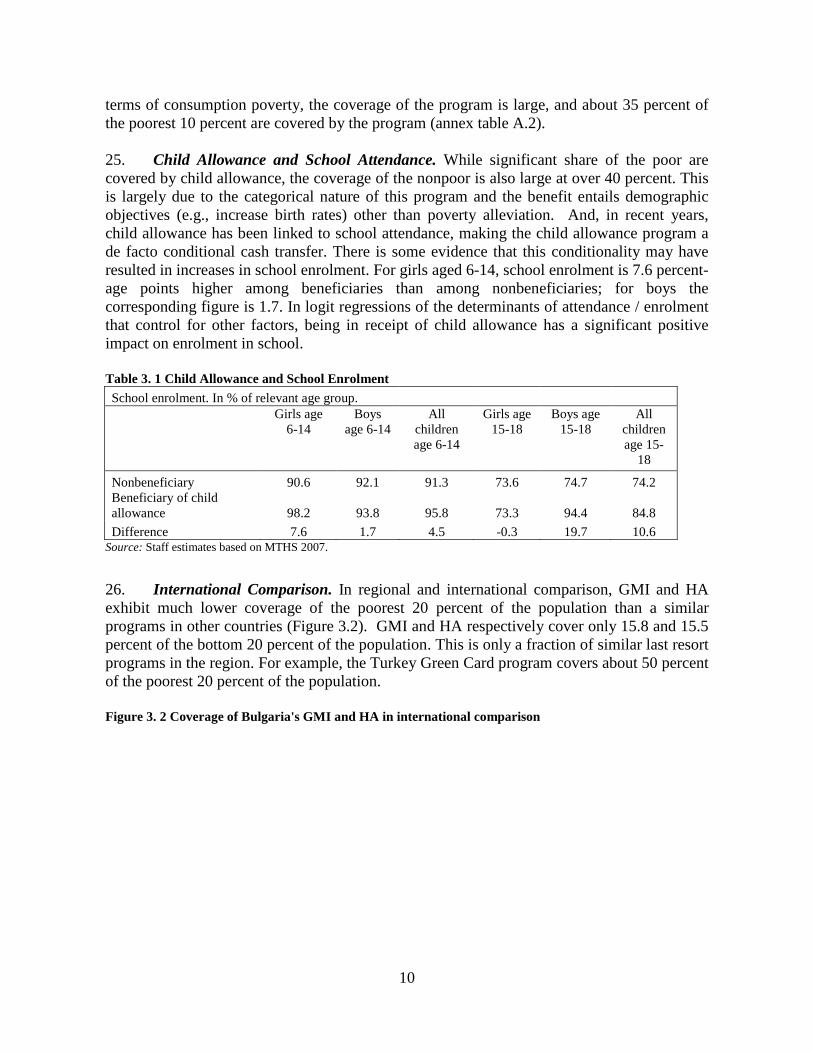
Source: Staff estimates based on MTHS 2007. 26. International Comparison. In regional and international comparison, GMI and HA exhibit much lower coverage of the poorest 20 percent of the population than a similar programs in other countries (Figure 3.2). GMI and HA respectively cover only 15.8 and 15.5 percent of the bottom 20 percent of the population. This is only a fraction of similar last resort programs in the region. For example, the Turkey Green Card program covers about 50 percent of the poorest 20 percent of the population. Figure 3. 2 Coverage of Bulgaria's GMI and HA in international comparison
11
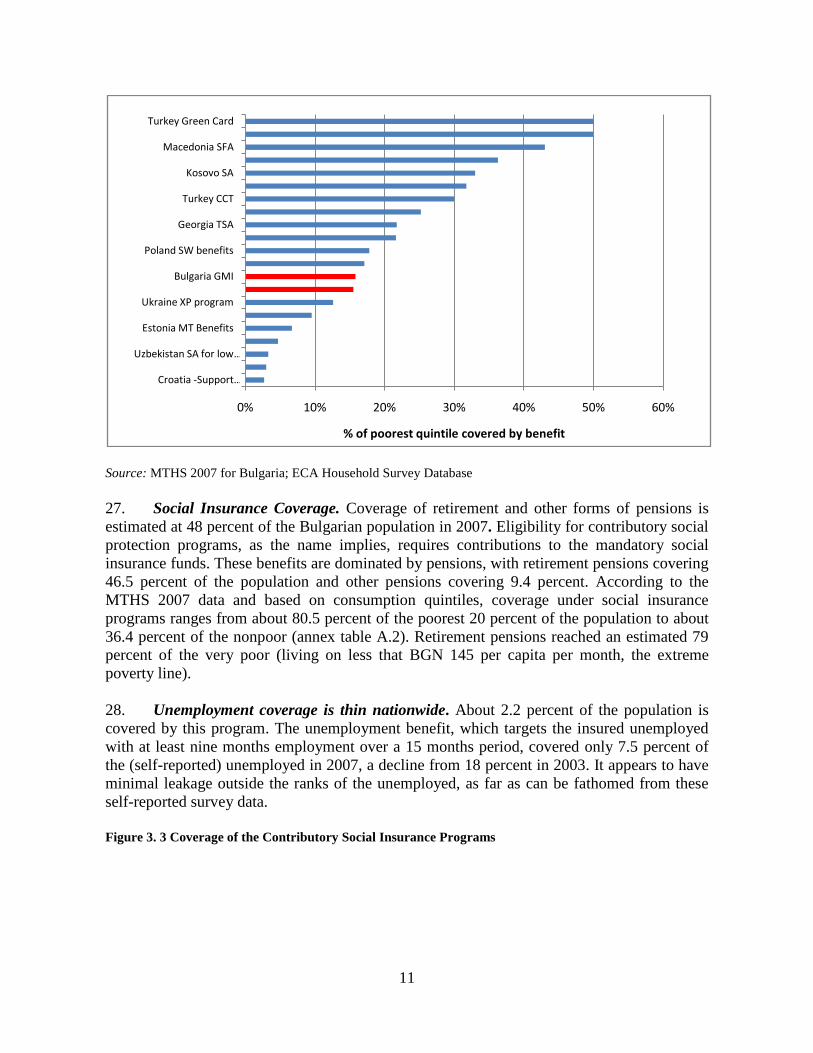
Source: MTHS 2007 for Bulgaria; ECA Household Survey Database 27. Social Insurance Coverage. Coverage of retirement and other forms of pensions is estimated at 48 percent of the Bulgarian population in 2007. Eligibility for contributory social protection programs, as the name implies, requires contributions to the mandatory social insurance funds. These benefits are dominated by pensions, with retirement pensions covering 46.5 percent of the population and other pensions covering 9.4 percent. According to the MTHS 2007 data and based on consumption quintiles, coverage under social insurance programs ranges from about 80.5 percent of the poorest 20 percent of the population to about 36.4 percent of the nonpoor (annex table A.2). Retirement pensions reached an estimated 79 percent of the very poor (living on less that BGN 145 per capita per month, the extreme poverty line). 28. Unemployment coverage is thin nationwide. About 2.2 percent of the population is covered by this program. The unemployment benefit, which targets the insured unemployed with at least nine months employment over a 15 months period, covered only 7.5 percent of the (self-reported) unemployed in 2007, a decline from 18 percent in 2003. It appears to have minimal leakage outside the ranks of the unemployed, as far as can be fathomed from these self-reported survey data. Figure 3. 3 Coverage of the Contributory Social Insurance Programs
0% 10% 20% 30% 40% 50% 60%
Croatia -Support …
Uzbekistan SA for low …
Estonia MT Benefits
Ukraine XP program
Bulgaria GMI
Poland SW benefits
Georgia TSA
Turkey CCT
Kosovo SA
Macedonia SFA
Turkey Green Card
% of poorest quintile covered by benefit
12
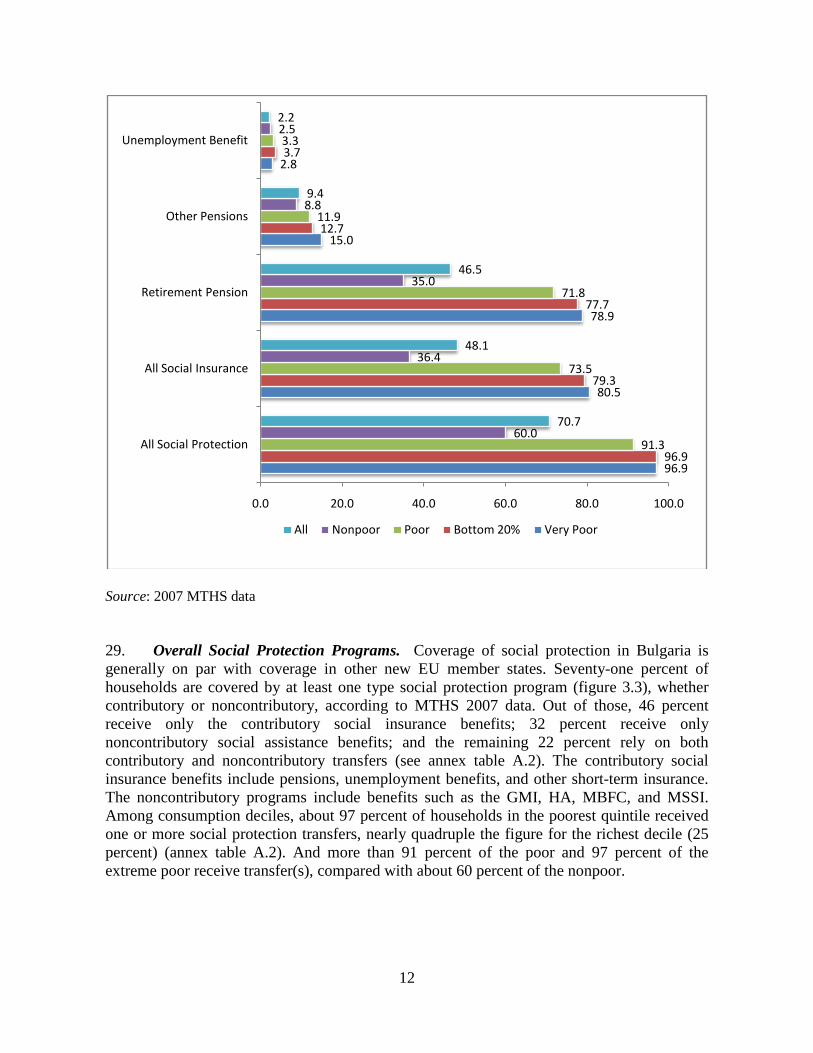
Source: 2007 MTHS data 29. Overall Social Protection Programs. Coverage of social protection in Bulgaria is generally on par with coverage in other new EU member states. Seventy-one percent of households are covered by at least one type social protection program (figure 3.3), whether contributory or noncontributory, according to MTHS 2007 data. Out of those, 46 percent receive only the contributory social insurance benefits; 32 percent receive only noncontributory social assistance benefits; and the remaining 22 percent rely on both contributory and noncontributory transfers (see annex table A.2). The contributory social insurance benefits include pensions, unemployment benefits, and other short-term insurance. The noncontributory programs include benefits such as the GMI, HA, MBFC, and MSSI. Among consumption deciles, about 97 percent of households in the poorest quintile received one or more social protection transfers, nearly quadruple the figure for the richest decile (25 percent) (annex table A.2). And more than 91 percent of the poor and 97 percent of the extreme poor receive transfer(s), compared with about 60 percent of the nonpoor.
96.9
80.5
78.9
15.0
2.8
96.9
79.3
77.7
12.7
3.7
91.3
73.5
71.8
11.9
3.3
60.0
36.4
35.0
8.8
2.5
70.7
48.1
46.5
9.4
2.2
0.0 20.0 40.0 60.0 80.0 100.0
All Social Protection
All Social Insurance
Retirement Pension
Other Pensions
Unemployment Benefit
All Nonpoor Poor Bottom 20% Very Poor
13
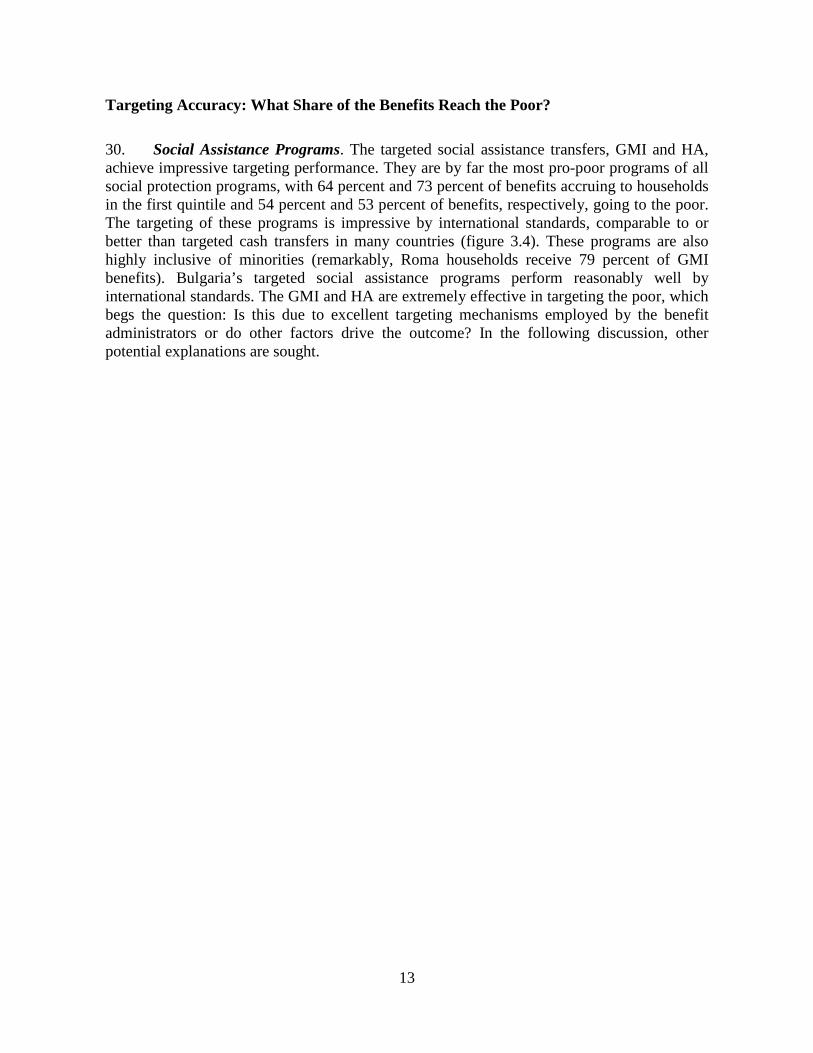
Targeting Accuracy: What Share of the Benefits Reach the Poor? 30. Social Assistance Programs. The targeted social assistance transfers, GMI and HA, achieve impressive targeting performance. They are by far the most pro-poor programs of all social protection programs, with 64 percent and 73 percent of benefits accruing to households in the first quintile and 54 percent and 53 percent of benefits, respectively, going to the poor. The targeting of these programs is impressive by international standards, comparable to or better than targeted cash transfers in many countries (figure 3.4). These programs are also highly inclusive of minorities (remarkably, Roma households receive 79 percent of GMI benefits). Bulgaria’s targeted social assistance programs perform reasonably well by international standards. The GMI and HA are extremely effective in targeting the poor, which begs the question: Is this due to excellent targeting mechanisms employed by the benefit administrators or do other factors drive the outcome? In the following discussion, other potential explanations are sought.
14
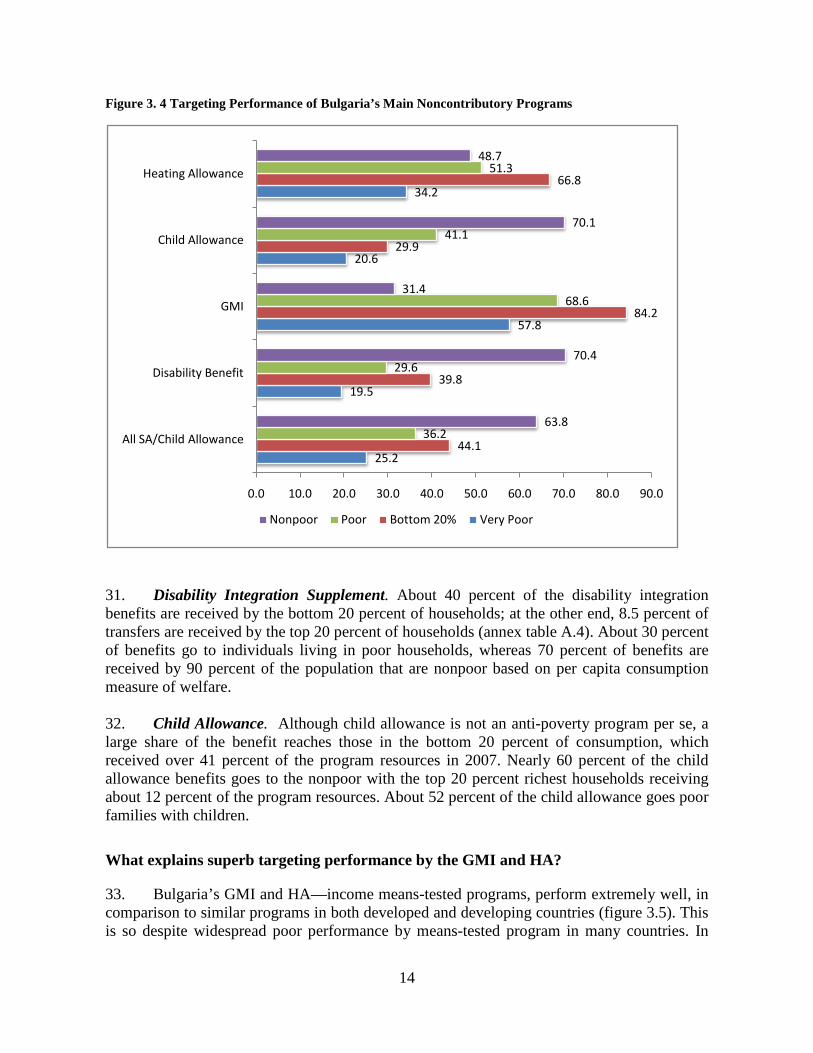
Figure 3. 4 Targeting Performance of Bulgaria’s Main Noncontributory Programs
31. Disability Integration Supplement. About 40 percent of the disability integration benefits are received by the bottom 20 percent of households; at the other end, 8.5 percent of transfers are received by the top 20 percent of households (annex table A.4). About 30 percent of benefits go to individuals living in poor households, whereas 70 percent of benefits are received by 90 percent of the population that are nonpoor based on per capita consumption measure of welfare. 32. Child Allowance. Although child allowance is not an anti-poverty program per se, a large share of the benefit reaches those in the bottom 20 percent of consumption, which received over 41 percent of the program resources in 2007. Nearly 60 percent of the child allowance benefits goes to the nonpoor with the top 20 percent richest households receiving about 12 percent of the program resources. About 52 percent of the child allowance goes poor families with children.
What explains superb targeting performance by the GMI and HA?
33. Bulgaria’s GMI and HA—income means-tested programs, perform extremely well, in comparison to similar programs in both developed and developing countries (figure 3.5). This is so despite widespread poor performance by means-tested program in many countries. In
25.2
19.5
57.8
20.6
34.2
44.1
39.8
84.2
29.9
66.8
36.2
29.6
68.6
41.1
51.3
63.8
70.4
31.4
70.1
48.7
0.0 10.0 20.0 30.0 40.0 50.0 60.0 70.0 80.0 90.0
All SA/Child Allowance
Disability Benefit
GMI
Child Allowance
Heating Allowance
Nonpoor Poor Bottom 20% Very Poor
15
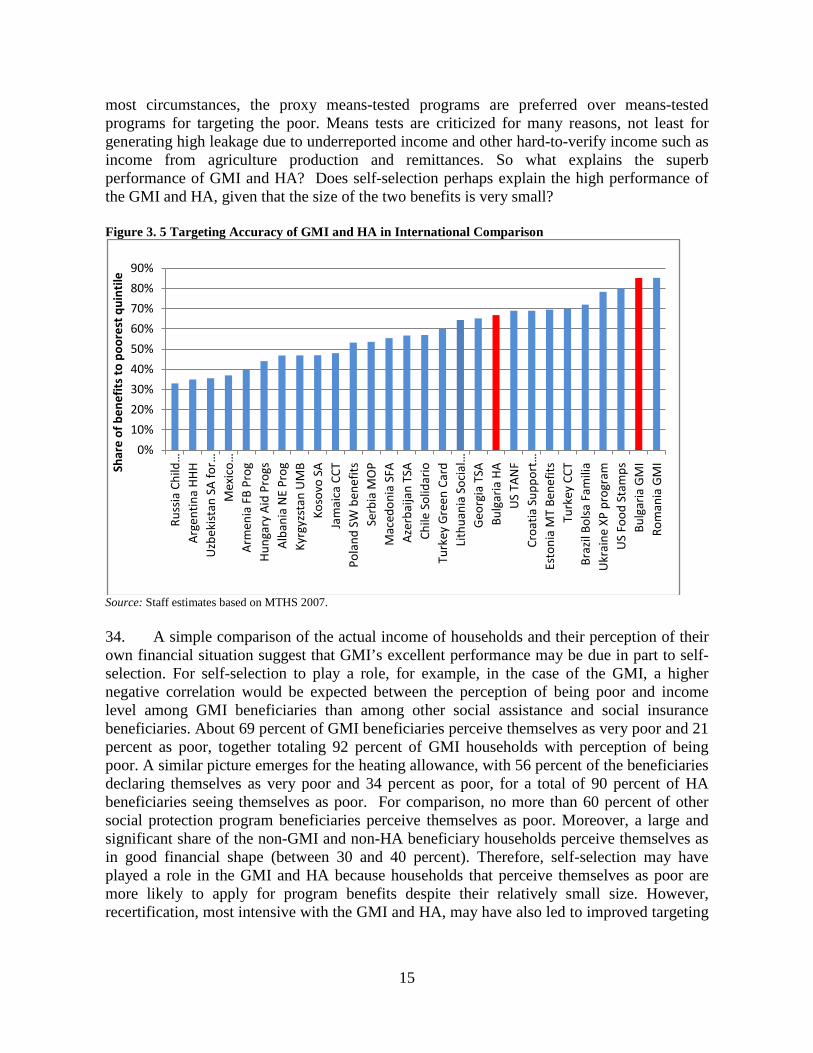
most circumstances, the proxy means-tested programs are preferred over means-tested programs for targeting the poor. Means tests are criticized for many reasons, not least for generating high leakage due to underreported income and other hard-to-verify income such as income from agriculture production and remittances. So what explains the superb performance of GMI and HA? Does self-selection perhaps explain the high performance of the GMI and HA, given that the size of the two benefits is very small? Figure 3. 5 Targeting Accuracy of GMI and HA in International Comparison
Source: Staff estimates based on MTHS 2007. 34. A simple comparison of the actual income of households and their perception of their own financial situation suggest that GMI’s excellent performance may be due in part to self-selection. For self-selection to play a role, for example, in the case of the GMI, a higher negative correlation would be expected between the perception of being poor and income level among GMI beneficiaries than among other social assistance and social insurance beneficiaries. About 69 percent of GMI beneficiaries perceive themselves as very poor and 21 percent as poor, together totaling 92 percent of GMI households with perception of being poor. A similar picture emerges for the heating allowance, with 56 percent of the beneficiaries declaring themselves as very poor and 34 percent as poor, for a total of 90 percent of HA beneficiaries seeing themselves as poor. For comparison, no more than 60 percent of other social protection program beneficiaries perceive themselves as poor. Moreover, a large and significant share of the non-GMI and non-HA beneficiary households perceive themselves as in good financial shape (between 30 and 40 percent). Therefore, self-selection may have played a role in the GMI and HA because households that perceive themselves as poor are more likely to apply for program benefits despite their relatively small size. However, recertification, most intensive with the GMI and HA, may have also led to improved targeting
0%
10%
20%
30%
40%
50%
60%
70%
80%
90%
Russ
ia C
hild
…A
rgen
tina
HH
HU
zbek
ista
n SA
for …
Mex
ico …
Arm
enia
FB
Prog
Hun
gary
Aid
Pro
gsA
lban
ia N
E Pr
ogKy
rgyz
stan
UM
BKo
sovo
SA
Jam
aica
CCT
Pola
nd S
W b
enef
itsSe
rbia
MO
PM
aced
onia
SFA
Aze
rbai
jan
TSA
Chile
Sol
idar
ioTu
rkey
Gre
en C
ard
Lith
uani
a So
cial
…G
eorg
ia T
SABu
lgar
ia H
AU
S TA
NF
Croa
tia S
uppo
rt …
Esto
nia
MT
Bene
fits
Turk
ey C
CTBr
azil
Bols
a Fa
mili
aU
krai
ne X
P pr
ogra
mU
S Fo
od S
tam
psBu
lgar
ia G
MI
Rom
ania
GM
IShar
e of
ben
efit
s to
poo
rest
qui
ntile
16
performance. Such a claim cannot, however, be verified because information is available only on the beneficiaries, not on all applicants.
Adequacy: Are the Benefits Large Enough to Alleviate Poverty?
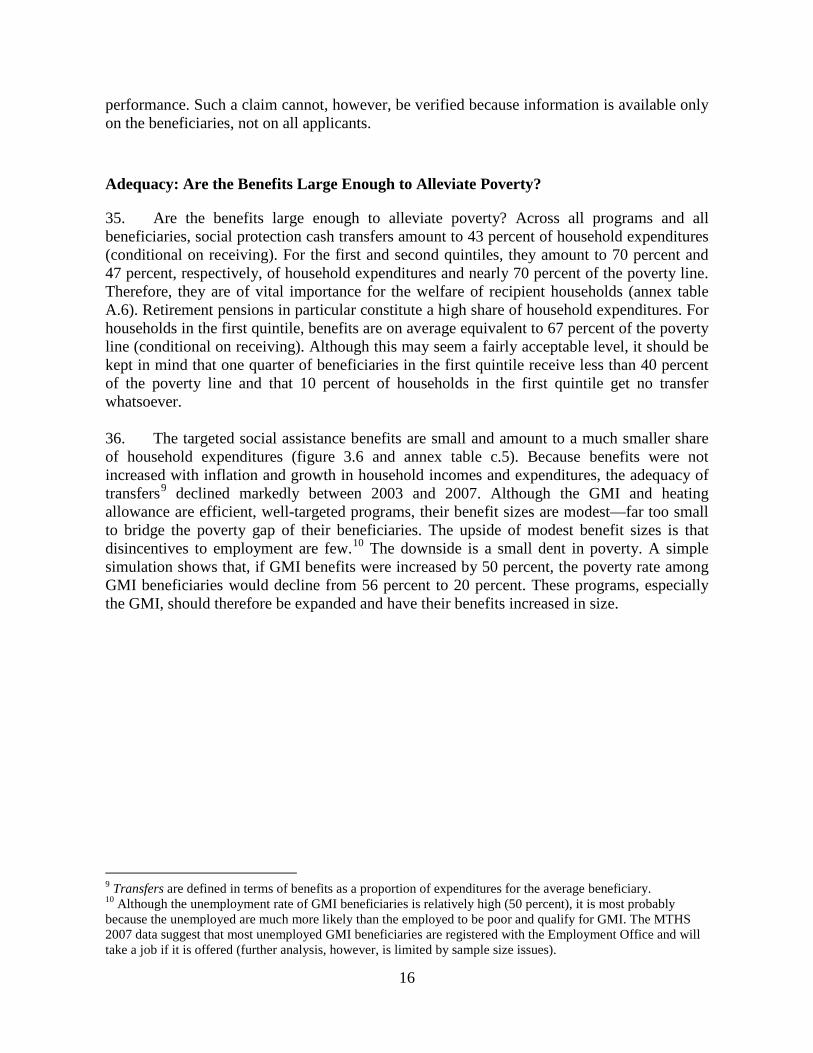
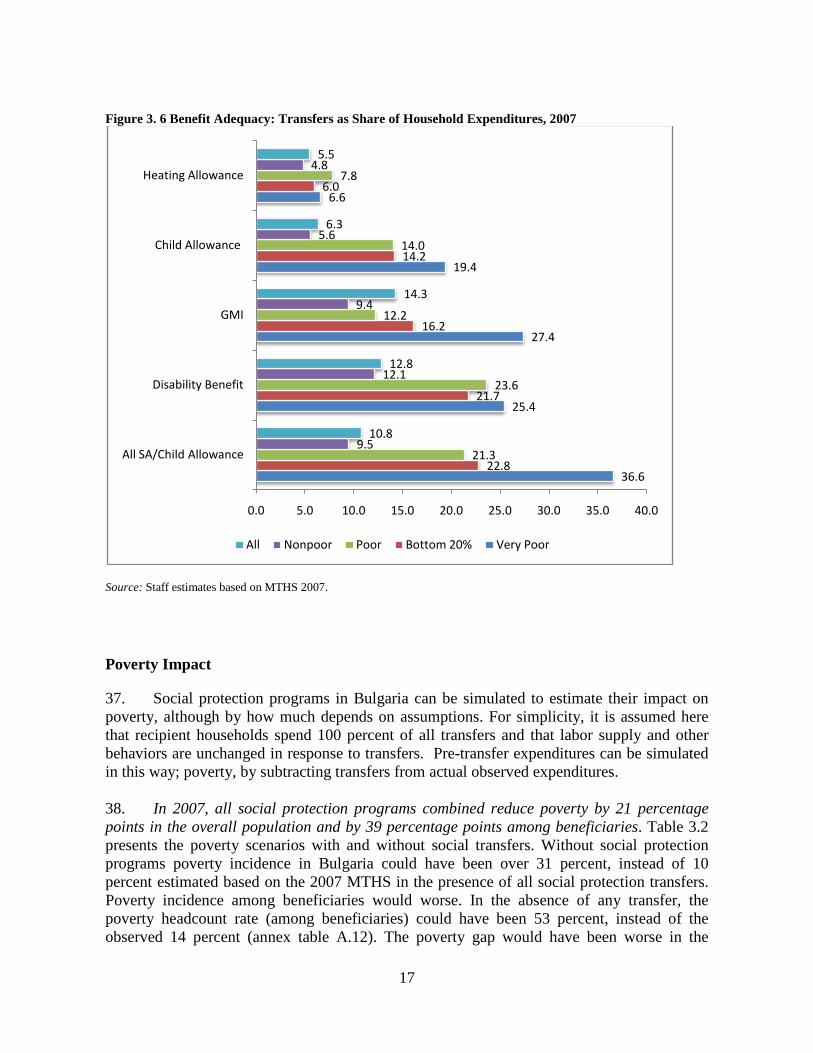
35. Are the benefits large enough to alleviate poverty? Across all programs and all beneficiaries, social protection cash transfers amount to 43 percent of household expenditures (conditional on receiving). For the first and second quintiles, they amount to 70 percent and 47 percent, respectively, of household expenditures and nearly 70 percent of the poverty line. Therefore, they are of vital importance for the welfare of recipient households (annex table A.6). Retirement pensions in particular constitute a high share of household expenditures. For households in the first quintile, benefits are on average equivalent to 67 percent of the poverty line (conditional on receiving). Although this may seem a fairly acceptable level, it should be kept in mind that one quarter of beneficiaries in the first quintile receive less than 40 percent of the poverty line and that 10 percent of households in the first quintile get no transfer whatsoever. 36. The targeted social assistance benefits are small and amount to a much smaller share of household expenditures (figure 3.6 and annex table c.5). Because benefits were not increased with inflation and growth in household incomes and expenditures, the adequacy of transfers9 declined markedly between 2003 and 2007. Although the GMI and heating allowance are efficient, well-targeted programs, their benefit sizes are modest—far too small to bridge the poverty gap of their beneficiaries. The upside of modest benefit sizes is that disincentives to employment are few.10
The downside is a small dent in poverty. A simple simulation shows that, if GMI benefits were increased by 50 percent, the poverty rate among GMI beneficiaries would decline from 56 percent to 20 percent. These programs, especially the GMI, should therefore be expanded and have their benefits increased in size.
9 Transfers are defined in terms of benefits as a proportion of expenditures for the average beneficiary. 10 Although the unemployment rate of GMI beneficiaries is relatively high (50 percent), it is most probably because the unemployed are much more likely than the employed to be poor and qualify for GMI. The MTHS 2007 data suggest that most unemployed GMI beneficiaries are registered with the Employment Office and will take a job if it is offered (further analysis, however, is limited by sample size issues).
17
Figure 3. 6 Benefit Adequacy: Transfers as Share of Household Expenditures, 2007
Source: Staff estimates based on MTHS 2007.
Poverty Impact
37. Social protection programs in Bulgaria can be simulated to estimate their impact on poverty, although by how much depends on assumptions. For simplicity, it is assumed here that recipient households spend 100 percent of all transfers and that labor supply and other behaviors are unchanged in response to transfers. Pre-transfer expenditures can be simulated in this way; poverty, by subtracting transfers from actual observed expenditures. 38. In 2007, all social protection programs combined reduce poverty by 21 percentage points in the overall population and by 39 percentage points among beneficiaries. Table 3.2 presents the poverty scenarios with and without social transfers. Without social protection programs poverty incidence in Bulgaria could have been over 31 percent, instead of 10 percent estimated based on the 2007 MTHS in the presence of all social protection transfers. Poverty incidence among beneficiaries would worse. In the absence of any transfer, the poverty headcount rate (among beneficiaries) could have been 53 percent, instead of the observed 14 percent (annex table A.12). The poverty gap would have been worse in the
36.6
25.4
27.4
19.4
6.6
22.8
21.7
16.2
14.2
6.0
21.3
23.6
12.2
14.0
7.8
9.5
12.1
9.4
5.6
4.8
10.8
12.8
14.3
6.3
5.5
0.0 5.0 10.0 15.0 20.0 25.0 30.0 35.0 40.0
All SA/Child Allowance
Disability Benefit
GMI
Child Allowance
Heating Allowance
All Nonpoor Poor Bottom 20% Very Poor
18
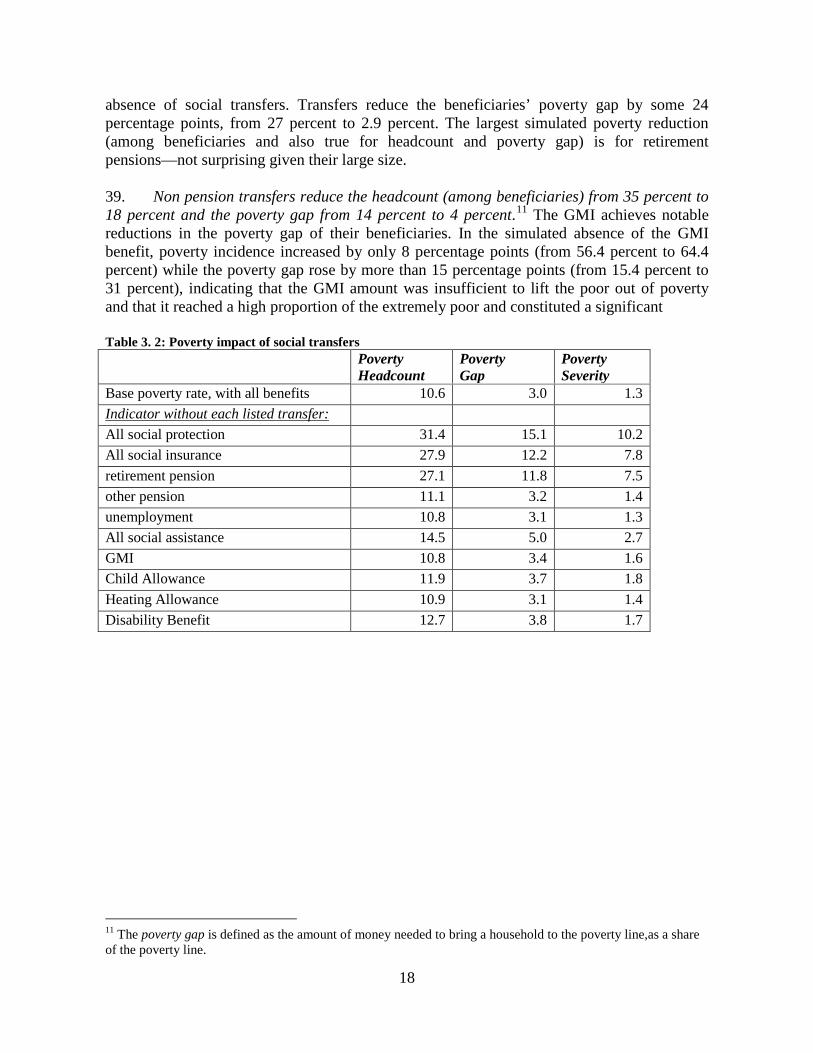
absence of social transfers. Transfers reduce the beneficiaries’ poverty gap by some 24 percentage points, from 27 percent to 2.9 percent. The largest simulated poverty reduction (among beneficiaries and also true for headcount and poverty gap) is for retirement pensions—not surprising given their large size. 39. Non pension transfers reduce the headcount (among beneficiaries) from 35 percent to 18 percent and the poverty gap from 14 percent to 4 percent.11
The GMI achieves notable reductions in the poverty gap of their beneficiaries. In the simulated absence of the GMI benefit, poverty incidence increased by only 8 percentage points (from 56.4 percent to 64.4 percent) while the poverty gap rose by more than 15 percentage points (from 15.4 percent to 31 percent), indicating that the GMI amount was insufficient to lift the poor out of poverty and that it reached a high proportion of the extremely poor and constituted a significant
Table 3. 2: Poverty impact of social transfers Poverty
Headcount Poverty Gap
Poverty Severity
Base poverty rate, with all benefits 10.6 3.0 1.3 Indicator without each listed transfer:
All social protection 31.4 15.1 10.2 All social insurance 27.9 12.2 7.8 retirement pension 27.1 11.8 7.5 other pension 11.1 3.2 1.4 unemployment 10.8 3.1 1.3 All social assistance 14.5 5.0 2.7 GMI 10.8 3.4 1.6 Child Allowance 11.9 3.7 1.8 Heating Allowance 10.9 3.1 1.4 Disability Benefit 12.7 3.8 1.7
11 The poverty gap is defined as the amount of money needed to bring a household to the poverty line,as a share of the poverty line.
19
Source: Staff estimate based on MTHS 2007. Notes: Calculations are based on poverty rates for program beneficiaries, comparing actual to simulated pre-transfer poverty. Cost-Benefit Analysis 40. The simulated efficiency of poverty reduction varies from a low of BGN 1.6 (highly efficient) spent on GMI transfers per BGN reduction in the poverty gap to BGN 8.3 for nonretirement pensions (figure 3.8). Therefore, GMI is the most cost effective social protection program in terms of impact on the poverty gap. For each BGN 1 spent on GMI, more than BGN 0.85 goes to poverty gap reduction. The corresponding figure for HA is BGN 0.46, making it the second most cost-effective program (annex table A.17 and C. 18) Again, this is testimony to the impressive targeting effectiveness of the GMI and heating allowance, whether it due to self-selection or intensive recertification by SAA staff.
20
Figure 3. 7 Poverty Reduction Efficiency (BGN spent per BGN reduction in poverty gap)
Source: Staff estimates based on MTHS 2007. Comparison of Targeting Accuracy Based on Income and Consumption
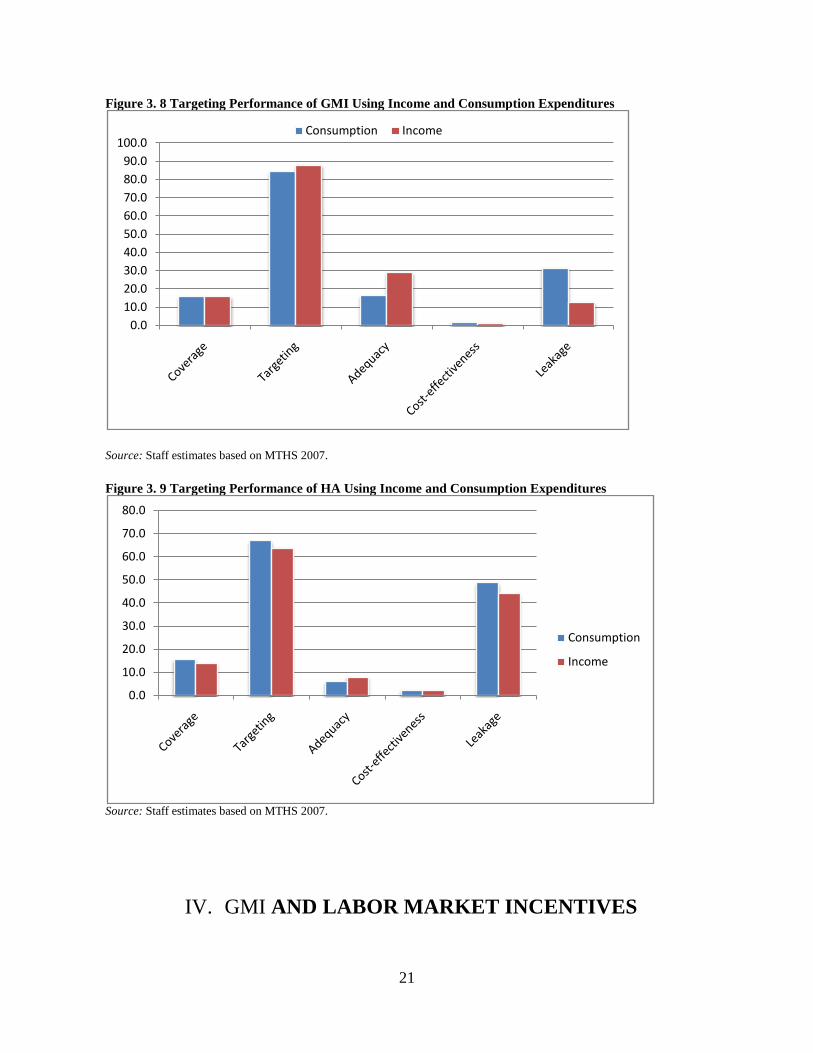
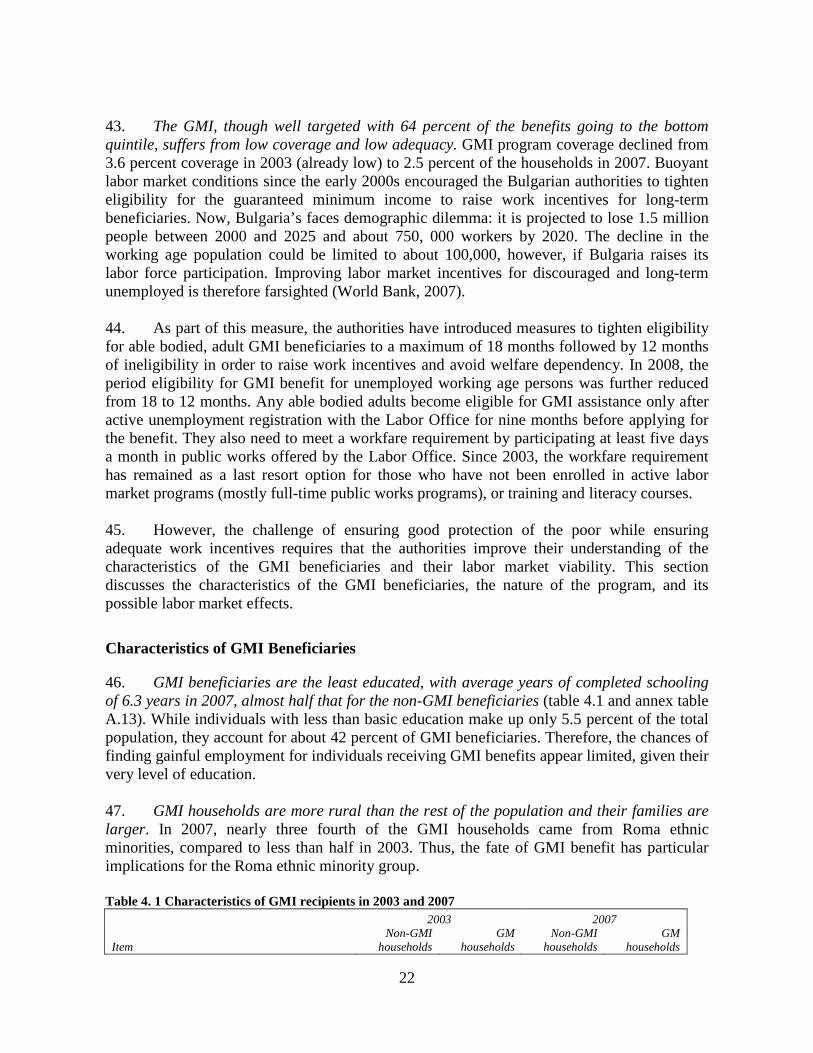
41. Consumption expenditure is commonly used as a measure of welfare to evaluate the performance of social transfer programs. This approach frequently diverges from the eligibility criteria actually used in assigning benefits. For example, income is used to target Bulgaria’s GMI and HA programs to the poor and the vulnerable. Therefore, unless consumption and income measures have strong positive correlations, consumption- and income-based evaluations are likely to lead to different conclusions about program performance.12
Although most discussions in this section are based on consumption expenditures, estimations based on both consumption expenditure and income are also reported (annex B). The two approaches are briefly compared below.
42. Although Bulgaria uses income criteria for selecting beneficiaries of social safety net programs, estimations in this report suggest that consumption-based targeting would be more accurate than income-based measures in terms of coverage of the poor and the share of resources that goes to the poor (figure 3.8 for GMI, figure 3.9 for HA). However, in terms of leakage,13 generosity,14 and cost-benefit15
outcomes, income-based measures improve targeting accuracy.
12 For Bulgaria, the correlation between income and consumption was a modest 0.50. 13 Leakage measures how much of the program resources go to nonpoor households. 14 Generosity measures the benefit size as a percentage of income. 15 The cost-benefit outcome is the amount of social assistance spending needed to reduce poverty by a given amount.
3.4
3.6
3.7
8.3
5.9
3.9
1.6
4.1
2.3
5.3
6.7
0.0 1.0 2.0 3.0 4.0 5.0 6.0 7.0 8.0 9.0
All Social Protection
All Social Insurance
Retirement Pension
Other Pensions
Unemployment Benefit
All SA/Child Protection
GMI
Child Allowance
Heating Allowance
Disability Benefit
Other Social Assistance
21
Figure 3. 8 Targeting Performance of GMI Using Income and Consumption Expenditures
Source: Staff estimates based on MTHS 2007.
Figure 3. 9 Targeting Performance of HA Using Income and Consumption Expenditures
Source: Staff estimates based on MTHS 2007.
IV. GMI AND LABOR MARKET INCENTIVES
0.010.020.030.040.050.060.070.080.090.0
100.0Consumption Income
0.0
10.0
20.0
30.0
40.0
50.0
60.0
70.0
80.0
Consumption
Income
22
43. The GMI, though well targeted with 64 percent of the benefits going to the bottom quintile, suffers from low coverage and low adequacy. GMI program coverage declined from 3.6 percent coverage in 2003 (already low) to 2.5 percent of the households in 2007. Buoyant labor market conditions since the early 2000s encouraged the Bulgarian authorities to tighten eligibility for the guaranteed minimum income to raise work incentives for long-term beneficiaries. Now, Bulgaria’s faces demographic dilemma: it is projected to lose 1.5 million people between 2000 and 2025 and about 750, 000 workers by 2020. The decline in the working age population could be limited to about 100,000, however, if Bulgaria raises its labor force participation. Improving labor market incentives for discouraged and long-term unemployed is therefore farsighted (World Bank, 2007). 44. As part of this measure, the authorities have introduced measures to tighten eligibility for able bodied, adult GMI beneficiaries to a maximum of 18 months followed by 12 months of ineligibility in order to raise work incentives and avoid welfare dependency. In 2008, the period eligibility for GMI benefit for unemployed working age persons was further reduced from 18 to 12 months. Any able bodied adults become eligible for GMI assistance only after active unemployment registration with the Labor Office for nine months before applying for the benefit. They also need to meet a workfare requirement by participating at least five days a month in public works offered by the Labor Office. Since 2003, the workfare requirement has remained as a last resort option for those who have not been enrolled in active labor market programs (mostly full-time public works programs), or training and literacy courses. 45. However, the challenge of ensuring good protection of the poor while ensuring adequate work incentives requires that the authorities improve their understanding of the characteristics of the GMI beneficiaries and their labor market viability. This section discusses the characteristics of the GMI beneficiaries, the nature of the program, and its possible labor market effects.
Characteristics of GMI Beneficiaries
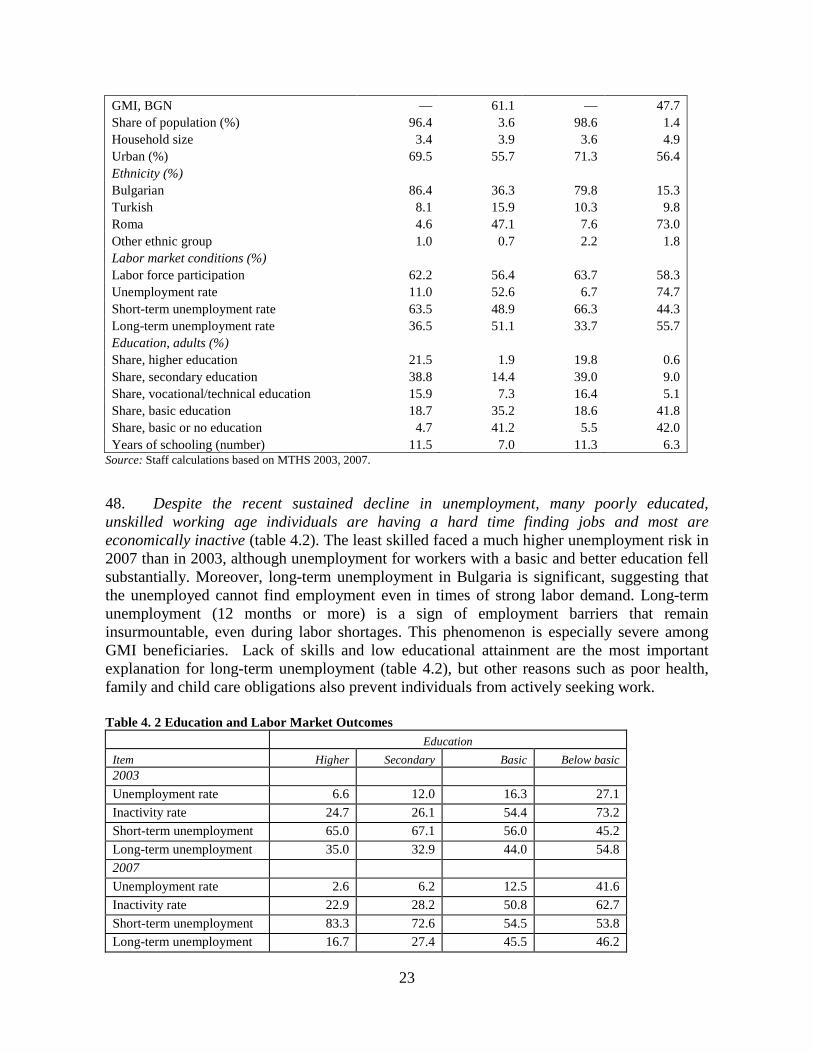
46. GMI beneficiaries are the least educated, with average years of completed schooling of 6.3 years in 2007, almost half that for the non-GMI beneficiaries (table 4.1 and annex table A.13). While individuals with less than basic education make up only 5.5 percent of the total population, they account for about 42 percent of GMI beneficiaries. Therefore, the chances of finding gainful employment for individuals receiving GMI benefits appear limited, given their very level of education. 47. GMI households are more rural than the rest of the population and their families are larger. In 2007, nearly three fourth of the GMI households came from Roma ethnic minorities, compared to less than half in 2003. Thus, the fate of GMI benefit has particular implications for the Roma ethnic minority group. Table 4. 1 Characteristics of GMI recipients in 2003 and 2007
2003 2007
Item Non-GMI
households GM
households Non-GMI
households GM
households
23
GMI, BGN — 61.1 — 47.7 Share of population (%) 96.4 3.6 98.6 1.4 Household size 3.4 3.9 3.6 4.9 Urban (%) 69.5 55.7 71.3 56.4 Ethnicity (%) Bulgarian 86.4 36.3 79.8 15.3 Turkish 8.1 15.9 10.3 9.8 Roma 4.6 47.1 7.6 73.0 Other ethnic group 1.0 0.7 2.2 1.8 Labor market conditions (%) Labor force participation 62.2 56.4 63.7 58.3 Unemployment rate 11.0 52.6 6.7 74.7 Short-term unemployment rate 63.5 48.9 66.3 44.3 Long-term unemployment rate 36.5 51.1 33.7 55.7 Education, adults (%) Share, higher education 21.5 1.9 19.8 0.6 Share, secondary education 38.8 14.4 39.0 9.0 Share, vocational/technical education 15.9 7.3 16.4 5.1 Share, basic education 18.7 35.2 18.6 41.8 Share, basic or no education 4.7 41.2 5.5 42.0 Years of schooling (number) 11.5 7.0 11.3 6.3
Source: Staff calculations based on MTHS 2003, 2007. 48. Despite the recent sustained decline in unemployment, many poorly educated, unskilled working age individuals are having a hard time finding jobs and most are economically inactive (table 4.2). The least skilled faced a much higher unemployment risk in 2007 than in 2003, although unemployment for workers with a basic and better education fell substantially. Moreover, long-term unemployment in Bulgaria is significant, suggesting that the unemployed cannot find employment even in times of strong labor demand. Long-term unemployment (12 months or more) is a sign of employment barriers that remain insurmountable, even during labor shortages. This phenomenon is especially severe among GMI beneficiaries. Lack of skills and low educational attainment are the most important explanation for long-term unemployment (table 4.2), but other reasons such as poor health, family and child care obligations also prevent individuals from actively seeking work. Table 4. 2 Education and Labor Market Outcomes
Education Item Higher Secondary Basic Below basic 2003 Unemployment rate 6.6 12.0 16.3 27.1 Inactivity rate 24.7 26.1 54.4 73.2 Short-term unemployment 65.0 67.1 56.0 45.2 Long-term unemployment 35.0 32.9 44.0 54.8 2007 Unemployment rate 2.6 6.2 12.5 41.6 Inactivity rate 22.9 28.2 50.8 62.7 Short-term unemployment 83.3 72.6 54.5 53.8 Long-term unemployment 16.7 27.4 45.5 46.2
24
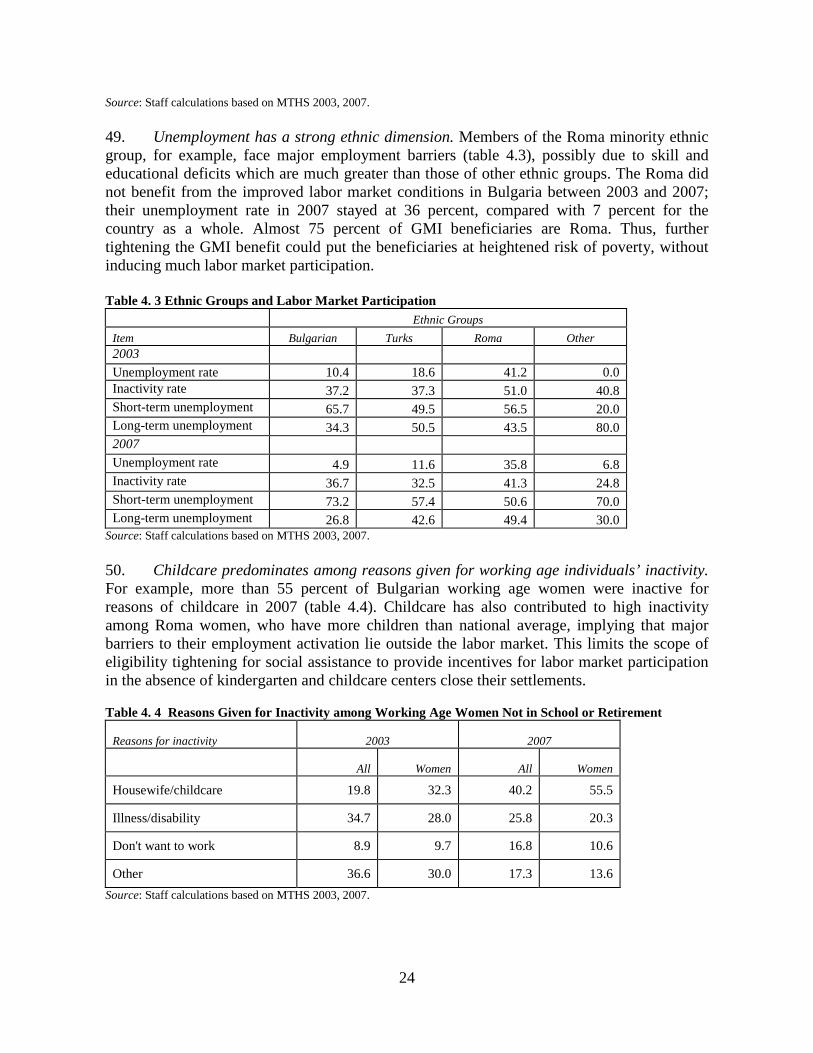
Source: Staff calculations based on MTHS 2003, 2007. 49. Unemployment has a strong ethnic dimension. Members of the Roma minority ethnic group, for example, face major employment barriers (table 4.3), possibly due to skill and educational deficits which are much greater than those of other ethnic groups. The Roma did not benefit from the improved labor market conditions in Bulgaria between 2003 and 2007; their unemployment rate in 2007 stayed at 36 percent, compared with 7 percent for the country as a whole. Almost 75 percent of GMI beneficiaries are Roma. Thus, further tightening the GMI benefit could put the beneficiaries at heightened risk of poverty, without inducing much labor market participation. Table 4. 3 Ethnic Groups and Labor Market Participation
Ethnic Groups Item Bulgarian Turks Roma Other 2003 Unemployment rate 10.4 18.6 41.2 0.0 Inactivity rate 37.2 37.3 51.0 40.8 Short-term unemployment 65.7 49.5 56.5 20.0 Long-term unemployment 34.3 50.5 43.5 80.0 2007 Unemployment rate 4.9 11.6 35.8 6.8 Inactivity rate 36.7 32.5 41.3 24.8 Short-term unemployment 73.2 57.4 50.6 70.0 Long-term unemployment 26.8 42.6 49.4 30.0
Source: Staff calculations based on MTHS 2003, 2007. 50. Childcare predominates among reasons given for working age individuals’ inactivity. For example, more than 55 percent of Bulgarian working age women were inactive for reasons of childcare in 2007 (table 4.4). Childcare has also contributed to high inactivity among Roma women, who have more children than national average, implying that major barriers to their employment activation lie outside the labor market. This limits the scope of eligibility tightening for social assistance to provide incentives for labor market participation in the absence of kindergarten and childcare centers close their settlements. Table 4. 4 Reasons Given for Inactivity among Working Age Women Not in School or Retirement
Reasons for inactivity 2003 2007
All Women All Women
Housewife/childcare 19.8 32.3 40.2 55.5
Illness/disability 34.7 28.0 25.8 20.3
Don't want to work 8.9 9.7 16.8 10.6
Other 36.6 30.0 17.3 13.6 Source: Staff calculations based on MTHS 2003, 2007.
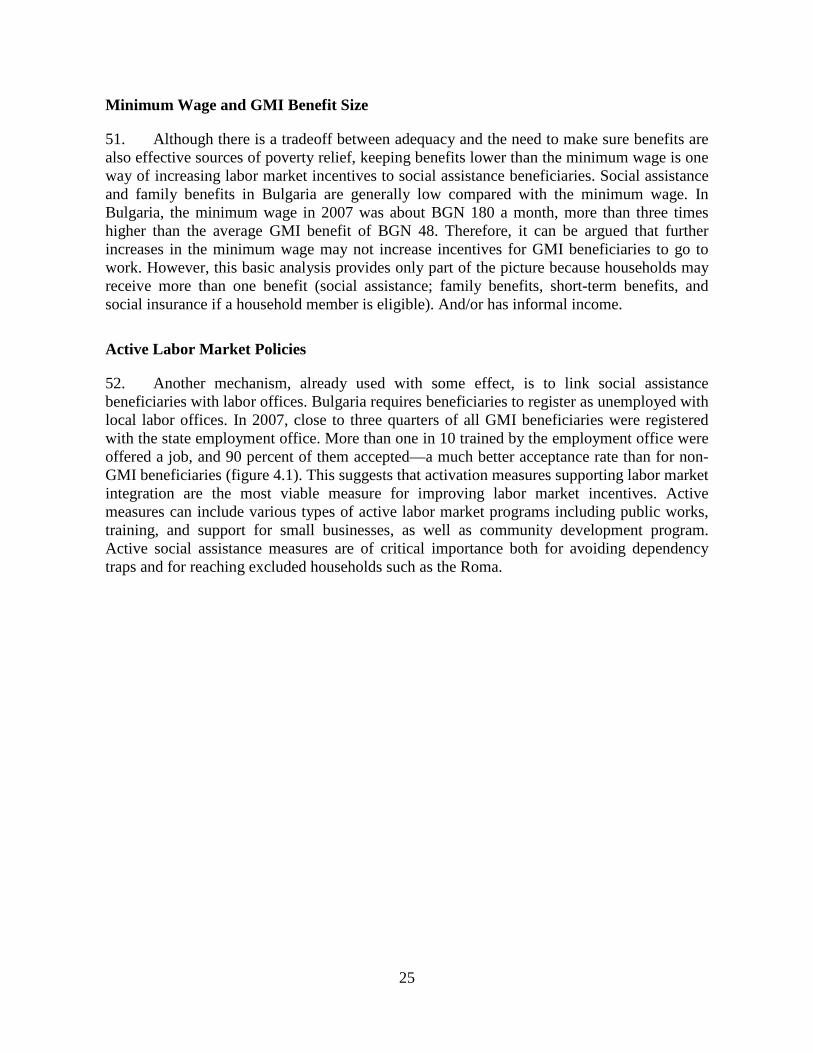
25
Minimum Wage and GMI Benefit Size
51. Although there is a tradeoff between adequacy and the need to make sure benefits are also effective sources of poverty relief, keeping benefits lower than the minimum wage is one way of increasing labor market incentives to social assistance beneficiaries. Social assistance and family benefits in Bulgaria are generally low compared with the minimum wage. In Bulgaria, the minimum wage in 2007 was about BGN 180 a month, more than three times higher than the average GMI benefit of BGN 48. Therefore, it can be argued that further increases in the minimum wage may not increase incentives for GMI beneficiaries to go to work. However, this basic analysis provides only part of the picture because households may receive more than one benefit (social assistance; family benefits, short-term benefits, and social insurance if a household member is eligible). And/or has informal income.
Active Labor Market Policies
52. Another mechanism, already used with some effect, is to link social assistance beneficiaries with labor offices. Bulgaria requires beneficiaries to register as unemployed with local labor offices. In 2007, close to three quarters of all GMI beneficiaries were registered with the state employment office. More than one in 10 trained by the employment office were offered a job, and 90 percent of them accepted—a much better acceptance rate than for non-GMI beneficiaries (figure 4.1). This suggests that activation measures supporting labor market integration are the most viable measure for improving labor market incentives. Active measures can include various types of active labor market programs including public works, training, and support for small businesses, as well as community development program. Active social assistance measures are of critical importance both for avoiding dependency traps and for reaching excluded households such as the Roma.
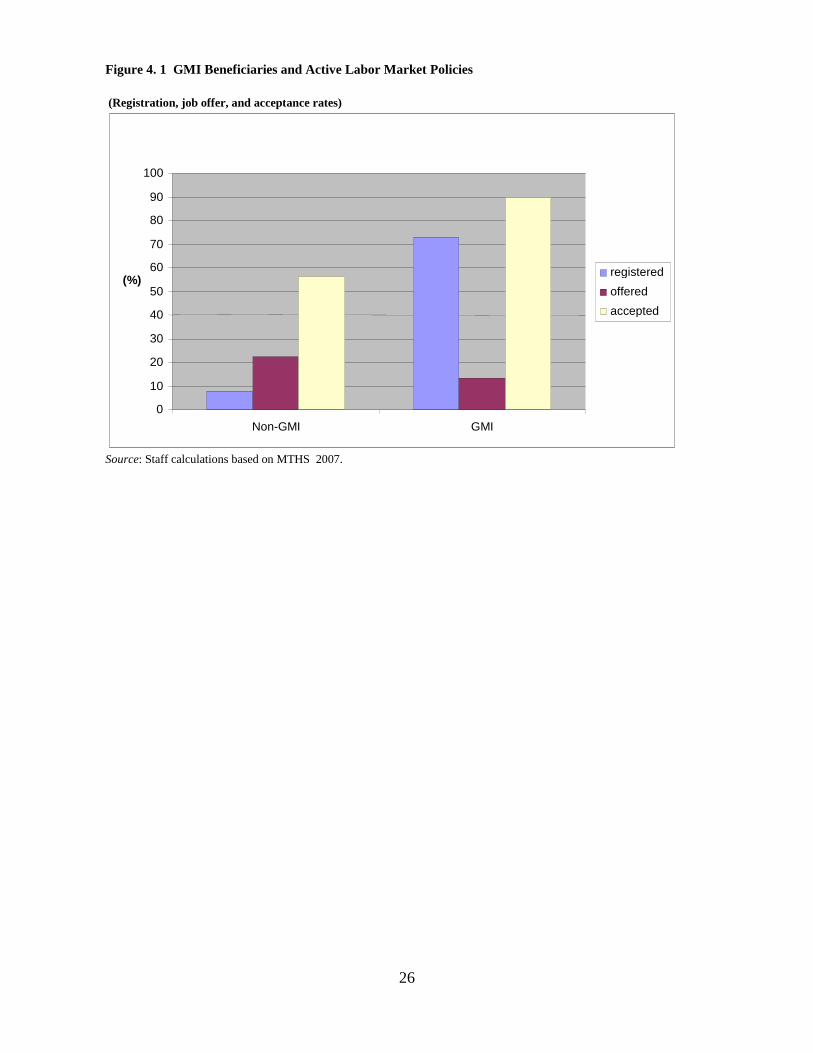
26
(Registration, job offer, and acceptance rates)
Source: Staff calculations based on MTHS 2007.
0 10 20 30 40 50 60 70 80 90
100
Non-GMI GMI
(%) registered offered accepted
Figure 4. 1 GMI Beneficiaries and Active Labor Market Policies
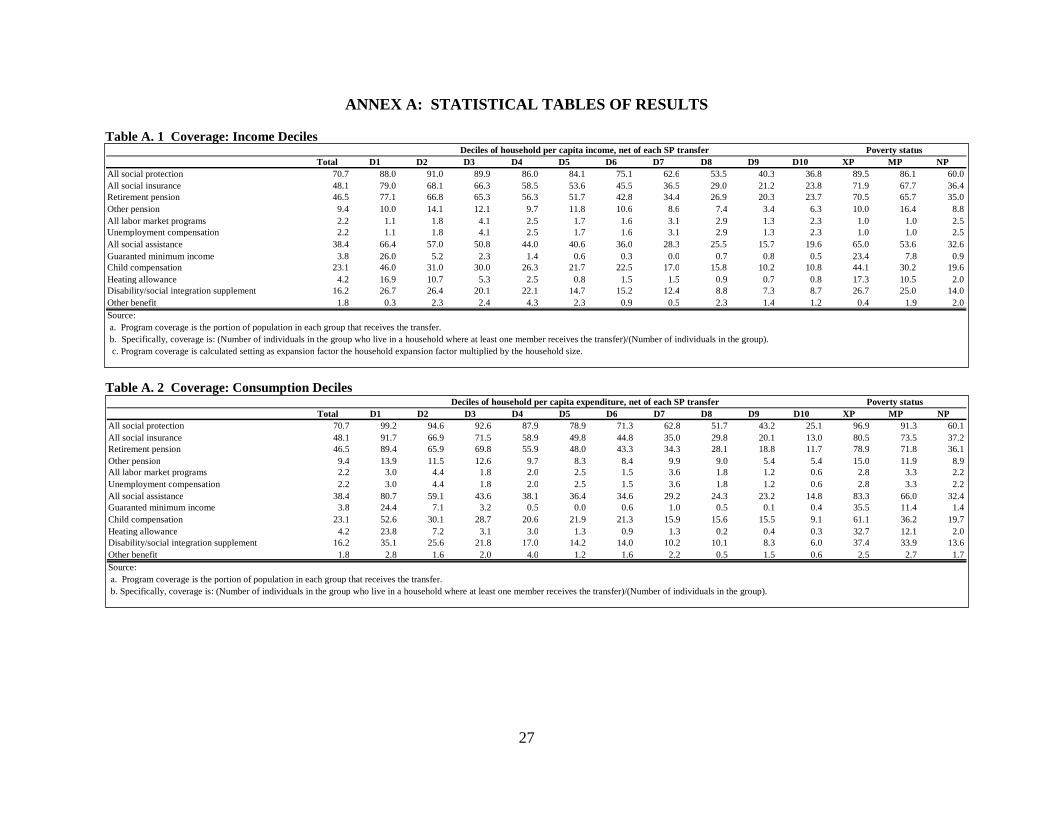
27
ANNEX A: STATISTICAL TABLES OF RESULTS Table A. 1 Coverage: Income Deciles
Table A. 2 Coverage: Consumption Deciles
Total D1 D2 D3 D4 D5 D6 D7 D8 D9 D10 XP MP NP All social protection 70.7 99.2 94.6 92.6 87.9 78.9 71.3 62.8 51.7 43.2 25.1 96.9 91.3 60.1 All social insurance 48.1 91.7 66.9 71.5 58.9 49.8 44.8 35.0 29.8 20.1 13.0 80.5 73.5 37.2 Retirement pension 46.5 89.4 65.9 69.8 55.9 48.0 43.3 34.3 28.1 18.8 11.7 78.9 71.8 36.1 Other pension 9.4 13.9 11.5 12.6 9.7 8.3 8.4 9.9 9.0 5.4 5.4 15.0 11.9 8.9 All labor market programs 2.2 3.0 4.4 1.8 2.0 2.5 1.5 3.6 1.8 1.2 0.6 2.8 3.3 2.2 Unemployment compensation 2.2 3.0 4.4 1.8 2.0 2.5 1.5 3.6 1.8 1.2 0.6 2.8 3.3 2.2 All social assistance 38.4 80.7 59.1 43.6 38.1 36.4 34.6 29.2 24.3 23.2 14.8 83.3 66.0 32.4 Guaranted minimum income 3.8 24.4 7.1 3.2 0.5 0.0 0.6 1.0 0.5 0.1 0.4 35.5 11.4 1.4 Child compensation 23.1 52.6 30.1 28.7 20.6 21.9 21.3 15.9 15.6 15.5 9.1 61.1 36.2 19.7 Heating allowance 4.2 23.8 7.2 3.1 3.0 1.3 0.9 1.3 0.2 0.4 0.3 32.7 12.1 2.0 Disability/social integration supplement 16.2 35.1 25.6 21.8 17.0 14.2 14.0 10.2 10.1 8.3 6.0 37.4 33.9 13.6 Other benefit 1.8 2.8 1.6 2.0 4.0 1.2 1.6 2.2 0.5 1.5 0.6 2.5 2.7 1.7 Source: a. Program coverage is the portion of population in each group that receives the transfer. b. Specifically, coverage is: (Number of individuals in the group who live in a household where at least one member receives the transfer)/(Number of individuals in the group).
Deciles of household per capita expenditure, net of each SP transfer Poverty status
Total D1 D2 D3 D4 D5 D6 D7 D8 D9 D10 XP MP NP All social protection 70.7 88.0 91.0 89.9 86.0 84.1 75.1 62.6 53.5 40.3 36.8 89.5 86.1 60.0 All social insurance 48.1 79.0 68.1 66.3 58.5 53.6 45.5 36.5 29.0 21.2 23.8 71.9 67.7 36.4 Retirement pension 46.5 77.1 66.8 65.3 56.3 51.7 42.8 34.4 26.9 20.3 23.7 70.5 65.7 35.0 Other pension 9.4 10.0 14.1 12.1 9.7 11.8 10.6 8.6 7.4 3.4 6.3 10.0 16.4 8.8 All labor market programs 2.2 1.1 1.8 4.1 2.5 1.7 1.6 3.1 2.9 1.3 2.3 1.0 1.0 2.5 Unemployment compensation 2.2 1.1 1.8 4.1 2.5 1.7 1.6 3.1 2.9 1.3 2.3 1.0 1.0 2.5 All social assistance 38.4 66.4 57.0 50.8 44.0 40.6 36.0 28.3 25.5 15.7 19.6 65.0 53.6 32.6 Guaranted minimum income 3.8 26.0 5.2 2.3 1.4 0.6 0.3 0.0 0.7 0.8 0.5 23.4 7.8 0.9 Child compensation 23.1 46.0 31.0 30.0 26.3 21.7 22.5 17.0 15.8 10.2 10.8 44.1 30.2 19.6 Heating allowance 4.2 16.9 10.7 5.3 2.5 0.8 1.5 1.5 0.9 0.7 0.8 17.3 10.5 2.0 Disability/social integration supplement 16.2 26.7 26.4 20.1 22.1 14.7 15.2 12.4 8.8 7.3 8.7 26.7 25.0 14.0 Other benefit 1.8 0.3 2.3 2.4 4.3 2.3 0.9 0.5 2.3 1.4 1.2 0.4 1.9 2.0 Source: a. Program coverage is the portion of population in each group that receives the transfer. b. Specifically, coverage is: (Number of individuals in the group who live in a household where at least one member receives the transfer)/(Number of individuals in the group). c. Program coverage is calculated setting as expansion factor the household expansion factor multiplied by the household size.
Deciles of household per capita income, net of each SP transfer Poverty status
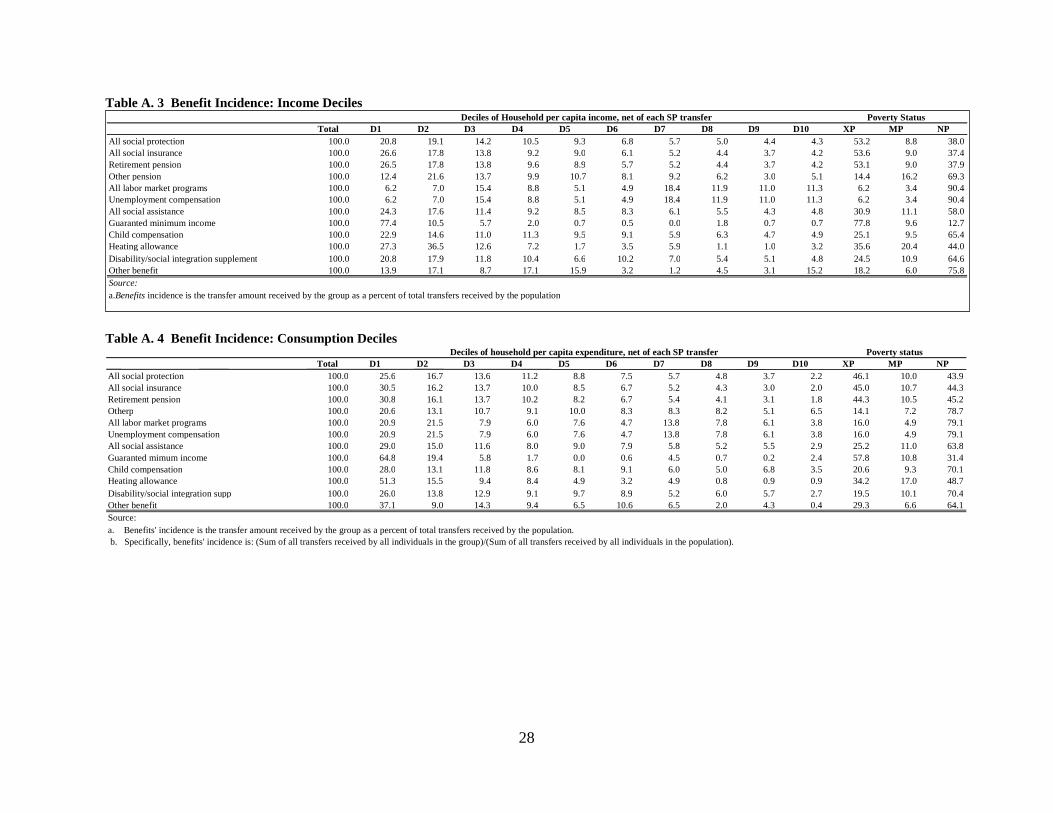
28
Table A. 3 Benefit Incidence: Income Deciles
Table A. 4 Benefit Incidence: Consumption Deciles
Total D1 D2 D3 D4 D5 D6 D7 D8 D9 D10 XP MP NP All social protection 100.0 25.6 16.7 13.6 11.2 8.8 7.5 5.7 4.8 3.7 2.2 46.1 10.0 43.9 All social insurance 100.0 30.5 16.2 13.7 10.0 8.5 6.7 5.2 4.3 3.0 2.0 45.0 10.7 44.3 Retirement pension 100.0 30.8 16.1 13.7 10.2 8.2 6.7 5.4 4.1 3.1 1.8 44.3 10.5 45.2 Otherp 100.0 20.6 13.1 10.7 9.1 10.0 8.3 8.3 8.2 5.1 6.5 14.1 7.2 78.7 All labor market programs 100.0 20.9 21.5 7.9 6.0 7.6 4.7 13.8 7.8 6.1 3.8 16.0 4.9 79.1 Unemployment compensation 100.0 20.9 21.5 7.9 6.0 7.6 4.7 13.8 7.8 6.1 3.8 16.0 4.9 79.1 All social assistance 100.0 29.0 15.0 11.6 8.0 9.0 7.9 5.8 5.2 5.5 2.9 25.2 11.0 63.8 Guaranted mimum income 100.0 64.8 19.4 5.8 1.7 0.0 0.6 4.5 0.7 0.2 2.4 57.8 10.8 31.4 Child compensation 100.0 28.0 13.1 11.8 8.6 8.1 9.1 6.0 5.0 6.8 3.5 20.6 9.3 70.1 Heating allowance 100.0 51.3 15.5 9.4 8.4 4.9 3.2 4.9 0.8 0.9 0.9 34.2 17.0 48.7 Disability/social integration supp 100.0 26.0 13.8 12.9 9.1 9.7 8.9 5.2 6.0 5.7 2.7 19.5 10.1 70.4 Other benefit 100.0 37.1 9.0 14.3 9.4 6.5 10.6 6.5 2.0 4.3 0.4 29.3 6.6 64.1 Source: a. Benefits' incidence is the transfer amount received by the group as a percent of total transfers received by the population. b. Specifically, benefits' incidence is: (Sum of all transfers received by all individuals in the group)/(Sum of all transfers received by all individuals in the population).
Deciles of household per capita expenditure, net of each SP transfer Poverty status
Total D1 D2 D3 D4 D5 D6 D7 D8 D9 D10 XP MP NP All social protection 100.0 20.8 19.1 14.2 10.5 9.3 6.8 5.7 5.0 4.4 4.3 53.2 8.8 38.0 All social insurance 100.0 26.6 17.8 13.8 9.2 9.0 6.1 5.2 4.4 3.7 4.2 53.6 9.0 37.4 Retirement pension 100.0 26.5 17.8 13.8 9.6 8.9 5.7 5.2 4.4 3.7 4.2 53.1 9.0 37.9 Other pension 100.0 12.4 21.6 13.7 9.9 10.7 8.1 9.2 6.2 3.0 5.1 14.4 16.2 69.3 All labor market programs 100.0 6.2 7.0 15.4 8.8 5.1 4.9 18.4 11.9 11.0 11.3 6.2 3.4 90.4 Unemployment compensation 100.0 6.2 7.0 15.4 8.8 5.1 4.9 18.4 11.9 11.0 11.3 6.2 3.4 90.4 All social assistance 100.0 24.3 17.6 11.4 9.2 8.5 8.3 6.1 5.5 4.3 4.8 30.9 11.1 58.0 Guaranted minimum income 100.0 77.4 10.5 5.7 2.0 0.7 0.5 0.0 1.8 0.7 0.7 77.8 9.6 12.7 Child compensation 100.0 22.9 14.6 11.0 11.3 9.5 9.1 5.9 6.3 4.7 4.9 25.1 9.5 65.4 Heating allowance 100.0 27.3 36.5 12.6 7.2 1.7 3.5 5.9 1.1 1.0 3.2 35.6 20.4 44.0 Disability/social integration supplement 100.0 20.8 17.9 11.8 10.4 6.6 10.2 7.0 5.4 5.1 4.8 24.5 10.9 64.6 Other benefit 100.0 13.9 17.1 8.7 17.1 15.9 3.2 1.2 4.5 3.1 15.2 18.2 6.0 75.8 Source: a.Benefits incidence is the transfer amount received by the group as a percent of total transfers received by the population
Deciles of Household per capita income, net of each SP transfer Poverty Status
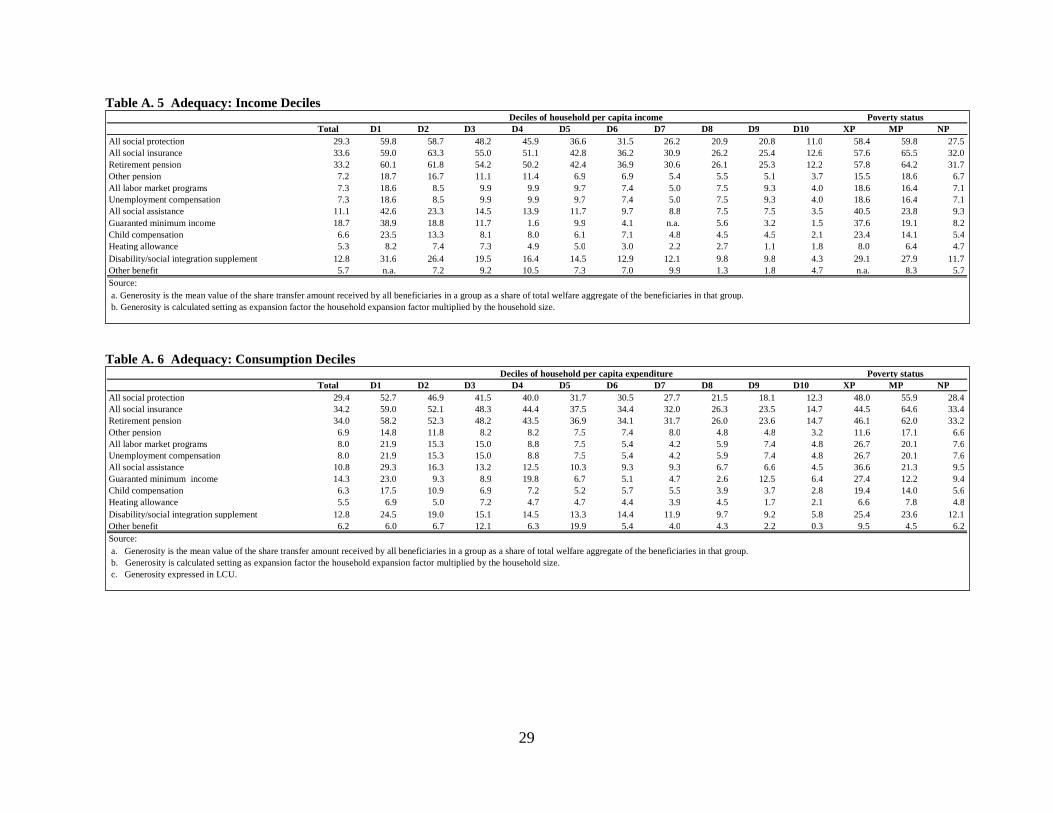
29
Table A. 5 Adequacy: Income Deciles
Table A. 6 Adequacy: Consumption Deciles
Total D1 D2 D3 D4 D5 D6 D7 D8 D9 D10 XP MP NP All social protection 29.4 52.7 46.9 41.5 40.0 31.7 30.5 27.7 21.5 18.1 12.3 48.0 55.9 28.4 All social insurance 34.2 59.0 52.1 48.3 44.4 37.5 34.4 32.0 26.3 23.5 14.7 44.5 64.6 33.4 Retirement pension 34.0 58.2 52.3 48.2 43.5 36.9 34.1 31.7 26.0 23.6 14.7 46.1 62.0 33.2 Other pension 6.9 14.8 11.8 8.2 8.2 7.5 7.4 8.0 4.8 4.8 3.2 11.6 17.1 6.6 All labor market programs 8.0 21.9 15.3 15.0 8.8 7.5 5.4 4.2 5.9 7.4 4.8 26.7 20.1 7.6 Unemployment compensation 8.0 21.9 15.3 15.0 8.8 7.5 5.4 4.2 5.9 7.4 4.8 26.7 20.1 7.6 All social assistance 10.8 29.3 16.3 13.2 12.5 10.3 9.3 9.3 6.7 6.6 4.5 36.6 21.3 9.5 Guaranted minimum income 14.3 23.0 9.3 8.9 19.8 6.7 5.1 4.7 2.6 12.5 6.4 27.4 12.2 9.4 Child compensation 6.3 17.5 10.9 6.9 7.2 5.2 5.7 5.5 3.9 3.7 2.8 19.4 14.0 5.6 Heating allowance 5.5 6.9 5.0 7.2 4.7 4.7 4.4 3.9 4.5 1.7 2.1 6.6 7.8 4.8 Disability/social integration supplement 12.8 24.5 19.0 15.1 14.5 13.3 14.4 11.9 9.7 9.2 5.8 25.4 23.6 12.1 Other benefit 6.2 6.0 6.7 12.1 6.3 19.9 5.4 4.0 4.3 2.2 0.3 9.5 4.5 6.2 Source: a. Generosity is the mean value of the share transfer amount received by all beneficiaries in a group as a share of total welfare aggregate of the beneficiaries in that group. b. Generosity is calculated setting as expansion factor the household expansion factor multiplied by the household size. c. Generosity expressed in LCU.
Deciles of household per capita expenditure Poverty status
Total D1 D2 D3 D4 D5 D6 D7 D8 D9 D10 XP MP NP All social protection 29.3 59.8 58.7 48.2 45.9 36.6 31.5 26.2 20.9 20.8 11.0 58.4 59.8 27.5 All social insurance 33.6 59.0 63.3 55.0 51.1 42.8 36.2 30.9 26.2 25.4 12.6 57.6 65.5 32.0 Retirement pension 33.2 60.1 61.8 54.2 50.2 42.4 36.9 30.6 26.1 25.3 12.2 57.8 64.2 31.7 Other pension 7.2 18.7 16.7 11.1 11.4 6.9 6.9 5.4 5.5 5.1 3.7 15.5 18.6 6.7 All labor market programs 7.3 18.6 8.5 9.9 9.9 9.7 7.4 5.0 7.5 9.3 4.0 18.6 16.4 7.1 Unemployment compensation 7.3 18.6 8.5 9.9 9.9 9.7 7.4 5.0 7.5 9.3 4.0 18.6 16.4 7.1 All social assistance 11.1 42.6 23.3 14.5 13.9 11.7 9.7 8.8 7.5 7.5 3.5 40.5 23.8 9.3 Guaranted minimum income 18.7 38.9 18.8 11.7 1.6 9.9 4.1 n.a. 5.6 3.2 1.5 37.6 19.1 8.2 Child compensation 6.6 23.5 13.3 8.1 8.0 6.1 7.1 4.8 4.5 4.5 2.1 23.4 14.1 5.4 Heating allowance 5.3 8.2 7.4 7.3 4.9 5.0 3.0 2.2 2.7 1.1 1.8 8.0 6.4 4.7 Disability/social integration supplement 12.8 31.6 26.4 19.5 16.4 14.5 12.9 12.1 9.8 9.8 4.3 29.1 27.9 11.7 Other benefit 5.7 n.a. 7.2 9.2 10.5 7.3 7.0 9.9 1.3 1.8 4.7 n.a. 8.3 5.7 Source: a. Generosity is the mean value of the share transfer amount received by all beneficiaries in a group as a share of total welfare aggregate of the beneficiaries in that group. b. Generosity is calculated setting as expansion factor the household expansion factor multiplied by the household size.
Deciles of household per capita income Poverty status

30
Table A. 7 Cost Benefit Analysis: Income Deciles
Simulated poverty
gap without transfer
Actual poverty
gap Difference
(dPG)
Total amount spent in
program
(X)
Cost- benefit
(dPG0/X)
Simulated poverty
gap without transfer
Actual poverty
gap Difference
(dPG)
Total amount spent in
program
(X)
Cost- benefit
(dPG0/X)
All social protection 322,627 98,780 223,847 583,159 0.384 219,781 57,150 162,631 583,159 0.279 All social insurance 272,051 98,780 173,272 469,101 0.369 179,443 57,150 122,293 469,101 0.261 Retirement pension 263,104 98,780 164,324 450,171 0.365 171,910 57,150 114,760 450,171 0.255 Other pension 102,341 98,780 3,561 18,930 0.188 58,871 57,150 1,721 18,930 0.091 All labor market programs 99,123 98,780 343 5,181 0.066 57,334 57,150 184 5,181 0.036 Unemployment compensation 99,123 98,780 343 5,181 0.066 57,334 57,150 184 5,181 0.036 All social assistance 133,807 98,780 35,027 108,877 0.322 82,031 57,150 24,881 108,877 0.229 Guaranted minimum income 105,322 98,780 6,542 7,807 0.838 62,739 57,150 5,590 7,807 0.716 Child compensation 109,806 98,780 11,026 38,062 0.290 65,185 57,150 8,036 38,062 0.211 Heating allowance 100,419 98,780 1,639 3,552 0.461 58,040 57,150 890 3,552 0.251 Disability/social integration supplement 113,193 98,780 14,413 56,341 0.256 65,917 57,150 8,768 56,341 0.156 Other benefit 99,236 98,780 456 3,115 0.147 57,389 57,150 239 3,115 0.077 Source: a. Cost-benefit is the poverty gap reduction in U.S. dollars for each unity (BGN 1) spent in the social program. b. Amounts in LCU.
Upper poverty line Lower poverty line
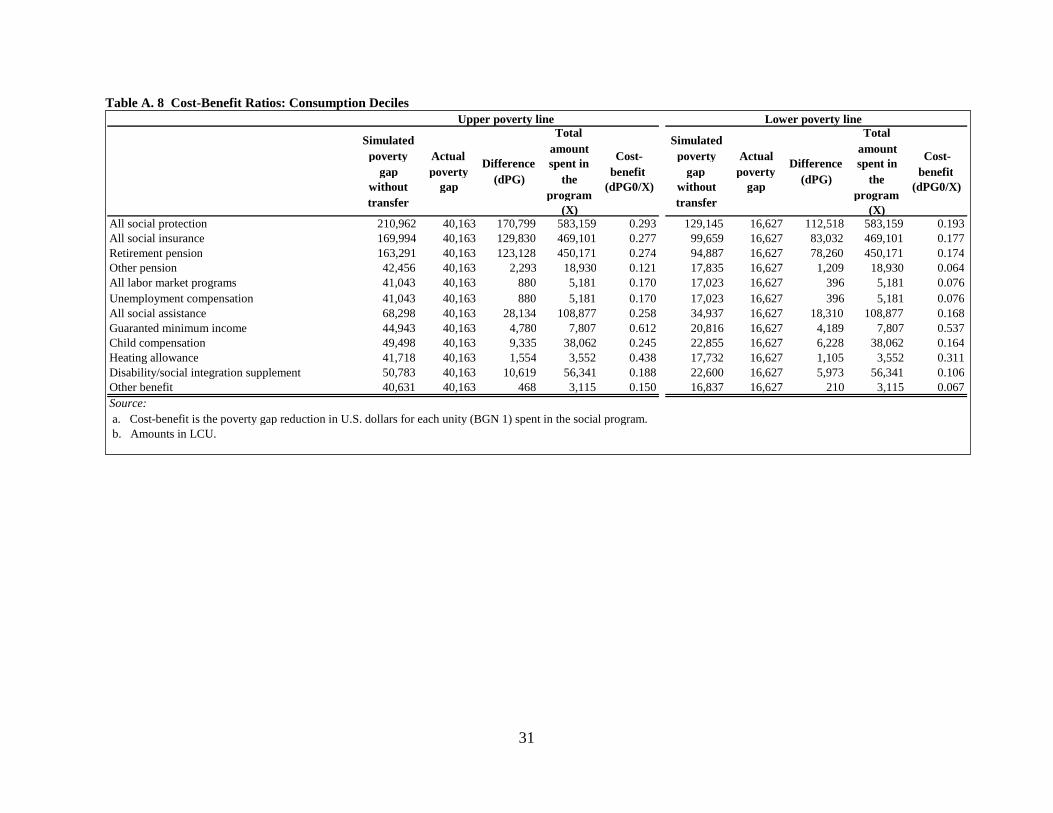
31
Table A. 8 Cost-Benefit Ratios: Consumption Deciles
Simulated poverty
gap without transfer
Actual poverty
gap Difference
(dPG)
Total amount spent in
the program
(X)
Cost- benefit
(dPG0/X)
Simulated poverty
gap without transfer
Actual poverty
gap Difference
(dPG)
Total amount spent in
the program
(X)
Cost- benefit
(dPG0/X)
All social protection 210,962 40,163 170,799 583,159 0.293 129,145 16,627 112,518 583,159 0.193 All social insurance 169,994 40,163 129,830 469,101 0.277 99,659 16,627 83,032 469,101 0.177 Retirement pension 163,291 40,163 123,128 450,171 0.274 94,887 16,627 78,260 450,171 0.174 Other pension 42,456 40,163 2,293 18,930 0.121 17,835 16,627 1,209 18,930 0.064 All labor market programs 41,043 40,163 880 5,181 0.170 17,023 16,627 396 5,181 0.076 Unemployment compensation 41,043 40,163 880 5,181 0.170 17,023 16,627 396 5,181 0.076 All social assistance 68,298 40,163 28,134 108,877 0.258 34,937 16,627 18,310 108,877 0.168 Guaranted minimum income 44,943 40,163 4,780 7,807 0.612 20,816 16,627 4,189 7,807 0.537 Child compensation 49,498 40,163 9,335 38,062 0.245 22,855 16,627 6,228 38,062 0.164 Heating allowance 41,718 40,163 1,554 3,552 0.438 17,732 16,627 1,105 3,552 0.311 Disability/social integration supplement 50,783 40,163 10,619 56,341 0.188 22,600 16,627 5,973 56,341 0.106 Other benefit 40,631 40,163 468 3,115 0.150 16,837 16,627 210 3,115 0.067 Source: a. Cost-benefit is the poverty gap reduction in U.S. dollars for each unity (BGN 1) spent in the social program. b. Amounts in LCU.
Upper poverty line Lower poverty line
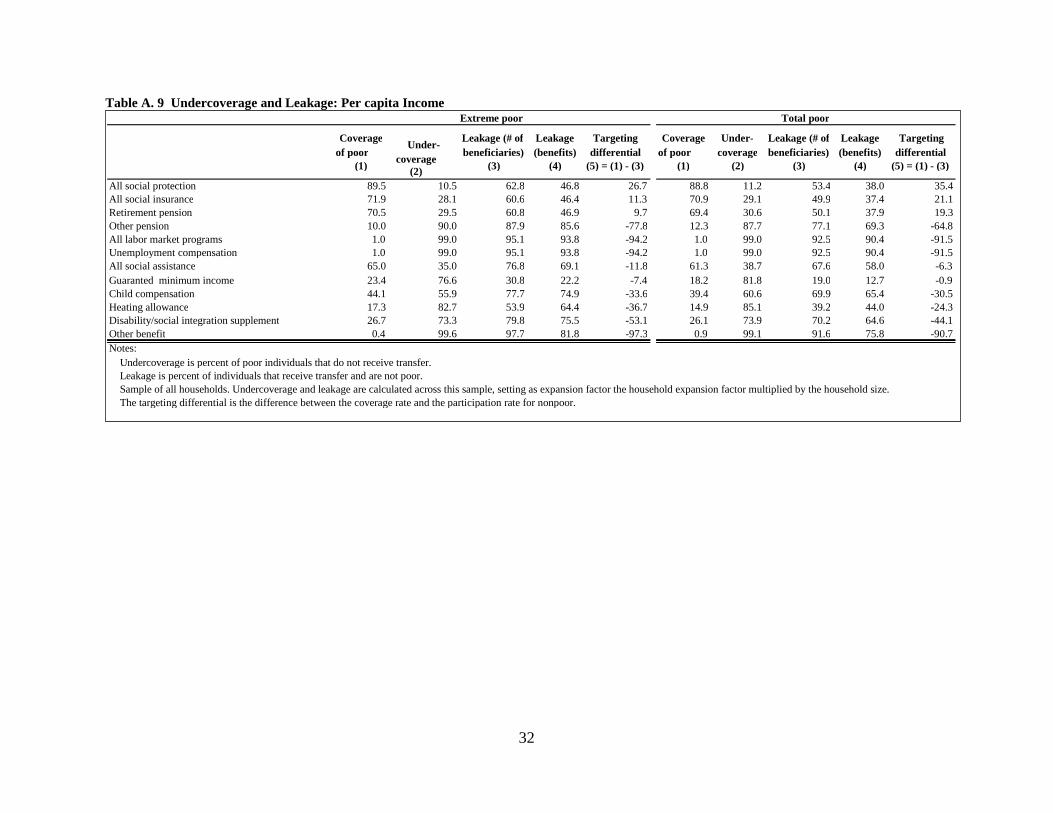
32
Table A. 9 Undercoverage and Leakage: Per capita Income
Coverage of poor
(1) Under-
coverage (2)
Leakage (# of beneficiaries)
(3)
Leakage (benefits)
(4)
Targeting differential
(5) = (1) - (3)
Coverage of poor
(1)
Under- coverage
(2)
Leakage (# of beneficiaries)
(3)
Leakage (benefits)
(4)
Targeting differential
(5) = (1) - (3) All social protection 89.5 10.5 62.8 46.8 26.7 88.8 11.2 53.4 38.0 35.4 All social insurance 71.9 28.1 60.6 46.4 11.3 70.9 29.1 49.9 37.4 21.1 Retirement pension 70.5 29.5 60.8 46.9 9.7 69.4 30.6 50.1 37.9 19.3 Other pension 10.0 90.0 87.9 85.6 -77.8 12.3 87.7 77.1 69.3 -64.8 All labor market programs 1.0 99.0 95.1 93.8 -94.2 1.0 99.0 92.5 90.4 -91.5 Unemployment compensation 1.0 99.0 95.1 93.8 -94.2 1.0 99.0 92.5 90.4 -91.5 All social assistance 65.0 35.0 76.8 69.1 -11.8 61.3 38.7 67.6 58.0 -6.3 Guaranted minimum income 23.4 76.6 30.8 22.2 -7.4 18.2 81.8 19.0 12.7 -0.9 Child compensation 44.1 55.9 77.7 74.9 -33.6 39.4 60.6 69.9 65.4 -30.5 Heating allowance 17.3 82.7 53.9 64.4 -36.7 14.9 85.1 39.2 44.0 -24.3 Disability/social integration supplement 26.7 73.3 79.8 75.5 -53.1 26.1 73.9 70.2 64.6 -44.1 Other benefit 0.4 99.6 97.7 81.8 -97.3 0.9 99.1 91.6 75.8 -90.7 Notes: Undercoverage is percent of poor individuals that do not receive transfer. Leakage is percent of individuals that receive transfer and are not poor. Sample of all households. Undercoverage and leakage are calculated across this sample, setting as expansion factor the household expansion factor multiplied by the household size. The targeting differential is the difference between the coverage rate and the participation rate for nonpoor.
Extreme poor Total poor
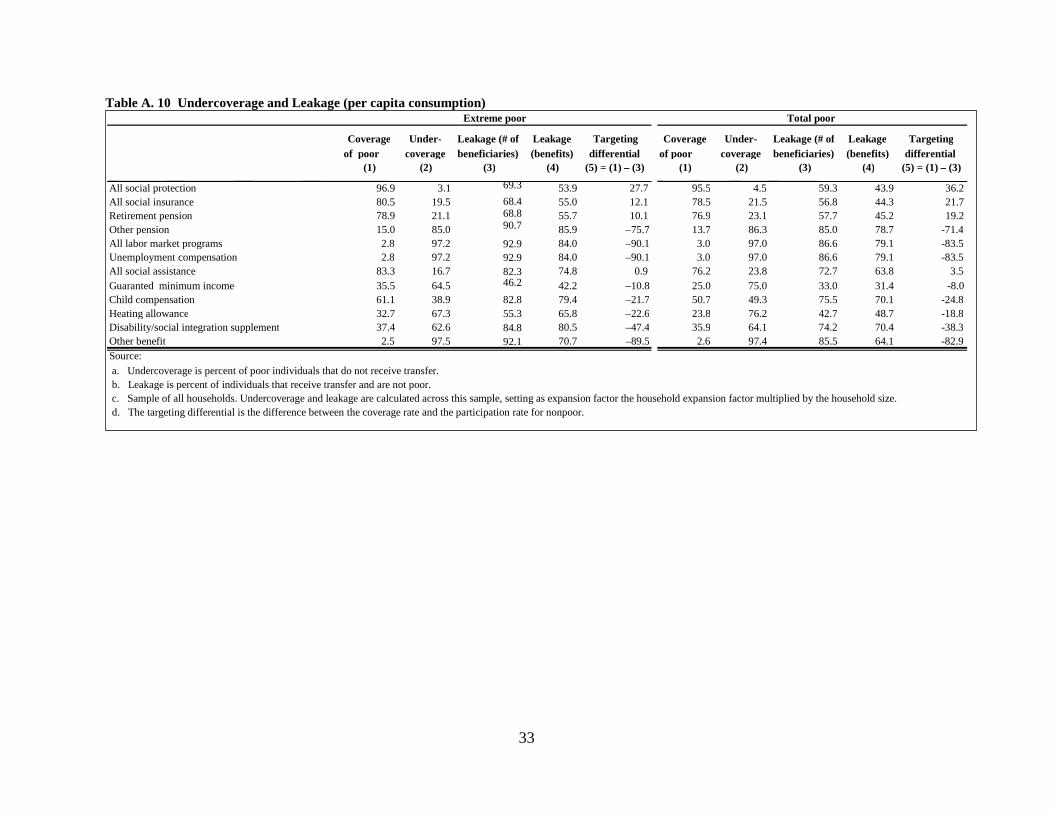
33
Table A. 10 Undercoverage and Leakage (per capita consumption)
Coverage of poor
(1)
Under- coverage
(2)
Leakage (# of beneficiaries)
(3)
Leakage (benefits)
(4)
Targeting differential
(5) = (1) – (3)
Coverage of poor
(1)
Under- coverage
(2)
Leakage (# of beneficiaries)
(3)
Leakage (benefits)
(4)
Targeting differential
(5) = (1) – (3) All social protection 96.9 3.1 69.3 53.9 27.7 95.5 4.5 59.3 43.9 36.2 All social insurance 80.5 19.5 68.4 55.0 12.1 78.5 21.5 56.8 44.3 21.7 Retirement pension 78.9 21.1 68.8 55.7 10.1 76.9 23.1 57.7 45.2 19.2 Other pension 15.0 85.0 90.7 85.9 –75.7 13.7 86.3 85.0 78.7 -71.4 All labor market programs 2.8 97.2 92.9 84.0 –90.1 3.0 97.0 86.6 79.1 -83.5 Unemployment compensation 2.8 97.2 92.9 84.0 –90.1 3.0 97.0 86.6 79.1 -83.5 All social assistance 83.3 16.7 82.3 74.8 0.9 76.2 23.8 72.7 63.8 3.5 Guaranted minimum income 35.5 64.5 46.2 42.2 –10.8 25.0 75.0 33.0 31.4 -8.0 Child compensation 61.1 38.9 82.8 79.4 –21.7 50.7 49.3 75.5 70.1 -24.8 Heating allowance 32.7 67.3 55.3 65.8 –22.6 23.8 76.2 42.7 48.7 -18.8 Disability/social integration supplement 37.4 62.6 84.8 80.5 –47.4 35.9 64.1 74.2 70.4 -38.3 Other benefit 2.5 97.5 92.1 70.7 –89.5 2.6 97.4 85.5 64.1 -82.9 Source: a. Undercoverage is percent of poor individuals that do not receive transfer. b. Leakage is percent of individuals that receive transfer and are not poor. c. Sample of all households. Undercoverage and leakage are calculated across this sample, setting as expansion factor the household expansion factor multiplied by the household size. d. The targeting differential is the difference between the coverage rate and the participation rate for nonpoor.
Extreme poor Total poor
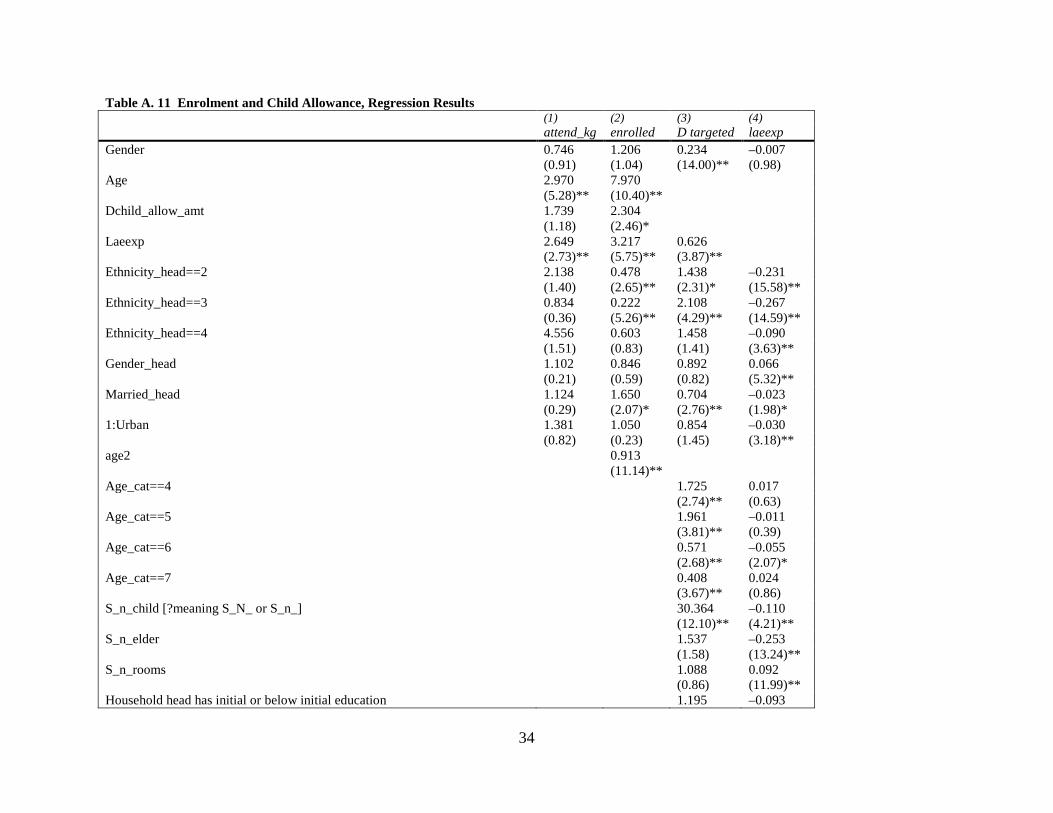
34
Table A. 11 Enrolment and Child Allowance, Regression Results (1) (2) (3) (4) attend_kg enrolled D targeted laeexp Gender 0.746 1.206 0.234 –0.007 (0.91) (1.04) (14.00)** (0.98) Age 2.970 7.970 (5.28)** (10.40)** Dchild_allow_amt 1.739 2.304 (1.18) (2.46)* Laeexp 2.649 3.217 0.626 (2.73)** (5.75)** (3.87)** Ethnicity_head==2 2.138 0.478 1.438 –0.231 (1.40) (2.65)** (2.31)* (15.58)** Ethnicity_head==3 0.834 0.222 2.108 –0.267 (0.36) (5.26)** (4.29)** (14.59)** Ethnicity_head==4 4.556 0.603 1.458 –0.090 (1.51) (0.83) (1.41) (3.63)** Gender_head 1.102 0.846 0.892 0.066 (0.21) (0.59) (0.82) (5.32)** Married_head 1.124 1.650 0.704 –0.023 (0.29) (2.07)* (2.76)** (1.98)* 1:Urban 1.381 1.050 0.854 –0.030 (0.82) (0.23) (1.45) (3.18)** age2 0.913 (11.14)** Age_cat==4 1.725 0.017 (2.74)** (0.63) Age_cat==5 1.961 –0.011 (3.81)** (0.39) Age_cat==6 0.571 –0.055 (2.68)** (2.07)* Age_cat==7 0.408 0.024 (3.67)** (0.86) S_n_child [?meaning S_N_ or S_n_] 30.364 –0.110 (12.10)** (4.21)** S_n_elder 1.537 –0.253 (1.58) (13.24)** S_n_rooms 1.088 0.092 (0.86) (11.99)** Household head has initial or below initial education 1.195 –0.093
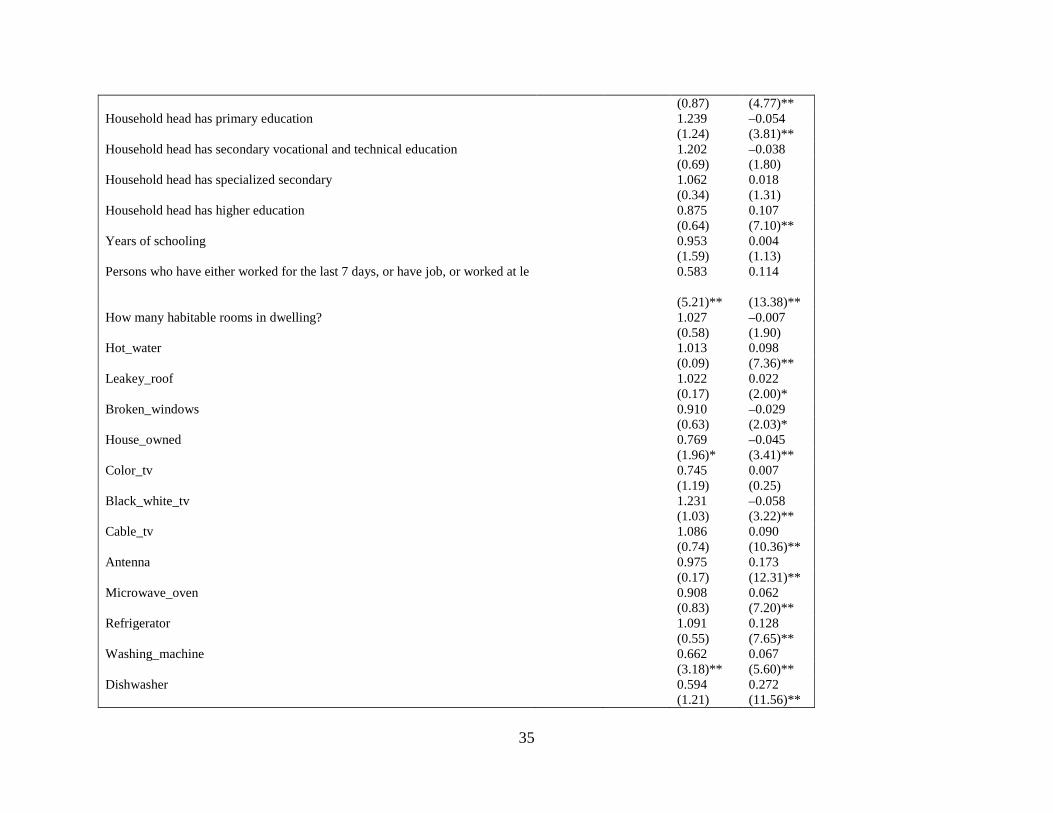
35
(0.87) (4.77)** Household head has primary education 1.239 –0.054 (1.24) (3.81)** Household head has secondary vocational and technical education 1.202 –0.038 (0.69) (1.80) Household head has specialized secondary 1.062 0.018 (0.34) (1.31) Household head has higher education 0.875 0.107 (0.64) (7.10)** Years of schooling 0.953 0.004 (1.59) (1.13) Persons who have either worked for the last 7 days, or have job, or worked at le
0.583 0.114
(5.21)** (13.38)** How many habitable rooms in dwelling? 1.027 –0.007 (0.58) (1.90) Hot_water 1.013 0.098 (0.09) (7.36)** Leakey_roof 1.022 0.022 (0.17) (2.00)* Broken_windows 0.910 –0.029 (0.63) (2.03)* House_owned 0.769 –0.045 (1.96)* (3.41)** Color_tv 0.745 0.007 (1.19) (0.25) Black_white_tv 1.231 –0.058 (1.03) (3.22)** Cable_tv 1.086 0.090 (0.74) (10.36)** Antenna 0.975 0.173 (0.17) (12.31)** Microwave_oven 0.908 0.062 (0.83) (7.20)** Refrigerator 1.091 0.128 (0.55) (7.65)** Washing_machine 0.662 0.067 (3.18)** (5.60)** Dishwasher 0.594 0.272 (1.21) (11.56)**
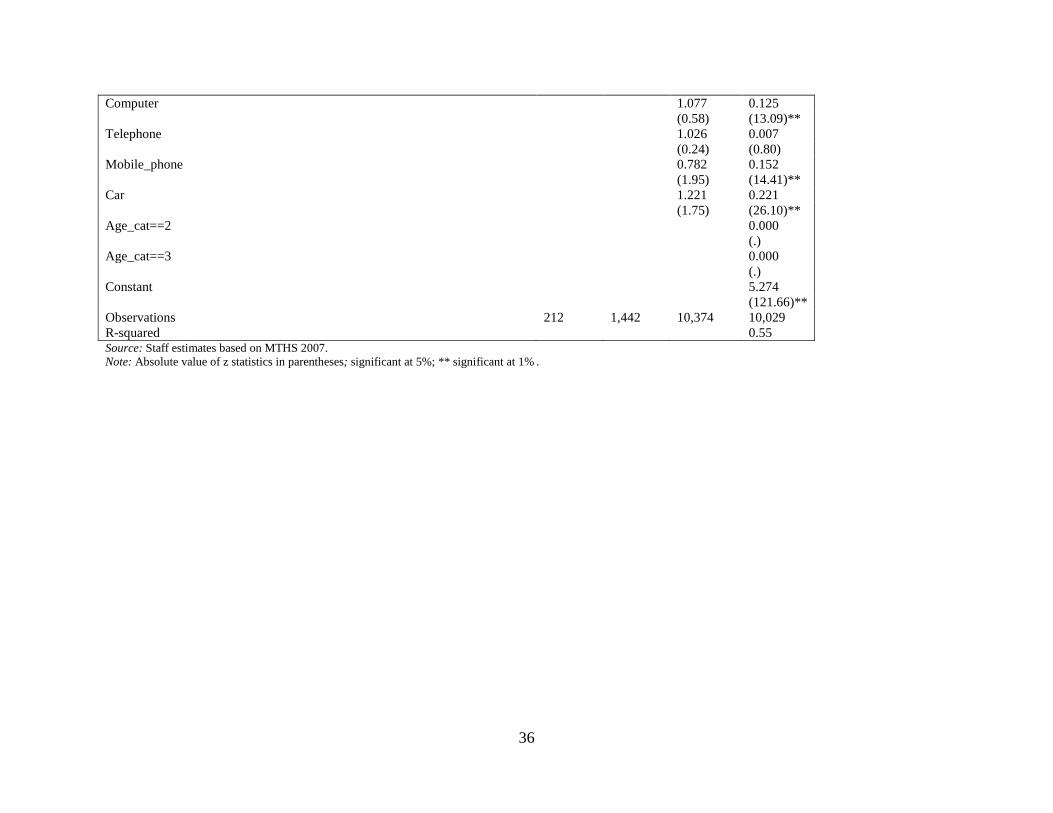
36
Computer 1.077 0.125 (0.58) (13.09)** Telephone 1.026 0.007 (0.24) (0.80) Mobile_phone 0.782 0.152 (1.95) (14.41)** Car 1.221 0.221 (1.75) (26.10)** Age_cat==2 0.000 (.) Age_cat==3 0.000 (.) Constant 5.274 (121.66)** Observations 212 1,442 10,374 10,029 R-squared 0.55 Source: Staff estimates based on MTHS 2007. Note: Absolute value of z statistics in parentheses; significant at 5%; ** significant at 1% .
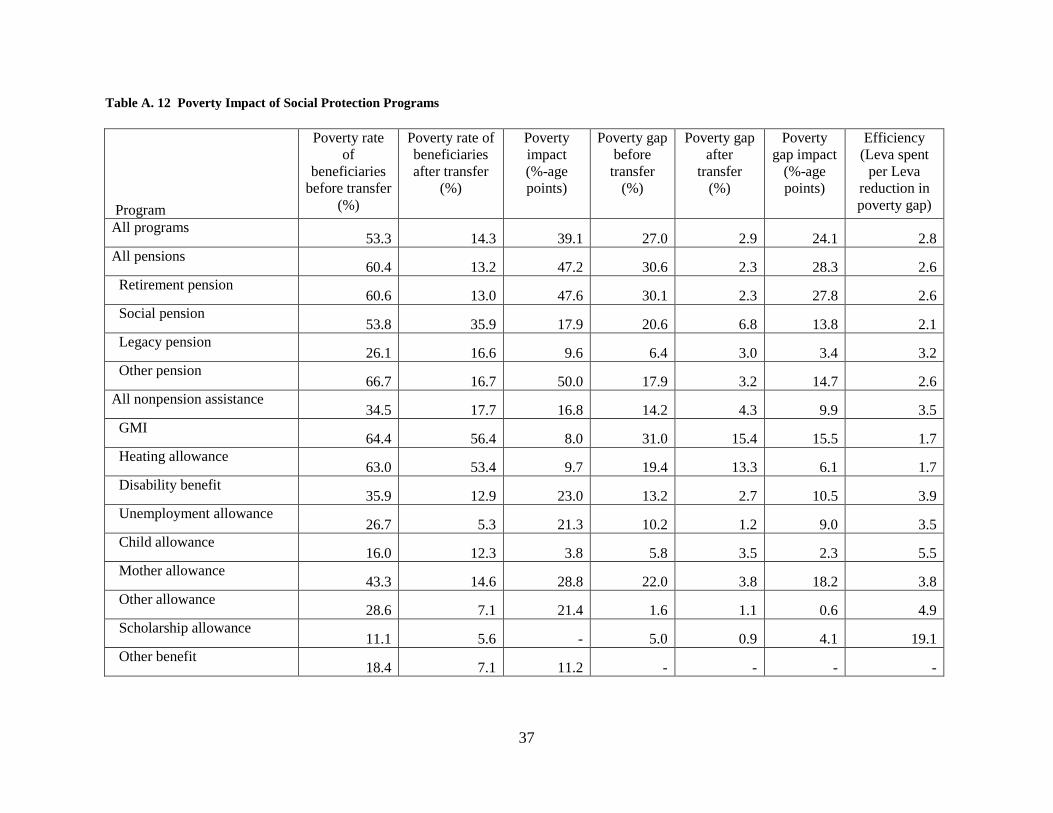
37
Table A. 12 Poverty Impact of Social Protection Programs
Program
Poverty rate of
beneficiaries before transfer
(%)
Poverty rate of beneficiaries after transfer
(%)
Poverty impact (%-age points)
Poverty gap before
transfer (%)
Poverty gap after
transfer (%)
Poverty gap impact
(%-age points)
Efficiency (Leva spent
per Leva reduction in poverty gap)
All programs 53.3 14.3 39.1 27.0 2.9 24.1 2.8
All pensions 60.4 13.2 47.2 30.6 2.3 28.3 2.6
Retirement pension 60.6 13.0 47.6 30.1 2.3 27.8 2.6
Social pension 53.8 35.9 17.9 20.6 6.8 13.8 2.1
Legacy pension 26.1 16.6 9.6 6.4 3.0 3.4 3.2
Other pension 66.7 16.7 50.0 17.9 3.2 14.7 2.6
All nonpension assistance 34.5 17.7 16.8 14.2 4.3 9.9 3.5
GMI 64.4 56.4 8.0 31.0 15.4 15.5 1.7
Heating allowance 63.0 53.4 9.7 19.4 13.3 6.1 1.7
Disability benefit 35.9 12.9 23.0 13.2 2.7 10.5 3.9
Unemployment allowance 26.7 5.3 21.3 10.2 1.2 9.0 3.5
Child allowance 16.0 12.3 3.8 5.8 3.5 2.3 5.5
Mother allowance 43.3 14.6 28.8 22.0 3.8 18.2 3.8
Other allowance 28.6 7.1 21.4 1.6 1.1 0.6 4.9
Scholarship allowance 11.1 5.6 - 5.0 0.9 4.1 19.1
Other benefit 18.4 7.1 11.2 - - - -
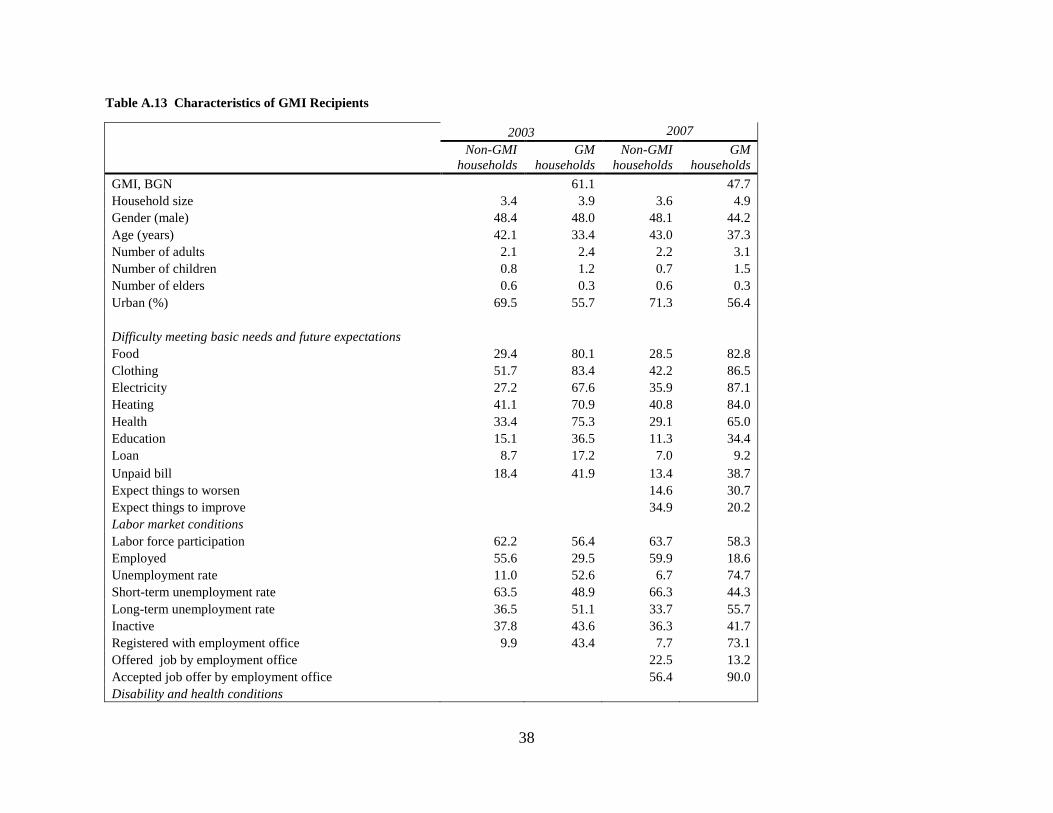
38
Table A.13 Characteristics of GMI Recipients 2003 2007
Non-GMI
households GM
households Non-GMI
households GM
households GMI, BGN 61.1 47.7 Household size 3.4 3.9 3.6 4.9 Gender (male) 48.4 48.0 48.1 44.2 Age (years) 42.1 33.4 43.0 37.3 Number of adults 2.1 2.4 2.2 3.1 Number of children 0.8 1.2 0.7 1.5 Number of elders 0.6 0.3 0.6 0.3 Urban (%) 69.5 55.7 71.3 56.4
Difficulty meeting basic needs and future expectations Food 29.4 80.1 28.5 82.8 Clothing 51.7 83.4 42.2 86.5 Electricity 27.2 67.6 35.9 87.1 Heating 41.1 70.9 40.8 84.0 Health 33.4 75.3 29.1 65.0 Education 15.1 36.5 11.3 34.4 Loan 8.7 17.2 7.0 9.2 Unpaid bill 18.4 41.9 13.4 38.7 Expect things to worsen 14.6 30.7 Expect things to improve 34.9 20.2 Labor market conditions Labor force participation 62.2 56.4 63.7 58.3 Employed 55.6 29.5 59.9 18.6 Unemployment rate 11.0 52.6 6.7 74.7 Short-term unemployment rate 63.5 48.9 66.3 44.3 Long-term unemployment rate 36.5 51.1 33.7 55.7 Inactive 37.8 43.6 36.3 41.7 Registered with employment office 9.9 43.4 7.7 73.1 Offered job by employment office 22.5 13.2 Accepted job offer by employment office 56.4 90.0 Disability and health conditions
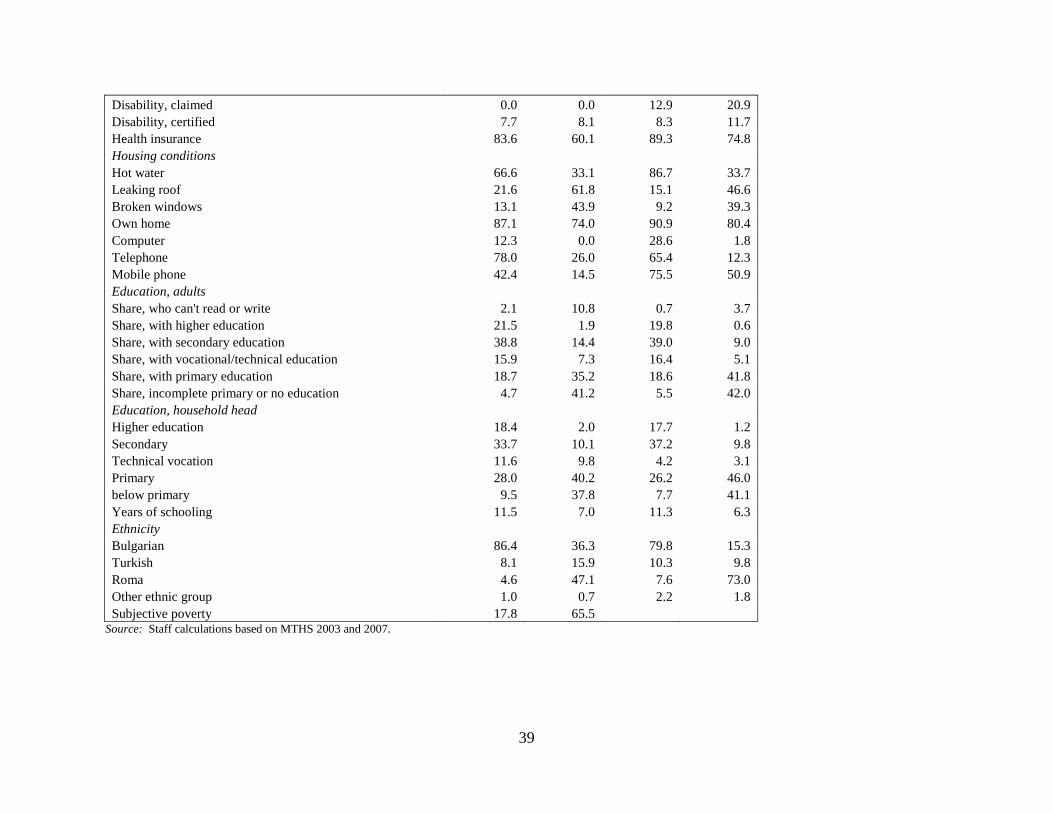
39
Disability, claimed 0.0 0.0 12.9 20.9 Disability, certified 7.7 8.1 8.3 11.7 Health insurance 83.6 60.1 89.3 74.8 Housing conditions Hot water 66.6 33.1 86.7 33.7 Leaking roof 21.6 61.8 15.1 46.6 Broken windows 13.1 43.9 9.2 39.3 Own home 87.1 74.0 90.9 80.4 Computer 12.3 0.0 28.6 1.8 Telephone 78.0 26.0 65.4 12.3 Mobile phone 42.4 14.5 75.5 50.9 Education, adults Share, who can't read or write 2.1 10.8 0.7 3.7 Share, with higher education 21.5 1.9 19.8 0.6 Share, with secondary education 38.8 14.4 39.0 9.0 Share, with vocational/technical education 15.9 7.3 16.4 5.1 Share, with primary education 18.7 35.2 18.6 41.8 Share, incomplete primary or no education 4.7 41.2 5.5 42.0 Education, household head Higher education 18.4 2.0 17.7 1.2 Secondary 33.7 10.1 37.2 9.8 Technical vocation 11.6 9.8 4.2 3.1 Primary 28.0 40.2 26.2 46.0 below primary 9.5 37.8 7.7 41.1 Years of schooling 11.5 7.0 11.3 6.3 Ethnicity Bulgarian 86.4 36.3 79.8 15.3 Turkish 8.1 15.9 10.3 9.8 Roma 4.6 47.1 7.6 73.0 Other ethnic group 1.0 0.7 2.2 1.8 Subjective poverty 17.8 65.5
Source: Staff calculations based on MTHS 2003 and 2007.
40
REFERENCES Castaneda and Lindert (2005), “Designing and implementing household targeting systems: lessons from Latin
American and the Unites States”. Social Safety Nets Primer, March 2005. World Bank. Coady, Grosh, and Hoddinott (2004), “Targeting of transfers in developing countries”. World Bank regional and
sectoral studies. Grosh, M. C. Del Ninno, E. Tesliuc, and A. Ouerghi. 2008. For Protection And Promotion: The Design And
Implementation Of Effective Safety Nets. Washington, DC: The World Bank Shopov, Georgi. 2008. “Assessment of the Administrative Costs of the Social Assistance Programs in Bulgaria”,
World Bank, Washington, DC. World Bank. 2002. A Sourcebook for Poverty Reduction Strategies. Vol. 2. Washington, DC: World Bank. World Bank. 2006. . World Development Report 2006, Oxford University Press, New York, New York World Bank. 2007. From Red to Gray. The Third Transition of the Aging of the Population of Eastern Europe and
Former Soviet Union. World Bank, Washington, DC. World Bank. 2008. “Bulgaria: Living Conditions before and after EU Accession.” World Bank, Washington, DC