Embed Size (px)
Citation preview

Saotharlann Náisiúnta Tagartha
Viris UCDUCD National Virus Reference
Laboratory
Dr. Jeff Connell
Assistant Director
National Virus Reference Laboratory.
National Epidemiology ProfileNational Epidemiology ProfileNational Epidemiology ProfileNational Epidemiology Profile

Presentation
• Background
• Needle-stick investigations performed at the NVRL
• National Epidemiological Data for HIV, HBV and HCV infection
• What information is available• Limitations of the data
National Epidemiology ProfileNational Epidemiology ProfileNational Epidemiology ProfileNational Epidemiology Profile

• Risk of transmission is probably directly related to the concentration of the virus (viral load) in the blood of the source patient at the time of exposure
Risk of blood-borne virus (BBB) transmissionRisk of blood-borne virus (BBB) transmissionRisk of blood-borne virus (BBB) transmissionRisk of blood-borne virus (BBB) transmission

Risk of transmission of a BBV to HCW from infected patient following a single open-bore needle-stick injury is;
• 20-30 % - HB eAg POSITIVE• 3% for anti-HCV positive source• 0.3% for anti-HIV positive source
Risk of blood-borne virus (BBB) transmissionRisk of blood-borne virus (BBB) transmissionRisk of blood-borne virus (BBB) transmissionRisk of blood-borne virus (BBB) transmission

NVRL needle-stick investigationsNVRL needle-stick investigations
Crude data – includes
• Source investigations• Recipient investigations
0
500
1000
1500
2000
2500
3000
2003 2004 2005
NVRL Data - samples referred for needlestick investigation (n = 6904)NVRL Data - samples referred for
needlestick investigation (n = 6904)

0
2
4
6
8
10
12
Perc
enta
ge
1 2 3 4 5 6 7 8 9 10
Hospital ID
NVRL Data - Hospitals in the Dublin AreaNVRL Data - Hospitals in the Dublin Area
49 % (3388/6904) of total needle-sticks 2003-2005

HIV infectionHIV infection

HIV HIV
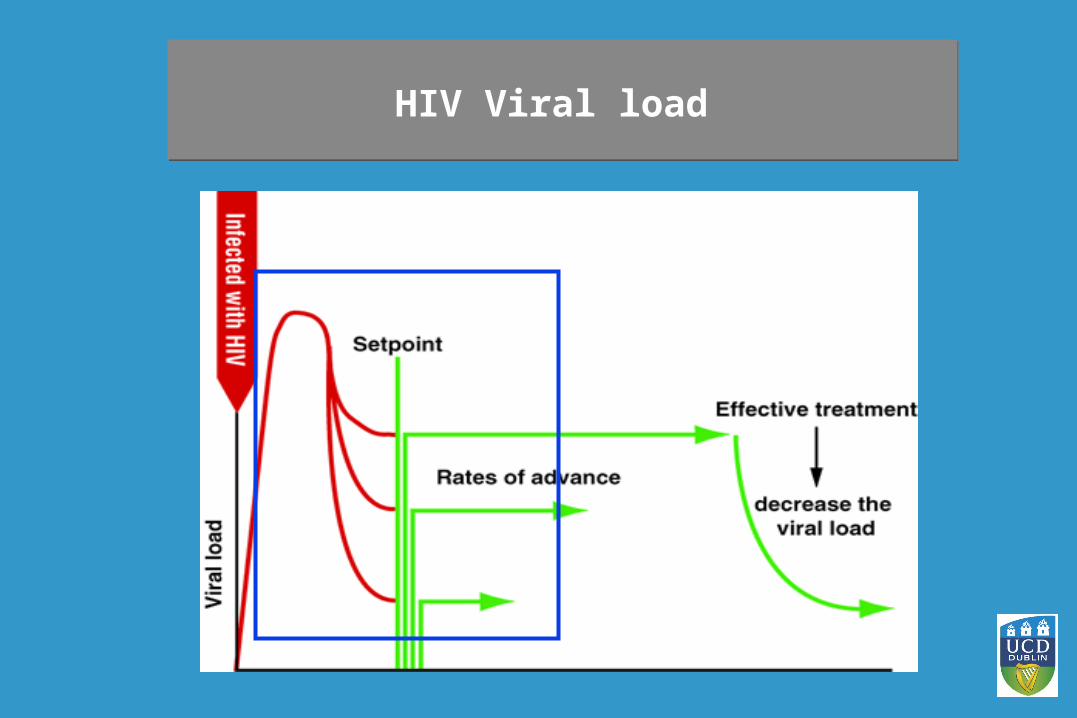
HIV Viral load HIV Viral load

HIV National Data – End of December 2000HIV National Data – End of December 2000
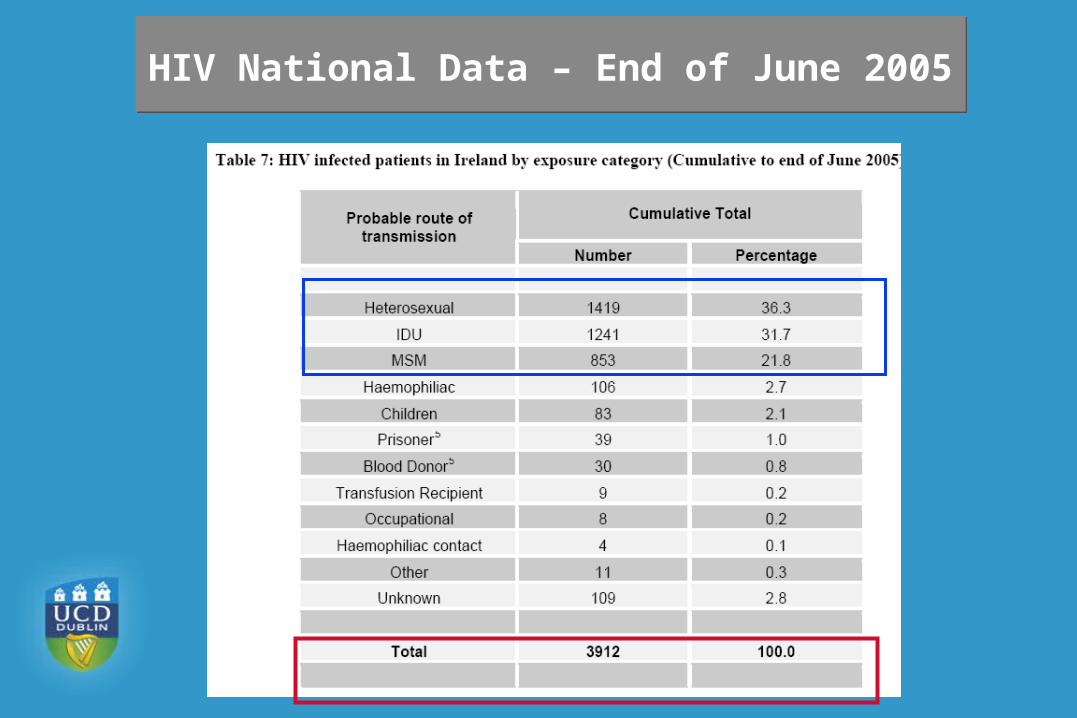
HIV National Data – End of June 2005HIV National Data – End of June 2005
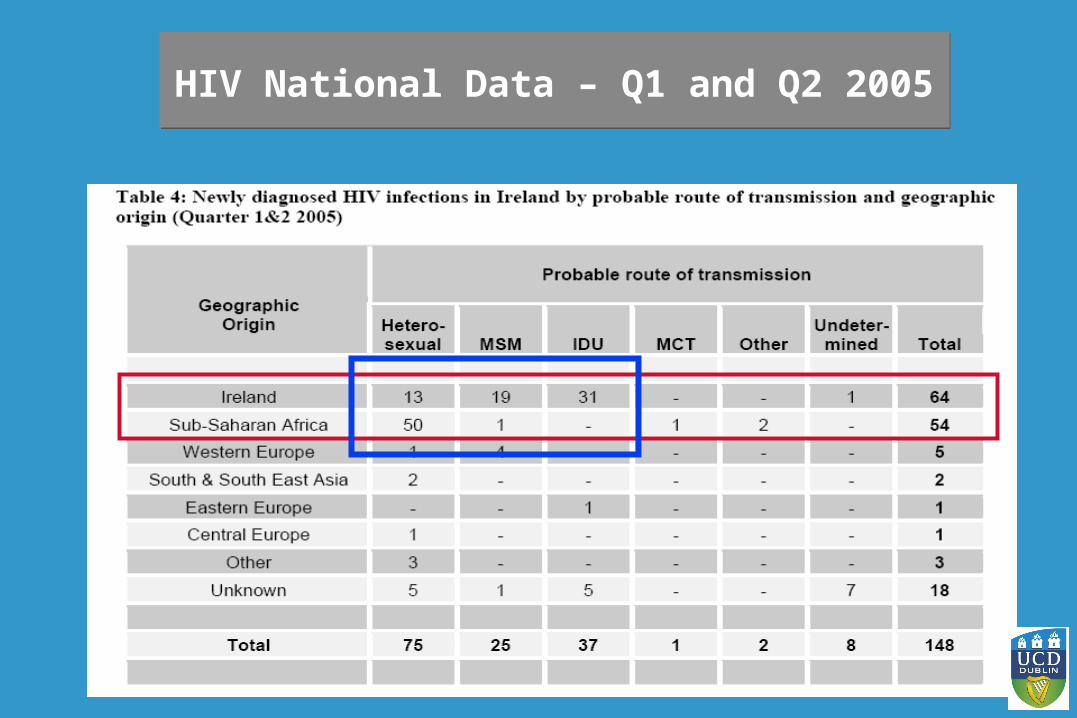
HIV National Data – Q1 and Q2 2005HIV National Data – Q1 and Q2 2005
Hepatitis BHepatitis B
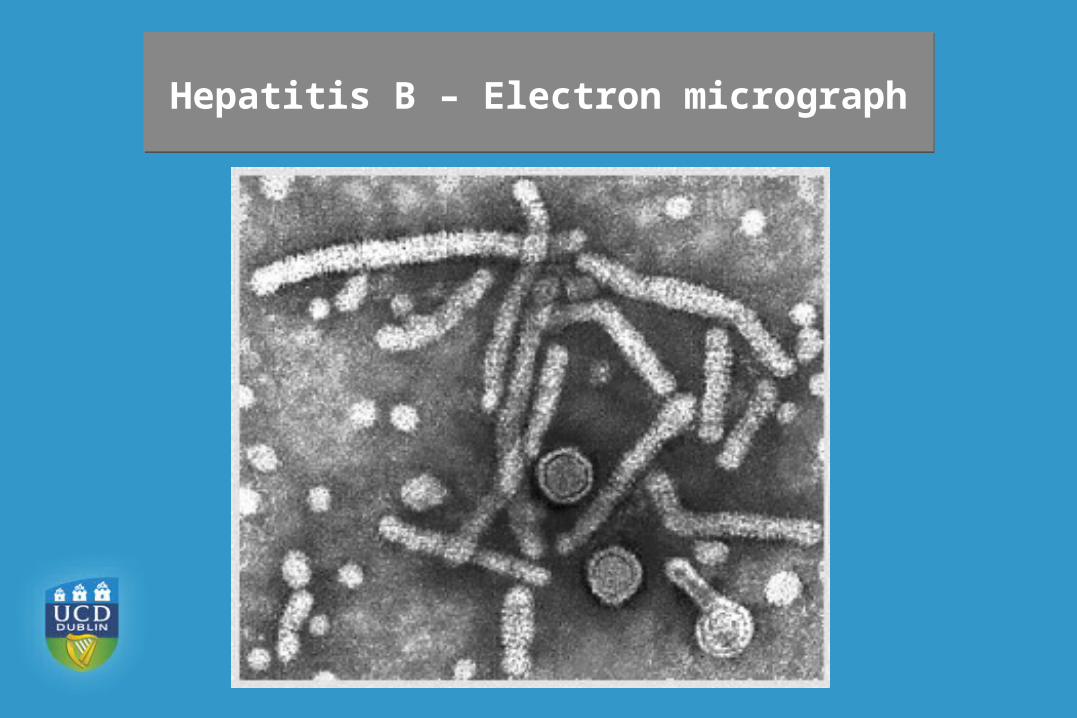
Hepatitis B – Electron micrographHepatitis B – Electron micrograph
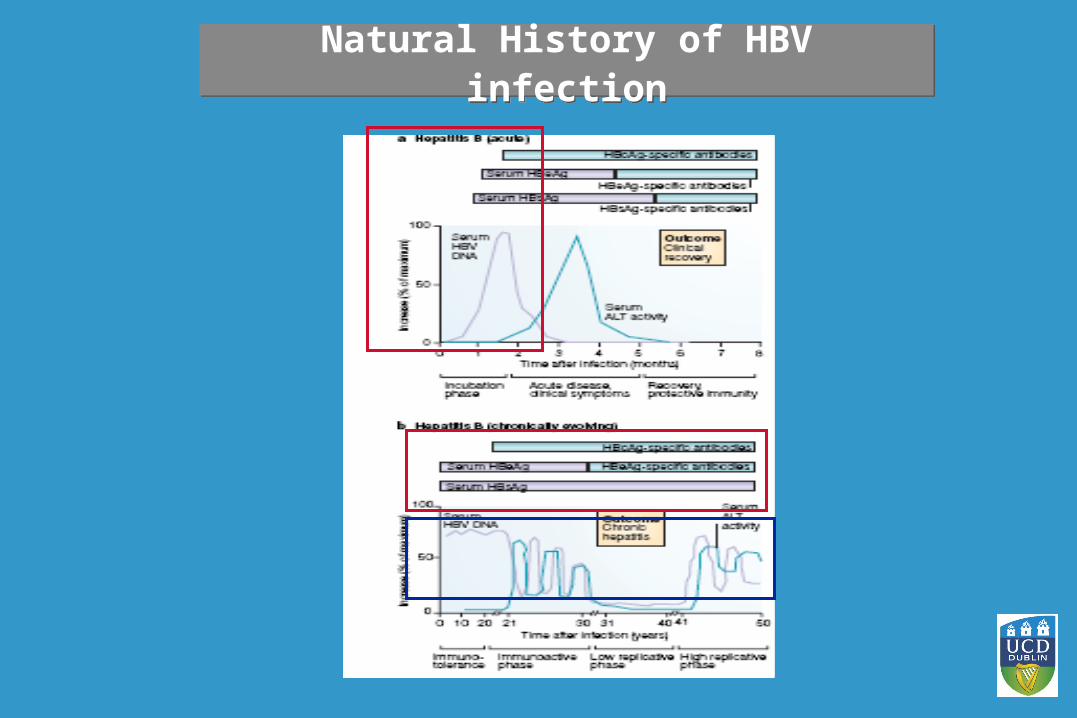
Natural History of HBV infectionNatural History of HBV infection
Hepatitis B infection in IrelandHepatitis B infection in Ireland
Nationally the numbers of HBV infected individuals is not known - data sources are
• Individual studies: IVDU, prisoners - underestimate the national problem
• NVRL database
• HPSC data
• ESEN 2 – European Sero-Epidemiology Network
• Antenatal screening

• 0.29% (5/1,714) samples positive for antibodies to HBc
• age range: 34-70 years
• sex : 3 male, 2 female
• location: 3 urban, 2 rural
• Adjusted prevalence for study design, estimated Irish population prevalence of HBV = 0.51%
HBV National Data – Oral fluid studyHBV National Data – Oral fluid study

HBV NVRL DataAugust 2004 to August 2005
HBV NVRL DataAugust 2004 to August 2005
• Non- acute HBV 459• Acute HBV 44
Total 503
0
5
10
15
20
25
30
35
40
1 2 3 4 5
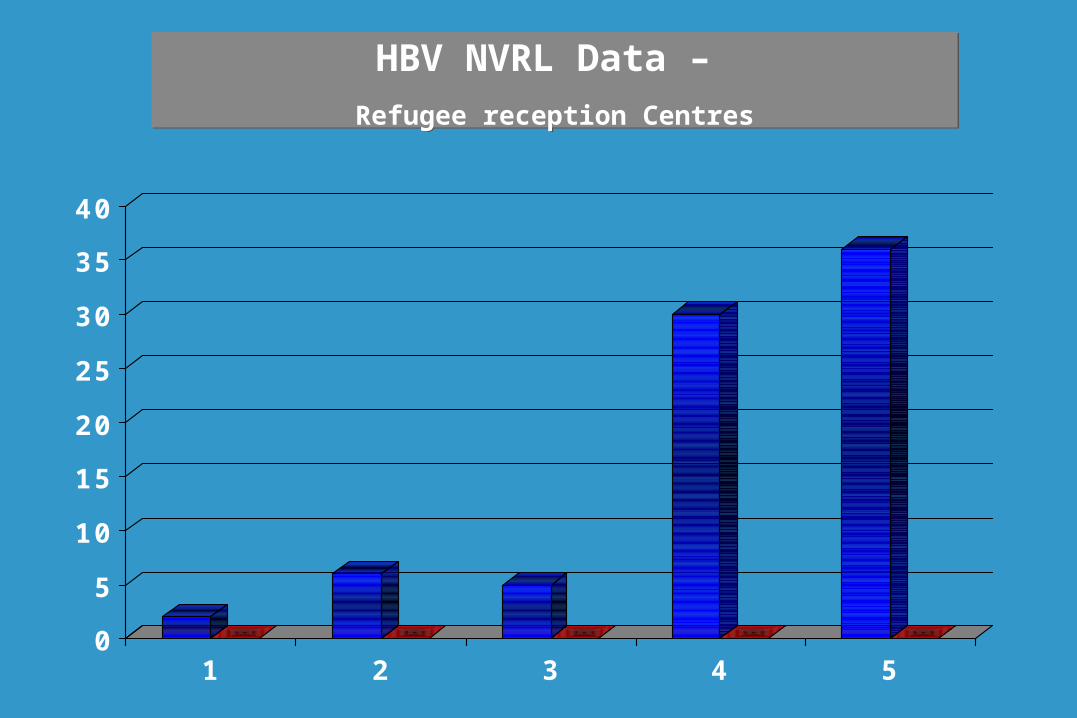
HBV NVRL Data – Refugee reception Centres
HBV NVRL Data – Refugee reception Centres
0
5
10
15
20
25
30
35
40
45
50
1 2 3 4 5
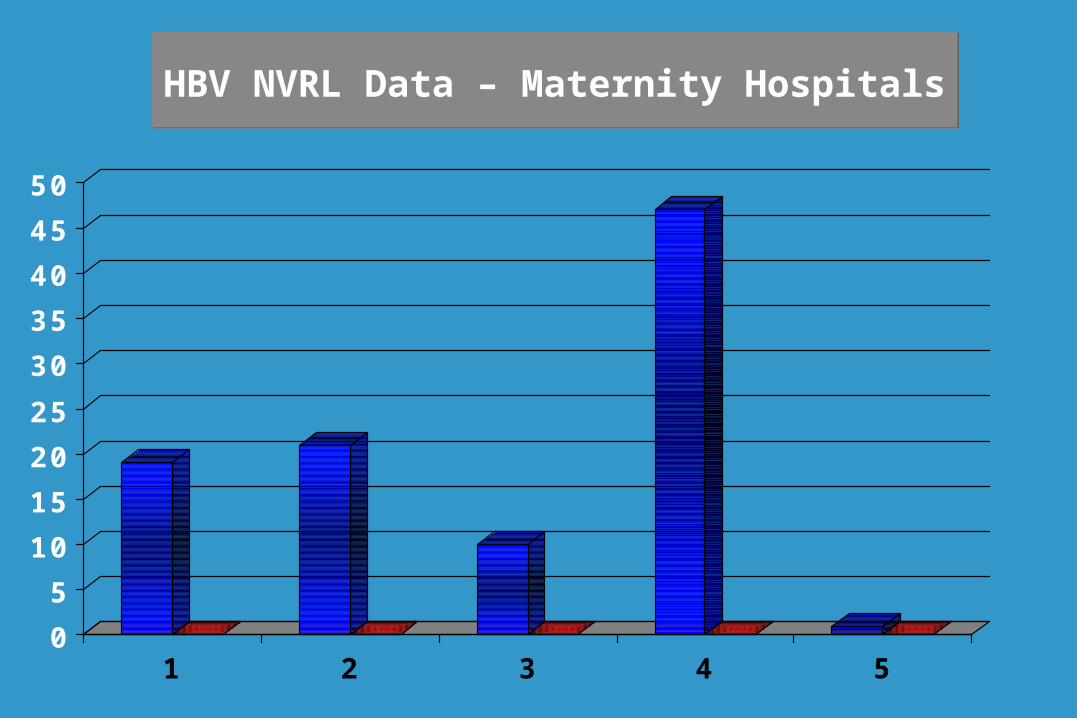
HBV NVRL Data – Maternity HospitalsHBV NVRL Data – Maternity Hospitals

0
5
10
15
20
25
30
35
40
45
50
1 2 3 4 5 6 7 8 9
HBV NVRL Data – HospitalsHBV NVRL Data – Hospitals

0
5
10
15
20
25
30
MSM ND Hepatitis/jaundice Fatigue Renal Failure
HBV NVRL DataAcute infection: n=44
HBV NVRL DataAcute infection: n=44

HBV National Data – HPSC HBV National Data – HPSC
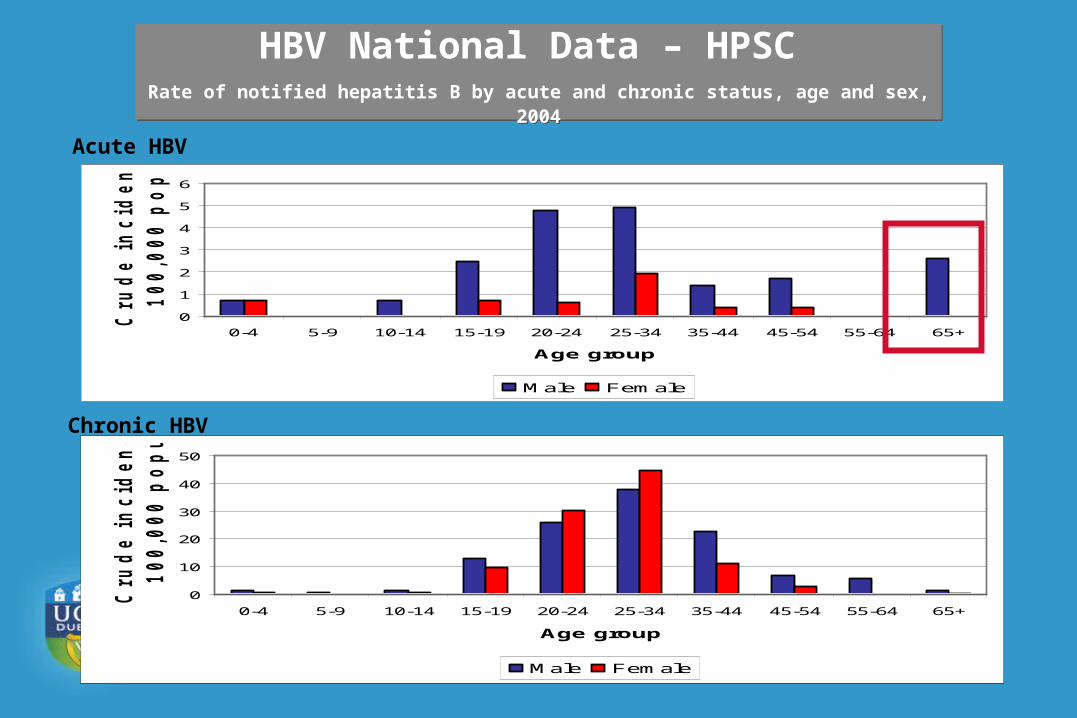
Acute HBV
Chronic HBV
0
1
2
3
4
5
6
0-4 5-9 10-14 15-19 20-24 25-34 35-44 45-54 55-64 65+
Age group
Cru
de in
cid
en
ce rate p
er
100,000 p
op
ulatio
n
Male Female
0
10
20
30
40
50
0-4 5-9 10-14 15-19 20-24 25-34 35-44 45-54 55-64 65+
Age group
Cru
de in
cid
en
ce rate p
er
100,000 p
op
ulatio
n
Male Female
HBV National Data – HPSC Rate of notified hepatitis B by acute and chronic status, age and sex, 2004
HBV National Data – HPSC Rate of notified hepatitis B by acute and chronic status, age and sex, 2004

020
4060
80100
120140
160180
Q1 Q2 Q3 Q4 Q1 Q2
2004 2005
Year and month
Nu
mb
er o
f n
oti
fica
tio
ns
of
hep
atit
is B Acute (8%)
Chronic (73%)
Unknown (19%)
HBV National Data – HPSC Number of cases of hepatitis B notified by status, 2004 & 2005 (end July)
HBV National Data – HPSC Number of cases of hepatitis B notified by status, 2004 & 2005 (end July)

*Enhanced form received but no known risk factor
Risk factorNumber of
casesRelative
frequency (%)
Men who have sex with men 20 20.4Possible sexual exposure 12 12.2Born in endemic country/Asylum seeker 4 4.1Infection acquired abroad 3 3.1Vertical transmission 2 2Tatooing/body piercing/acupuncture 2 2Surgery 2 2Intravenous drug user 2 2Household contact 2 2Dental work 2 2Percutaneous/mucocutaneous blood/body fluid exposure 1 1No risk data available 32 32.7No known risk factor* 14 14.3Total 98 100
Acute HBV National Data – HPSC Risk factors for acute cases of hepatitis B, 2004 & 2005 (end Aug)
Acute HBV National Data – HPSC Risk factors for acute cases of hepatitis B, 2004 & 2005 (end Aug)
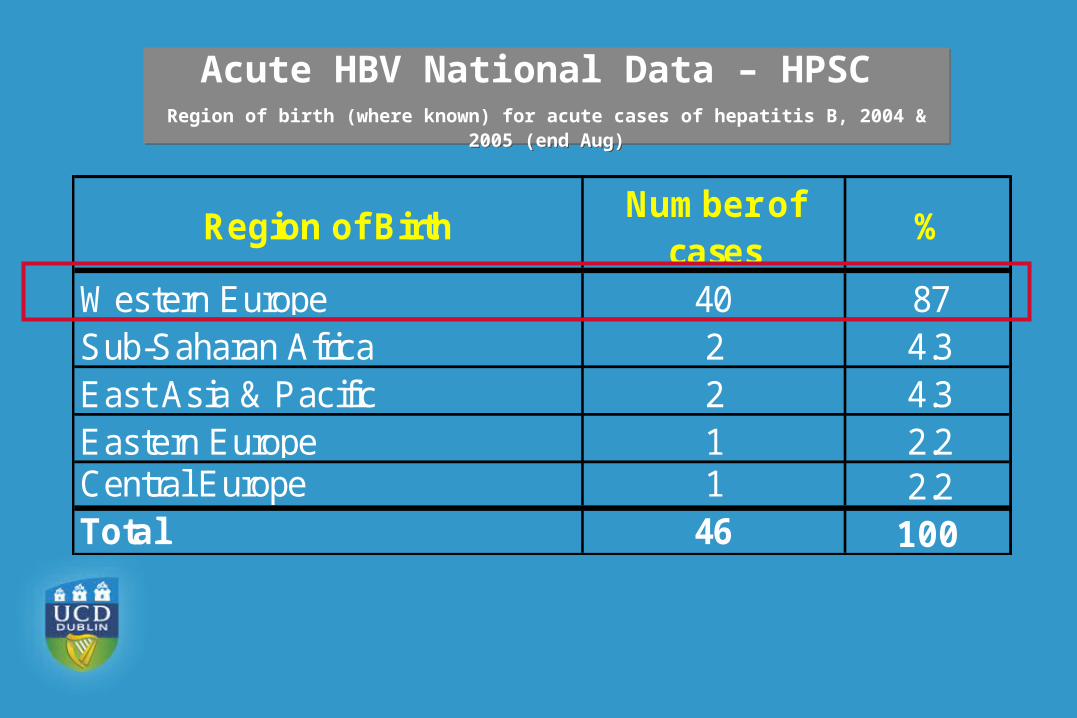
Region of BirthNumber of
cases%
Western Europe 40 87Sub-Saharan Africa 2 4.3East Asia & Pacific 2 4.3Eastern Europe 1 2.2Central Europe 1 2.2Total 46 100
Acute HBV National Data – HPSC Region of birth (where known) for acute cases of hepatitis B, 2004 & 2005 (end Aug)
Acute HBV National Data – HPSC Region of birth (where known) for acute cases of hepatitis B, 2004 & 2005 (end Aug)
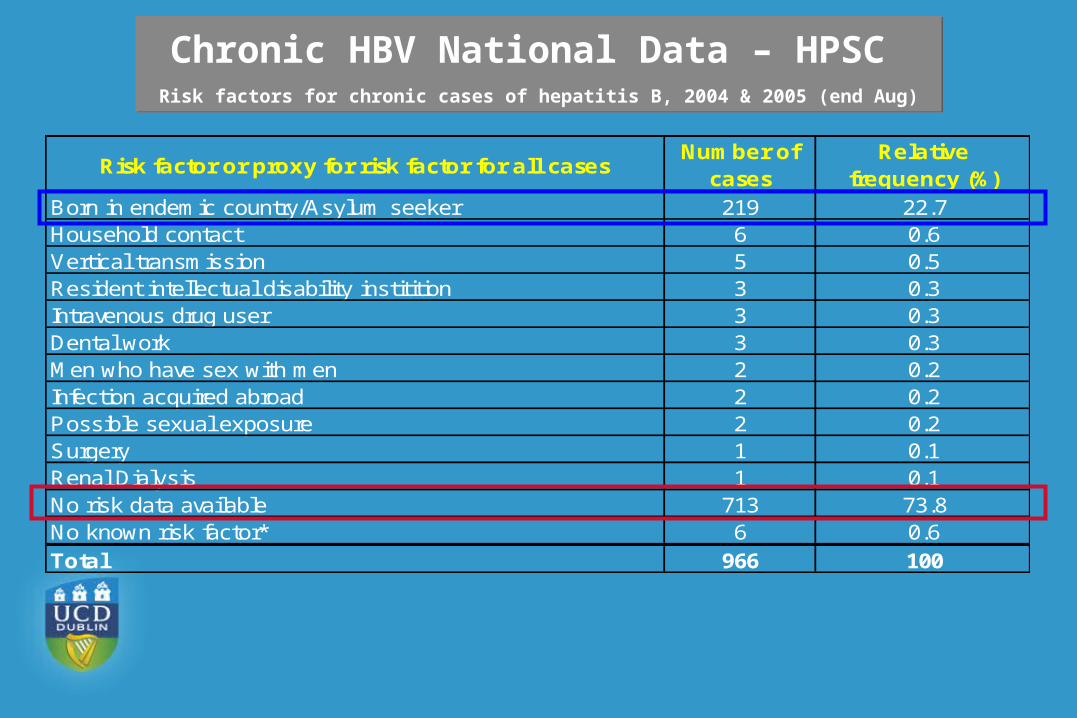
Risk factor or proxy for risk factor for all casesNumber of
casesRelative
frequency (%)Born in endemic country/Asylum seeker 219 22.7Household contact 6 0.6Vertical transmission 5 0.5Resident intellectual disability institition 3 0.3Intravenous drug user 3 0.3Dental work 3 0.3Men who have sex with men 2 0.2Infection acquired abroad 2 0.2Possible sexual exposure 2 0.2Surgery 1 0.1Renal Dialysis 1 0.1No risk data available 713 73.8No known risk factor* 6 0.6Total 966 100
Chronic HBV National Data – HPSC Risk factors for chronic cases of hepatitis B, 2004 & 2005 (end Aug)
Chronic HBV National Data – HPSC Risk factors for chronic cases of hepatitis B, 2004 & 2005 (end Aug)
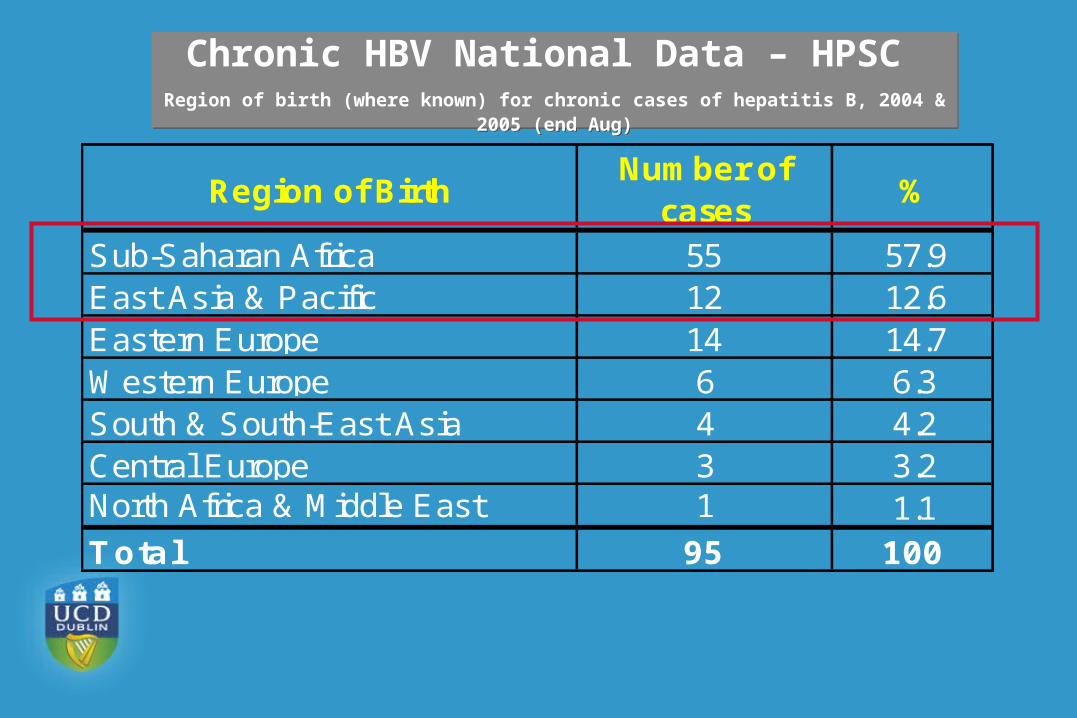
Region of BirthNumber of
cases%
Sub-Saharan Africa 55 57.9East Asia & Pacific 12 12.6Eastern Europe 14 14.7Western Europe 6 6.3South & South-East Asia 4 4.2Central Europe 3 3.2North Africa & Middle East 1 1.1Total 95 100
Chronic HBV National Data – HPSC Region of birth (where known) for chronic cases of hepatitis B, 2004 & 2005 (end Aug)
Chronic HBV National Data – HPSC Region of birth (where known) for chronic cases of hepatitis B, 2004 & 2005 (end Aug)
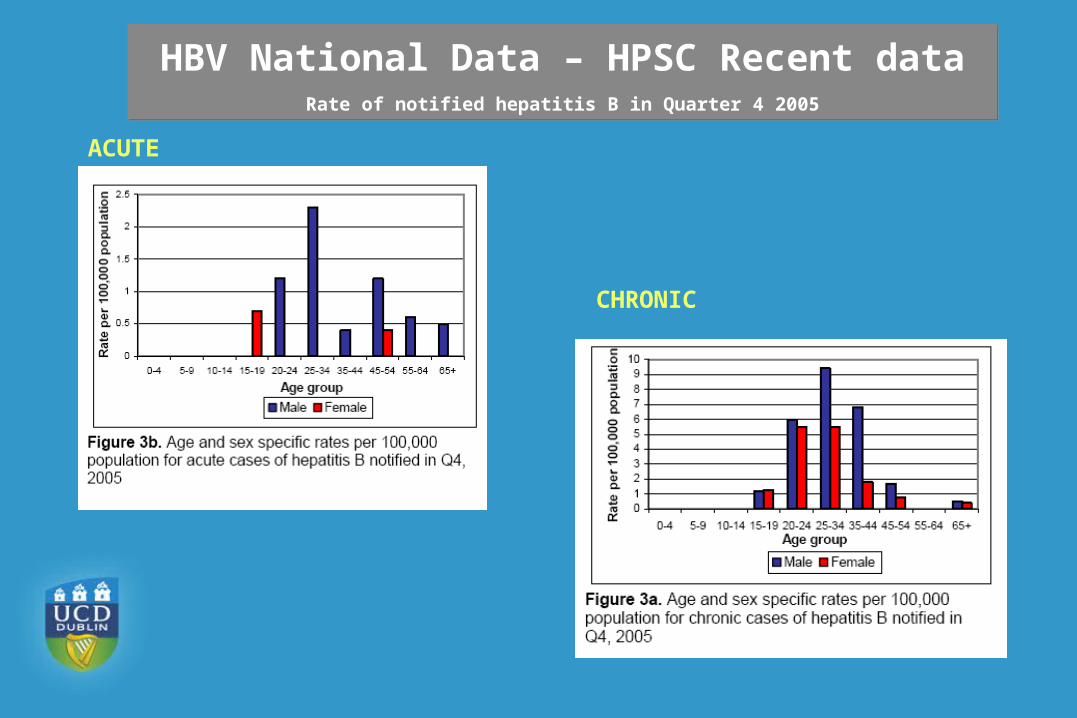
HBV National Data – HPSC Recent dataRate of notified hepatitis B in Quarter 4 2005
HBV National Data – HPSC Recent dataRate of notified hepatitis B in Quarter 4 2005
ACUTE
CHRONIC

Hepatitis CHepatitis C
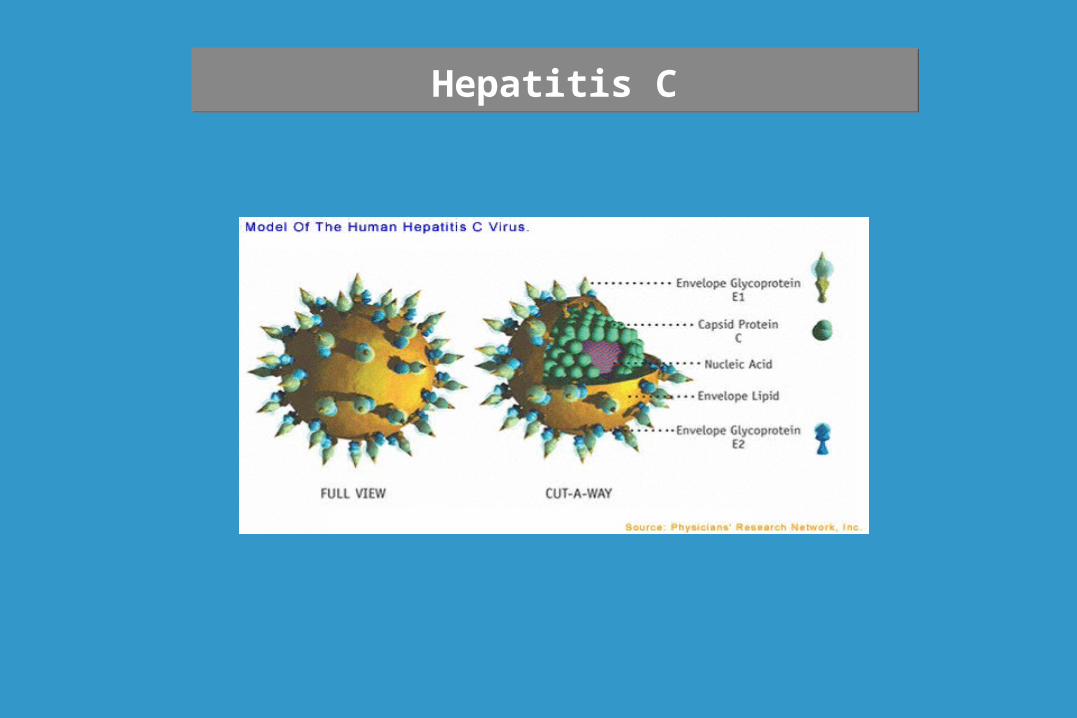
Hepatitis CHepatitis C

Persistent High viral load – reaches a stable baseline
Natural History of HCV infectionNatural History of HCV infection
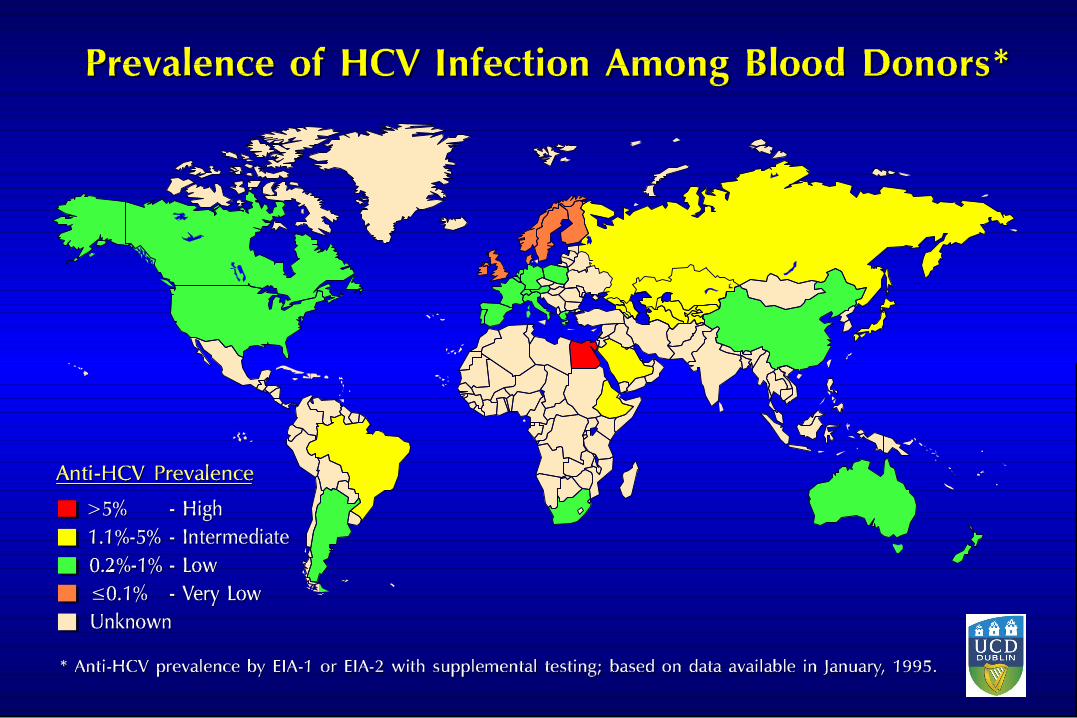
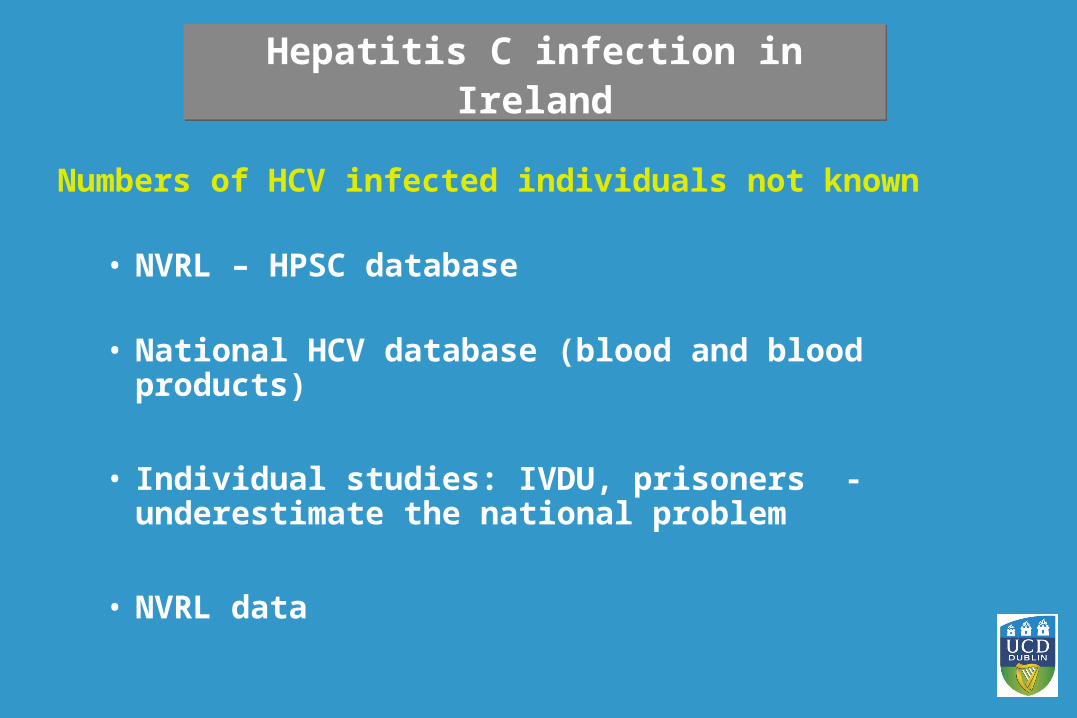
Hepatitis C infection in IrelandHepatitis C infection in Ireland
Numbers of HCV infected individuals not known
• NVRL – HPSC database • National HCV database (blood and blood products)
• Individual studies: IVDU, prisoners - underestimate the national problem
• NVRL data
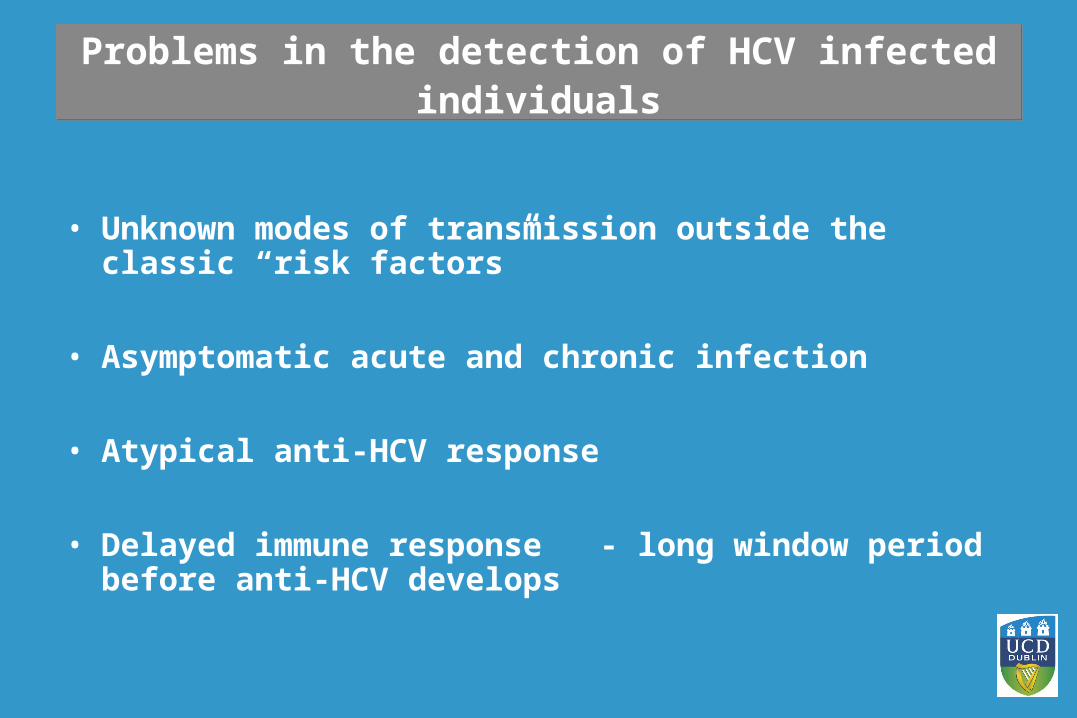
Problems in the detection of HCV infected individuals
Problems in the detection of HCV infected individuals
• Unknown modes of transmission outside the classic “risk factors”
• Asymptomatic acute and chronic infection
• Atypical anti-HCV response
• Delayed immune response - long window period before anti-HCV develops
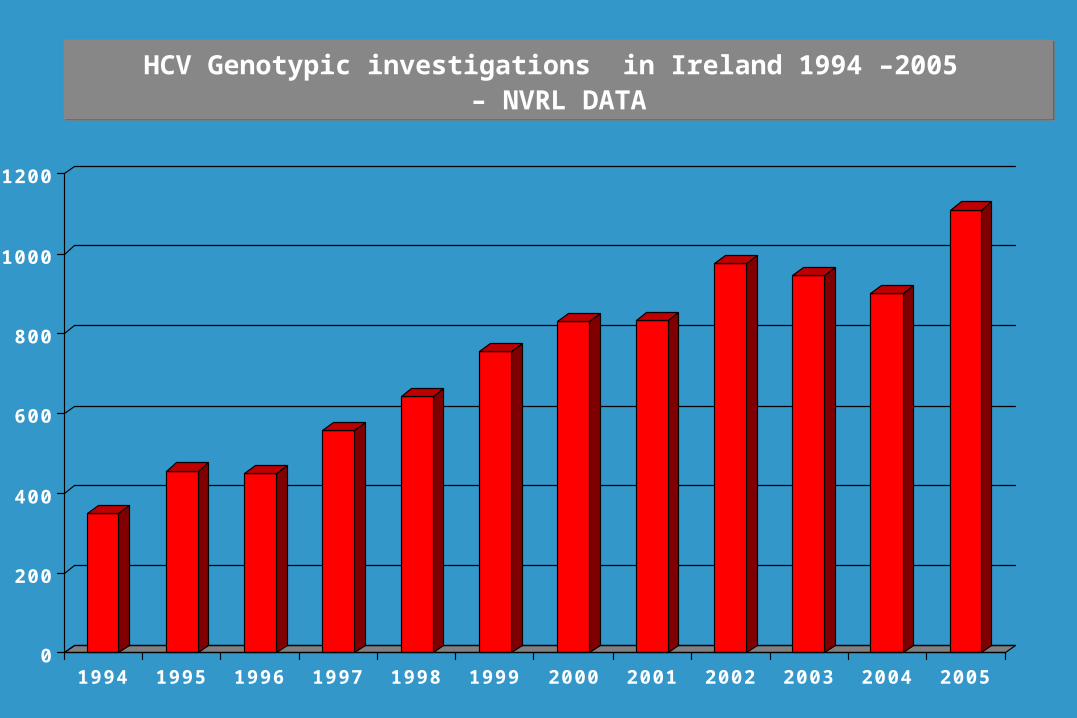
HCV Genotypic investigations in Ireland 1994 –2005 – NVRL DATA
HCV Genotypic investigations in Ireland 1994 –2005 – NVRL DATA
0
200
400
600
800
1000
1200
1994 1995 1996 1997 1998 1999 2000 2001 2002 2003 2004 2005
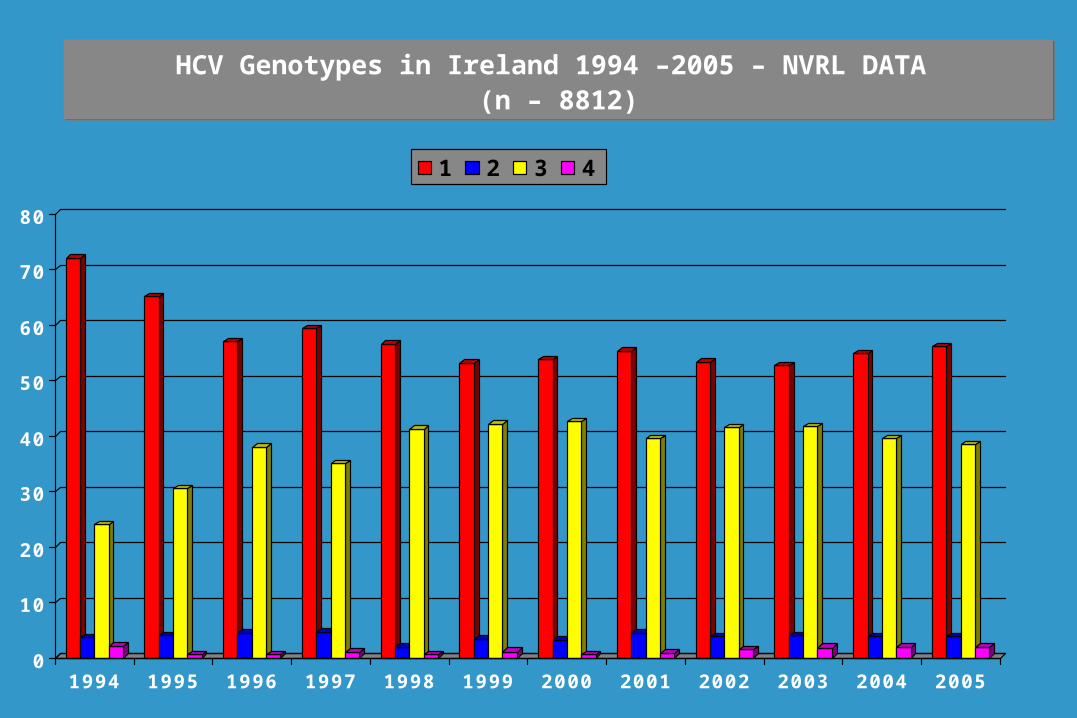
HCV Genotypes in Ireland 1994 –2005 – NVRL DATA (n – 8812)
HCV Genotypes in Ireland 1994 –2005 – NVRL DATA (n – 8812)
0
10
20
30
40
50
60
70
80
1994 1995 1996 1997 1998 1999 2000 2001 2002 2003 2004 2005
1 2 3 4

HCV National Data – HPSC HCV National Data – HPSC
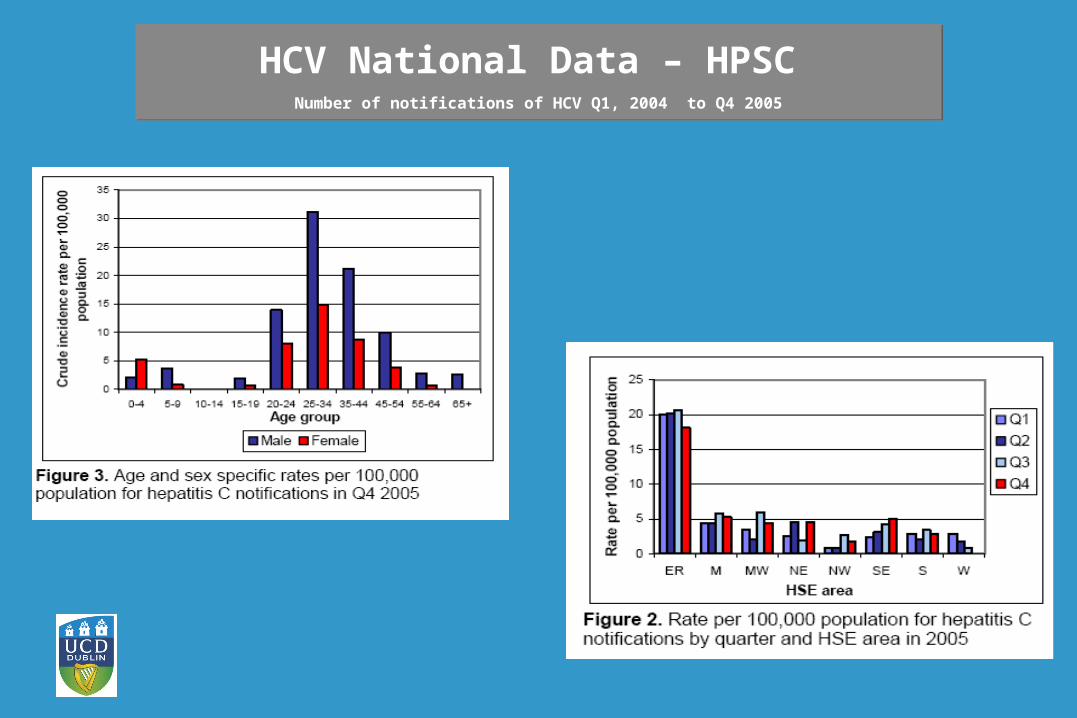
HCV National Data – HPSC Number of notifications of HCV Q1, 2004 to Q4 2005
HCV National Data – HPSC Number of notifications of HCV Q1, 2004 to Q4 2005
• Needle-stick injuries are a substantial problem
• Changing demographics in Ireland – increased level of HIV and HBV
• National data is improving
National Epidemiology Profile - National Epidemiology Profile - ConclusionsConclusions
National Epidemiology Profile - National Epidemiology Profile - ConclusionsConclusions

National Epidemiology ProfileNational Epidemiology ProfileNational Epidemiology ProfileNational Epidemiology Profile
Acknowledgments:
Dr. Lelia Thornton, HPSCLindsay Jones. IT, NVRLStaff at the NVRL
National Epidemiology ProfileNational Epidemiology ProfileNational Epidemiology ProfileNational Epidemiology Profile
Thanks for your attentionAny questions ?