Embed Size (px)
Citation preview

2009 Investor Seminar Delivering Transformational Growth
9 December 20091
Disclaimer & Important Notice
This presentation contains forward looking statements that are subject to risk factors associated with the oil and gas industry. It is believed that the expectations reflected in these statements are reasonable, but they may be affected by a range of variables which could cause actual results or trends to differ materially, including but not limited to: price fluctuations, actual demand, currency fluctuations, geotechnical factors, drilling and production results, gas commercialisation, development progress,operating results, engineering estimates, reserve estimates, loss of market, industry competition, environmental risks, physical risks, legislative, fiscal and regulatory developments, economic and financial markets conditions in various countries, approvals and cost estimates.
All references to dollars, cents or $ in this document are to Australian currency, unless otherwise stated.
2

Our View of Energy World Is Unchanged
Fundamentally
Unprecedented Asian economic growth driving energy demand
Rising CO2 emissions
Security of supply becoming increasingly important
To meet energy needs while reducing emissions…
Gas must have an increasing share of the fuel mix
Unconventional hydrocarbon supplies must complement conventional
Prices will reflect a new supply/demand equilibrium
3
World Primary Energy Consumption
0
100
200
300
400
500
600
700
800
1990
2005
2006
2010
2015
2020
2025
2030
Qua
drill
ions
BTU
World GDP*
0
20
40
60
80
100
120
140
160
1990
2005
2006
2010
2015
2020
2025
2030
US$
bn
($20
05)
World Population
0
1
2
3
4
5
6
7
8
9
10
1990
2005
2006
2010
2015
2020
2025
2030
Bill
ions
of
Peo
ple
Asia is the Engine of Energy Growth
Asia 47% of population growth 52% of GDP growth 62% of primary energy growth
Source: EIA International Energy Outlook 2009*World GDP by Region Expressed as Purchasing Power Parity
Asia
Rest of World
Asia
Rest of World
Asia
Rest of World
4
250
300
350
400
1200 1600 1800 2000
CO2
conc
entr
atio
n (p
pm)
1000
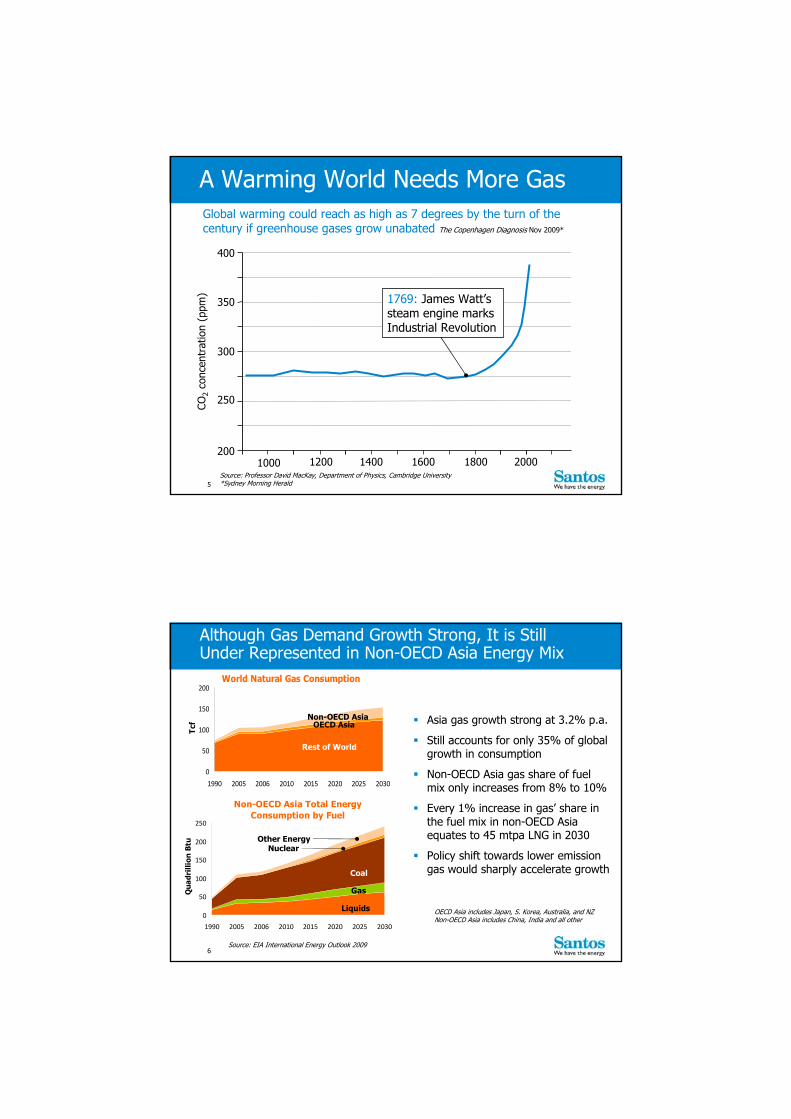
A Warming World Needs More Gas
1769: James Watt’s steam engine marks Industrial Revolution
Source: Professor David MacKay, Department of Physics, Cambridge University*Sydney Morning Herald
1400200
Global warming could reach as high as 7 degrees by the turn of the century if greenhouse gases grow unabated The Copenhagen Diagnosis Nov 2009*
5
Non-OECD Asia Total Energy Consumption by Fuel
0
50
100
150
200
250
1990 2005 2006 2010 2015 2020 2025 2030
Qua
drill
ion
Btu
World Natural Gas Consumption
0
50
100
150
200
1990 2005 2006 2010 2015 2020 2025 2030
Tcf
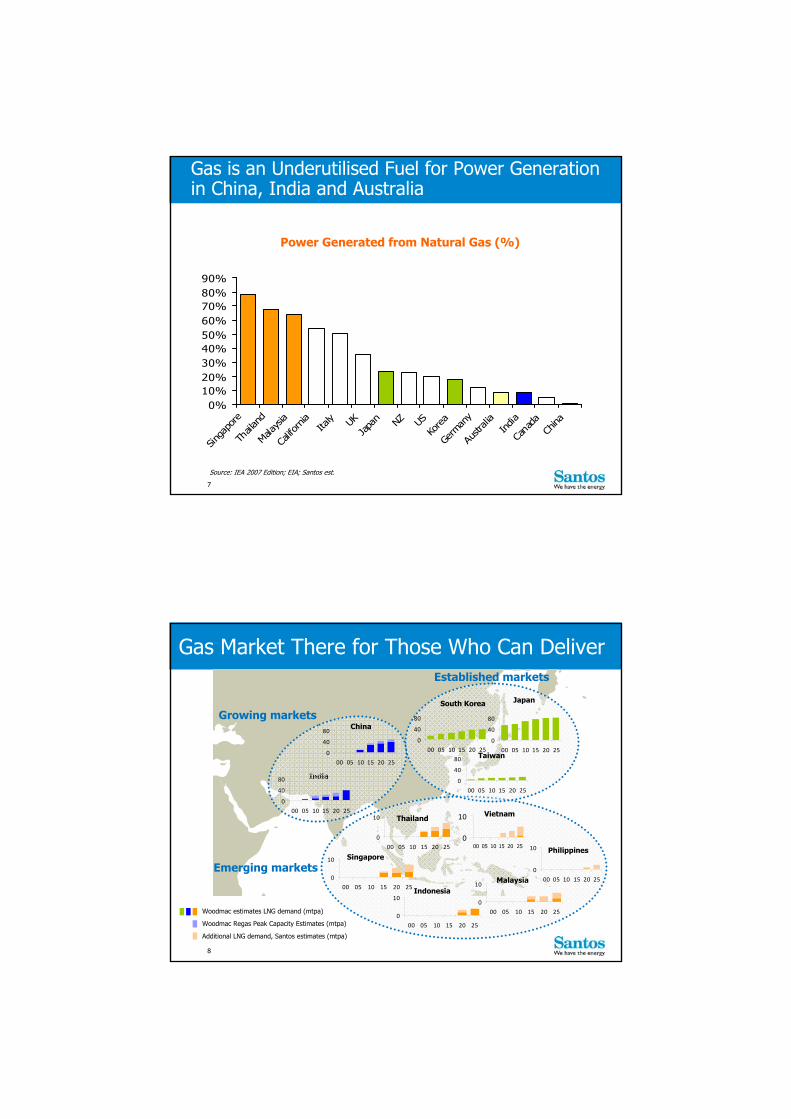
Although Gas Demand Growth Strong, It is Still Under Represented in Non-OECD Asia Energy Mix
Asia gas growth strong at 3.2% p.a.
Still accounts for only 35% of global growth in consumption
Non-OECD Asia gas share of fuel mix only increases from 8% to 10%
Every 1% increase in gas’ share in the fuel mix in non-OECD Asia equates to 45 mtpa LNG in 2030
Policy shift towards lower emission gas would sharply accelerate growth
Source: EIA International Energy Outlook 2009
Non-OECD Asia
Rest of World
OECD Asia
Liquids
Gas
Coal
NuclearOther Energy
OECD Asia includes Japan, S. Korea, Australia, and NZNon-OECD Asia includes China, India and all other
6
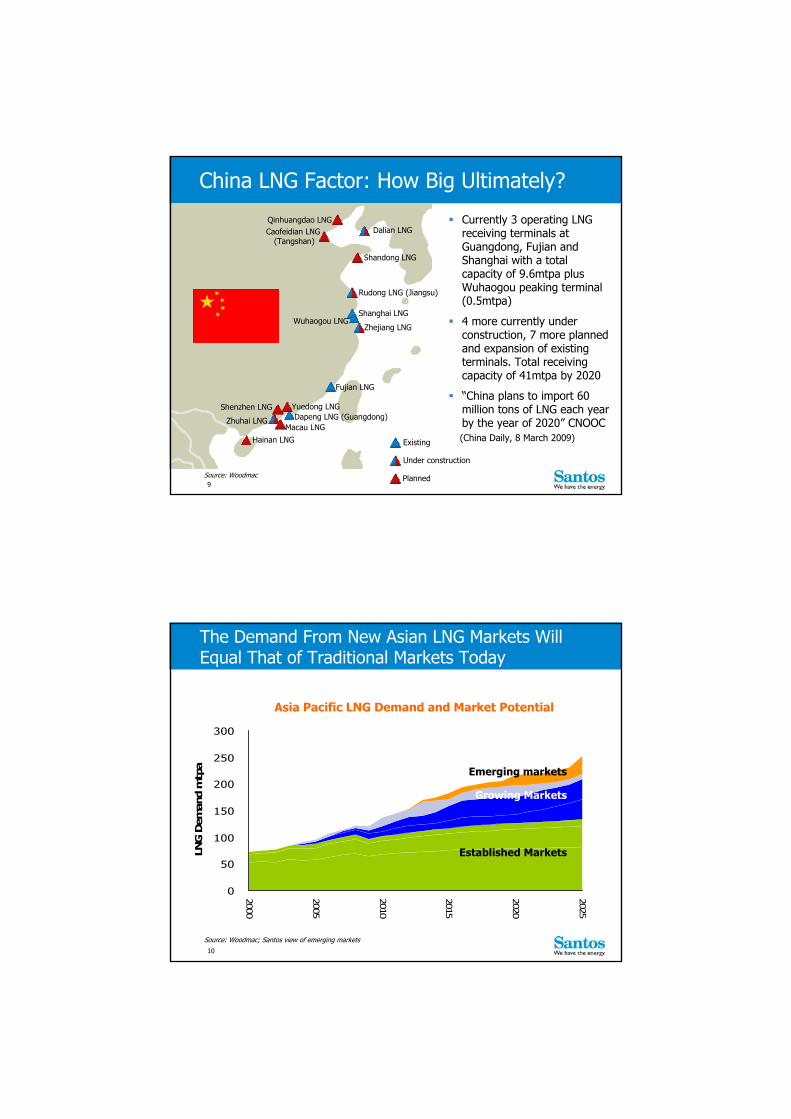
Gas is an Underutilised Fuel for Power Generation in China, India and Australia
Source: IEA 2007 Edition; EIA; Santos est.
0%10%20%30%40%50%60%70%80%90%
Singa
pore
Thailan
d
Malaysia
Califo
rnia
Italy UK
Japa
n NZ USKo
rea
Germ
any
Austr
alia
India
Cana
daCh
ina
Power Generated from Natural Gas (%)
7
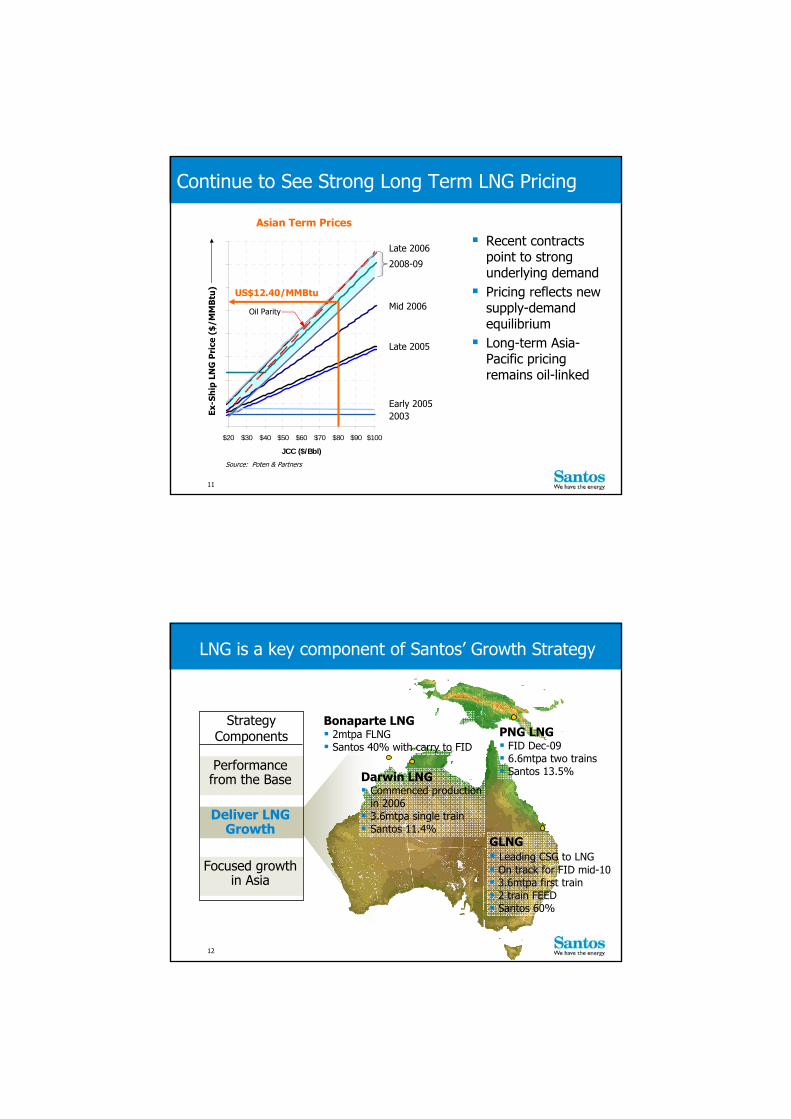
Gas Market There for Those Who Can Deliver
India
IndonesiaMalaysia
JapanSouth Korea
China
Singapore
Thailand
Taiwan
Established markets
Growing markets
Emerging markets
Vietnam
Woodmac estimates LNG demand (mtpa)
Additional LNG demand, Santos estimates (mtpa)
Philippines
0
40
80
00 05 10 15 20 25
0
40
80
00 05 10 15 20 25
0
40
80
00 05 10 15 20 25
0
10
00 05 10 15 20 25
0
10
00 05 10 15 20 25
0
10
00 05 10 15 20 25
0
10
00 05 10 15 20 25
0
10
00 05 10 15 20 25
Woodmac Regas Peak Capacity Estimates (mtpa)
0
40
80
00 05 10 15 20 25
0
40
80
00 05 10 15 20 25
0
10
8
00 05 10 15 20 25
Source: Woodmac
Currently 3 operating LNG receiving terminals at Guangdong, Fujian and Shanghai with a total capacity of 9.6mtpa plus Wuhaogou peaking terminal (0.5mtpa)
4 more currently under construction, 7 more planned and expansion of existing terminals. Total receiving capacity of 41mtpa by 2020
“China plans to import 60 million tons of LNG each year by the year of 2020” CNOOC(China Daily, 8 March 2009)
China LNG Factor: How Big Ultimately?
Zhuhai LNGMacau LNG
Shanghai LNG
Zhejiang LNG
Qinhuangdao LNG
Fujian LNG
Rudong LNG (Jiangsu)
Hainan LNG
Dapeng LNG (Guangdong)
Dalian LNGCaofeidian LNG(Tangshan)
Wuhaogou LNG
Shandong LNG
Shenzhen LNG Yuedong LNG
Existing
Under construction
Planned9
0
50
100
150
200
250
300
2000
2005
2010
2015
2020
2025LN
G D
eman
d m
tpa
Source: Woodmac; Santos view of emerging markets
Established Markets
Growing Markets
Emerging markets
The Demand From New Asian LNG Markets Will Equal That of Traditional Markets Today
Asia Pacific LNG Demand and Market Potential
10
$2
$4
$6
$8
$10
$12
$14
$16
$18
$20 $30 $40 $50 $60 $70 $80 $90 $100
JCC ($/Bbl)
Ex-s
hip
LN
G P
rice
($/M
MB
tu
Source: Poten & Partners
Mid 2006
Late 2005
Late 2006
Early 20052003
2008-09
Ex-S
hip
LN
G P
rice
($
/MM
Btu
)Asian Term Prices
Oil Parity
Recent contracts point to strong underlying demand
Pricing reflects new supply-demand equilibrium
Long-term Asia-Pacific pricing remains oil-linked
Continue to See Strong Long Term LNG Pricing
US$12.40/MMBtu
11
LNG is a key component of Santos’ Growth Strategy
Strategy Components
Darwin LNG Commenced production
in 2006 3.6mtpa single train Santos 11.4%
GLNG Leading CSG to LNG On track for FID mid-10 3.6mtpa first train 2 train FEED Santos 60%
PNG LNG FID Dec-09 6.6mtpa two trains Santos 13.5%
Bonaparte LNG 2mtpa FLNG Santos 40% with carry to FID
Performance from the Base
Deliver LNG Growth
Focused growth in Asia
12
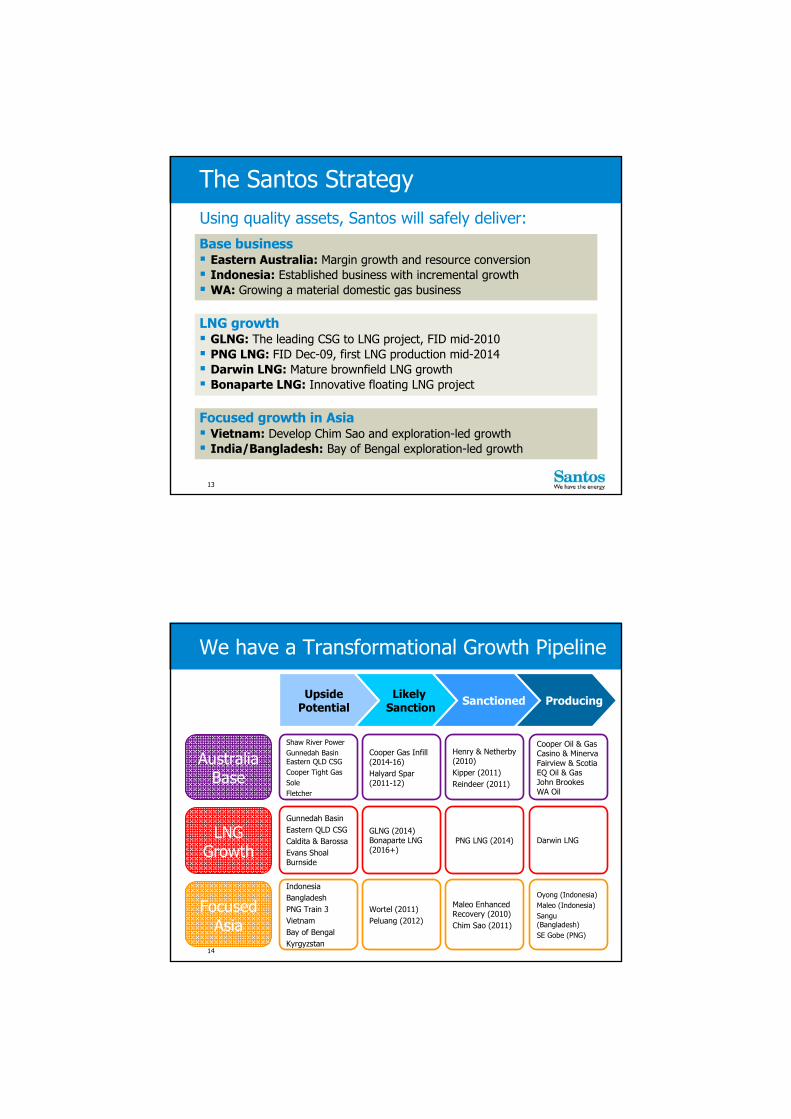
The Santos Strategy
Base business Eastern Australia: Margin growth and resource conversion Indonesia: Established business with incremental growth WA: Growing a material domestic gas business
LNG growth GLNG: The leading CSG to LNG project, FID mid-2010 PNG LNG: FID Dec-09, first LNG production mid-2014 Darwin LNG: Mature brownfield LNG growth Bonaparte LNG: Innovative floating LNG project
Focused growth in Asia Vietnam: Develop Chim Sao and exploration-led growth India/Bangladesh: Bay of Bengal exploration-led growth
Using quality assets, Santos will safely deliver:
13
UpsidePotential
LikelySanction Sanctioned Producing
We have a Transformational Growth Pipeline
Shaw River PowerGunnedah BasinEastern QLD CSGCooper Tight GasSoleFletcher
Cooper Gas Infill (2014-16)Halyard Spar (2011-12)
Henry & Netherby (2010)Kipper (2011)Reindeer (2011)
Cooper Oil & GasCasino & MinervaFairview & ScotiaEQ Oil & GasJohn BrookesWA Oil
Gunnedah BasinEastern QLD CSGCaldita & BarossaEvans ShoalBurnside
GLNG (2014)Bonaparte LNG (2016+)
Darwin LNG
IndonesiaBangladeshPNG Train 3VietnamBay of BengalKyrgyzstan
Wortel (2011)Peluang (2012)
Maleo Enhanced Recovery (2010)Chim Sao (2011)
Oyong (Indonesia)Maleo (Indonesia)Sangu(Bangladesh)SE Gobe (PNG)
AustraliaBase
LNG Growth
FocusedAsia
PNG LNG (2014)
14
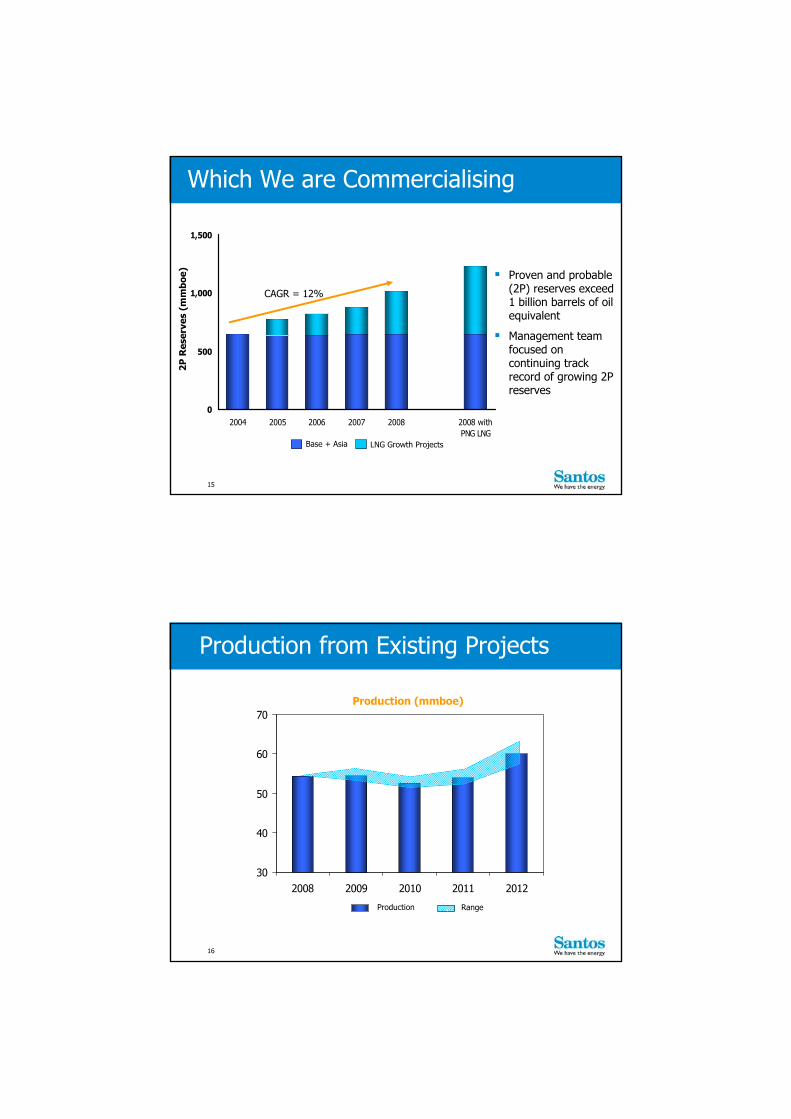
0
500
1,000
1,500
2004 2005 2006 2007 2008 2008 withPNG LNG
2P R
eser
ves
(mm
boe)
Which We are Commercialising
Proven and probable (2P) reserves exceed 1 billion barrels of oil equivalent
Management team focused on continuing track record of growing 2P reserves
CAGR = 12%
LNG Growth ProjectsBase + Asia
15
Production from Existing Projects
30
40
50
60
70
2008 2009 2010 2011 2012
Production (mmboe)
Production Range
16

Twin Themes Of Strategy
Twin themes for shareholder value creation
Building a better base business Delivering transformational growth
17
Delivering Without Compromising Safety
40% reduction in TRCFR during 2009Santos TRCFR performance
(Employees & Contractors)
0
2
4
6
8
10
2002 2003 2004 2005 2006 2007 2008 YTD 2009
Year
TRCF
R
3.5
18

Strategy, Finance, Public Affairs &
Investor Relations
Peter Wasow
Legal, Corporate Development &
Commercial
James Baulderstone
Human Resources
Petrina Coventry
Corporate Centre
Asia Pacific
Martyn Eames
Eastern Australia
Mark Macfarlane
GLNG & Queensland
Rick Wilkinson
WA & NT
John Anderson
Business UnitsDisciplines
Technical
Ray Betros
Exploration
Trevor Brown
The Delivery Model
19
Agenda
Strategy David Knox
Eastern Australia Mark Macfarlane
WA & NT John Anderson
Asia Pacific Martyn Eames
GLNG Rick Wilkinson
Technical Ray Betros
Exploration Trevor Brown
Outlook & Funding Peter Wasow
Wrap Up David Knox
20

Eastern Australia Business UnitMark Macfarlane
Vice President, Eastern Australia21
Eastern Australia – The Next 40 YearsToday’s pioneers capitalising on gas demand growth for the next 40 years
Opening up market channels
Reserves growth and extension
Cost and reliability improvement
22
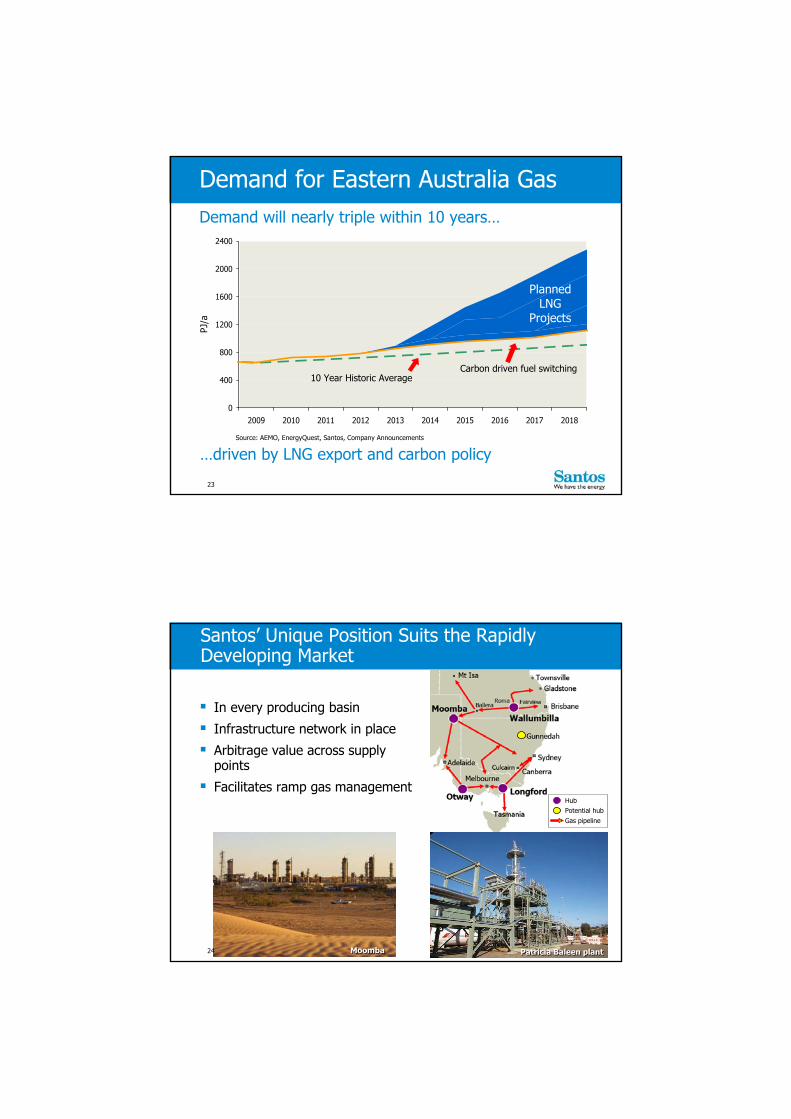
0
400
800
1200
1600
2000
2400
2009 2010 2011 2012 2013 2014 2015 2016 2017 2018
PJ/a
Demand for Eastern Australia Gas
10 Year Historic Average
Demand will nearly triple within 10 years…
…driven by LNG export and carbon policySource: AEMO, EnergyQuest, Santos, Company Announcements
PlannedLNG
Projects
Carbon driven fuel switching
23
In every producing basin
Infrastructure network in place
Arbitrage value across supply points
Facilitates ramp gas management
Santos’ Unique Position Suits the Rapidly Developing Market
Patricia Baleen plantPatricia Baleen plantMoombaMoomba
HubPotential hubGas pipeline
24
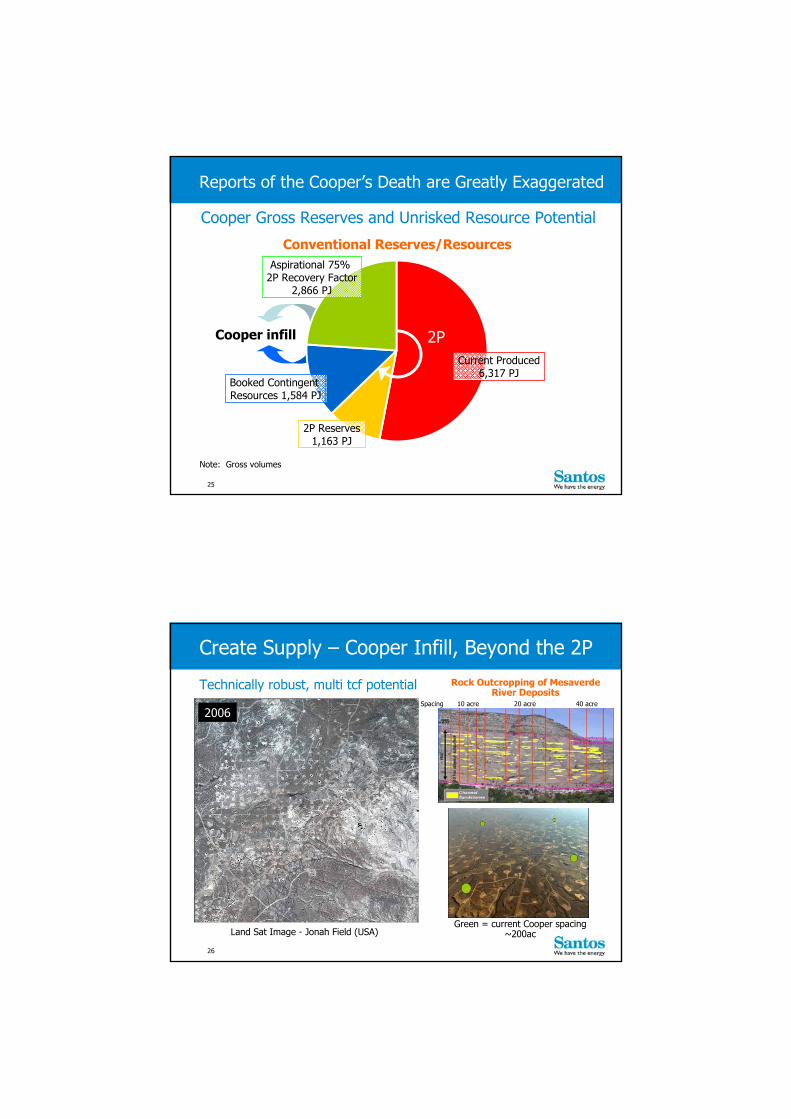
Reports of the Cooper’s Death are Greatly Exaggerated
Cooper Gross Reserves and Unrisked Resource Potential
Current Produced6,317 PJ
2P Reserves1,163 PJ
Aspirational 75% 2P Recovery Factor
2,866 PJ
2P
Note: Gross volumes
Booked Contingent Resources 1,584 PJ
Conventional Reserves/Resources
Cooper infill
25
198619992006
Land Sat Image - Jonah Field (USA)
Create Supply – Cooper Infill, Beyond the 2P
Technically robust, multi tcf potential Rock Outcropping of MesaverdeRiver Deposits
10 acre 20 acre 40 acreSpacing
Green = current Cooper spacing ~200ac
26

Gross Unrisked Resource Potential
Note: Gross volumes
Unconventional Resource Potential: 39,000+ PJ
Booked Contingent Resources 4,750 PJ
Moomba
TOOL DARA
ROSE EPSI MTRE
PATC
GRANITE
Shale Gas
Tight Gas
Deep Coal
Developed Conventional
Undeveloped Unconventional
Gross gas thickness ~1600 feet
UnconventionalResources
Reports of the Cooper’s Death are Greatly Exaggerated
27
Reserves Growth OpportunityWorld scale operation, significant strategic asset
Cooper Basin 40 yr Production history and growth
0
250
500
750
1,000
1,250
1969
1972
1975
1978
1981
1984
1987
1990
1993
1996
1999
2002
2005
2008
2011
2014
2017
2020
2023
2026
2029
2032
2035
2038
Gas
Pro
duct
ion
Rate
(TJ
/d)
Base production Infill & Unconventional
6,317 PJ6,317 PJ
28
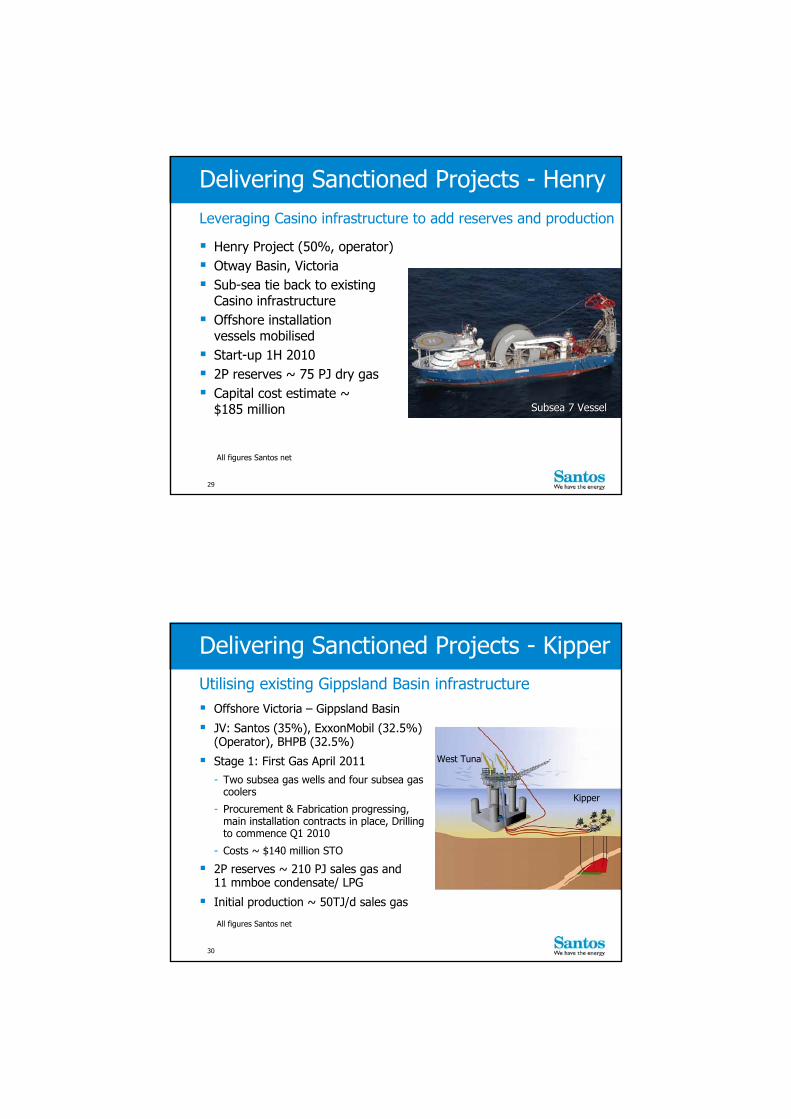
Delivering Sanctioned Projects - Henry
Henry Project (50%, operator) Otway Basin, Victoria Sub-sea tie back to existing
Casino infrastructure Offshore installation
vessels mobilised Start-up 1H 2010 2P reserves ~ 75 PJ dry gas Capital cost estimate ~
$185 million
Leveraging Casino infrastructure to add reserves and production
Subsea 7 VesselSubsea 7 Vessel
All figures Santos net
29
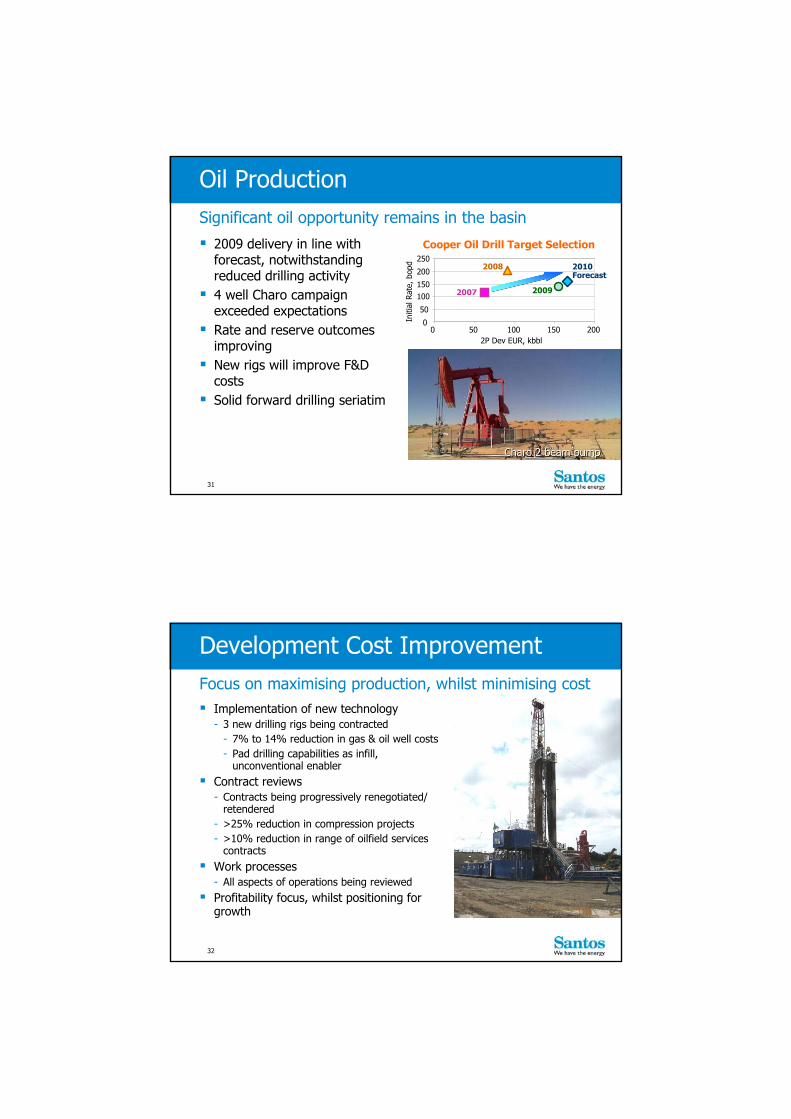
Delivering Sanctioned Projects - Kipper
Offshore Victoria – Gippsland Basin
JV: Santos (35%), ExxonMobil (32.5%) (Operator), BHPB (32.5%)
Stage 1: First Gas April 2011- Two subsea gas wells and four subsea gas
coolers
- Procurement & Fabrication progressing, main installation contracts in place, Drilling to commence Q1 2010
- Costs ~ $140 million STO
2P reserves ~ 210 PJ sales gas and 11 mmboe condensate/ LPG
Initial production ~ 50TJ/d sales gas
Utilising existing Gippsland Basin infrastructure
West Tuna
Kipper
All figures Santos net
30
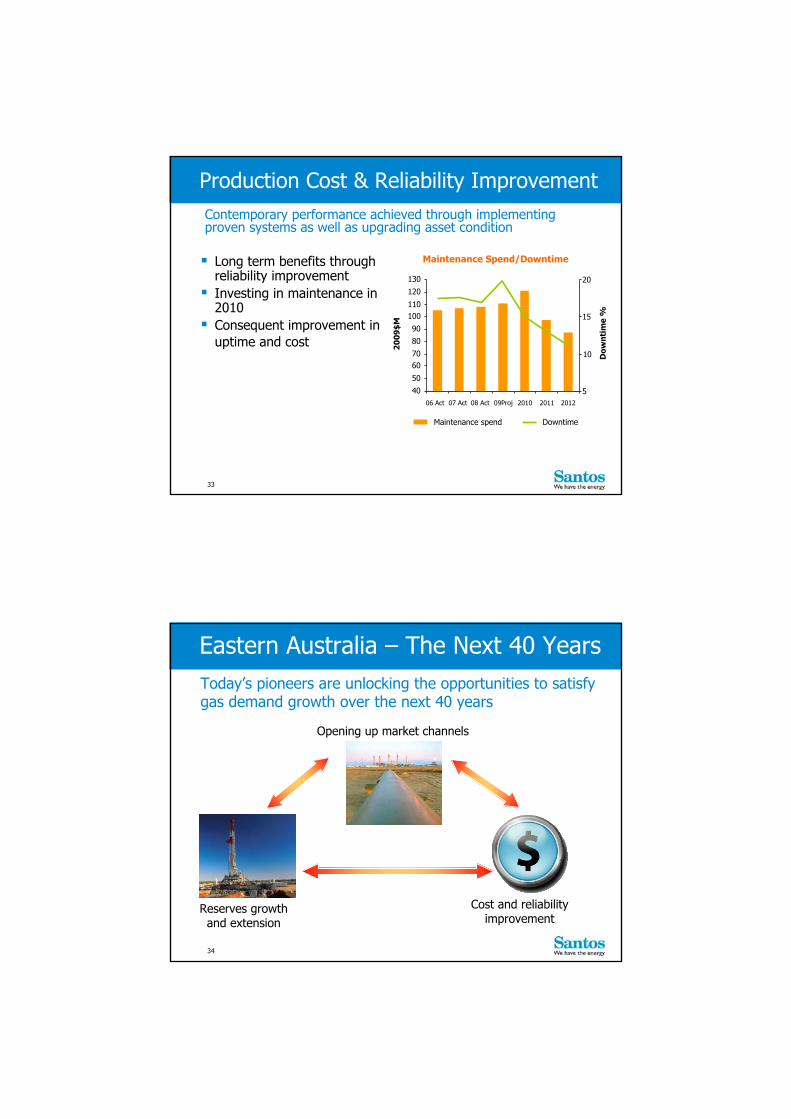
Oil Production
2009 delivery in line with forecast, notwithstanding reduced drilling activity
4 well Charo campaign exceeded expectations
Rate and reserve outcomes improving
New rigs will improve F&D costs
Solid forward drilling seriatim
Charo 2 beam pumpCharo 2 beam pump
Significant oil opportunity remains in the basin
0
50
100150
200
250
0 50 100 150 2002P Dev EUR, kbbl
Initi
al R
ate,
bop
d 2010Forecast
2009
2008
2007
Cooper Oil Drill Target Selection
31
Development Cost Improvement
Implementation of new technology- 3 new drilling rigs being contracted
- 7% to 14% reduction in gas & oil well costs- Pad drilling capabilities as infill,
unconventional enabler Contract reviews
- Contracts being progressively renegotiated/ retendered
- >25% reduction in compression projects- >10% reduction in range of oilfield services
contracts Work processes
- All aspects of operations being reviewed Profitability focus, whilst positioning for
growth
Focus on maximising production, whilst minimising cost
32
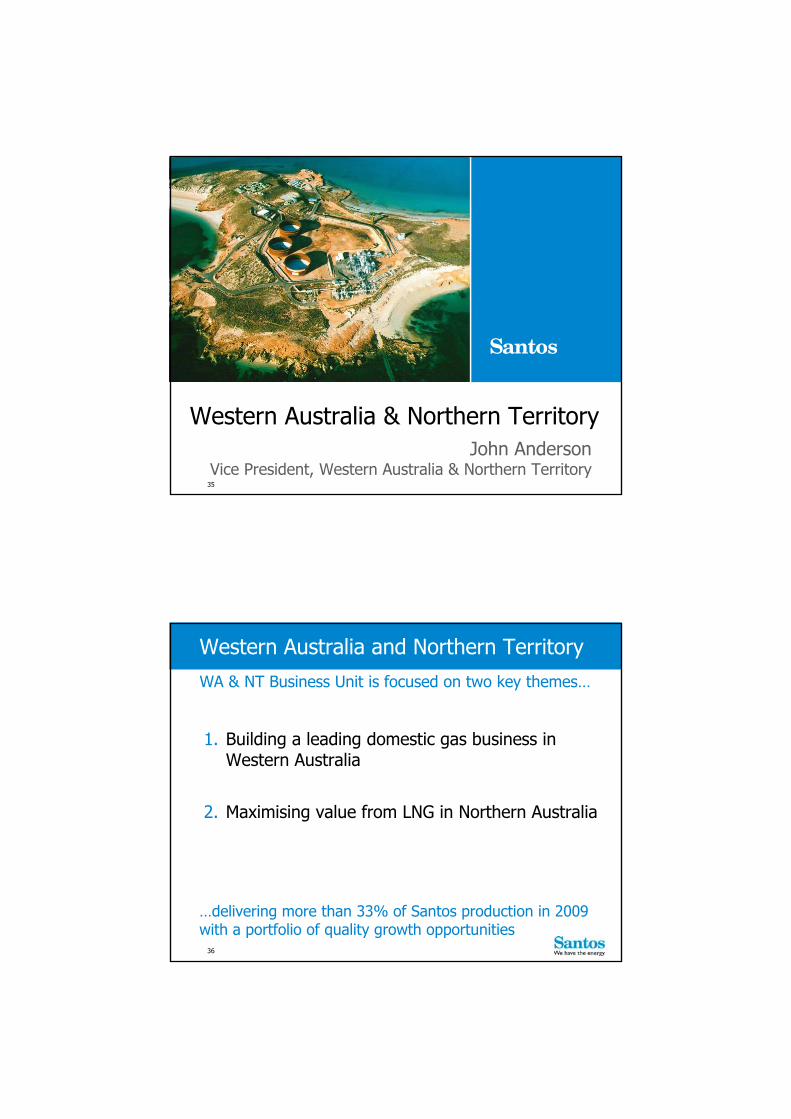
Production Cost & Reliability Improvement
Long term benefits through reliability improvement Investing in maintenance in
2010 Consequent improvement in
uptime and cost
Contemporary performance achieved through implementing proven systems as well as upgrading asset condition
Maintenance Spend/Downtime
40
50
6070
80
90
100110
120
130
06 Act 07 Act 08 Act 09Proj 2010 2011 20122
009
$M
5
10
15
20
Dow
ntim
e %
Maintenance spend Downtime
33
Eastern Australia – The Next 40 YearsToday’s pioneers are unlocking the opportunities to satisfy gas demand growth over the next 40 years
Opening up market channels
Reserves growth and extension
Cost and reliability improvement
34
Western Australia & Northern TerritoryJohn Anderson
Vice President, Western Australia & Northern Territory 35
Western Australia and Northern TerritoryWA & NT Business Unit is focused on two key themes…
…delivering more than 33% of Santos production in 2009with a portfolio of quality growth opportunities
1. Building a leading domestic gas business in Western Australia
2. Maximising value from LNG in Northern Australia
36
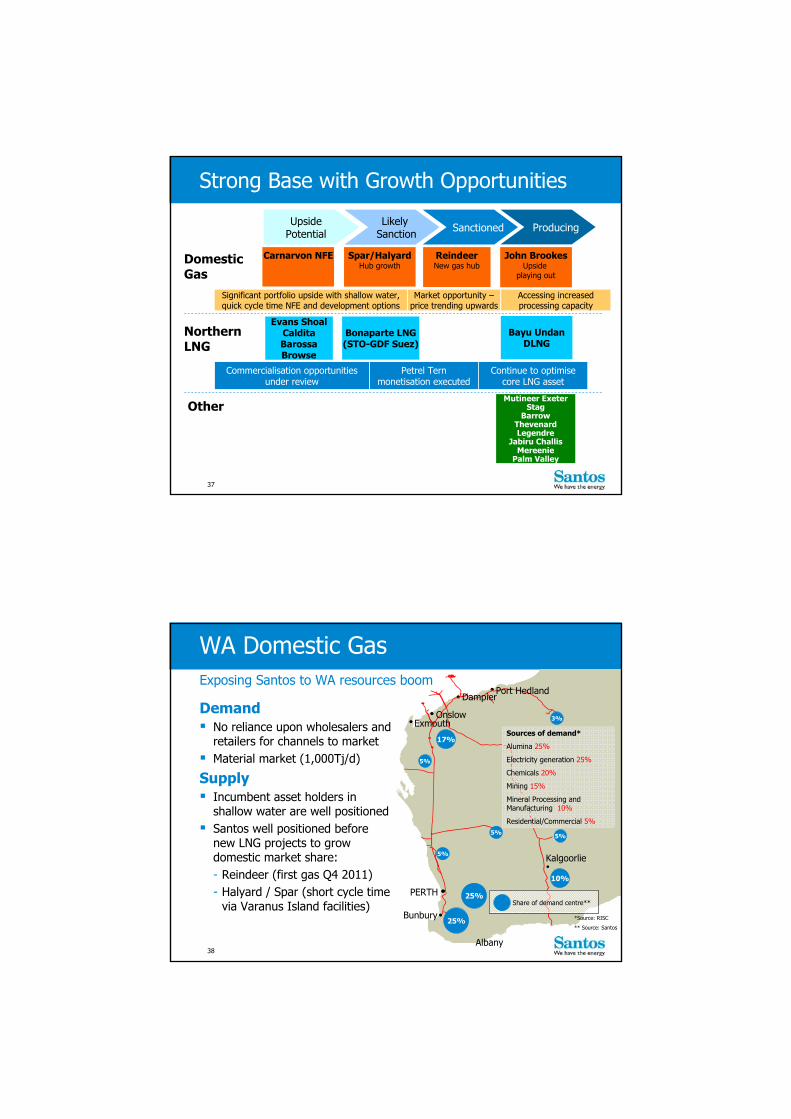
John BrookesUpside
playing out
Spar/HalyardHub growth
Evans ShoalCalditaBarossaBrowse
ReindeerNew gas hub
UpsidePotential
LikelySanction Sanctioned Producing
Mutineer ExeterStag
BarrowThevenardLegendre
Jabiru ChallisMereenie
Palm Valley
Bayu UndanDLNG
Bonaparte LNG(STO-GDF Suez)
Domestic Gas
NorthernLNG
Other
Carnarvon NFE
Accessing increased processing capacity
Market opportunity –price trending upwards
Significant portfolio upside with shallow water, quick cycle time NFE and development options
Petrel Tern monetisation executed
Commercialisation opportunities under review
Continue to optimise core LNG asset
Strong Base with Growth Opportunities
37
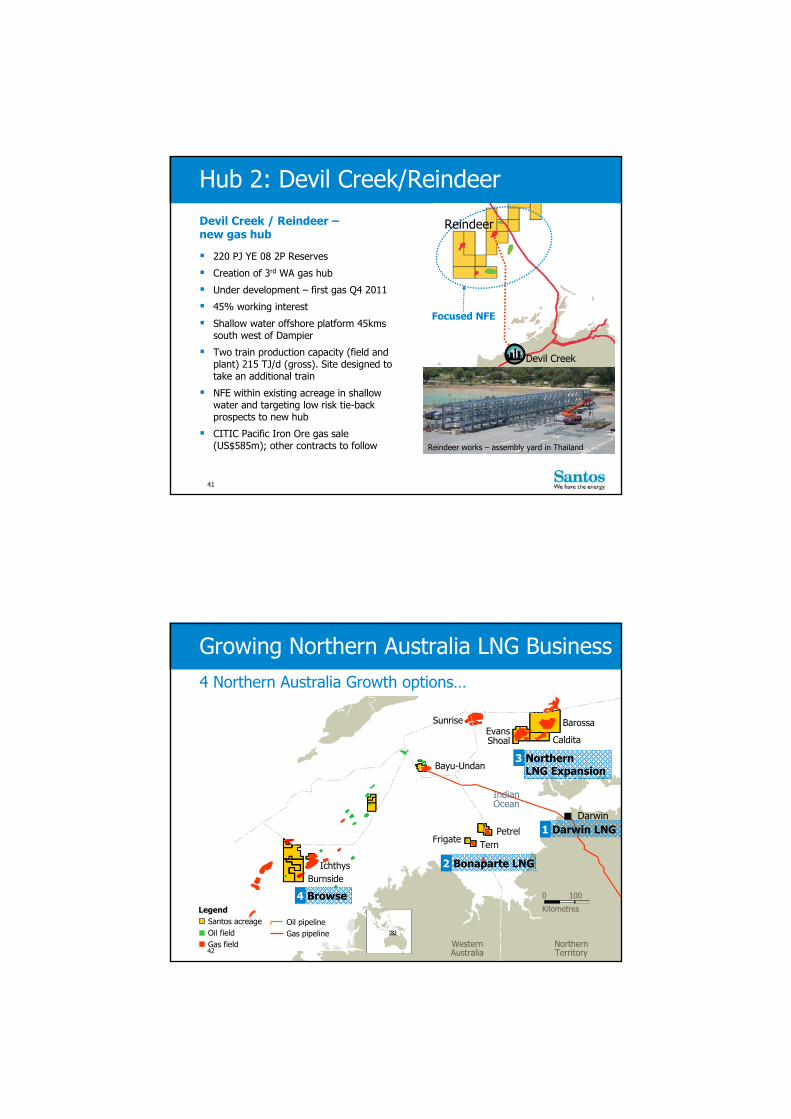
WA Domestic Gas
Demand No reliance upon wholesalers and
retailers for channels to market Material market (1,000Tj/d)
Supply Incumbent asset holders in
shallow water are well positioned Santos well positioned before
new LNG projects to grow domestic market share: - Reindeer (first gas Q4 2011) - Halyard / Spar (short cycle time
via Varanus Island facilities)
17%
10%
5%5%
5%
3%
5%
25%
25%
Exmouth
PERTH
Bunbury
Kalgoorlie
Onslow
DampierPort Hedland
Albany
Share of demand centre**
Exposing Santos to WA resources boom
Sources of demand*
Alumina 25%
Electricity generation 25%
Chemicals 20%
Mining 15%
Mineral Processing and Manufacturing 10%
Residential/Commercial 5%
*Source: RISC
** Source: Santos
38

Santos supplies gas via one of two existing hubs and one new hubunder construction…
Hub-led Strategy
LegendSantos acreageOil fieldGas field
Gas pipelineGas hub
East Spar
Varanus Is.
John Brookes
Devil Creek
Focused NFE
…with focused NFE in shallow water close to existing hubs targeting low risk/quick cycle gas tie-back prospects
Reindeer
Spar / Halyard
2010 NFE well39
East Spar
John Brookes
Focused NFE
Spar / Halyard
590 PJ YE 08 2P Reserves 560 PJ YE 08 2C Resource John Brookes
- Producing asset - 45% working interest- New gas sales at higher prices- Field capacity +300TJ/d (gross); East Spar
plant capacity ~230TJ/d (gross)- Opportunities to maximise production via
spare processing capacity in Harriet Joint Venture and sales to Harriet parties
Spar / Halyard- Apache progressing Halyard development- Spar development under review
NFE Opportunities- Existing acreage with shallow water and
access to existing gas hub- Spar Deep and East Spar East NFE wells
planned in 2010
Hub 1: Varanus Island
Varanus Is.
40
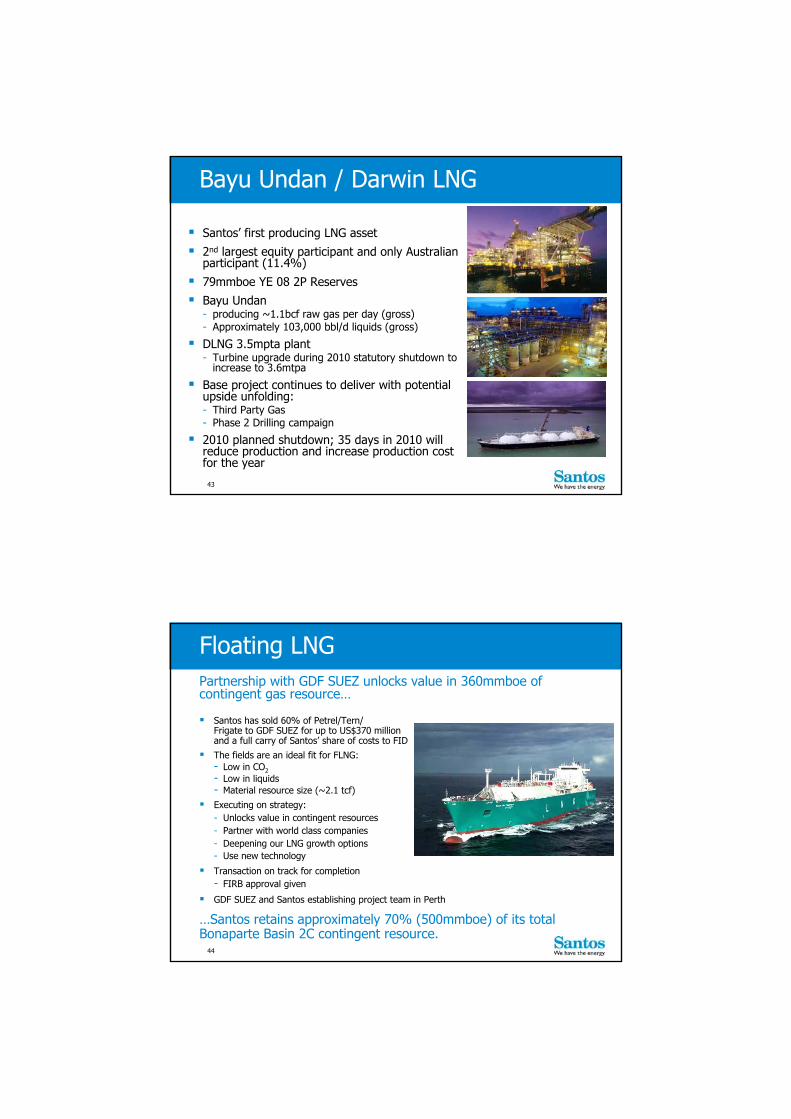
Devil Creek
ReindeerDevil Creek / Reindeer –new gas hub
220 PJ YE 08 2P Reserves
Creation of 3rd WA gas hub
Under development – first gas Q4 2011
45% working interest
Shallow water offshore platform 45kms south west of Dampier
Two train production capacity (field and plant) 215 TJ/d (gross). Site designed to take an additional train
NFE within existing acreage in shallow water and targeting low risk tie-back prospects to new hub
CITIC Pacific Iron Ore gas sale (US$585m); other contracts to follow
Hub 2: Devil Creek/Reindeer
Reindeer works – assembly yard in Thailand
Focused NFE
41
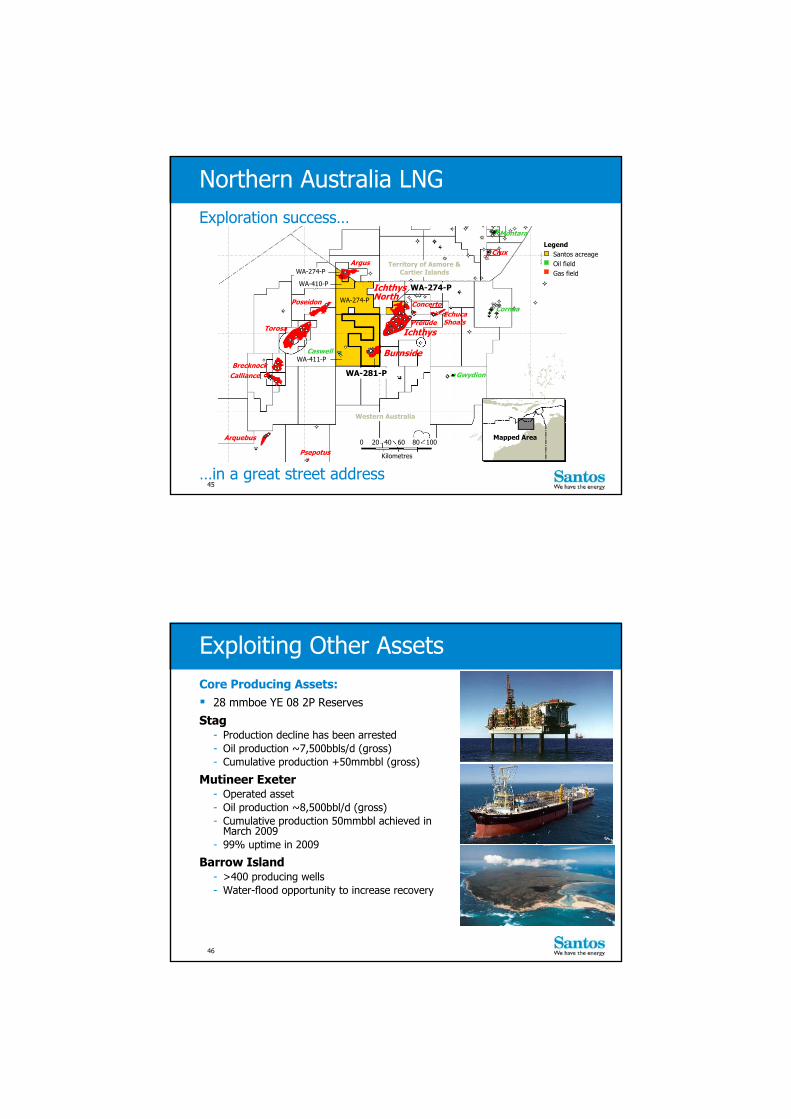
4 Northern Australia Growth options…
NorthernTerritory
WesternAustralia
Darwin
IndianOcean
EvansShoal
PetrelTern
Barossa
Bayu-Undan
Ichthys
Caldita
Oil pipelineGas pipeline
LegendSantos acreageOil fieldGas field
Frigate
Burnside
Darwin LNG
Bonaparte LNG
Browse
Northern LNG Expansion
0 100
Kilometres
Sunrise
Growing Northern Australia LNG Business
4
2
1
3
42
Santos’ first producing LNG asset
2nd largest equity participant and only Australian participant (11.4%)
79mmboe YE 08 2P Reserves
Bayu Undan- producing ~1.1bcf raw gas per day (gross)- Approximately 103,000 bbl/d liquids (gross)
DLNG 3.5mpta plant- Turbine upgrade during 2010 statutory shutdown to
increase to 3.6mtpa
Base project continues to deliver with potential upside unfolding:- Third Party Gas - Phase 2 Drilling campaign
2010 planned shutdown; 35 days in 2010 will reduce production and increase production cost for the year
Bayu Undan / Darwin LNG
43
Santos has sold 60% of Petrel/Tern/Frigate to GDF SUEZ for up to US$370 million and a full carry of Santos’ share of costs to FID
The fields are an ideal fit for FLNG:- Low in CO2- Low in liquids- Material resource size (~2.1 tcf)
Executing on strategy:- Unlocks value in contingent resources- Partner with world class companies- Deepening our LNG growth options- Use new technology
Transaction on track for completion- FIRB approval given
GDF SUEZ and Santos establishing project team in Perth
Partnership with GDF SUEZ unlocks value in 360mmboe of contingent gas resource…
…Santos retains approximately 70% (500mmboe) of its total Bonaparte Basin 2C contingent resource.
Floating LNG
44
WA-281-P
WA-411-P
WA-274-PWA-410-P
WA-274-P
WA-274-P Concerto
PreludeEchuca Shoals
Ichthys
ArgusCrux
Montara
Arquebus
CallianceBrecknock
Torosa
Poseidon
Gwydion
Caswell
LegendSantos acreageOil fieldGas field
0 20 40 60 80 100
Territory of Asmore & Cartier Islands
Western Australia
Mapped Area
Cornea
Burnside
IchthysNorth
Exploration success…
Northern Australia LNG
…in a great street addressPsepotus Kilometres
45
Exploiting Other AssetsCore Producing Assets: 28 mmboe YE 08 2P Reserves
Stag- Production decline has been arrested- Oil production ~7,500bbls/d (gross)- Cumulative production +50mmbbl (gross)
Mutineer Exeter- Operated asset- Oil production ~8,500bbl/d (gross)- Cumulative production 50mmbbl achieved in
March 2009 - 99% uptime in 2009
Barrow Island- >400 producing wells- Water-flood opportunity to increase recovery
46
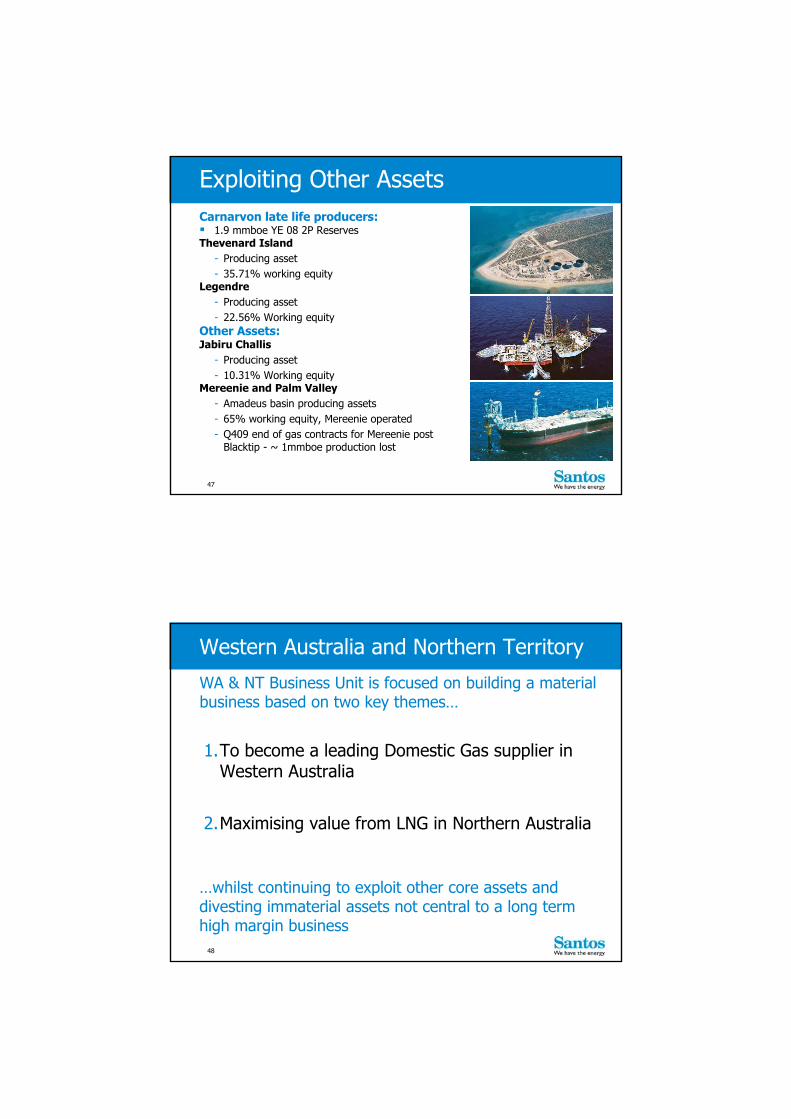
Carnarvon late life producers: 1.9 mmboe YE 08 2P Reserves Thevenard Island
- Producing asset- 35.71% working equity
Legendre- Producing asset- 22.56% Working equity
Other Assets:Jabiru Challis
- Producing asset- 10.31% Working equity
Mereenie and Palm Valley- Amadeus basin producing assets- 65% working equity, Mereenie operated- Q409 end of gas contracts for Mereenie post
Blacktip - ~ 1mmboe production lost
Exploiting Other Assets
47
Western Australia and Northern Territory
WA & NT Business Unit is focused on building a materialbusiness based on two key themes…
…whilst continuing to exploit other core assets and divesting immaterial assets not central to a long term high margin business
1.To become a leading Domestic Gas supplier in Western Australia
2.Maximising value from LNG in Northern Australia
48
Asia Pacific Business UnitMartyn Eames
Vice President, Asia Pacific49
Base business Eastern Australia: Margin growth and resource conversion Indonesia: Established business with incremental growth Western Australia: Growing a material domestic gas business
LNG growth
GLNG: The leading CSG to LNG project, FID mid-2010 PNG LNG: FID Dec-09, first LNG production mid-2014 Darwin LNG: Mature brownfield LNG growth Bonaparte LNG: Innovative floating LNG project
Focused growth in Asia Vietnam: Develop Chim Sao and exploration-led growth India/Bangladesh: Bay of Bengal exploration-led growth
The Santos Strategy & Asia PacificLeverage Asia’s growing energy needs to develop material & sustainable exploitation focused businesses
50
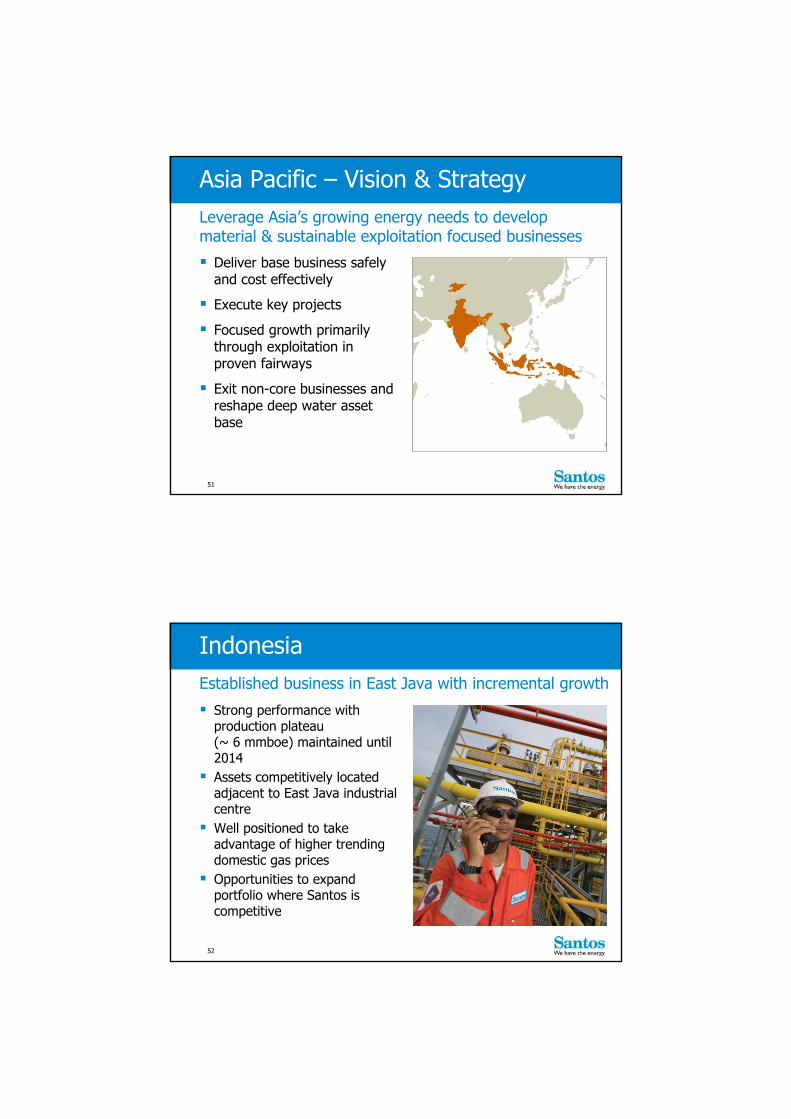
Asia Pacific – Vision & StrategyLeverage Asia’s growing energy needs to develop material & sustainable exploitation focused businesses
Deliver base business safely and cost effectively
Execute key projects
Focused growth primarily through exploitation in proven fairways
Exit non-core businesses and reshape deep water asset base
51
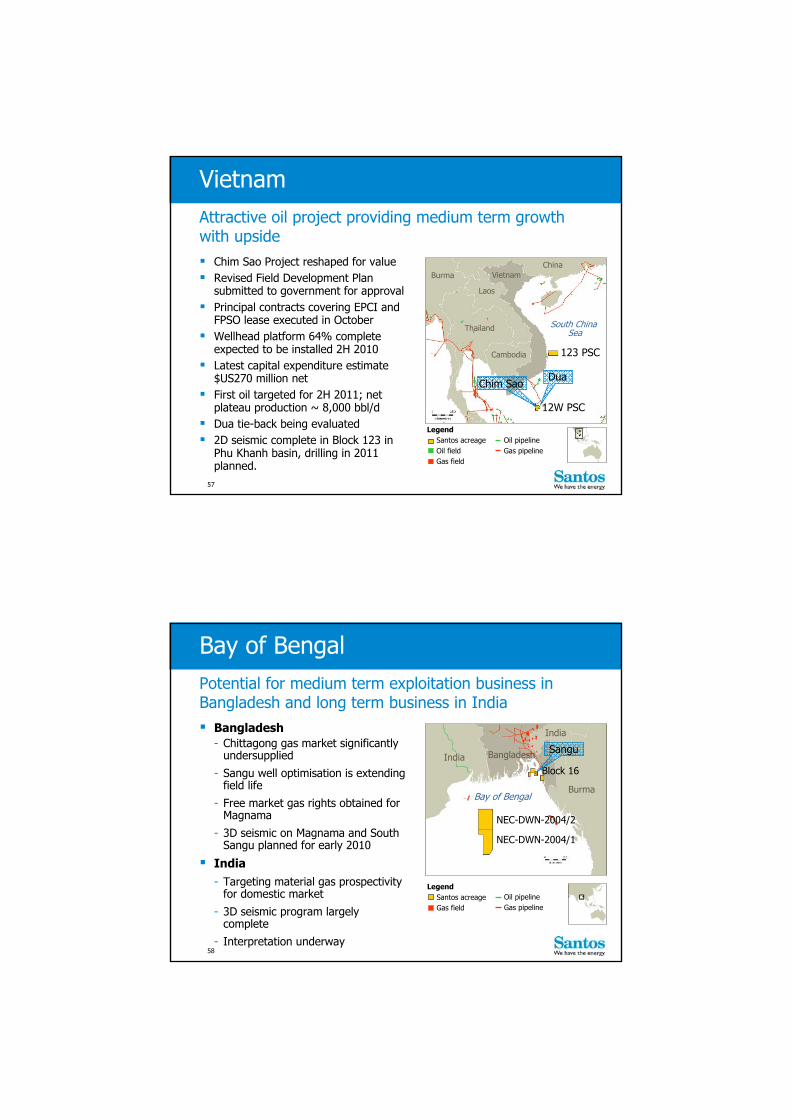
Indonesia
Strong performance with production plateau (~ 6 mmboe) maintained until 2014
Assets competitively located adjacent to East Java industrial centre
Well positioned to take advantage of higher trending domestic gas prices
Opportunities to expand portfolio where Santos is competitive
Established business in East Java with incremental growth
52

Madura Offshore PSC
Maleo- Production start-up 29 Sept.
2006- Gross gas production
~ 110 mmscf/d- Reserve upgrade at end 2009
forecast- Long term sales gas contract to
PT Perusahaan Gas Negara Peluang
- Peluang-1 well drilled in 1Q 2009
- Potential tie back to Maleo to maintain plateau
Maleo performing beyond expectation; incremental growth from Peluang
LegendSantos acreageOil fieldGas field
Oil pipelineGas pipeline
MaduraOffshore PSC
East Java
Madura Island
Bali
Peluang-1Maleo
GratiProcessing
Plant50km
Surabaya
53
Sampang PSC
Oyong Phase 1 (oil)- Production performance above
expectation at ~ 3600 bbl/day (gross) Oyong Phase 2 (oil and gas)
- 2.6 million manhours without aLost Time Injury
- Gas production start-up on time (Q309) and plateau of ~ 60 mmscf/d(gross) reached within 20 days
- Gas sales to PT Indonesia Power Wortel
- Tie back to Oyong- POD approval expected in December
2009 - FID targeted mid 2010- First gas forecast 2H 2011
LegendSantos acreageOil fieldGas field
Oil pipelineGas pipeline
Surabaya
Sampang PSC
East Java
Madura Island
Bali50km
GratiProcessing
Plant
Wortel OyongJava Sea
Oyong Phase 2 delivered on time; incremental growth from Wortel
54

Papua New Guinea LNG
FID approved on 8 December 2 SPAs executed, remaining
two expected to be executed by early-2010 Financial Close early in 2010 First sales are targeted for
2014 Initial equity determination in
line with prior guidance Plateau Production of ~
9 mmboe pa Reserves addition 22% of
Santos’ YE 2008 2P Reserves
PNG LNG Project FID approval signals next step in LNG growth strategy
55
Papua New Guinea LNG
Papua New Guinea
LegendSantos acreageOil fieldGas field
Oil pipelineProposed gaspipeline
MarineTerminal
PRL 9PDL 3
PDL 1
Santos’ acreage and infrastructure position provides opportunity for further growth
100km
Hides
Proposed LNG Plant
Port Moresby
Gulf of Papua
First redetermination to follow Hides drilling in 2012/13
Debottlenecking has the potential to increase off-take
3rd train alternatives being considered
- Hides drilling results could be key driver
56
Vietnam
Chim Sao Project reshaped for value Revised Field Development Plan
submitted to government for approval Principal contracts covering EPCI and
FPSO lease executed in October Wellhead platform 64% complete
expected to be installed 2H 2010 Latest capital expenditure estimate
$US270 million net First oil targeted for 2H 2011; net
plateau production ~ 8,000 bbl/d Dua tie-back being evaluated 2D seismic complete in Block 123 in
Phu Khanh basin, drilling in 2011 planned.
Attractive oil project providing medium term growth with upside
LegendSantos acreageOil fieldGas field
Oil pipelineGas pipeline
Vietnam
Cambodia
Thailand
Laos
ChinaBurma
South China Sea
12W PSC
123 PSC
DuaChim Sao
57
Bay of Bengal
Bangladesh- Chittagong gas market significantly
undersupplied
- Sangu well optimisation is extending field life
- Free market gas rights obtained for Magnama
- 3D seismic on Magnama and South Sangu planned for early 2010
India- Targeting material gas prospectivity
for domestic market
- 3D seismic program largely complete
- Interpretation underway
Potential for medium term exploitation business in Bangladesh and long term business in India
LegendSantos acreageGas field
Oil pipelineGas pipeline
Bangladesh
Burma
India
India
Bay of Bengal
NEC-DWN-2004/2
NEC-DWN-2004/1
Block 16
Sangu
58
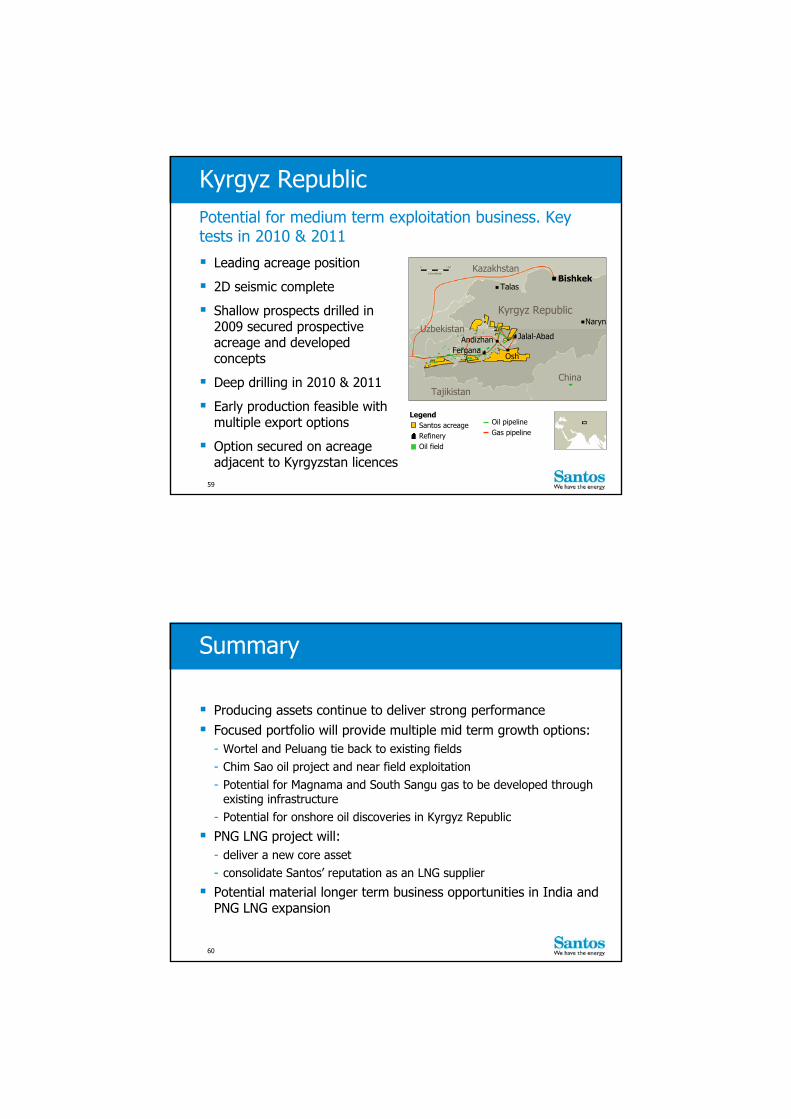
Kyrgyz Republic
Leading acreage position
2D seismic complete
Shallow prospects drilled in 2009 secured prospective acreage and developed concepts
Deep drilling in 2010 & 2011
Early production feasible with multiple export options
Option secured on acreage adjacent to Kyrgyzstan licences
Oil pipelineGas pipeline
Bishkek
Kyrgyz RepublicNaryn
Jalal-Abad
Osh
Andizhan
Talas
Fergana
ChinaTajikistan
Kazakhstan
Uzbekistan
LegendSantos acreageRefineryOil field
Potential for medium term exploitation business. Key tests in 2010 & 2011
59
Summary
Producing assets continue to deliver strong performance Focused portfolio will provide multiple mid term growth options:
- Wortel and Peluang tie back to existing fields- Chim Sao oil project and near field exploitation- Potential for Magnama and South Sangu gas to be developed through
existing infrastructure - Potential for onshore oil discoveries in Kyrgyz Republic
PNG LNG project will:- deliver a new core asset- consolidate Santos’ reputation as an LNG supplier
Potential material longer term business opportunities in India and PNG LNG expansion
60

GLNGRick Wilkinson
President, GLNG and Queensland61
Overview
Two trains Milestones achieved
We have the energy to deliver…
…CSG to LNG: a world first
The Project
OperationalExcellence & Innovation
The RightPeople
Comprehensive CSG program Reserves growth Technology innovation Scalability Ramp gas strategy Storage advantage
Capability established PETRONAS leverage Train 2 and beyond
62
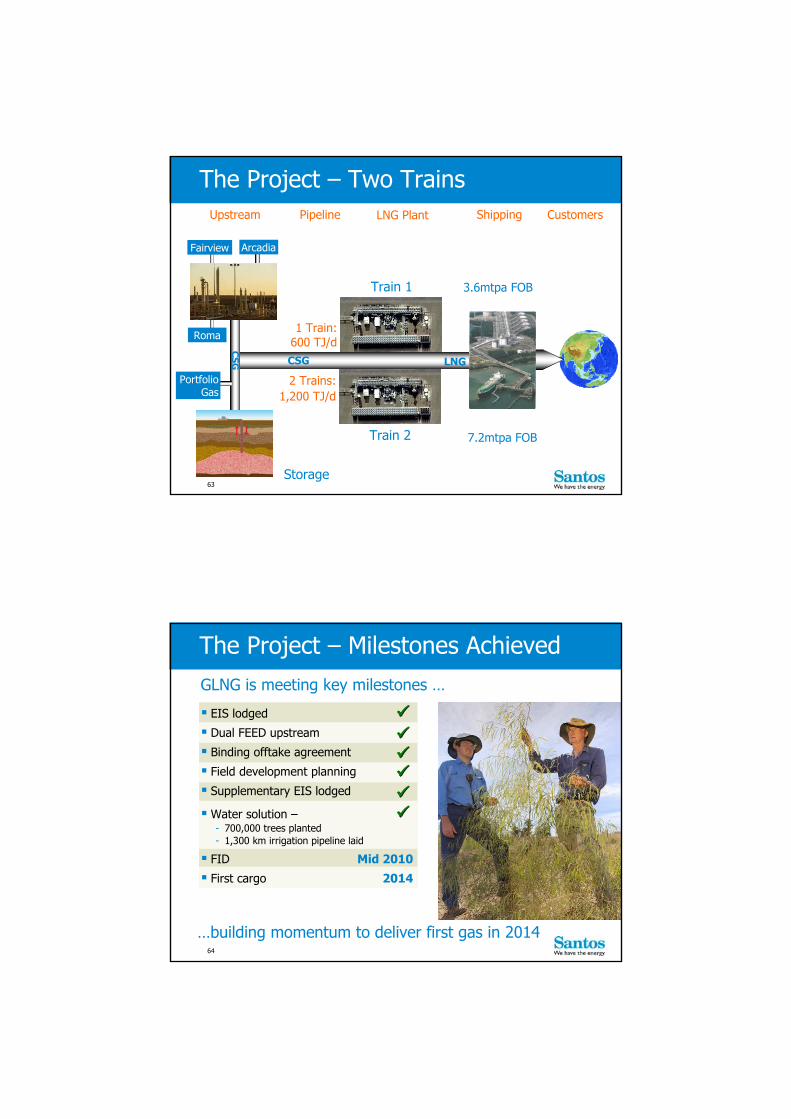
The Project – Two TrainsUpstream CustomersLNG Plant
Train 1
Train 2
1 Train: 600 TJ/d
Pipeline Shipping
3.6mtpa FOB
7.2mtpa FOB
Arcadia
Roma
Fairview
2 Trains:1,200 TJ/d
LNGCSG
CSG
Portfolio Gas
Storage63
The Project – Milestones AchievedGLNG is meeting key milestones …
…building momentum to deliver first gas in 2014
EIS lodged
Dual FEED upstream
Binding offtake agreement
Field development planning
Supplementary EIS lodged
Water solution –- 700,000 trees planted- 1,300 km irrigation pipeline laid
FID Mid 2010
First cargo 2014
64
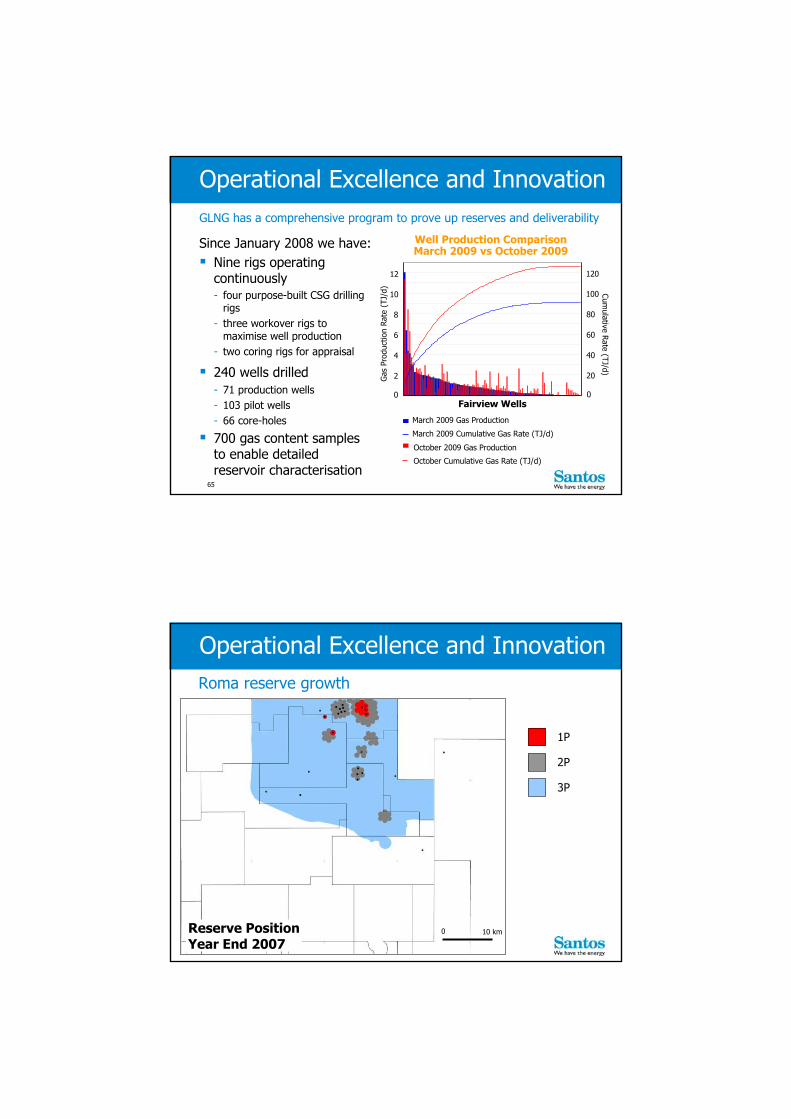
Operational Excellence and Innovation
Since January 2008 we have: Nine rigs operating
continuously- four purpose-built CSG drilling
rigs- three workover rigs to
maximise well production- two coring rigs for appraisal
240 wells drilled- 71 production wells- 103 pilot wells- 66 core-holes
700 gas content samples to enable detailed reservoir characterisation
GLNG has a comprehensive program to prove up reserves and deliverability
Well Production ComparisonMarch 2009 vs October 2009
0
2
4
6
8
10
12
Fairview Wells
Gas
Pro
duct
ion
Rate
(TJ
/d)
0
20
40
60
80
100
120
Cumulative R
ate (TJ/d)
March 2009 Gas Production
October 2009 Gas Production
March 2009 Cumulative Gas Rate (TJ/d)
October Cumulative Gas Rate (TJ/d)
65
Roma reserve growth
0 10 km
2P
3P
Reserve PositionYear End 2007
1P
Operational Excellence and Innovation
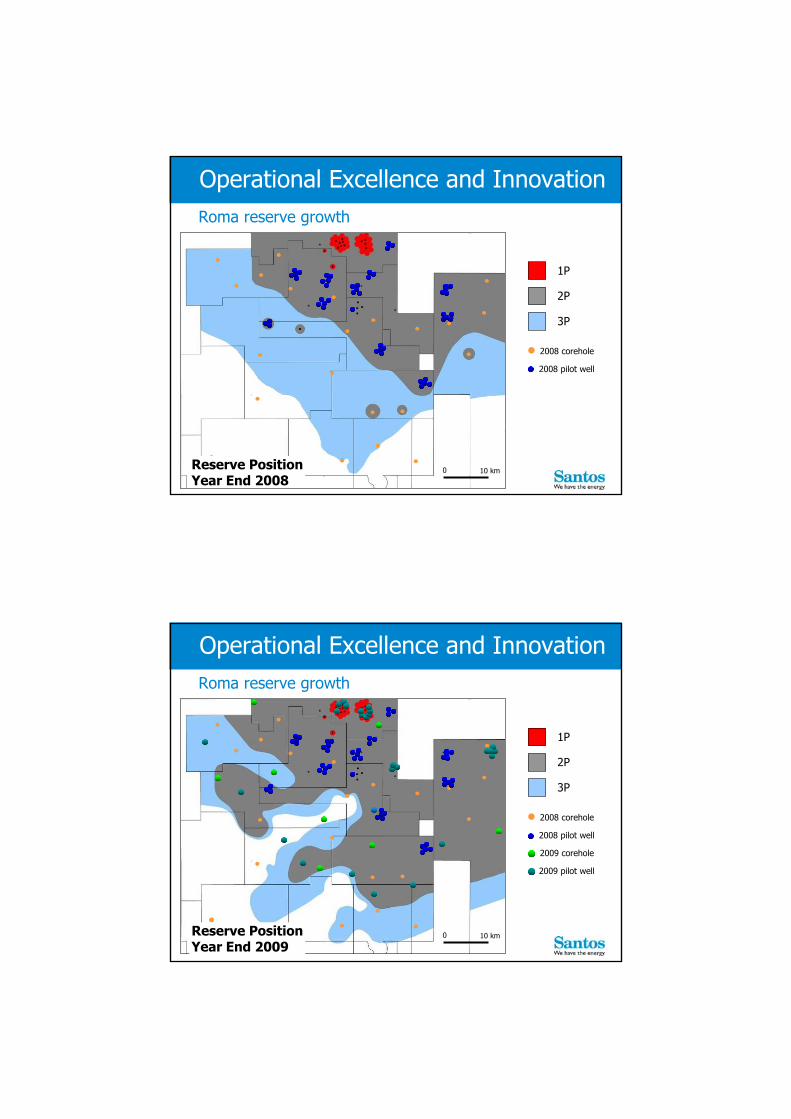
0 10 kmReserve PositionYear End 2008
2008 corehole
2008 pilot well
2P
3P
1P
Roma reserve growth
Operational Excellence and Innovation
0 10 kmReserve PositionYear End 2009
2008 corehole
2008 pilot well
2009 corehole
2009 pilot well
2P
3P
1P
Roma reserve growth
Operational Excellence and Innovation

Technology innovation will realise value and opportunities
Pad Drilling
2-9 wells/pad
Reduced rig moves
CAPEX and OPEX savings
Facility simplification
Economies of scale
Operator efficiency
Gas to processing station Water to plantation/crops
Operational Excellence and Innovation
69
…and are ready to be scaled up to full capacity
Scalability – our assets are delivering in the field now …
Daily water production capacity 80,000 bbl/d
700,000 trees Drip irrigation
Compressor capacity 130 TJ/d 3 installed compressor
stations
9 operating rigs 120 wells drilled
in 2009 25 core-holes
CSG exploration& production
CompressorStations
CSG Water Projects
Amended water
Reverse osmosis
230 ha forage crops Pivot irrigation
Operational Excellence and Innovation
70
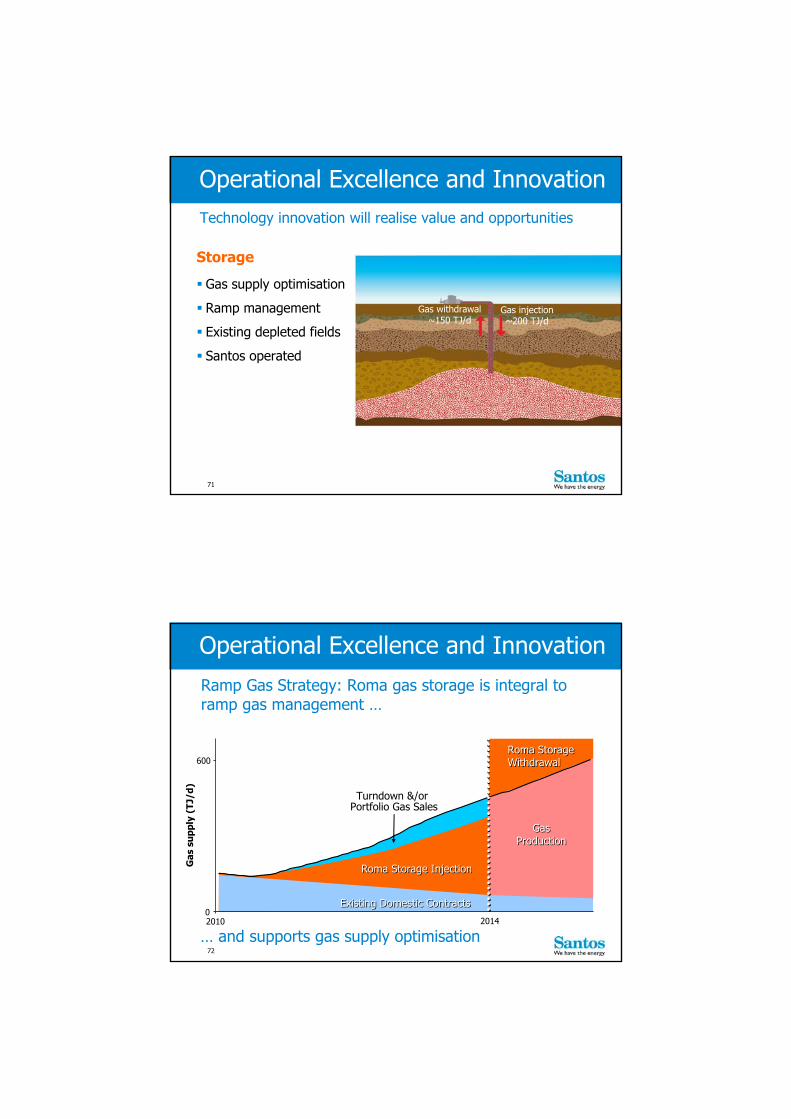
Technology innovation will realise value and opportunities
Storage
Gas supply optimisation
Ramp management
Existing depleted fields
Santos operated
Gas export Gas input
Underground storage
Gas injectionGas withdrawalApprox 150 TJ/d Approx 200 TJ/d
Gas injection~200 TJ/d
Gas withdrawal~150 TJ/d
Operational Excellence and Innovation
71
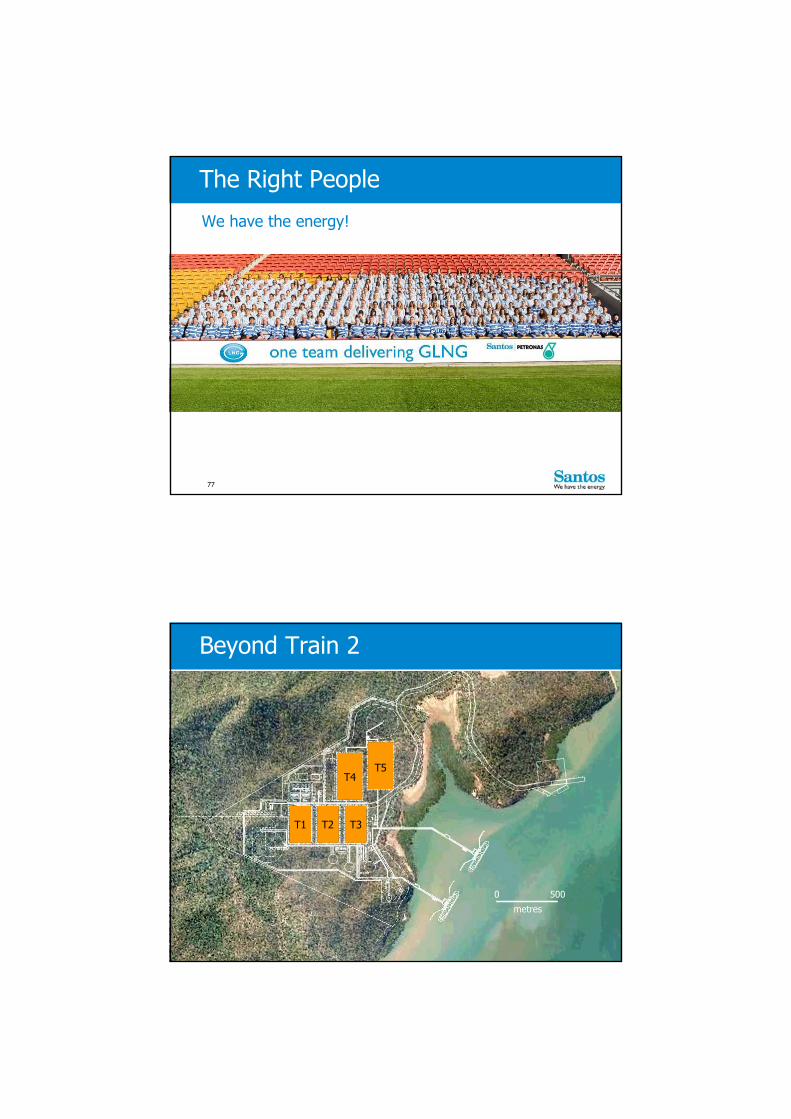
Roma Storage WithdrawalRoma Storage Withdrawal
Turndown &/or Portfolio Gas Sales
0
600
2010 2014
Gas
su
pply
(TJ
/d)
Existing Domestic ContractsExisting Domestic Contracts
Roma Storage InjectionRoma Storage Injection
GasProduction
GasProduction
Ramp Gas Strategy: Roma gas storage is integral to ramp gas management …
… and supports gas supply optimisation
Operational Excellence and Innovation
72

Legend
Santos/Petronas JV permits
Other Santosacreage
Gladstone
Queensland
Arcadia
Fairview
Proposedpipeline
Wallumbilla
Roma
25km
Roma
Gas field
Gas pipeline
ProposedGLNG pipeline
… have been identified in Santos-operated acreage
Depleted conventional reservoirs suitable for storage …
Storage wells
Operational Excellence and Innovation
73
Preparing for Train 2
Upstream reserves already building for Train 2
Plant Train 2 FEED well progressed – 60% complete
Up to $600m of pre-investment in Train 2 facilities- Shared facilities- Pipeline designed to include Train 2
Significant reduction in investment required for Train 2
Current plan to commence operating Train 2 one year after Train 1
Gas supply and marketing efforts under way
74

The Right People
…with unrivalled skill and experience
PETRONAS is the right partner for Santos …
Operator of MLNG, Bintulu, Sarawak
25 years’ supply LNG to Asia
3rd largest LNG producer in the world
One of the largest owner-operator LNG fleets in the world
75
The Right People
…and stretches from Roma to Asia
Capability footprint is established…
Global operations Technical knowledge Marketing expertise World class shipping fleet Purchasing power
Bechtel Foster Wheeler Fluor GHD
Inte
rnat
ion
al
Con
trac
tors
PET
RO
NA
S
76
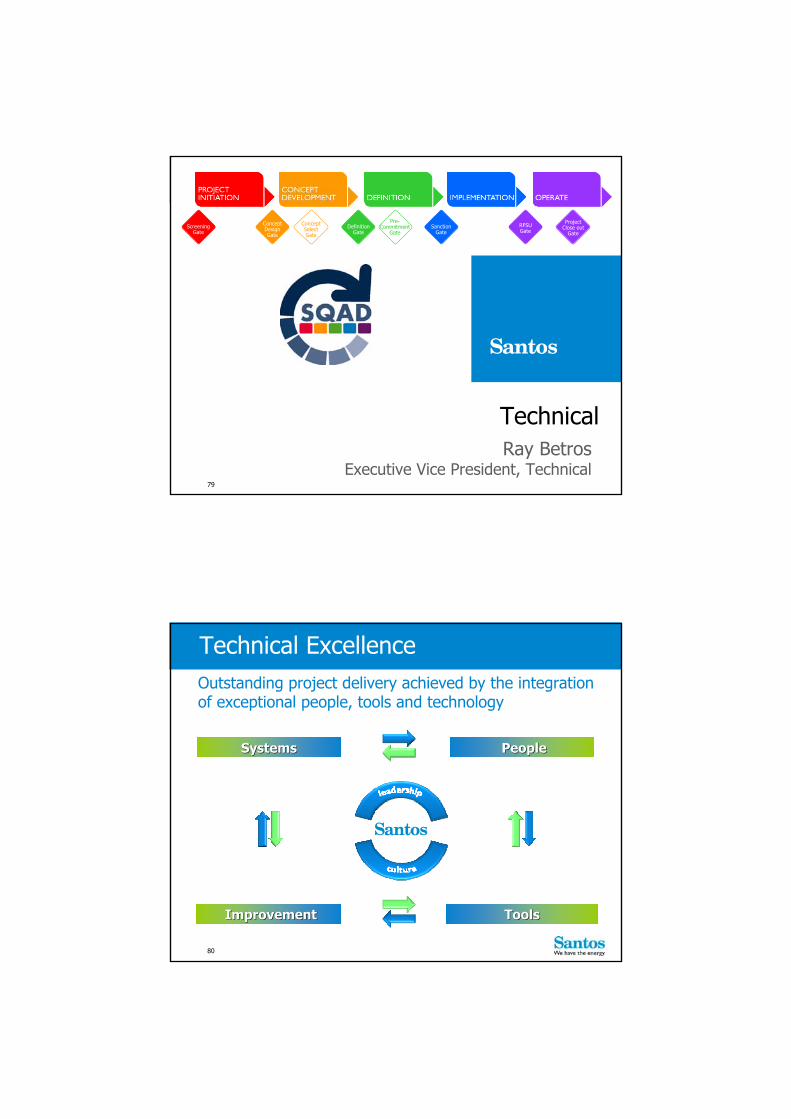
The Right People
We have the energy!
77
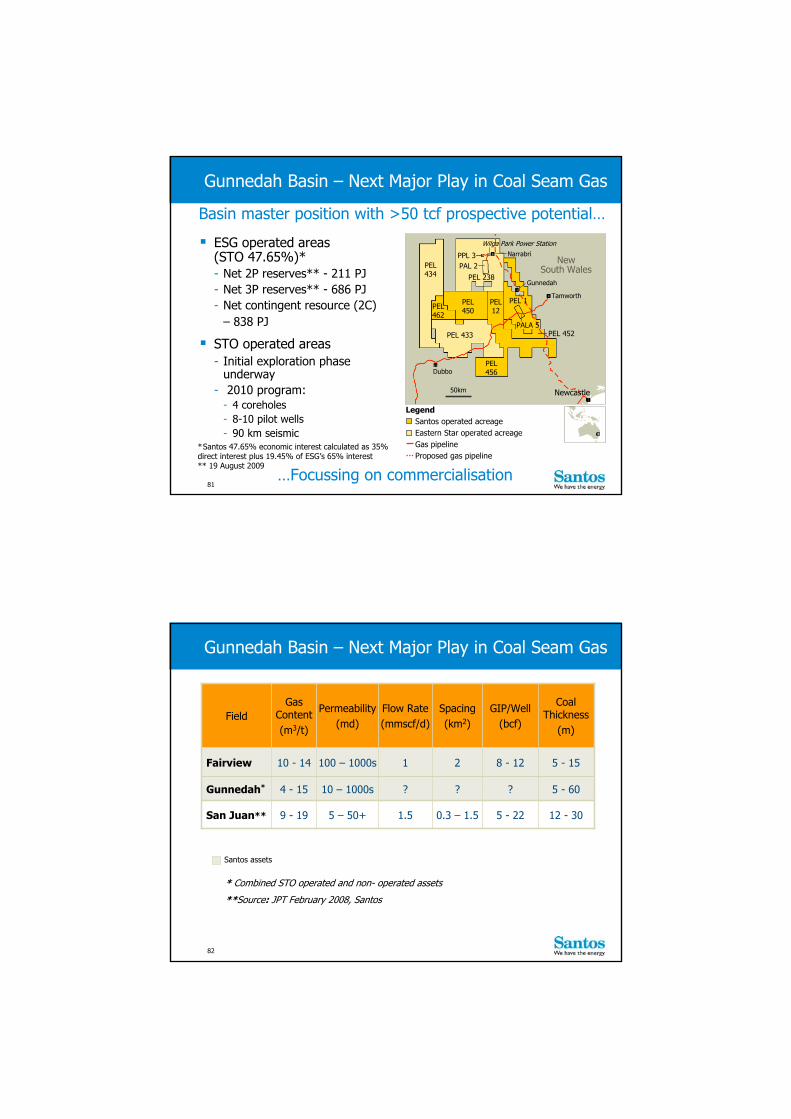
Beyond Train 2
0 500
metres
T1 T2 T3
T4T5
TechnicalRay Betros
Executive Vice President, Technical
ConceptDesignGate
ConceptSelectGate
DefinitionGate
Pre-Commitment
GateSanction
GateRFSUGate
ProjectClose out
GateScreening
Gate
79
Technical Excellence Outstanding project delivery achieved by the integration of exceptional people, tools and technology
SystemsSystems PeoplePeople
ImprovementImprovement ToolsTools
80
ESG operated areas (STO 47.65%)*- Net 2P reserves** - 211 PJ- Net 3P reserves** - 686 PJ- Net contingent resource (2C)
– 838 PJ
STO operated areas- Initial exploration phase
underway- 2010 program:
- 4 coreholes- 8-10 pilot wells- 90 km seismic
Basin master position with >50 tcf prospective potential…
50km
LegendSantos operated acreageEastern Star operated acreageGas pipelineProposed gas pipeline
NewSouth Wales
Narrabri
Dubbo
Gunnedah
Tamworth
PEL434
PEL450PEL
462
PEL12
PEL 238
PEL 433
PEL456
PEL 1
PPL 3PAL 2
PALA 5PEL 452
Newcastle
Wilga Park Power Station
*Santos 47.65% economic interest calculated as 35% direct interest plus 19.45% of ESG’s 65% interest** 19 August 2009
…Focussing on commercialisation
Gunnedah Basin – Next Major Play in Coal Seam Gas
81
??? 5 - 6010 – 1000s4 - 15Gunnedah*
12 - 30
5 - 15
Coal Thickness
(m)
5 - 220.3 – 1.51.55 – 50+9 - 19San Juan**
8 - 1221100 – 1000s10 - 14Fairview
GIP/Well(bcf)
Spacing(km2)
Flow Rate(mmscf/d)
Permeability(md)
Gas Content(m3/t)
Field
* Combined STO operated and non- operated assets
**Source: JPT February 2008, Santos
Santos assets
Gunnedah Basin – Next Major Play in Coal Seam Gas
82
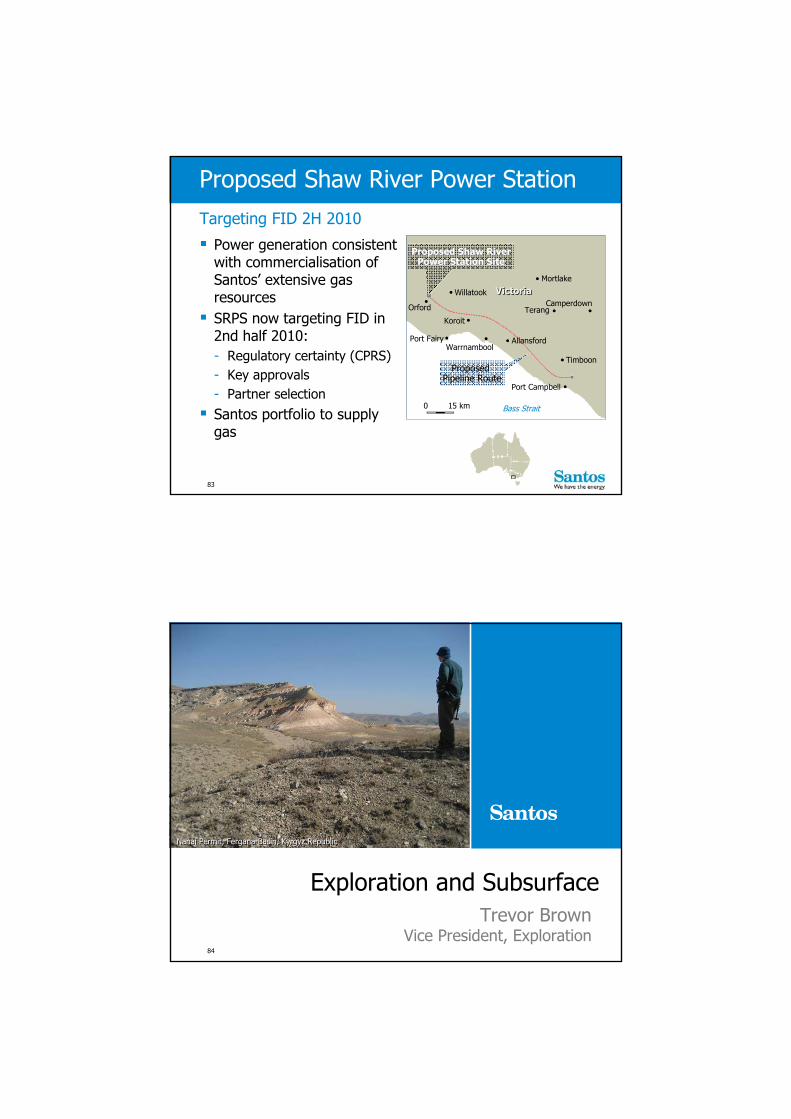
Proposed Shaw River Power Station
Power generation consistent with commercialisation of Santos’ extensive gas resources SRPS now targeting FID in
2nd half 2010:- Regulatory certainty (CPRS)- Key approvals- Partner selection Santos portfolio to supply
gas
WarrnamboolPort Fairy
Orford
Willatook
Mortlake
TerangCamperdown
Timboon
Port Campbell
Koroit
Allansford
Proposed Shaw RiverProposed Shaw RiverPower Station SitePower Station Site
Proposed Pipeline Route
VictoriaVictoria
0 15 km Bass Strait
Targeting FID 2H 2010
83
Exploration and SubsurfaceTrevor Brown
Vice President, Exploration
Nanai Permit, Fergana Basin, Kyrgyz RepublicNanai Permit, Fergana Basin, Kyrgyz Republic
84
Exploration Wells (Number)
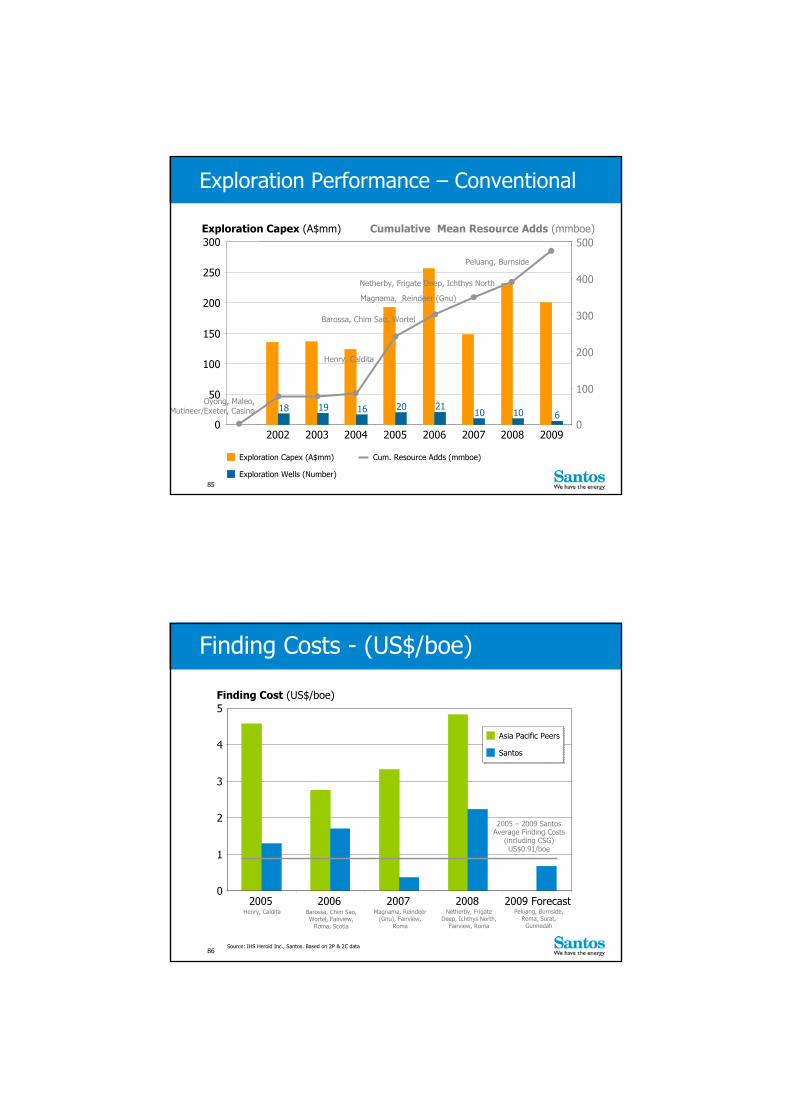
Exploration Performance – Conventional
Exploration Capex (A$mm) Cum. Resource Adds (mmboe)
0
50
100
150
200
250
300Exploration Capex (A$mm) Cumulative Mean Resource Adds (mmboe)
18 19 16 20 2110 10 6
2002 2003 2004 2005 2006 2007 2008 20090
100
200
300
400
500
Henry, Caldita
Barossa, Chim Sao, Wortel
Magnama, Reindeer (Gnu)
Netherby, Frigate Deep, Ichthys North
Peluang, Burnside
Oyong, Maleo, Mutineer/Exeter, Casino
85
Barossa, Chim Sao, Wortel, Fairview,
Roma, Scotia
Magnama, Reindeer (Gnu), Fairview,
Roma
Netherby, Frigate Deep, Ichthys North,
Fairview, Roma
Peluang, Burnside, Roma, Surat,
Gunnedah
Henry, Caldita
Finding Costs - (US$/boe)
0
1
2
3
4
5
2005 2006 2007 2008 2009 Forecast
Finding Cost (US$/boe)
Source: IHS Herold Inc., Santos. Based on 2P & 2C data
.
Santos
Asia Pacific Peers
2005 – 2009 Santos Average Finding Costs
(including CSG) US$0.91/boe
86
200km
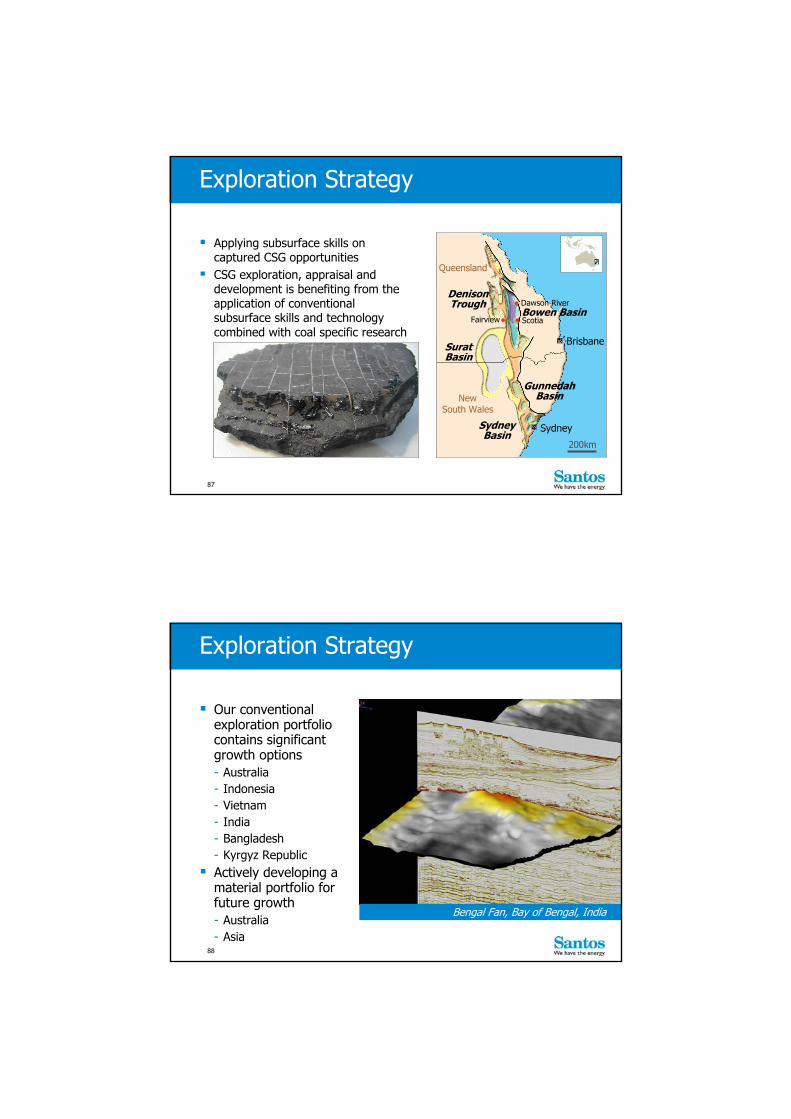
Exploration Strategy
Applying subsurface skills on captured CSG opportunities
CSG exploration, appraisal and development is benefiting from the application of conventional subsurface skills and technology combined with coal specific research
Brisbane
Sydney
Dawson River
ScotiaFairview
DenisonTrough
Bowen Basin
SuratBasin
GunnedahBasin
SydneyBasin
Queensland
NewSouth Wales
87
Exploration Strategy
Our conventional exploration portfolio contains significant growth options- Australia- Indonesia- Vietnam- India- Bangladesh- Kyrgyz Republic
Actively developing a material portfolio for future growth- Australia- Asia
Bengal Fan, Bay of Bengal, India
88

0
50
100
150
200
250
300
2008 2009 2010 2011 2012
A$mm
ConventionalCSG
Exploration Spend (A$mm)
Exploration Spend
0
5
10
15
20
25
2003 2004 2005 2006 2007 2008 2009 2010 2011 2012
% Exploration % of Total Capex
89
Spar Deep
Spar Deep gas opportunity, located beneath the Spar Gas Field, 70km from Varanus Island at a depth of 3500m
Targeting a structural/stratigraphic trap of Early Cretaceous age sands In success case, opportunity to quickly develop due to proximity to
near-by facilities
Spar 1 Spar 2SW NE
90
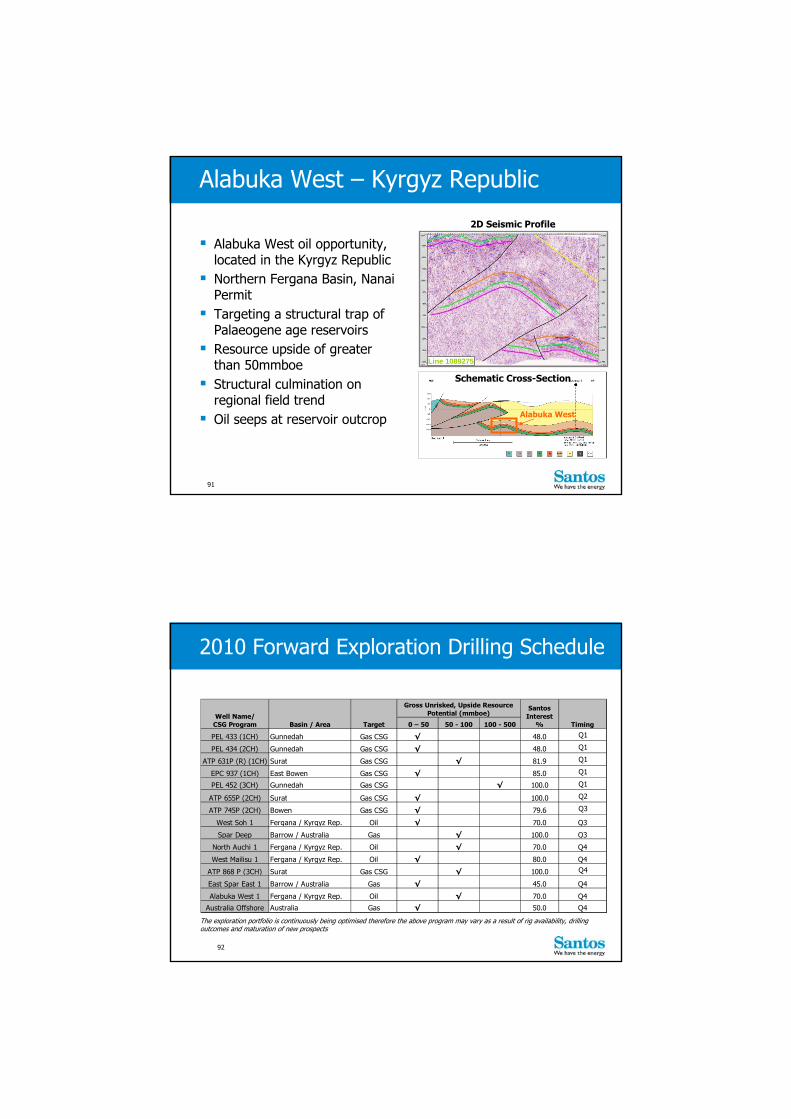
Alabuka West – Kyrgyz Republic
Alabuka West oil opportunity, located in the Kyrgyz Republic
Northern Fergana Basin, Nanai Permit
Targeting a structural trap of Palaeogene age reservoirs
Resource upside of greater than 50mmboe
Structural culmination on regional field trend
Oil seeps at reservoir outcrop
Line 1089275
2D Seismic Profile
Alabuka West
Schematic Cross-Section
91
The exploration portfolio is continuously being optimised therefore the above program may vary as a result of rig availability, drilling outcomes and maturation of new prospects
2010 Forward Exploration Drilling Schedule
0 – 50 50 - 100 100 - 500
PEL 433 (1CH) Gunnedah Gas CSG √ 48.0 Q1
PEL 434 (2CH) Gunnedah Gas CSG √ 48.0 Q1
ATP 631P (R) (1CH) Surat Gas CSG √ 81.9 Q1
EPC 937 (1CH) East Bowen Gas CSG √ 85.0 Q1
PEL 452 (3CH) Gunnedah Gas CSG √ 100.0 Q1
ATP 655P (2CH) Surat Gas CSG √ 100.0 Q2
ATP 745P (2CH) Bowen Gas CSG √ 79.6 Q3
West Soh 1 Fergana / Kyrgyz Rep. Oil √ 70.0 Q3
Spar Deep Barrow / Australia Gas √ 100.0 Q3
North Auchi 1 Fergana / Kyrgyz Rep. Oil √ 70.0 Q4
West Mailisu 1 Fergana / Kyrgyz Rep. Oil √ 80.0 Q4
ATP 868 P (3CH) Surat Gas CSG √ 100.0 Q4
East Spar East 1 Barrow / Australia Gas √ 45.0 Q4
Alabuka West 1 Fergana / Kyrgyz Rep. Oil √ 70.0 Q4
Australia Offshore Australia Gas √ 50.0 Q4
Basin / Area TargetWell Name/
CSG Program
Santos Interest
% Timing
Gross Unrisked, Upside Resource Potential (mmboe)
92
Outlook and FundingPeter Wasow
Executive Vice President & Chief Financial Officer93
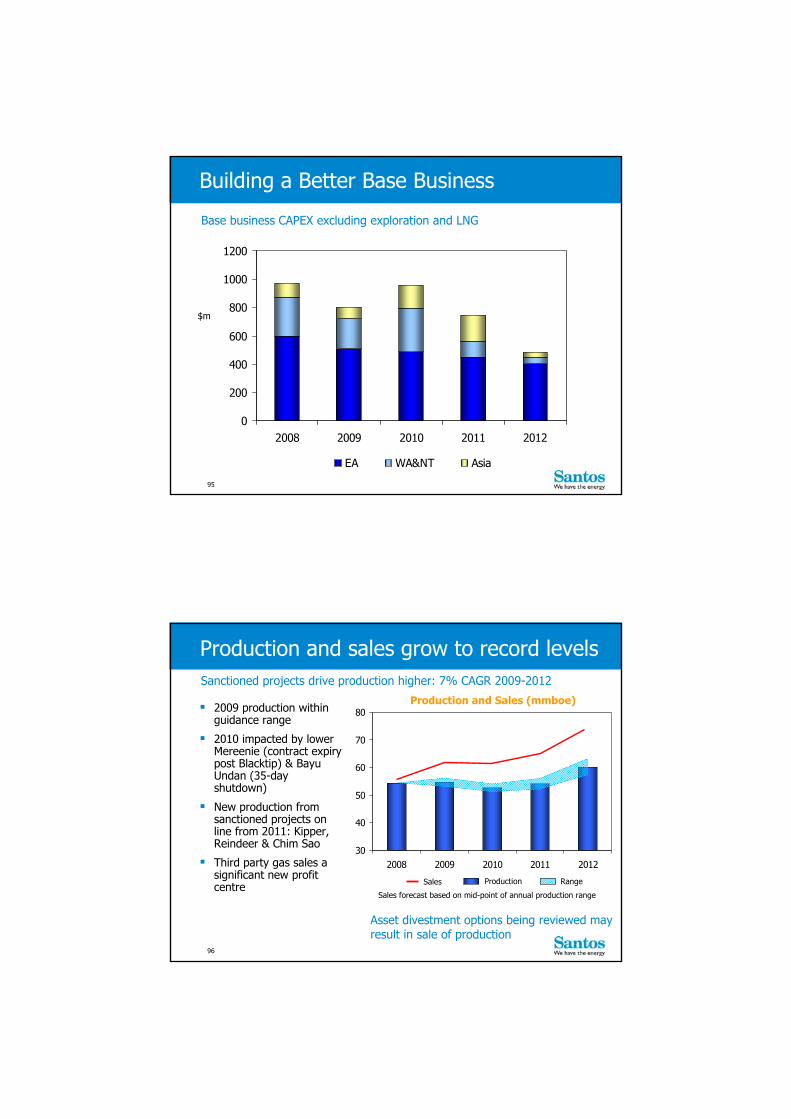
Delivering Transformational Growth
Prod
uctio
n
Asset quality is transformed…
0%
25%
50%
75%
100%
2010 2011 2012 2013 2014 2015 2016 2017 2018
Mature assets
Long life assets on plateau with high free cash flowLNG
John Brookes, Reindeer, Kipper, Otway
…with liquids linked pricing rising to 70% of production
94
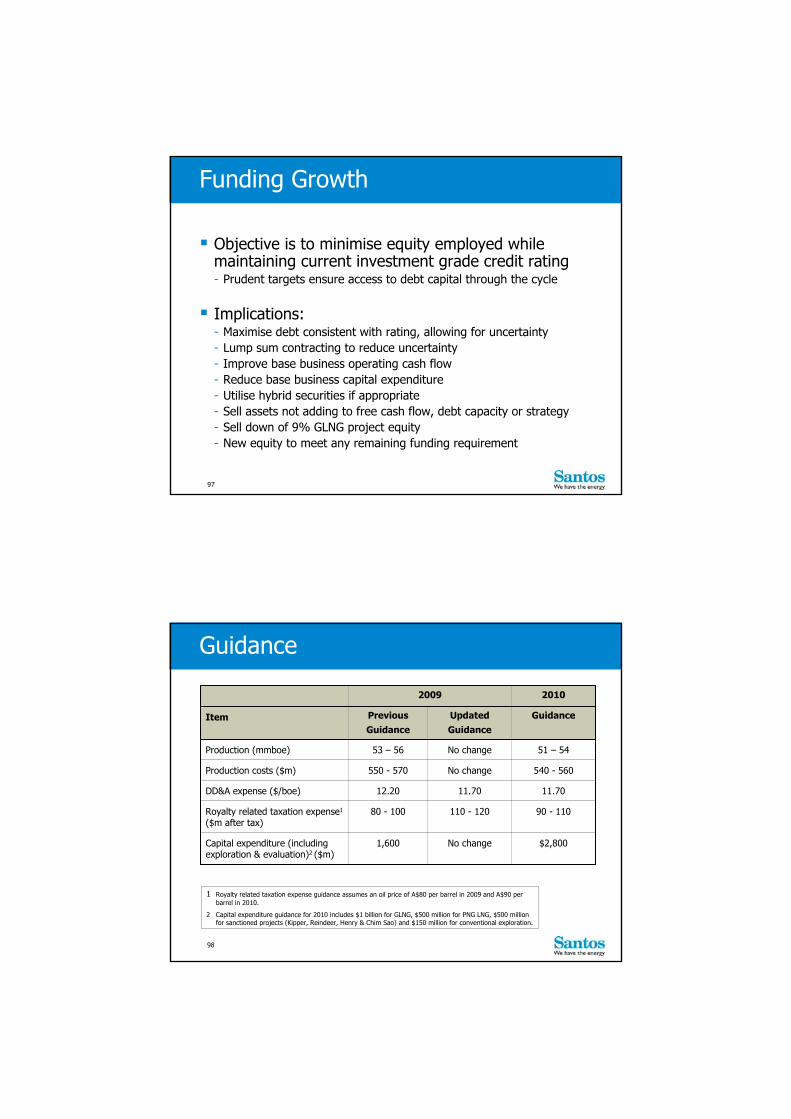
Building a Better Base Business
Base business CAPEX excluding exploration and LNG
0
200
400
600
800
1000
1200
2008 2009 2010 2011 2012
EA WA&NT Asia
$m
95
30
40
50
60
70
80
2008 2009 2010 2011 2012
Production and sales grow to record levels
2009 production within guidance range
2010 impacted by lower Mereenie (contract expiry post Blacktip) & BayuUndan (35-day shutdown)
New production from sanctioned projects on line from 2011: Kipper, Reindeer & Chim Sao
Third party gas sales a significant new profit centre
Production and Sales (mmboe)
Asset divestment options being reviewed may result in sale of production
Sanctioned projects drive production higher: 7% CAGR 2009-2012
ProductionSales
Sales forecast based on mid-point of annual production range
Range
96
Funding Growth
Objective is to minimise equity employed while maintaining current investment grade credit rating- Prudent targets ensure access to debt capital through the cycle
Implications:- Maximise debt consistent with rating, allowing for uncertainty- Lump sum contracting to reduce uncertainty- Improve base business operating cash flow- Reduce base business capital expenditure- Utilise hybrid securities if appropriate- Sell assets not adding to free cash flow, debt capacity or strategy- Sell down of 9% GLNG project equity- New equity to meet any remaining funding requirement
97
Guidance
20102009
No change
110 - 120
11.70
No change
No change
UpdatedGuidance
$2,800
90 - 110
11.70
540 - 560
51 – 54
Guidance
1,600Capital expenditure (including exploration & evaluation)2 ($m)
80 - 100Royalty related taxation expense1
($m after tax)
12.20DD&A expense ($/boe)
550 - 570Production costs ($m)
53 – 56Production (mmboe)
PreviousGuidance
Item
1 Royalty related taxation expense guidance assumes an oil price of A$80 per barrel in 2009 and A$90 per barrel in 2010.
2 Capital expenditure guidance for 2010 includes $1 billion for GLNG, $500 million for PNG LNG, $500 million for sanctioned projects (Kipper, Reindeer, Henry & Chim Sao) and $150 million for conventional exploration.
98
David KnoxChief Executive Officer & Managing Director
99
Our strategy delivers…
Performance from the base business
LNG growth- LNG at more than 50% of revenue- With equity in 4 LNG projects
Focussed growth in Asia
Thereby realising our vision to be a leading Australian company providing energy for Australia and Asia
100


![Unconscionability’s Greatly Exaggerated Death · 2020-04-25 · 2019] Unconscionability’s Greatly Exaggerated Death 967 INTRODUCTION Nearly every first-year Contracts class studies](https://img.pdfslide.us/doc/110x75/5f2db821c0bc323a853f1f2a/unconscionabilityas-greatly-exaggerated-death-2020-04-25-2019-unconscionabilityas.jpg)