Embed Size (px)
Citation preview

1 | P a g e
Santa Catalina Island Tourism Supply and Demand Analysis and Strategy
Prepared for: Catalina Island Chamber of Commerce
& Visitors Bureau
“Solutions and ideas for your competitive world”

Catalina Island Chamber of Commerce & Visitors Bureau
2 | P a g e
Table of Contents
Project Overview ............................................................................................... 3 Executive Summary............................................................................................ 8 Situation Analysis ............................................................................................... 9 Catalina Island Strategy Development ............................................................. 24 Figures Figure 1: Catalina Island Overnight, Day vs. Total Arrivals ..................................................................... 9 Figure 2: Day Visitors with a Percent of Total Arrivals .......................................................................... 10 Figure 3A: Catalina Island Visitor Demand Seasonality ........................................................................ 11 Figure 3B: Catalina Island Visitor Demand Seasonality (Day and Overnight Visitors) .......................... 11 Figure 4: Day and Overnight Visitor Percentages ................................................................................. 12 Figure 5: California Population Growth 2000-2017 .............................................................................. 14 Figure 6: California Travel Spending 2000-2016 ................................................................................... 15 Figure 7: Use of a Discount or Incentive on the Last Trip ..................................................................... 17 Figure 8A: Use of a Discount or Incentive on the Last Trip by Month of Visitation ............................. 17 Figure 8B: Use of a Discount or Incentive on the Last Trip (Day vs. Overnight Visitor) ........................ 18 Figure 9: Would you have visited without the incentive or promotion?.............................................. 18 Figure 10: Trip Satisfaction ................................................................................................................... 19 Figure 11: Level of Crowding Impacting Future Decision to Visit ......................................................... 20 Figure 12A: Would you consider visiting during a less crowded time? ................................................ 21 Figure 12B: Would you consider visiting during a less crowded time? (Day vs. Overnight Visitor) ..... 21 Figure 13: Would you support limits on the number of people that can visit? .................................... 22 Figure 14: Would you visit during a different time of year other than the peak summer season? ..... 22 Figure 15: City of Avalon Wastewater Flow (2015-2015 Millions of Gallons Per Day)……………………….23 Figure 16: Day Visitor Reduction Scenarios .......................................................................................... 26 Figure 17: Total Visitor Water Use Reduction Estimates ...................................................................... 27 Figure 18: Overall Visitor Demand for Catalina Island .......................................................................... 29 Figure 19: Avalon Temperatures ........................................................................................................... 30 Figure 20: Avalon Visibility (miles) ........................................................................................................ 30 Figure 21: Visitor Activity Participation (Summer vs. Fall %) ................................................................ 31 Tables Table 1: Overnight vs. Day Spending .................................................................................................... 12 Table 2: Trade-Off Analysis ................................................................................................................... 26 Table 3: Overnight Visitor Increase-Projected Cost Estimates ............................................................. 27 3.0
Catalina Island Chamber of Commerce & Visitors Bureau
3 | P a g e
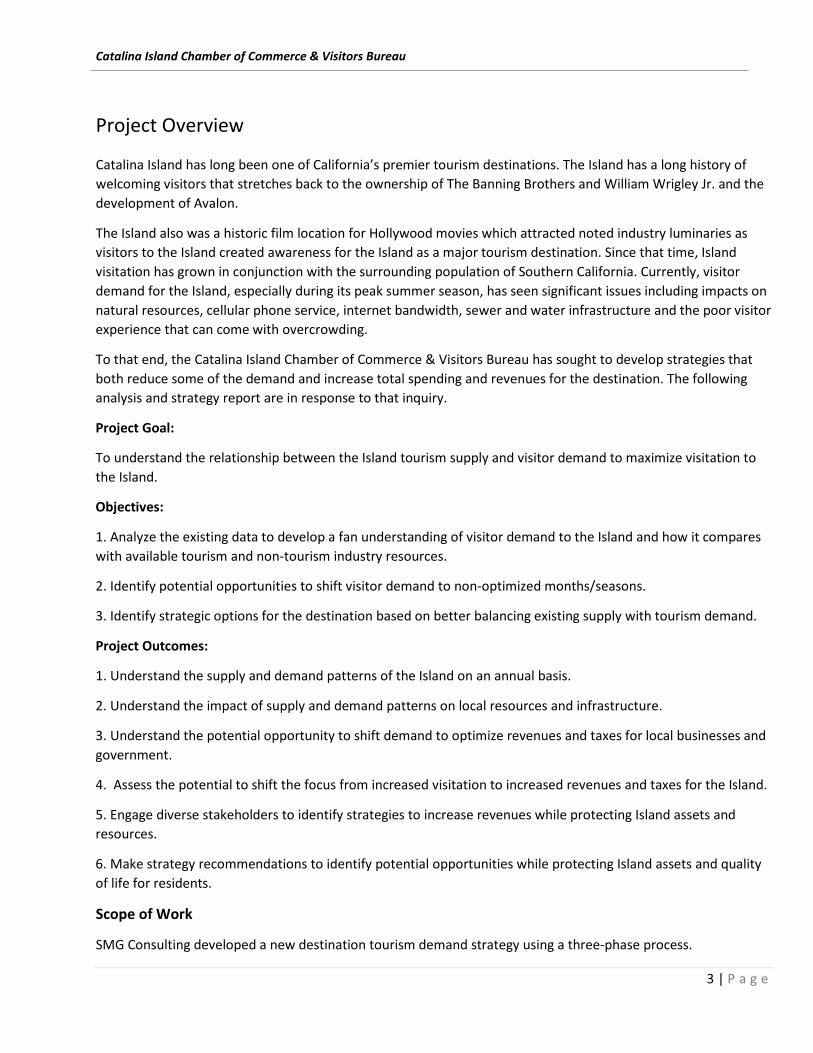
Project Overview Catalina Island has long been one of California’s premier tourism destinations. The Island has a long history of welcoming visitors that stretches back to the ownership of The Banning Brothers and William Wrigley Jr. and the development of Avalon.
The Island also was a historic film location for Hollywood movies which attracted noted industry luminaries as visitors to the Island created awareness for the Island as a major tourism destination. Since that time, Island visitation has grown in conjunction with the surrounding population of Southern California. Currently, visitor demand for the Island, especially during its peak summer season, has seen significant issues including impacts on natural resources, cellular phone service, internet bandwidth, sewer and water infrastructure and the poor visitor experience that can come with overcrowding.
To that end, the Catalina Island Chamber of Commerce & Visitors Bureau has sought to develop strategies that both reduce some of the demand and increase total spending and revenues for the destination. The following analysis and strategy report are in response to that inquiry.
Project Goal:
To understand the relationship between the Island tourism supply and visitor demand to maximize visitation to the Island.
Objectives:
1. Analyze the existing data to develop a fan understanding of visitor demand to the Island and how it compares with available tourism and non-tourism industry resources.
2. Identify potential opportunities to shift visitor demand to non-optimized months/seasons.
3. Identify strategic options for the destination based on better balancing existing supply with tourism demand.
Project Outcomes:
1. Understand the supply and demand patterns of the Island on an annual basis.
2. Understand the impact of supply and demand patterns on local resources and infrastructure.
3. Understand the potential opportunity to shift demand to optimize revenues and taxes for local businesses and government.
4. Assess the potential to shift the focus from increased visitation to increased revenues and taxes for the Island.
5. Engage diverse stakeholders to identify strategies to increase revenues while protecting Island assets and resources.
6. Make strategy recommendations to identify potential opportunities while protecting Island assets and quality of life for residents.
Scope of Work
SMG Consulting developed a new destination tourism demand strategy using a three-phase process.

Catalina Island Chamber of Commerce & Visitors Bureau
4 | P a g e
Catalina Island Tourism Demand Strategy Development Methodology
Phase 1: Data Collection
1.1 SMG reviewed a variety of data sources provided by the Chamber of Commerce and the City of Avalon including the following:
• Ferry data • Lodging occupancy • Visitor profile information • Visitor spending information • Boating and buoy use information • Current marketing programs • Visitor databases
1.2 On-site workshop/presentation
• SMG presented research information and received input from a cross-section of Catalina Island stakeholders including the following:
o Tourism/Transportation o Local government o Resource agencies o Others
1.3 Visitor survey
SMG conducted a primary research project using the organization's email database. Over 2,000 consumers responded to the survey and provided valuable consumer perspective to the project.
• Visitor survey using the organization's email database • Survey was designed to assess visitor perceptions of crowding issues during certain seasons and to test
the concept of limiting visitation during certain seasons. • Summary Report
Information Collection &
Analysis
StrategyDevelopment
Final Strategy Plan
Development

Catalina Island Chamber of Commerce & Visitors Bureau
5 | P a g e
Phase 2: Data /Information Analysis
2.1 Analyze and compare data sources
Once all of the data and information was collected, SMG Consulting analyzed the information to understand how the data fits together to provide a complete view of visitor demand for Catalina Island.
• Compare visitor demand with other data series o Compare with lodging capacity o Compare with non-tourism data including water use and sewer use
2.2 Identify potential opportunities
SMG then identified potential opportunities that would be the basis of a new tourism strategy designed to soften peak demand while also seeking to increase total visitor spending.
• Identify potential opportunities to invest tourism promotion resources in low demand times • Identify potential strategic opportunities to position Catalina Island as the first environmental
destination to effectively manage demand
Phase 3: Final Report Development
3.1 Final Report
• Develop a final report/presentation
The strategy development process was an inclusive, comprehensive approach that ensured all perspectives were understood and considered for a competitive strategy.
The SMG approach captured the following three interrelated critical elements necessary to develop a comprehensive strategic plan.
1. A macro dimension included a review of the dynamic change elements in which the industry currently functions. It asked the question, “What significant changes are occurring that are impacting the industry?” and “What opportunities and threats exist?”
2. Stakeholder viewpoint provided perspective and insight from those who might be impacted by the development of an a new visitor demand strategy.
3. Organizational view included perspective and insight from tourism and City staff regarding how the industry will impact the broader community.
This “3-Point” approach ensures that the strategic plan is inclusive and has ample perspective and input to achieve the goals of the project with buy-in from all the stakeholders affected.

Catalina Island Chamber of Commerce & Visitors Bureau
6 | P a g e
Regional Overview
Santa Catalina Island is located 22 miles South-Southwest of Los Angeles. Catalina Island is part of the Channel Islands archipelago. The eight Islands that make up the archipelago include two distinct groups: the Northern Channel Islands and the Southern Channel Islands. Catalina Island is one of the four Southern Channel Islands. Catalina Island is the only one of the eight Islands with a significant permanent civilian settlement—the city of Avalon and the unincorporated town of Two Harbors. The distance from Avalon to Two Harbors is 13.4 miles by boat and 23 miles by road. The Island is 21 miles and encompasses approximately 47,884 acres or approximately 76 square miles. The width is 8 miles at its widest point (Long Point), and a half mile wide at its narrowest point at Two Harbors at the Isthmus. The coastal perimeter is 54 miles. The highest elevations are Mt. Orizaba (2,097 feet) and Mount Black Jack (2,006 feet). The deepest water between Catalina Island and the mainland is approximately 3,000 feet or more than a 1/2 mile. Water temperature ranges from 64 to 73 degrees in the summer and 54 to 59 degrees in winter. Catalina Island is accessible by two passenger ferry services (Catalina Express and Catalina Flyer) that provide scheduled service with departures from four mainland communities:
• San Pedro • Long Beach • Dana Point • Newport Beach
Charter boat services are provided by a handful of carriers that will serve Avalon, Two Harbors and camps located along the Island’s coast. Private boaters moor or anchor primarily in Avalon Harbor and Two Harbors or along coves to the Island’s west end. Multiple cruise lines including Carnival, Princess and Holland America call on Avalon Harbor. Additionally, Helicopter service is also available with departures from Long Beach, San Pedro and The Orange County Airport. Additionally, Helicopter service is also available via Island Express Helicopters with departures from Long Beach, San Pedro, Burbank and the Orange County Airport, with other locations available by charter. Private planes use the Airport in the Sky located midway between Avalon and Two Harbors in the Island’s backcountry.

Catalina Island Chamber of Commerce & Visitors Bureau
7 | P a g e
Catalina Island Regional View
San Pedro
Two Harbors
Avalon

Catalina Island Chamber of Commerce & Visitors Bureau
8 | P a g e
Executive Summary
• It is estimated that Catalina Island receives approximately 885,000 visitors annually with approximately 350,000 overnight visitors and 530,000-day visitors.
• Catalina Island’s mix of day vs. overnight visitors are approximately 60%-day visitors vs. 40% overnight visitors.
• Overall visitation during peak visitor demand imposes significant impacts on the visitor experience, the
environment, and infrastructure.
• On a quarterly basis, the third quarter (July-September) is, as expected, makes up the largest percentage of visitors to the Island. Visitation during the third quarter accounts for 34%, followed by the second quarter (April- June) 26%, the fourth quarter (October-December) 21%, and the first quarter (January-March) 17%.
• One of the biggest challenges now facing many tourism destinations, like Catalina Island, is too much
tourism during certain parts of the year. As a result, hotels and vacation rentals have become expensive on weekends and crowding has reached levels that impact residents. Both threaten to become political issues.
• To gain insight from Catalina Island visitors, SMG Consulting implemented an email survey of those that
had contacted the Catalina Island Chamber of Commerce & Visitors Bureau and had placed themselves on a database to receive ongoing information. The overall trip satisfaction was very high, but the data also suggests that, to a certain percentage of visitors, crowding was an issue. To this segment, crowding was more significant than expected and could impact future visitation; they would be interested in visiting during a less crowded time. Additionally, those who had visited indicated they would support limiting the number of visitors to the destination to reduce potential negative impacts on the Island.
• Many destinations like Catalina Island are also looking to modify their demand curve and create additional demand during the nonpeak season. These efforts can be seen in a variety of marketing approaches such as value season promotions or new special events.
• Given the current situation, officials and stakeholders have an important strategic decision to consider: either continue the existing demand pattern or modify, it by slowing and or reducing peak summer demand, by developing demand during other times of the years when infrastructure would be less stressed and the visitor experience more enjoyable.
• In developing a new strategy for Catalina Island, the central concept is to “broaden demand” for the Island. The idea is based on the need to expand the demand during non-peak season to other times of the year while increasing overall revenue to stakeholders.

Catalina Island Chamber of Commerce & Visitors Bureau
9 | P a g e
Situation Analysis A. Overall Demand Patterns It is estimated that Catalina Island receives approximately 885,000 visitors annually with approximately 350,000 overnight visitors and 530,000-day visitors. Figure 1 below outlines the overall annual demand pattern of those visitors.
Figure 1: Catalina Island Overnight, Day Vs. Total Arrivals
Source: Catalina Island Chamber of Commerce & Visitors Bureau and SMG Consulting
One of the challenges with such a pronounced demand pattern is the challenge for the local workforce to work multiple jobs during the high season to compensate for less income during the slower season. According to the Southern California Association of Governments there are approximately 2,269 jobs in the city of Avalon. The percentage of leisure employment accounts for 33% of total jobs in 2015.1 This also creates workforce housing challenges conflicting those that are in need of seasonal housing versus those that are year-round employees.
Catalina Island’s mix of Day vs. Overnight visitors are approximately 60% day visitors vs. 40% overnight visitors. As Figure 2 on the following page illustrates, the percentage of day visitors reaches well above that average during May through August, the peak time for visitor demand.
From a tourism perspective several challenges exist with a visitor mix so heavily oriented to day visitation. While these visitors provide spending on ferry fees and retail sales, day visitors do not
1 SCAG Profile of the City of Avalon, Local Profile Report 2017.
17,69221,970
30,733 29,182 30,48034,762
39,083 38,32733,421 31,110
24,762 20,903
34,202
56,578
67,051 68,24874,696
90,768
114,727109,211
78,112 78,234
61,490
51,109
16,510
34,608 36,318 39,06644,216
56,006
75,64470,884
44,691 47,124
36,72830,206
0
20,000
40,000
60,000
80,000
100,000
120,000
140,000
Jan Feb March April May June July Aug Sept Oct Nov Dec
Overnight Total Arrivals Day Visitors
Catalina Island Chamber of Commerce & Visitors Bureau
10 | P a g e
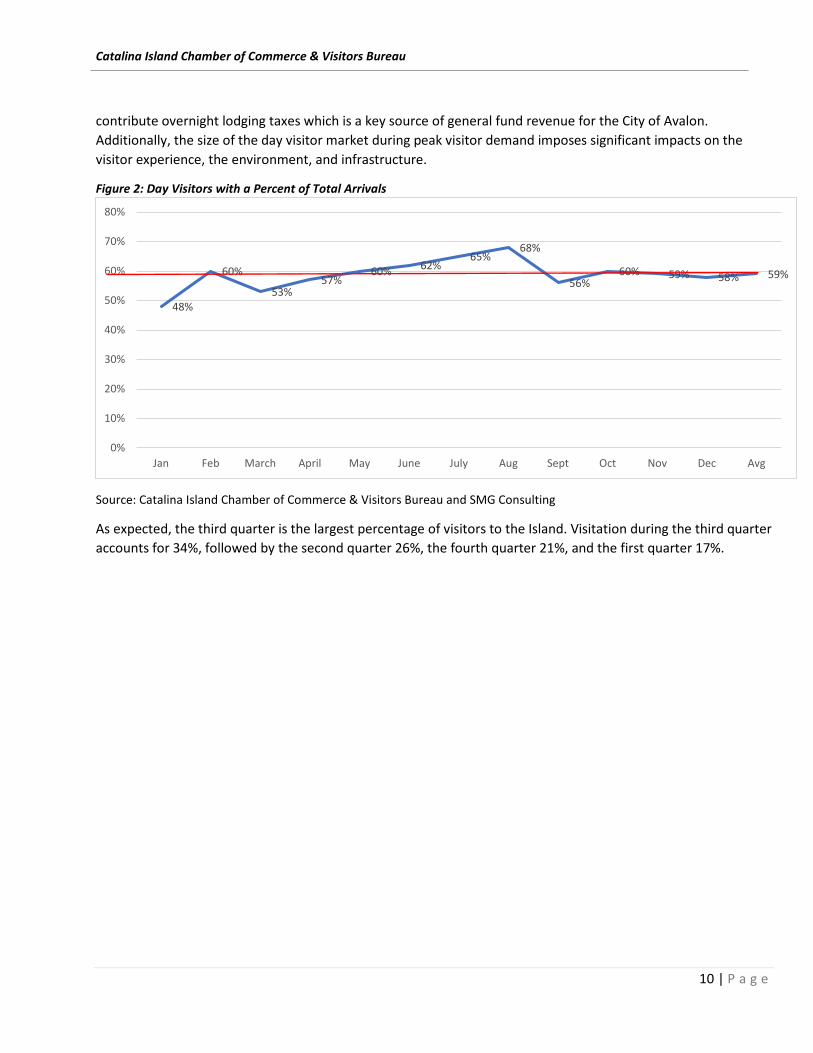
contribute overnight lodging taxes which is a key source of general fund revenue for the City of Avalon. Additionally, the size of the day visitor market during peak visitor demand imposes significant impacts on the visitor experience, the environment, and infrastructure.
Figure 2: Day Visitors with a Percent of Total Arrivals
Source: Catalina Island Chamber of Commerce & Visitors Bureau and SMG Consulting
As expected, the third quarter is the largest percentage of visitors to the Island. Visitation during the third quarter accounts for 34%, followed by the second quarter 26%, the fourth quarter 21%, and the first quarter 17%.
48%
60%
53%57%
60% 62%65%
68%
56%60% 59% 58% 59%
0%
10%
20%
30%
40%
50%
60%
70%
80%
Jan Feb March April May June July Aug Sept Oct Nov Dec Avg

Catalina Island Chamber of Commerce & Visitors Bureau
11 | P a g e
Figure 3A: Catalina Island Visitor Demand Seasonality
Source: Catalina Island Chamber of Commerce & Visitors Bureau and SMG Consulting
In terms of seasonality, day visitors when compared with overnight visitors, have a higher percentage of visits during the summer season (Quarter 3).
Figure 3B: Catalina Island Visitor Demand Seasonality (Day and Overnight Visitors)
Source: Catalina Island Chamber of Commerce & Visitors Bureau and SMG Consulting
17%
26%
34%
21%
Jan-March April-June July-Sept Oct-Dec
16%
26%
36%
21%20%
27%
31%
22%
0%
5%
10%
15%
20%
25%
30%
35%
40%
Quarter 1 Quarter 2 Quarter 3 Quarter 4
Day Visitors Overnight Visitors

Catalina Island Chamber of Commerce & Visitors Bureau
12 | P a g e
B. Travel Spending Overnight visitor spending, per capita, is almost three times greater than day visitors as seen below in Table 1. Table 1: Overnight vs. Day Spending
Segment Number Length of Stay
Per Capita Spending
Total Spending
Overnight Visitors 352,425 2.2 $163.16 $126,503,000 Day Visitors 532,001 <1 $82.18 $43,719,842 Source: Catalina Island Chamber of Commerce & Visitors Bureau and SMG Consulting
From a macro view, day visitors represent 60% of visitors and 26% of travel spending, contrasted with overnight visitors who represent 40% of visitors and 60% of total travel spending.
Figure 4: Day and Overnight Visitor Percentages
Source: Catalina Island Chamber of Commerce & Visitors Bureau and SMG Consulting
Table 1 and Figure 4 illustrate the value of overnight visitors on per capita as well as the overall economic value of the destination. This represents a significant future opportunity.
60%
40%
26%
74%
0%
10%
20%
30%
40%
50%
60%
70%
80%
Day Visitor Overnight Visitor
% Of Visitors % of Revenue

Catalina Island Chamber of Commerce & Visitors Bureau
13 | P a g e
Overtourism One of the biggest challenges now facing many tourism destinations, like Catalina Island, is too much tourism during certain parts of the year. With the recession a decade ago, tourism levels dropped in just about every destination. Ten years later tourism levels, across many destinations in California, have seen significant increases--not only in visitors but also in travel spending.
As a result, hotel rooms have become expensive on weekends and crowding has reached levels that impact residents. Both threaten to become political issues.
What is Overtourism?
Overtourism started in Europe when visitors overwhelmed places like Venice, Barcelona, Paris, London, Prague, Berlin, and Rome. The phenomenon is the opposite of Responsible Tourism.
“Overtourism describes destinations where hosts or guests, locals or visitors, feel that there are too many visitors and that the quality of life in the area or the quality of the experience has deteriorated unacceptably. It is the opposite of Responsible Tourism which is about using tourism to make better places to live in and better places to visit. Often both visitors and guests experience the deterioration concurrently.”2
SMG Consulting has reviewed tourism destinations throughout California. Almost all are experiencing extreme crowding and congestion on the weekends and, in many cases, mid-week too.
The Causes
There are several causes that have impacted Catalina Island tourism including economic, technology and social dynamics that have converged creating the current situation.
Strong Economy
From a political perspective, much has been made about a slow economic recovery, but viewed from a tourism perspective, the economy has been very strong which serves as an important backdrop to stimulating travel. All key economic indicators at both the national and state level have been positive including unemployment, personal income growth, and inflation. This coupled with low gas prices and improved consumer confidence has enabled consumers to travel more.
Proximity to Markets
Catalina Island, like many destinations in California, is within proximity to major populations. The urbanization and the resulting population increase in San Diego, Los Angeles/Orange County, have become the primary market areas for Catalina Island and provide an ample supply of population (and potential visitors). These markets are within a short proximity to the Island and have a consistent weekend visitation demand pattern. As the population has grown in these markets, so too, has weekend demand. Naturally, without a corresponding increase in infrastructure, the result is a strong over-demand during weekends and high demand seasonal travel.
2 Responsible Tourism Partnership.com

Catalina Island Chamber of Commerce & Visitors Bureau
14 | P a g e
Technology
The second element that has facilitated the surge in tourism is the relentless, transformative impact of technology. Emerging and existing digital technologies, like Expedia, Trivago, Travelocity, and others are changing the way visitors travel and engage a destination. Comparing prices and shopping for the best value has never been easier. A newer entrant in the online booking system are vacation rental properties. Airbnb has become the biggest provider in that category and offers consumer lodging choices they did not have just five years ago.
Social and Demographic Changes
Maybe one of the biggest and least recognized factors that has spurred growth in travel is the increase in California’s population. The population has grown significantly to approximately 40 million people, up from 37 Million people in 2010, and 34 million at the turn of the century. By 2025 44 million people are expected to live in California.
Figure 5: California Population Growth and Forecast 2000-2030
Source: State of California Department of Finance
From a revenue standpoint, this dramatic increase has had positive results within California’s entire tourism industry. As Figure 6 illustrates, travel spending within the state has increased significantly during the 2000-2016 timeframe, from $81B to $126B. This is an increase of 56%.
33.8
37.239.5
42.444
0
5
10
15
20
25
30
35
40
45
50
2000 2010 2017 2025 2030
Forecast

Catalina Island Chamber of Commerce & Visitors Bureau
15 | P a g e
Figure 6: California Travel Spending 2000-2016
Source: Visit California
Growth in travel spending has also fueled growth in industry employment to just shy of 1.1M jobs and tax revenue of $17.1B.3 Not all of California's growth in travel spending, employment and taxes is a result of population growth. Still, Visit California estimates this figure to be approximately 74%.4 It is assumed that as the population has grown, so too, has travel spending, but this also has had related negative travel impacts.
Implications
Perhaps the biggest implication of overtourism for Catalina Island is the diminishing resources for visitors and locals alike be it parks, beaches, and hiking and bike trails resulting in impacts to the environment and on sewer and water infrastructure. These can all become subject to intense use diminishing the experience for everyone.
3 California Travel Impacts by County, 1992-2016. 4 Visit California, “California Tourism Facts and Figures.”
81
100.3
126.3
0
20
40
60
80
100
120
140
2000 2010 2016

Catalina Island Chamber of Commerce & Visitors Bureau
16 | P a g e
Consumer Perspectives on Catalina Island To gain insight from Catalina Island visitors, SMG Consulting implemented an email survey of those that had contacted the Catalina Island Chamber of Commerce & Visitors Bureau and had placed themselves on a database. The database was sent an online survey with an incentive and a total of 2,189 surveys were completed. The following are highlights from that survey related to the use of discounts and incentives, overall trip satisfaction and crowding issues. The full results of the study are available in a separate document. Results Overview
• Fully 48% of those surveyed indicated they had visited the Island in the past three years. • Of those that had visited, 61% indicated they had taken an overnight trip5. • 41% indicated their last trip was during the mid-week, 34% indicated their last trip was during the
weekend, and 24% indicated their last trip included both weekend and mid-week days. • Survey results indicated there was a significant use of incentives especially for day visitors and were used
during peak demand times. The results also indicated that the use of discounts and incentives were only influential in a decision to visit. 17% indicated they definitely would not have visited without that incentive.
• The overall trip satisfaction was very high, but the data also suggests that, to a certain percentage of visitors, crowding was an issue. To this segment, crowding was more significant than expected and could impact future visitation; they would be interested in visiting during a less crowded time. Additionally, those surveyed who visited indicated they would support limiting the number of visitors to the destination to reduce potential negative impacts on the Island.
• Most interesting, and offering a significant opportunity to the tourism industry, was the considerable interest in visiting the Island during a different time of the year outside the peak summer season.
These overall results suggest there is the potential to attract visitors to visit during a different time of the year. Given proper programming, communication and product offering, the tourism industry should be able to begin to build a different visitation pattern.
5 This percentage indicates that those on the Catalina Island Chamber of Commerce & Visitors Bureau mailing list were more likely in overnight visitation.

Catalina Island Chamber of Commerce & Visitors Bureau
17 | P a g e
Use of Incentives Overall, 33% of those surveyed indicated they used a discount or an incentive to visit on their last trip. Figure 7: Use of a discount or incentive on the last trip
Source: SMG Consulting Discounts were most frequently used during the summer season which is the period of highest demand. Figure 8A: Use of a discount or incentive on the last trip by month of visitation
Source: SMG Consulting
29.20%
41.00%
70.70%
59.40%
0.00%
10.00%
20.00%
30.00%
40.00%
50.00%
60.00%
70.00%
80.00%
Overnight Day
Yes No
54% 55%
46%
64%69%
66%70% 71% 69%
64%
55%
68%62%
0%
10%
20%
30%
40%
50%
60%
70%
80%
Jan Feb March April May June July Aug Sept Oct Nov Dec AVG.
Day visitors are more likely to use a discount.

Catalina Island Chamber of Commerce & Visitors Bureau
18 | P a g e
Day visitors were much more likely to use a discount or incentive on their last trip. Figure 8B: Use of a discount or incentive on the last trip by month of visitation
Source: SMG Consulting Of those that did receive a discount or incentive, 47% indicated they would have visited anyway; only 17% indicated they would definitely not have visited without the discount or incentive. Figure 9: Would you have visited the Island on that trip if you were not given the incentive or promotion?
Source: SMG Consulting
29.20%
41.00%
70.70%
59.40%
0.00%
10.00%
20.00%
30.00%
40.00%
50.00%
60.00%
70.00%
80.00%
Overnight Day
Yes No
25.7%
22.0%
19.2%
16.1%
16.9%
0.0% 5.0% 10.0% 15.0% 20.0% 25.0% 30.0%
Definitely
Probably
Maybe
Not Sure
Definitely Not
A high percentage of visitors indicated they would have visited the Island without an incentive. 17% indicated they would definitely not.

Catalina Island Chamber of Commerce & Visitors Bureau
19 | P a g e
Trip Satisfaction Overall trip satisfaction was very high with 94% of those surveyed indicating they had an excellent/very good time. Figure 10: Trip Satisfaction
Source: SMG Consulting
58%
36%
5%
1%
0% 10% 20% 30% 40% 50% 60% 70%
Excellent
Very Good
Average
Below Average
Poor
94% indicated their trip was Excellent/Very Good.

Catalina Island Chamber of Commerce & Visitors Bureau
20 | P a g e
Crowding The survey asked a number of questions related to crowding that provide some insight. Despite the fact that a significant percentage of visitors expressed a high level of satisfaction, crowding issues did resonate with visitors to the Island. Of those who had visited the Island, approximately 10% indicated that the level of crowding they experienced exceeded their expectations for the trip. See Figure 11 below. Figure 11: Level of crowding impacting future decision to visit
Source: SMG Consulting
10.1%
84.0%
5.8%
0.0% 10.0% 20.0% 30.0% 40.0% 50.0% 60.0% 70.0% 80.0% 90.0%
Yes
No
Don’t Know

Catalina Island Chamber of Commerce & Visitors Bureau
21 | P a g e
Twenty-seven percent of those who visited indicated they would consider visiting the Island during a less crowded time. Figure 12A: Would you consider visiting during a less crowded time?
Source: SMG Consulting Approximately 25-30% would consider visiting during a different time of year with overnight visitors more likely to do so. Figure 12B: Would you consider visiting during a less crowded time (Day vs. Overnight Visitor)
Source: SMG Consulting
27.7%
65.1%
7.0%
0.0% 10.0% 20.0% 30.0% 40.0% 50.0% 60.0% 70.0%
Yes
No
Don’t Know
30%24.50%
63.40%68%
6.70% 7.30%
0%
10%
20%
30%
40%
50%
60%
70%
80%
Overnight Day
Yes No Don’t Know

Catalina Island Chamber of Commerce & Visitors Bureau
22 | P a g e
Interestingly, those that visited showed significant support for limiting the number of visitors that can visit the Island at one time. Figure 13: Given potential negative impacts, would you support limits on the number of people that can visit the Island at one time?
Source: SMG Consulting Fully 90% of those that visited the Island indicated they would be interested in visiting Catalina Island during a different time of the year. Figure 14: Interested in visiting Catalina Island during a different time of year other than the peak summer season?
Source: SMG Consulting
21.4%
25.7%
20.4%
18.3%
14.0%
0.0% 5.0% 10.0% 15.0% 20.0% 25.0% 30.0%
Definitely yes
Probably
Maybe
Not Sure
Definitely Not
89.5%
3.4%
7.1%
0.0% 10.0% 20.0% 30.0% 40.0% 50.0% 60.0% 70.0% 80.0% 90.0% 100.0%
Yes
No
Don't Know

Catalina Island Chamber of Commerce & Visitors Bureau
23 | P a g e
Island Impacts
In terms of environmental impact, there are a variety of indicators that can measure impact on the resources and infrastructure. As a proxy measure the City of Avalon waste water flows provide insight into the magnitude of impact on resources. The Avalon Waste Water treatment facility currently has a capacity of 1.2 million of gallons per day. The figure below illustrates the volume and seasonality of waste water treatment.
Figure 15: City of Avalon Wastewater Flow (2015-2015 Millions of Gallons Per Day)
Source: City of Avalon In the figure above, it is clear wastewater use follows the demand pattern of visitation to the Island with use peaking during the summer season. It is also evident demand is significantly higher in the peak season compared to winter months. August which is the peak month the system used approximately 636,000 gallons per day.
Shifting visitor demand away from peak summer seasons would ease the impact on the system and transfer wastewater use to other times of the year with less demand on the system. The peak demand also illustrates the strain on drinking water use which currently relies on reservoirs. To help alleviate this issue the most recent Southern California Edison Feasibility Study for a Desalinization Treatment Systems has outlined a recommended course of action that would reduce reliance on water collection reservoirs6. This development would provide a more sustainable source of water for the Island
6 Southern California Edison Catalina Desalination Feasibility Study 2017
0.53
0.47
0.380.36
0.340.36
0.32 0.320.36
0.38 0.380.42
0.550.51
0.460.43
0.390.36
0
0.1
0.2
0.3
0.4
0.5
0.6
Aug Sept Oct Nov Dec Jan2015
Feb March April May June July Aug Sept Oct Nov Dec
Average Day = .41
Minimum Day = .22
Maximum Day = .68

Catalina Island Chamber of Commerce & Visitors Bureau
24 | P a g e
Catalina Island Strategy Development
Throughout California, there is a consistent demand curve that is very similar in most destinations with visitation peaking during the summer months with fall as the second season of visitation. Typically, coastal destinations have lower occupancy during the first quarter, starts to increase during the spring and peaks during the summer season. From that perspective, Catalina Island has a classic coastal destination demand curve. Many destinations, like Catalina Island, are also looking to modify their demand curve and create additional demand during nonpeak seasons. These efforts can be seen in a variety of marketing approaches such as value season promotions or new special events. The proposed strategy seeks to attract core and non-core visitors to the destination during a different time of year for a different set of reasons thus providing a new experience.
Markets
New Existing Visitors Visitors
Non-Peak Season Proposed
Seasons
Peak Season Current Current
Source: SMG Consulting
In the case of Catalina Island, the peak summer season activities are dominated by beach and water based activities and recreation. As the weather changes during the fall and winter seasons, a different set of activities are available to attract existing or new visitors with land-based activities. Additionally, Catalina Island can augment the existing activities with special events etc. to draw attention and focus to that time of the year. It’s also important to note that the development of demand during non-peak times of year does not happen quickly but may, in fact, take two to five years. As such, expectations must be realistic. Strategic Decision Given the current situation, officials and stakeholders have an important strategic decision to consider: continue the existing demand pattern or modify it by slowing and/or reducing peak summer demand by developing demand during other times of the year when infrastructure would be less stressed and the visitor experience more enjoyable. Is the current demand pattern sustainable over the medium and long-term? Or should resources and efforts be channeled to develop alternative times of the year to increase tourism?

Catalina Island Chamber of Commerce & Visitors Bureau
25 | P a g e
The figure below simply illustrates the strategic decision options that are available. One option is to maintain the current course of activities and marketing efforts. This option assumes that infrastructure changes will be made to adapt to the continued peak season demand. It assumes the current visitor experience will continue to be positive and resources will be maintained. This option also assumes that the demand pattern continues, infrastructure changes will not be made, the visitor experience will diminish, and resources will not be supported. Option 1= Best Option Option 3=Least Preferred Option Catalina Island Decision Options
The second option assumes the demand pattern is not sustainable and is modified. It also assumes that there will be minimal or no changes to infrastructure, and it also implies the visitor experience will be improved by shifting demand and lessening crowding during peak times. Resources are maintained. Without the benefit of extensive feasibility studies, changing demand to the new non-peak season would be less costly than new infrastructure while, at the same time, improving the visitor experience.
Catalina Island Tourism
Current demand pattern and marketing investment continues
Assumes infrastructure changes will be made
to adapt
Option 3Assumes visitor expereince
improves and resources maintained.
Assumes infrastructure changes will not be
made
Option 2Assumes visitor experience
and resourcesdiminishes
Current demand pattern is modified and
marketing investment shifts to build new
demand
Assumes there will be minimal /no
infrastructure changes.
Option 1Assumes visitor expereince improves and resources are
protected.

Catalina Island Chamber of Commerce & Visitors Bureau
26 | P a g e
Figure 16: Day Visitor Reduction Scenarios
Source: SMG Consulting
What would this kind of trade-off look like from a revenue perspective? To get a better understanding of what this type of tradeoff could look like, Figure 16 looks at a theoretical reduction in day visitor volumes ranging from 10% -20%. As can be seen, the overall demand is lessened, and as a result, consideration is given on how to make up that lost revenue during another part of the year. One summary of trade-offs would look like this:
1. To reduce day visitors, 10% will require a gain of 3.2% Overnight Visitors. 2. To reduce day visitors, 15% will require a gain of 4.7% Overnight Visitors. 3. To reduce day visitors, 20% will require a gain of 6.3% Overnight Visitors.
As the table below illustrates, there is a clear revenue opportunity to make up lost revenue if peak summer visitors decline. In this example, the lost revenue from day visitors, during the summer, can be made up during other parts of the year. Table 2: Trade-off Analysis
Day Visitors 531,001 Overnight Visitor 352,425Percent Reduction 10% 15% 20% Percent Increase 3.30% 5.00% 6.30%Visitor Reduction 53,100 79,650 106,200 Visitor Increase 11,858 17,787 23,716Perc Capita/Per day $82.18 $82.18 $82.18 Per Capita/Per Day $368.00 $368.00 $368.00Revenue Loss $4,363,766 $6,545,649 $8,727,532 Revenue Gain $4,363,744 $6,545,616 $8,727,488
Source: SMG Consulting
16,510
34,608 36,31839,066
44,216
56,004
75,64470,884
44,69147,124
36,728
30,206
16,510
34,608 36,31839,066 39,794
50,404
68,08063,796
40,222
47,124
36,728
30,206
16,510
34,608 36,31839,066 37,584
47,603
64,29760,251
37,987
47,124
36,728
30,206
16,510
34,608 36,31839,066
35,373
44,803
60,51556,707
35,753
47,124
36,728
30,206
0
10,000
20,000
30,000
40,000
50,000
60,000
70,000
80,000
Jan Feb March April May June July Aug Sept Oct Nov Dec
Baseline 10% Reduction 15% Reduction 20% Reduction

Catalina Island Chamber of Commerce & Visitors Bureau
27 | P a g e
To get some level of understanding of what it would take from a marketing perspective, SMG has developed the following estimate. This situation assumes that visitor bureau marketing efforts including programming, special events, communications, etc. can be channeled to increase demand during nonpeak season times. This table assumes that to generate approximately 11,858 new visitors, The Catalina Island Chamber of Commerce & Visitors Bureau will have to generate approximately 48,000 new website users. Of which, we estimate the organization will influence 10% who will visit. Additional estimates are provided to illustrate the full potential of new marketing investment. This illustrates there is a distinct connection between increasing demand and the potential that new demand can generate. Table 3: Overnight Visitor Increase-Projected Cost Estimates
Source: SMG Consulting
This example only illustrates at a conceptual level what trade-offs could look like and what other tradeoffs could be considered including the reduction of either/or both day and overnight visitors during the peak summer season and a corresponding increase of the same during other seasons. As might be expected a reduction in peak season visitors would also have a reduction in peak season use of water. The figure below is an illustrative example of what water use reduction might look like if total visitation were reduced by 10-20%. Figure 17: Total Visitor Water Use Reduction Estimates (Peak Season)
Source: SMG Consulting
432,000384,000384,000
432,000456,000456,000
504,000
660,000612,000
552,000516,000
468,000
0
100,000
200,000
300,000
400,000
500,000
600,000
700,000
Jan Feb March April May June July Aug Sept Oct Nov Dec
Baseline 10%Reduction 15% Reduction 20% Reductions
Number of People 11,858 17,787 23,716Party size 2.2 2.2 2.2Parties Booked 5,390 8,085 10,780Website Influence % Estimated 10% 10% 10%Incremental Website Traffic Needed 48,510 72,765 97,020
Catalina Island Chamber of Commerce & Visitors Bureau
28 | P a g e
Developing a New Strategy
In developing a new strategy for Catalina Island, the central concept is to “broaden demand” for the Island. The idea is based on the need to expand the demand during non-peak season to other times of the year while increasing overall revenue to stakeholders. New Season Strategy Objectives Build a new demand model that achieves a number of objectives including the following: 1. Reduce visitor demand to Catalina Island during peak times.
2. Develop a strategy that increases overall revenues and taxes for the Island stakeholders.
3. Balance protection of natural resources and infrastructure with a tourism economy. Conceptual Strategy Design
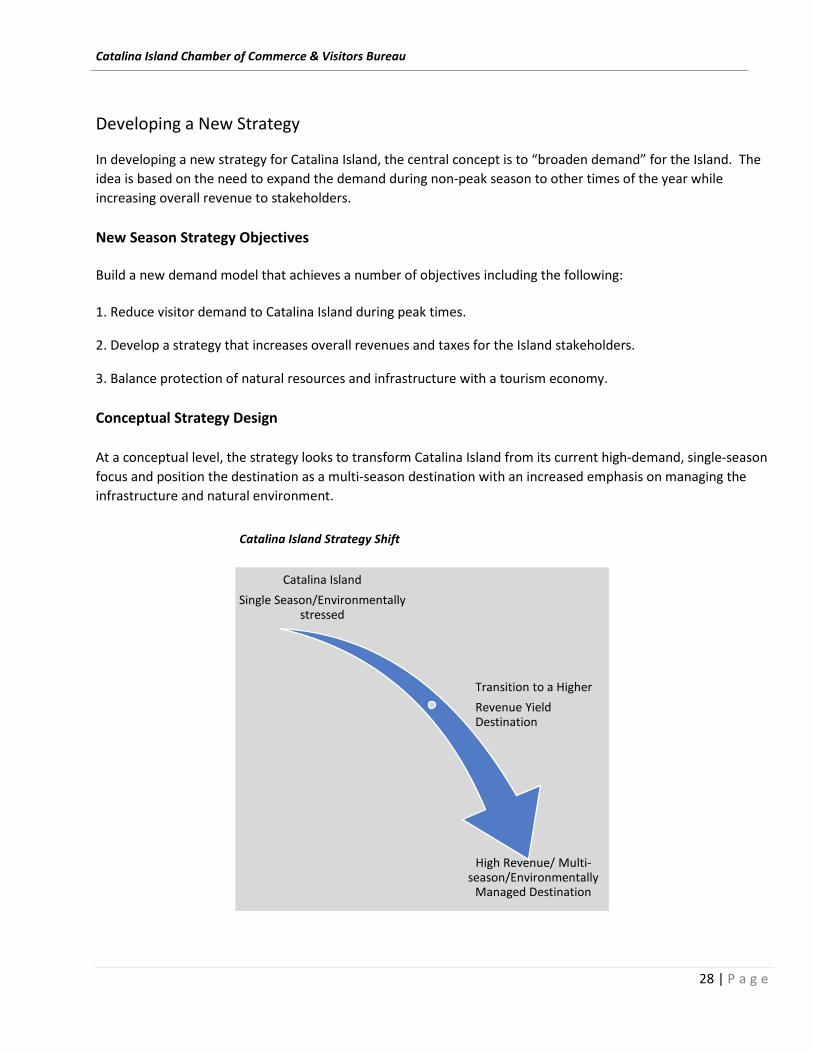
At a conceptual level, the strategy looks to transform Catalina Island from its current high-demand, single-season focus and position the destination as a multi-season destination with an increased emphasis on managing the infrastructure and natural environment.
Catalina Island Strategy Shift
Catalina IslandSingle Season/Environmentally
stressed
Transition to a HigherRevenue Yield Destination
High Revenue/ Multi-season/Environmentally
Managed Destination
Catalina Island Chamber of Commerce & Visitors Bureau
29 | P a g e
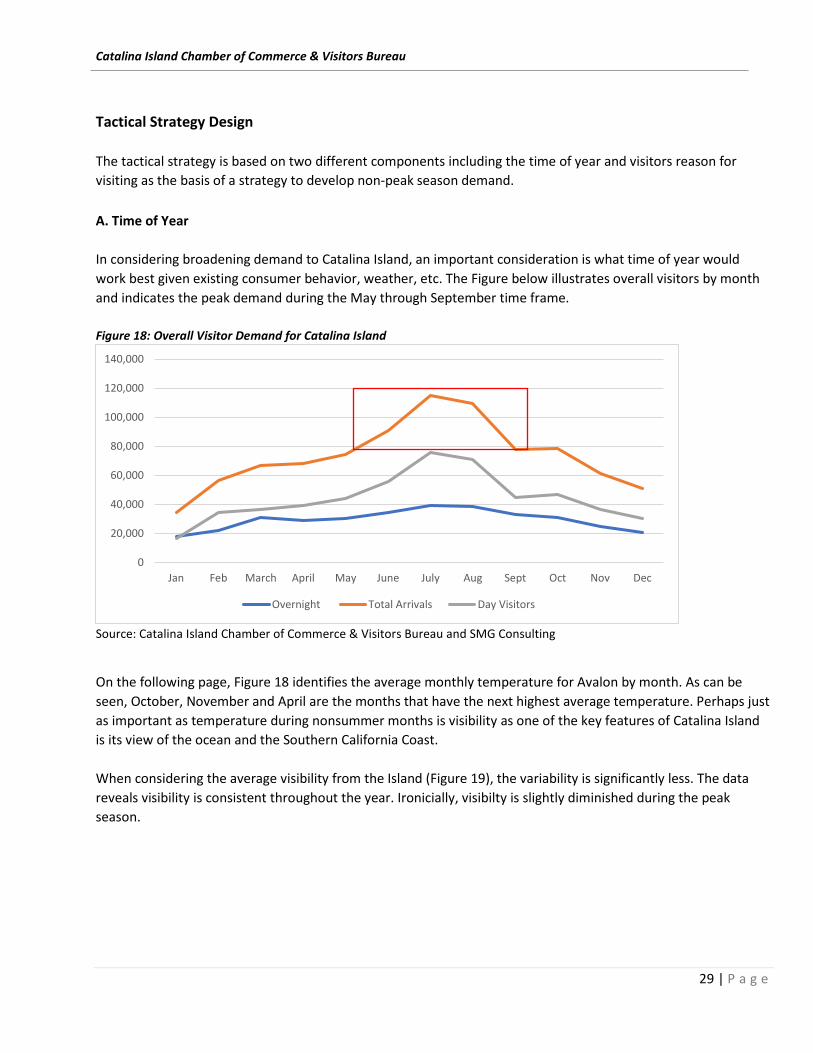
Tactical Strategy Design The tactical strategy is based on two different components including the time of year and visitors reason for visiting as the basis of a strategy to develop non-peak season demand.
A. Time of Year
In considering broadening demand to Catalina Island, an important consideration is what time of year would work best given existing consumer behavior, weather, etc. The Figure below illustrates overall visitors by month and indicates the peak demand during the May through September time frame. Figure 18: Overall Visitor Demand for Catalina Island
Source: Catalina Island Chamber of Commerce & Visitors Bureau and SMG Consulting
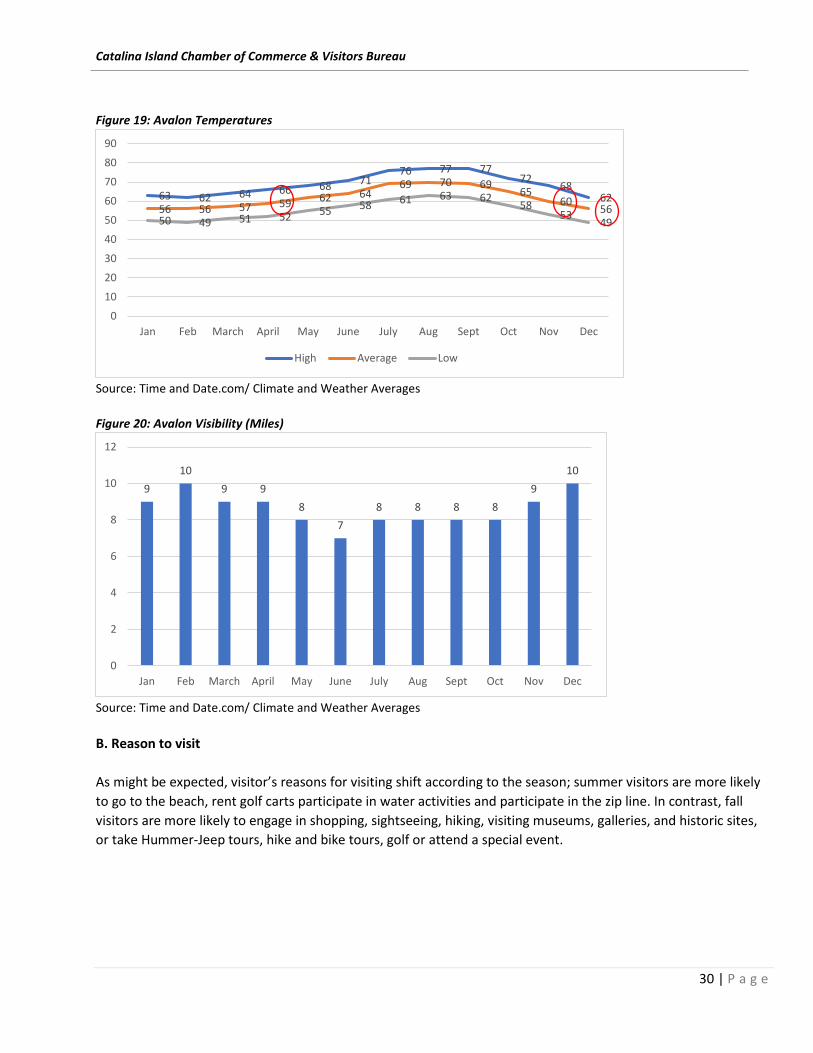
On the following page, Figure 18 identifies the average monthly temperature for Avalon by month. As can be seen, October, November and April are the months that have the next highest average temperature. Perhaps just as important as temperature during nonsummer months is visibility as one of the key features of Catalina Island is its view of the ocean and the Southern California Coast. When considering the average visibility from the Island (Figure 19), the variability is significantly less. The data reveals visibility is consistent throughout the year. Ironicially, visibilty is slightly diminished during the peak season.
0
20,000
40,000
60,000
80,000
100,000
120,000
140,000
Jan Feb March April May June July Aug Sept Oct Nov Dec
Overnight Total Arrivals Day Visitors
Catalina Island Chamber of Commerce & Visitors Bureau
30 | P a g e
Figure 19: Avalon Temperatures
Source: Time and Date.com/ Climate and Weather Averages Figure 20: Avalon Visibility (Miles)
Source: Time and Date.com/ Climate and Weather Averages B. Reason to visit As might be expected, visitor’s reasons for visiting shift according to the season; summer visitors are more likely to go to the beach, rent golf carts participate in water activities and participate in the zip line. In contrast, fall visitors are more likely to engage in shopping, sightseeing, hiking, visiting museums, galleries, and historic sites, or take Hummer-Jeep tours, hike and bike tours, golf or attend a special event.
63 62 64 66 68 7176 77 77
7268
6256 56 57 59 62 64
69 70 6965
6056
50 49 51 52 55 58 61 63 6258
5349
0
10
20
30
40
50
60
70
80
90
Jan Feb March April May June July Aug Sept Oct Nov Dec
High Average Low
910
9 98
78 8 8 8
910
0
2
4
6
8
10
12
Jan Feb March April May June July Aug Sept Oct Nov Dec

Catalina Island Chamber of Commerce & Visitors Bureau
31 | P a g e
Figure 21: Visitor Activity Participation (Summer vs. Fall %)
Source: Profile of Catalina Island Visitors 2016
It is these differences in activity participation that can serve as the basis of building a strategy designed to attract visitors during non-peak season. With the asset base and range of available activities, stakeholders can develop marketing approaches to create visitation during non-peak times.
78.7
46.5
40.6
47
38.1
23.8
24.3
15.3
10.9
12.4
13.9
11.4
8.9
5
6.4
3
2
1.5
0.5
0.5
24.3
77
54.5
46.5
31.5
29
24
10.5
18.5
13.5
14.5
13
6
10
6
3
2
3
1.5
2
0.5
0
25
0 10 20 30 40 50 60 70 80 90
Eat in Restaurants
Shopping
Sightseeing
Go to beach
Gold Cart Rental
Just visit/Socialize
Water activities
Hiking
Art Musuem/Gallery
See historic or architectural sites
Walking Tour
Zip Lining
Hummer Jeep Tour
Biking/Bike tour
Parasailing
Camping
Golfing
Fishing
Attend a Special event/concert
Segway
Helicoptering/touring
Other activities
Fall Summer
Catalina Island Chamber of Commerce & Visitors Bureau
32 | P a g e
Action Steps Action steps include those to be taken during the existing peak season as well as those needed to develop non-peak tourism demand. Existing Peak Season 1. Reduce discounts and promotions-Work to reduce the discounts and promotions targeted to generate
visitation during the peak season. Educate private sector stakeholders that discounting during the peak season may not be cost-effective and may erode the price value perception of the destination.
2. Eliminate summer advertising- Eliminate hard dollar advertising expenditures that target visitation during the summer season. Utilize noncash alternatives like social media to maintain a marketing presence in target markets.
3. Redirect Catalina Island Chamber of Commerce & Visitors Bureau marketing funds-Redirect existing organization marketing funds to promote non- peak season visitation.
4. Manage visitor expectations- Both public and private sector organizations should make potential summer visitors aware of the potential crowding issues that may diminish the experience.
5. Suggestive selling- Suggest to potential visitors, through marketing, that they may want to consider shifting their trip to other times of the year for favorable pricing, fewer crowds and interesting activities and events.
6. Destination Visitors-Target audiences outside of the Los Angeles DMA who will stay longer and spend more than the day visitors that are so close to home. Work with air carriers that have similar mid-week demand objectives.
7. Demand Based Pricing- Transport and lodging segements of the industry should look to implement demand based pricing models as a way to manage different demand levels. Demand-based pricing is any pricing method that uses consumer demand – based on perceived value – as the central element in developing prices for goods and services. This method of pricing has been implemented for years in the travel industry by airlines, lodging, car rentals etc. Peak season, peak days and peak times should be considered for pricing differentials so as to better manage the demand during those times. As a starting point a test marketing of the idea should be considered.

Catalina Island Chamber of Commerce & Visitors Bureau
33 | P a g e
Developing Non-Peak Season Demand Branding
1. Develop a specific off-season brand to promote visitation to potential visitors. For example, brand “Island Time” etc.
2. Continue to implement branding to effectively differentiate Catalina Island from other California coastal destinations.
3. Draw sharp distinctions between Catalina Island and other competitive California coastal destinations during the non-peak season.
4. Increase awareness for Catalina Island non-peak season by effectively positioning the destinations core elements: coastal location, dining, outdoor recreation, and fun, but begin to focus on specific activities that are targeted and attract visitors for non-peak tourism season visitation.
Direct Sales
1. Concentrate direct sales efforts primarily to focus on non-peak tourism season.
2. Continue to reinforce Catalina Island’s strong Southern California connection and encourage off-season visitors to view Catalina Island as a special place to visit during the offseason.
3. Continue to integrate the brand into all sales elements.
Special Events
Key to using special events as a tool to broaden the appeal of Catalina Island is to review the existing events and identify if current events support the objective of developing visitation during non-peak season and develop a special events action plan designed to meet that objective.
1. Build on off season special events that are working and develop an offseason-specific special events strategy that identifies events for non-peak season visitation.
2. Develop a strategy to link events to create incremental return visits.
3. Review the existing schedule to understand the types of events and their timing and identify potential target areas of opportunity.
4. Identify ways to integrate existing special events. Consider bundling existing events into a season or schedule to create more of a reason to visit and generate overnight visitors.

Catalina Island Chamber of Commerce & Visitors Bureau
34 | P a g e
Content Development (Content /Photo/Video)
Content development is a critically important component of the marketing mix for helping to build awareness for Catalina Island’s non- peak tourism season. Content development efforts should promote the Islands non-peak season in a unified format representing all of its areas and related activities.
1. Develop basic tools • A series of stories. Potential story ideas include the following:
o Fall recreation activities. o Area history and things to see o Fall food experiences o Fall special events
• Photography that depicts the fall visitor experience • Video for inclusion on the website and social media channels
2. Media familiarization (FAM) tours. Continue to attract travel and activity writers to emphasize different
aspects of Catalina Island. • Develop a 2 to 3-day itinerary • Arrange lodging and meals • Arrange meetings with key tourism contacts
Summary
Developing and launching a new tourism initiative is a challenging effort. In our extensive experience, SMG has identified several key factors that can make the challenge much easier. In this day and age, it's near impossible to make a change without the support of others, and to this end, we offer the following factors to help ensure Catalina Island’s success.
Success Factors
• Industry Shared Vision Before any steps can be taken, it is critical the Catalina Island tourism industry stakeholders fully support the shift in resources and the overall goal of developing demand during non-peak times. Without the backing of the industry, it's doubtful the strategy can be successful. As such, it's important to have their buy-in and involvement in this new direction. Potentially survey stakeholders and use the collected information to educate them and build a shared vision.
• Focused Efforts To make the new strategy, a focused and sustainable effort over the next 2-5 years is required. To make these kind of strategic changes, stakeholders must have expectations that are real. It will take several years for all the elements to come together and results to happen. The industry should have real expectations.
Catalina Island Chamber of Commerce & Visitors Bureau
35 | P a g e
• Work Together All of Catalina Island, both the public and private sectors, need to collaborate to develop and implement
this strategy. The Catalina Island Chamber of Commerce & Visitors Bureau and it’s partners must be supportive and enable the success of the industry through its policies and programs.
• Think of the Bigger Picture
Everyone involved needs to consider the bigger picture of what works for the entire effort. It is critical for the industry and The Catalina Chamber & Visitors Bureau to work collectively to shape and change the strategic direction of tourism promotions. Individual efforts to make exceptions will not succeed. A good idea for change, supported by a coalition of others, has a much better chance to benefit the entire effort.
• Political Support The new strategy will require political support and a “how do we make it happen attitude”.
• Community Critical to the destination’s success is the ongoing efforts to educate and involve the community in
tourism issues and opportunities, as well as helping the Island to maintain its unique character and local culture. It is important that the local community understand the significance of tourism and the industry’s role in maintaining the local quality of life.
• Culture of Innovation
Catalina Island tourism must continue to innovate to meet the changing dynamics of the industry and the political, market, social, and economic environments to continually increase the viability of these new changes for the Island’s economy and environment.

Catalina Island Chamber of Commerce & Visitors Bureau
36 | P a g e
SMG Consulting is a tourism and recreation consulting firm located in South Lake Tahoe. For more information www.smgonline.net


![Geology and Tectonics of Santa Catalina Island and the California … · 2017. 9. 27. · 3 Santa Catalina Island Field Trip Road Log Day 1 [October 23, 2004] Begin – Catalina Express](https://img.pdfslide.us/doc/110x75/610e92d7eec8805a8129f692/geology-and-tectonics-of-santa-catalina-island-and-the-california-2017-9-27.jpg)