Embed Size (px)
Citation preview

SANTA BARBARA AND VENTURA SANTA BARBARA AND VENTURA COUNTIES COASTAL PROCESSES STUDYCOUNTIES COASTAL PROCESSES STUDY
Patrick BarnardPatrick BarnardUnited States Geological SurveyUnited States Geological Survey
Coastal and Marine Geology Team Coastal and Marine Geology Team Santa Cruz, CASanta Cruz, CA
Gary GriggsGary GriggsInstitute of Marine SciencesInstitute of Marine Sciences
University of California, Santa CruzUniversity of California, Santa Cruz
ProductsProducts
•• BEACON Final BEACON Final Technical Report Technical Report (early 2009)(early 2009)
•• MS Thesis and Dissertation MS Thesis and Dissertation (Summer 2007)(Summer 2007)
•• USGS Open File Reports + USGS Open File Reports + Scientific Investigations Scientific Investigations MapsMaps
•• Journal publications and Journal publications and conference proceedingsconference proceedings
•• Seamless Map ProductSeamless Map Product
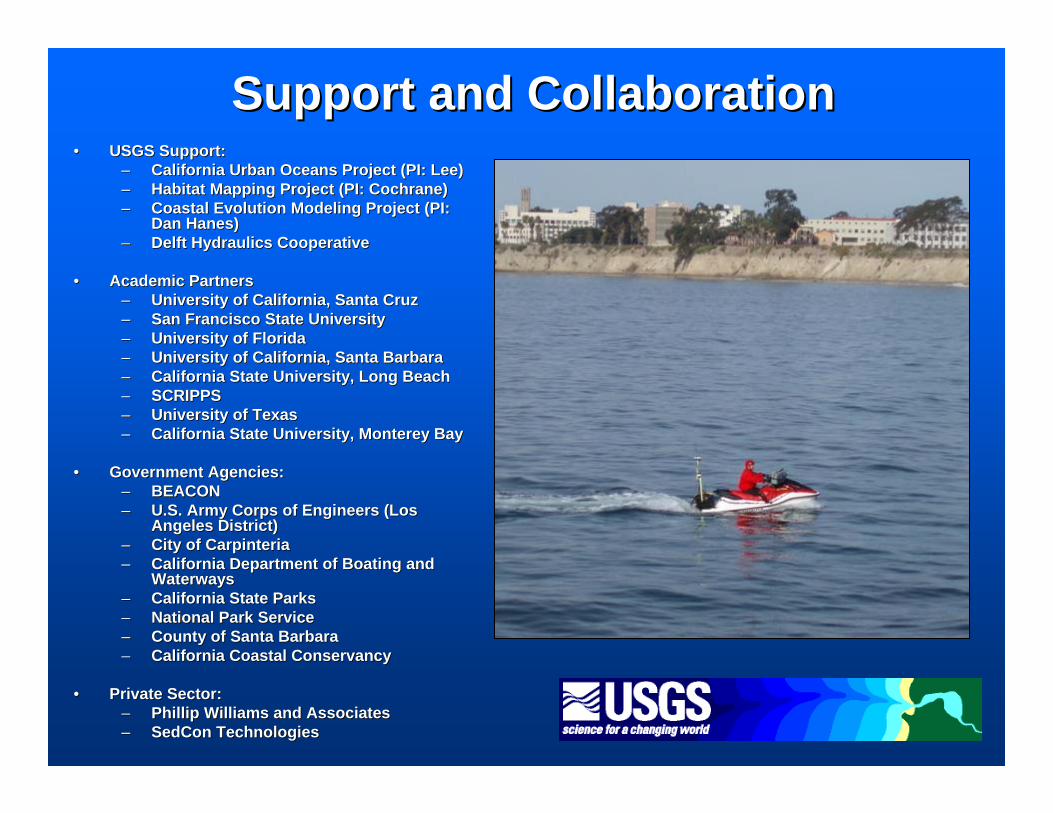
Support and CollaborationSupport and Collaboration•• USGS Support: USGS Support:
–– California Urban Oceans Project (PI: Lee)California Urban Oceans Project (PI: Lee)–– Habitat Mapping Project (PI: Cochrane)Habitat Mapping Project (PI: Cochrane)–– Coastal Evolution Modeling Project (PI: Coastal Evolution Modeling Project (PI:
Dan Hanes)Dan Hanes)–– Delft Hydraulics CooperativeDelft Hydraulics Cooperative
•• Academic PartnersAcademic Partners–– University of California, Santa CruzUniversity of California, Santa Cruz–– San Francisco State UniversitySan Francisco State University–– University of FloridaUniversity of Florida–– University of California, Santa BarbaraUniversity of California, Santa Barbara–– California State University, Long BeachCalifornia State University, Long Beach–– SCRIPPSSCRIPPS–– University of TexasUniversity of Texas–– California State University, Monterey BayCalifornia State University, Monterey Bay
•• Government Agencies:Government Agencies:–– BEACONBEACON–– U.S. Army Corps of Engineers (Los U.S. Army Corps of Engineers (Los
Angeles District)Angeles District)–– City of CarpinteriaCity of Carpinteria–– California Department of Boating and California Department of Boating and
WaterwaysWaterways–– California State ParksCalifornia State Parks–– National Park ServiceNational Park Service–– County of Santa BarbaraCounty of Santa Barbara–– California Coastal ConservancyCalifornia Coastal Conservancy
•• Private Sector:Private Sector:–– Phillip Williams and AssociatesPhillip Williams and Associates–– SedCon TechnologiesSedCon Technologies
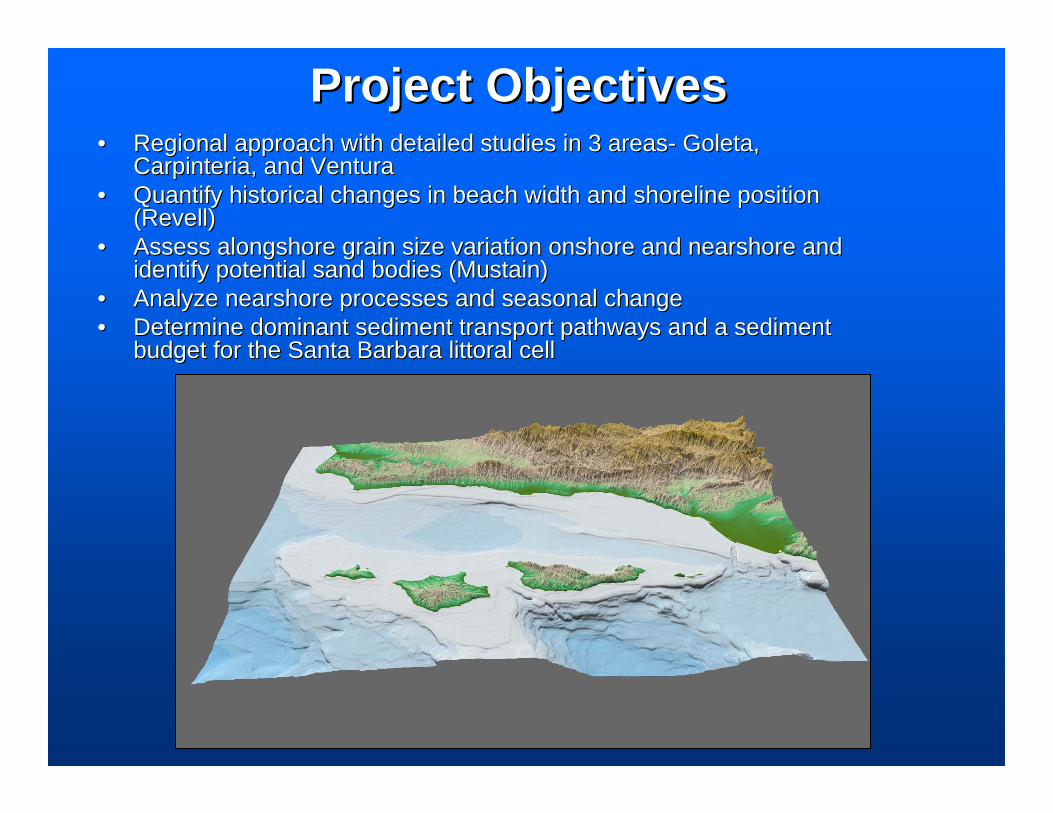
Project ObjectivesProject Objectives•• Regional approach with detailed studies in 3 areasRegional approach with detailed studies in 3 areas-- Goleta, Goleta,
Carpinteria, and VenturaCarpinteria, and Ventura•• Quantify historical changes in beach width and shoreline positioQuantify historical changes in beach width and shoreline position n
(Revell)(Revell)•• Assess alongshore grain size variation onshore and nearshore andAssess alongshore grain size variation onshore and nearshore and
identify potential sand bodies (Mustain)identify potential sand bodies (Mustain)•• Analyze nearshore processes and seasonal changeAnalyze nearshore processes and seasonal change•• Determine dominant sediment transport pathways and a sediment Determine dominant sediment transport pathways and a sediment
budget for the Santa Barbara littoral cellbudget for the Santa Barbara littoral cell

•• Lidar (Light Detection and Ranging)Lidar (Light Detection and Ranging)•• Topographic beach surveysTopographic beach surveys•• Nearshore bathymetric surveysNearshore bathymetric surveys•• Multibeam/ side scan mappingMultibeam/ side scan mapping•• Grain size surveys, nearshore and onshoreGrain size surveys, nearshore and onshore•• Instrument deploymentsInstrument deploymentsAdd OnsAdd Ons•• Expanded multibeam/side scan mappingExpanded multibeam/side scan mapping•• Box coring (Summer 2007)Box coring (Summer 2007)•• SubSub--bottom profiling (Summer 2007)bottom profiling (Summer 2007)•• GroundGround--based Lidarbased Lidar•• Mugu Canyon StudyMugu Canyon Study
Field WorkField Work
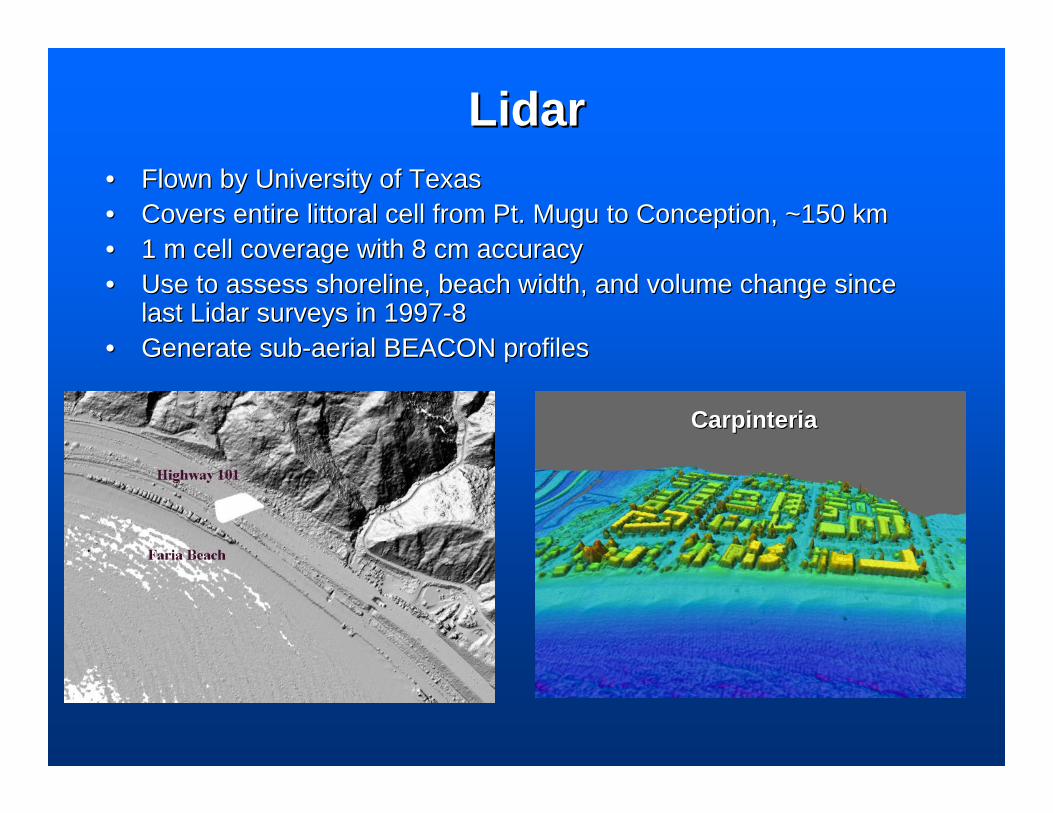
LidarLidar•• Flown by University of TexasFlown by University of Texas•• Covers entire littoral cell from Pt. Mugu to Conception, ~150 kmCovers entire littoral cell from Pt. Mugu to Conception, ~150 km•• 1 m cell coverage with 8 cm accuracy1 m cell coverage with 8 cm accuracy•• Use to assess shoreline, beach width, and volume change since Use to assess shoreline, beach width, and volume change since
last Lidar surveys in 1997last Lidar surveys in 1997--88•• Generate subGenerate sub--aerial BEACON profilesaerial BEACON profiles
CarpinteriaCarpinteria
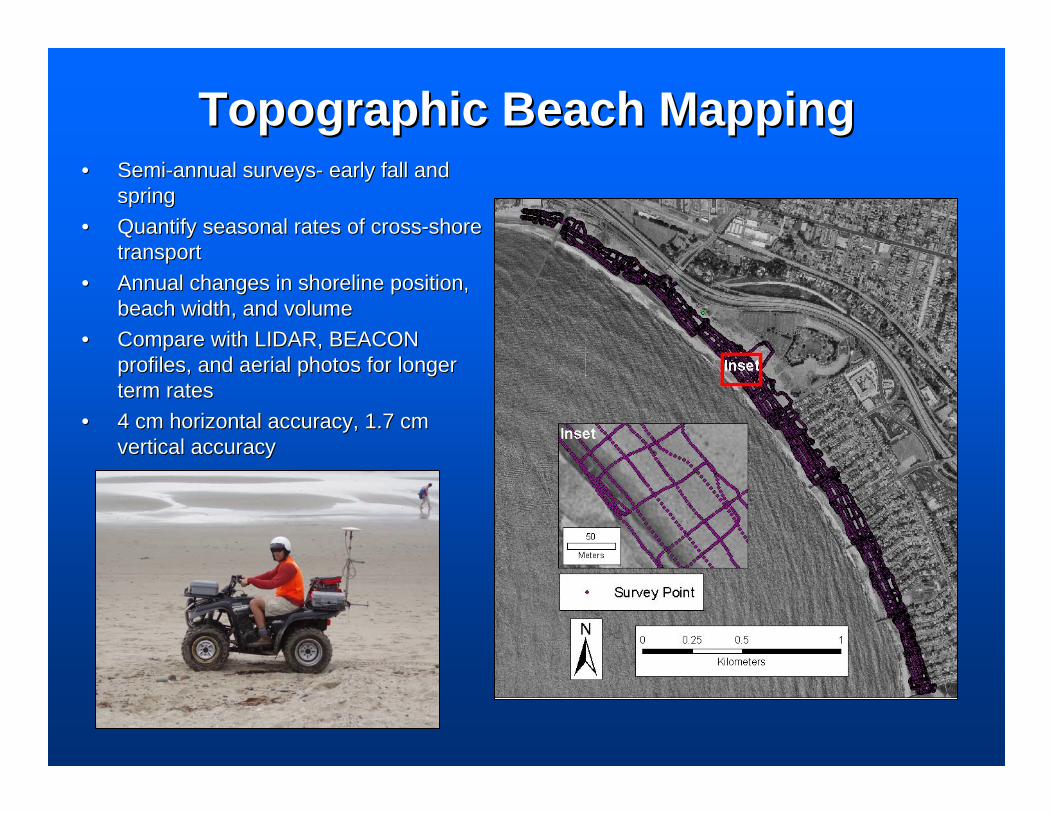
Topographic Beach MappingTopographic Beach Mapping•• SemiSemi--annual surveysannual surveys-- early fall and early fall and
springspring•• Quantify seasonal rates of crossQuantify seasonal rates of cross--shore shore
transporttransport•• Annual changes in shoreline position, Annual changes in shoreline position,
beach width, and volumebeach width, and volume•• Compare with LIDAR, BEACON Compare with LIDAR, BEACON
profiles, and aerial photos for longer profiles, and aerial photos for longer term ratesterm rates
•• 4 cm horizontal accuracy, 1.7 cm 4 cm horizontal accuracy, 1.7 cm vertical accuracyvertical accuracy

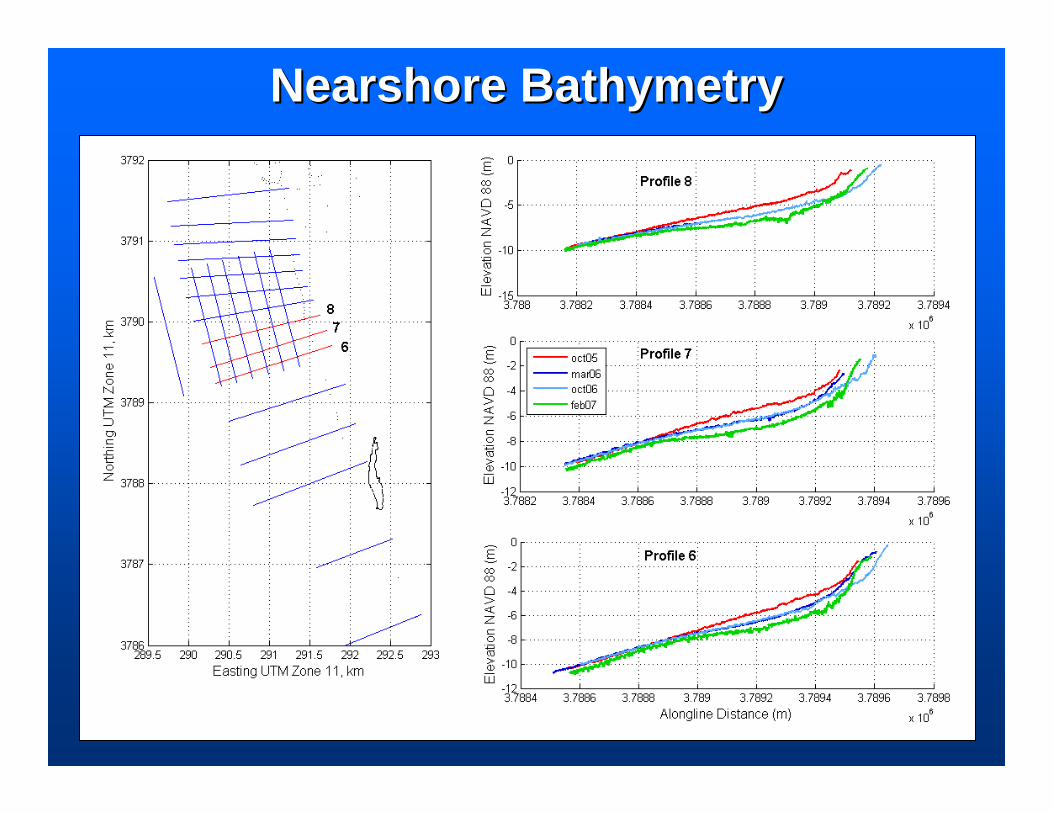
Nearshore BathymetryNearshore Bathymetry•• Focus on three high resolution sites + Rincon ParkwayFocus on three high resolution sites + Rincon Parkway•• Quantify seasonal and annual nearshore changeQuantify seasonal and annual nearshore change•• Determine crossDetermine cross--shore transport ratesshore transport rates•• Updated bathymetry for model inputUpdated bathymetry for model input
UCSBUCSB

Nearshore BathymetryNearshore Bathymetry

Nearshore BathymetryNearshore Bathymetry
Nearshore BathymetryNearshore Bathymetry
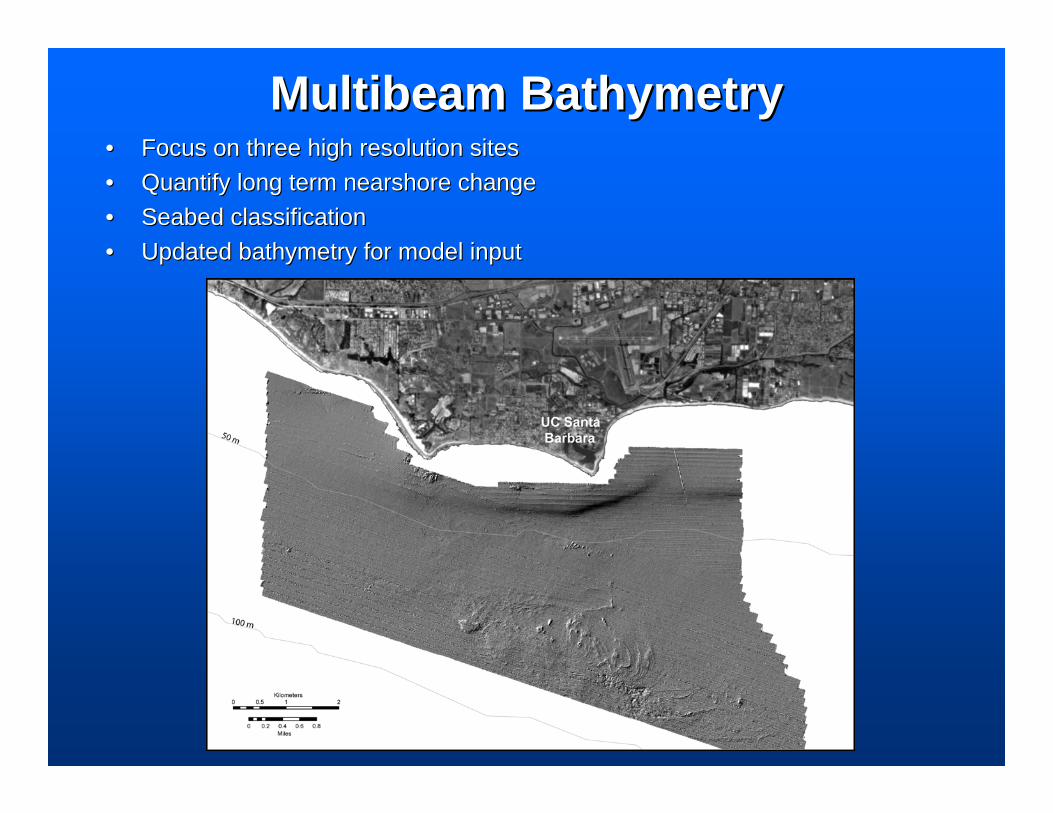
Multibeam BathymetryMultibeam Bathymetry•• Focus on three high resolution sitesFocus on three high resolution sites•• Quantify long term nearshore changeQuantify long term nearshore change•• Seabed classificationSeabed classification•• Updated bathymetry for model inputUpdated bathymetry for model input

Expanded MultibeamExpanded Multibeam•• $400,000 from California Coastal Conservancy + $135,000 (field) $400,000 from California Coastal Conservancy + $135,000 (field) from USGS from USGS •• Map inside 3 mi limit from Mugu to Goleta, Summer 2006 and 2007Map inside 3 mi limit from Mugu to Goleta, Summer 2006 and 2007•• Cochrane and Dartnell offshore work in 2004 and 2005Cochrane and Dartnell offshore work in 2004 and 2005
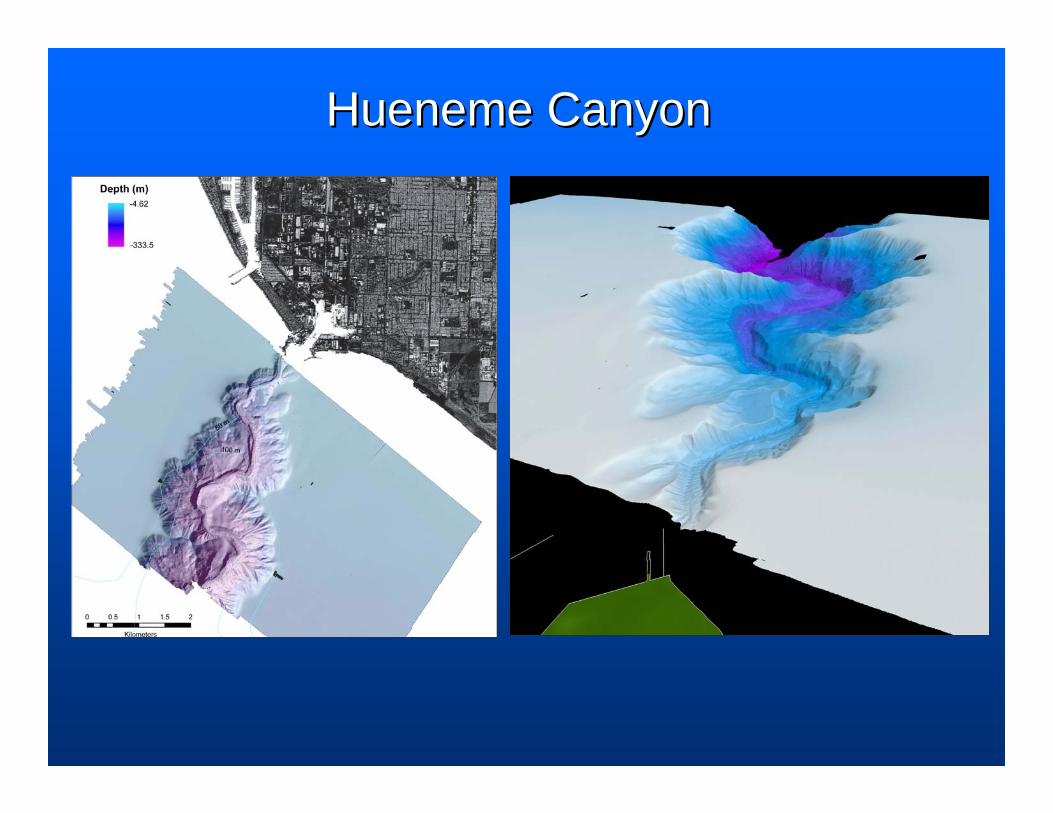
Hueneme CanyonHueneme Canyon
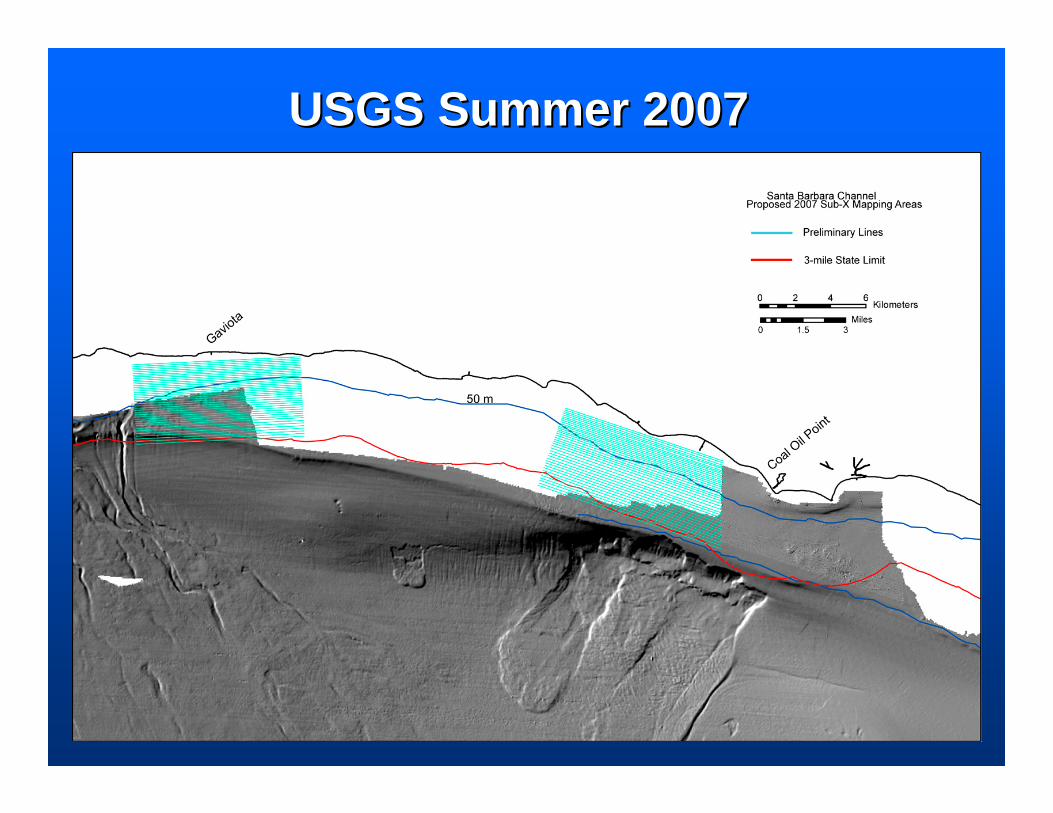
USGS Summer 2007USGS Summer 2007

Grain Size StudiesGrain Size Studies
•• 192 beach sample locations, 576 192 beach sample locations, 576 imagesimages
•• 300 nearshore sampling stations, 300 nearshore sampling stations, 1500 images1500 images
•• Products to comeProducts to comeMustain, N., Griggs, G. and Barnard, P.L. Mustain, N., Griggs, G. and Barnard, P.L. (2007). A Rapid Compatibility Analysis of (2007). A Rapid Compatibility Analysis of Potential Offshore Sand Sources for Potential Offshore Sand Sources for Beaches of the Santa Barbara Littoral Cell. Beaches of the Santa Barbara Littoral Cell. Coastal Sediments 07, New Orleans, LA.Coastal Sediments 07, New Orleans, LA.
Mustain, N. (2007). Grain Size Distribution in Mustain, N. (2007). Grain Size Distribution in the Santa Barbara Littoral Cell and the Santa Barbara Littoral Cell and Implications for Beach Nourishment. M.S. Implications for Beach Nourishment. M.S. Thesis, U.C. Santa Cruz. Thesis, U.C. Santa Cruz.
Santa Barbara Littoral Cell Beach and Santa Barbara Littoral Cell Beach and Nearshore Grain Size Map, USGS Scientific Nearshore Grain Size Map, USGS Scientific Investigations MapInvestigations Map
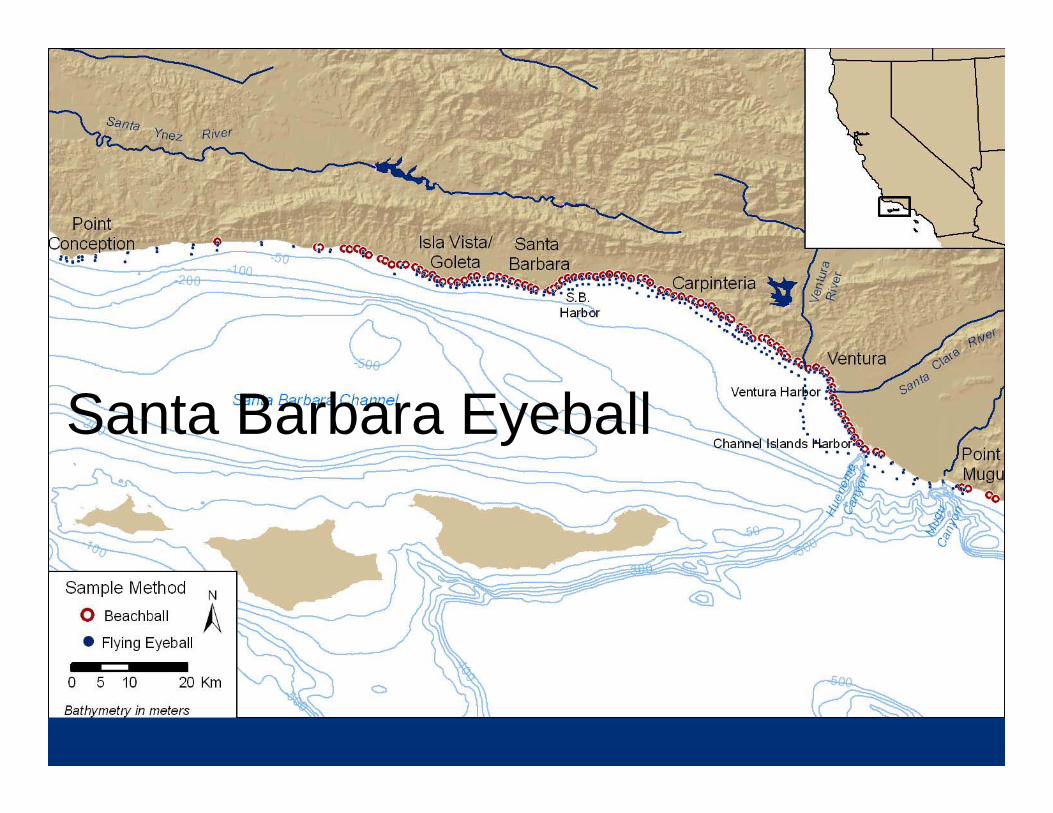
Santa Barbara Eyeball
0.00
0.10
0.20
0.30
0.40
0.50
0.60
0.70
0.80
0.90
-25 0 25 50 75 100 125 150
Sample Location (Km)
Mea
n G
rain
Siz
e (m
m)
Swash 5 m 10 m 20 m#
Depth:
CoarseSand
SiltClay
Very FineSand
MediumSand
FineSand
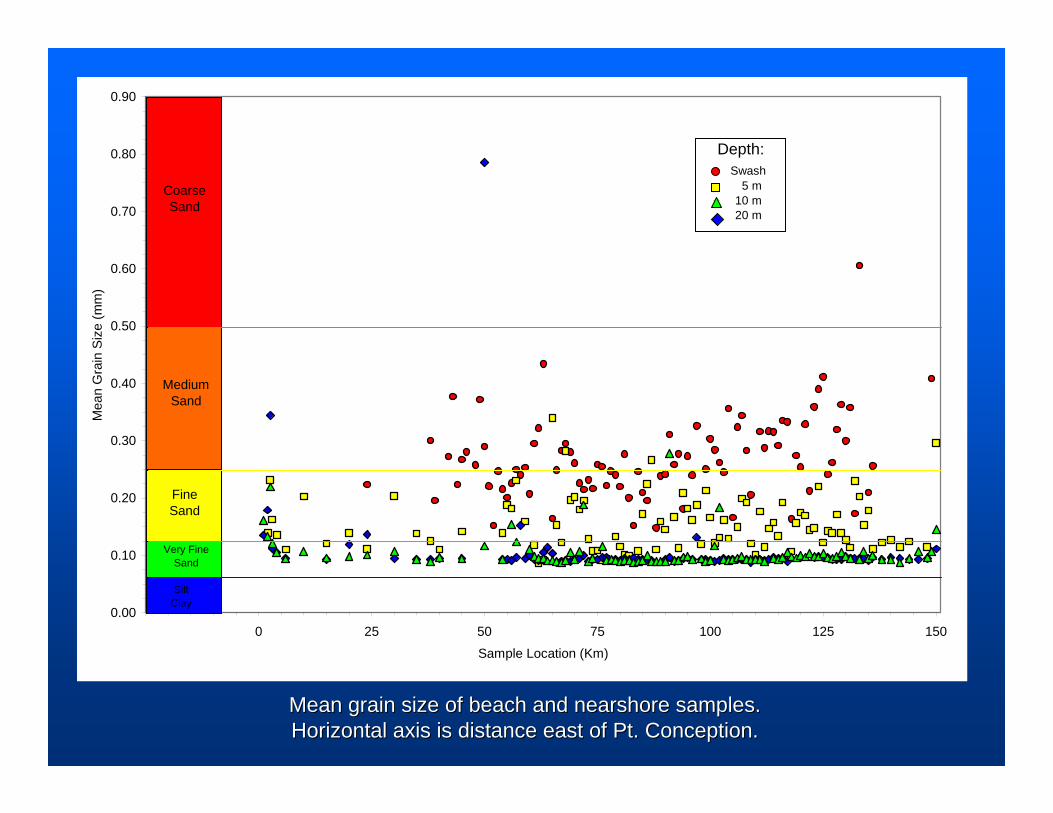
Mean grain size of beach and nearshore samples. Mean grain size of beach and nearshore samples. Horizontal axis is distance east of Pt. Conception.Horizontal axis is distance east of Pt. Conception.

Mean grain size of nearshore (5, 10, 20 m) Flying Eyeball Mean grain size of nearshore (5, 10, 20 m) Flying Eyeball samples in the Santa Barbara Littoral Cell. samples in the Santa Barbara Littoral Cell.
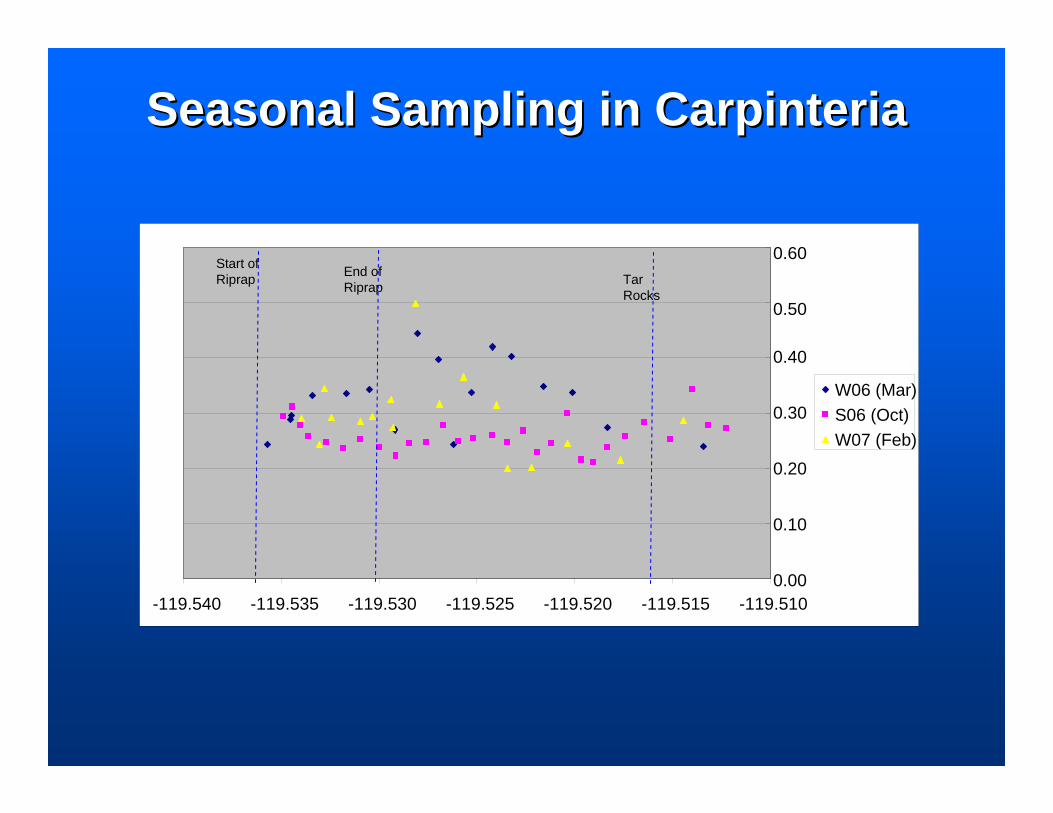
End of Riprap Tar
Rocks
Start of Riprap
0.00
0.10
0.20
0.30
0.40
0.50
0.60
-119.540 -119.535 -119.530 -119.525 -119.520 -119.515 -119.510
W06 (Mar)S06 (Oct)W07 (Feb)
End of Riprap Tar
Rocks
Start of Riprap
Seasonal Sampling in CarpinteriaSeasonal Sampling in Carpinteria

Instrument DeploymentsInstrument Deployments
•• Summer 2006 and Winter Summer 2006 and Winter 20072007
•• Place in 10 m water depth Place in 10 m water depth offshore of 3 high offshore of 3 high resres sitessites
•• Use for model calibration/ Use for model calibration/ validationvalidation
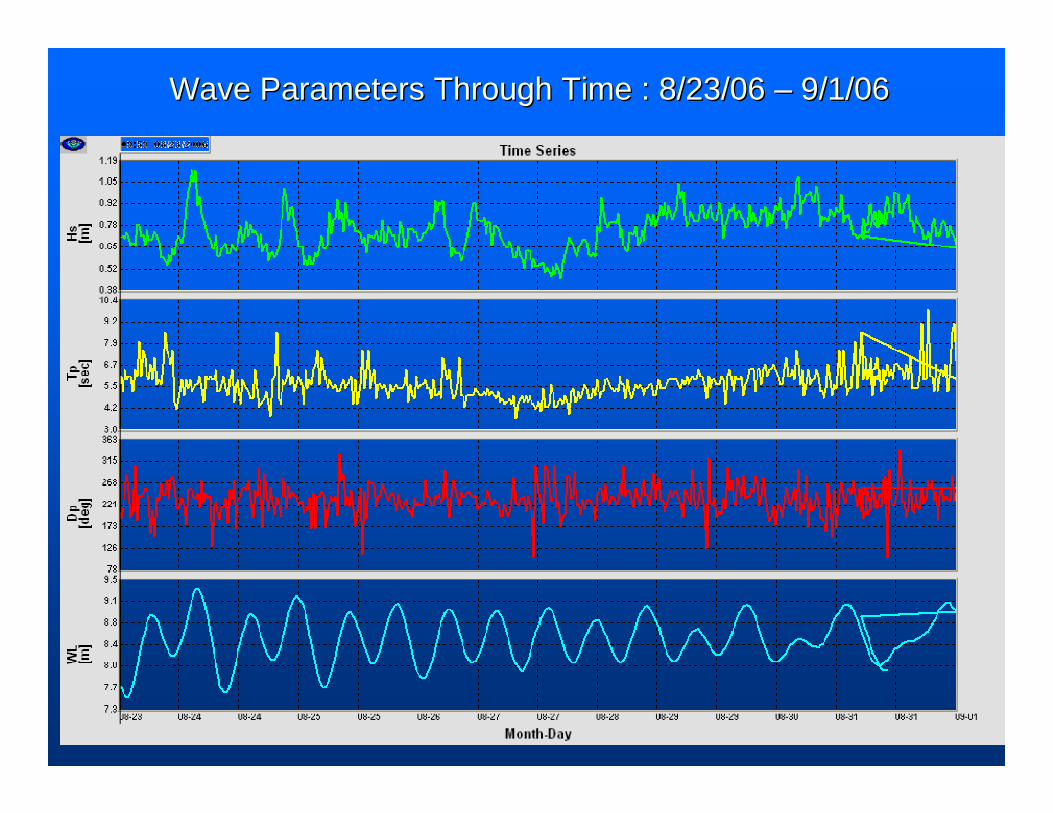
Wave Parameters Through Time : 8/23/06 Wave Parameters Through Time : 8/23/06 –– 9/1/069/1/06
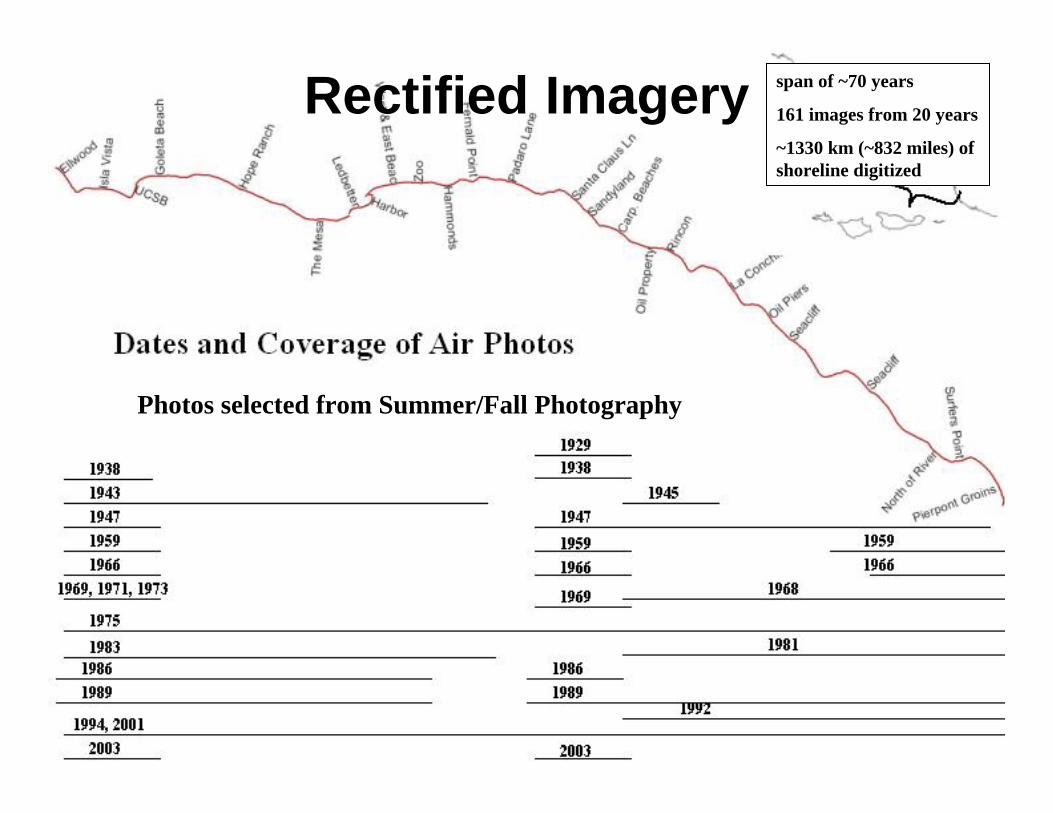
Rectified Imagery span of ~70 years
161 images from 20 years
~1330 km (~832 miles) of shoreline digitized
Photos selected from Summer/Fall Photography
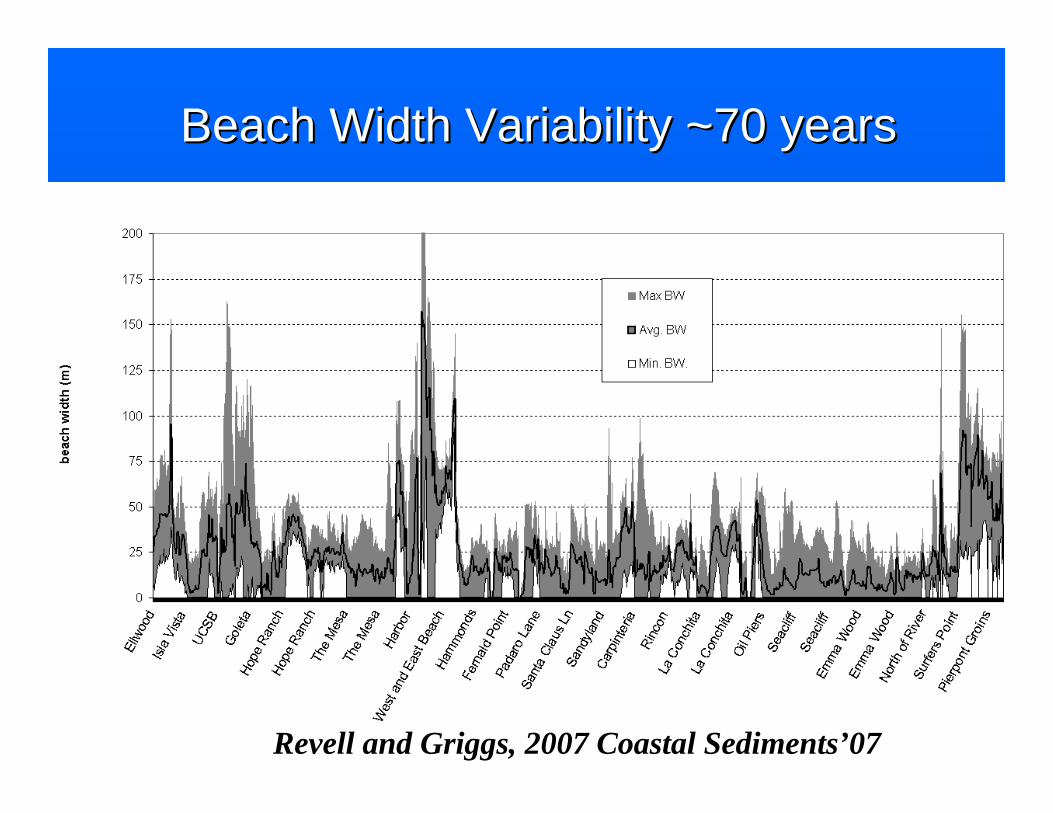
Beach Width Variability ~70 yearsBeach Width Variability ~70 years
Revell and Griggs, 2007 Coastal Sediments’07

Beach Width ChangesBeach Width Changes
19971997--98 El Nino98 El Nino
19821982--83 El Nino83 El Nino
Carpinteria Carpinteria
Revell and Griggs, 2007 Revell and Griggs, 2007 Coastal Sediments’07Coastal Sediments’07

David Revell Publications in David Revell Publications in Santa Barbara Littoral CellSanta Barbara Littoral Cell
[email protected]@es.ucsc.eduDissertation Defense March 9, 2007…Dissertation Defense March 9, 2007…Beach Width and Climate Oscillations in Isla Vista, Santa Beach Width and Climate Oscillations in Isla Vista, Santa
Barbara, CA. Barbara, CA. Shore and BeachShore and Beach 74(3):874(3):8--1515Regional Shoreline and Beach Changes in the Santa Barbara Regional Shoreline and Beach Changes in the Santa Barbara
Sandshed. In Proceedings of Sandshed. In Proceedings of Coastal Sediments ‘07Coastal Sediments ‘07Physical and Ecological Response of Sandy Beaches to the Physical and Ecological Response of Sandy Beaches to the
19971997--98 El Nino (submitted to 98 El Nino (submitted to Journal of Coastal Research)Journal of Coastal Research)

Santa Barbara Littoral Cell Longshore Transport VolumesSanta Maria River to Mugu Submarine Canyon
0
200
400
600
800
1,000
1,200
1,400
1,600
1,800
2,0000 6 12 18 24 30 36 42 48 54 60 66 72 78 84 90 96 102
108
114
120
126
132
138
144
Location Miles
Litto
ral D
rift V
olum
e (x
1000
cy/
yr)
Santa Barbara Harbor
Ventura Harbor
Santa Maria River Santa
Ynez River
Loss to Dunes
San AntonioCreek
Loss around Point Conception
Santa Ynez Mountain Streams
Beach Erosion
Ventura River
Santa Clara River
Channel Is. & Port Hueneme Harbors
Loss into Sediment
Traps
Calleguas Creek
Loss to Mugu
Canyon
Patch and Griggs WorkPatch and Griggs Work
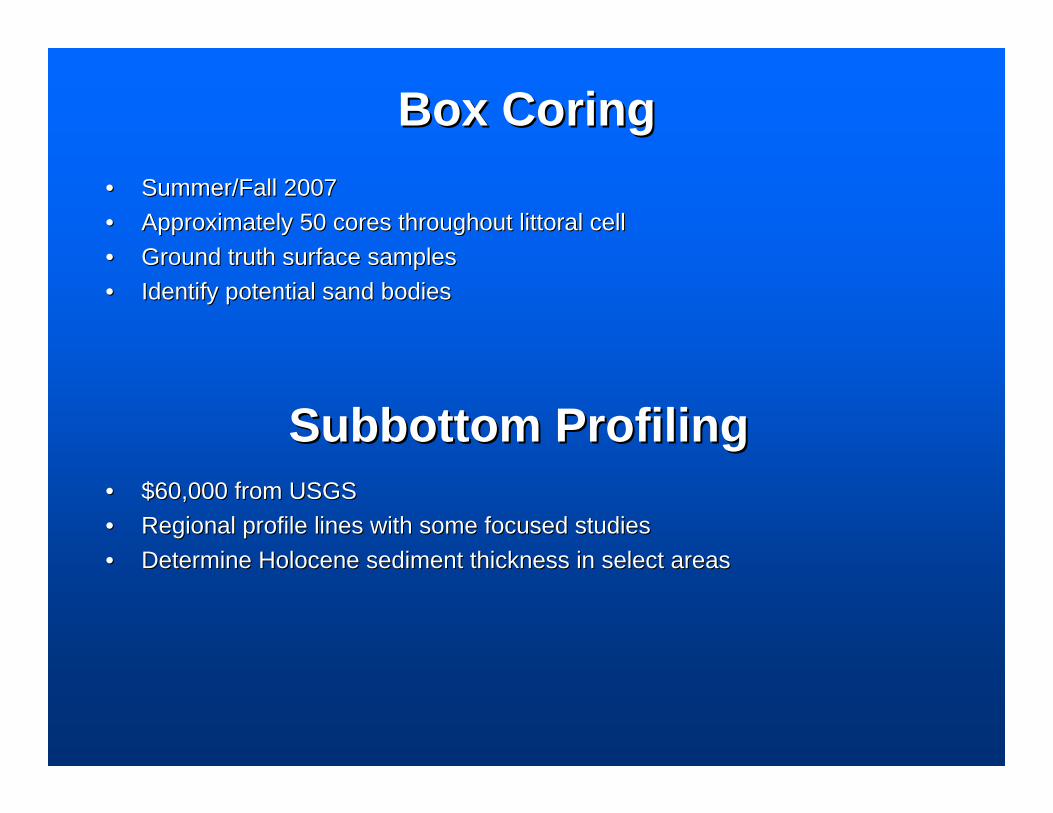
Box CoringBox Coring•• Summer/Fall 2007Summer/Fall 2007•• Approximately 50 cores throughout littoral cellApproximately 50 cores throughout littoral cell•• Ground truth surface samplesGround truth surface samples•• Identify potential sand bodiesIdentify potential sand bodies
Subbottom ProfilingSubbottom Profiling•• $60,000 from USGS$60,000 from USGS•• Regional profile lines with some focused studiesRegional profile lines with some focused studies•• Determine Holocene sediment thickness in select areasDetermine Holocene sediment thickness in select areas
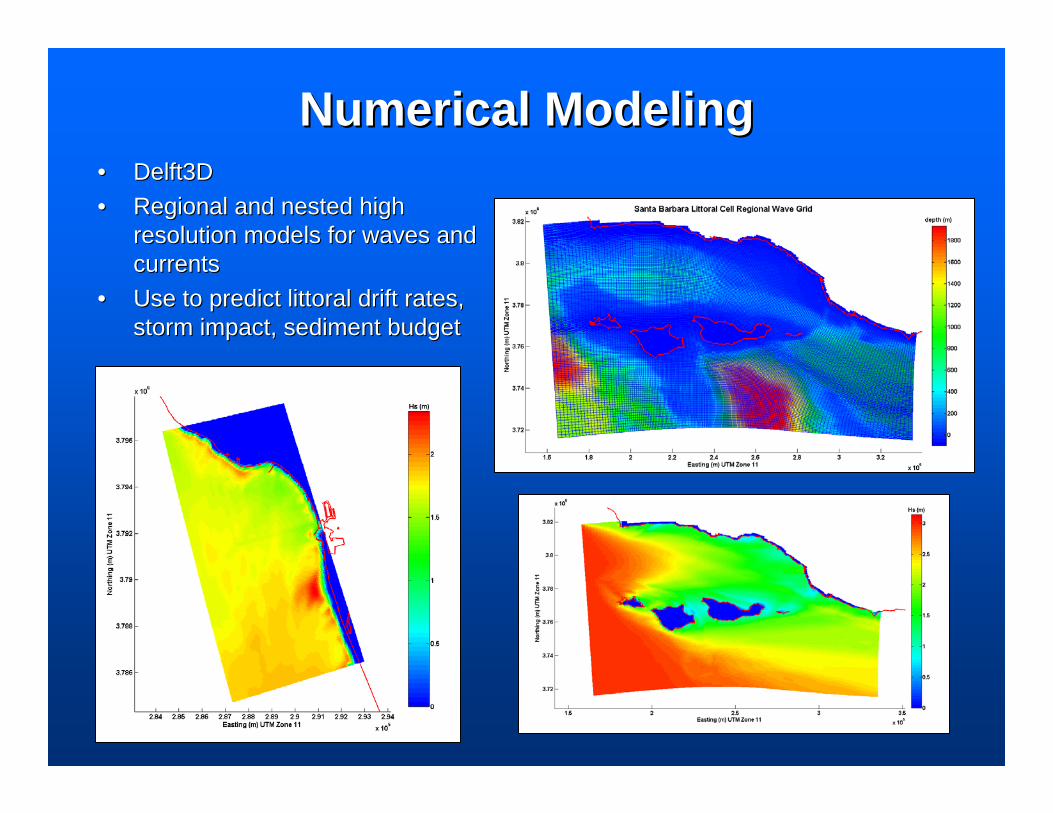
Numerical ModelingNumerical Modeling•• Delft3D Delft3D •• Regional and nested high Regional and nested high
resolution models for waves and resolution models for waves and currentscurrents
•• Use to predict littoral drift rates, Use to predict littoral drift rates, storm impact, sediment budgetstorm impact, sediment budget

GroundGround--based Lidarbased Lidar•• USGS, Brian CollinsUSGS, Brian Collins•• Goleta, Isla Vista/Ellwood RegionGoleta, Isla Vista/Ellwood Region•• Used to asses cliff retreat ratesUsed to asses cliff retreat rates•• 500,000 points/min, 10500,000 points/min, 10--50 cm resolution50 cm resolution
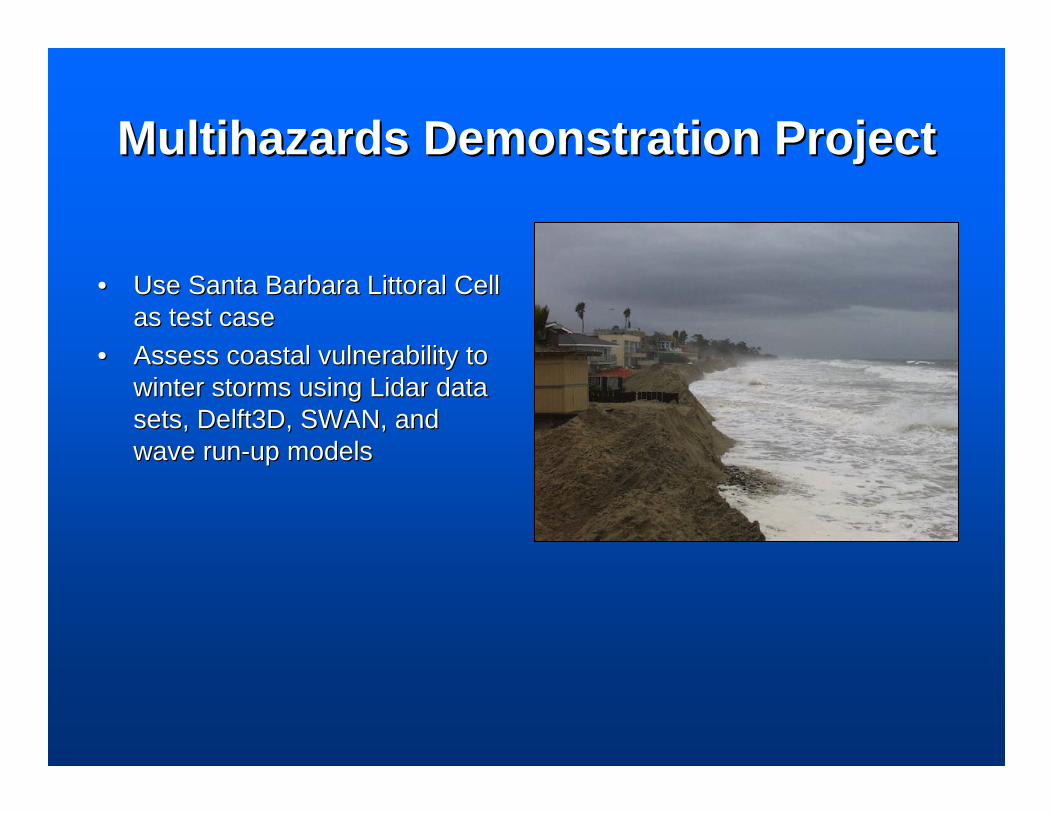
Multihazards Demonstration ProjectMultihazards Demonstration Project
•• Use Santa Barbara Littoral Cell Use Santa Barbara Littoral Cell as test caseas test case
•• Assess coastal vulnerability to Assess coastal vulnerability to winter storms using Lidar data winter storms using Lidar data sets, Delft3D, SWAN, and sets, Delft3D, SWAN, and wave runwave run--up modelsup models
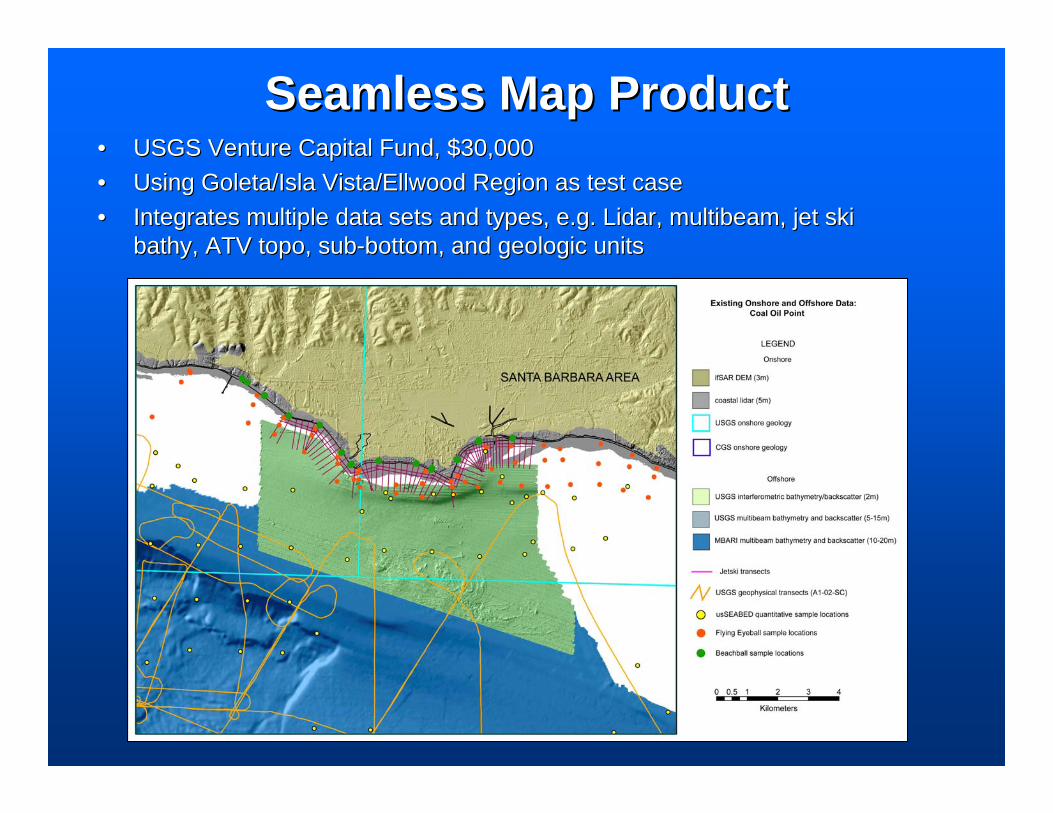
Seamless Map ProductSeamless Map Product•• USGS Venture Capital Fund, $30,000USGS Venture Capital Fund, $30,000•• Using Goleta/Isla Vista/Ellwood Region as test caseUsing Goleta/Isla Vista/Ellwood Region as test case•• Integrates multiple data sets and types, e.g. Lidar, multibeam, Integrates multiple data sets and types, e.g. Lidar, multibeam, jet ski jet ski
bathy, ATV topo, subbathy, ATV topo, sub--bottom, and geologic unitsbottom, and geologic units
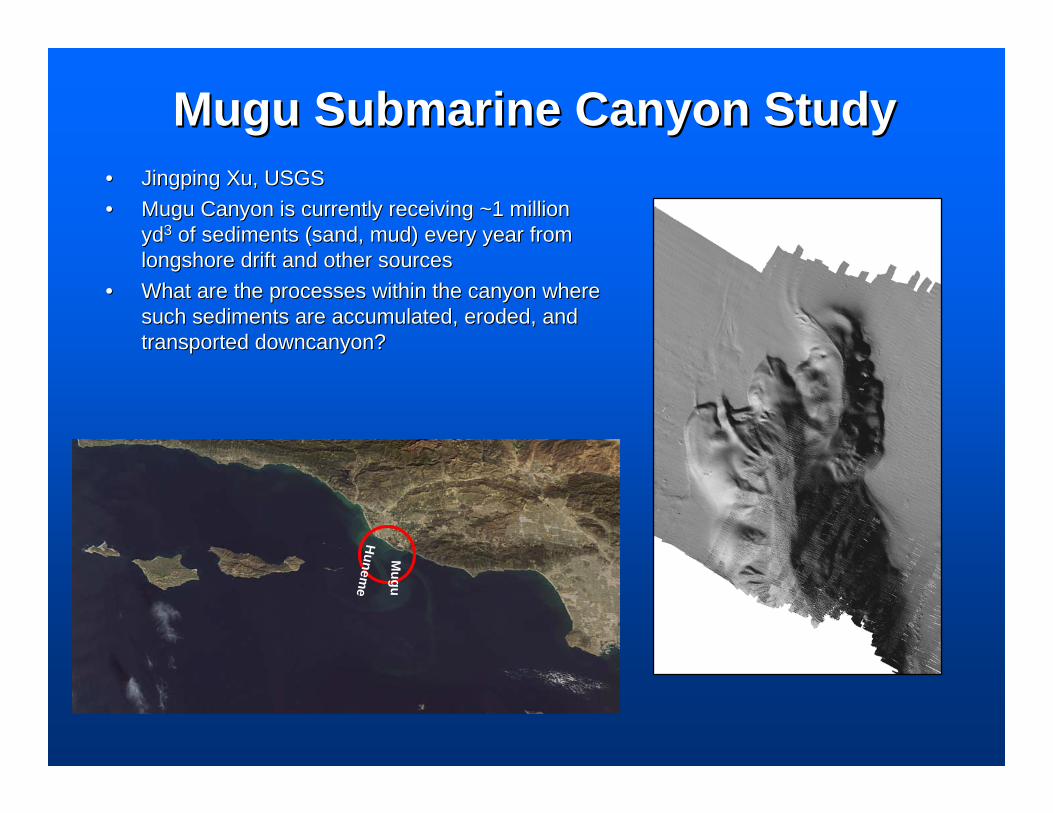
Mugu Submarine Canyon StudyMugu Submarine Canyon Study•• Jingping Xu, USGSJingping Xu, USGS•• Mugu Canyon is currently receiving ~1 million Mugu Canyon is currently receiving ~1 million
ydyd33 of sediments (sand, mud) every year from of sediments (sand, mud) every year from longshore drift and other sourceslongshore drift and other sources
•• What are the processes within the canyon where What are the processes within the canyon where such sediments are accumulated, eroded, and such sediments are accumulated, eroded, and transported downcanyon?transported downcanyon?
Mugu
Hunem
e
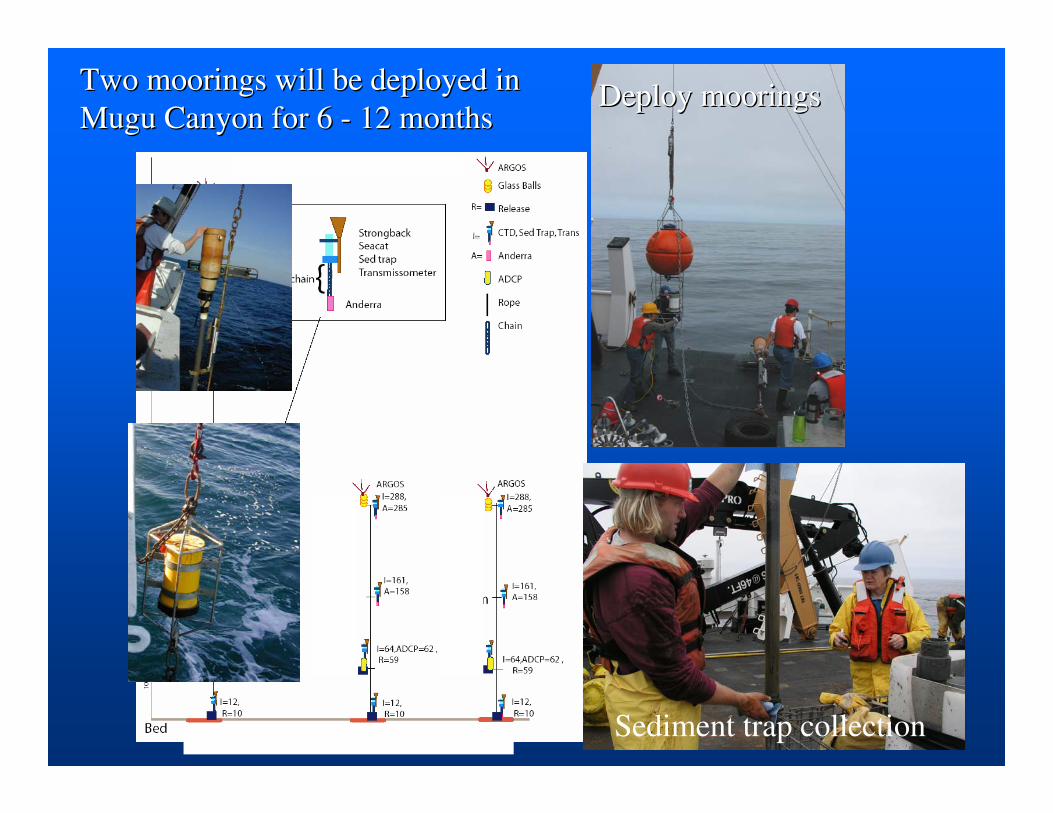
Sediment trap collection
Deploy mooringsDeploy mooringsTwo moorings will be deployed in Two moorings will be deployed in Mugu Canyon for 6 Mugu Canyon for 6 -- 12 months12 months
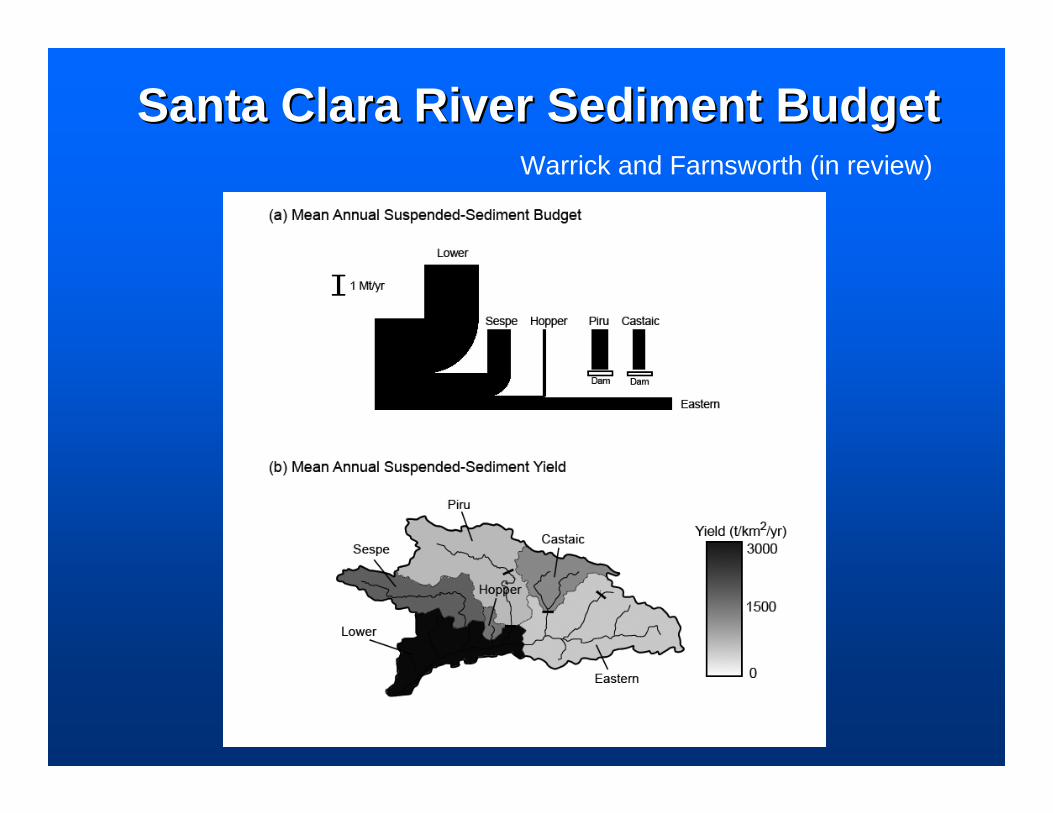
Santa Clara River Sediment BudgetSanta Clara River Sediment BudgetWarrick and Farnsworth (in review)
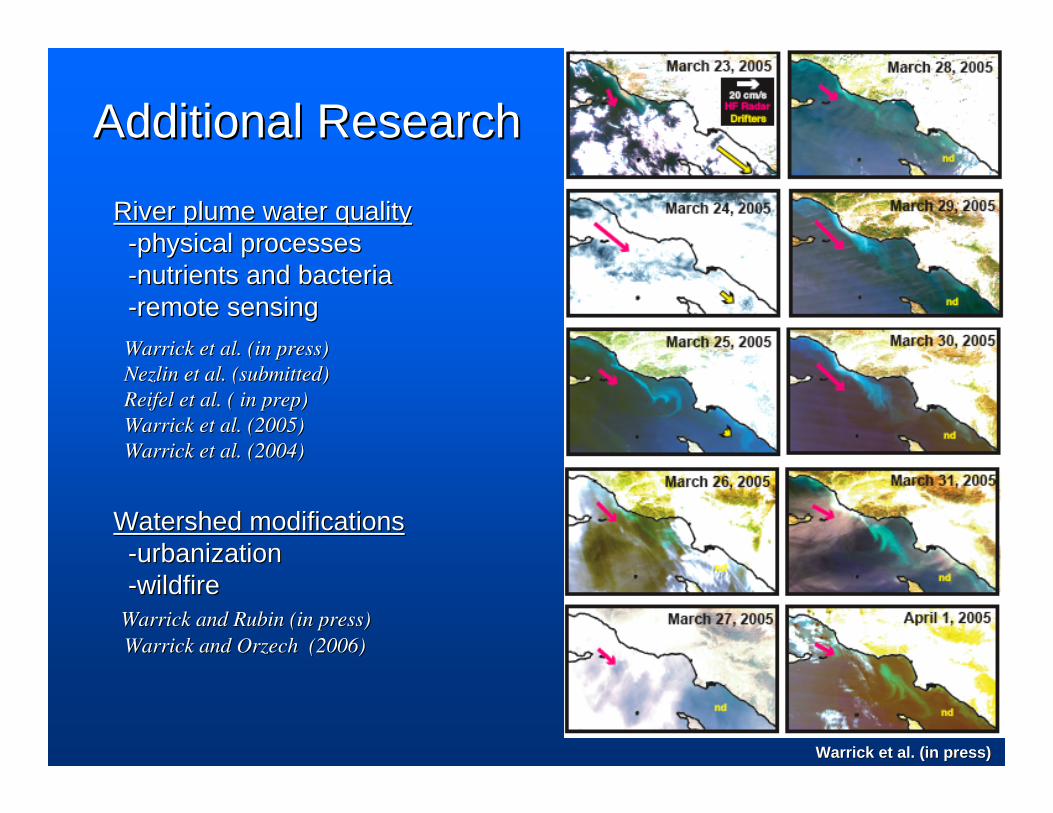
Additional ResearchAdditional Research
Warrick et al. (in press)Warrick et al. (in press)
River plume water qualityRiver plume water quality--physical processesphysical processes--nutrients and bacterianutrients and bacteria--remote sensingremote sensingWarrick et al. (in press) Warrick et al. (in press) Nezlin et al. (submitted)Nezlin et al. (submitted)Reifel et al. ( in prep)Reifel et al. ( in prep)Warrick et al. (2005)Warrick et al. (2005)Warrick et al. (2004)Warrick et al. (2004)
Watershed modificationsWatershed modifications--urbanizationurbanization--wildfirewildfire
Warrick and Rubin (in press) Warrick and Rubin (in press) Warrick and Orzech (2006)Warrick and Orzech (2006)
ProductsProducts
•• BEACON Final BEACON Final Technical Report Technical Report (early 2009)(early 2009)
•• MS Thesis and MS Thesis and Dissertation (Summer Dissertation (Summer 2007)2007)
•• USGS Open File USGS Open File Reports + Scientific Reports + Scientific Investigations MapsInvestigations Maps
•• Journal publications Journal publications and conference and conference proceedingsproceedings
•• Seamless Map ProductSeamless Map Product

Future DirectionsFuture Directions
•• Complete BEACON Complete BEACON tasks (Dec 2008)tasks (Dec 2008)
•• Coastal vulnerability Coastal vulnerability assessment for USGS assessment for USGS Multihazards Multihazards InvestigationInvestigation
•• Seamless Map ProductSeamless Map Product
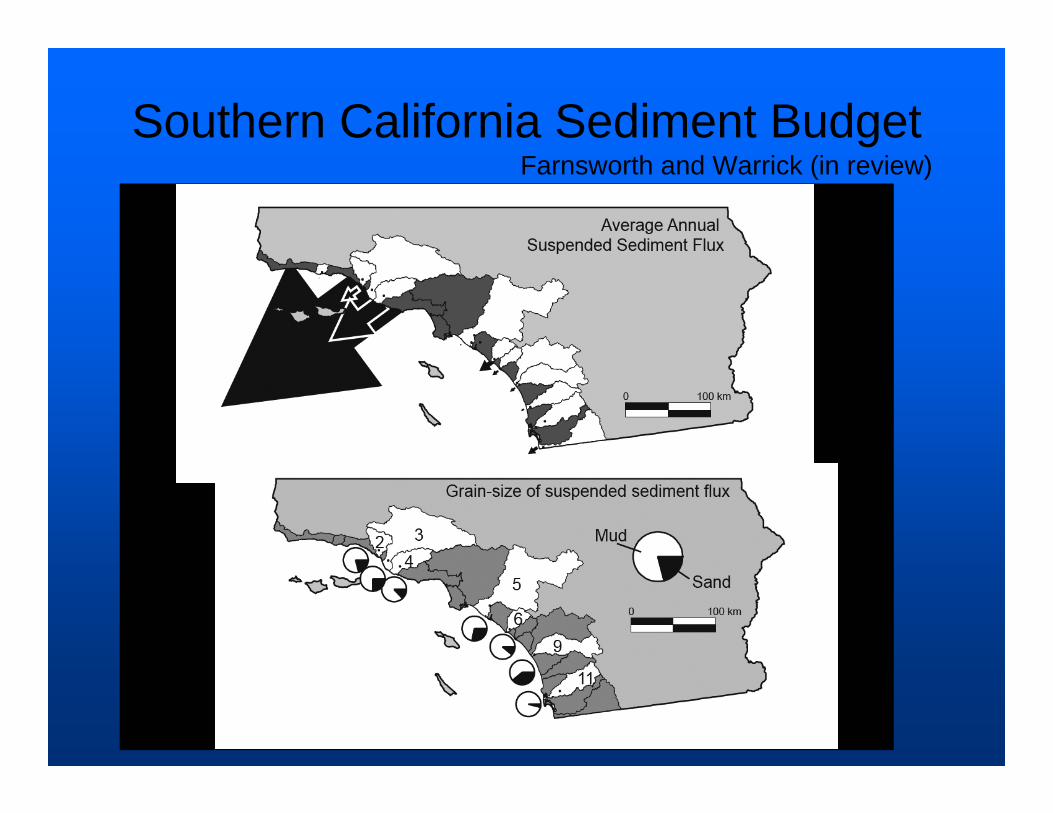
Southern California Sediment BudgetFarnsworth and Warrick (in review)
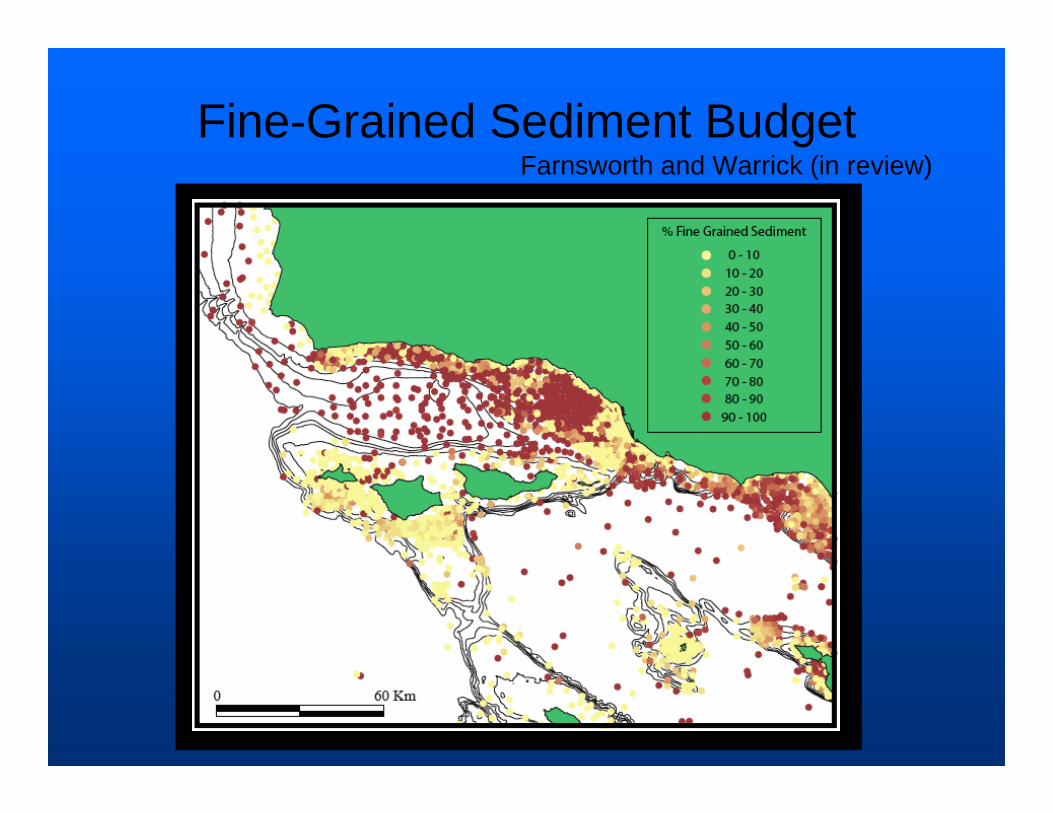
Fine-Grained Sediment BudgetFarnsworth and Warrick (in review)

Regional
No regional pattern of beach width narrowing due to sand supply reductions, instead beach widths oscillate.
Regional narrowing of beaches due to placement loss resulting from construction and encroachment of shore protection structures.
Study area can be divided based on location relative to Santa Barbara Harbor.
•Updrift – Beach minimums controlled by El Ninos with PDO influences
•Downdrift - dredge controlled
Patterns of long-term shoreline change rates match patterns of beach responses to El Ninos
El Ninos
Beach widths generally narrow by >50%
Erosion hotspots fit observed pattern of shoreline rotations with beaches rotating clockwise at west and southwest facing beaches, and counterclockwise at east facing beaches.
Transport Rates
Evidence of alongshore transport about 1 mile per year with pulses of sand detectable primarily along stable beaches
Some of David Revell’s Conclusions