Embed Size (px)
Citation preview
SANS and USANS Investigation
of
Oil Uptake by Micellar Gels
Summer School on Small Angle Neutron Scattering and Neutron ReflectometryNIST Center for Neutron Research
A. Jackson, D. Mildner, J. Barker
May 10 – 14 2010
1

Contents
1 Introduction 31.1 Why use SANS? . . . . . . . . . . . . . . . . . . . . . . . . . . . . . . . . . . . . . . 4
2 The Objectives of the Experiment 6
3 The USANS Instrument 7
4 Planning the Experiment 94.1 Scattering Contrast . . . . . . . . . . . . . . . . . . . . . . . . . . . . . . . . . . . . . 94.2 Sample Thickness . . . . . . . . . . . . . . . . . . . . . . . . . . . . . . . . . . . . . . 104.3 Multiple Scattering . . . . . . . . . . . . . . . . . . . . . . . . . . . . . . . . . . . . . 114.4 Required q range . . . . . . . . . . . . . . . . . . . . . . . . . . . . . . . . . . . . . . 11
5 Collecting data 115.1 Configuring the instrument . . . . . . . . . . . . . . . . . . . . . . . . . . . . . . . . 115.2 What measurements to make . . . . . . . . . . . . . . . . . . . . . . . . . . . . . . . 125.3 How long to count . . . . . . . . . . . . . . . . . . . . . . . . . . . . . . . . . . . . . 135.4 Sample Transmission . . . . . . . . . . . . . . . . . . . . . . . . . . . . . . . . . . . . 13
5.4.1 Wide angle transmission . . . . . . . . . . . . . . . . . . . . . . . . . . . . . . 135.4.2 Rocking curve transmission . . . . . . . . . . . . . . . . . . . . . . . . . . . . 14
5.5 Multiple scattering estimate . . . . . . . . . . . . . . . . . . . . . . . . . . . . . . . . 145.6 Simulation of Scattering . . . . . . . . . . . . . . . . . . . . . . . . . . . . . . . . . . 14
6 Data reduction 15
7 Data Analysis 17
2
1 Introduction
Surfactants are molecules that have both hydrophilic (“water loving”) and hydrophobic (“waterhating”) components. In aqueous solvents such molecules self-assemble into structures that mini-mize contact between the solvent and hydrophobic segments. Micelles are one of a family of possiblestructures, with spherical, ellipsoidal, rod-like and disk-like micelles all being possible. A character-istic of micellar systems is the ability to solubilize oil through uptake into the hydrophobic micellecore - this is how your dish soap gets the grease off your plate.
This experiment will consider a surfactant with a polymerizable counterion and the uptake of oilby gels formed by cross-linking of micelles.
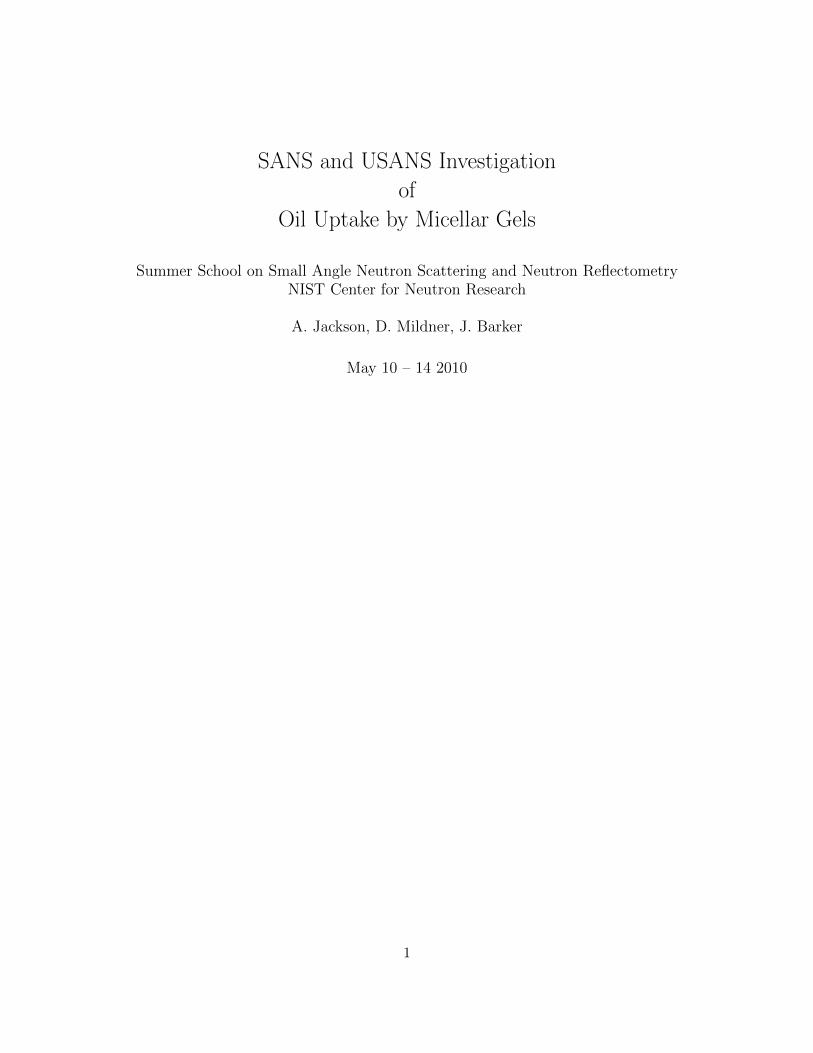
The surfactant in question is cetyltrimethylammonium 4-vinylbenzoate (CTVB) (figure 1), whichforms rod-like micelles at a concentration of 10 mg/ml. The vinylbenzoate counterion can thenbe polymerized such that each micelle becomes a poly-electrolyte counterion around an alkyl core.These rod-like micelles form a viscoelastic solution that can be further covalently cross-linked usingdivinylbenzene (DVB) to form a space-filling gel.
(a) cetyltrimethylammonium 4-vinylbenzoate
(b) 1,4-divinyl benzene
Figure 1: Components of the micellar gel
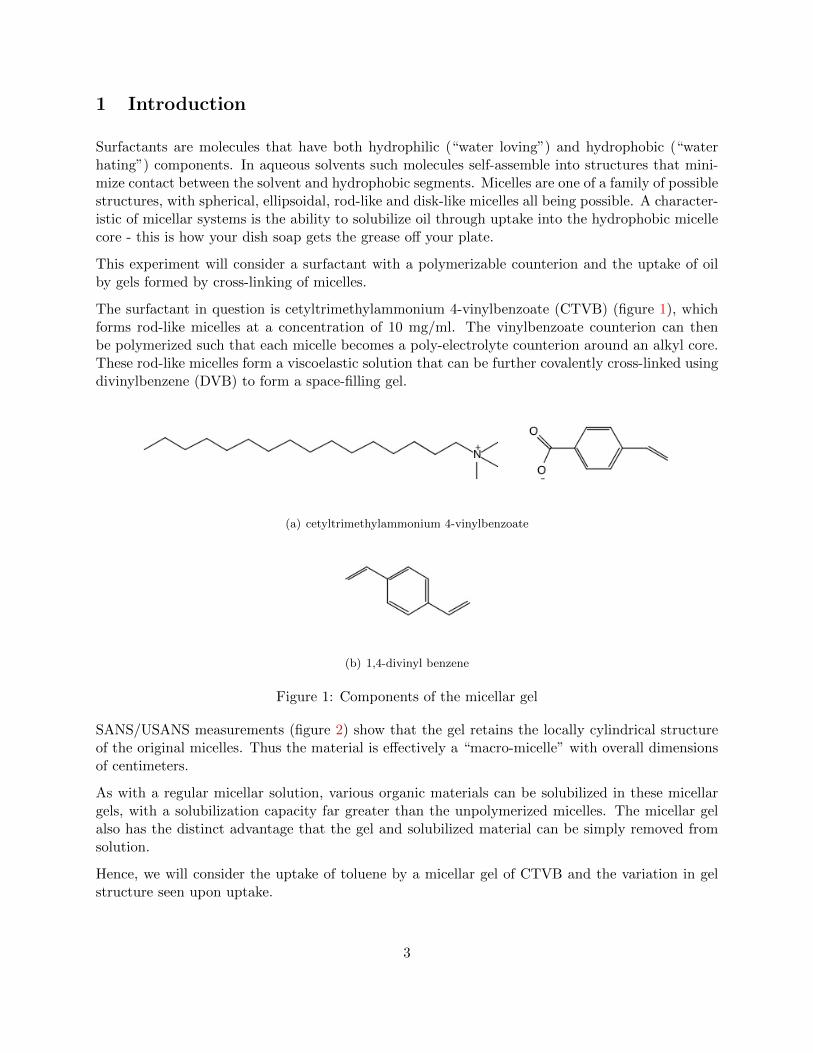
SANS/USANS measurements (figure 2) show that the gel retains the locally cylindrical structureof the original micelles. Thus the material is effectively a “macro-micelle” with overall dimensionsof centimeters.
As with a regular micellar solution, various organic materials can be solubilized in these micellargels, with a solubilization capacity far greater than the unpolymerized micelles. The micellar gelalso has the distinct advantage that the gel and solubilized material can be simply removed fromsolution.
Hence, we will consider the uptake of toluene by a micellar gel of CTVB and the variation in gelstructure seen upon uptake.
3
10-3
10-2
10-1
100
101
102
103
104
105
106
I(q)
10-4 10-3 10-2 10-1
q (A-1)
Gel in D2O - SANS / desmeared USANS
Figure 2: SANS/USANS measurement of gel in D2O
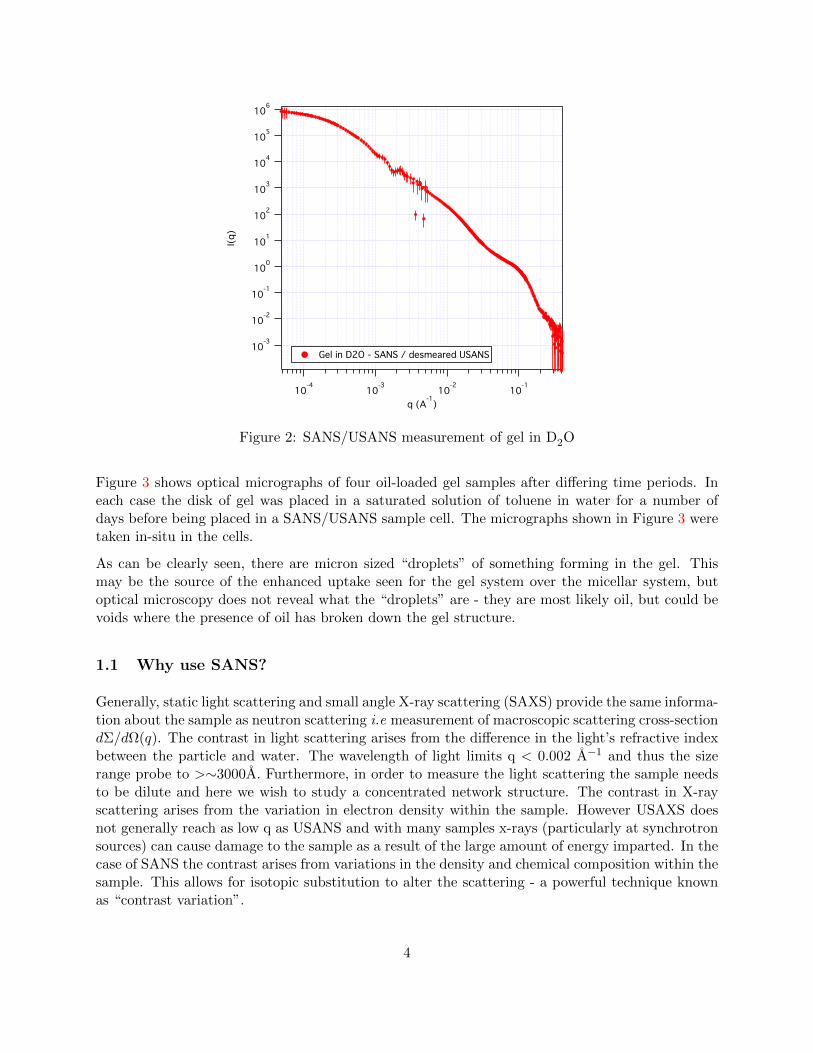
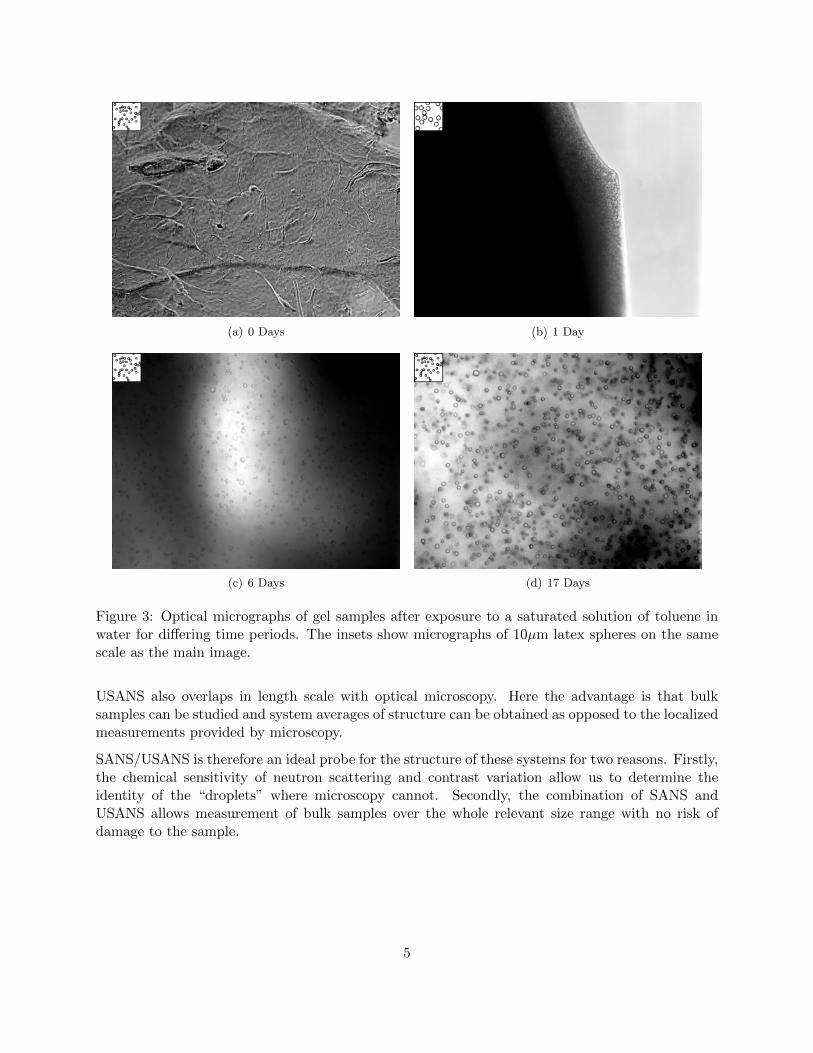
Figure 3 shows optical micrographs of four oil-loaded gel samples after differing time periods. Ineach case the disk of gel was placed in a saturated solution of toluene in water for a number ofdays before being placed in a SANS/USANS sample cell. The micrographs shown in Figure 3 weretaken in-situ in the cells.
As can be clearly seen, there are micron sized “droplets” of something forming in the gel. Thismay be the source of the enhanced uptake seen for the gel system over the micellar system, butoptical microscopy does not reveal what the “droplets” are - they are most likely oil, but could bevoids where the presence of oil has broken down the gel structure.
1.1 Why use SANS?
Generally, static light scattering and small angle X-ray scattering (SAXS) provide the same informa-tion about the sample as neutron scattering i.e measurement of macroscopic scattering cross-sectiondΣ/dΩ(q). The contrast in light scattering arises from the difference in the light’s refractive indexbetween the particle and water. The wavelength of light limits q < 0.002 A−1 and thus the sizerange probe to >∼3000A. Furthermore, in order to measure the light scattering the sample needsto be dilute and here we wish to study a concentrated network structure. The contrast in X-rayscattering arises from the variation in electron density within the sample. However USAXS doesnot generally reach as low q as USANS and with many samples x-rays (particularly at synchrotronsources) can cause damage to the sample as a result of the large amount of energy imparted. In thecase of SANS the contrast arises from variations in the density and chemical composition within thesample. This allows for isotopic substitution to alter the scattering - a powerful technique knownas “contrast variation”.
4
(a) 0 Days (b) 1 Day
(c) 6 Days (d) 17 Days
Figure 3: Optical micrographs of gel samples after exposure to a saturated solution of toluene inwater for differing time periods. The insets show micrographs of 10µm latex spheres on the samescale as the main image.
USANS also overlaps in length scale with optical microscopy. Here the advantage is that bulksamples can be studied and system averages of structure can be obtained as opposed to the localizedmeasurements provided by microscopy.
SANS/USANS is therefore an ideal probe for the structure of these systems for two reasons. Firstly,the chemical sensitivity of neutron scattering and contrast variation allow us to determine theidentity of the “droplets” where microscopy cannot. Secondly, the combination of SANS andUSANS allows measurement of bulk samples over the whole relevant size range with no risk ofdamage to the sample.
5

2 The Objectives of the Experiment
To determine the the gel structure with and without oil The scattering data obtained un-der various contrast conditions with and without oil will be analyzed using model independentand non-linear model fitting techniques to identify the structure of the gel over a wide lengthscale.
To determine the identity of the “droplets” The scattering from the droplets will be identi-fied and compared to predictions of scattering from possible droplet compositions.
6
3 The USANS Instrument
Fundamentally, the SANS experiment consists of measuring the number of neutrons scattered perincoming neutron as a function of scattering angle. Since the size probed is inversely proportionalto angle, to examine larger objects we need to measure scattering at smaller angles. In the case ofa “pinhole” SANS instrument this is achieved by moving a 2 dimensional detector relative to thesample such that a detector element subtends a smaller angle the further the detector is from thesample.
The SANS instruments at the NCNR can measure down to 8×10⁻⁴A−1 at their maximum sampleto detector distance and using lenses to focus the neutron beam. This implies a maximum sizeof measurable object of approximately 500nm. One can imagine simply making longer and longerinstruments to study larger and larger objects, however there a limitations to that approach. Firstlyneutrons have mass and so are affected by gravity. Hence they fall through a parabolic path as theytravel from source to detector. Secondly, the collimation required as the instrument gets longerreduces the flux of neutrons on the sample and counting times increase. Indeed, the count rate atthe detector varies with the fourth power of the resolution.
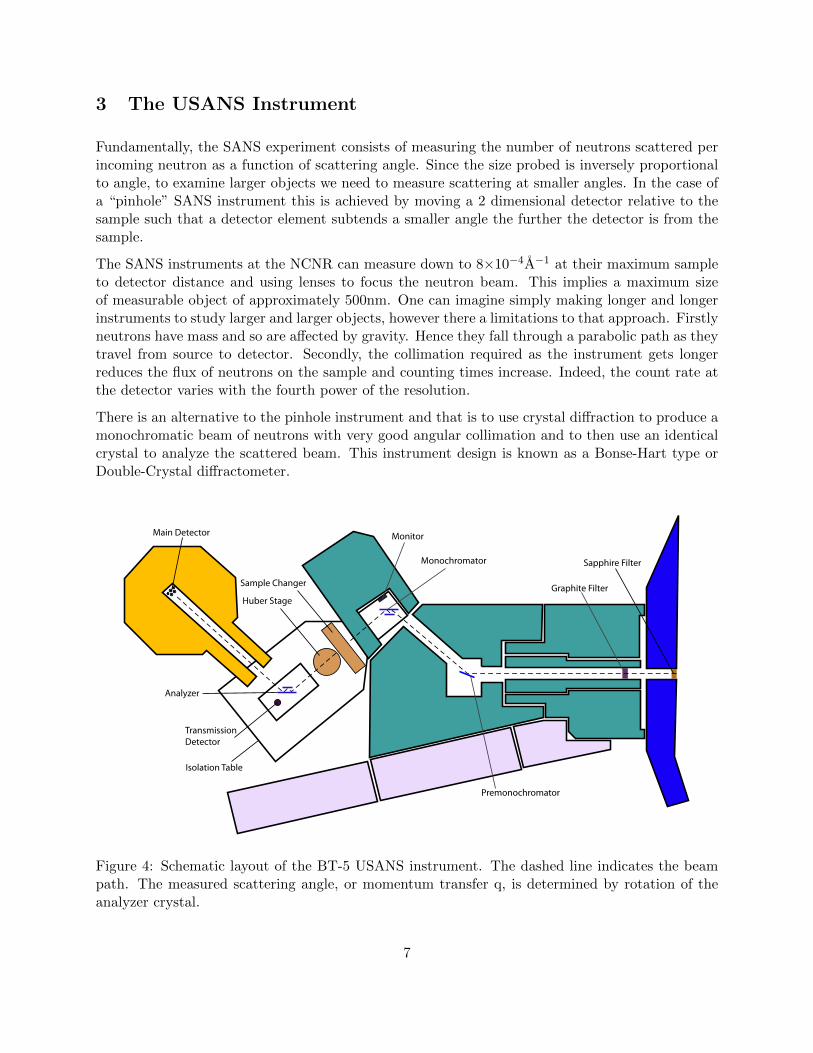
There is an alternative to the pinhole instrument and that is to use crystal diffraction to produce amonochromatic beam of neutrons with very good angular collimation and to then use an identicalcrystal to analyze the scattered beam. This instrument design is known as a Bonse-Hart type orDouble-Crystal diffractometer.
Main Detector
Analyzer
TransmissionDetector
Isolation Table
Sample Changer
Huber Stage
Monochromator
Premonochromator
Graphite Filter
Sapphire Filter
Monitor
Figure 4: Schematic layout of the BT-5 USANS instrument. The dashed line indicates the beampath. The measured scattering angle, or momentum transfer q, is determined by rotation of theanalyzer crystal.
7
Figure 4 show the schematic layout of the NCNR USANS instrument which is located on beamtube 5 (BT-5). A channel cut silicon crystal (monochromator) provides the neutron beam onto thesample, where the neutrons are scattered. A second identical channel cut crystal (analyzer) is thenplaced in the scattered beam path and rotated to select the scattering angle to be analyzed anddiffract the neutrons scattered at that angle into the detector. An experiment consists of rotatingthe analyzer to a series of angles and counting the number of neutrons that reach the detector.
The intensity of scattering on the detector after background correction in a USANS experiment isgiven by
Icor(q)s = εIbeam∆ΩAdsT (dΣs(q)
dΩ) (1)
where
ε is the detector efficiency
Ibeam is the number of neutrons per second incident on the sample
ds is the sample thickness
T is the sample transmission
∆Ω is the solid angle over which scattered neutrons are accepted by the analyzer
dΣs(q)dΩ is the measured scattering cross section, which is the true cross section modified by the
instrumental resolution function.
The aim of the experiment is to obtain the differential macroscopic scattering cross section dΣdΩ from
Imeas. How we can go about that process is described later, but first we need to decide how toprepare our sample for the measurement.
8
4 Planning the Experiment
Given the stated objectives of the experiment and knowledge of the instrument, how do we goabout preparing for the experiment to maximize our chances of success? Here we discuss some ofthe issues that bear on this question.
4.1 Scattering Contrast
In order for there to be small-angle scattering, there must be scattering contrast between, inthis case, the gel and the water, and the oil and the surrounding gel matrix. The scattering isproportional to the scattering contrast, ∆ρ, squared where
∆ρ = ρt − ρg (2)
and ρt and ρg are the scattering length densities (SLD) of the toluene and the gel matrix , respec-tively. Recall that SLD is defined as
ρ =1
V
N∑i
bi (3)
where V is the volume containing n atoms, and bi is the (bound coherent) scattering length of theith atom in the volume V. V is usually the molecular or molar volume for a homogenous phase inthe system of interest.
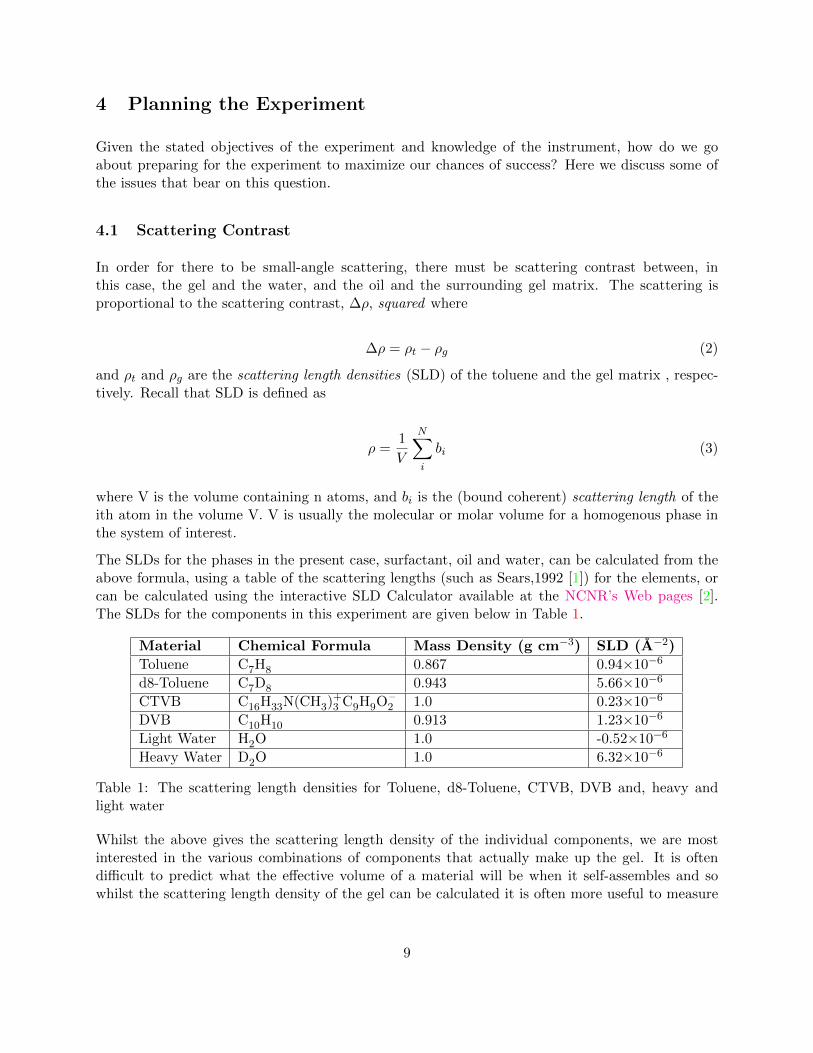
The SLDs for the phases in the present case, surfactant, oil and water, can be calculated from theabove formula, using a table of the scattering lengths (such as Sears,1992 [1]) for the elements, orcan be calculated using the interactive SLD Calculator available at the NCNR’s Web pages [2].The SLDs for the components in this experiment are given below in Table 1.
Material Chemical Formula Mass Density (g cm−3) SLD (A−2)
Toluene C7H8 0.867 0.94×10⁻⁶
d8-Toluene C7D8 0.943 5.66×10⁻⁶
CTVB C16H33N(CH3)+3 C9H9O –
2 1.0 0.23×10⁻⁶
DVB C10H10 0.913 1.23×10⁻⁶
Light Water H2O 1.0 -0.52×10⁻⁶
Heavy Water D2O 1.0 6.32×10⁻⁶
Table 1: The scattering length densities for Toluene, d8-Toluene, CTVB, DVB and, heavy andlight water
Whilst the above gives the scattering length density of the individual components, we are mostinterested in the various combinations of components that actually make up the gel. It is oftendifficult to predict what the effective volume of a material will be when it self-assembles and sowhilst the scattering length density of the gel can be calculated it is often more useful to measure
9
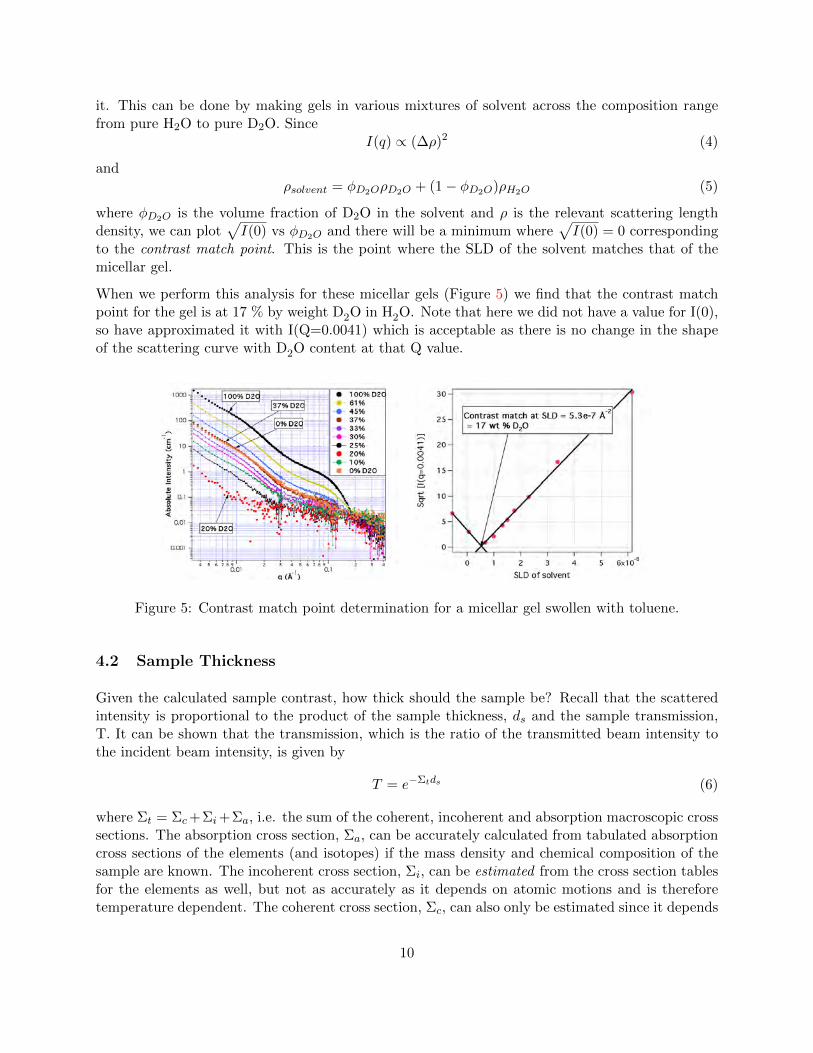
it. This can be done by making gels in various mixtures of solvent across the composition rangefrom pure H2O to pure D2O. Since
I(q) ∝ (∆ρ)2 (4)
andρsolvent = φD2OρD2O + (1− φD2O)ρH2O (5)
where φD2O is the volume fraction of D2O in the solvent and ρ is the relevant scattering lengthdensity, we can plot
√I(0) vs φD2O and there will be a minimum where
√I(0) = 0 corresponding
to the contrast match point. This is the point where the SLD of the solvent matches that of themicellar gel.
When we perform this analysis for these micellar gels (Figure 5) we find that the contrast matchpoint for the gel is at 17 % by weight D2O in H2O. Note that here we did not have a value for I(0),so have approximated it with I(Q=0.0041) which is acceptable as there is no change in the shapeof the scattering curve with D2O content at that Q value.
Figure 5: Contrast match point determination for a micellar gel swollen with toluene.
4.2 Sample Thickness
Given the calculated sample contrast, how thick should the sample be? Recall that the scatteredintensity is proportional to the product of the sample thickness, ds and the sample transmission,T. It can be shown that the transmission, which is the ratio of the transmitted beam intensity tothe incident beam intensity, is given by
T = e−Σtds (6)
where Σt = Σc+Σi+Σa, i.e. the sum of the coherent, incoherent and absorption macroscopic crosssections. The absorption cross section, Σa, can be accurately calculated from tabulated absorptioncross sections of the elements (and isotopes) if the mass density and chemical composition of thesample are known. The incoherent cross section, Σi, can be estimated from the cross section tablesfor the elements as well, but not as accurately as it depends on atomic motions and is thereforetemperature dependent. The coherent cross section, Σc, can also only be estimated since it depends
10
on the details of both the structure and the correlated motions of the atoms in the sample. Thisshould be no surprise as Σc as a function of angle is the quantity we are aiming to measure!
The scattered intensity is proportional to dsT and hence
Imeas ∝ dse−Σtds (7)
which has a maximum at ds = 1/Σt which implies an optimum transmission, Topt = 1/e = 0.37.The sample thickness at which this occurs is known as the “1/e length”.
The NCNR web based SLD calculator provides estimates of Σi and Σa and gives an estimate ofthe 1/e length as well as calculating the SLD.
4.3 Multiple Scattering
The analysis of small angle scattering data assumes that a neutron is scattered only once on passingthrough the sample and thus that the scattering angle is simply related to structure of the sample.However, if the small angle scattering is strong enough to result in multiple scattering, then theshape of the scattering curve will become distorted [4] and analysis essentially impossible. Thuswhen Σc is significantly larger than Σi+Σa the thickness should be chosen such that T > 0.9 ratherthan 0.37 to avoid problems with multiple scattering.
In this experiment, the optimum sample thickness has been determined to be 1mm.
4.4 Required q range
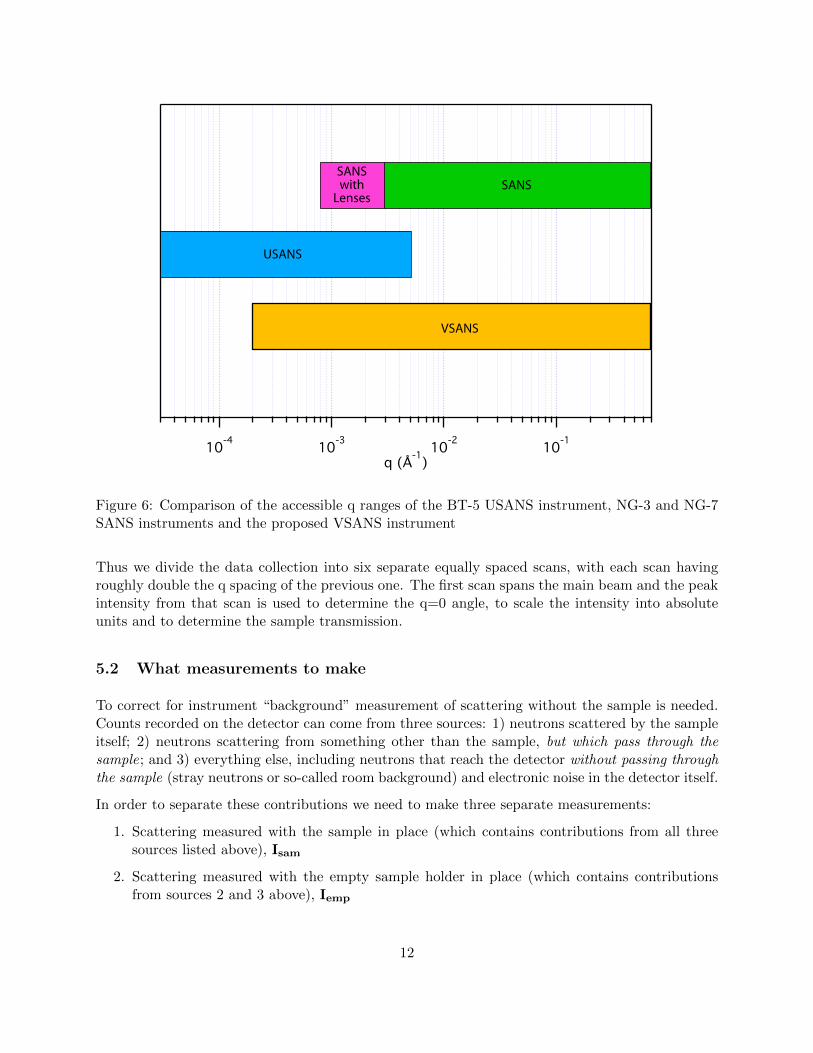
The q range that is routinely accessible using the BT-5 USANS instrument is 5 × 10⁻⁵A−1 to5×10−3A−1. Both low q and high q limits are in practice determined by whether there is measurablescattering above background since the analyzer can be set to count at any q. The high q valuechosen for an experiment is usually determined by the length scales of relevance to the sample andwhether overlap with the SANS measurement regime is required. Figure 6 shows the accessible qranges of the SANS and USANS instruments.
In this experiment we will be measuring to approximately 3× 10⁻³A−1.
5 Collecting data
As discussed earlier, the experiment consists of scanning the analyzer through a series of anglesand counting the scattered intensity on the detector. The first step before collecting the scatteringdata, therefore, is to decide which angles to measure at and how long to count at each.
5.1 Configuring the instrument
We need to measure over a range of angles spanning two orders of magnitude in q and an appropriateq spacing for around q=0 would lead to a huge excess of data points at around q=1×10⁻³A−1.
11
SANSwith
LensesSANS
USANS
VSANS
Figure 6: Comparison of the accessible q ranges of the BT-5 USANS instrument, NG-3 and NG-7SANS instruments and the proposed VSANS instrument
Thus we divide the data collection into six separate equally spaced scans, with each scan havingroughly double the q spacing of the previous one. The first scan spans the main beam and the peakintensity from that scan is used to determine the q=0 angle, to scale the intensity into absoluteunits and to determine the sample transmission.
5.2 What measurements to make
To correct for instrument “background” measurement of scattering without the sample is needed.Counts recorded on the detector can come from three sources: 1) neutrons scattered by the sampleitself; 2) neutrons scattering from something other than the sample, but which pass through thesample; and 3) everything else, including neutrons that reach the detector without passing throughthe sample (stray neutrons or so-called room background) and electronic noise in the detector itself.
In order to separate these contributions we need to make three separate measurements:
1. Scattering measured with the sample in place (which contains contributions from all threesources listed above), Isam
2. Scattering measured with the empty sample holder in place (which contains contributionsfrom sources 2 and 3 above), Iemp
12
3. Counts measured with a complete absorber at the sample position (which contains only thecontribution from source 3 above ), Ibgd
The Ibgd on the USANS instrument is predominantly due to fast neutrons. This background isindependent of instrument configuration as the fast neutrons are not coming along the beam path.It has been measured and is 0.018s−1, which equals 0.62 counts per 106 monitor counts. Thus wedo not usually measure a blocked beam run on USANS but use a fixed value for Ibgd
5.3 How long to count
A SANS experiment is an example of the type of counting experiment where the uncertainty, ormore precisely the standard deviation, σ, in the number of counts recorded in time, I(t) is givenby σ =
√I(t). Thus increasing the counting time by a factor of four will reduce the relative error,
σ/I by a factor of two. If there are 1000 total counts per data point, the standard deviation is√1000 which is approximately 30, giving a relative uncertainty of about 3%, which is good enough
for most purposes.
A related question is how long should the empty cell measurements be counted relative to the samplemeasurement. The same σ =
√I(t) relationship leads to the following approximate relationship
for optimal counting times
tbgdtsam
=
√Count RatebgdCount Ratesam
(8)
Hence if the scattering from the sample is weak, the background should be counted for as long as(but no longer than!) the sample scattering. If, however, the sample scattering count rate is, say,4 times greater than the background rate, the background should be counted for only half as longas the sample.
Since the scattering usually becomes much weaker at larger q, the time spent per data pointincreases with angle and the high q scans dominate the overall counting time.
5.4 Sample Transmission
The sample transmission is determined in two ways.
5.4.1 Wide angle transmission
A separate transmission detector (see figure 4), located behind the analyzer, collects all neutronsnot meeting the Bragg condition for the analyzer. When the analyzer is rotated to a sufficientlywide angle from the main beam orientation the transmission detector counts both the direct beamintensity and the coherently small angle scattered intensity. Thus the ratio of the count rate onthe transmission detector with and without the sample is the sample transmission (Twide) due toattenuation from incoherent scattering and absorption.
13
5.4.2 Rocking curve transmission
Rotating the analyzer through the main beam allows the intensity at q = 0 to be measured. Theratio of this intensity with and without the sample gives the transmission of the sample (Trock) dueto attenuation from incoherent scattering, absorption and coherent small angle scattering.
5.5 Multiple scattering estimate
The ratio of these separate transmission measurements can be used to estimate the amount ofmultiple scattering by determining the scattering power (τ = ΣSASds) by
TSAS =TRock
TWide= e−τ (9)
where ideally TSAS > 0.9
5.6 Simulation of Scattering
Given enough information about the chemical composition of the sample and expected scatteringproperties we can simulate the scattering to help us optimize the experimental setup. The reductionand analysis package provided for Igor Pro [5] by NIST [6] contains tools to help you do this.
The simulation takes input about your sample and simulates the data you would expect to collecton the instrument. This can guide you in deciding many of the factors discussed above such asappropriate sample thickness, counting time, and amount of multiple scattering. Additionally it canhelp decide on the density of data points to be collected for USANS or the instrument configurationsfor SANS.
14
6 Data reduction
Data reduction consists of correcting the measured scattering from the sample for the sources ofbackground discussed in section 5.2 and rescaling the observed, corrected data to an absolute scaleof scattering cross section per unit volume. This is done via equation (1) presented previously andreproduced here for reference:
Icor(q)s = εIbeam∆ΩAdsT (dΣs(q)
dΩ) (10)
The beam intensity, εIbeam, is measured by rotating the analyzer through the direct beam at q = 0with the empty cell in the beam path. The transmission, T, is measured by taking the ratio of thecount rate observed on the transmission detector with and without the sample in the beam path.The solid angle of scattering accepted by the analyzer, ∆ΩA, is given by
∆ΩA =
(λ
2π
)2
(2∆qv)∆qh (11)
where 2∆qv is the total vertical divergence of the beam convoluted with the angular divergenceaccepted by the detector and ∆qh is the horizontal divergence accepted for diffraction by monochro-mator and analyzer crystals. The instrument accepts scattered neutrons with ±∆qv = 0.117A−1.The horizontal resolution ∆qh is measured from the full width at half maximum (fwhm) of themain beam profile obtained by rotating the analyzer through the direct beam. The fwhm when thecrystal is properly aligned is 2.00 arcsec, equating to ∆qh = 2.55× 10⁻⁵A−1. Thus the solid angleover which neutrons are accepted by the analyzer is ∆ΩA = 8.6× 10⁻⁷ ster.
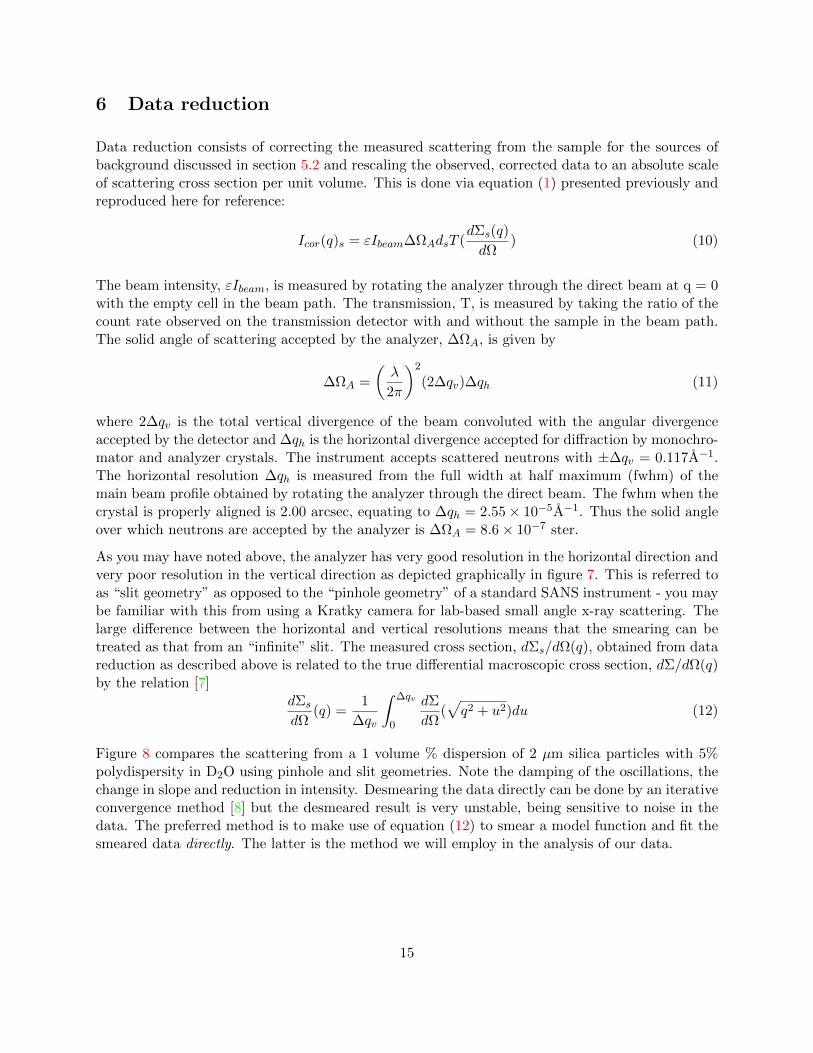
As you may have noted above, the analyzer has very good resolution in the horizontal direction andvery poor resolution in the vertical direction as depicted graphically in figure 7. This is referred toas “slit geometry” as opposed to the “pinhole geometry” of a standard SANS instrument - you maybe familiar with this from using a Kratky camera for lab-based small angle x-ray scattering. Thelarge difference between the horizontal and vertical resolutions means that the smearing can betreated as that from an “infinite” slit. The measured cross section, dΣs/dΩ(q), obtained from datareduction as described above is related to the true differential macroscopic cross section, dΣ/dΩ(q)by the relation [7]
dΣs
dΩ(q) =
1
∆qv
∫ ∆qv
0
dΣ
dΩ(√q2 + u2)du (12)
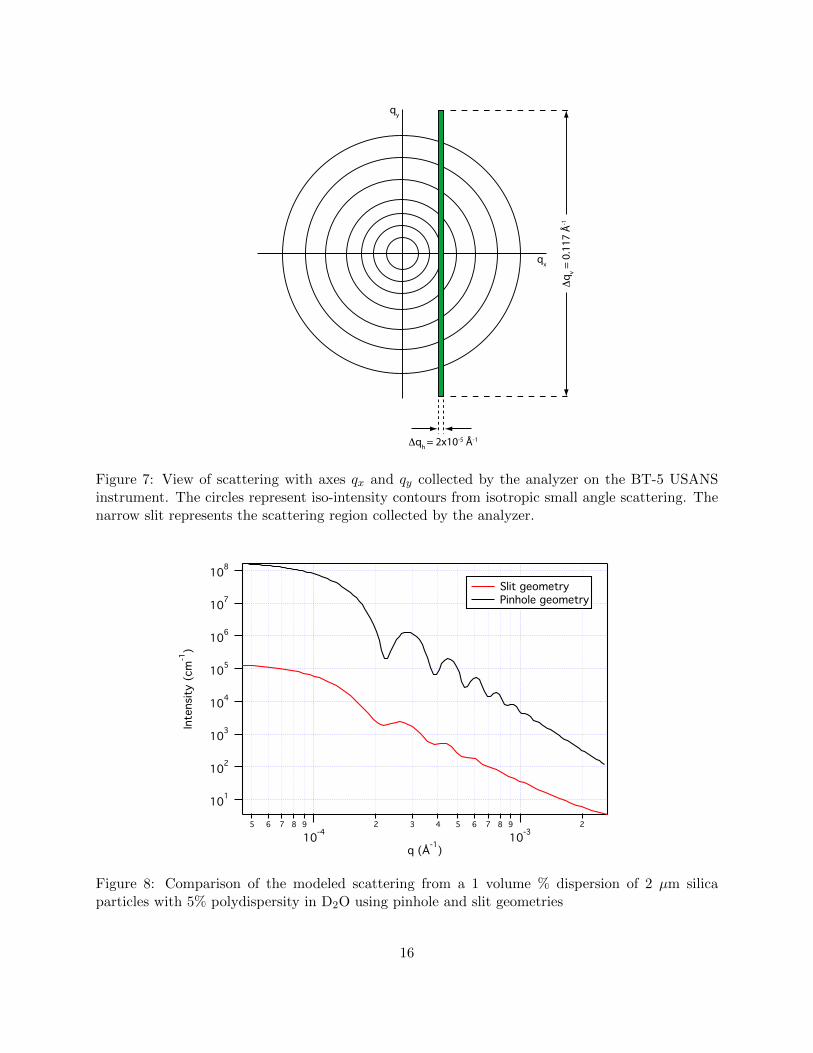
Figure 8 compares the scattering from a 1 volume % dispersion of 2 µm silica particles with 5%polydispersity in D2O using pinhole and slit geometries. Note the damping of the oscillations, thechange in slope and reduction in intensity. Desmearing the data directly can be done by an iterativeconvergence method [8] but the desmeared result is very unstable, being sensitive to noise in thedata. The preferred method is to make use of equation (12) to smear a model function and fit thesmeared data directly. The latter is the method we will employ in the analysis of our data.
15
qy
qx
Δqh
= 2x10⁻⁵ Å-1
Δq
v = 0
.117
Å-1
Figure 7: View of scattering with axes qx and qy collected by the analyzer on the BT-5 USANSinstrument. The circles represent iso-intensity contours from isotropic small angle scattering. Thenarrow slit represents the scattering region collected by the analyzer.
101
102
103
104
105
106
107
108
Inte
nsi
ty (
cm-1
)
5 6 7 8 9
10-4
2 3 4 5 6 7 8 9
10-3
2
q (-1
)
Slit geometry Pinhole geometry
Figure 8: Comparison of the modeled scattering from a 1 volume % dispersion of 2 µm silicaparticles with 5% polydispersity in D2O using pinhole and slit geometries
16

7 Data Analysis
At the summer school you will reduce and analyze data collected from samples of micellar gel beforeand after swelling with toluene to determine:
• The structure of the gel
• The oil content of the swollen gel
• The identity of the “droplets”
• The size of the “droplets”
17
References
[1] Sears, V.F. Neutron News 1992, 3, 29-37
[2] http://www.ncnr.nist.gov/resources/index.html
[3] Storm, C.; Pastore, J. J.; MacKintosh, F. C.; Lubensky, T. C.; Janmey, P. A. Nature 2005, 435,(7039), 191-194.
[4] Schelten, J.; Schmatz, W. J. Appl. Cryst. 1992, 13, 385-390
[5] Wavemetrics Inc, Lake Oswego, OR, USA (http://www.wavemetrics.com)
[6] http://www.ncnr.nist.gov/programs/sans/data/red anal.html
[7] Roe, R.J. Methods of X-Ray and Neutron Scattering in Polymer Science, Oxford UniversityPress, 2000
[8] Lake, J. Acta. Cryst. 1967, 23, 191-194
18