Embed Size (px)
Citation preview

In order to promote public education and public safety, equal justice for all, a better informed citizenry, the rule of law, world trade and world peace, this legal document is hereby made available on a noncommercial basis, as it is the right of all humans to know and speak the laws that govern them.
Republic of South Africa≠ EDICT OF GOVERNMENT ±
SANS 1929 (2011) (English): Ambient air quality -Limits for common pollutants


ISBN 978-0-626-26919-7 SANS 1929:2011Edition 2
SOUTH AFRICAN NATIONAL STANDARD
Ambient air quality — Limits for common pollutants
Published by SABS Standards Division 1 Dr Lategan Road Groenkloof Private Bag X191 Pretoria 0001Tel: +27 12 428 7911 Fax: +27 12 344 1568 www.sabs.co.za
SABS

SANS 1929:2011 Edition 2
Table of changes Change No. Date Scope
Foreword This South African standard was approved by National Committee SABS TC 146, Air quality, in accordance with procedures of the SABS Standards Division, in compliance with annex 3 of the WTO/TBT agreement. This document was published in December 2011. This document supersedes SANS 1929:2005 (edition 1.1). This document is referenced in the National Environmental Management: Air Quality Act, 2004 (Act No. 39 of 2004). Reference is made in the introductory paragraph of clause 3 to the �“relevant national legislation�”. In South Africa this means the National Framework for Air Quality Management in the Republic of South Africa as contemplated in section 7 of the National Environmental Management: air Quality Act, 2004 (Act No. 39 of 2004). Reference is made in 3.1.4 to the �“relevant national legislation�”. In South Africa this means the Occupational Health and Safety Act, 1993 (Act No. 85 of 1993). Reference is made in 3.1.14, 4.2.1 and 4.2.2 to the �“relevant national legislation�”. In South Africa this means the National Environmental Management: Air Quality Act, 2004 (Act No. 39 of 2004). Reference is made in 3.1.15.1 to the �“relevant national legislation�”. In South Africa this means the Local Government: Municipal Structures Act, 1998 (Act No. 117 of 1998). Reference is made in 3.1.15.2 to the �“relevant national legislation�”. In South Africa this means section 103 of the Constitution of the Republic of South Africa, 1996 (Act No. 108 of 1996). Annexes A, B and E form an integral part of this document. Annexes C, D, F and G are for information only. Introduction The National Framework for Air Quality Management in South Africa makes provision for the establishment of air quality objectives for the protection of human health and the environment as a whole. Such air quality objectives include limit values, alert thresholds and target values. Margins of tolerance, time frames for achieving compliance with limit values and permissible frequencies of exceeding limit values are determined to enable the implementation of limit values for the purpose of air quality management and planning. These values are based on assessments that establish the ambient concentrations of prioritized pollutants, and evaluate the technical feasibility, economic viability and social and political acceptability of implementing measures to reduce and maintain air quality within limit values. The numerical values for limit values, alert thresholds and target values are based on the findings of work carried out by international scientific groups active in the field, taking into account the wealth of local knowledge and relevant local conditions. Although the National Framework makes provision for establishing air quality objectives for the protection of human health and the environment, it stipulates that limit values are initially set to protect human health. The setting of such limit values represents the first step in a process to manage air quality and initiate a process to ultimately achieve air quality that is not harmful to health and wellbeing nationally. The limit values presented in this standard can therefore not be viewed in isolation, but should be seen as one part of an air quality management programme. The limit values will also be revised in future to address impacts on other components of the environment such as vegetation and ecosystems, and other pollutants of concern may also be included.

SANS 1929:2011 Edition 2
1
Contents
Page Foreword Introduction 1 Scope .................................................................................................................................. 3 2 Normative references.......................................................................................................... 3 3 Definitions and abbreviations .............................................................................................. 4 4 Limits for common pollutants .............................................................................................. 5
4.1 General .................................................................................................................... 5 4.2 Provisions for progressive compliance with limit values ......................................... 5 4.3 Sulfur dioxide (SO2)................................................................................................... 6 4.4 Nitrogen dioxide (NO2) .............................................................................................. 6 4.5 Carbon monoxide (CO) ............................................................................................. 6 4.6 Particulate matter (PM10).......................................................................................... 7 4.7 Particulate matter (PM2.5) ......................................................................................... 8 4.8 Ozone (O3) ............................................................................................................... 8 4.9 Lead (Pb).................................................................................................................. 8 4.10 Benzene (C6H6) ........................................................................................................ 9 4.11 Dust deposition ........................................................................................................ 9
5 Assessment of air pollutant concentrations ........................................................................ 10 6 Report and review ............................................................................................................... 12 Annex A (normative) Location of sampling points for the measurement of atmospheric pollutants in ambient air ................................................. 13 Annex B (normative) Criteria for determining the number of sampling points for fixed measurement of concentrations of atmospheric pollutants in ambient air ...................................................................................... 16 Annex C (informative) Data quality objectives and compilation of the results of air quality assessment ............................................................................. 18 Annex D (informative) Basis for setting an annual limit value for benzene............................ 20 Annex E (normative) Measurements of ozone precursor substances ................................. 21 Annex F (informative) Target levels for PM10, SO2 and Pb.................................................... 22 Annex G (informative) The use of air quality models.............................................................. 23 Bibliography.............................................................................................................................. 31

SANS 1929:2011 Edition 2
2
This page is intentionally left blank

SANS 1929:2011 Edition 2
3
Ambient air quality — Limits for common pollutants 1 Scope This standard gives limit values for common air pollutants to ensure that the negative effects of such pollutants on human health are prevented or reduced. Limit values given in this standard are expressed for common pollutants as are permissible frequencies by which limit values may be exceeded. 2 Normative references The following referenced documents are indispensable for the application of this document. For dated references, only the edition cited applies. For undated references, the latest edition of the referenced document (including any amendments) applies. Information on currently valid national and international standards can be obtained from the SABS Standards Division. ASTM D1739, Standard test method for the collection measurement of dustfall (settleable particulate matter). EN 12341, Air Quality – Determination of the PM10 fraction of suspended particulate matter – Reference method and field test procedure to demonstrate reference equivalence of measurement methods. ISO 4224, Ambient air – Determination of carbon monoxide – Non-dispersive infrared spectrometric method. ISO 5725-1, Accuracy (trueness and precision) of measurement methods and results – Part 1: General principles and definitions. ISO 6767, Ambient air – Determination of the mass concentration of sulfur dioxide – Tetrachloromercurate (TCM)/pararosaniline method. ISO 7996, Ambient air – Determination of the mass concentrations of nitrogen oxides – Chemiluminescence method. ISO 9855, Ambient air – Determination of the particulate lead content of aerosols collected on filters – Atomic absorption spectrometric method. ISO 13964, Air quality – Determination of ozone in ambient air – Ultraviolet photometric method.

SANS 1929:2011 Edition 2
4
3 Definitions and abbreviations For the purposes of this document, the definitions and abbreviations given in the relevant national legislation (see foreword) and the following apply. 3.1 Definitions 3.1.1 agglomeration area with a population of 250 000 or more inhabitants or, where the population is less than 250 000 inhabitants, a population density per square kilometre that justifies the need for ambient air quality to be assessed and managed 3.1.2 alert threshold levels of ambient air quality where pre-emptive governance interventions are triggered that provide an adequate intervention development buffer between air that is considered harmful and air that is not considered harmful to health and wellbeing 3.1.3 ambient air outdoor air in the troposphere, excluding air regulated by the relevant national legislation (see foreword) , where air quality is determined in accordance with this standard 3.1.4 assessment method that is used to measure, calculate, predict or estimate the level of a pollutant in the ambient air 3.1.5 average period period over which the average value is determined 3.1.6 data capture ratio of the time for which the instrument produces valid data, to the time for which the statistical parameter or aggregate value is calculated 3.1.7 level concentration of a pollutant in ambient air or the mass deposition thereof on surfaces over a given time 3.1.8 limit value level that is fixed on the basis of scientific knowledge, with the aim of reducing harmful effects on human health, wellbeing or the environment, that is attained within a given compliance period and that does not exceed the number of permissible exceedances once attained 3.1.9 lower assessment threshold 99th percentile pollutant levels that represent a pollutant value below 50 % of all limit values, taking into account limit values for all periods which have been used to derive averages

SANS 1929:2011 Edition 2
5
3.1.10 particulate matter (PM10) substance that passes through a size-selective inlet with a 50 % efficiency cut-off at 10 µm aerodynamic diameter 3.1.11 pollutant substance that is introduced directly or indirectly by man into the ambient air and that is likely to have harmful effects on human health, wellbeing or the environment 3.1.12 target value aspirational level that is based on current scientific knowledge, with the aim of minimizing or avoiding harmful effects on human health, wellbeing or the environment 3.1.13 time coverage percentage of the time that is considered for setting the threshold value during which the pollutant is measured 3.1.14 upper assessment threshold 99th percentile pollutant levels that represent a pollutant value exceeding 70 % of a limit value, taking into account limit values for all periods which have been used to derive averages 3.2 Abbreviations EC: European Commission GEP: good engineering practice VOC: volatile organic compound 4 Limits for common pollutants 4.1 General 4.1.1 It is recognized that, although national limit values laid down primarily aim at the protection of human health, these limit values might be revised in future to address impacts on other components of the environment such as vegetation and ecosystems. 4.1.2 Concentrations shall be expressed at a standardized temperature of 25 °C and a pressure of 101,3 kPa. 4.1.3 Where test methods are specified, any other method that can be demonstrated to give equivalent results may be used. 4.1.4 Compliance with the limit values shall be at 99 % of each average period specified in this standard. 4.2 Provisions for progressive compliance with the standards 4.2.1 Compliance with the standards shall be on the date of publication in terms of the relevant national legislation (see foreword).

SANS 1929:2011 Edition 2
6
4.2.2 Municipalities that do not comply with these standards shall be required to develop and implement an air quality management plan, as required in terms of the relevant national legislation (see foreword) to progressively meet compliance within the prescribed time frame. 4.3 Sulfur dioxide (SO2) NOTE For the purposes of this standard �“sulfur�” is deemed to be equivalent to �“sulphur�”. 4.3.1 The limit values, average periods and number of permissible exceedances for sulfur dioxide are stipulated in table 1.
Table 1 — Limits for SO2
1 2 3
Average period Concentration µg/m3
Frequency of exceedances
10 min 500 526
1 h 350 88
24 h 125 4
1 year 50 0
4.3.2 The reference method for the analysis of SO2 shall be the tetrachloromercurate(TCM)/ pararosaniline method in accordance with ISO 6767. 4.4 Nitrogen dioxide (NO2) 4.4.1 Limit values, average periods and number of permissible exceedances for nitrogen dioxide are stipulated in table 2.
Table 2 — Limits for NO2
1 2 3
Average period Concentration µg/m3
Frequency of exceedances
1 hour 200 88
1 year 40 0
4.4.2 The reference method for the analysis of nitrogen dioxide shall be ISO 7996. 4.5 Carbon monoxide (CO) 4.5.1 The limit values, average periods and number of permissible exceedances for carbon monoxide are stipulated in table 3.

SANS 1929:2011 Edition 2
7
Table 3 — Limits for CO
1 2 3
Average period Concentration mg/m3
Frequency of exceedances
1 h 30 88
8 h (calculated on 1-hourly averages) 10 11
4.5.2 The maximum daily 8-hourly mean concentration shall be selected by examining 8-hourly running averages, calculated from hourly data and updated each hour. Each 8-hourly average so calculated shall be assigned to the day on which it ends, thus, the first calculation period for any one day will be the period from 17:00 on the previous day to 01:00 on that day. The last calculation period for any one day shall be the period from 16:00 to 24:00 on that day. 4.5.3 The reference method for analysis of CO shall be ISO 4224. 4.6 Particulate matter (PM10) 4.6.1 The limit values, average periods and number of permissible exceedances for particulate matter (PM10) are stipulated in table 4.
Table 4 — Limits for PM10
1 2 3
Average period Concentration µg/m3
Frequency of exceedances
Interim
24 h 120 4
1 year 50 0
Target
24 h 75 4
1 year 40 0
4.6.2 With regard to the setting of limit values for particulate matter, the following shall be recognized: a) different types of particles can have different harmful effects on human health; b) there is evidence that risks to human health associated with exposure to anthropogenic PM10 are
higher than risks associated with exposure to naturally occurring particles in ambient air; and c) insofar as they relate to PM10, action plans and other reduction strategies should aim to reduce
concentrations of fine particles as part of the total reduction in concentrations of particulate matter.
4.6.3 The reference method for the determination of the PM10 fraction of suspended particulate matter shall be EN 12341.
SANS 1929:2011 Edition 2
8
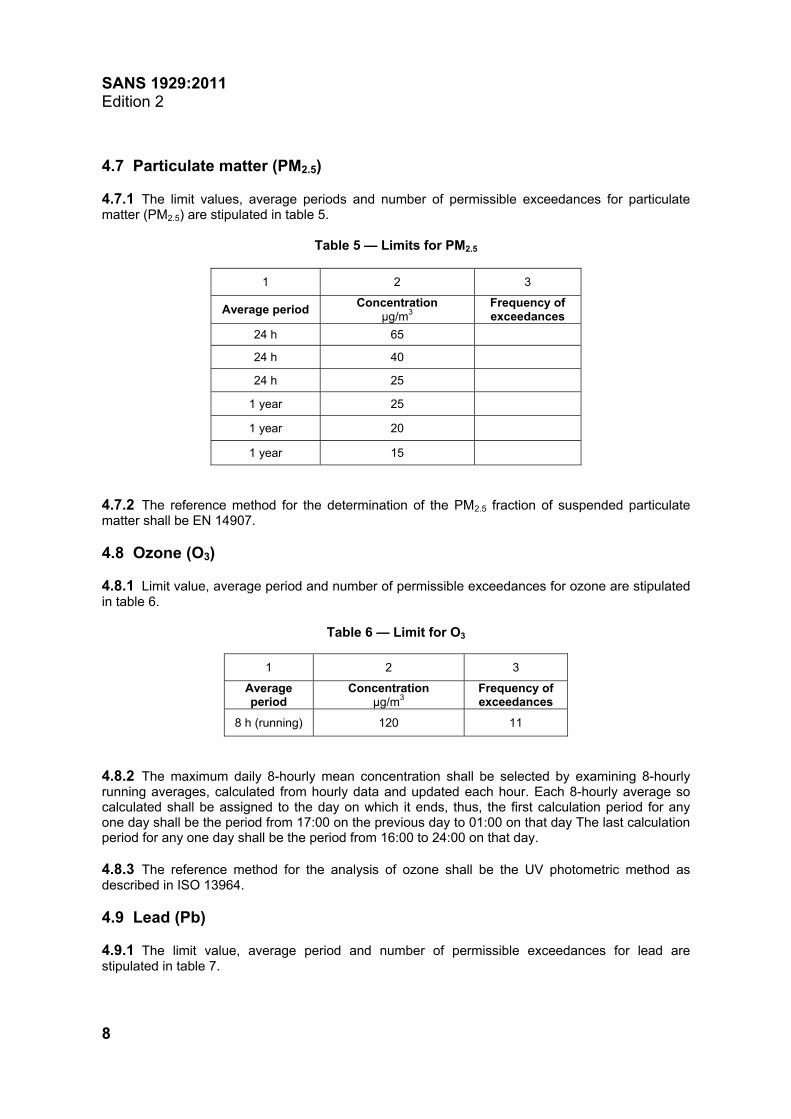
4.7 Particulate matter (PM2.5) 4.7.1 The limit values, average periods and number of permissible exceedances for particulate matter (PM2.5) are stipulated in table 5.
Table 5 — Limits for PM2.5
1 2 3
Average period Concentration µg/m3
Frequency of exceedances
24 h 65
24 h 40
24 h 25
1 year 25
1 year 20
1 year 15
4.7.2 The reference method for the determination of the PM2.5 fraction of suspended particulate matter shall be EN 14907. 4.8 Ozone (O3) 4.8.1 Limit value, average period and number of permissible exceedances for ozone are stipulated in table 6.
Table 6 — Limit for O3
1 2 3
Average period
Concentration µg/m3
Frequency of exceedances
8 h (running) 120 11
4.8.2 The maximum daily 8-hourly mean concentration shall be selected by examining 8-hourly running averages, calculated from hourly data and updated each hour. Each 8-hourly average so calculated shall be assigned to the day on which it ends, thus, the first calculation period for any one day shall be the period from 17:00 on the previous day to 01:00 on that day The last calculation period for any one day shall be the period from 16:00 to 24:00 on that day. 4.8.3 The reference method for the analysis of ozone shall be the UV photometric method as described in ISO 13964. 4.9 Lead (Pb) 4.9.1 The limit value, average period and number of permissible exceedances for lead are stipulated in table 7.

SANS 1929:2011 Edition 2
9
Table 7 — Limits for Pb
1 2 3
Average period Concentration µg/m3
Frequency of exceedances
1 year 0,5 0
4.9.2 The reference method for the analysis of lead shall be ISO 9855. 4.10 Benzene (C6H6) 4.10.1 Limit values, average period and number of permissible exceedances for benzene are stipulated in table 8.
Table 8 — Limits for C6H6
1 2 3
Average period Concentration µg/m3
Frequency of exceedances
Interim
1 year 10 0
Target
1 year 5 0
4.10.2 The reference methods for the sampling and analysis of benzene shall either be EPA compendium method TO-14 A or method TO-17. 4.11 Dust deposition 4.11.1 The four-band scale that shall be used in the evaluation of dust deposition is stipulated in table 9. NOTE Dust deposition rates are expressed in units of milligrams per square metre per·day over a 30-day average period. 4.11.2 The target, action and alert thresholds for ambient dust deposition are stipulated in table 10. 4.11.3 Dustfalls that exceed the specified rates but that can be shown to be the result of some extreme weather or geological event shall be discounted for the purpose of enforcement and control. Such an event might typically result in excessive dustfall rates across an entire metropolitan region, and not be localized to a particular operation. Natural seasonal variations, for example the naturally windy months each year, will not be considered extreme events for this definition. 4.11.4 The reference method for measuring dustfall shall be ASTM D1739.

SANS 1929:2011 Edition 2
10
Table 9 — Four-band scale evaluation criteria for dust deposition
1 2 3 4
Band number
Band description
label
Dustfall rate, D (mg/m-2·day-1,
30-day average) Comment
1 Residential D < 600 Permissible for residential and light commercial
2 Industrial D 1 200 Permissible for heavy commercial and industrial.
3 Action 1 200 < D 2 400 Requires investigation and remediation if two sequential months lie in this band, or more than three occur in a year
4 Alert D >2 400
Immediate action and remediation required following the first incidence of the dustfall rate being exceeded. Incident report to be submitted to the relevant authority
Table 10 — Target, action and alert thresholds for dust deposition
1 2 3 4
Level Dustfall rate, D (mg/m-2·day-1, 30-d average)
Average period
Permitted frequency of exceeding dustfall rate
Target 300 Annual
Action residential 600 30 days Three within any year, no two sequential months
Action industrial 1 200 30 days Three within any year, not sequential months
Alert threshold 2 400 30 days None. First incidence of dustfall rate being exceeded requires remediation and compulsory report to the relevant authorities
5 Assessment of air pollutants concentrations 5.1 In order to determine applicable assessment methods for specific pollutants within each area, including zones and agglomerations, the concentrations of sulfur dioxide, nitrogen dioxide, particulate matter, ozone, lead, carbon monoxide and benzene shall be evaluated against the following thresholds: a) The upper assessment threshold, i.e. the 99th percentile pollutant levels represent a pollutant
value exceeding 70 % of a limit value (taking into account limit values for all periods that have been used to derive averages).
b) The lower assessment threshold, i.e. the 99th percentile pollutant levels represent a pollutant
value below 50 % of all limit values (taking into account limit values for all periods that have been used to derive averages).

SANS 1929:2011 Edition 2
11
5.2 Provision is made for three air pollutants concentration assessment methods used in areas, including zones and agglomerations, based on the classification pollutants concentrations relative to the upper and lower assessment thresholds. These methods are a) mandatory monitoring, which may be supplemented by modelling techniques to provide an
adequate level of information on ambient air quality. This method shall be implemented in areas where the upper assessment threshold for a specific pollutant is exceeded,
b) a combination of measurement and modelling techniques that shall be implemented in areas
and for pollutants for which concentrations are between the upper and lower assessment thresholds, and
c) the sole use of modelling or objective estimation techniques; this is permissible in areas with and
for pollutants concentration below the lower assessment threshold. 5.3 The classification of areas and agglomerations to determine applicable assessment methods shall be based on air pollutants concentrations recorded during the previous five years where sufficient data are available. Where fewer than five years' data are available, results from measurement campaigns of short duration during the period of the year and at locations likely to be typical of the highest pollution levels may be combined with information from emission inventories and modelling to provide the concentration data required. Classification should be reviewed earlier than every five years in the event of significant changes in activities relevant to ambient air pollutants concentrations. 5.4 Where pollutants have to be measured, the measurements shall be taken at fixed sites determined by appropriate assessment. The analyser can be permanent or movable, but in the case of movable analysers they shall monitor at each site for at least two weeks in every two�–month period. The measurements shall be taken either continuously or by random sampling. The number of measurements shall be sufficiently large to enable the levels observed to be determined. 5.5 The criteria for determining the location of sampling points for the measurement of SO2, NO2, particulate matter (PM10), O3, Pb, CO and C6H6 in ambient air shall be those listed in annex A. The minimum number of sampling points for fixed measurements of concentrations of each relevant pollutant shall be as laid down in annex B and they shall be installed in each zone or agglomeration within which measurement is required, if fixed measurement is the sole source of data on concentrations within it. NOTE See annex C for the compilation of results, and annex D for the setting of an annual limit value for C6H6. 5.6 Measurements of nitrogen dioxide shall be made at a minimum of 50 % of the ozone sampling points as required in B.2. Measurement of nitrogen dioxide shall be continuous, except at rural background stations, as defined in A.2, where other measurement methods may be used. 5.7 In the case of zones and agglomerations within which information from fixed measurement stations is supplemented by information from other sources, such as emissions, inventories, indicative measurement methods and air quality modelling, the number of fixed measuring stations to be installed and the spatial resolution of other techniques shall be sufficient for the concentrations of air pollutants to be established in accordance with A.1 and A.2, in consideration of data capture and time coverage (see 3.1.6 and 3.1.13, respectively). 5.8 In the case of zones and agglomerations within which information from sampling points for fixed measurement of ozone is supplemented by information from modelling or indicative measurement (or both), the number of sampling points specified in B.2 may be reduced, provided that:

SANS 1929:2011 Edition 2
12
a) the number of sampling points in each zone or agglomeration amounts to at least one sampling point per two million inhabitants or one sampling point per 50 000 km2, whichever produces the greater number of sampling points;
b) each zone or agglomeration contains at least one sampling point; and c) nitrogen dioxide is measured at all remaining sampling points except at rural background
stations. 5.9 In the case of zones and agglomerations within which measurement is not required, modelling or objective estimation techniques may be used. 5.10 The reference methods for the sampling and analysis of SO2, NO2, PM10, O3, Pb, CO and C6H6 shall be as given in the relevant clauses of this standard. 5.11 Any amendments necessary to adapt the assessment of air pollutants concentrations and annexes A to E to scientific and technical progress shall ensure that such adaptations do not have the effect of modifying the limit values or alert thresholds either directly or indirectly. 5.12 Each provincial authority shall ensure that at least one measuring station that supplies data on concentrations of the ozone precursor substances listed in annex E, is installed and operated within its province. Each province shall choose the number and siting of the station at which ozone precursor substances are to be measured, taking into account the objectives, methods and recommendations given in annex E. 5.13 The reference techniques for air quality modelling shall be as given in annex F. 6 Report and review In order to facilitate the review of this standard the national authority will encourage research into the effects of the pollutants referred to herein, namely sulfur dioxide, nitrogen dioxide (and oxides of nitrogen), particulate matter, lead, carbon monoxide, ozone and benzene. Amendments necessary for adaptation to scientific and technical progress may relate solely to criteria and techniques for the assessment of pollutants concentrations or detailed arrangements for forwarding information, and may not have the effect of modifying limit values or alert thresholds either directly or indirectly. NOTE See annex G for air quality models.

SANS 1929:2011 Edition 2
13
Annex A (normative)
Location of sampling points for the measurement of
atmospheric pollutants in ambient air A.1 Macroscale siting of SO2, NO2, PM10, CO, C6H6 and Pb sampling points A.1.1 Sampling points directed at the protection of human health shall be sited a) to provide data on the areas within zones and agglomerations where the highest concentrations
of pollutants occur to which the population is likely to be directly or indirectly exposed for a period that is significant in relation to the period used to derive averages in the case of limit value(s), and
b) to provide data on levels in other areas within the zones and agglomerations that are
representative of the exposure of the general population. A.1.2 Sampling points shall be sited to avoid measuring very small micro-environments in their immediate vicinity. As a guideline, a sampling point shall be sited to be representative of air quality in a surrounding area of not less than 200 m2 at traffic-orientated sites and of several square kilometres at urban-background sites. A.1.3 Sampling points should also, where possible, be representative of similar locations not in their immediate vicinity. A.2 Macroscale siting of O3 sampling points The macroscale siting criteria in table A.1 shall be used to assess the exposure of specific populations. A.3 Macroscale siting of dustfall sampling points The number and location of samplers shall be sufficient to monitor dustfall at representative locations around the dust source, and will include monitors located at human residences and sensitive businesses, industrial or agricultural locations within a maximum distance of 2 km from the source boundary. Micro-surroundings of the samplers shall, where possible, comply with ASTM D1739. Dustfall monitors may also be located within the boundaries of the industrial plant as defined by the legal, fenced boundaries of the enterprise, for industrial control purposes. Even when included in general environmental reports, these site-internal monitors shall not be evaluated against the dust deposition evaluation criteria stipulated in 4.11.1.
SANS 1929:2011 Edition 2
14
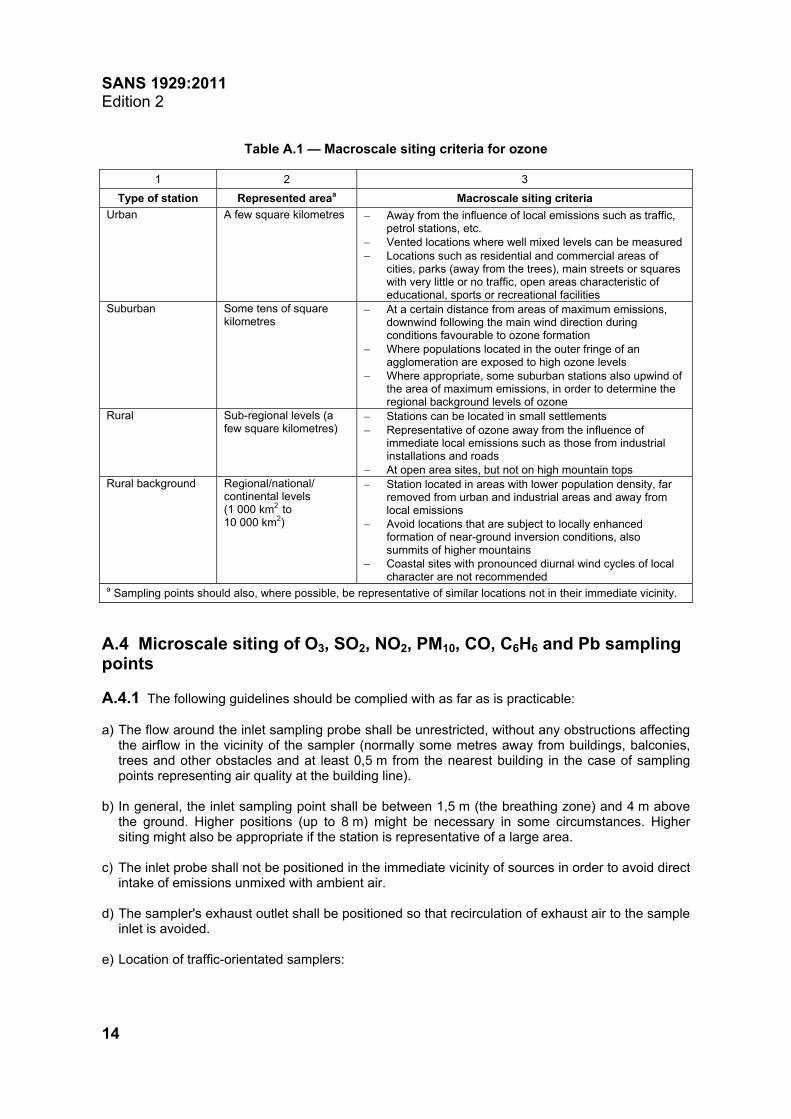
Table A.1 — Macroscale siting criteria for ozone
1 2 3
Type of station Represented areaa Macroscale siting criteria Urban A few square kilometres Away from the influence of local emissions such as traffic,
petrol stations, etc. Vented locations where well mixed levels can be measured Locations such as residential and commercial areas of
cities, parks (away from the trees), main streets or squares with very little or no traffic, open areas characteristic of educational, sports or recreational facilities
Suburban Some tens of square kilometres
At a certain distance from areas of maximum emissions, downwind following the main wind direction during conditions favourable to ozone formation
Where populations located in the outer fringe of an agglomeration are exposed to high ozone levels
Where appropriate, some suburban stations also upwind of the area of maximum emissions, in order to determine the regional background levels of ozone
Rural Sub-regional levels (a few square kilometres)
Stations can be located in small settlements Representative of ozone away from the influence of
immediate local emissions such as those from industrial installations and roads
At open area sites, but not on high mountain tops Rural background Regional/national/
continental levels (1 000 km2 to 10 000 km2)
Station located in areas with lower population density, far removed from urban and industrial areas and away from local emissions
Avoid locations that are subject to locally enhanced formation of near-ground inversion conditions, also summits of higher mountains
Coastal sites with pronounced diurnal wind cycles of local character are not recommended
a Sampling points should also, where possible, be representative of similar locations not in their immediate vicinity. A.4 Microscale siting of O3, SO2, NO2, PM10, CO, C6H6 and Pb sampling points A.4.1 The following guidelines should be complied with as far as is practicable: a) The flow around the inlet sampling probe shall be unrestricted, without any obstructions affecting
the airflow in the vicinity of the sampler (normally some metres away from buildings, balconies, trees and other obstacles and at least 0,5 m from the nearest building in the case of sampling points representing air quality at the building line).
b) In general, the inlet sampling point shall be between 1,5 m (the breathing zone) and 4 m above
the ground. Higher positions (up to 8 m) might be necessary in some circumstances. Higher siting might also be appropriate if the station is representative of a large area.
c) The inlet probe shall not be positioned in the immediate vicinity of sources in order to avoid direct
intake of emissions unmixed with ambient air. d) The sampler's exhaust outlet shall be positioned so that recirculation of exhaust air to the sample
inlet is avoided. e) Location of traffic-orientated samplers:

SANS 1929:2011 Edition 2
15
1) for all pollutants, such sampling points shall be at least 25 m from the edge of major junctions and at least 4 m from the centre of the nearest traffic lane;
2) for nitrogen dioxide and carbon monoxide, inlets shall be not more than 5 m from the kerb; 3) for benzene, particulate matter and lead, inlets shall be sited so as to be representative of air
quality near the building line. A.4.2 The following factors can also be taken into account: a) interfering sources; b) security; c) access; d) availability of electrical power and telephone communications; e) visibility of the site in relation to its surroundings; f) safety of the public and operators; g) desirability of co-locating sampling points for different pollutants; and h) planning requirements. A.5 Documentation and review of site selection The site selection procedures shall be fully documented at the classification stage by such means as compass-point photographs of the surrounding area and a detailed map. Sites shall be reviewed at intervals and documentation updated to ensure that selection criteria remain valid over time. In the case of ozone, the site review process requires proper screening and interpretation of the monitoring data in the context of the meteorological and photochemical processes affecting the ozone concentrations measured at the respective site.

SANS 1929:2011 Edition 2
16
Annex B (normative)
Criteria for determining the number of sampling points
for fixed measurement of concentrations of atmospheric pollutants in ambient air
B.1 Minimum number of sampling points for fixed measurements to assess compliance with SO2, NO2, PM10, CO, C6H6 and Pb limit values B.1.1 Diffuse sources In the case of areas polluted by NO2, PM10, C6H6 and CO in which the pollutant level exceeds the upper assessment threshold, at least one urban background station and one traffic-orientated station shall be included, provided this does not increase the number of sampling points (see table B.1).
Table B.1 — Minimum number of sampling points for fixed measurements to assess compliance with SO2, NO2, PM10, CO, C6H6 and Pb limit values
1 2 3 4
Minimum number of sampling points Population of agglomeration
or zone (thousands)
If concentrations exceed the upper
assessment thresholda
If maximum concentrations are between the upper and
lower assessment thresholdsb
For SO2 and NO2 in agglomerations where
maximum concentrations are below the lower
assessment thresholdc 0 - 249 1 1 not applicable 250 - 499 2 1 1 500 - 749
2 1 1
750 - 999 3 1 1 1 000 - 1 499 4 2 1 1 500 - 1 999
5 2 1
2 000 - 2 749 6 3 2 2 750 - 3 749 7 3 2 3 750 - 4 749 8 4 2 4 750 - 5 999 9 4 2
>6 000 10 5 3 a Areas in which the 99th percentile pollutant levels represent a value exceeding 70 % of a limit value (taking into account limit values for all periods used to derive averages).
b Areas in which the 99th percentile pollutant levels are between 50 % and 70 % of a limit value (taking into account limit values for all specified periods used to derive averages).
c Agglomerations where the 99th percentile pollutant levels are below 50 % of all limit values (taking into account limit values for all specified average periods).
B.1.2 Point sources For the assessment of pollution in the vicinity of point sources, the number of sampling points for fixed measurements shall be calculated taking into account emission densities, the likely distribution patterns of ambient air pollution and potential exposure of the population.

SANS 1929:2011 Edition 2
17
Sampling points for fixed measurements shall be sited in such a way that the samples taken will be representative of the exposure of the sampled population. B.2 Minimum number of sampling points for fixed measurements to assess compliance with ozone limit values
Table B.2 — Minimum number of sampling points for fixed measurements to assess compliance with ozone limit values
1 2 3 4
Minimum number of sampling points Population of agglomeration or
zone (thousands)
Agglomerations (urban and suburban)a
Other zones (suburban and rural)a Rural background
0 - 249 �– 1 250 - 499 1 2 500 - 999
2 2
1 000 - 1 499 3 3 1 500 - 1 999 3 4 2 000 - 2 749 4 5 2 750 - 3 749 5 6
>3 750 One additional station per two million
inhabitants
One additional station per two million
inhabitants
One station per 50 000 km2 as an average density over all zones within the countryb
a At least one station in suburban areas, where the highest exposure of the population is likely to occur. In agglomerations, at least 50 % of the stations should be located in suburban areas. b One station per 25 000 km2 for complex terrain is recommended.

SANS 1929:2011 Edition 2
18
Annex C (informative)
Data quality objectives and compilation of the results
of air quality assessments C.1 Data quality objectives C.1.1 The following data quality objectives for allowed uncertainty of assessment methods, of minimum time coverage and of data capture of measurement are provided in table C.1 to guide quality assurance programmes.
Table C.1 — Data quality objectives per measuring station
1 2 3 4 5 6
Measurement SO2 and NO2 %
PM10 and Pb %
O3 %
C6H6 %
CO %
Fixed point, continuous measurementsa Uncertainty 15 25 15 25 15 Minimum data capture 90 90 90 (summer)
75 (winter) 90 90
Minimum time coverage 35c 90d
Indicative measurements Uncertainty 25 50 30 30 25 Minimum data capture 90 90 90 90 90 Minimum time coverage 14b 14b >10 (summer) 14b 14b
Modelling Uncertainty Hourly averages 8-hourly averages Daily averages Annual averages
50-60
50 30
not yet defined 50
50 (daytime)
50
50
50
Objective estimation Uncertainty 75 100 75 75 75 a Random measurements instead of continuous measurements may be applied for benzene if it can be
demonstrated that the uncertainty, including the uncertainty due to random sampling, meets the quality objective of 25 %. Random sampling should be evenly distributed over the year in order to avoid skewing of results.
b One day's measurement per week at random, evenly distributed over the year, or eight weeks evenly distributed over the year.
c Urban background and traffic sites (distributed over the year to be representative of various conditions for climate and traffic).
d Industrial sites. C.1.2 The uncertainty (on a 95 % confidence interval) of the measurement methods should be evaluated in accordance with the principles of ISO 5725-1, or equivalent. The percentages for uncertainty in table C.1 are given for individual measurements, averaged over the period for considered by the limit values, for a 95 % confidence interval (bias plus twice the standard deviation). The accuracy for continuous measurements should be interpreted as being applicable in the region of the appropriate limit value. C.1.3 The uncertainty for modelling and objective estimation is defined as the maximum deviation of the measured and calculated concentration levels, over the period for calculating the appropriate threshold, without taking into account the time of the events.

SANS 1929:2011 Edition 2
19
C.1.4 The requirements for minimum data capture and time coverage do not include losses of data due to the regular calibration or normal maintenance of the instrumentation. C.1.5 By way of derogation, random measurements may be applied instead of continuous measurements for particulate matter and lead if it can be demonstrated that accuracy within the 95 % confidence interval with respect to continuous monitoring is within 10 %. Random sampling should be spread evenly over the year. C.2 Results of air quality assessments The following information should be compiled for zones or agglomerations within which sources other than measurement are employed to supplement information from measurements or as the sole means of air quality assessment: a) a description of assessment activities carried out; b) the specific methods used, with references to descriptions of the methods; c) the sources of data and information; d) a description of results, including accuracies and, in particular, the extent of any area or, if
relevant, the length of road within the zone or agglomeration over which concentrations exceed the limit value(s). Alternatively the limit value(s) plus applicable margin(s) of tolerance and of any area within which concentrations exceed the upper assessment threshold or the lower assessment threshold as given in clause 5;
e) for the limit values, the object of which is the protection of human health, the population
potentially exposed to concentrations in excess of the limit value; and f) where possible, maps should be compiled showing concentration distributions within each zone
and agglomeration. C.3 Standardization For sulfur dioxide, nitrogen dioxide, benzene, carbon monoxide and ozone, the volumes should be standardized at a temperature of 25 ºC and a pressure of 101,3 kPa.

SANS 1929:2011 Edition 2
20
Annex D (informative)
Basis for setting an annual limit value for benzene
In proposing the limit value for benzene based on an annual average concentration for South Africa, there was a call to justify the adoption of the EU Guideline and in particular reference to the risk-based approach. The reported acceptable risk level to be tolerated is in the range one in ten thousand to one in a million. The one in a million incremental cancer risk tends to have widespread use but its basis appears to be linked to arbitrary application by the US Food and Drug administration. Taking the risk-based approach, it should be emphasized that risk determination should be justified using local data and the final risk profiles selected should be subjected to an overall risk management process subject to social, political and economic considerations. This approach has been justified in the WHO Air Quality Guidelines for Europe. The limit value proposed for South Africa is based on the EC document Council directive on ambient air quality assessment and management: Working group on benzene: Position Paper, September 1998. The working group for organic volatile pollutants noted that, owing to the phasing out of lead in South African fuel by 2006 and the probable low proportion of motor vehicles that would be fitted with catalytic converters by that time, it is possible that ambient concentrations of benzene could increase from present (2003) levels (see chapter 5 in the position paper). The working group nevertheless concurred that exposure to benzene in ambient air should be as low as possible and that only an annual average limit value should be set. In view of the uncertainties still associated with estimating the health risk due to benzene exposure, the working group for organic volatile pollutants concurred that the proposed limit of 5 µg/m3 implements the precautionary approach until such time as further studies provide more certainty. The working group was of the opinion that full implementation of the standard could not realistically be achieved in less than ten years.

SANS 1929:2011 Edition 2
21
Annex E (normative)
Measurements of ozone precursor substances
E.1 Objectives The main objectives of measurements of ozone precursor substances are to analyse any trend in ozone precursors, to check the efficiency of emission reduction strategies, to check the consistency of emission inventories and to help attribute emission sources to pollution concentration. An additional aim is to support the understanding of ozone formation and precursor dispersion processes, and also the application of photochemical models. E.2 Substances Measurement of ozone precursor substances shall include at least nitrogen oxides and appropriate volatile organic compounds (VOCs). A list of VOCs recommended for measurement is given in table E.1.
Table E.1 —Volatile organic compounds for measurement of ozone precursor substances
1 2 3 4 Volatile organic compounds
Acetylene Ethane i-Octane Toluene Benzene Ethylene n-Octane Total non-methane hydrocarbons 1.3-Butadiene Ethyl benzene i-Pentane 1,2,3-Trimethylbenzene i-Butane Formaldehyde n-Pentane 1,2,4-Trimethylbenzene n-Butane n-Heptane 1-Pentene 1,2,5-Trimethylbenzene 1-Butene i-Hexane 2-Pentene m+p-Xylene cis-2-Butene n-Hexane Propane o-Xylene trans-2-Butene Isoprene Propene
E.3 Reference methods The reference methods for the sampling and analysis of ozone precursor substances shall either be EPA Compendium method TO-14 A or method TO-17. NOTE Any other method that can be demonstrated to give equivalent results may be used. E.4 Siting Measurements shall be taken in particular urban and suburban areas at any monitoring site considered appropriate with regard to the above monitoring objectives.

SANS 1929:2011 Edition 2
22
Annex F (informative)
Target levels for PM10, SO2 and Pb
F.1 Objectives Target levels are defined as aspirational levels based on current scientific knowledge, with the aim of minimizing or avoiding harmful effects on human health, wellbeing or the environment. The National Framework describes these as the ambient air quality levels that provide an adequate development buffer between air that is considered harmful and air that is not considered harmful to health and wellbeing. These levels may be regarded as limit values in future reviews of this standard, after taking into account all technical and socio-economic conditions. F.2 Target levels Target levels for PM10, SO2, and Pb are given in tables F.1 to F.3.
Table F.1 — Target level for PM10
1 2 3
Exposure period Average period
Target value
µg/m³ Daily limit value for the protection
of human health 24 h 50
Annual limit value for the protection of human health Calendar year 20
Table F.2 — Target level for SO2
1 2 3
Exposure period Average period
Target value
µg/m³ Daily limit value for the protection
of human health 24 h 20
10 min limit value for the protection of human health 10 min 500
Table F.3 — Target level for Pb
2 3
Exposure period Average period
Target value
µg/m³ Annual limit value for the
protection of human health Calendar year 0,25

SANS 1929:2011 Edition 2
23
Annex G (informative)
The use of air quality models
G.1 Introduction Air quality dispersion models are used to predict the ambient concentrations in air of pollutants emitted to the atmosphere from a variety of processes. The most common applications are those that simulate the emission of gaseous and particulate combustion products. Such models are widely used by environmental regulators and practitioners in the US, the UK, Europe, Australia and elsewhere to determine likely compliance with air quality limits. Air quality modelling and monitoring should be seen as complementary activities. Monitoring can give accurate information about air quality at discrete points. The main disadvantages are that monitoring is generally expensive, and the results cannot necessarily be extrapolated to describe concentrations over a wide spatial domain. On the other hand, modelling can be relatively inexpensive and can cover a defined spatial domain. The disadvantages of modelling are in its inherent uncertainties with regard to the predicted concentrations and the necessity to obtain reasonably well-defined emission and meteorological data. This guidance is intended for use by those tasked with air quality assessment and management for emissions from either existing or proposed sources. In the case of an application for an emissions license, it is important that the submitting organization and the regulatory authorities understand the limitations and applicability of the model or models being used. Thus the choice of model will be determined not only by the complexity of the situation being modelled but also by the ease with which the results can be assessed and adjudicated by the authorities on a case-by-case basis and the capacity of the authorities to do such assessments. The users should thus be trained and capacitated to undertake the necessary work, bearing in mind that the modelling environment is continuously developing, given the rapidly increasing availability of computer power and techniques. Finally, models should be compatible across the various processes needed to authorize operations. Thus, only one modelling submission should be needed for both environmental impact assessment purposes and the application for an emissions license. This guidance does not represent a comprehensive set of criteria covering all possible considerations related to dispersion model selection and applications. Instead, it examines the applicability of different types of dispersion models under certain circumstances and sets the minimum requirements to promote the use of the best practice in the application of atmospheric dispersion models for compliance assessment purposes. The intending applicant should discuss the specific application and agree to a particular modelling requirement with the regulatory authority based on a written protocol. This protocol should include: a) the location of the applicant�’s sources; b) emission rates, source type, source release parameters; c) a discussion of the surrounding terrain and the effects it will have on pollutant dispersion, as
applicable; d) the modelling analysis methodology, including the model(s) to be used in the analysis;

SANS 1929:2011 Edition 2
24
e) the air quality monitoring data and location of air quality monitoring location(s) used in the analysis for model result verification, if applicable; and
f) the type of meteorological data used in the analysis, as applicable. G.2 Air quality model selection G.2.1 A hierarchy of models of increasing complexity exists, ranging from simple empirical models, through screening models, which generally do not require site-specific meteorology, to advanced, refined models able to account for pollutant dispersion from multiple sources within complex terrain environments and complex meteorology. Other models that address specialized features of localized atmospheric dispersion are also available. G.2.2 Several air quality models have been approved for regulatory use for specific applications in various countries. The use of such models is recommended given that these models have been developed using the large resources available in the developed world and, in many cases, are available free of charge as downloadable files. They are likely to have been subject to substantial evaluation studies and peer review; and the mathematics of the model, data requirements and programme operating characteristics are likely to be documented. They are also subject to a continuous process of review and update at no cost to users outside that country. However, it should not be construed that the models preferred or approved for use elsewhere should be used to the exclusion of all others or that they are the only models available for relating emissions to air quality. G.2.3 The use of independently developed software in regulatory analyses is recognized. Such software should, however, have been evaluated and shown to be valid for the application for which it is being used. Such evaluation should include quality assurance planning, documentation and scrutiny consistent with the intended use. This scrutiny will include a) a scientific peer review, b) a supportive analysis (i.e. diagnostic evaluations, code verification, and a sensitivity and
uncertainty analysis), c) diagnostic and performance evaluations with data obtained in trial locations, and d) statistical performance evaluation circumstances similar to the intended application G.2.4 The user of a model should be able to justify the choice of any particular model, and demonstrate its �“fitness for purpose�”. Model users should be able to demonstrate that the model is suited to the following: a) the size of the modelling domain; b) the complexity of the terrain (includes potential for thermo-topographic and urban boundary
layer effects); c) the nature of the sources; and d) the type of pollutant.

SANS 1929:2011 Edition 2
25
Complex terrain refers to uneven terrain, coastal environments or urban areas where the potential exists for thermo-topographically induced air circulations or urban boundary layer effects. Models applied in such environments should allow for spatial variations, i.e. wind, inversion break-up, fumigation and atmospheric stagnation. G.3 Treatment of specific pollutants Carbon monoxide (CO), nitrogen dioxide (NO2), particulates (PM10 and PM2.5) and lead (Pb) are often associated with emissions from numerous sources. Several of these pollutants are also closely related to one another in that they share common sources of emission or are subject to chemical transformations of similar precursors, or both. It is therefore recommended that models be used that take into account the chemical coupling between relevant pollutants when appropriate and feasible. For example, fine particles in the PM2.5 range are typically comprised primarily of secondary particles formed through transformations of sulfur oxides (SOx), nitrogen oxides (NOx) and VOCs. The simulation of PM2.5 concentrations based exclusively on particulate emissions and neglecting the secondary components of PM2.5 such as sulfates and nitrates, will therefore result in an underestimation of actual PM2.5 concentrations. The use of photochemical models is specifically recommended for the prediction of ozone concentrations. Such models need to consider emissions of VOC, NOx and CO, and also a means for generating meteorological data governing transport and the dispersion of ozone and its precursors. Where compliance to the dust deposition criteria of this standard is to be tested, the model(s) used should contain specific deposition algorithms. G.4 Source data G.4.1 Emission rates Modelled emission rates should be representative of the average period(s) for which air pollution concentrations are being determined. Temporal trends in emissions should be accounted for, with both normal and foreseeable upset emission rates being modelled. G.4.2 Background concentrations In the case of proposed sources, modelled concentrations should be added to existing background concentrations in order to evaluate the cumulative impact relative to the air quality limits. Such background concentrations might be determined from monitoring or modelling approaches, or from a combination thereof. G.5 Receptor grids The receptor grid should be able to delimit the areas of highest possible impact. In general, the receptor network may be considered adequate if the difference in concentration at neighbouring receptors is no larger than half the difference between the maximum modelled concentration and the air quality limit being considered. Thus, C1 C2 0,5(Cl Cm) where C1 and C2 are concentrations at adjacent receptors 1 and 2; Cl is the air quality limit;

SANS 1929:2011 Edition 2
26
Cm is the maximum modelled concentration at receptors 1 and 2. The height of receptors should be appropriate to the purpose for which modelling is being carried out. For general air quality compliance modelling, a receptor height of 1,5 m is appropriate. G.6 Terrain elevations Simple terrain (terrain elevations below the level of pollutant release) and complex terrain (terrain elevations above the level of pollutant release) will need to be addressed in all modelling analyses if the terrain within the vicinity of the subject source is expected to have an effect on pollutant dispersion. Similarly, sensitive receiving environments might be elevated above ground level. G.7 Meteorological data G.7.1 Screening meteorological data Screening models use a �“worst-case�” meteorological data set. Such data sets allow such models to simulate a full set of atmospheric conditions to calculate the highest possible concentration which, in some cases, may be sufficient in terms of the application. Worst-case meteorological data should only be used in a refined screening model for compliance analysis purposes, and only if a representative actual meteorological data set is not available. Only 1 h concentrations can be calculated using a worst-case meteorological data set. For other average periods, impacts should be calculated by the application of appropriate time-scaled conversion factors. G.7.2 Representative meteorological data Where available, actual meteorological data should be used in a refined modelling analysis. If on-site data are not available for modelling, representative data collected from another meteorological site may be used, subject to qualification in terms of quality assurance and such data being shown to be adequately representative of the site being modelled. To demonstrate representativeness, an analysis should be undertaken comparing the physiographic and meteorological parameters of the data site. Where available, five years of valid meteorological data should be used. A minimum of one year of valid data should be used. G.8 Time average periods Air pollutants concentrations should be predicted for the same average period for which air quality limits are provided. Should such limits refer to running averages rather than block averages, the dispersion model outputs should reflect such values. Most dispersion models are only able to simulate pollutant concentrations for a one-hourly or longer average period. In order to use such models to demonstrate compliance with air quality limits for shorter average periods, reference can be made to reported concentration ratios between different average periods. Although this is a function of both source configuration and atmospheric turbulence, it can generally be shown that concentrations obtained over different average times are related as follows: C1/C2=(T2/T1)p where C1 and C2 are concentrations for average times T1 and T2, respectively;

SANS 1929:2011 Edition 2
27
T1 and T2 are any two average times; p is a parameter ranging from 0,16 to 0,68, depending on the atmospheric stability. The most widely used values for p range between 0,16 and 0,25. Where a locally validated value is not available, a value of 0,2 is recommended. G.9 Building downwash Airflow over and around buildings and other solid structures might restrict the dispersion of a pollutant source. When modelling release points where the release height is less than good engineering practice (GEP), the effects of building downwash should be addressed in the modelling analysis. G.10 Quantification of model uncertainty Any dispersion model will always have a degree of error due to unavoidable inaccuracies in the recorded meteorological data and the simplifications made in the model algorithms for atmospheric processes. In addition, atmospheric mixing has an inherent degree of randomness, owing to the turbulent flows that occur. It is for this reason that models are required to be performance tested and their degree of uncertainty specified. If a model is used for compliance demonstration, the model uncertainty should be quantified and communicated to the decision-makers. G.11 Validation protocols The application of air quality models for air pollution control strategy analysis should include calibration and evaluation against quality monitoring data. Only models that have been verified by past data should be used for future forecasting. Modelled and monitored concentrations should be compared for the same average period. The generation of curves indicating the frequency by which modelled and monitored concentrations exceed the permissible values provides a more effective basis for comparison than does a simple comparison of maximum and mean period averages. Any corrections made to the model during its validation should be clearly documented and identified. A standard validation protocol should be used for model evaluation. Examples of such protocols are: Protocol for determining the best performing model. US EPA report EPA-454/R-92-025.
European initiative on harmonisation within atmospheric dispersion modelling for regulatory
purposes. Atmospheric dispersion modelling: guidelines on the justification and use of models, and the
communication and reporting of results.
These evaluation protocols include the validation steps enumerated for independently developed models given in G.2.

Table G.1 — Air quality model selection
1 2 3 4 5
Model Advantages Disadvantages Availability Suitability for regulatory purposes
Empirical Very easy to use once it has been set up. Setting up the model requires only moderate data intensity. Needs no prior assumptions regarding the local validity of dispersion characteristics. Needs little data.
Requires observed data up-front for emissions, ambient air quality and meteorology. Site specific. Plant specific. Process specific. No theoretical basis. Short range only.
Local data exist for model formulations but may not be made available in all cases.
Low
Screening Very easy to use. Gives a wide range of predictions that can be easily matched to expected operational conditions. Can incorporate: plume rise due to momentum and
buoyancy; plume reflection from ground and top of
the mixing height; and stack-top downwash effects.
Uses well-tested and documented dispersion parameters. Can be used for scoping environmental impact assessments. Short and medium ranges.
Single source only.
Cannot readily incorporate: instantaneous releases; complex terraina and associated thermal
effects; low wind speeds; changing dispersion characteristics with
height; dispersion in layered atmospheres; and chemical reactions and removal processes.
Needs moderate meteorological understanding if used for convective boundary layer calculations. Often overly conservative.
Widely available as downloadable files.
High for screening assessment of isolated, single sources against short-term (24 h and lower) standards.
a Complex terrain refers to uneven terrain, coastal environments or urban areas where the potential exists for thermo-topographically induced air circulations or urban boundary layer effects. Models applied in such environments should allow for spatial variations in wind, inversion break-up fumigation and atmospheric stagnation during calm wind periods.
28
SAN
S 1929:2010 E
dition 2

Table G.1 (continued)
1 2 3 4 5
Model Advantages Disadvantages Availability Suitability for regulatory purposes
Gaussian Plume
Used by many regulatory agencies worldwide. Relatively easy to use. Can incorporate: plume rise due to momentum and
buoyancy; diffusion; deposition; plume reflection from ground and top
of the mixing height; stack-top downwash and building
wake effects; various average periods; the calculation of spatial distribution of
ground level pollutants concentrations and deposition rates;
the calculation of pollutants concentration isopleths; and
intermittent releases. Uses well-tested and documented dispersion parameters. Fairly good to moderate data intensity. Short and medium ranges.
Cannot readily incorporate: realistic wind fields; instantaneous releases; complex terrain and associated
thermal effects; low wind speeds; changing dispersion
characteristics with height; dispersion in layered
atmospheres; and chemical reactions and removal
processes. Needs expert meteorological understanding if used for convective boundary layer calculations. Often overly conservative.
Some good examples are available as downloadable files. Commercial schemes are available.
High for multi-source situations and air quality management planning in non-complex terrain and for short to medium ranges.
29
SAN
S 1929:2010 E
dition 2

Table G.1 (concluded)
1 2 3 4 5
Model Advantages Disadvantages Availability Suitability for regulatory purposes
Gaussian Puff Can incorporate: realistic wind field simulations
including low wind conditions; various average periods; the calculation of spatial distribution
of ground level pollutants concentrations and deposition rates;
the calculation of pollutants concentration isopleths; and
complex terrain.
Often very data intensive. Requires detailed meteorological data. Requires specialist meteorological expertise to prepare meteorological input data required.
Some good examples are available as downloadable files and commercial schemes are available.
Low for non-complex terrain and short to moderate range applications. High for multi-source situations and air quality management planning in complex terrain environments. High for regional assessments.
Complex terrain, including street canyon and urban boundary layer effects.
Uses well-tested and documented chemical transformation mechanisms. Input of emissions for a range of diverse source types. Medium and regional scale.
VOC, NOx and CO, and also a means for generating meteorological data governing transport and dispersion of ozone and its precursors.
30
SAN
S 1929:2010 E
dition 2

SANS 1929:2011 Edition 2
31
Bibliography Council Directive on Ambient Air Quality Assessment and Management: Working group on benzene. Position Paper. September 1998. Available from a link on the following website: <http://europa.eu.int/comm/environment/air/ambient.htm> Directive 82/884/EEC, EC Directive on a limit value for lead in the air. Council Directive of 3 December 1982. EPA Compendium Method TO-14A, Determination of volatile organic compounds (VOCs) in ambient air using specially prepared canisters with subsequent analysis by gas chromatography. Available at <http://www.epa.gov/ttnamti1/files/ambient/airtox/to-14ar.pdf> EPA Compendium Method TO-17, Determination of volatile organic compounds in ambient air using active sampling onto sorbent tubes. Available at <http://www.epa.gov/ttn/amtic/files/ambient/airtox/to-17r.pdf> European initiative on harmonisation within atmospheric dispersion modelling for regulatory purposes. Available at <http://www.harmo.org/#ToC20> The Model Validation Kit can be obtained from: H.R. Olesen, National Environmental Research Institute, P.O. Box 358, DK-4000 Roskilde, Denmark Tel. +45 46 30 12 00, Fax. +45 46 30 11 14. E-mail: [email protected] or http://www.dmu.dk/atmosphericenvironment/Harmoni/M_V_KIT.htm FOURIE, M.; VAN NIEKERK, W. and Mouton, G. Technical Background Document for the Development of a National Ambient Air Quality Standard for Lead. Report compiled on behalf of the Chemical and Allied Industry Association. Document number 005-2003, February 2003. HELD, G.; GORE, BJ.; SURRIDGE, AD.; TOSEN, GR.; TURNER, CR. and WALMSLEY, RD. Air pollution and its impacts on the South African highveld. Environmental Scientific Association. 1996. Protocol for determining the best performing model. US EPA report EPA-454/R-92-025, 1992. Royal Meteorological Society. Policy Statement – Atmospheric dispersion modelling: guidelines on the justification of choice and use of models, and the communication and reporting of results. Published in collaboration with the British Department of the Environment, 1995. Available at <http://www.royal-met-soc.org.uk/policydispmod.htm> SCORGIE, Y., ANNEGARN, HJ. and BURGER, LW. Review of International Air Quality Guidelines and Standards for the Purpose of Informing South African Air Quality Standards. Report compiled on behalf of the Technical Committee on National Air Quality Standards �– Working Group 1, 5 March 2003. United States Office of the Federal Register. Code of federal regulations. Vol. 5. Regulation 40: Protection of the environment. Chapter 1: Environmental protection agency. Part 53: Ambient air monitoring reference and equivalent methods. Section 53.32: Test procedures for methods for SO2, CO, O3, and NO2. Washington: U.S. Government Printing Office, 1999. US-EPA Guidelines on air quality models (Revised). EPA-450/2-78-027R, PB86-245248. Available at <http://www.epa.gov/EPA-AIR/2003/April/Day-15/a8542.htm> US-EPA Revision to the guideline on air quality models: Adoption of a preferred long range transport model and other revisions; final rule. 40 CFR Part 51. 15 April 2003. WHO, Air quality guidelines for Europe. 1999. WHO Air quality guidelines for particulate matter, ozone, nitrogen dioxide and sulfur dioxide. Global update 2005. Summary of risk assessment. WHO/SDE/PHE/OEH/06.02

SANS 1929:2011 Edition 2
32
WHO. Air quality guidelines for Europe, 2nd ed. Copenhagen, WHO Regional Office for Europe, 2000. (WHO Regional Publications, European Series, No. 91). Available at <http://www.who.int/peh/air/Airqualitygd.htm>
SABS

SABS – Standards Division
The objective of the SABS Standards Division is to develop, promote and maintain South African
National Standards. This objective is incorporated in the Standards Act, 2008 (Act No. 8 of 2008).
Amendments and Revisions
South African National Standards are updated by amendment or revision. Users of South African
National Standards should ensure that they possess the latest amendments or editions.
The SABS continuously strives to improve the quality of its products and services and would
therefore be grateful if anyone finding an inaccuracy or ambiguity while using this standard would
inform the secretary of the technical committee responsible, the identity of which can be found in
the foreword.
Tel: +27 (0) 12 428 6666 Fax: +27 (0) 12 428 6928
The SABS offers an individual notification service, which ensures that subscribers automatically
receive notification regarding amendments and revisions to South African National Standards.
Tel: +27 (0) 12 428 6883 Fax: +27 (0) 12 428 6928 E-mail: [email protected]
Buying Standards
Contact the Sales Office for South African and international standards, which are available in both
electronic and hardcopy format.
Tel: +27 (0) 12 428 6883 Fax: +27 (0) 12 428 6928 E-mail: [email protected]
South African National Standards are also available online from the SABS website
http://www.sabs.co.za
Information on Standards
The Standards Information Centre provides a wide range of standards-related information on both
national and international standards, and is the official WTO/TBT enquiry point for South Africa. The
Centre also offers an individual updating service called INFOPLUS, which ensures that subscribers
automatically receive notification regarding amendments to, and revisions of, international
standards.
Tel: +27 (0) 12 428 6666 Fax: +27 (0) 12 428 6928 E-mail: [email protected]
Copyright
The copyright in a South African National Standard or any other publication published by the SABS
Standards Division vests in the SABS. Unless exemption has been granted, no extract may be
reproduced, stored in a retrieval system or transmitted in any form or by any means without prior
written permission from the SABS Standards Division. This does not preclude the free use, in the
course of implementing the standard, of necessary details such as symbols, and size, type or grade
designations. If these details are to be used for any purpose other than implementation, prior written
permission must be obtained.
Details and advice can be obtained from the Senior Manager.
Tel: +27 (0) 12 428 6666 Fax: +27 (0) 12 428 6928 E-mail: [email protected]