Embed Size (px)
Citation preview
SANLAM LIFE INSURANCE LIMITED GROUP
Annual Financial Statements
2010
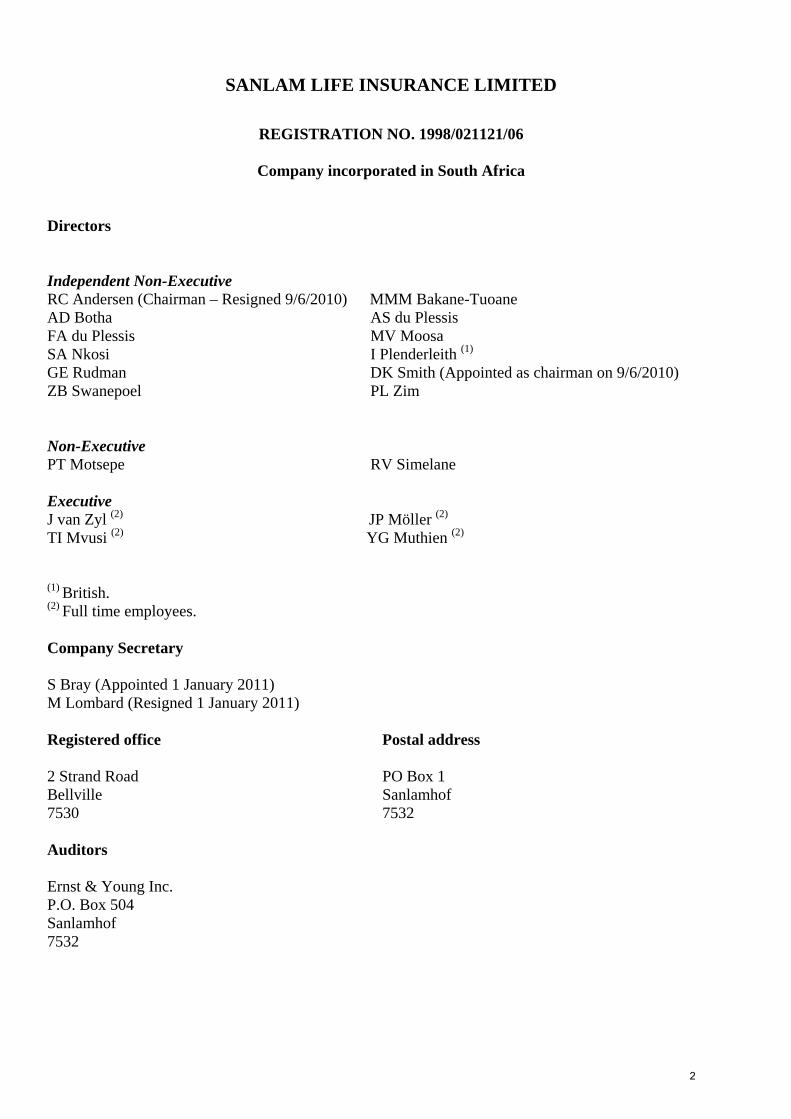
SANLAM LIFE INSURANCE LIMITED
REGISTRATION NO. 1998/021121/06
Company incorporated in South Africa
Directors Independent Non-Executive RC Andersen (Chairman – Resigned 9/6/2010) MMM Bakane-Tuoane AD Botha AS du Plessis FA du Plessis MV Moosa SA Nkosi I Plenderleith (1) GE Rudman DK Smith (Appointed as chairman on 9/6/2010) ZB Swanepoel PL Zim Non-Executive PT Motsepe RV Simelane Executive J van Zyl (2) JP Möller (2)
TI Mvusi (2) YG Muthien (2) (1) British. (2) Full time employees. Company Secretary S Bray (Appointed 1 January 2011) M Lombard (Resigned 1 January 2011) Registered office Postal address 2 Strand Road PO Box 1 Bellville Sanlamhof 7530 7532 Auditors Ernst & Young Inc. P.O. Box 504 Sanlamhof 7532 2
SANLAM LIFE INSURANCE LIMITED GROUP Annual Financial Statements
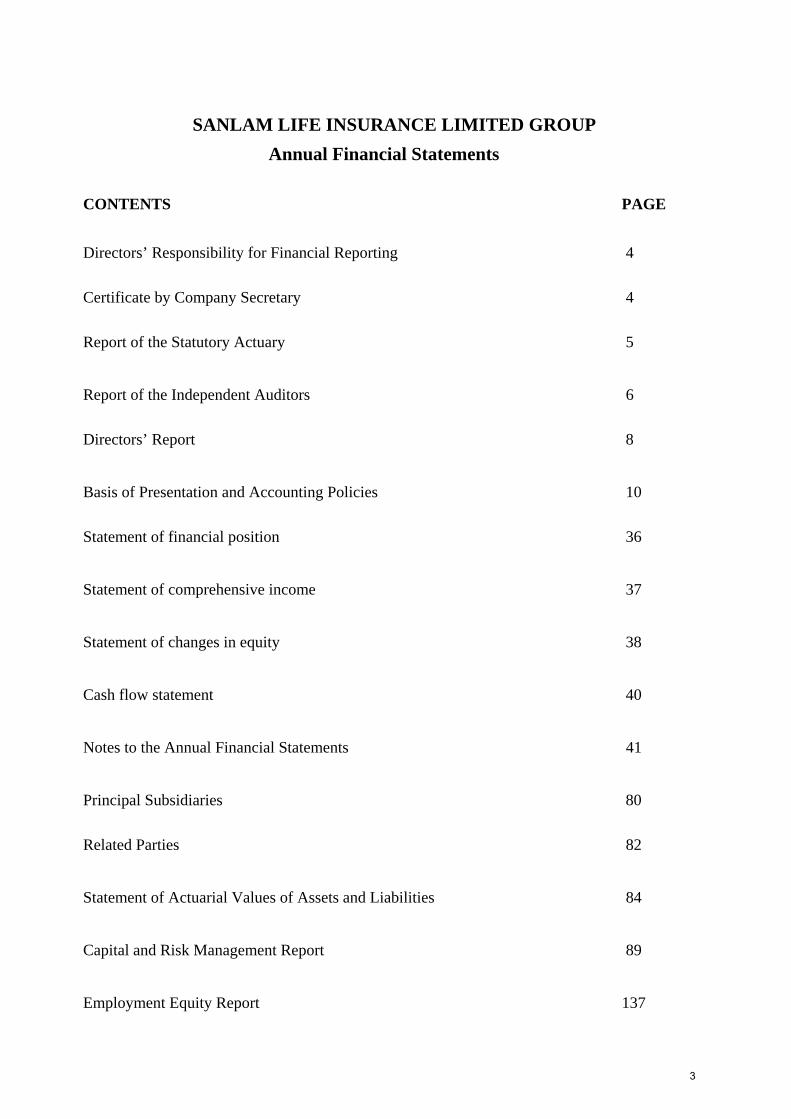
CONTENTS PAGE Directors’ Responsibility for Financial Reporting 4
Certificate by Company Secretary 4
Report of the Statutory Actuary 5
Report of the Independent Auditors 6
Directors’ Report 8
Basis of Presentation and Accounting Policies 10
Statement of financial position 36
Statement of comprehensive income 37
Statement of changes in equity 38
Cash flow statement 40
Notes to the Annual Financial Statements 41
Principal Subsidiaries 80
Related Parties 82
Statement of Actuarial Values of Assets and Liabilities 84
Capital and Risk Management Report 89
Employment Equity Report 137
3

DIRECTORS’ RESPONSIBILITY FOR FINANCIAL REPORTING The Board of Sanlam Life Insurance Limited takes responsibility for the integrity, objectivity and reliability of the group and company annual financial statements of Sanlam Life Insurance Limited in accordance with International Financial Reporting Standards. Adequate accounting records have been maintained. The Board endorses the principle of transparency in financial reporting. The responsibility for the preparation and presentation of the annual financial statements has been delegated to management.
The responsibility of the external auditors, Ernst & Young Inc., is to express an independent opinion on the fair presentation of the financial statements based on their audit of Sanlam Life Insurance Limited and the Group. The Audit, Actuarial and Finance committee has satisfied itself that the external auditors were independent of the company during the period under review.
The audit committee has confirmed that effective systems of internal control and risk management are being maintained. There were no material breakdowns in the functioning of the internal financial control systems during the year, which had a material impact on the Sanlam Life Insurance Limited group annual financial statements. The Board is satisfied that the annual financial statements fairly present the financial position, the results of operations and cash flows in accordance with International Financial Reporting Standards and supported by reasonable and prudent judgements consistently applied.
The Board is of the opinion that Sanlam Life Insurance Limited is financially sound and operates as a going concern. The financial statements have accordingly been prepared on this basis.
The financial statements on pages 8 to 136 were approved by the Board and signed on its behalf by:
J van Zyl JP Möller
Director Director 9 March 2011
CERTIFICATE BY COMPANY SECRETARY In my capacity as Company Secretary, I hereby certify, in terms of the Companies Act, that for the year ended 31 December 2010, the company has lodged with the Registrar of Companies all such returns as are required of a public company in terms of this Act, and that all such returns are, to the best of my knowledge and belief, true, correct and up to date.
S Bray
Company Secretary 9 March 2011
4
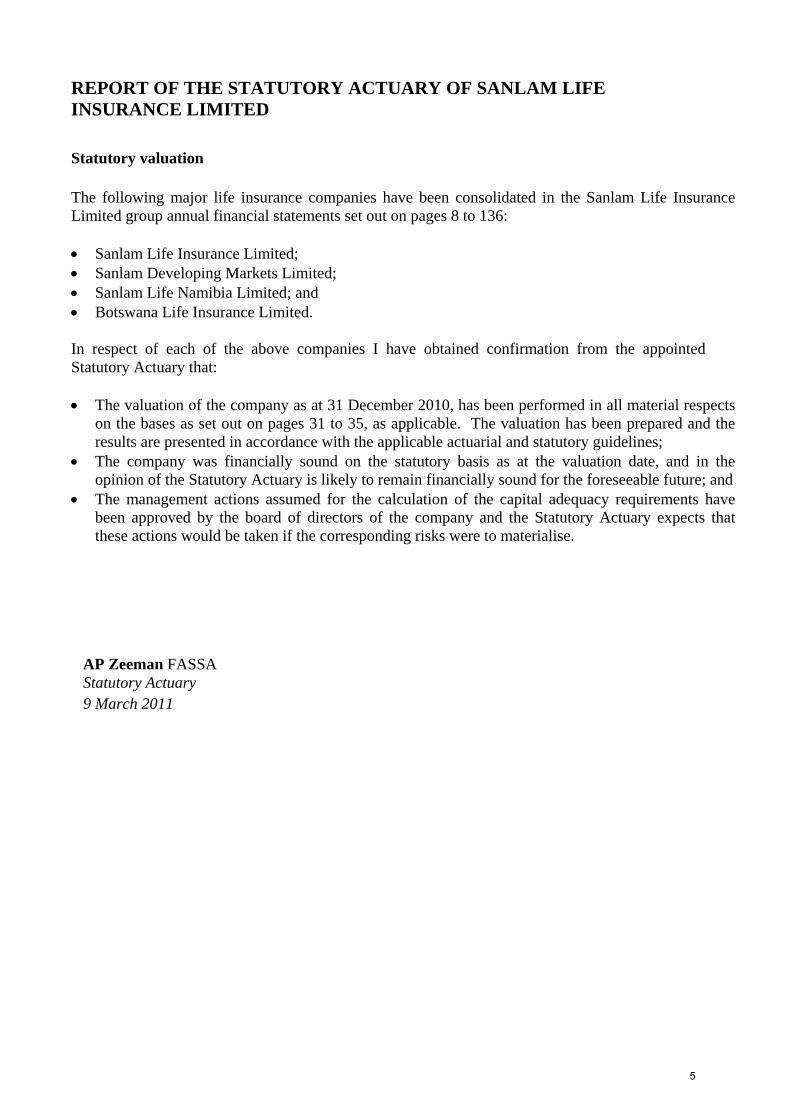
REPORT OF THE STATUTORY ACTUARY OF SANLAM LIFE INSURANCE LIMITED
Statutory valuation
The following major life insurance companies have been consolidated in the Sanlam Life Insurance Limited group annual financial statements set out on pages 8 to 136:
• Sanlam Life Insurance Limited; • Sanlam Developing Markets Limited; • Sanlam Life Namibia Limited; and • Botswana Life Insurance Limited.
In respect of each of the above companies I have obtained confirmation from the appointed Statutory Actuary that:
• The valuation of the company as at 31 December 2010, has been performed in all material respects
on the bases as set out on pages 31 to 35, as applicable. The valuation has been prepared and the results are presented in accordance with the applicable actuarial and statutory guidelines;
• The company was financially sound on the statutory basis as at the valuation date, and in the opinion of the Statutory Actuary is likely to remain financially sound for the foreseeable future; and
• The management actions assumed for the calculation of the capital adequacy requirements have been approved by the board of directors of the company and the Statutory Actuary expects that these actions would be taken if the corresponding risks were to materialise.
AP Zeeman FASSA Statutory Actuary 9 March 2011
5
INDEPENDENT AUDITORS’ REPORT TO THE MEMBERS OF SANLAM LIFE INSURANCE LIMITED
We have audited the annual financial statements and the Group annual financial statements of Sanlam Life Insurance Limited, which comprise the Statement of financial position as at 31 December 2010, the Statement of comprehensive income, the Statement of changes in equity and Cash flow statement for the year then ended, a summary of significant accounting policies and other explanatory notes, as set out on pages 8 to 136. Directors’ responsibility for the financial statements The company’s directors are responsible for the preparation and fair presentation of these annual financial statements in accordance with International Financial Reporting Standards, and in the manner required by the Companies Act of South Africa, and for such internal control as the directors determine is necessary to enable the preparation of annual financial statements that are free from material misstatement, whether due to fraud or error. Auditors’ responsibility Our responsibility is to express an opinion on these annual financial statements based on our audit. We conducted our audit in accordance with International Standards on Auditing. Those standards require that we comply with ethical requirements and plan and perform the audit to obtain reasonable assurance whether the financial statements are free from material misstatement. An audit involves performing procedures to obtain audit evidence about the amounts and disclosures in the annual financial statements. The procedures selected depend on the auditors’ judgement, including the assessment of the risks of material misstatement of the annual financial statements, whether due to fraud or error. In making those risk assessments, the auditor considers internal control relevant to the entity’s preparation and fair presentation of the annual financial statements in order to design audit procedures that are appropriate in the circumstances, but not for the purpose of expressing an opinion on the effectiveness of the entity’s internal control. An audit also includes evaluating the appropriateness of accounting policies used and the reasonableness of accounting estimates made by the directors, as well as evaluating the overall presentation of the annual financial statements. We believe that the audit evidence we have obtained is sufficient and appropriate to provide a basis for our audit opinion.
6
Opinion In our opinion, the annual financial statements present fairly, in all material respects, the financial position of the company and Group as of 31 December 2010, and of the financial performance and their cash flows for the year then ended in accordance with International Financial Reporting Standards, and in the manner required by the Companies Act of South Africa.
Ernst & Young Inc.
Director: Malcolm Peter Rapson
Registered Auditor
Chartered Accountant (SA)
Ernst & Young House
35 Lower Long Street
Cape Town
9 March 2011
7
DIRECTORS’ REPORT FOR THE YEAR ENDED 31 DECEMBER 2010 NATURE OF BUSINESS
The core activities of the Sanlam Life Insurance Limited group include long-term insurance, investment management and other related financial services activities. Sanlam Life Insurance Limited is a public company incorporated in terms of the Companies Act, 1973 as amended, in South Africa.
CORPORATE GOVERNANCE The Board of Sanlam Life Insurance Limited endorses the Code of Corporate Practice and Conduct recommended in the King II Report on Corporate Governance. The directors constantly pursue the implications of the King Code and are of the opinion that the company does substantially comply with the requirements of the King Code. In supporting the Code, the directors recognise the need to conduct the enterprise with integrity, transparency, accountability and in accordance with generally accepted corporate practices. As the company is a wholly owned subsidiary the recommended disclosures of the King II Report have been included in the annual financial statements of the holding company, Sanlam Limited. The Audit, Actuarial and Finance Committee, based on representations received and after considering compliance with the non-audit services policy of the Sanlam Group and any other business relationships with the external auditors, is satisfied that the external auditors are independent.
GROUP AND COMPANY RESULTS Profit before tax for the Group increased from R7 800 million in 2009 to R8 889 million in 2010, attributable to improved profitability and higher relative investment market performance in 2010. Profit before tax for the Company decreased from R8 969 million in 2009 to R8 221 million in 2010, due to lower dividend income received from subsidiaries. Further details regarding the Group’s results are included in the financial statements on pages 36 to 136.
SHARE CAPITAL
There were no changes in the authorised and issued share capital of the company during the financial year.
DIVIDEND The Board approved the declaration and payment of dividends amounting to a maximum of R2 500 million (2009: R3 500 million) in respect of the 2010 financial year.
SUBSIDIARIES Details of the company’s principal subsidiaries are set out on page 80.
8
DIRECTORS’ REPORT FOR THE YEAR ENDED 31 DECEMBER 2010 (continued)
HOLDING COMPANY Sanlam Life Insurance Limited is a wholly owned subsidiary of Sanlam Limited, a company incorporated in South Africa and listed on the Johannesburg Securities Exchange and the Namibia Stock Exchange.
DIRECTORS’ INTEREST IN CONTRACTS No material contracts involving directors’ interests were entered into in the year under review.
DIRECTORS AND SECRETARY Particulars of the directors and secretary of the company are set out on page 2.
DIRECTORS’ EMOLUMENTS
Refer to note 24 for details on directors’ emoluments. Further details can also be found in the Corporate Governance report in the Sanlam Limited financial report.
EMPLOYMENT EQUITY The required report in terms of section 21 of the Employment Equity Act has been submitted and a compliance certificate has been issued. See pages 137 and 138 for an extract of the report.
EVENTS AFTER THE YEAR END No material facts or circumstances have arisen between the dates of the statement of financial position and this report that affect the financial position of Sanlam Life Insurance Limited at 31 December 2010 as reflected in these annual financial statements.
9
BASIS OF PRESENTATION AND ACCOUNTING POLICIES BASIS OF PRESENTATION 1. Introduction The consolidated financial statements are prepared on the historical-cost basis, as modified by the revaluation of investment properties, investment instruments, derivative assets and liabilities, listed term finance and long-term policy liabilities, in accordance with International Financial Reporting Standards (IFRS) and the Companies Act, No. 61 of 1973, as amended, in South Africa, and the AC 500 Standards as issued by the Accounting Practices Board and its successor. The financial statements are presented in South African rand rounded to the nearest million, unless otherwise stated. The following new or revised IFRSs and interpretations are applied in the Group’s 2010 financial year: IAS 27 Amended Consolidated and Separate Financial Statements
IAS 39 Amended Financial Instruments: Recognition and Measurement – Eligible Hedged Items
IFRS 3 Revised Business Combinations
IFRIC 17 Distribution of Non-cash Assets to Owners
IFRIC 18 Transfers of Assets from Customers
April 2009 Improvements to IFRS
Amendments to IFRS 2: Group Cash-settled Share-based Payment Transactions
AC 504: IAS 19 – The Limit on a Defined Benefit Asset, Minimum Funding Requirements and their Interaction in a South African Pension Fund Environment
The application of these standards and interpretations did not have a significant impact on the Group’s financial position, reported results and cash flows. The following new or revised IFRSs and interpretations have effective dates applicable to future financial years and have not been early adopted: Amendment to IAS 32 - Classification of Rights Issues (effective 1 February 2010)
IAS 24 revised - Related Party Disclosures (effective 1 January 2011)
IFRS 9 Financial Instruments (effective 1 January 2013)
IFRIC 19 Extinguishing Financial Liabilities with Equity Instruments (effective 1 July 2010)
Amendments to IFRIC 14 - Prepayments of a Minimum Funding Requirement (effective 1 January 2011)
May 2010 Improvements to IFRS (mostly effective 1 January 2011)
Amendments to IAS 12 - Deferred tax: Recovery of underlying assets (effective 1 January 2012)
Amendments to IFRS 1 - Severe hyperinflation and removal of fixed dates for first-time adopters (effective 1 July 2011)
10
Amendment to IFRS 7 - Disclosures - Transfers of Financial Assets (effective date 1 July 2011)
Amendment to AC504 - The limit on a defined benefit asset, minimum funding requirements and their interaction in the South African pension fund environment (effective 1 January 2011)
The application of these revised standards and interpretations in future financial reporting periods is not expected to have a significant impact on the Group’s reported results, financial position and cash flows. The following section provides additional information in respect of the presentation of selected items in the Group and company financial statements on pages 36 to 83 and pages 89 to 136. 2. Financial statements presentation Use of estimates, assumptions and judgements The preparation of the financial statements necessitates the use of estimates, assumptions and judgements. These estimates and assumptions affect items reported in the Group statement of financial position and statement of comprehensive income, as well as contingent liabilities. The major items subject to the application of estimates, assumptions and judgements include: The fair value of unlisted investments; Deferred taxation; The valuation of policy liabilities; and Potential claims and contingencies.
Although estimates are based on management’s best knowledge and judgement of current facts as at the statement of financial position date, the actual outcome may differ from these estimates, possibly significantly. Refer to note 30 for further information on critical estimates and judgements and note 33 for information on contingencies. Policyholders’ and shareholders’ activities The Group financial statements set out on pages 36 to 83 include the consolidated activities of the policyholders and shareholders. The Statement of Actuarial Values of Assets and Liabilities of the major life insurance businesses of the Group are disclosed on pages 84 to 88. The assets, liabilities and activities of the policyholders and shareholders in respect of the life insurance businesses are managed separately and are governed by the valuation bases for policy liabilities and profit entitlement rules, which are determined in accordance with prevailing legislation, IFRS, generally accepted actuarial practice and the stipulations contained in the Sanlam Life demutualisation proposal. The valuation bases in respect of policy liabilities and the profit entitlement of shareholders are set out on pages 31 to 35. Insurance contracts The disclosure of claims experience in claims development tables is based on the period when the earliest material claims arose for which there is still uncertainty about the amount and timing of the claims payments.
11
Cash, deposits and similar securities Cash, deposits and similar securities include bank account balances, call, term and negotiable deposits, promissory notes and money market collective investment schemes. A distinction is made between: Cash, deposits and similar securities included in the asset mix of policyholders’ and
discretionary shareholders’ fund investment portfolios, which are disclosed as investments in the Group statement of financial position; and
Working capital balances that are disclosed as working capital assets, apart from bank overdrafts, which are disclosed as working capital liabilities.
Financial Instruments Due to the nature of the Group’s business, financial instruments have a significant impact on the Group’s financial position and performance. Audited information in respect of the major categories of financial instruments and the risks associated therewith are provided in the following sections: Audited Capital and Risk Management report on pages 89 to 136; Note 7: Investments; Note 15: Long-term policy liabilities; Note 16: Term finance; and Note 30: Critical accounting estimates and judgements.
Segmental information The Group’s segments are based on the dominant source and nature of the Group’s risks and returns, which are also reflected in the Group’s operational management structure. The segmental information is presented for operating segments. The segments are life insurance; investment management and short-term insurance. The life insurance segment includes the activities of Sanlam Personal Finance, Sanlam Employee Benefits and Sanlam Developing Markets. The premiums in respect of the majority of individual underwriting business can be rerated. The individual and employee benefits products are therefore subject to similar risks and are accordingly not disclosed as separate segments. Required geographical information is presented. The geographical segments are identified as segments that are subject to risks and returns that differ from those of segments operating in other economic environments. The segments are Republic of South Africa, Africa and Other international. The decentralised nature of the Group businesses facilitates the allocation of costs between them, as the costs are directly attributable to the different businesses. Intersegment transfers are estimated to reflect arm’s length prices. Intergroup loans Intergroup loans are disclosed as follows:
• Loans between the Group and the ultimate holding company are included in working capital assets and liabilities;
• Loans between the Group and other fellow subsidiaries in the rest of the Sanlam Ltd Group are included in working capital assets and liabilities; and
12
• Loans between the Company and subsidiaries are included in investments in subsidiaries, to reflect the total investment in these subsidiaries.
Funds received from clients Funds received from clients include single and recurring long- and short-term insurance premium income from insurance and investment policy contracts, which are included in the financial statements. New business In the case of long-term insurance business the value of all new policies (insurance and investment contracts) that have been issued during the financial year and have not subsequently been refunded is regarded as new business. Payments to clients Payments to clients include policy benefits paid in respect of long- and short-term insurance and investment policy contracts, which are included in the financial statements. ACCOUNTING POLICIES 1. Introduction The Sanlam Life Group has identified the accounting policies that are most significant to its business operations and the understanding of its results. These include policies relating to insurance liabilities, deferred acquisition costs, the ascertainment of fair values of financial assets, financial liabilities and derivative financial instruments, and the determination of impairment losses. In each case, the determination of these is fundamental to the financial results and position, and requires management to make complex judgements based on information and financial data that may change in future periods. Since these involve the use of assumptions and subjective judgements as to future events and are subject to change, the use of different assumptions or data could produce materially different results. These policies (as set out below) are in accordance with and comply with IFRS and have been applied consistently for all periods presented, unless otherwise noted. 2. Change in accounting policies
Sanlam Sky Solutions and Channel Life were integrated into a single business unit after the acquisition of the minority shareholder interest in Channel Life during 2009. As part of the integration, Channel Life’s accounting policies for insurance contracts have been aligned with that of the Sanlam Life group by eliminating negative rand reserves values held as part of its insurance contract policy liabilities. The alignment of the accounting policies results in a more consistent presentation of the Sanlam Life Group results.
13
3. Significant accounting policies Basis of consolidation Subsidiaries and consolidated funds are entities (including special purpose entities) that are controlled by Sanlam Life Insurance Limited or any of its subsidiaries. The Group has control over an entity where it has the power, directly or indirectly, to govern the financial and operating policies of the entity so as to obtain benefits from its activities. The existence and effect of potential voting rights that are currently exercisable or convertible are considered when assessing whether control exists. The purchase method of accounting is applied to account for acquisitions of subsidiaries. The cost of an acquisition is measured as the fair value of consideration transferred, equity instruments issued and liabilities assumed at the date of exchange. Costs directly attributable to an acquisition are expensed in the Statement of Comprehensive Income with effect from the 2010 financial year. These costs were capitalised against the investment acquired in financial years up to the end of 2009. Identifiable assets and liabilities acquired and contingent liabilities assumed are recognised at fair value at acquisition date. The excess of the cost of an acquisition over the Group’s share of the fair value of the net identifiable assets and contingent liabilities represents goodwill and is accounted for in terms of the accounting policy note for goodwill. If the cost of an acquisition is less than the fair value of the net identifiable assets and contingent liabilities, the difference is recognised in the statement of comprehensive income. The results of subsidiaries and consolidated funds are included from the effective dates when control is acquired to the effective dates when the Group ceases to have a controlling interest, using accounting policies uniform to the Group. Intergroup transactions, balances and unrealised profits on intergroup transactions are eliminated. Unrealised losses are also eliminated unless the transaction indicates the impairment of the asset transferred. The interest of minority shareholders in subsidiaries is stated at the minorities’ share of the recognised values of the subsidiaries’ assets and liabilities. Net losses attributable to minority shareholders in excess of the minority interest are recognised as negative reserves against minority shareholders’ interest. A financial liability is recognised, and classified as at fair value through profit or loss, for the fair value of external investors’ interest in consolidated funds where the issued units of the fund are classified as financial liabilities in terms of IFRS. Changes in the fair value of the external investors’ liability are recognised in the statement of comprehensive income. In all other instances, the interests of external investors in consolidated funds are not financial liabilities and are recognised as minority shareholders’ interest. The Group offers cell captive facilities to clients. Cells are classified as special purpose entities and are regarded as being controlled by the cell owner. For this reason these cell captive facilities are not consolidated by the Group. In the case of third party cells, the insurer is still the principal to the insurance transaction, although the business is written on behalf of the cell owner. The insurer, however, in substance reinsures this business to the cell as the cell owner remains responsible for the solvency of the cell. The cell owner’s interest liability represents the cell owner’s funds withheld by the insurer, similar to an insurance deposit. The assets relating to the funds withheld are under the control of the insurer and are therefore reflected as part of the financial assets at fair value through income or cash and cash equivalents, depending on the nature of the assets.
14
The Company financial statements are consistent with the Group financial statements, apart from investments in subsidiaries, associates and joint ventures, which are valued at fair value through profit or loss. Stock exchange prices are used to determine fair value for listed subsidiaries, associates and joint ventures. The fair values of unlisted subsidiaries, associates and joint ventures are determined by the directors using equity valuation methodologies. Property and equipment Property and equipment are reflected at their depreciated cost prices less provisions for impairment in value, where appropriate. Depreciation is provided for on a straight-line basis, taking into account the residual value and estimated useful lives of the assets, which vary between two and twenty years. If the expected residual value is equal to or greater than the carrying value, no depreciation is provided for. The residual values, estimated useful lives of the assets and depreciation methods are reviewed at each statement of financial position date and adjusted as appropriate. Cost prices include costs directly attributable to the acquisition of property and equipment, as well as any subsequent expenditure when it is probable that future economic benefits associated with the item will flow to the Group and the expenditure can be measured reliably. Property and equipment is included in the net asset value of cash generating units for impairment testing purposes. Property and equipment are derecognised at disposal date or at the date when it is permanently withdrawn from use without the ability to be disposed of. The difference between the carrying amount at the date of derecognition and any disposal proceeds, as applicable, is recognised in the statement of comprehensive income. Owner-occupied property Owner-occupied property is property held for use in the supply of services or for administration purposes. These properties are valued at carrying amount less depreciation and provisions for impairment in value, where appropriate. The carrying amount is based on the cost of properties classified as owner-occupied on date of acquisition and the fair value at date of reclassification in instances where properties are reclassified from investment properties to owner-occupied properties. Depreciation is provided for on a straight-line basis by taking into account the residual value and estimated useful life of the property. The residual values, estimated useful lives of the owner-occupied properties and depreciation methods are reviewed at each statement of financial position date and adjusted as appropriate. If the expected residual value is equal to or greater than the carrying value, no depreciation is provided for. Owner-occupied property is tested bi-annually for impairment. When owner-occupied properties become investment properties, they are reclassified to investment properties at the fair value of the properties at the date of reclassification. The difference between the carrying value and fair value of the properties at the date of reclassification is recognised directly in other comprehensive income as a revaluation surplus. Owner-occupied property is derecognised at disposal date or at the date when it is permanently withdrawn from use without the ability to be disposed of. The difference between the carrying amount at the date of derecognition and any disposal proceeds, as applicable, is recognised in the statement of comprehensive income. Goodwill Goodwill arises on the acquisition of a subsidiary company or the acquisition of a business. It represents the excess of the cost of an acquisition over the Group’s share of the fair value of the net identifiable assets of the subsidiary or business at the date of acquisition. Goodwill is not amortised. The gain or loss on the disposal of a subsidiary or business includes the carrying amount of goodwill attributable to the entity or business sold.
15
Goodwill is not recognised when an interest in an existing subsidiary is increased. The difference between the cost of the acquisition and the minority interest acquired is accounted for directly in equity. These differences were recognised as goodwill for business combinations occurring before 1 January 2010. When an interest in an existing subsidiary is decreased without a loss of control, the difference between the proceeds received and the share of the net assets disposed of, including an appropriate portion of the related goodwill, is accounted for directly in equity. These profits and losses were recognised in the Statement of Comprehensive Income before 1 January 2010. For impairment purposes the carrying amount of goodwill is allocated to cash generating units, reviewed bi-annually for impairment and written down where this is considered necessary. Impairment losses in respect of goodwill are recognised in the statement of comprehensive income and are not reversed. Where a number of related businesses acquired in the same business combination are allocated to different Group business divisions, the related goodwill is held on a Group level and the businesses are combined for purposes of determining the recoverable amount of the goodwill. Goodwill in respect of associates and joint ventures is included in the carrying value of investments in associates and joint ventures. For impairment purposes each investment is tested for impairment individually and goodwill is not tested separately from the investment in associates and joint ventures, nor is any impairment allocated to any underlying assets. Value of insurance and investment business acquired The value of insurance and investment management services contracts acquired (VOBA) in a business combination is recognised as an intangible asset. VOBA, at initial recognition, is equal to the discounted value, using a risk-adjusted discount rate, of the projected stream of future after-tax profit that is expected to flow from the book of business acquired, after allowing for the cost of capital supporting the business, as applicable. The valuation is based on the Group’s actuarial and valuation principles as well as assumptions in respect of future premium income, fee income, investment return, policy benefits, costs, taxation, mortality, morbidity and surrenders, as appropriate. VOBA is amortised on a straight-line basis over the expected life of the client relationships underlying the book of business acquired. VOBA is tested for impairment on a bi-annual basis and written down for impairment where this is considered necessary. Where impairment events subsequently reverse, impairments are reversed up to a maximum of what the depreciated cost would have been. The gain or loss on the disposal of a subsidiary or business includes the carrying amount of VOBA attributable to the entity or business sold. VOBA is derecognised when the related contracts are terminated, settled or disposed of. Other intangible assets Acquired intangible assets are recognised at cost on acquisition date. Subsequent to initial recognition, these assets are reflected at their depreciated cost prices less provisions for impairment in value, where appropriate. Depreciation is provided for on a straight-line basis, taking into account the residual value and estimated useful lives of the assets. The residual values, estimated useful lives of the assets and depreciation methods are reviewed at each statement of financial position date and adjusted as appropriate. Other intangible assets are tested for impairment on a bi-annual basis and written down for impairment where this is considered necessary.
16
Costs associated with software development for internal use are capitalised if the completion of the software development is technically feasible, the Group has the intent and ability to complete the development and use the asset, the asset can be reliably measured and will generate future economic benefits. No value is attributed to internally developed brands or similar rights. Costs incurred on these items are charged to the statement of comprehensive income in the period in which they are incurred. Deferred acquisition costs Incremental costs directly attributable to the acquisition of investment contracts with investment management services are capitalised to a deferred acquisition cost (DAC) asset if they are separately identifiable, can be measured reliably and it is probable that they will be recovered. Deferred acquisition costs are amortised to the statement of comprehensive income over the term of the contracts as the related services are rendered and revenue recognised, which varies from year to year dependent on the outstanding term of the contracts in force. The DAC asset is tested for impairment bi-annually and written down when it is not expected to be fully recovered from future fee income. Long-term reinsurance contracts Contracts entered into with reinsurers under which the Group is compensated for losses on one or more long-term policy contracts issued by the Group and that meet the classification requirements for insurance contracts are classified as long-term reinsurance contracts. The expected claims and benefits to which the Group is entitled under these contracts are recognised as assets. The Group assesses its long-term reinsurance assets for impairment bi-annually. If there is objective evidence that the reinsurance asset is impaired, the carrying amount is reduced to a recoverable amount, and the impairment loss is recognised in the statement of comprehensive income. Financial instruments Financial instruments carried on the statement of financial position include investments (excluding investment properties, associates and joint ventures), receivables, cash, deposits and similar securities, investment policy contracts, term finance liabilities, liabilities in respect of external investors in consolidated funds and trade creditors. Recognition and derecognition Financial instruments are recognised when the Group becomes party to a contractual arrangement that constitutes a financial asset or financial liability for the Group that is not subject to suspensive conditions. Financial assets are derecognised when the contractual rights to receive the cash flows expire or when the asset is transferred. Financial liabilities are derecognised when the obligation to deliver cash or other resources in terms of the contract is discharged, cancelled or expires. Collateral placed at counter-parties as part of the Group’s capital market activities are not derecognised. No transfer of ownership takes place in respect of collateral other than cash and any such collateral accepted by counter-parties may not be used for any purpose other than being held as security for the trades to which such security relates. In respect of cash security, ownership transfers in law. However, the counter-party has an obligation to refund the same
17
amount of cash, together with interest, if no default has occurred in respect of the trades to which such cash security relates. Cash collateral is accordingly also not derecognised. Classification Financial instruments are classified into the following categories: Financial assets: At fair value through profit or loss
Loans and receivables Financial liabilities: At fair value through profit or loss
Other financial liabilities The classification of financial instruments is determined at initial recognition based on the purpose for which the financial assets are acquired or liabilities assumed. Financial instruments classified as at fair value through profit or loss comprise of held for trading assets and liabilities as well as financial instruments designated as at fair value through profit or loss. All non-trading financial instruments are designated as at fair value through profit or loss apart from: Working capital receivables that are classified as loans and receivables based on their short-
term nature; Financial assets acquired as part of interest margin business to match specific financial
liabilities, which are classified as loans and receivables; Term finance liabilities incurred as part of interest margin business and matched by specific
financial assets, which are classified as other financial liabilities; and Working capital payables that are classified as other financial liabilities based on their short-
term nature. The Group designates financial instruments as at fair value through profit or loss in line with its risk management policies and procedures that are based on the management of the Group’s capital and activities on a fair value basis, apart from the exceptions outlined above. The Group’s internal management reporting basis is consistent with the classification of its financial instruments. Initial measurement Financial instruments at fair value through profit or loss are initially recognised at fair value. Costs directly attributable to the acquisition of financial assets classified as at fair value through profit or loss are recognised in the statement of comprehensive income as investment surpluses. Other financial instruments are recognised at the fair value of the consideration given or received in exchange for the instrument plus transaction costs that are directly attributable to their acquisition. Regular way investment transactions are recognised by using trade date accounting. Subsequent measurement and impairment Financial instruments classified as at fair value through profit or loss are carried at fair value after initial recognition, with changes in fair value recognised in the statement of comprehensive income as investment surpluses. The particular valuation methods adopted are disclosed in the individual policy statements associated with each item. Loans and receivables and other financial liabilities are carried at amortised cost using the effective interest rate method. The carrying values of all loans and receivables are reviewed for impairment bi-annually. A financial asset is deemed to be impaired when there is objective evidence of impairment.
18
Objective evidence of impairment would include when market rates of return have increased during the period to such an extent that the asset’s recoverable amount has decreased materially. The amount of the loss is measured as the difference between the asset’s carrying amount and the present value of the asset’s estimated future cash flows, and is recognised in the statement of comprehensive income. If, in a subsequent period, the amount of the impairment loss decreases and the decrease can objectively be attributed to an event occurring after the impairment was recognised, the previously recognised impairment loss is reversed through the statement of comprehensive income, to the extent that the carrying amount of the financial asset does not exceed what the amortised cost would have been had the impairment not been recognised. If a financial asset would have been impaired had the terms of the asset not been renegotiated, the asset continues to be accounted for in accordance with its category, and the difference between the carrying amount based on the new terms and the previous carrying amount is recognised in the statement of comprehensive income as investment surpluses. Offsetting Financial assets and liabilities are offset and the net amount reported in the statement of financial position when there is currently a legally enforceable right to offset the recognised amounts and there is an intention to settle on a net basis, or to realise the assets and settle the liabilities simultaneously. Investments Investment properties Investment properties comprise properties held to earn rental income and/or for capital appreciation. Investment properties are carried at fair value based on valuations by valuators internally employed by the Sanlam Group, less the cumulative straight-line rental adjustment (refer to the accounting policy for investment income). The valuators have appropriate qualifications and extensive experience in property valuations. Fair value is determined by discounting expected future cash flows at appropriate market interest rates. Valuations are carried out monthly. Changes in the fair value of investment properties are recognised in the statement of comprehensive income as investment surpluses. When investment properties become owner-occupied, the Group reclassifies them to owner-occupied properties at a deemed cost equal to the fair value of the investment properties at the date of reclassification. When owner-occupied properties become investment properties, they are reclassified to investment properties at a deemed cost equal to the fair value of the properties at the date of reclassification. The difference between the carrying value and fair value of the properties at the date of reclassification to investment properties is recognised directly in equity as a revaluation surplus. Investment properties are derecognised when they have either been disposed of or when they are permanently withdrawn from use and no future benefit is expected from their disposal. Associates An associate is an entity, not being a subsidiary, in which the Group has a long-term investment and over which it has the ability to exercise significant influence, being the ability to participate in the financial and operating policies of the entity without being able to jointly control or control those policies by virtue of a majority vote.
19
Investments in associates are recognised on the date significant influence is obtained and derecognised on the date significant influence is lost. Investments in associates, other than those investments, or portions thereof, held by investment-linked life insurance funds, are initially recognised at cost. The results of these associated companies after initial recognition are accounted for using the equity method of accounting, whereby the Group’s share of associates’ post-acquisition comprehensive income profit or loss is recognised in the Group statement of comprehensive income as equity-accounted earnings, and the Group’s share of associates’ other post-acquisition movement in equity reserves is recognised in reserves, with a corresponding adjustment to the carrying value of investments in associates. Net losses are only recognised to the extent of the net investment in an associate, unless the Group has incurred obligations or made payments on behalf of the associate. Equity-accounted earnings are based on accounting policies uniform to those of the Group. The carrying amount is reviewed bi-annually for impairment and written down where this is considered necessary. The carrying value of the investment in an associate includes goodwill. Investments in associates, or portions thereof, held by investment-linked life insurance funds are treated as investments at fair value through profit or loss and are not equity-accounted. Joint ventures A joint venture is a contractual arrangement whereby two or more parties undertake an economic activity that is subject to joint control. The results of joint ventures, other than those held by investment-linked life insurance funds, are accounted for using the equity method of accounting, whereby the Group’s share of the joint ventures’ profit or loss is recognised in the Group statement of comprehensive income as equity-accounted earnings, and the Group’s share of joint ventures’ post-acquisition movement in reserves is recognised in reserves, with a corresponding adjustment to the carrying value of investments in joint ventures. Net losses are only recognised to the extent of the net investment in a joint venture, unless the Group has incurred obligations or made payments on behalf of the joint venture. Equity-accounted earnings are based on accounting policies uniform to those of the Group. The carrying value of the investment in a joint venture is reviewed bi-annually for impairment and written down where this is considered necessary. The carrying value of the investment in a joint venture includes goodwill. Investments in joint ventures held by investment-linked life insurance funds are treated as investments at fair value through profit or loss and are not equity-accounted. Other investments Other investments comprise: Equities and similar securities (including non-trading derivatives); Public sector stocks and loans; Debentures, insurance policies, preference shares and other loans; and Cash, deposits and similar securities.
These investments are either classified as at fair value through profit or loss (measured at fair value), or as loans and receivables (measured at amortised cost), as described in the financial instruments accounting policy note. Loans of investment scrip to and from third parties are not treated as sales and purchases.
20
The following bases are used to determine fair value, for those investments that are classified as at fair value through profit or loss: Listed shares and units in collective investment schemes are valued at the stock exchange and
net asset value prices respectively; The value of unlisted shares is determined by the directors using appropriate valuation bases; Listed bonds are valued at the stock exchange prices; Unlisted interest-bearing investments are valued by discounting expected future cash flows at
appropriate market interest rates; and Listed derivative instruments are valued at the South African Futures Exchange prices and
the value of unlisted derivatives is determined by the directors using generally accepted valuation models.
Derivative instruments Derivative financial instruments include foreign exchange contracts, interest rate futures, forward rate agreements, currency and interest rate swaps, currency, interest rate and equity options and other derivative financial instruments that are measured at fair value. Fair values are obtained from quoted market prices. In the absence of quoted market prices the Group uses valuation techniques that incorporate factors that market participants would consider in setting the price and are consistent with accepted economic methodologies for pricing derivatives such as discounted cash flow models and option pricing models, as appropriate. The Group calibrates its valuation techniques against market transactions or any available observable market data. Day one gains or losses on derivatives measured using these valuation techniques are recognised in the statement of comprehensive income to the extent that they arise from a technique that incorporates only variables based on observable market data and there has been a change in one of these variables (including time). If there has been no change in one of these variables, the gains or losses are deferred, and recognised in the statement of comprehensive income over the life of the instrument. The Group does not separate embedded derivatives that meet the definition of an insurance contract or relate to investment contracts recognised at fair value. Derivatives are used for non-trading purposes by Group businesses. The fair values related to non-trading derivatives are included in equities and similar securities. Non-trading transactions are those which are held for economic hedging purposes as part of the Group’s risk management strategy against assets, liabilities, positions or cash flows measured at fair value, as well as structures incorporated in the product design of policyholder products. The hedge accounting treatment prescribed by IAS 39 Financial Instruments: Recognition and Measurement is not applied. Although the nature of these derivatives is non-trading from a management perspective, IAS 39 requires all derivatives to be classified as held for trading for accounting purposes. Cash, deposits and similar securities Cash, deposits and similar securities consist of cash at hand, call deposits at banks, negotiable certificates of deposit and other short-term highly liquid investments. Short-term insurance technical provisions and assets Outstanding claims Liabilities for outstanding claims are estimated using the input of assessments for individual
21
cases reported to the Group and statistical analyses for the claims incurred but not reported, and to estimate the expected ultimate cost of more complex claims that may be affected by external factors (such as court decisions). The Group does not discount its liabilities for unpaid claims. Unearned premiums Short-term insurance premiums are recognised as financial services income proportionally over the period of coverage. The portion of premiums received on in-force contracts that relates to unexpired risks at the statement of financial position date is reported as an unearned premium liability. Short-term insurance technical assets The benefits to which the Group is entitled under its short-term reinsurance contracts are recognised as short-term insurance technical assets. These assets represent longer-term receivables that are dependent on the expected claims and benefits arising under the related reinsured insurance contracts. Amounts recoverable from reinsurers are measured consistently with the amounts associated with the reinsured insurance contracts and in accordance with the terms of each reinsurance contract.
In certain cases a reinsurance contract is entered into retrospectively to reinsure a notified claim under the Group’s property insurance contracts. Where the premium due to the reinsurer differs from the liability established by the Group for the related claim, the difference is amortised over the estimated remaining settlement period. Commissions and other incremental acquisition costs related to securing new contracts and renewing existing contracts are capitalised to deferred acquisition cost assets and amortised to the statement of comprehensive income over the period in which the related premiums are earned. All other costs are recognised as expenses when incurred.
The Group assesses its short-term insurance technical assets for impairment on a bi-annual basis. If there is objective evidence that an asset is impaired, the Group reduces the carrying amount of the asset to its recoverable amount and recognises the impairment loss in the statement of comprehensive income. Salvage and subrogation reimbursements Some insurance contracts permit the Group to sell (usually damaged) property acquired in settling a claim (salvage). The Group may also have the right to pursue third parties for payment of some or all costs (subrogation).
Estimates of salvage recoveries are included as an allowance in the measurement of the insurance liability for claims, and salvage property is recognised in other assets when the liability is settled. The allowance is the amount that can reasonably be recovered from the disposal of the property.
Subrogation reimbursements are also considered as an allowance in the measurement of the insurance liability for claims and are recognised in other assets when the liability is settled. The allowance is the assessment of the amount that can be recovered from the action against the liable third party.
22
Trade and other receivables Trade and other receivables are measured at amortised cost apart from trading account assets. Trading account assets include equities and similar securities, interest-bearing instruments and derivative financial instruments relating to the trading transactions undertaken by Sanlam Capital Markets for market making, to service customer needs, for proprietary purposes, as well as any related economic hedging transactions. These transactions are marked-to-market (fair values) after initial recognition and any profits or losses arising are recognised in the statement of comprehensive income as financial services income. The fair values related to such contracts and commitments are determined on the same basis as described for non-trading instruments in the policy note for financial instruments and are reported on a gross basis in the statement of financial position as positive and negative replacement values to the extent that set-off is not required by IAS 32 Financial Instruments: Disclosure and Presentation. Other financial liabilities Other financial liabilities include: Term finance liabilities incurred as part of interest margin business and matched by specific
financial assets measured at amortised cost; Other term finance liabilities measured at stock exchange prices or amortised cost as
applicable; Insurance contract liabilities are measured according to the bases disclosed in the section on
Policy Liabilities and Profit Entitlement; Investment contract liabilities measured at fair value, determined on the bases as disclosed in
the section on Policy Liabilities and Profit Entitlement; and External investors in consolidated funds measured at the attributable net asset value of the
respective funds. Trade and other payables Trade and other payables are measured at amortised cost, apart from trading account liabilities that are measured at fair value (refer to the description on the measurement of trading account assets in the accounting policy note for trade and other receivables, which also applies to trading account liabilities). Provisions Provisions are recognised when the Group has a present legal or constructive obligation as a result of a past event, it is probable that an outflow of resources embodying economic benefits will be required to settle the obligation and a reliable estimate of the amount of the obligation can be made. Provisions for onerous contracts are recognised when the expected benefits to be derived from contracts are less than the unavoidable cost of meeting the obligations under the contracts. Provisions are measured at the present value of the amounts that are expected to be paid to settle the obligations. Share capital Share capital is classified as equity where the Group has no obligation to deliver cash or other assets to shareholders. Preference shares issued by the Group that are redeemable or subject to fixed dividend payment terms are classified as term finance liabilities. Dividends paid in respect
23
of term finance are recognised in the statement of comprehensive income as a term finance expense. Incremental costs attributable to the issue or cancellation of equity instruments are recognised directly in equity, net of tax if applicable. Non-distributable reserve The reserve comprises the transfer from the Sanlam mutual capital fund on demutualisation and the regulatory non-distributable reserves of the Group's Botswana operations. Foreign currency translation reserve The exchange differences arising on the translation of foreign operations to the presentation currency are transferred to the foreign currency translation reserve. On disposal of the net investment, the cumulative exchange differences relating to the operations disposed of are released to the statement of comprehensive income. Consolidation reserve A consolidation reserve is created for differences in the valuation bases of long-term policy liabilities and investments supporting those liabilities. Certain assets held in policyholder portfolios may not be recognised at fair value in terms of IFRS, whereas the valuation of the related policy liabilities is based on the assets at fair value. This creates a mismatch with a corresponding impact on the shareholders’ fund. A separate reserve is created for these valuation differences due to the fact that they represent accounting differences and not economic losses for the shareholders’ fund. Valuation differences arise from the following investments which are accounted for as noted below for IFRS purposes, while for purposes of valuing the related policy liabilities these same investments are valued at fair value: Investments in subsidiaries and consolidated funds, which are valued at net asset value plus
goodwill; and The shareholders portion of investments in associates and joint ventures, which are
recognised on an equity-accounted basis.
The reserve represents temporary differences insofar as the mismatch is reversed when the affected investments are realised. Financial services income Financial services income is considered to be revenue for IFRS purposes and includes: Income earned from long-term insurance activities, such as investment and administration
fees, risk underwriting charges and asset mismatch profits or losses in respect of non-participating business;
Income from short-term insurance business, such as short-term insurance premiums; Income from investment management activities, such as fund management fees and
collective investment and linked-product administration fees; and Income from other financial services, such as independent financial advice and trust services.
24
Fees for investment management services Fees for investment management services in respect of investment contracts are recognised as services are rendered. Initial fees that relate to the future rendering of services are deferred and recognised as those future services are rendered. Fee income – long-term policy contracts Investment and insurance contract policyholders are charged for policy administration, risk underwriting and other services. These fees are recognised as revenue on an accrual basis as the related services are rendered. Short-term insurance premiums Short-term insurance premiums are accounted for when receivable, net after a provision for unearned premiums relating to risk periods that extend to the following year. Inward short-term reinsurance agreement premiums are accounted for on an intimated basis. Consulting fees earned Consulting fees are earned for advice and other services provided to clients of the Group’s financial advisory businesses. Fees are accounted for on an accrual basis as the related services are rendered. Investment return Investment income Investment income includes interest, rental and dividend income received. Interest income is accounted for on a time proportionate basis that takes into account the effective yield on the asset and includes the net income earned from interest margin business. Rental income is recognised on an accrual basis, apart from operating leases that contain fixed escalation clauses, where it is recognised on a straight-line basis over the lease term. The difference between rental income on a straight-line and accrual basis is recognised as part of the carrying amount of properties in the statement of financial position. Dividend income is recognised once the last day for registration has passed. Capitalisation shares received in terms of a capitalisation issue from reserves, other than share premium or a reduction in share capital, are treated as dividend income. Dividend income from subsidiaries is recognised when the dividends are declared by the subsidiary. In respect of the company financial statements, there is no allocation of pre-acquisition reserves to cost. We consider impairment when the dividend exceeds the total comprehensive income of the subsidiary or associate in the period the dividend is declared and the carrying amount of the investment exceeds the carrying amount of the investee's net assets, including associated goodwill. Investment surpluses Investment surpluses consist of net realised gains and losses on the sale of investments and net unrealised fair value gains and losses on the valuation of investments at fair value excluding
25
dividend and interest income. These surpluses are recognised in the statement of comprehensive income on the date of sale or upon valuation to fair value. Premium income – long-term policy contracts Premium income from long-term insurance and investment policy contracts is recognised as an increase in long-term policy liabilities. The full annual premiums on individual insurance and investment policy contracts that are receivable in terms of the policy contracts are accounted for on policy anniversary dates, notwithstanding that premiums are payable in instalments. The monthly premiums in respect of certain new products are in terms of their policy contracts accounted for when due. Cover only commences when premiums are received. Group life insurance and investment contract premiums are accounted for when receivable. Where premiums are not determined in advance, they are accounted for upon receipt. The unearned portion of accrued premiums is included within long-term policy liabilities. Policy contract benefits Underwriting benefits Life insurance policy claims received up to the last day of each financial period and claims incurred but not reported (IBNR) are provided for and included in underwriting policy benefits. Past claims experience is used as the basis for determining the extent of the IBNR claims. Provision is made for underwriting losses that may arise from unexpired short-term insurance risks when it is anticipated that unearned premiums will be insufficient to cover future claims. Income from reinsurance policies are recognised concurrently with the recognition of the related policy benefit. Other policy benefits Other policy benefits are not recognised in the Group statement of comprehensive income but reflected as a reduction in long-term policy liabilities. Maturity and annuity payments are recognised when due. Surrenders are recognised at the earlier of payment date or the date on which the policy ceases to be included in long-term policy liabilities. Sales remuneration Sales remuneration consists of commission payable to sales staff on long-term and short-term investment and insurance business and expenses directly related thereto, bonuses payable to sales staff and the Group’s contribution to their retirement and medical aid funds. Commission is accounted for on all in-force policies in the financial period during which it is incurred. The portion of sales remuneration that is directly attributable to the acquisition of long-term recurring premium investment policy contracts is capitalised to the deferred acquisition cost (DAC) asset and recognised over the period in which the related services are rendered and revenue recognised (refer policy statement for DAC asset).
26
Acquisition cost for short-term insurance business is deferred over the period in which the related premiums are earned. Sales remuneration recognised in the statement of comprehensive income includes the amortisation of deferred acquisition costs as well as sales remuneration incurred that is not directly attributable to the acquisition of long-term investment policy contracts or short-term insurance business. Administration costs Administration costs include, inter alia, indirect taxes such as VAT, property and administration expenses relating to owner-occupied property, property and investment expenses related to the management of the policyholders’ investments, claims handling costs, product development and training costs. Leases Leases of assets, under which the lessor effectively retains all the risks and benefits of ownership, are classified as operating leases. Payments made under operating leases are charged to the statement of comprehensive income on a straight-line basis over the period of the lease. When an operating lease is terminated, any payment required by the lessor by way of penalty is recognised as an expense in the period in which termination takes place. Leases where the Group effectively assumes all the risks and benefits of ownership are classified as finance leases. Finance leases are capitalised at inception at the lower of the present value of minimum lease payments and the fair value of the leased assets. The effective interest rate method is used to allocate lease payments between finance cost and the lease liability. The finance cost component is recognised as an expense in the statement of comprehensive income. Finance lease assets recognised are depreciated, where applicable, over the shorter of the assets’ useful lives and the lease terms. Borrowing costs Borrowing costs are recognised as an expense in the statement of comprehensive income on an accrual basis. Taxation Normal income tax Current income tax is provided in respect of taxable income based on currently enacted tax legislation. Deferred income tax Deferred income tax is provided for all temporary differences between the tax bases of assets and liabilities and their carrying values for financial reporting purposes using the liability method, except for: Temporary differences relating to investments in associates, joint ventures and subsidiaries
where the Group controls the timing of the reversal of the temporary differences and it is probable that the temporary differences will not reverse in the foreseeable future; and
27

Temporary differences arising from the initial recognition of assets or liabilities in transactions other than business combinations that at transaction date do not affect either accounting or taxable profit or loss.
The amount of deferred income tax provided is based on the expected realisation or settlement of the deferred tax assets and liabilities using tax rates enacted or substantively enacted at the statement of financial position date. Deferred tax assets relating to unused tax losses are recognised to the extent that it is probable that future taxable profit will be available against which the unused tax losses can be utilised. Deferred tax balances are reflected at current values and have not been discounted. Foreign currencies Transactions and balances Foreign currency transactions are translated to functional currency, i.e. the currency of the primary economic environment in which each of the Group’s entities operate, at the exchange rates on transaction date. Monetary assets and liabilities are translated to functional currency at the exchange rates ruling at the financial period end. Non-monetary assets and liabilities carried at fair value are translated to functional currency at the exchange rates ruling at valuation date. Non-monetary assets and liabilities carried at historic cost are translated to functional currency at the exchange rates ruling at the date of initial recognition. Exchange differences arising on the settlement of transactions or the translation of working capital assets and liabilities are recognised in the statement of comprehensive income as financial services income. Exchange differences on non-monetary assets and monetary assets classified as investment assets, such as equities and foreign interest-bearing investments, are included in investment surpluses. Foreign operations Statement of comprehensive income items of foreign operations (including foreign subsidiaries, associates and joint ventures) with a functional currency different from the presentation currency are converted to South African rand at the weighted average exchange rates for the financial year, except where the average exchange rate is not representative of the timing of specific items, in which instances the exchange rate on transaction date is used. The closing rate is used for the translation of assets and liabilities, including goodwill and fair value adjustments arising on the acquisition of foreign entities. At acquisition, equity is translated at the rate ruling on the date of acquisition. Post-acquisition equity is translated at the rates prevailing when the change in equity occurred. Exchange differences arising on the translation of foreign operations are transferred to a foreign currency translation reserve until the disposal of the net investment when it is released to the statement of comprehensive income. Retirement benefits Retirement benefits for employees are provided by a number of defined benefit and defined contribution pension and provident funds. The assets of these funds, including those relating to any actuarial surpluses, are held separately from those of the Group. The retirement plans are funded by payments from employees and the relevant group companies, taking into account the recommendations of the retirement fund valuator. The Group’s contributions to the defined contribution and defined benefit funds are charged to the statement of comprehensive income in the year in which they are incurred. A valuation in accordance with IAS 19 Employee Benefits is performed on the statement of financial position date. For the purpose of calculating pensions, medical contributions are deemed to be a part of
28
pensionable salary. Retirement fund contributions are made on the pensionable salary. Therefore, pensioners fund post-retirement medical contributions themselves from their increased pensions. The Group has provided in full for its medical contribution commitments in respect of pensioners and disabled members who are not covered under the current scheme. Defined-benefit plans The schemes are valued using the valuation basis for past-service cost. Any deficits advised by the actuaries are funded either immediately or through increased contributions to ensure the ongoing soundness of the schemes. Contributions are expensed during the year in which they are funded. The net surplus or deficit in the benefit obligation is the difference between the present value of the funded obligation and the fair value of plan assets. The Group recognises the estimated liability using the projected unit credit method. The present value of the overfunded portion of these schemes is recognised as an asset to the extent that there are material benefits available in the form of refunds and reductions in contributions. The amount of actuarial gains and losses recognised in the statement of comprehensive income is equal to the amount that the cumulative actuarial gains and losses at the end of the previous reporting period exceed the greater of 10% of the present value of the defined obligation or 10% of the fair value of the plan assets, amortised over the employees’ average working life. Defined-contribution plans Group contributions to the pension and provident funds are based on a percentage of the payroll and are charged against income as incurred. Medical aid benefits Group contributions to medical aid funds are charged to the statement of comprehensive income in the year in which they are incurred. Post-retirement medical aid benefits The present value of the post-retirement medical aid obligation is actuarially determined annually and any deficit or surplus is immediately recognised in the statement of comprehensive income. The Group recognises the estimated liability using the projected unit credit method. The Group has no significant exposure to any other post-retirement benefit obligation. Contingencies Possible obligations of the Group, the existence of which will only be confirmed by the occurrence or non-occurrence of uncertain future events not wholly within the control of the Group and present obligations of the Group where it is not probable that an outflow of economic benefits will be required to settle the obligation or where the amount of the obligation cannot be measured reliably, are not recognised in the Group statement of financial position but are disclosed in the notes to the financial statements. Possible assets of the Group, the existence of which will only be confirmed by the occurrence or non-occurrence of uncertain future events not wholly within the control of the Group, are not recognised in the Group statement of financial position and are only disclosed in the notes to the financial statements where an inflow of economic benefits is probable.
29
Equity-based staff long-term incentive schemes The following staff long-term incentive schemes have been implemented in the Group and have unvested conditions at 31 December 2010: Long-term Incentive Plan In 2005, the Sanlam share option scheme was replaced with a long-term incentive bonus scheme. In terms of the scheme, employees were paid bonuses that vest over a period of between three and five years. The beneficiaries under the scheme, which include executive directors, management and sales advisers employed on a full-time basis, are not entitled to the benefits under the scheme before the pre-determined dates. The cost associated with the bonuses is recognised in the statement of comprehensive income over the vesting period, based on the expected amount to vest at the pre-determined dates. Deferred Share Plan (DSP) In 2007, the DSP replaced the long-term incentive plan. In terms of the DSP, Sanlam undertakes to deliver a fixed number of shares to selected employees on pre-determined dates in the future, on condition that the employee is still in the employment of Sanlam on those dates. Vesting occurs in three tranches over a period starting three years from the grant date, subject to certain performance targets. The fair value of equity instruments granted is measured on grant date using an appropriate valuation model, which takes into account the market price on grant date, the fact that employees will not be entitled to dividends until the shares vest, as well as an assumption on the actual percentage of shares that will be delivered. The fair value on grant date is recognised in the statement of comprehensive income on a straight-line basis over the vesting period of the equity instruments, adjusted to reflect actual levels of vesting, with a corresponding increase in equity. Share Purchase Plan From 2006 loans are granted to selected key employees for the purpose of acquiring Sanlam shares. The loans are secured, bear interest at market related rates and repayable after four years. An annual retention bonus is payable to these employees based on the number of shares held by the employee. The cost in respect of these bonuses is recognised in the statement of comprehensive income over the retention period. Restricted Share Plan The Restricted Share Plan was introduced in 2006. Selected key employees are granted fully paid-up shares at no consideration in terms of retention and performance agreements. Unconditional vesting occurs on pre-determined dates subject to certain performance targets being met. The fair value of the equity investments granted on the date of grant is recognised in the statement of comprehensive income on a straight-line basis over the vesting period. Dividends Dividends proposed or declared after the statement of financial position date are not recognised at the statement of financial position date.
30
POLICY LIABILITIES AND PROFIT ENTITLEMENT
Introduction The valuation bases and methodology used to calculate the policy liabilities of all material lines of long-term insurance business and the corresponding shareholder profit entitlement for Sanlam Life are set out below. The same valuation methodology, where applicable, is applied in all material respects to value the policy liabilities of Sanlam Developing Markets Limited and the Namibian insurance companies, as well as investment contracts issued by the Channel Life group of companies, unless otherwise stated. The valuation bases and methodology, which comply with South African actuarial guidelines and requires minimum liabilities to be held based on a prospective calculation of policy liabilities, serves as a liability adequacy test. No adjustment is required to the value of the liabilities at 31 December 2010 as a result of the aforementioned adequacy test. The valuation bases and methodology comply with the requirements of IFRS. The methodology has been applied for purposes of the Group financial statements and the changes to determine the prudential regulatory results in terms of the requirements of the Long-term Insurance Act of 1998 as amended (LTIA), are presented at the end of this section. Where the valuation of long-term policy liabilities is based on the valuation of supporting assets, the assets are valued on the bases as set out in the accounting policy for investments, with the exception of investments in treasury shares, subsidiaries, associated companies, joint ventures and consolidated funds, which are also valued at fair value. Classification of contracts A distinction is made between investment contracts without discretionary participation features (DPF) (which fall within the scope of IAS 39 Financial Instruments: Recognition and Measurement); and investment contracts with DPF and insurance contracts (where the Financial Soundness Valuation (FSV) method continues to apply, subject to certain requirements specified in IFRS 4 Insurance Contracts). A contract is classified as insurance where Sanlam accepts significant insurance risk by agreeing with the policyholder to pay benefits if a specified uncertain future event (the insured event) adversely affects the policyholder or other beneficiary. Significant insurance risk exists where it is expected that for the duration of the policy or part thereof, policy benefits payable on the occurrence of the insured event will significantly exceed the amount payable on early termination, before allowance for expense deductions at early termination. Once a contract has been classified as an insurance contract, the classification remains unchanged for the remainder of its lifetime, even if the insurance risk reduces significantly during this period. Policy contracts not classified as insurance contracts are classified as investment contracts and comprise of the following categories:
• Investment contracts with DPF; • Investment contracts with investment management services; and • Other investment contracts.
An investment contract with DPF entitles the policyholder to receive benefits or bonuses in addition to guaranteed benefits. These additional benefits have the following features:
• The benefits constitute a significant portion of each policy’s total benefits; 31
• The timing and amount of the benefits are at the discretion of the Sanlam Life group, which has to be exercised in a reasonable way; and
• The benefits are based on the investment performance of a specified pool of underlying assets.
All investment contracts that fall within the scope of IAS 39 (ie all investment contracts without DPF) are designated as at fair value through profit or loss.
Insurance contracts and investment contracts with DPF The actuarial value of the policy liabilities is determined using the FSV method as described in Professional Guidance Note (PGN) 104 issued by the Actuarial Society of South Africa (Actuarial Society), which is consistent with the valuation method prescribed in the Long Term Insurance Act of 1998 as amended (LTIA) and consistent with the valuation of assets at fair value as described in the accounting policy for investments. The underlying philosophy is to recognise profits prudently over the term of each contract consistent with the work done and risk borne. In the valuation of liabilities, provision is made for: • The best estimate of future experience; • The compulsory margins prescribed in the LTIA; and • Discretionary margins determined to release profits to shareholders consistent with policy
design and company policy. The value of policy liabilities at 31 December 2010 exceeds the minimum requirements in terms of the LTIA, PGN104 and PGN 110. The application of actuarial guidance, as set out in PGN 104 and PGN 110 issued by the Actuarial Society, is described below in the context of the Group’s major product classifications. Best estimate of future experience The best estimate of future experience is determined as follows:
• Future investment return assumptions are derived from market yields of fixed interest securities on the valuation date, with adjustments for the other asset classes. The appropriate asset composition of the various asset portfolios, investment management expenses, taxation at current tax rates and charges for investment guarantees are taken into account.
For some of the Group’s African operations, where long-term fixed interest markets are underdeveloped, investment return assumptions are based on an assessment of longer-term economic conditions. The future investment returns for Namibian businesses are based on the market yields of South African fixed interest securities on the valuation date.
Refer to note 8 on page 87 for investment return assumptions per asset class.
• Unit expenses are based on the 2010 actual expenses and escalated at estimated expense inflation rates per annum. The allocation of initial and renewal expenses is based on functional cost analyses.
• Assumptions with regard to future mortality, disability and disability payment termination rates are consistent with Sanlam’s recent experience or expected future experience if this would result in a higher liability. In particular, mortality and disability rates are adjusted to allow for expected deterioration in mortality rates as a result of Aids, other pandemics and for expected improvements in mortality rates in the case of annuity business.
• Persistency assumptions with regard to lapse, surrender and paid-up rates are consistent with Sanlam’s recent experience or expected future experience if this would result in a higher liability.
32
Asset portfolios Separate asset portfolios are maintained in support of policy liabilities for each of the major lines of business; each portfolio having an asset mix appropriate for the specific product. Bonus rates are declared for each class of participating business in relation to the funding level of each portfolio and the expected future net investment return on the assets of the particular investment portfolio. Unrecouped expenses
The timing of fees recovered from some individual life policies do not correspond to the timing of the expenses incurred in respect of the policies. For certain of these policies an unrecouped expense account is created and included in the valuation of the policy liabilities. The unrecouped expense account is increased with expenses incurred and reduced by an allocation of policy charges. Policy charges are designed to ensure that on average the unrecouped expense account is redeemed over the lifetime of the related policies. Unrecouped expenses are annually assessed for impairment and are derecognised when the related contracts are settled or disposed of. Bonus stabilisation reserves Sanlam Life’s individual and group stabilised bonus portfolios are valued on a retrospective basis. If the fair value of the assets in such a portfolio is greater than the policyholders’ investment accounts (net premiums invested plus declared bonuses), a positive bonus stabilisation reserve is created, which will be used to enhance future bonuses. Conversely, if assets are less than the investment accounts, a negative bonus stabilisation reserve is created. A negative bonus stabilisation reserve will be limited to the amount that the Statutory Actuary expects will be recovered through the declaration of lower bonuses during the ensuing three years, if investment returns are in line with long-term assumptions. Negative bonus stabilisation reserves in excess of 7,5% of the investment accounts are specifically disclosed. Bonus stabilisation reserves are included in long-term policy liabilities. Provision for future bonuses Provision was made for future bonuses so that each asset portfolio, less charges for expenses (including investment guarantee charges) and profit loadings, for each line of business would be fully utilised for the benefit of the policyholders of that portfolio. Reversionary bonus business The liability is set equal to the fair value of the underlying assets. This is equivalent to a best estimate prospective liability calculation using the bonus rates as set out above, and allowing for the shareholders’ share of one-ninth of the cost of these bonuses.
The present value of the shareholders’ entitlement is sufficient to cover the compulsory margins required in the LTIA and the Actuarial Society guidelines for the valuation of policy liabilities. These margins are thus not provided for in addition to the shareholders’ entitlement. Individual stable bonus, linked and market-related business For investment policies where the bonuses are stabilised or directly related to the return on the underlying investment portfolios, the liabilities are equated to the retrospectively accumulated fair value of the underlying assets less any unrecouped expenses. These retrospective liabilities are higher than the prospective liabilities calculated as the present value of expected future benefits and expenses less future premiums at the relevant discount rates.
To the extent that the retrospective liabilities exceed the prospective liabilities, the valuation contains discretionary margins. The valuation methodology results in the release of these margins
33
to shareholders on a fee minus expenses basis consistent with the work done and risks borne over the lifetime of the policies.
An exception to the above relates to policy liabilities in respect of Sanlam Developing Markets’ individual Universal Life business (including stable bonus and market-linked business), which are valued prospectively. Negative values are not allowed in respect of any of these policies. Group stable bonus business In the case of Group policies where bonuses are stabilised, the liabilities are equated to the fair value of the retrospectively accumulated underlying assets.
Future fees are expected to exceed expenses, including allowance for the prescribed margins. These excesses are released to shareholders consistent with the work done and risks borne over the lifetime of the policies. Participating annuity business The liabilities are equated to the fair value of the retrospectively accumulated underlying assets. This is equivalent to a best estimate prospective liability calculation allowing for future bonus rates as described above and expected future investment returns. Shareholder entitlements emerge in line with fees charged less expenses incurred consistent with work done and risks borne over the lifetime of the annuities. The present value of the shareholders’ entitlement is sufficient to cover the compulsory margins for the valuation of policy liabilities. The compulsory margins are thus not provided for in addition to the shareholders’ entitlement. Non-participating annuity business Non-participating life annuity instalments and future expenses in respect of these instalments are discounted at the zero-coupon yield curve adjusted to allow for credit risk and investment administration charges. All profits or losses accrue to the shareholders when incurred. Other non-participating business Most of the other non-participating business liabilities are valued on a retrospective basis. The remainder is valued prospectively and contains discretionary margins via either an explicit interest rate deduction of less than 1% on average or by not allowing policies with negative reserves.
For Sanlam Life’s non-participating business other than life annuity business, an asset mismatch provision is maintained. The interest and asset profits arising from the non-participating portfolio are added to this provision. The asset mismatch provision accrues to shareholders at the rate of 1,33% monthly, based on the balance of the provision at the end of the previous quarter. The effect of holding this provision is, among other purposes, to dampen the impact on earnings of short-term fluctuations in fair values of assets underlying these liabilities. The asset mismatch provision represents a discretionary margin. A negative asset mismatch provision will not be created, but such shortfall will accrue to shareholders in the year in which it occurs. Provision for HIV/Aids and other pandemics A specific provision for HIV/Aids-related claims is maintained and included as follows:
Within ‘Other non-participating business’ (refer above) in respect of Sanlam Life; and Within the related prospective reserves in respect of Sanlam Developing Markets.
A prospective calculation according to the relevant guidelines is performed for Sanlam Life’s non-participating individual policies and for those with a small savings element. The provision for Sanlam Life’s other individual policies (39% of Sanlam Life’s total HIV/Aids provision for individual policies) is built up by increasing the opening provision by the HIV/Aids risk premiums and investment returns on the underlying assets. It is then reduced by claims attributed to
34
HIV/Aids and further limited to a maximum of the prospective calculation without allowance for future increases in HIV/Aids risk premiums. This retrospectively built-up provision is higher than a prospective calculation done according to the relevant guidelines allowing for possible increases in future HIV/Aids risk premiums. This difference can be regarded as a discretionary margin. It is the intention to rerate premiums as experience develops.
Premium rates for Group business are reviewed annually. The HIV/Aids provision is based on the expected HIV/Aids claims in a year and the time that may elapse before premium rates and underwriting conditions can be suitably adjusted should actual experience be worse than expected.
In addition, provision for claims relating to other pandemics is also made based on the estimated additional death claims should a moderate pandemic occur. Provision for minimum investment return guarantees In addition to the liabilities described above, a stochastic modelling approach was used to provide for the possible cost of minimum investment return guarantees provided by some participating and market-related policies, consistent with actuarial guidance note PGN 110. Working capital To the extent that the management of working capital gives rise to profits, no credit is taken for this in determining the policy liabilities. Reinsurance Liabilities are valued gross before taking into account reinsurance. Where material, the difference between the gross and net (after reinsurance) value of liabilities is held as a reinsurance asset. Investment contracts (other than with DPF) Contracts with investment management services The liabilities for individual and group contracts are set equal to the retrospectively accumulated fair value of the underlying assets. No deduction is made for unrecouped expenses. The profits or losses that accrue to shareholders are equal to fees received during the period concerned plus the movement in the DAC asset less expenses incurred.
Where these contracts provide for minimum investment return guarantees, provision is made for the fair value of the embedded derivative. Non-participating annuity business Term annuity instalments and expected future expenses in respect of these instalments are discounted at market-related interest rates. All profits or losses accrue to the shareholders when incurred. Guarantee plans Guaranteed maturity values and expected future expenses are discounted at market-related interest rates. All profits or losses accrue to the shareholders when incurred.
35
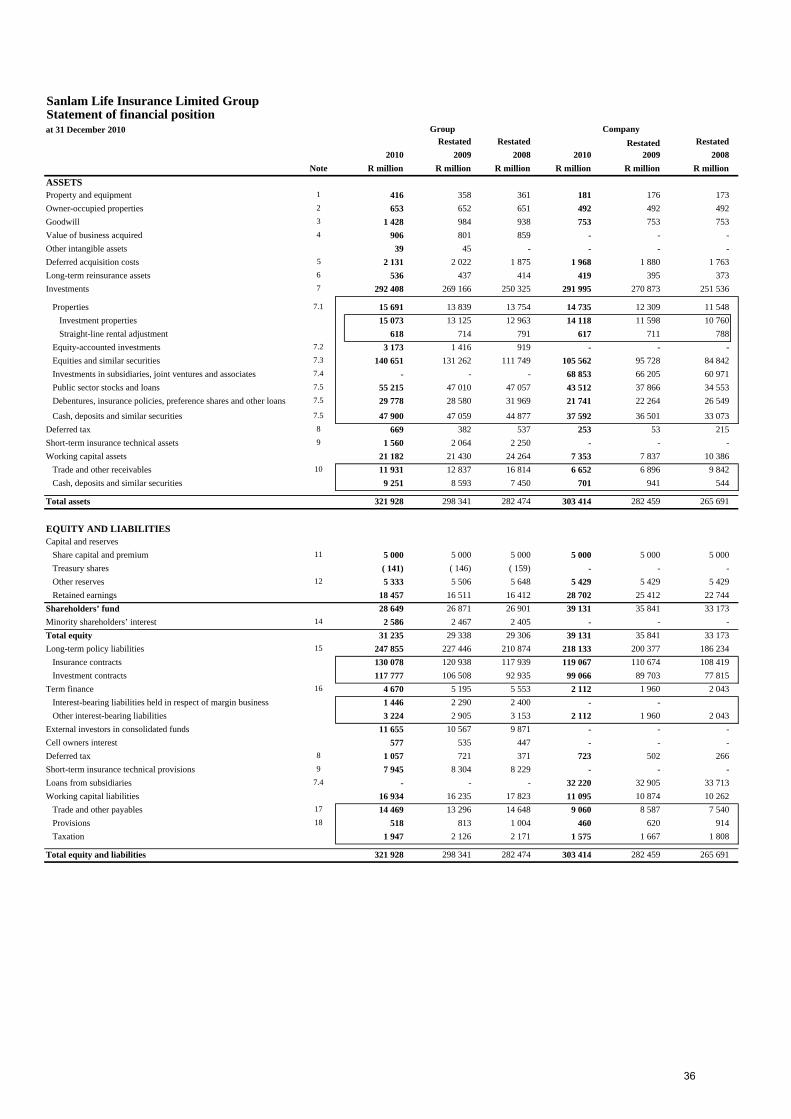
Sanlam Life Insurance Limited GroupStatement of financial positionat 31 December 2010 Group Company
Restated Restated Restated Restated2010 2009 2008 2010 2009 2008
Note R million R million R million R million R million R millionASSETSProperty and equipment 1 416 358 361 181 176 173 Owner-occupied properties 2 653 652 651 492 492 492 Goodwill 3 1 428 984 938 753 753 753 Value of business acquired 4 906 801 859 - - - Other intangible assets 39 45 - - - - Deferred acquisition costs 5 2 131 2 022 1 875 1 968 1 880 1 763 Long-term reinsurance assets 6 536 437 414 419 395 373 Investments 7 292 408 269 166 250 325 291 995 270 873 251 536
Properties 7.1 15 691 13 839 13 754 14 735 12 309 11 548 Investment properties 15 073 13 125 12 963 14 118 11 598 10 760 Straight-line rental adjustment 618 714 791 617 711 788
Equity-accounted investments 7.2 3 173 1 416 919 - - - Equities and similar securities 7.3 140 651 131 262 111 749 105 562 95 728 84 842 Investments in subsidiaries, joint ventures and associates 7.4 - - - 68 853 66 205 60 971 Public sector stocks and loans 7.5 55 215 47 010 47 057 43 512 37 866 34 553 Debentures, insurance policies, preference shares and other loans 7.5 29 778 28 580 31 969 21 741 22 264 26 549
Cash, deposits and similar securities 7.5 47 900 47 059 44 877 37 592 36 501 33 073 Deferred tax 8 669 382 537 253 53 215 Short-term insurance technical assets 9 1 560 2 064 2 250 - - - Working capital assets 21 182 21 430 24 264 7 353 7 837 10 386
Trade and other receivables 10 11 931 12 837 16 814 6 652 6 896 9 842 Cash, deposits and similar securities 9 251 8 593 7 450 701 941 544
Total assets 321 928 298 341 282 474 303 414 282 459 265 691
EQUITY AND LIABILITIESCapital and reserves
Share capital and premium 11 5 000 5 000 5 000 5 000 5 000 5 000 Treasury shares ( 141) ( 146) ( 159) - - - Other reserves 12 5 333 5 506 5 648 5 429 5 429 5 429 Retained earnings 18 457 16 511 16 412 28 702 25 412 22 744
Shareholders’ fund 28 649 26 871 26 901 39 131 35 841 33 173 Minority shareholders’ interest 14 2 586 2 467 2 405 - - - Total equity 31 235 29 338 29 306 39 131 35 841 33 173 Long-term policy liabilities 15 247 855 227 446 210 874 218 133 200 377 186 234
Insurance contracts 130 078 120 938 117 939 119 067 110 674 108 419 Investment contracts 117 777 106 508 92 935 99 066 89 703 77 815
Term finance 16 4 670 5 195 5 553 2 112 1 960 2 043 Interest-bearing liabilities held in respect of margin business 1 446 2 290 2 400 - - Other interest-bearing liabilities 3 224 2 905 3 153 2 112 1 960 2 043
External investors in consolidated funds 11 655 10 567 9 871 - - - Cell owners interest 577 535 447 - - - Deferred tax 8 1 057 721 371 723 502 266 Short-term insurance technical provisions 9 7 945 8 304 8 229 - - - Loans from subsidiaries 7.4 - - - 32 220 32 905 33 713 Working capital liabilities 16 934 16 235 17 823 11 095 10 874 10 262
Trade and other payables 17 14 469 13 296 14 648 9 060 8 587 7 540 Provisions 18 518 813 1 004 460 620 914 Taxation 1 947 2 126 2 171 1 575 1 667 1 808
Total equity and liabilities 321 928 298 341 282 474 303 414 282 459 265 691
36

Sanlam Life Insurance Limited GroupStatement of comprehensive incomefor the year ended 31 December 2010 Group Company
Restated2010 2009 2010 2009
Note R million R million R million R million
Net income 63 329 56 194 42 139 36 012 Financial services income 19 31 649 29 141 9 462 8 889 Reinsurance premiums paid 20 (3 027) (2 832) ( 350) ( 359) Reinsurance commission received 21 307 258 30 37 Investment income 22 14 522 15 306 12 592 14 428 Investment surpluses 22 20 667 15 359 20 405 13 017 Finance cost - margin business 26 ( 111) ( 200) - - Change in fair value of external investors liability ( 678) ( 838) - -
Net insurance and investment contract benefits and claims (42 622) (37 778) (29 429) (23 158) Long-term insurance contract benefits 23 (22 638) (16 592) (19 734) (13 149) Long-term investment contract benefits 23 (11 713) (12 958) (10 000) (10 365) Short-term insurance claims (9 520) (9 800) - - Reinsurance claims received 21 1 249 1 572 305 356
Expenses (11 825) (10 275) (4 349) (3 633) Sales remuneration (4 808) (4 357) (1 173) (1 085) Administration costs 24 (7 017) (5 918) (3 176) (2 548)
Impairment of investments and goodwill 39 51 ( 57) 51 ( 61)
Amortisation of intangibles ( 73) ( 63) - -
Net operating result 8 860 8 021 8 412 9 160 Equity-accounted earnings 25 315 114 - - Finance cost - other 26 ( 286) ( 335) ( 191) ( 191)
Profit before tax 8 889 7 800 8 221 8 969 Taxation 27 (2 418) (2 358) (1 431) (1 653)
Shareholders' fund (1 649) (1 580) ( 749) ( 968) Policyholders' fund ( 769) ( 778) ( 682) ( 685)
Profit for the year 6 471 5 442 6 790 7 316 Other comprehensive income
Movement in foreign currency translation reserve ( 276) ( 315) - - Comprehensive income for the year 6 195 5 127 6 790 7 316 Allocation of comprehensive incomeProfit for the year 6 471 5 442 6 790 7 316
Shareholders' fund 5 479 4 782 6 790 7 316 Minority shareholders' interest 992 660 - -
Comprehensive income for the year 6 195 5 127 6 790 7 316 Shareholders' fund 5 312 4 612 6 790 7 316 Minority shareholders' interest 883 515 - -
37
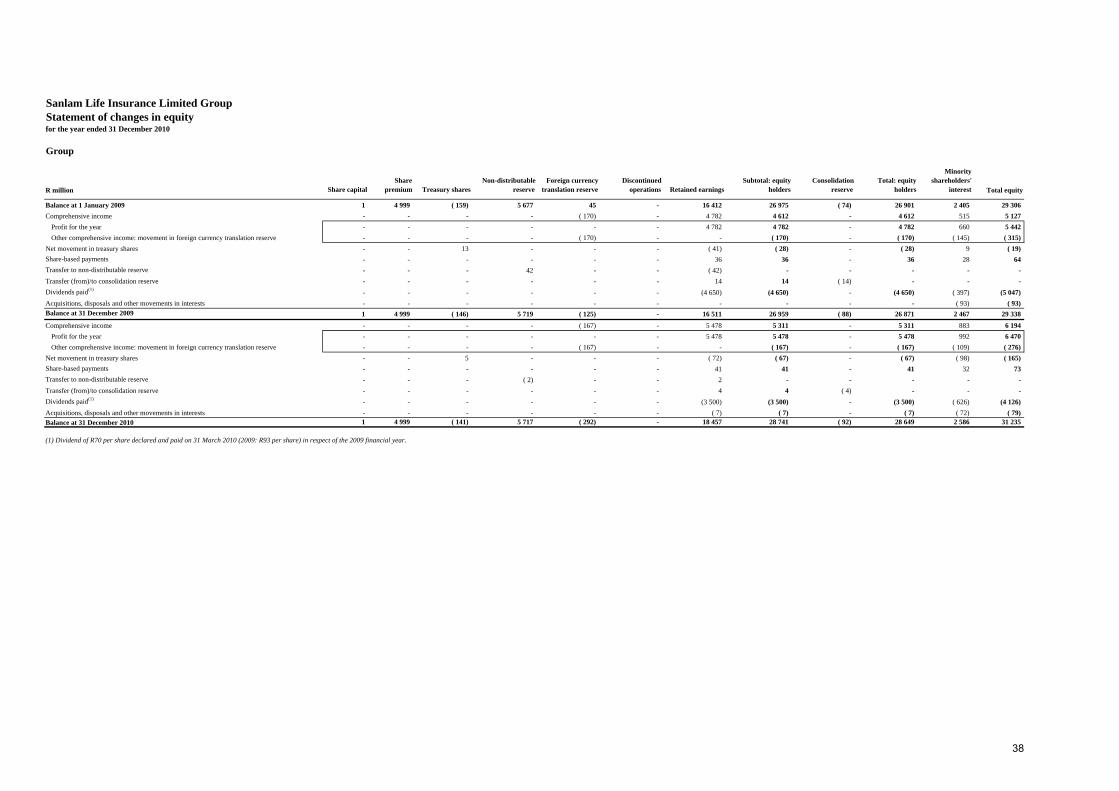
Sanlam Life Insurance Limited GroupStatement of changes in equityfor the year ended 31 December 2010
Group
R million Share capitalShare
premium Treasury sharesNon-distributable
reserveForeign currency
translation reserveDiscontinued
operations Retained earningsSubtotal: equity
holdersConsolidation
reserveTotal: equity
holders
Minority shareholders'
interest Total equity
Balance at 1 January 2009 1 4 999 ( 159) 5 677 45 - 16 412 26 975 ( 74) 26 901 2 405 29 306 Comprehensive income - - - - ( 170) - 4 782 4 612 - 4 612 515 5 127
Profit for the year - - - - - - 4 782 4 782 - 4 782 660 5 442 Other comprehensive income: movement in foreign currency translation reserve - - - - ( 170) - - ( 170) - ( 170) ( 145) ( 315)
Net movement in treasury shares - - 13 - - - ( 41) ( 28) - ( 28) 9 ( 19) Share-based payments - - - - - - 36 36 - 36 28 64 Transfer to non-distributable reserve - - - 42 - - ( 42) - - - - - Transfer (from)/to consolidation reserve - - - - - - 14 14 ( 14) - - - Dividends paid (1) - - - - - - (4 650) (4 650) - (4 650) ( 397) (5 047) Acquisitions, disposals and other movements in interests - - - - - - - - - - ( 93) ( 93) Balance at 31 December 2009 1 4 999 ( 146) 5 719 ( 125) - 16 511 26 959 ( 88) 26 871 2 467 29 338 Comprehensive income - - - - ( 167) - 5 478 5 311 - 5 311 883 6 194
Profit for the year - - - - - - 5 478 5 478 - 5 478 992 6 470 Other comprehensive income: movement in foreign currency translation reserve - - - - ( 167) - - ( 167) - ( 167) ( 109) ( 276)
Net movement in treasury shares - - 5 - - - ( 72) ( 67) - ( 67) ( 98) ( 165) Share-based payments - - - - - - 41 41 - 41 32 73 Transfer to non-distributable reserve - - - ( 2) - - 2 - - - - - Transfer (from)/to consolidation reserve - - - - - - 4 4 ( 4) - - - Dividends paid (1) - - - - - - (3 500) (3 500) - (3 500) ( 626) (4 126) Acquisitions, disposals and other movements in interests - - - - - - ( 7) ( 7) - ( 7) ( 72) ( 79) Balance at 31 December 2010 1 4 999 ( 141) 5 717 ( 292) - 18 457 28 741 ( 92) 28 649 2 586 31 235
(1) Dividend of R70 per share declared and paid on 31 March 2010 (2009: R93 per share) in respect of the 2009 financial year.
38
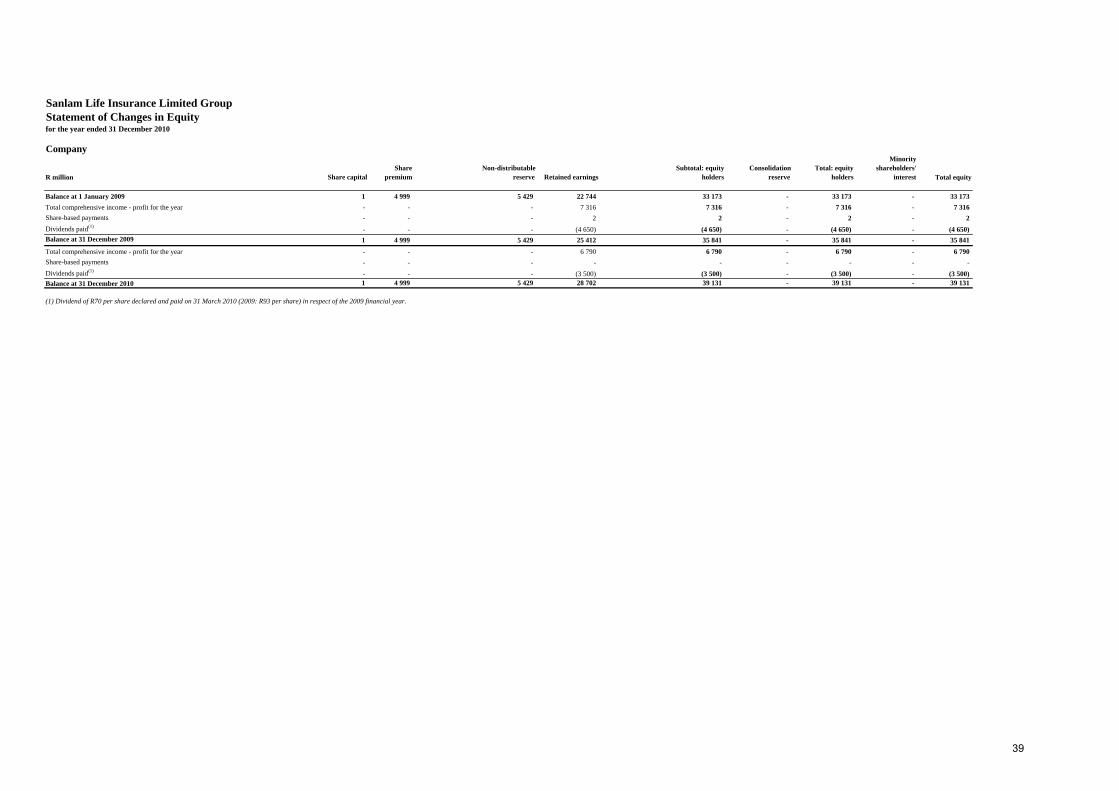
Sanlam Life Insurance Limited GroupStatement of Changes in Equityfor the year ended 31 December 2010
Company
R million Share capitalShare
premiumNon-distributable
reserve Retained earningsSubtotal: equity
holdersConsolidation
reserveTotal: equity
holders
Minority shareholders'
interest Total equity
Balance at 1 January 2009 1 4 999 5 429 22 744 33 173 - 33 173 - 33 173 Total comprehensive income - profit for the year - - - 7 316 7 316 - 7 316 - 7 316 Share-based payments - - - 2 2 - 2 - 2 Dividends paid (1) - - - (4 650) (4 650) - (4 650) - (4 650) Balance at 31 December 2009 1 4 999 5 429 25 412 35 841 - 35 841 - 35 841 Total comprehensive income - profit for the year - - - 6 790 6 790 - 6 790 - 6 790 Share-based payments - - - - - - - - - Dividends paid (1) - - - (3 500) (3 500) - (3 500) - (3 500) Balance at 31 December 2010 1 4 999 5 429 28 702 39 131 - 39 131 - 39 131
(1) Dividend of R70 per share declared and paid on 31 March 2010 (2009: R93 per share) in respect of the 2009 financial year.
39
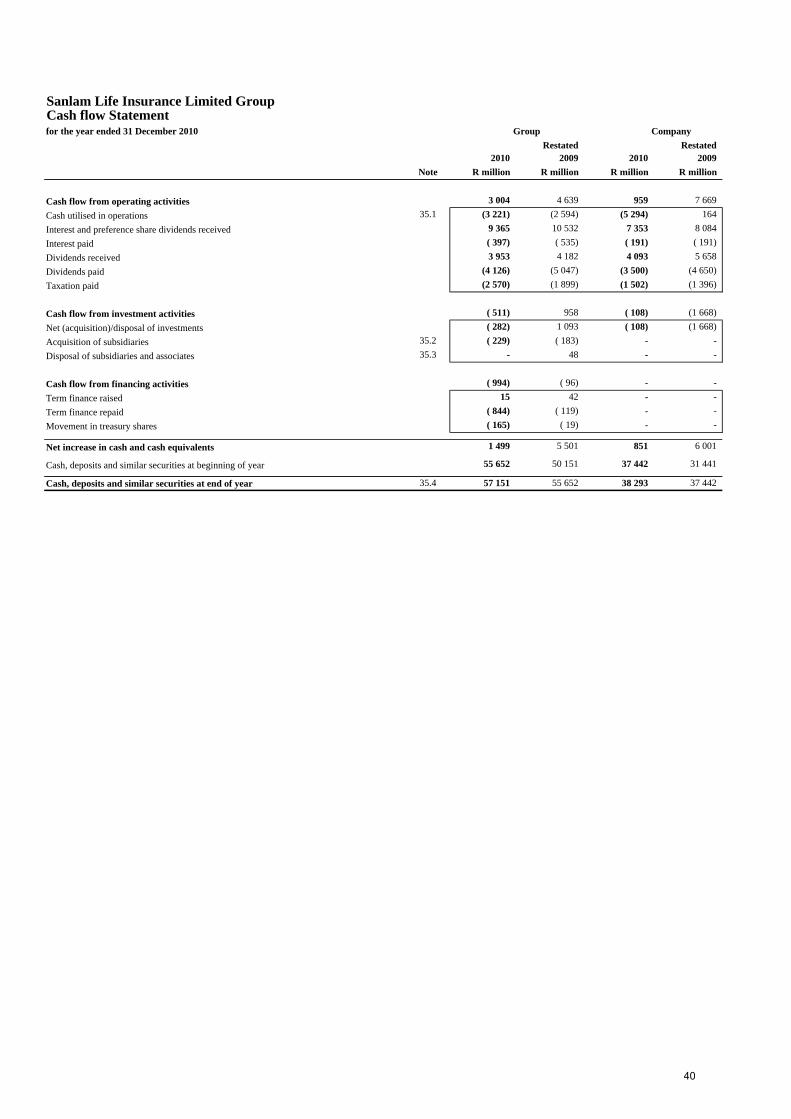
Sanlam Life Insurance Limited GroupCash flow Statementfor the year ended 31 December 2010 Group Company
Restated Restated2010 2009 2010 2009
Note R million R million R million R million
Cash flow from operating activities 3 004 4 639 959 7 669 Cash utilised in operations 35.1 (3 221) (2 594) (5 294) 164 Interest and preference share dividends received 9 365 10 532 7 353 8 084 Interest paid ( 397) ( 535) ( 191) ( 191) Dividends received 3 953 4 182 4 093 5 658 Dividends paid (4 126) (5 047) (3 500) (4 650) Taxation paid (2 570) (1 899) (1 502) (1 396)
Cash flow from investment activities ( 511) 958 ( 108) (1 668) Net (acquisition)/disposal of investments ( 282) 1 093 ( 108) (1 668) Acquisition of subsidiaries 35.2 ( 229) ( 183) - - Disposal of subsidiaries and associates 35.3 - 48 - -
Cash flow from financing activities ( 994) ( 96) - - Term finance raised 15 42 - - Term finance repaid ( 844) ( 119) - - Movement in treasury shares ( 165) ( 19) - -
Net increase in cash and cash equivalents 1 499 5 501 851 6 001
Cash, deposits and similar securities at beginning of year 55 652 50 151 37 442 31 441
Cash, deposits and similar securities at end of year 35.4 57 151 55 652 38 293 37 442
40
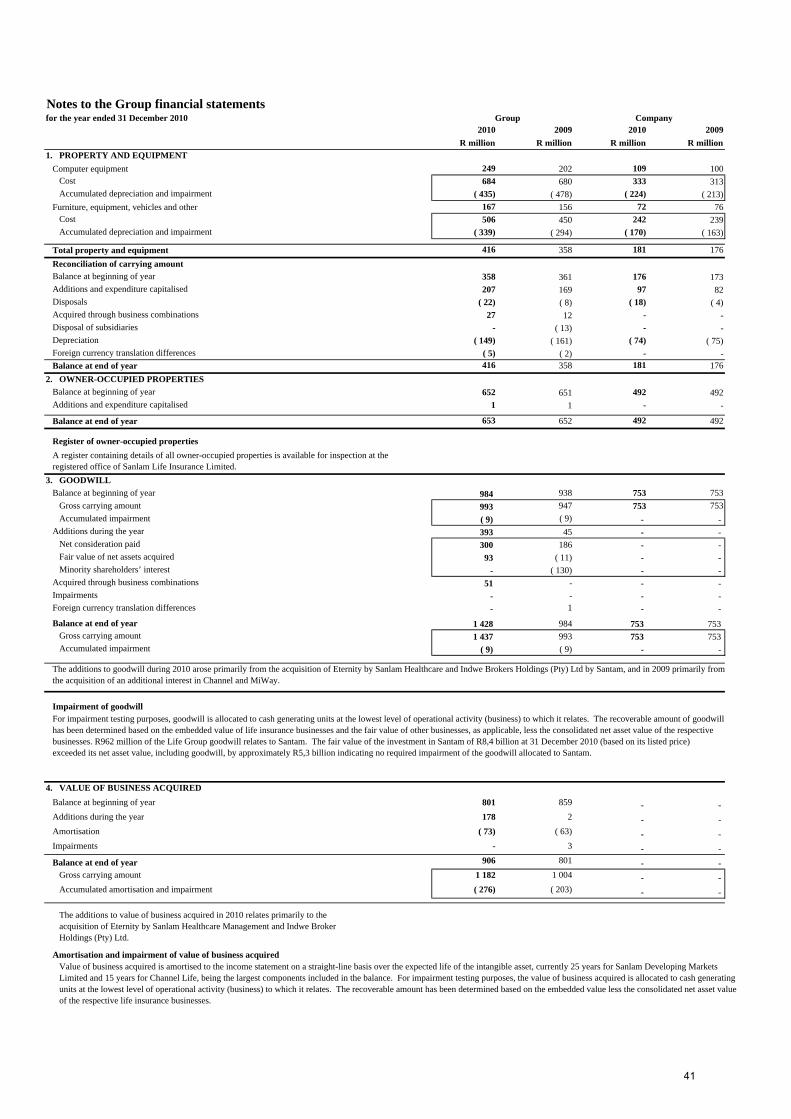
Notes to the Group financial statements for the year ended 31 December 2010 Group Company
2010 2009 2010 2009 R million R million R million R million
1. PROPERTY AND EQUIPMENTComputer equipment 249 202 109 100
Cost 684 680 333 313 Accumulated depreciation and impairment ( 435) ( 478) ( 224) ( 213)
Furniture, equipment, vehicles and other 167 156 72 76 Cost 506 450 242 239 Accumulated depreciation and impairment ( 339) ( 294) ( 170) ( 163)
Total property and equipment 416 358 181 176 Reconciliation of carrying amountBalance at beginning of year 358 361 176 173 Additions and expenditure capitalised 207 169 97 82 Disposals ( 22) ( 8) ( 18) ( 4) Acquired through business combinations 27 12 - - Disposal of subsidiaries - ( 13) - - Depreciation ( 149) ( 161) ( 74) ( 75) Foreign currency translation differences ( 5) ( 2) - - Balance at end of year 416 358 181 176
2. OWNER-OCCUPIED PROPERTIESBalance at beginning of year 652 651 492 492 Additions and expenditure capitalised 1 1 - -
Balance at end of year 653 652 492 492
Register of owner-occupied properties
3. GOODWILLBalance at beginning of year 984 938 753 753
Gross carrying amount 993 947 753 753 Accumulated impairment ( 9) ( 9) - -
Additions during the year 393 45 - - Net consideration paid 300 186 - - Fair value of net assets acquired 93 ( 11) - - Minority shareholders’ interest - ( 130) - -
Acquired through business combinations 51 - - - Impairments - - - -
A register containing details of all owner-occupied properties is available for inspection at the registered office of Sanlam Life Insurance Limited.
Foreign currency translation differences - 1 - - Balance at end of year 1 428 984 753 753
Gross carrying amount 1 437 993 753 753 Accumulated impairment ( 9) ( 9) - -
Impairment of goodwill
4. VALUE OF BUSINESS ACQUIREDBalance at beginning of year 801 859 - - Additions during the year 178 2 - - Amortisation ( 73) ( 63) - - Impairments - 3 - - Balance at end of year 906 801 - -
Gross carrying amount 1 182 1 004 - - Accumulated amortisation and impairment ( 276) ( 203) - -
The additions to value of business acquired in 2010 relates primarily to the acquisition of Eternity by Sanlam Healthcare Management and Indwe Broker Holdings (Pty) Ltd.
Amortisation and impairment of value of business acquired
For impairment testing purposes, goodwill is allocated to cash generating units at the lowest level of operational activity (business) to which it relates. The recoverable amount of goodwill has been determined based on the embedded value of life insurance businesses and the fair value of other businesses, as applicable, less the consolidated net asset value of the respective businesses. R962 million of the Life Group goodwill relates to Santam. The fair value of the investment in Santam of R8,4 billion at 31 December 2010 (based on its listed price) exceeded its net asset value, including goodwill, by approximately R5,3 billion indicating no required impairment of the goodwill allocated to Santam.
The additions to goodwill during 2010 arose primarily from the acquisition of Eternity by Sanlam Healthcare and Indwe Brokers Holdings (Pty) Ltd by Santam, and in 2009 primarily from the acquisition of an additional interest in Channel and MiWay.
Value of business acquired is amortised to the income statement on a straight-line basis over the expected life of the intangible asset, currently 25 years for Sanlam Developing Markets Limited and 15 years for Channel Life, being the largest components included in the balance. For impairment testing purposes, the value of business acquired is allocated to cash generating units at the lowest level of operational activity (business) to which it relates. The recoverable amount has been determined based on the embedded value less the consolidated net asset value of the respective life insurance businesses.
41
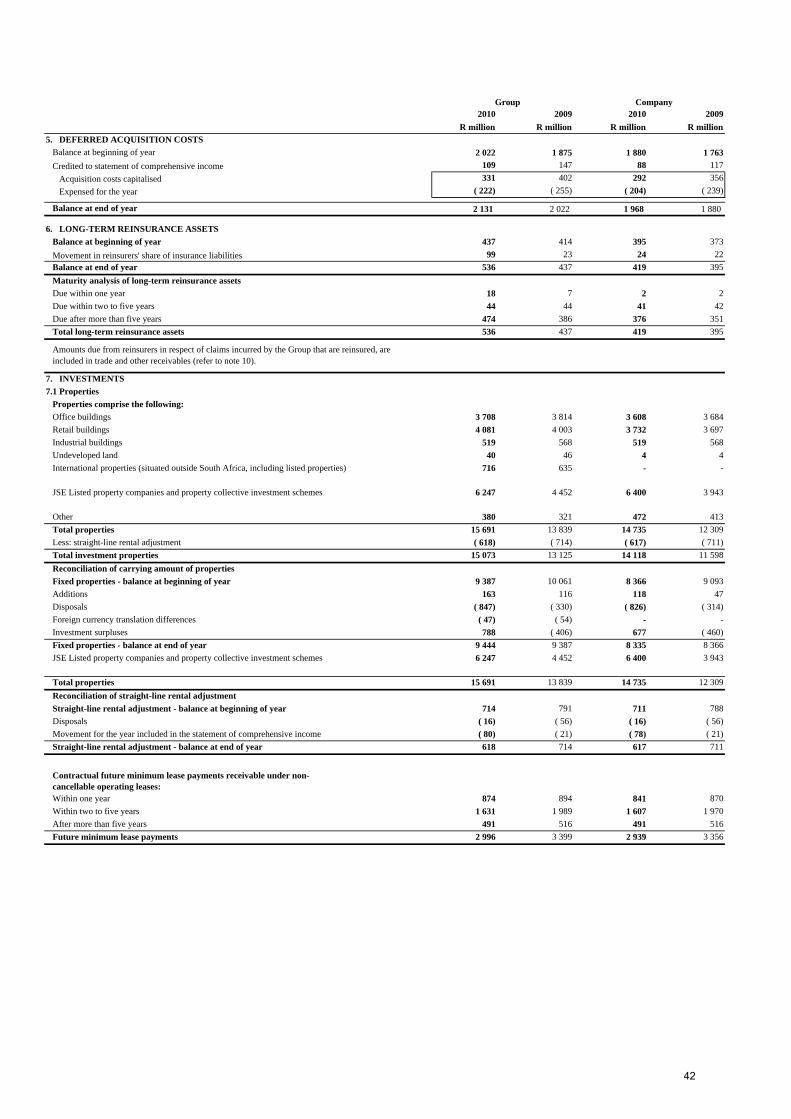
Group Company2010 2009 2010 2009
R million R million R million R million 5. DEFERRED ACQUISITION COSTS
Balance at beginning of year 2 022 1 875 1 880 1 763 Credited to statement of comprehensive income 109 147 88 117
Acquisition costs capitalised 331 402 292 356 Expensed for the year ( 222) ( 255) ( 204) ( 239)
Balance at end of year 2 131 2 022 1 968 1 880
6. LONG-TERM REINSURANCE ASSETSBalance at beginning of year 437 414 395 373 Movement in reinsurers' share of insurance liabilities 99 23 24 22 Balance at end of year 536 437 419 395 Maturity analysis of long-term reinsurance assetsDue within one year 18 7 2 2 Due within two to five years 44 44 41 42 Due after more than five years 474 386 376 351 Total long-term reinsurance assets 536 437 419 395
7. INVESTMENTS 7.1 Properties
Properties comprise the following: Office buildings 3 708 3 814 3 608 3 684 Retail buildings 4 081 4 003 3 732 3 697 Industrial buildings 519 568 519 568 Undeveloped land 40 46 4 4 International properties (situated outside South Africa, including listed properties) 716 635 - -
JSE Listed property companies and property collective investment schemes 6 247 4 452 6 400 3 943
Other 380 321 472 413 Total properties 15 691 13 839 14 735 12 309 Less: straight-line rental adjustment ( 618) ( 714) ( 617) ( 711) Total investment properties 15 073 13 125 14 118 11 598 Reconciliation of carrying amount of properties Fixed properties - balance at beginning of year 9 387 10 061 8 366 9 093 Additions 163 116 118 47
Amounts due from reinsurers in respect of claims incurred by the Group that are reinsured, are included in trade and other receivables (refer to note 10).
Disposals ( 847) ( 330) ( 826) ( 314) Foreign currency translation differences ( 47) ( 54) - - Investment surpluses 788 ( 406) 677 ( 460) Fixed properties - balance at end of year 9 444 9 387 8 335 8 366 JSE Listed property companies and property collective investment schemes 6 247 4 452 6 400 3 943
Total properties 15 691 13 839 14 735 12 309 Reconciliation of straight-line rental adjustmentStraight-line rental adjustment - balance at beginning of year 714 791 711 788 Disposals ( 16) ( 56) ( 16) ( 56) Movement for the year included in the statement of comprehensive income ( 80) ( 21) ( 78) ( 21) Straight-line rental adjustment - balance at end of year 618 714 617 711
Contractual future minimum lease payments receivable under non-cancellable operating leases:Within one year 874 894 841 870 Within two to five years 1 631 1 989 1 607 1 970 After more than five years 491 516 491 516 Future minimum lease payments 2 996 3 399 2 939 3 356
42
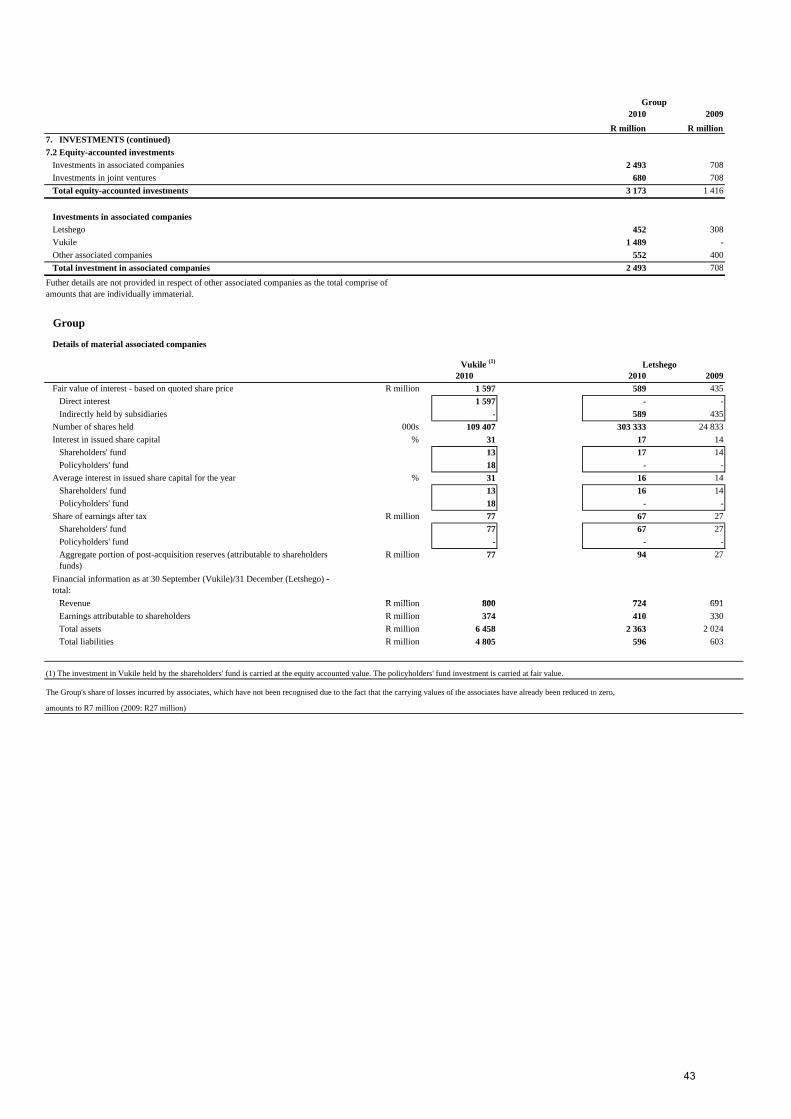
Group 2010 2009
R million R million 7. INVESTMENTS (continued)7.2 Equity-accounted investments
Investments in associated companies 2 493 708 Investments in joint ventures 680 708 Total equity-accounted investments 3 173 1 416
Investments in associated companies Letshego 452 308 Vukile 1 489 - Other associated companies 552 400 Total investment in associated companies 2 493 708
Group
Details of material associated companies
Vukile (1) Letshego2010 2010 2009
Fair value of interest - based on quoted share price R million 1 597 589 435 Direct interest 1 597 - - Indirectly held by subsidiaries - 589 435
Number of shares held 000s 109 407 303 333 24 833 Interest in issued share capital % 31 17 14
Shareholders' fund 13 17 14 Policyholders' fund 18 - -
Average interest in issued share capital for the year % 31 16 14 Shareholders' fund 13 16 14 Policyholders' fund 18 - -
Share of earnings after tax R million 77 67 27 Shareholders' fund 77 67 27 Policyholders' fund - - - Aggregate portion of post-acquisition reserves (attributable to shareholders funds)
R million 77 94 27
Financial information as at 30 September (Vukile)/31 December (Letshego) - total:
R R illi 800 724 691
Futher details are not provided in respect of other associated companies as the total comprise of amounts that are individually immaterial.
Revenue R million 800 724 691 Earnings attributable to shareholders R million 374 410 330 Total assets R million 6 458 2 363 2 024 Total liabilities R million 4 805 596 603
(1) The investment in Vukile held by the shareholders' fund is carried at the equity accounted value. The policyholders' fund investment is carried at fair value.
The Group's share of losses incurred by associates, which have not been recognised due to the fact that the carrying values of the associates have already been reduced to zero,
amounts to R7 million (2009: R27 million)
43

Group 2010 2009
R million R million 7. INVESTMENTS (continued)7.2 Equity-accounted investments (continued)
Investments in joint venturesShriram Life Insurance 257 247 Sanlam Home Loans - 120 Sanlam Personal Loans 260 133 Shriram General Insurance 143 115 Other joint ventures 20 93 Total investment in joint ventures 680 708 Shriram General Insurance conducts the Group's short term insurance activities in India. Detailed information is not provided as the Groups's share of earnings and equity is not material.Details of material joint ventures
Sanlam Home Loans (1) Sanlam Personal Loans (2)
2010 2009 2010 2009
Interest in issued share capital % - 50 70 70 Carrying value of interest R million - 120 260 133 Fair value of interest R million - 120 365 133 Share of revenue R million 116 245 284 262 Share of earnings after tax R million 3 ( 12) 67 14 Share of expenses R million 8 34 94 125 Share of assets R million - 2 522 1 256 1 045
Non-current - 2 367 916 692 Current - 155 340 353
Share of liabilities R million - 2 538 1 125 992 Non-current - 1 146 667 717
Interest bearing - 970 525 559 Non-interest bearing - 176 142 158
Current - 1 392 458 275 Interest bearing - 1 366 433 261 Non-interest bearing - 26 25 14
Aggregate portion of post-acquisition reserves (attributable to shareholders)R million - ( 23) 125 58
Contingencies and capital commitments of venturer: R million - 3 Directly incurred 298
The Group holds an interest in the following material jointly controlled entities, which are accounted for on an equity-accounted basis:
Directly incurred - 298 - - Share of cash flows R million 116 27 ( 30) ( 28)
Operating activities 98 ( 40) ( 162) 72 Investment activities - 1 - - Financing activities 18 66 132 ( 100)
Shriram Life Insurance (3)
2010 2009 Interest in issued share capital % 26 26 Carrying value of interest R million 257 247 Fair value of interest R million 267 247 Share of revenue R million ( 11) ( 2) Share of earnings after tax R million ( 11) ( 2) Share of expenses R million - - Share of assets R million 700 498
Non-current 670 474 Current 30 24
Share of liabilities R million 651 443 Non-current 618 416
Interest bearing 618 416 Non-interest bearing - -
Current 33 27 Interest bearing - - Non-interest bearing 33 27
Aggregate portion of post-acquisition reserves (attributable to shareholders)R million ( 1) 10
Share of cash flows R million ( 6) ( 1) Operating activities ( 6) ( 1) Investment activities - - Financing activities - -
(1) Sanlam Home Loans conducted the Group's mortgage lending business in South Africa and was sold during 2010. (2) Sanlam Personal Loans conducts personal loan business in South Africa. Refer to note 39 for reversal of impairment recognised during the year.(3) Shriram Life Insurance conducts the Group's long-term insurance business in India.
44
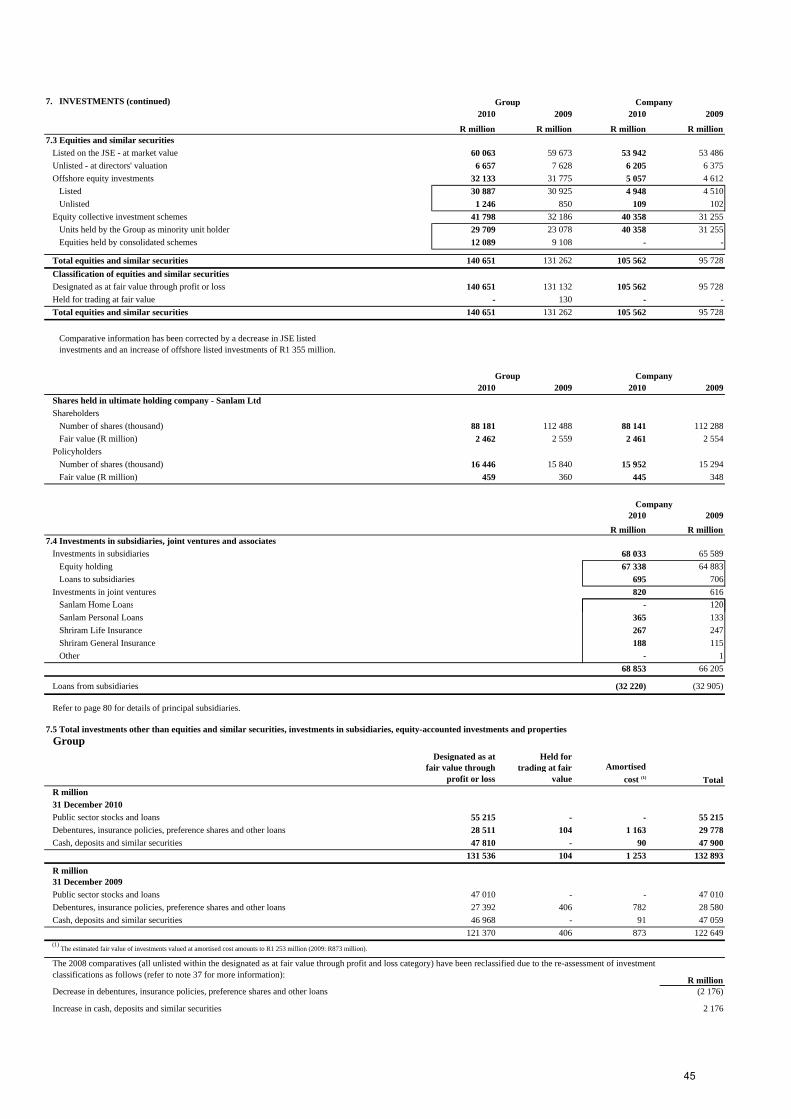
7. INVESTMENTS (continued) Group Company 2010 2009 2010 2009
R million R million R million R million 7.3 Equities and similar securities
Listed on the JSE - at market value 60 063 59 673 53 942 53 486 Unlisted - at directors' valuation 6 657 7 628 6 205 6 375 Offshore equity investments 32 133 31 775 5 057 4 612
Listed 30 887 30 925 4 948 4 510 Unlisted 1 246 850 109 102
Equity collective investment schemes 41 798 32 186 40 358 31 255 Units held by the Group as minority unit holder 29 709 23 078 40 358 31 255 Equities held by consolidated schemes 12 089 9 108 - -
Total equities and similar securities 140 651 131 262 105 562 95 728 Classification of equities and similar securitiesDesignated as at fair value through profit or loss 140 651 131 132 105 562 95 728 Held for trading at fair value - 130 - - Total equities and similar securities 140 651 131 262 105 562 95 728
Comparative information has been corrected by a decrease in JSE listed investments and an increase of offshore listed investments of R1 355 million.
Group Company 2010 2009 2010 2009
Shares held in ultimate holding company - Sanlam LtdShareholders
Number of shares (thousand) 88 181 112 488 88 141 112 288 Fair value (R million) 2 462 2 559 2 461 2 554
PolicyholdersNumber of shares (thousand) 16 446 15 840 15 952 15 294 Fair value (R million) 459 360 445 348
Company2010 2009
R million R million 7.4 Investments in subsidiaries, joint ventures and associates
Investments in subsidiaries 68 033 65 589 Equity holding 67 338 64 883 Loans to subsidiaries 695 706
Investments in joint ventures 820 616 S l H L 120Sanlam Home Loans - 120 Sanlam Personal Loans 365 133 Shriram Life Insurance 267 247 Shriram General Insurance 188 115 Other - 1
68 853 66 205
Loans from subsidiaries (32 220) (32 905)
Refer to page 80 for details of principal subsidiaries.
Group
Amortised cost (1) Total
R million31 December 2010Public sector stocks and loans 55 215 - - 55 215 Debentures, insurance policies, preference shares and other loans 28 511 104 1 163 29 778 Cash, deposits and similar securities 47 810 - 90 47 900
131 536 104 1 253 132 893
R million31 December 2009Public sector stocks and loans 47 010 - - 47 010 Debentures, insurance policies, preference shares and other loans 27 392 406 782 28 580 Cash, deposits and similar securities 46 968 - 91 47 059
121 370 406 873 122 649
R million Decrease in debentures, insurance policies, preference shares and other loans (2 176)
Increase in cash, deposits and similar securities 2 176
The 2008 comparatives (all unlisted within the designated as at fair value through profit and loss category) have been reclassified due to the re-assessment of investment classifications as follows (refer to note 37 for more information):
7.5 Total investments other than equities and similar securities, investments in subsidiaries, equity-accounted investments and properties
Held for trading at fair
value
Designated as at fair value through
profit or loss
(1) The estimated fair value of investments valued at amortised cost amounts to R1 253 million (2009: R873 million).
45
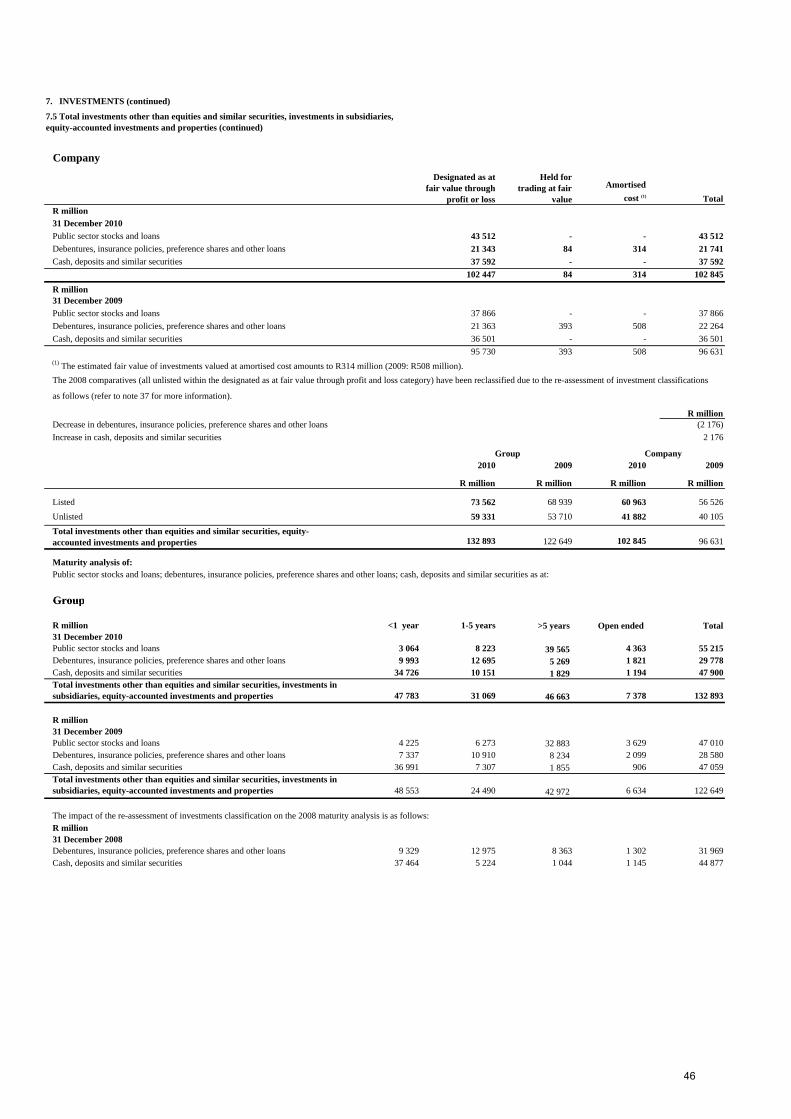
7. INVESTMENTS (continued)
Company
Amortised cost (1) Total
R million31 December 2010Public sector stocks and loans 43 512 - - 43 512 Debentures, insurance policies, preference shares and other loans 21 343 84 314 21 741 Cash, deposits and similar securities 37 592 - - 37 592
102 447 84 314 102 845
R million31 December 2009Public sector stocks and loans 37 866 - - 37 866 Debentures, insurance policies, preference shares and other loans 21 363 393 508 22 264 Cash, deposits and similar securities 36 501 - - 36 501
95 730 393 508 96 631
The 2008 comparatives (all unlisted within the designated as at fair value through profit and loss category) have been reclassified due to the re-assessment of investment classifications
as follows (refer to note 37 for more information).
R million Decrease in debentures, insurance policies, preference shares and other loans (2 176) Increase in cash, deposits and similar securities 2 176
Group Company 2010 2009 2010 2009
R million R million R million R million
Listed 73 562 68 939 60 963 56 526 Unlisted 59 331 53 710 41 882 40 105
Total investments other than equities and similar securities, equity-accounted investments and properties 132 893 122 649 102 845 96 631
Maturity analysis of:Public sector stocks and loans; debentures, insurance policies, preference shares and other loans; cash, deposits and similar securities as at:
Group
Designated as at fair value through
profit or loss
Held for trading at fair
value
7.5 Total investments other than equities and similar securities, investments in subsidiaries, equity-accounted investments and properties (continued)
(1) The estimated fair value of investments valued at amortised cost amounts to R314 million (2009: R508 million).
Group
R million <1 year 1-5 years >5 years Open ended Total31 December 2010Public sector stocks and loans 3 064 8 223 39 565 4 363 55 215 Debentures, insurance policies, preference shares and other loans 9 993 12 695 5 269 1 821 29 778 Cash, deposits and similar securities 34 726 10 151 1 829 1 194 47 900 Total investments other than equities and similar securities, investments in subsidiaries, equity-accounted investments and properties 47 783 31 069 46 663 7 378 132 893
R million31 December 2009Public sector stocks and loans 4 225 6 273 32 883 3 629 47 010 Debentures, insurance policies, preference shares and other loans 7 337 10 910 8 234 2 099 28 580 Cash, deposits and similar securities 36 991 7 307 1 855 906 47 059 Total investments other than equities and similar securities, investments in subsidiaries, equity-accounted investments and properties 48 553 24 490 42 972 6 634 122 649
The impact of the re-assessment of investments classification on the 2008 maturity analysis is as follows:R million31 December 2008Debentures, insurance policies, preference shares and other loans 9 329 12 975 8 363 1 302 31 969 Cash, deposits and similar securities 37 464 5 224 1 044 1 145 44 877
46
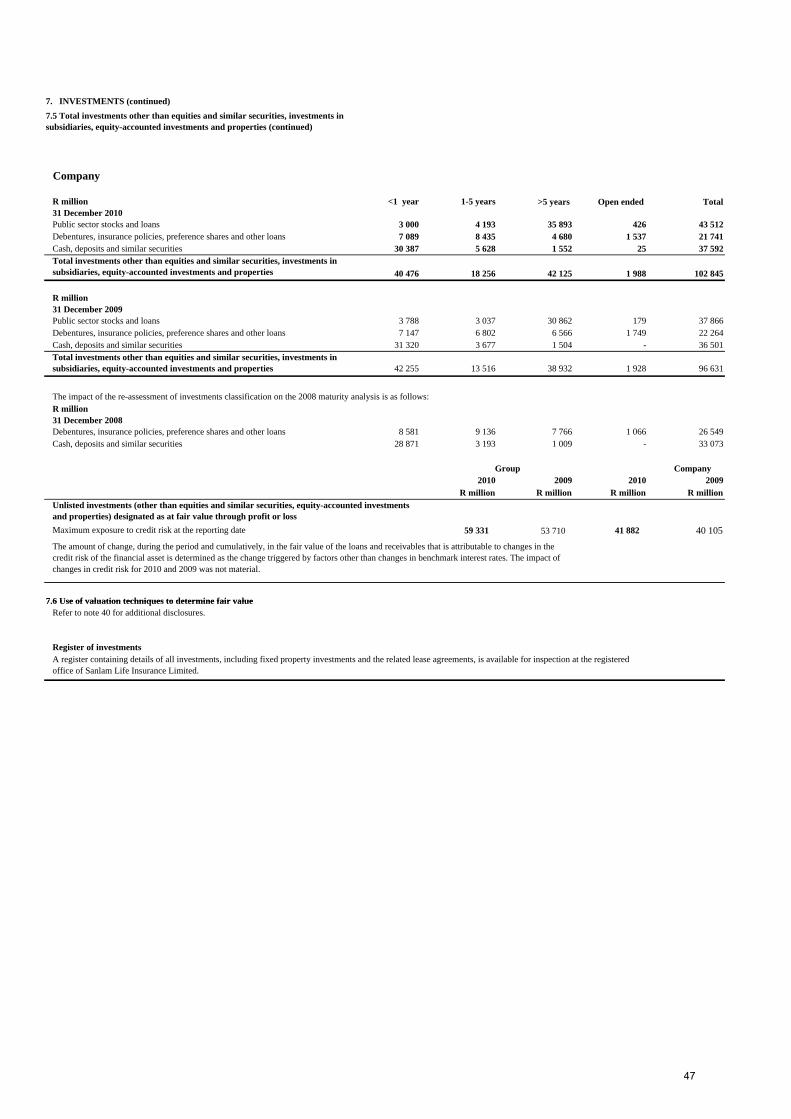
7. INVESTMENTS (continued)7.5 Total investments other than equities and similar securities, investments in subsidiaries, equity-accounted investments and properties (continued)
Company
R million <1 year 1-5 years >5 years Open ended Total31 December 2010Public sector stocks and loans 3 000 4 193 35 893 426 43 512 Debentures, insurance policies, preference shares and other loans 7 089 8 435 4 680 1 537 21 741 Cash, deposits and similar securities 30 387 5 628 1 552 25 37 592 Total investments other than equities and similar securities, investments in subsidiaries, equity-accounted investments and properties 40 476 18 256 42 125 1 988 102 845
R million31 December 2009Public sector stocks and loans 3 788 3 037 30 862 179 37 866 Debentures, insurance policies, preference shares and other loans 7 147 6 802 6 566 1 749 22 264 Cash, deposits and similar securities 31 320 3 677 1 504 - 36 501 Total investments other than equities and similar securities, investments in subsidiaries, equity-accounted investments and properties 42 255 13 516 38 932 1 928 96 631
The impact of the re-assessment of investments classification on the 2008 maturity analysis is as follows:R million31 December 2008Debentures, insurance policies, preference shares and other loans 8 581 9 136 7 766 1 066 26 549 Cash, deposits and similar securities 28 871 3 193 1 009 - 33 073
Group Company 2010 2009 2010 2009
R million R million R million R million
Maximum exposure to credit risk at the reporting date 59 331 53 710 41 882 40 105
7 6 Use of valuation techniques to determine fair value
Unlisted investments (other than equities and similar securities, equity-accounted investments and properties) designated as at fair value through profit or loss
The amount of change, during the period and cumulatively, in the fair value of the loans and receivables that is attributable to changes in the credit risk of the financial asset is determined as the change triggered by factors other than changes in benchmark interest rates. The impact of changes in credit risk for 2010 and 2009 was not material.
7.6 Use of valuation techniques to determine fair value
A register containing details of all investments, including fixed property investments and the related lease agreements, is available for inspection at the registered office of Sanlam Life Insurance Limited.
Register of investments
Refer to note 40 for additional disclosures.
47
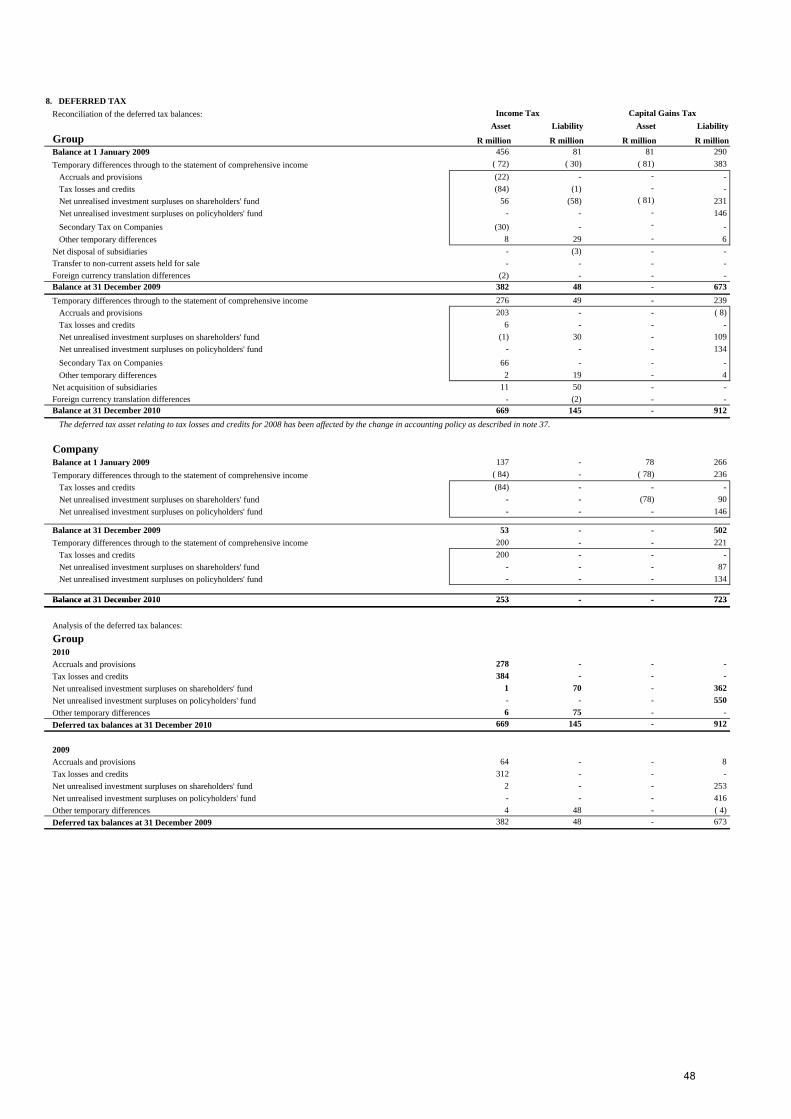
8. DEFERRED TAX Reconciliation of the deferred tax balances:
Asset Liability Asset LiabilityGroup R million R million R million R millionBalance at 1 January 2009 456 81 81 290
( 72) ( 30) ( 81) 383 Accruals and provisions (22) - - - Tax losses and credits (84) (1) - - Net unrealised investment surpluses on shareholders' fund 56 (58) ( 81) 231 Net unrealised investment surpluses on policyholders' fund - - - 146 Secondary Tax on Companies (30) - - - Other temporary differences 8 29 - 6
- (3) - - Transfer to non-current assets held for sale - - - - Foreign currency translation differences (2) - - - Balance at 31 December 2009 382 48 - 673 Temporary differences through to the statement of comprehensive income 276 49 - 239
Accruals and provisions 203 - - ( 8) Tax losses and credits 6 - - - Net unrealised investment surpluses on shareholders' fund (1) 30 - 109 Net unrealised investment surpluses on policyholders' fund - - - 134 Secondary Tax on Companies 66 - - - Other temporary differences 2 19 - 4
11 50 - - Foreign currency translation differences - (2) - - Balance at 31 December 2010 669 145 - 912
The deferred tax asset relating to tax losses and credits for 2008 has been affected by the change in accounting policy as described in note 37.
CompanyBalance at 1 January 2009 137 - 78 266
( 84) - ( 78) 236 Tax losses and credits (84) - - - Net unrealised investment surpluses on shareholders' fund - - (78) 90 Net unrealised investment surpluses on policyholders' fund - - - 146
Balance at 31 December 2009 53 - - 502 200 - - 221
Tax losses and credits 200 - - - Net unrealised investment surpluses on shareholders' fund - - - 87 Net unrealised investment surpluses on policyholders' fund - - - 134
Balance at 31 December 2010 253 - - 723
Net acquisition of subsidiaries
Capital Gains TaxIncome Tax
Temporary differences through to the statement of comprehensive income
Net disposal of subsidiaries
Temporary differences through to the statement of comprehensive income
Temporary differences through to the statement of comprehensive income
Balance at 31 December 2010 253 - - 723
Analysis of the deferred tax balances:Group2010Accruals and provisions 278 - - - Tax losses and credits 384 - - - Net unrealised investment surpluses on shareholders' fund 1 70 - 362 Net unrealised investment surpluses on policyholders' fund - - - 550 Other temporary differences 6 75 - - Deferred tax balances at 31 December 2010 669 145 - 912
2009Accruals and provisions 64 - - 8 Tax losses and credits 312 - - - Net unrealised investment surpluses on shareholders' fund 2 - - 253 Net unrealised investment surpluses on policyholders' fund - - - 416 Other temporary differences 4 48 - ( 4) Deferred tax balances at 31 December 2009 382 48 - 673
48
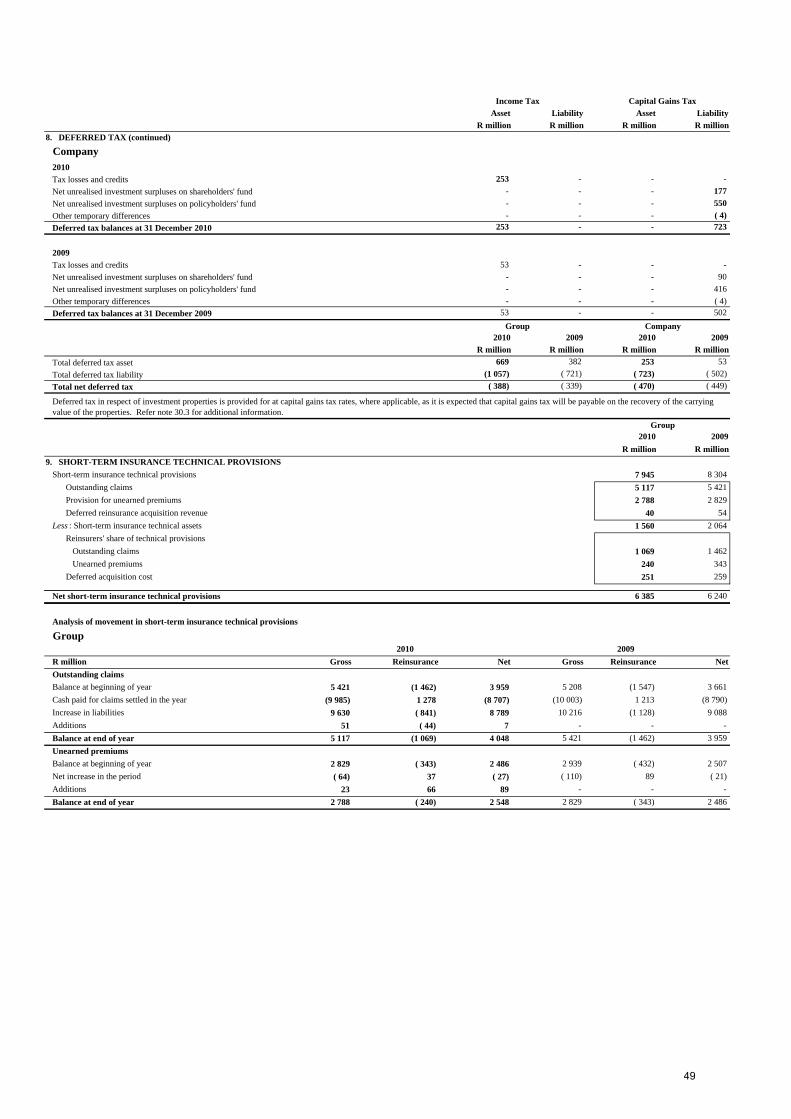
Asset Liability Asset Liability R million R million R million R million
8. DEFERRED TAX (continued)
Company2010Tax losses and credits 253 - - - Net unrealised investment surpluses on shareholders' fund - - - 177 Net unrealised investment surpluses on policyholders' fund - - - 550 Other temporary differences - - - ( 4) Deferred tax balances at 31 December 2010 253 - - 723
2009Tax losses and credits 53 - - - Net unrealised investment surpluses on shareholders' fund - - - 90 Net unrealised investment surpluses on policyholders' fund - - - 416 Other temporary differences - - - ( 4) Deferred tax balances at 31 December 2009 53 - - 502
Group Company2010 2009 2010 2009
R million R million R million R millionTotal deferred tax asset 669 382 253 53 Total deferred tax liability (1 057) ( 721) ( 723) ( 502) Total net deferred tax ( 388) ( 339) ( 470) ( 449)
Group2010 2009
R million R million9. SHORT-TERM INSURANCE TECHNICAL PROVISIONS
Short-term insurance technical provisions 7 945 8 304 Outstanding claims 5 117 5 421 Provision for unearned premiums 2 788 2 829 Deferred reinsurance acquisition revenue 40 54
Less : Short-term insurance technical assets 1 560 2 064 Reinsurers' share of technical provisions
Outstanding claims 1 069 1 462 Unearned premiums 240 343
Deferred acquisition cost 251 259
Net short-term insurance technical provisions 6 385 6 240
Deferred tax in respect of investment properties is provided for at capital gains tax rates, where applicable, as it is expected that capital gains tax will be payable on the recovery of the carrying value of the properties. Refer note 30.3 for additional information.
Income Tax Capital Gains Tax
p
Analysis of movement in short-term insurance technical provisions
Group
R million Gross Reinsurance Net Gross Reinsurance NetOutstanding claimsBalance at beginning of year 5 421 (1 462) 3 959 5 208 (1 547) 3 661 Cash paid for claims settled in the year (9 985) 1 278 (8 707) (10 003) 1 213 (8 790) Increase in liabilities 9 630 ( 841) 8 789 10 216 (1 128) 9 088 Additions 51 ( 44) 7 - - - Balance at end of year 5 117 (1 069) 4 048 5 421 (1 462) 3 959 Unearned premiumsBalance at beginning of year 2 829 ( 343) 2 486 2 939 ( 432) 2 507 Net increase in the period ( 64) 37 ( 27) ( 110) 89 ( 21) Additions 23 66 89 - - - Balance at end of year 2 788 ( 240) 2 548 2 829 ( 343) 2 486
2010 2009
49
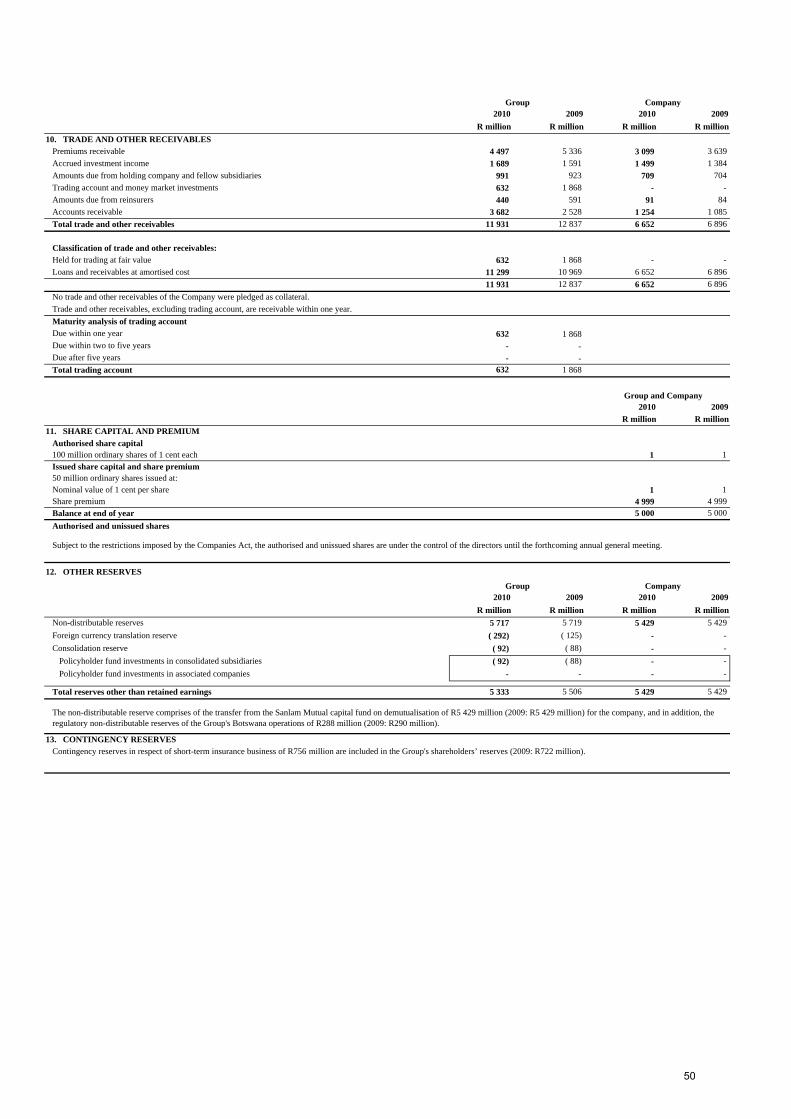
Group Company2010 2009 2010 2009
R million R million R million R million10. TRADE AND OTHER RECEIVABLES
Premiums receivable 4 497 5 336 3 099 3 639 Accrued investment income 1 689 1 591 1 499 1 384 Amounts due from holding company and fellow subsidiaries 991 923 709 704 Trading account and money market investments 632 1 868 - - Amounts due from reinsurers 440 591 91 84 Accounts receivable 3 682 2 528 1 254 1 085 Total trade and other receivables 11 931 12 837 6 652 6 896
Classification of trade and other receivables:Held for trading at fair value 632 1 868 - - Loans and receivables at amortised cost 11 299 10 969 6 652 6 896
11 931 12 837 6 652 6 896
Maturity analysis of trading accountDue within one year 632 1 868 Due within two to five years - - Due after five years - - Total trading account 632 1 868
Group and Company2010 2009
R million R million11. SHARE CAPITAL AND PREMIUM
Authorised share capital100 million ordinary shares of 1 cent each 1 1 Issued share capital and share premium50 million ordinary shares issued at:Nominal value of 1 cent per share 1 1 Share premium 4 999 4 999 Balance at end of year 5 000 5 000 Authorised and unissued shares
12. OTHER RESERVES
Group Company2010 2009 2010 2009
No trade and other receivables of the Company were pledged as collateral.Trade and other receivables, excluding trading account, are receivable within one year.
Subject to the restrictions imposed by the Companies Act, the authorised and unissued shares are under the control of the directors until the forthcoming annual general meeting.
R million R million R million R millionNon-distributable reserves 5 717 5 719 5 429 5 429 Foreign currency translation reserve ( 292) ( 125) - - Consolidation reserve ( 92) ( 88) - -
( 92) ( 88) - - - - - -
5 333 5 506 5 429 5 429
13. CONTINGENCY RESERVESContingency reserves in respect of short-term insurance business of R756 million are included in the Group's shareholders’ reserves (2009: R722 million).
Total reserves other than retained earnings
The non-distributable reserve comprises of the transfer from the Sanlam Mutual capital fund on demutualisation of R5 429 million (2009: R5 429 million) for the company, and in addition, the regulatory non-distributable reserves of the Group's Botswana operations of R288 million (2009: R290 million).
Policyholder fund investments in associated companiesPolicyholder fund investments in consolidated subsidiaries
50
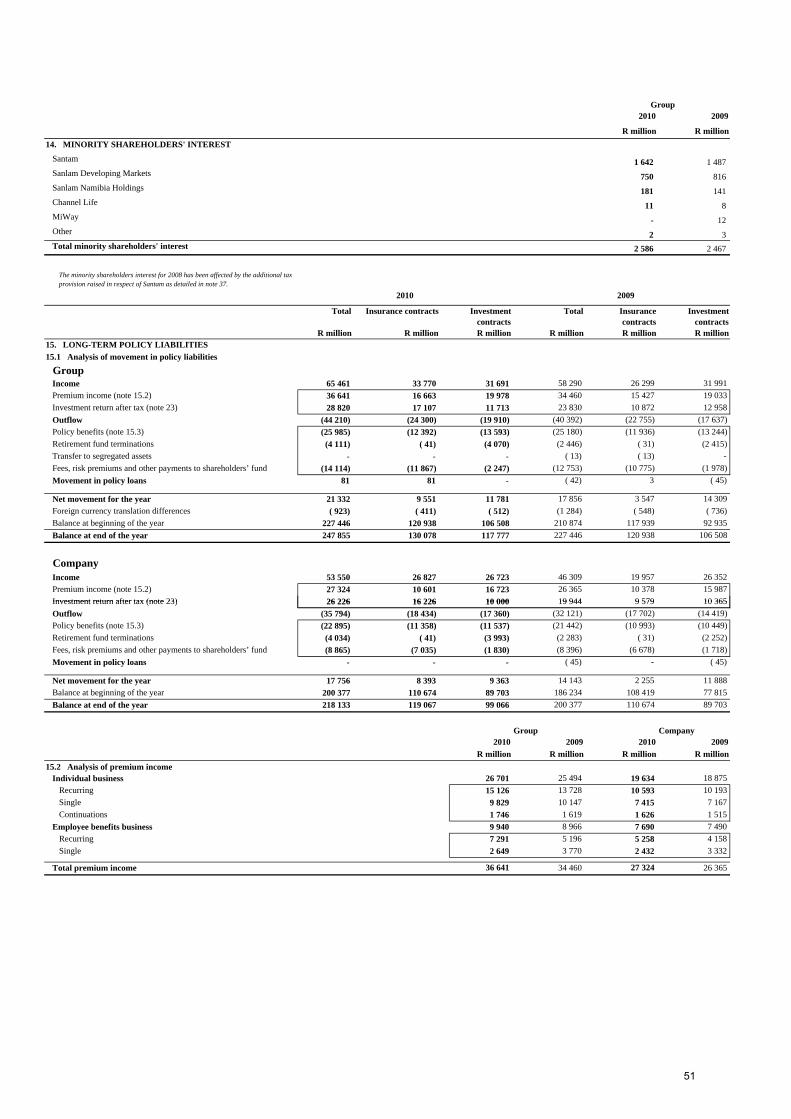
Group2010 2009
R million R million14. MINORITY SHAREHOLDERS' INTEREST
Santam 1 642 1 487 Sanlam Developing Markets 750 816 Sanlam Namibia Holdings 181 141 Channel Life 11 8 MiWay - 12 Other 2 3 Total minority shareholders' interest 2 586 2 467
The minority shareholders interest for 2008 has been affected by the additional tax provision raised in respect of Santam as detailed in note 37.
Total Insurance contracts Investment contracts
Total Insurance contracts
Investment contracts
R million R million R million R million R million R million15. LONG-TERM POLICY LIABILITIES15.1 Analysis of movement in policy liabilities
GroupIncome 65 461 33 770 31 691 58 290 26 299 31 991 Premium income (note 15.2) 36 641 16 663 19 978 34 460 15 427 19 033 Investment return after tax (note 23) 28 820 17 107 11 713 23 830 10 872 12 958 Outflow (44 210) (24 300) (19 910) (40 392) (22 755) (17 637) Policy benefits (note 15.3) (25 985) (12 392) (13 593) (25 180) (11 936) (13 244) Retirement fund terminations (4 111) ( 41) (4 070) (2 446) ( 31) (2 415) Transfer to segregated assets - - - ( 13) ( 13) - Fees, risk premiums and other payments to shareholders’ fund (14 114) (11 867) (2 247) (12 753) (10 775) (1 978) Movement in policy loans 81 81 - ( 42) 3 ( 45)
Net movement for the year 21 332 9 551 11 781 17 856 3 547 14 309 Foreign currency translation differences ( 923) ( 411) ( 512) (1 284) ( 548) ( 736) Balance at beginning of the year 227 446 120 938 106 508 210 874 117 939 92 935 Balance at end of the year 247 855 130 078 117 777 227 446 120 938 106 508
CompanyIncome 53 550 26 827 26 723 46 309 19 957 26 352 Premium income (note 15.2) 27 324 10 601 16 723 26 365 10 378 15 987 Investment return after tax (note 23) 26 226 16 226 10 000 19 944 9 579 10 365
2010 2009
Investment return after tax (note 23) 26 226 16 226 10 000 19 944 9 579 10 365 Outflow (35 794) (18 434) (17 360) (32 121) (17 702) (14 419) Policy benefits (note 15.3) (22 895) (11 358) (11 537) (21 442) (10 993) (10 449) Retirement fund terminations (4 034) ( 41) (3 993) (2 283) ( 31) (2 252) Fees, risk premiums and other payments to shareholders’ fund (8 865) (7 035) (1 830) (8 396) (6 678) (1 718) Movement in policy loans - - - ( 45) - ( 45)
Net movement for the year 17 756 8 393 9 363 14 143 2 255 11 888 Balance at beginning of the year 200 377 110 674 89 703 186 234 108 419 77 815 Balance at end of the year 218 133 119 067 99 066 200 377 110 674 89 703
Group Company2010 2009 2010 2009
R million R million R million R million15.2 Analysis of premium income
Individual business 26 701 25 494 19 634 18 875 Recurring 15 126 13 728 10 593 10 193 Single 9 829 10 147 7 415 7 167 Continuations 1 746 1 619 1 626 1 515
Employee benefits business 9 940 8 966 7 690 7 490 Recurring 7 291 5 196 5 258 4 158 Single 2 649 3 770 2 432 3 332
Total premium income 36 641 34 460 27 324 26 365
51
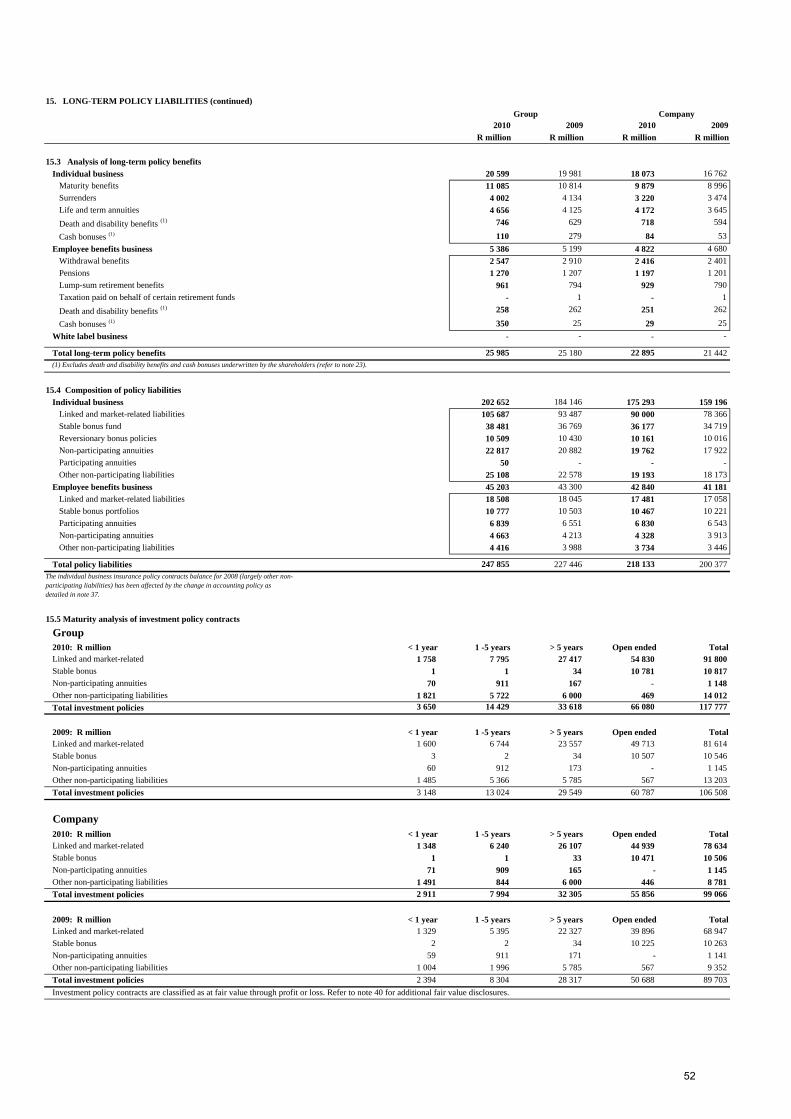
15. LONG-TERM POLICY LIABILITIES (continued)Group Company
2010 2009 2010 2009R million R million R million R million
15.3 Analysis of long-term policy benefitsIndividual business 20 599 19 981 18 073 16 762
Maturity benefits 11 085 10 814 9 879 8 996 Surrenders 4 002 4 134 3 220 3 474 Life and term annuities 4 656 4 125 4 172 3 645 Death and disability benefits (1) 746 629 718 594
Cash bonuses (1) 110 279 84 53 Employee benefits business 5 386 5 199 4 822 4 680
Withdrawal benefits 2 547 2 910 2 416 2 401 Pensions 1 270 1 207 1 197 1 201 Lump-sum retirement benefits 961 794 929 790 Taxation paid on behalf of certain retirement funds - 1 - 1 Death and disability benefits (1) 258 262 251 262
Cash bonuses (1) 350 25 29 25 White label business - - - -
Total long-term policy benefits 25 985 25 180 22 895 21 442 (1) Excludes death and disability benefits and cash bonuses underwritten by the shareholders (refer to note 23).
15.4 Composition of policy liabilitiesIndividual business 202 652 184 146 175 293 159 196
Linked and market-related liabilities 105 687 93 487 90 000 78 366 Stable bonus fund 38 481 36 769 36 177 34 719 Reversionary bonus policies 10 509 10 430 10 161 10 016 Non-participating annuities 22 817 20 882 19 762 17 922 Participating annuities 50 - - - Other non-participating liabilities 25 108 22 578 19 193 18 173
Employee benefits business 45 203 43 300 42 840 41 181 Linked and market-related liabilities 18 508 18 045 17 481 17 058 Stable bonus portfolios 10 777 10 503 10 467 10 221 Participating annuities 6 839 6 551 6 830 6 543 Non-participating annuities 4 663 4 213 4 328 3 913 Other non-participating liabilities 4 416 3 988 3 734 3 446
Total policy liabilities 247 855 227 446 218 133 200 377 The individual business insurance policy contracts balance for 2008 (largely other non-participating liabilities) has been affected by the change in accounting policy as detailed in note 37.
Group2010: R million < 1 year 1 -5 years > 5 years Open ended TotalLinked and market-related 1 758 7 795 27 417 54 830 91 800 Stable bonus 1 1 34 10 781 10 817 Non-participating annuities 70 911 167 - 1 148 Other non-participating liabilities 1 821 5 722 6 000 469 14 012 Total investment policies 3 650 14 429 33 618 66 080 117 777
2009: R million < 1 year 1 -5 years > 5 years Open ended TotalLinked and market-related 1 600 6 744 23 557 49 713 81 614 Stable bonus 3 2 34 10 507 10 546 Non-participating annuities 60 912 173 - 1 145 Other non-participating liabilities 1 485 5 366 5 785 567 13 203 Total investment policies 3 148 13 024 29 549 60 787 106 508
Company2010: R million < 1 year 1 -5 years > 5 years Open ended TotalLinked and market-related 1 348 6 240 26 107 44 939 78 634 Stable bonus 1 1 33 10 471 10 506 Non-participating annuities 71 909 165 - 1 145 Other non-participating liabilities 1 491 844 6 000 446 8 781 Total investment policies 2 911 7 994 32 305 55 856 99 066
2009: R million < 1 year 1 -5 years > 5 years Open ended TotalLinked and market-related 1 329 5 395 22 327 39 896 68 947 Stable bonus 2 2 34 10 225 10 263 Non-participating annuities 59 911 171 - 1 141 Other non-participating liabilities 1 004 1 996 5 785 567 9 352 Total investment policies 2 394 8 304 28 317 50 688 89 703 Investment policy contracts are classified as at fair value through profit or loss. Refer to note 40 for additional fair value disclosures.
15.5 Maturity analysis of investment policy contracts
52
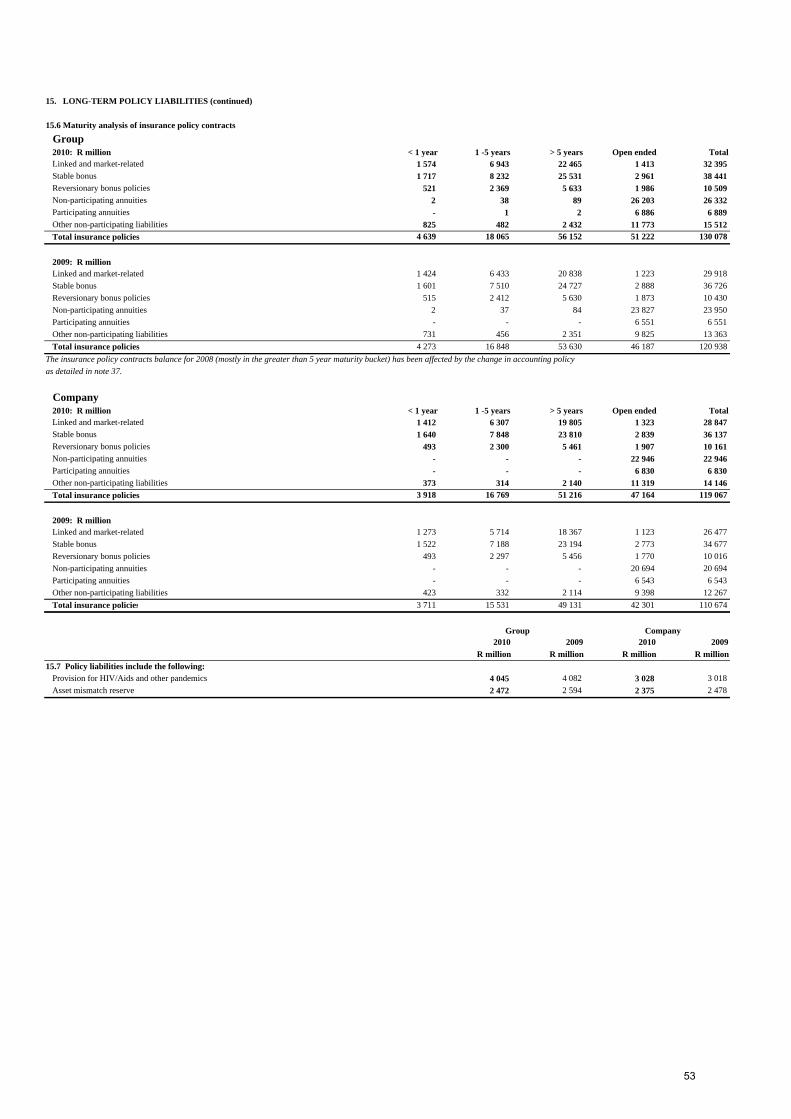
15. LONG-TERM POLICY LIABILITIES (continued)
Group2010: R million < 1 year 1 -5 years > 5 years Open ended TotalLinked and market-related 1 574 6 943 22 465 1 413 32 395 Stable bonus 1 717 8 232 25 531 2 961 38 441 Reversionary bonus policies 521 2 369 5 633 1 986 10 509 Non-participating annuities 2 38 89 26 203 26 332 Participating annuities - 1 2 6 886 6 889 Other non-participating liabilities 825 482 2 432 11 773 15 512 Total insurance policies 4 639 18 065 56 152 51 222 130 078
2009: R millionLinked and market-related 1 424 6 433 20 838 1 223 29 918 Stable bonus 1 601 7 510 24 727 2 888 36 726 Reversionary bonus policies 515 2 412 5 630 1 873 10 430 Non-participating annuities 2 37 84 23 827 23 950 Participating annuities - - - 6 551 6 551 Other non-participating liabilities 731 456 2 351 9 825 13 363 Total insurance policies 4 273 16 848 53 630 46 187 120 938
The insurance policy contracts balance for 2008 (mostly in the greater than 5 year maturity bucket) has been affected by the change in accounting policyas detailed in note 37.
Company2010: R million < 1 year 1 -5 years > 5 years Open ended TotalLinked and market-related 1 412 6 307 19 805 1 323 28 847 Stable bonus 1 640 7 848 23 810 2 839 36 137 Reversionary bonus policies 493 2 300 5 461 1 907 10 161 Non-participating annuities - - - 22 946 22 946 Participating annuities - - - 6 830 6 830 Other non-participating liabilities 373 314 2 140 11 319 14 146 Total insurance policies 3 918 16 769 51 216 47 164 119 067
2009: R millionLinked and market-related 1 273 5 714 18 367 1 123 26 477 Stable bonus 1 522 7 188 23 194 2 773 34 677 Reversionary bonus policies 493 2 297 5 456 1 770 10 016 Non-participating annuities - - - 20 694 20 694 Participating annuities - - - 6 543 6 543 Other non-participating liabilities 423 332 2 114 9 398 12 267
15.6 Maturity analysis of insurance policy contracts
Total insurance policies 3 711 15 531 49 131 42 301 110 674
Group Company2010 2009 2010 2009
R million R million R million R million15.7 Policy liabilities include the following:
Provision for HIV/Aids and other pandemics 4 045 4 082 3 028 3 018 Asset mismatch reserve 2 472 2 594 2 375 2 478
53
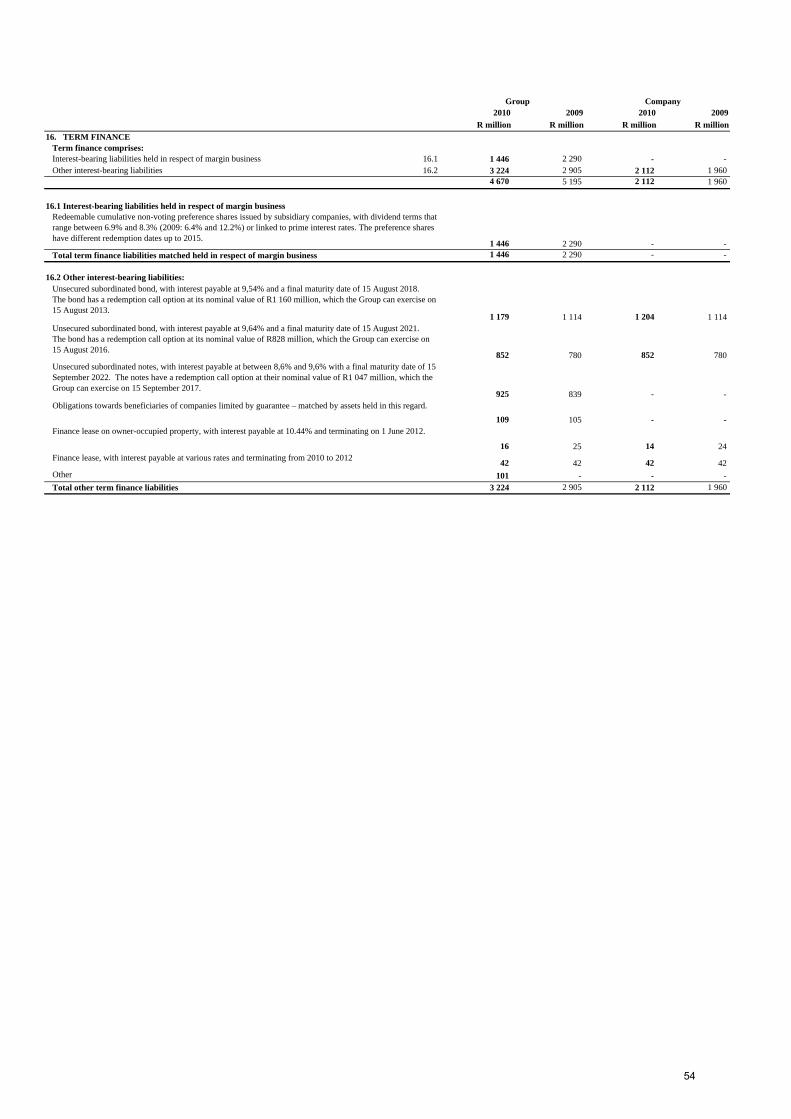
Group Company2010 2009 2010 2009
R million R million R million R million16. TERM FINANCE
Term finance comprises:Interest-bearing liabilities held in respect of margin business 16.1 1 446 2 290 - - Other interest-bearing liabilities 16.2 3 224 2 905 2 112 1 960
4 670 5 195 2 112 1 960
16.1 Interest-bearing liabilities held in respect of margin business
1 446 2 290 - - Total term finance liabilities matched held in respect of margin business 1 446 2 290 - -
16.2 Other interest-bearing liabilities:
1 179 1 114 1 204 1 114
852 780 852 780
925 839 - -
109 105 - -
16 25 14 24 Finance lease, with interest payable at various rates and terminating from 2010 to 2012 42 42 42 42
101 - - - Total other term finance liabilities 3 224 2 905 2 112 1 960
Redeemable cumulative non-voting preference shares issued by subsidiary companies, with dividend terms that range between 6.9% and 8.3% (2009: 6.4% and 12.2%) or linked to prime interest rates. The preference shares have different redemption dates up to 2015.
Other
Finance lease on owner-occupied property, with interest payable at 10.44% and terminating on 1 June 2012.
Unsecured subordinated bond, with interest payable at 9,64% and a final maturity date of 15 August 2021. The bond has a redemption call option at its nominal value of R828 million, which the Group can exercise on 15 August 2016.
Unsecured subordinated notes, with interest payable at between 8,6% and 9,6% with a final maturity date of 15 September 2022. The notes have a redemption call option at their nominal value of R1 047 million, which the Group can exercise on 15 September 2017.
Obligations towards beneficiaries of companies limited by guarantee – matched by assets held in this regard.
Unsecured subordinated bond, with interest payable at 9,54% and a final maturity date of 15 August 2018. The bond has a redemption call option at its nominal value of R1 160 million, which the Group can exercise on 15 August 2013.
54
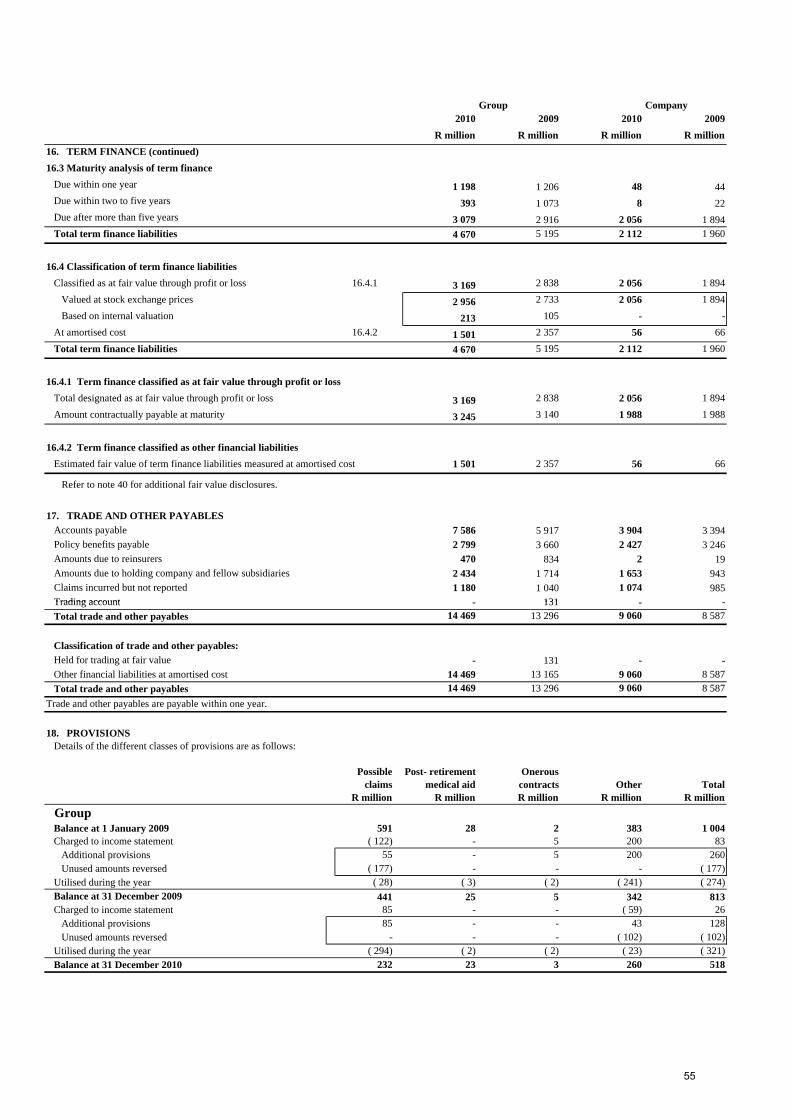
Group Company2010 2009 2010 2009
R million R million R million R million16. TERM FINANCE (continued)16.3 Maturity analysis of term finance
Due within one year 1 198 1 206 48 44 Due within two to five years 393 1 073 8 22 Due after more than five years 3 079 2 916 2 056 1 894 Total term finance liabilities 4 670 5 195 2 112 1 960
16.4 Classification of term finance liabilitiesClassified as at fair value through profit or loss 16.4.1 3 169 2 838 2 056 1 894
Valued at stock exchange prices 2 956 2 733 2 056 1 894 Based on internal valuation 213 105 - -
At amortised cost 16.4.2 1 501 2 357 56 66 Total term finance liabilities 4 670 5 195 2 112 1 960
16.4.1 Term finance classified as at fair value through profit or lossTotal designated as at fair value through profit or loss 3 169 2 838 2 056 1 894 Amount contractually payable at maturity 3 245 3 140 1 988 1 988
16.4.2 Term finance classified as other financial liabilitiesEstimated fair value of term finance liabilities measured at amortised cost 1 501 2 357 56 66
Refer to note 40 for additional fair value disclosures.
17. TRADE AND OTHER PAYABLESAccounts payable 7 586 5 917 3 904 3 394 Policy benefits payable 2 799 3 660 2 427 3 246 Amounts due to reinsurers 470 834 2 19 Amounts due to holding company and fellow subsidiaries 2 434 1 714 1 653 943 Claims incurred but not reported 1 180 1 040 1 074 985 Trading account 131Trading account - 131 - - Total trade and other payables 14 469 13 296 9 060 8 587
- 131 - - 14 469 13 165 9 060 8 587
Total trade and other payables 14 469 13 296 9 060 8 587
18. PROVISIONSDetails of the different classes of provisions are as follows:
Possible claims
Post- retirement medical aid
Onerous contracts Other Total
R million R million R million R million R millionGroupBalance at 1 January 2009 591 28 2 383 1 004 Charged to income statement ( 122) - 5 200 83
Additional provisions 55 - 5 200 260 Unused amounts reversed ( 177) - - - ( 177)
Utilised during the year ( 28) ( 3) ( 2) ( 241) ( 274) Balance at 31 December 2009 441 25 5 342 813 Charged to income statement 85 - - ( 59) 26
Additional provisions 85 - - 43 128 Unused amounts reversed - - - ( 102) ( 102)
Utilised during the year ( 294) ( 2) ( 2) ( 23) ( 321) Balance at 31 December 2010 232 23 3 260 518
Classification of trade and other payables:Held for trading at fair valueOther financial liabilities at amortised cost
Trade and other payables are payable within one year.
55
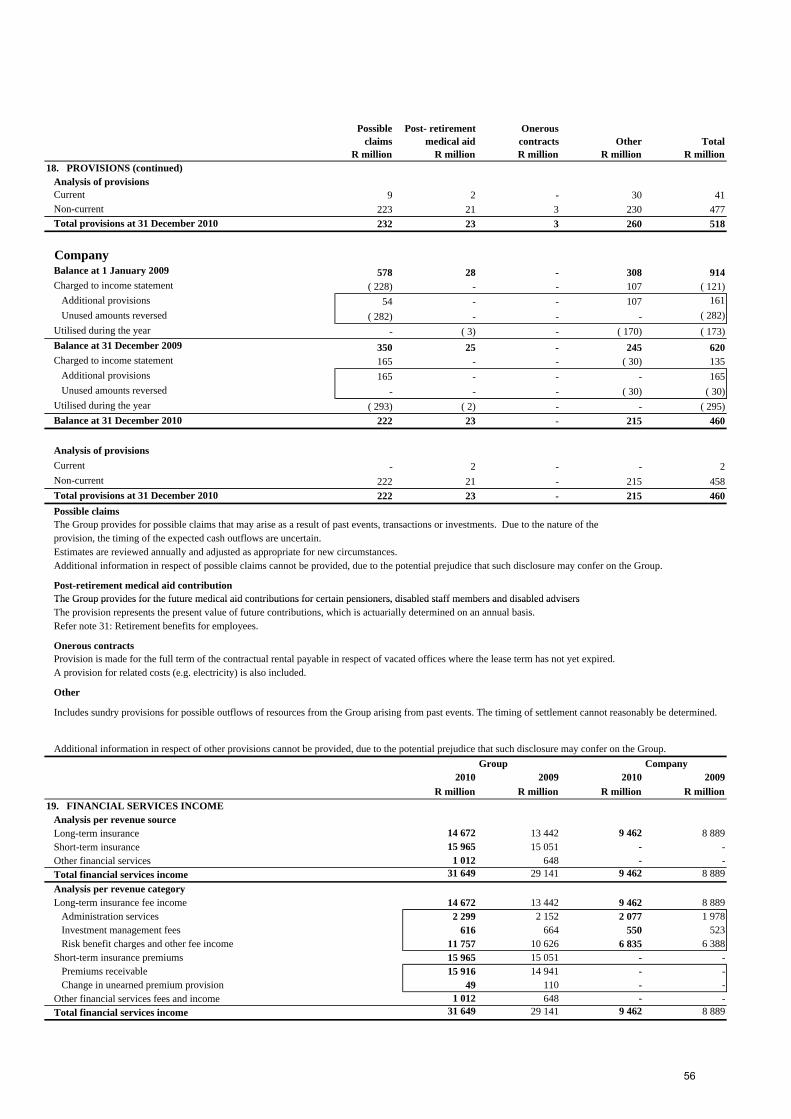
Possible claims
Post- retirement medical aid
Onerous contracts Other Total
R million R million R million R million R million18. PROVISIONS (continued)
Analysis of provisionsCurrent 9 2 - 30 41 Non-current 223 21 3 230 477 Total provisions at 31 December 2010 232 23 3 260 518
CompanyBalance at 1 January 2009 578 28 - 308 914 Charged to income statement ( 228) - - 107 ( 121)
Additional provisions 54 - - 107 161 Unused amounts reversed ( 282) - - - ( 282)
Utilised during the year - ( 3) - ( 170) ( 173) Balance at 31 December 2009 350 25 - 245 620 Charged to income statement 165 - - ( 30) 135
Additional provisions 165 - - - 165 Unused amounts reversed - - - ( 30) ( 30)
Utilised during the year ( 293) ( 2) - - ( 295) Balance at 31 December 2010 222 23 - 215 460
Analysis of provisionsCurrent - 2 - - 2 Non-current 222 21 - 215 458 Total provisions at 31 December 2010 222 23 - 215 460 Possible claimsThe Group provides for possible claims that may arise as a result of past events, transactions or investments. Due to the nature of the provision, the timing of the expected cash outflows are uncertain.Estimates are reviewed annually and adjusted as appropriate for new circumstances.
Post-retirement medical aid contributionThe Group provides for the future medical aid contributions for certain pensioners, disabled staff members and disabled advisers
Additional information in respect of possible claims cannot be provided, due to the potential prejudice that such disclosure may confer on the Group.
The Group provides for the future medical aid contributions for certain pensioners, disabled staff members and disabled advisersThe provision represents the present value of future contributions, which is actuarially determined on an annual basis. Refer note 31: Retirement benefits for employees.
Onerous contractsProvision is made for the full term of the contractual rental payable in respect of vacated offices where the lease term has not yet expired. A provision for related costs (e.g. electricity) is also included.
Other
Group Company2010 2009 2010 2009
R million R million R million R million19. FINANCIAL SERVICES INCOME
Analysis per revenue sourceLong-term insurance 14 672 13 442 9 462 8 889 Short-term insurance 15 965 15 051 - - Other financial services 1 012 648 - - Total financial services income 31 649 29 141 9 462 8 889 Analysis per revenue categoryLong-term insurance fee income 14 672 13 442 9 462 8 889
Administration services 2 299 2 152 2 077 1 978 Investment management fees 616 664 550 523 Risk benefit charges and other fee income 11 757 10 626 6 835 6 388
Short-term insurance premiums 15 965 15 051 - - Premiums receivable 15 916 14 941 - - Change in unearned premium provision 49 110 - -
Other financial services fees and income 1 012 648 - - Total financial services income 31 649 29 141 9 462 8 889
Additional information in respect of other provisions cannot be provided, due to the potential prejudice that such disclosure may confer on the Group.
Includes sundry provisions for possible outflows of resources from the Group arising from past events. The timing of settlement cannot reasonably be determined.
56
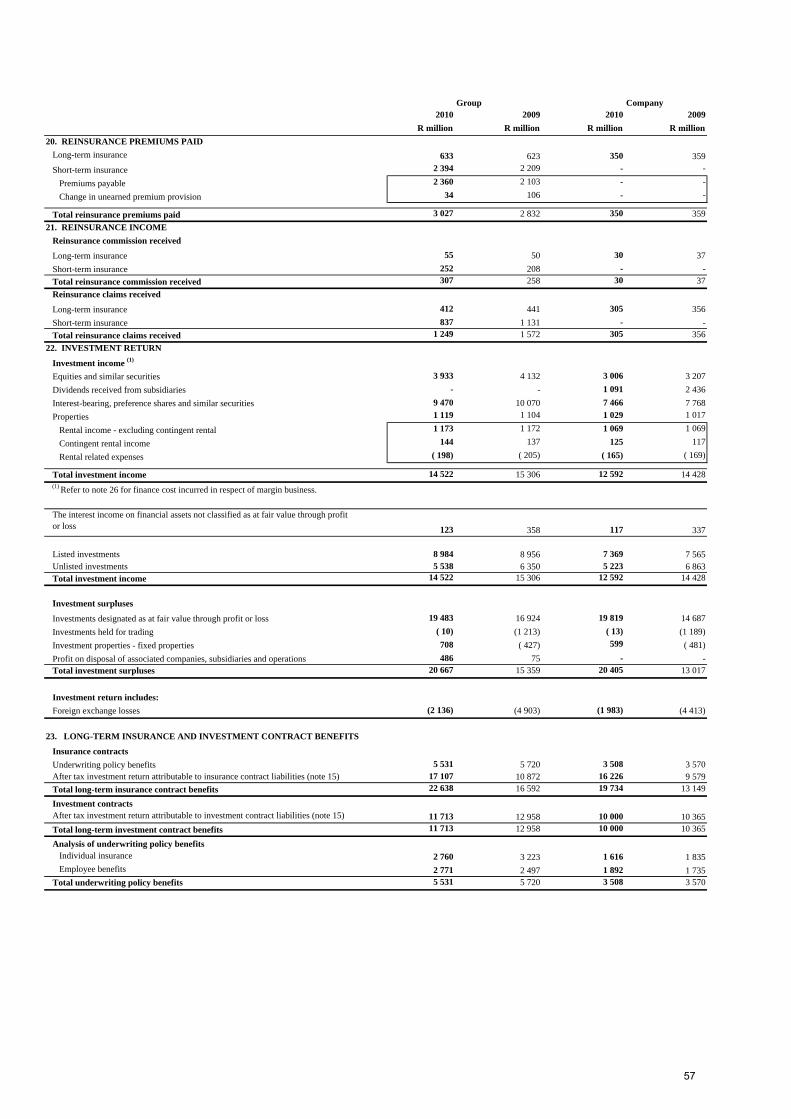
Group Company2010 2009 2010 2009
R million R million R million R million20. REINSURANCE PREMIUMS PAID
Long-term insurance 633 623 350 359 Short-term insurance 2 394 2 209 - -
Premiums payable 2 360 2 103 - -
Change in unearned premium provision 34 106 - -
Total reinsurance premiums paid 3 027 2 832 350 359 21. REINSURANCE INCOME
Reinsurance commission received
Long-term insurance 55 50 30 37 Short-term insurance 252 208 - - Total reinsurance commission received 307 258 30 37 Reinsurance claims received
Long-term insurance 412 441 305 356 Short-term insurance 837 1 131 - - Total reinsurance claims received 1 249 1 572 305 356
22. INVESTMENT RETURN
Investment income (1)
Equities and similar securities 3 933 4 132 3 006 3 207 Dividends received from subsidiaries - - 1 091 2 436 Interest-bearing, preference shares and similar securities 9 470 10 070 7 466 7 768 Properties 1 119 1 104 1 029 1 017
Rental income - excluding contingent rental 1 173 1 172 1 069 1 069
Contingent rental income 144 137 125 117
Rental related expenses ( 198) ( 205) ( 165) ( 169)
Total investment income 14 522 15 306 12 592 14 428 (1) Refer to note 26 for finance cost incurred in respect of margin business.
The interest income on financial assets not classified as at fair value through profit or loss 123 358 117 337
Listed investments 8 984 8 956 7 369 7 565 Unlisted investments 5 538 6 350 5 223 6 863 Total investment income 14 522 15 306 12 592 14 428
I t t lInvestment surpluses
Investments designated as at fair value through profit or loss 19 483 16 924 19 819 14 687 Investments held for trading ( 10) (1 213) ( 13) (1 189) Investment properties - fixed properties 708 ( 427) 599 ( 481) Profit on disposal of associated companies, subsidiaries and operations 486 75 - - Total investment surpluses 20 667 15 359 20 405 13 017
Investment return includes:Foreign exchange losses (2 136) (4 903) (1 983) (4 413)
Insurance contractsUnderwriting policy benefits 5 531 5 720 3 508 3 570 After tax investment return attributable to insurance contract liabilities (note 15) 17 107 10 872 16 226 9 579 Total long-term insurance contract benefits 22 638 16 592 19 734 13 149
Investment contractsAfter tax investment return attributable to investment contract liabilities (note 15) 11 713 12 958 10 000 10 365 Total long-term investment contract benefits 11 713 12 958 10 000 10 365
Analysis of underwriting policy benefitsIndividual insurance 2 760 3 223 1 616 1 835 Employee benefits 2 771 2 497 1 892 1 735
Total underwriting policy benefits 5 531 5 720 3 508 3 570
23. LONG-TERM INSURANCE AND INVESTMENT CONTRACT BENEFITS
57
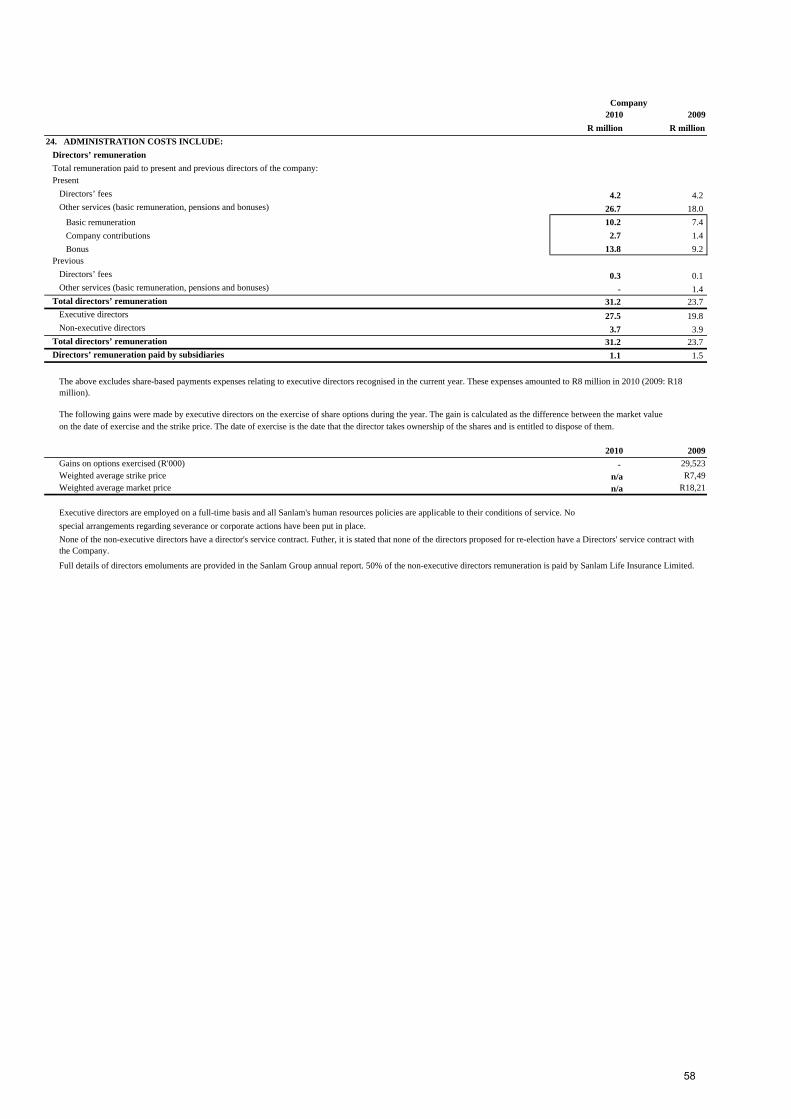
Company2010 2009
R million R million24. ADMINISTRATION COSTS INCLUDE:
Directors’ remunerationTotal remuneration paid to present and previous directors of the company:Present
Directors’ fees 4.2 4.2 Other services (basic remuneration, pensions and bonuses) 26.7 18.0
Basic remuneration 10.2 7.4Company contributions 2.7 1.4Bonus 13.8 9.2
PreviousDirectors’ fees 0.3 0.1Other services (basic remuneration, pensions and bonuses) - 1.4
Total directors’ remuneration 31.2 23.7Executive directors 27.5 19.8Non-executive directors 3.7 3.9
Total directors’ remuneration 31.2 23.7 Directors’ remuneration paid by subsidiaries 1.1 1.5
2010 2009Gains on options exercised (R'000) - 29,523Weighted average strike price n/a R7,49Weighted average market price n/a R18,21
Full details of directors emoluments are provided in the Sanlam Group annual report. 50% of the non-executive directors remuneration is paid by Sanlam Life Insurance Limited.
Executive directors are employed on a full-time basis and all Sanlam's human resources policies are applicable to their conditions of service. Nospecial arrangements regarding severance or corporate actions have been put in place.None of the non-executive directors have a director's service contract. Futher, it is stated that none of the directors proposed for re-election have a Directors' service contract with the Company.
The following gains were made by executive directors on the exercise of share options during the year. The gain is calculated as the difference between the market value on the date of exercise and the strike price. The date of exercise is the date that the director takes ownership of the shares and is entitled to dispose of them.
The above excludes share-based payments expenses relating to executive directors recognised in the current year. These expenses amounted to R8 million in 2010 (2009: R18 million).
58

24. ADMINISTRATION COSTS (continued)
Original loan Original no shares purchased Purchase price Total loan balance at 31
Dec 2009 Interest accrued Repayments Balance at 31 Dec 2010
Name (R'000) 000 (Rands) (R'000) (R'000) (R'000) (R'000)JP MollerGranted08/06/2006 2,684 188 14,21 2,739 92 2,831 0J van ZylGranted14/06/2006 14,688 1,021 14,31 10,954 360 11,314 0
17,372 1,209 13,693 452 14,145 0
2010 2009 2010 2009R million R million R million R million
Auditors’ remunerationAudit fees: statutory audit 61 59 28 26 Other services provided by 6 2 3 -
Subsidiaries' own auditorsDue diligence services 2 2 - - Other services 4 - 3 -
Total auditors’ remuneration 67 61 31 26 Depreciation 149 161 74 75 Operating leases 383 347 41 38
Properties 200 181 36 37 Equipment 169 151 5 1 Other 14 15 - -
Consultancy fees 359 336 155 124 Technical, administrative and secretarial fees 528 514 108 50 Restructuring costs - 21 - - Employee benefits 3 977 3 159 1 824 1 393
Salaries and other short-term benefits 3 507 2 703 1 563 1 144 Pension costs - defined contribution plans 204 209 104 96 Pension costs - defined benefit plans 9 12 8 8 Other post-employment benefits - - - - Share-based payments 169 156 96 84 Other long-term incentive schemes 88 79 53 61
Office staff (number of persons) 10 445 8 497 3 917 3 758
Other long-term incentive schemes for 2009 were inappropriately reflected as R171m (Group) and R145m (Company) and have been restated.
Loans were granted to executive directors for the purpose of acquiring Sanlam shares. The loans are secured, bear interest at market-related rates, and will be repaid over four years. An annual bonus is payable to the directors, based on the number of Sanlam shares held by the director. Details of the loans granted are as follows:
CompanyGroup
59
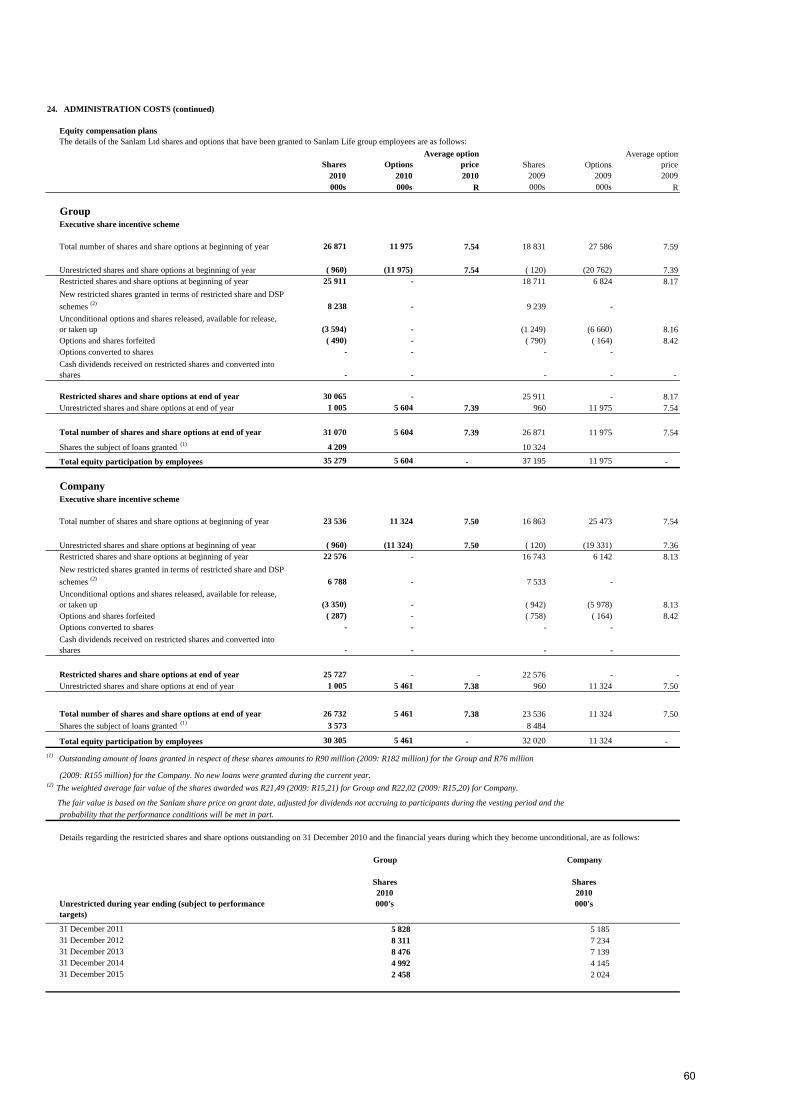
24. ADMINISTRATION COSTS (continued)
Equity compensation plansThe details of the Sanlam Ltd shares and options that have been granted to Sanlam Life group employees are as follows:
Shares OptionsAverage option
price Shares OptionsAverage option
price 2010 2010 2010 2009 2009 2009000s 000s R 000s 000s R
GroupExecutive share incentive scheme
Total number of shares and share options at beginning of year 26 871 11 975 7.54 18 831 27 586 7.59
Unrestricted shares and share options at beginning of year ( 960) (11 975) 7.54 ( 120) (20 762) 7.39Restricted shares and share options at beginning of year 25 911 - 18 711 6 824 8.17New restricted shares granted in terms of restricted share and DSP schemes (2) 8 238 - 9 239 - Unconditional options and shares released, available for release, or taken up (3 594) - (1 249) (6 660) 8.16Options and shares forfeited ( 490) - ( 790) ( 164) 8.42Options converted to shares - - - - Cash dividends received on restricted shares and converted into shares - - - - -
Restricted shares and share options at end of year 30 065 - 25 911 - 8.17Unrestricted shares and share options at end of year 1 005 5 604 7.39 960 11 975 7.54
Total number of shares and share options at end of year 31 070 5 604 7.39 26 871 11 975 7.54
Shares the subject of loans granted (1) 4 209 10 324
Total equity participation by employees 35 279 5 604 - 37 195 11 975 -
CompanyExecutive share incentive scheme
Total number of shares and share options at beginning of year 23 536 11 324 7.50 16 863 25 473 7.54
Unrestricted shares and share options at beginning of year ( 960) (11 324) 7.50 ( 120) (19 331) 7.36Restricted shares and share options at beginning of year 22 576 - 16 743 6 142 8.13New restricted shares granted in terms of restricted share and DSP schemes (2) 6 788 - 7 533 - Unconditional options and shares released, available for release, or taken up (3 350) - ( 942) (5 978) 8.13Options and shares forfeited ( 287) - ( 758) ( 164) 8.42Options converted to shares - - - - Cash dividends received on restricted shares and converted into shares - - - -
Restricted shares and share options at end of year 25 727 - - 22 576 - - Unrestricted shares and share options at end of year 1 005 5 461 7.38 960 11 324 7.50
Total number of shares and share options at end of year 26 732 5 461 7.38 23 536 11 324 7.50Shares the subject of loans granted (1) 3 573 8 484
Total equity participation by employees 30 305 5 461 - 32 020 11 324 - (1) Outstanding amount of loans granted in respect of these shares amounts to R90 million (2009: R182 million) for the Group and R76 million
(2009: R155 million) for the Company. No new loans were granted during the current year.(2) The weighted average fair value of the shares awarded was R21,49 (2009: R15,21) for Group and R22,02 (2009: R15,20) for Company.
probability that the performance conditions will be met in part.
Shares Shares2010 2010
Unrestricted during year ending (subject to performance targets)
000's 000's
31 December 2011 5 828 5 185 31 December 2012 8 311 7 234 31 December 2013 8 476 7 139 31 December 2014 4 992 4 145 31 December 2015 2 458 2 024
Details regarding the restricted shares and share options outstanding on 31 December 2010 and the financial years during which they become unconditional, are as follows:
CompanyGroup
The fair value is based on the Sanlam share price on grant date, adjusted for dividends not accruing to participants during the vesting period and the
60
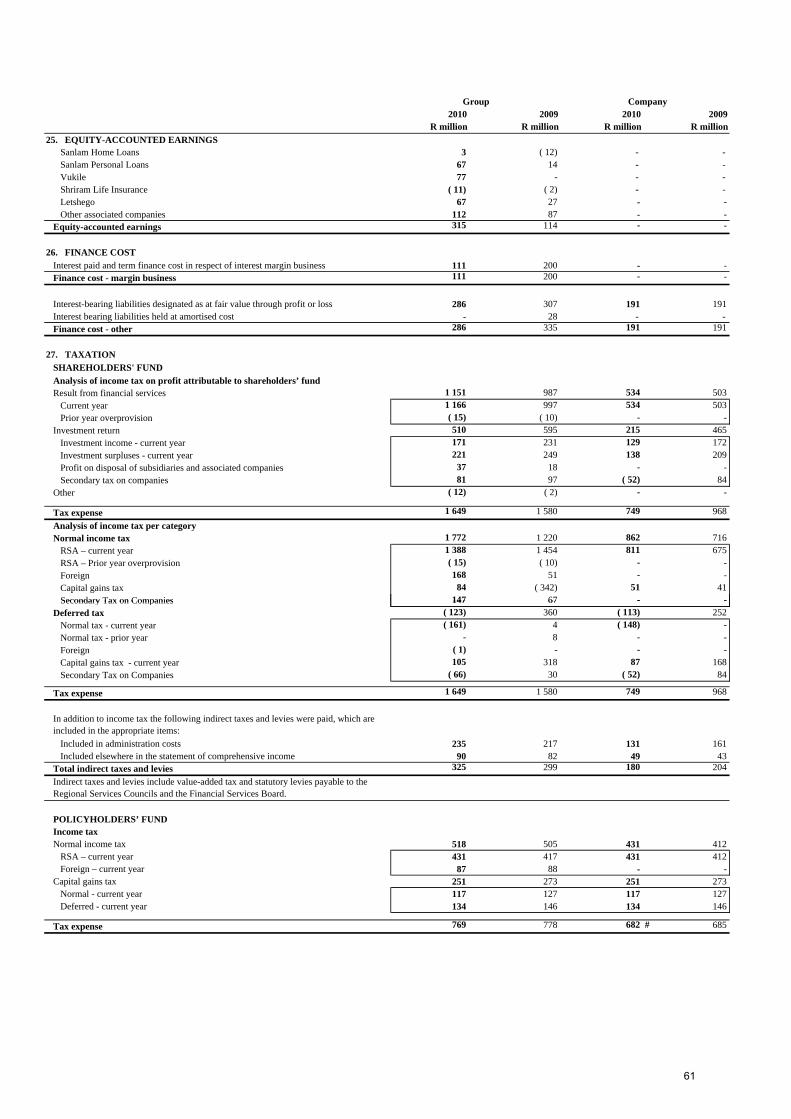
Group Company2010 2009 2010 2009
R million R million R million R million25. EQUITY-ACCOUNTED EARNINGS
Sanlam Home Loans 3 ( 12) - - Sanlam Personal Loans 67 14 - - Vukile 77 - - - Shriram Life Insurance ( 11) ( 2) - - Letshego 67 27 - - Other associated companies 112 87 - -
Equity-accounted earnings 315 114 - -
26. FINANCE COSTInterest paid and term finance cost in respect of interest margin business 111 200 - - Finance cost - margin business 111 200 - -
Interest-bearing liabilities designated as at fair value through profit or loss 286 307 191 191 Interest bearing liabilities held at amortised cost - 28 - - Finance cost - other 286 335 191 191
27. TAXATIONSHAREHOLDERS' FUNDAnalysis of income tax on profit attributable to shareholders’ fundResult from financial services 1 151 987 534 503
Current year 1 166 997 534 503 Prior year overprovision ( 15) ( 10) - -
Investment return 510 595 215 465 Investment income - current year 171 231 129 172 Investment surpluses - current year 221 249 138 209 Profit on disposal of subsidiaries and associated companies 37 18 - - Secondary tax on companies 81 97 ( 52) 84
Other ( 12) ( 2) - -
Tax expense 1 649 1 580 749 968 Analysis of income tax per categoryNormal income tax 1 772 1 220 862 716
RSA – current year 1 388 1 454 811 675 RSA – Prior year overprovision ( 15) ( 10) - - Foreign 168 51 - - Capital gains tax 84 ( 342) 51 41 Secondary Tax on Companies 147 67 - -Secondary Tax on Companies 147 67 - -
Deferred tax ( 123) 360 ( 113) 252 Normal tax - current year ( 161) 4 ( 148) - Normal tax - prior year - 8 - - Foreign ( 1) - - - Capital gains tax - current year 105 318 87 168 Secondary Tax on Companies ( 66) 30 ( 52) 84
Tax expense 1 649 1 580 749 968
In addition to income tax the following indirect taxes and levies were paid, which are included in the appropriate items:
Included in administration costs 235 217 131 161 Included elsewhere in the statement of comprehensive income 90 82 49 43
Total indirect taxes and levies 325 299 180 204 Indirect taxes and levies include value-added tax and statutory levies payable to the Regional Services Councils and the Financial Services Board.
POLICYHOLDERS’ FUNDIncome taxNormal income tax 518 505 431 412
RSA – current year 431 417 431 412 Foreign – current year 87 88 - -
Capital gains tax 251 273 251 273 Normal - current year 117 127 117 127 Deferred - current year 134 146 134 146
Tax expense 769 778 682 # 685
61
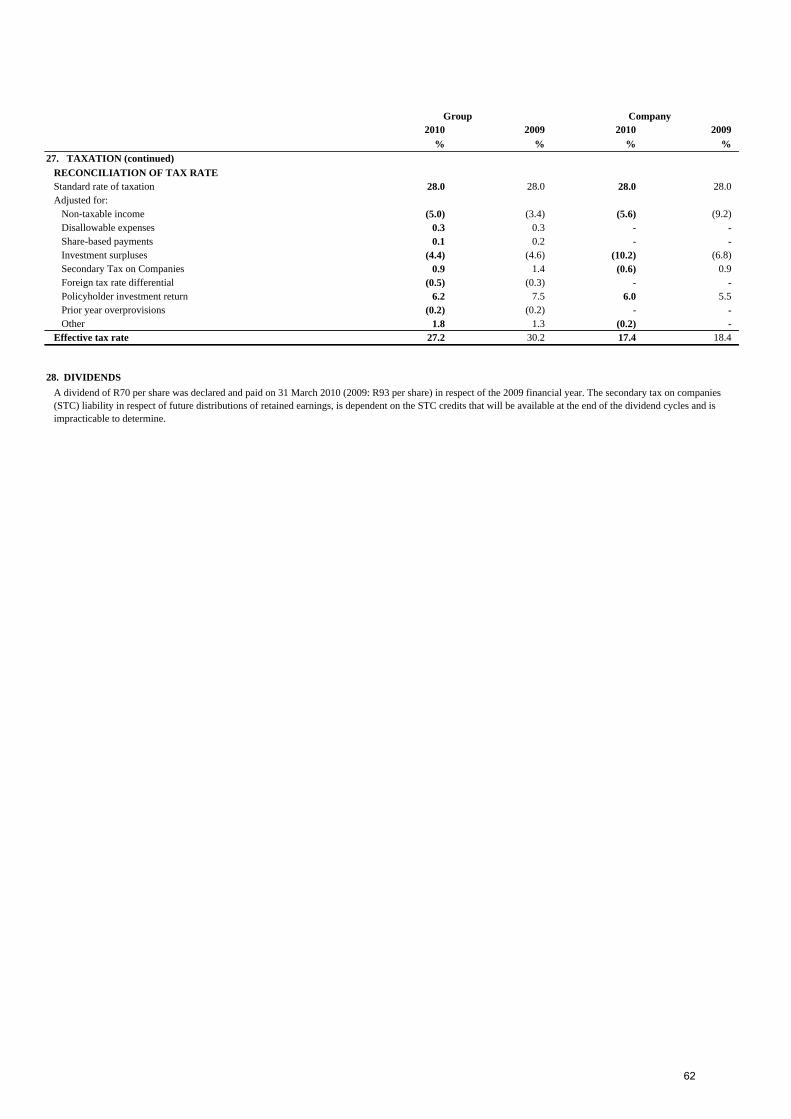
Group Company2010 2009 2010 2009
% % % %27. TAXATION (continued)
RECONCILIATION OF TAX RATEStandard rate of taxation 28.0 28.0 28.0 28.0Adjusted for:
Non-taxable income (5.0) (3.4) (5.6) (9.2)Disallowable expenses 0.3 0.3 - - Share-based payments 0.1 0.2 - - Investment surpluses (4.4) (4.6) (10.2) (6.8)Secondary Tax on Companies 0.9 1.4 (0.6) 0.9Foreign tax rate differential (0.5) (0.3) - - Policyholder investment return 6.2 7.5 6.0 5.5Prior year overprovisions (0.2) (0.2) - - Other 1.8 1.3 (0.2) -
Effective tax rate 27.2 30.2 17.4 18.4
28. DIVIDENDSA dividend of R70 per share was declared and paid on 31 March 2010 (2009: R93 per share) in respect of the 2009 financial year. The secondary tax on companies (STC) liability in respect of future distributions of retained earnings, is dependent on the STC credits that will be available at the end of the dividend cycles and is impracticable to determine.
62

2010 2009 2010 2009R million R million R million R million
29. COLLATERAL
The following assets have been pledged as collateral for the Group's derivatives, liabilities or contingent liabilities:
InvestmentsInvestment property - 159 - - Public sector stocks and loans 587 480 543 398
15 494 12 875 18 084 20 129 Collateral of between 100% and 110% of the value of the loaned securities is held at 31 December 2010.
The following collateral has been received in respect of securities lending activities conducted by the Group:
Fair value of collateral accepted as security for these activities
CompanyGroup
29.1 Collateral provided
29.2 Collateral received
63
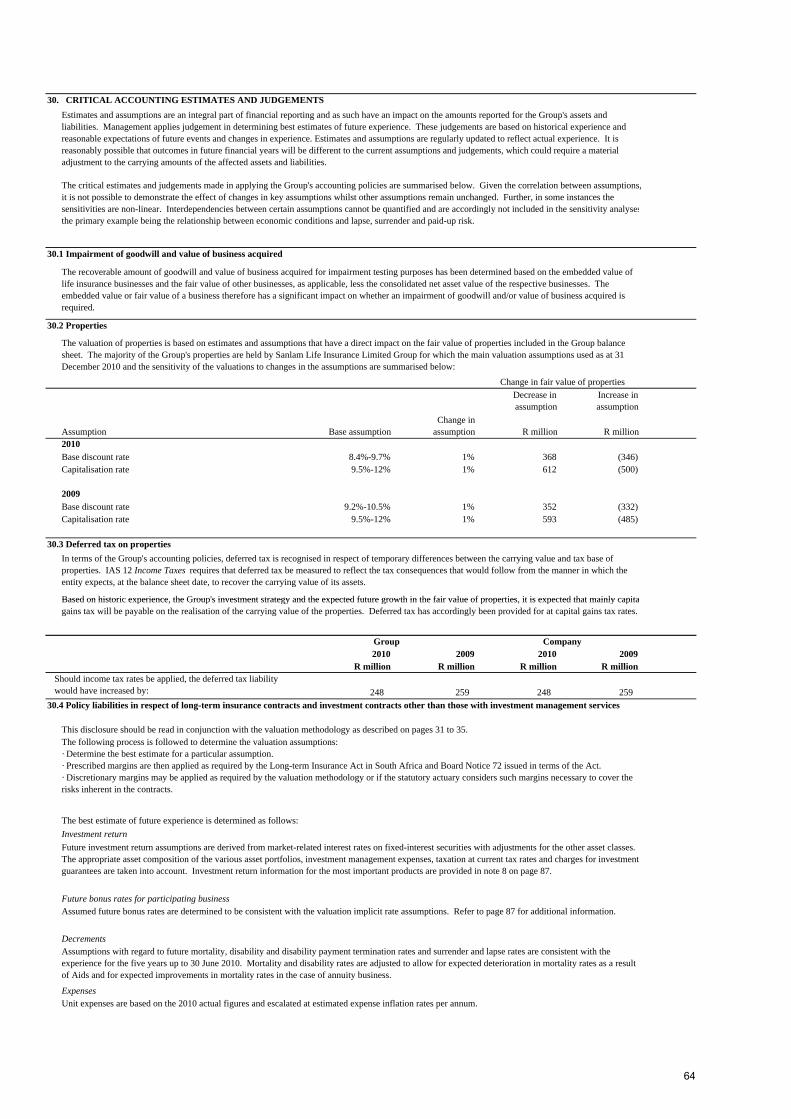
30. CRITICAL ACCOUNTING ESTIMATES AND JUDGEMENTS
30.1 Impairment of goodwill and value of business acquired
30.2 Properties
Decrease in assumption
Increase in assumption
Assumption Base assumptionChange in
assumption R million R million2010Base discount rate 8.4%-9.7% 1% 368 (346)Capitalisation rate 9.5%-12% 1% 612 (500)
2009Base discount rate 9.2%-10.5% 1% 352 (332)Capitalisation rate 9.5%-12% 1% 593 (485)
30.3 Deferred tax on properties
Estimates and assumptions are an integral part of financial reporting and as such have an impact on the amounts reported for the Group's assets and liabilities. Management applies judgement in determining best estimates of future experience. These judgements are based on historical experience and reasonable expectations of future events and changes in experience. Estimates and assumptions are regularly updated to reflect actual experience. It is reasonably possible that outcomes in future financial years will be different to the current assumptions and judgements, which could require a material adjustment to the carrying amounts of the affected assets and liabilities.
The critical estimates and judgements made in applying the Group's accounting policies are summarised below. Given the correlation between assumptions, it is not possible to demonstrate the effect of changes in key assumptions whilst other assumptions remain unchanged. Further, in some instances the sensitivities are non-linear. Interdependencies between certain assumptions cannot be quantified and are accordingly not included in the sensitivity analysesthe primary example being the relationship between economic conditions and lapse, surrender and paid-up risk.
In terms of the Group's accounting policies, deferred tax is recognised in respect of temporary differences between the carrying value and tax base of properties. IAS 12 Income Taxes requires that deferred tax be measured to reflect the tax consequences that would follow from the manner in which the entity expects, at the balance sheet date, to recover the carrying value of its assets.
Based on historic experience the Group's investment strategy and the expected future growth in the fair value of properties it is expected that mainly capita
The recoverable amount of goodwill and value of business acquired for impairment testing purposes has been determined based on the embedded value of life insurance businesses and the fair value of other businesses, as applicable, less the consolidated net asset value of the respective businesses. The embedded value or fair value of a business therefore has a significant impact on whether an impairment of goodwill and/or value of business acquired is required.
The valuation of properties is based on estimates and assumptions that have a direct impact on the fair value of properties included in the Group balance sheet. The majority of the Group's properties are held by Sanlam Life Insurance Limited Group for which the main valuation assumptions used as at 31 December 2010 and the sensitivity of the valuations to changes in the assumptions are summarised below:
Change in fair value of properties
Group Company2010 2009 2010 2009
R million R million R million R million
248 259 248 259
Unit expenses are based on the 2010 actual figures and escalated at estimated expense inflation rates per annum.
Assumptions with regard to future mortality, disability and disability payment termination rates and surrender and lapse rates are consistent with the experience for the five years up to 30 June 2010. Mortality and disability rates are adjusted to allow for expected deterioration in mortality rates as a result of Aids and for expected improvements in mortality rates in the case of annuity business.
The best estimate of future experience is determined as follows:
Future investment return assumptions are derived from market-related interest rates on fixed-interest securities with adjustments for the other asset classes. The appropriate asset composition of the various asset portfolios, investment management expenses, taxation at current tax rates and charges for investment guarantees are taken into account. Investment return information for the most important products are provided in note 8 on page 87.
Future bonus rates for participating businessAssumed future bonus rates are determined to be consistent with the valuation implicit rate assumptions. Refer to page 87 for additional information.
Investment return
Should income tax rates be applied, the deferred tax liability would have increased by:
Based on historic experience, the Group s investment strategy and the expected future growth in the fair value of properties, it is expected that mainly capitagains tax will be payable on the realisation of the carrying value of the properties. Deferred tax has accordingly been provided for at capital gains tax rates.
The following process is followed to determine the valuation assumptions:· Determine the best estimate for a particular assumption.· Prescribed margins are then applied as required by the Long-term Insurance Act in South Africa and Board Notice 72 issued in terms of the Act. · Discretionary margins may be applied as required by the valuation methodology or if the statutory actuary considers such margins necessary to cover the risks inherent in the contracts.
30.4 Policy liabilities in respect of long-term insurance contracts and investment contracts other than those with investment management services
This disclosure should be read in conjunction with the valuation methodology as described on pages 31 to 35.
Decrements
Expenses
64

30. CRITICAL ACCOUNTING ESTIMATES AND JUDGEMENTS (continued)30.5 Policy liabilities for investment contracts with investment management services
The valuation of unlisted investments is based on generally accepted and applied investment techniques, but is subject to judgement in respect of the adjustments made by the Group to allow for perceived risks. The appropriateness of the valuations is continuously tested through the Group's approval framework, in terms of which the valuation of unlisted investments is reviewed and recommended for approval by the Audit, Actuarial and Risk Committee and Board by the Sanlam Non-listed Asset Controlling Body at each reporting period.
30.6 The ultimate liability arising from claims under short-term insurance contracts
30.7 Valuation of unlisted investments
The valuation of these contracts is linked to the fair value of the supporting assets and deviations from future investment return assumptions will therefore not have a material impact. The recoverability of the DAC asset is not significantly impacted by changes in lapse experience; if future lapse experience was to differ by 10% (2009: 10%) from management's estimates, no impairment of the DAC asset would be required.
The risk environment can change suddenly and unexpectedly owing to a wide range of events or influences. The Group is constantly refining its short-term insurance risk monitoring and management tools to enable the Group to assess risks appropriately, despite the greatly increased pace of change. The growing complexity and dynamism of the environment in which the Group operates means that there are, however, natural limits. There will never be absolute certainty in respect of identifying risks at an early stage, measuring them sufficiently or correctly estimating their real hazard potential.
The estimation of the ultimate liability arising from claims under short-term insurance contracts is an important accounting estimate. There are several sources of uncertainty that need to be considered in the estimation of the liability that the Group will ultimately incur.
Refer to the Capital and Risk Management Report on page 123 for further information on the estimation of the claims liability.
65
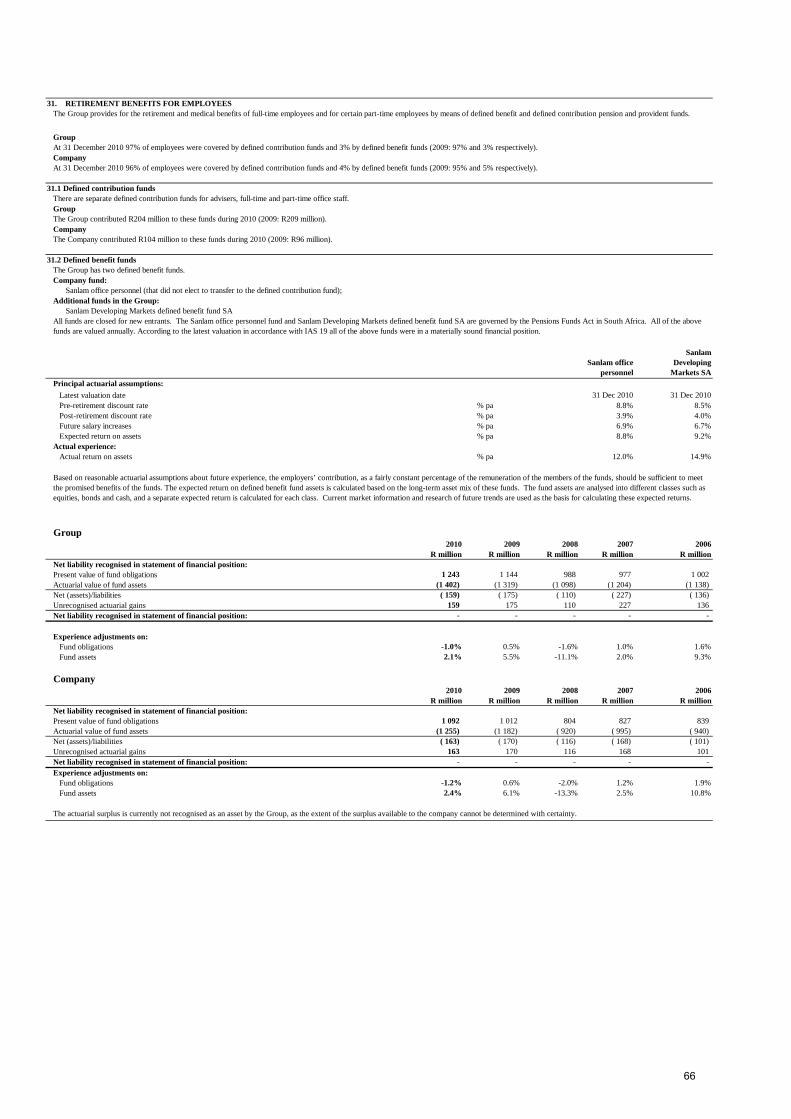
Group
Company
31.1 Defined contribution funds
GroupThe Group contributed R204 million to these funds during 2010 (2009: R209 million).CompanyThe Company contributed R104 million to these funds during 2010 (2009: R96 million).
31.2 Defined benefit funds
Company fund:
Additional funds in the Group:
Sanlam office personnel
Sanlam Developing
Markets SAPrincipal actuarial assumptions:
Latest valuation date 31 Dec 2010 31 Dec 2010Pre-retirement discount rate % pa 8.8% 8.5%Post-retirement discount rate % pa 3.9% 4.0%Future salary increases % pa 6.9% 6.7%Expected return on assets % pa 8.8% 9.2%
Actual experience:Actual return on assets % pa 12.0% 14.9%
Group2010 2009 2008 2007 2006
R million R million R million R million R million
Present value of fund obligations 1 243 1 144 988 977 1 002 Actuarial value of fund assets (1 402) (1 319) (1 098) (1 204) (1 138) Net (assets)/liabilities ( 159) ( 175) ( 110) ( 227) ( 136)
31. RETIREMENT BENEFITS FOR EMPLOYEES
At 31 December 2010 96% of employees were covered by defined contribution funds and 4% by defined benefit funds (2009: 95% and 5% respectively).
Sanlam office personnel (that did not elect to transfer to the defined contribution fund);
Net liability recognised in statement of financial position:
The Group has two defined benefit funds.
There are separate defined contribution funds for advisers, full-time and part-time office staff.
At 31 December 2010 97% of employees were covered by defined contribution funds and 3% by defined benefit funds (2009: 97% and 3% respectively).
The Group provides for the retirement and medical benefits of full-time employees and for certain part-time employees by means of defined benefit and defined contribution pension and provident funds.
Sanlam Developing Markets defined benefit fund SAAll funds are closed for new entrants. The Sanlam office personnel fund and Sanlam Developing Markets defined benefit fund SA are governed by the Pensions Funds Act in South Africa. All of the above funds are valued annually. According to the latest valuation in accordance with IAS 19 all of the above funds were in a materially sound financial position.
Based on reasonable actuarial assumptions about future experience, the employers’ contribution, as a fairly constant percentage of the remuneration of the members of the funds, should be sufficient to meet the promised benefits of the funds. The expected return on defined benefit fund assets is calculated based on the long-term asset mix of these funds. The fund assets are analysed into different classes such as equities, bonds and cash, and a separate expected return is calculated for each class. Current market information and research of future trends are used as the basis for calculating these expected returns.
( ) ( ) ( ) ( ) ( ) ( )Unrecognised actuarial gains 159 175 110 227 136 Net liability recognised in statement of financial position: - - - - -
Experience adjustments on:Fund obligations -1.0% 0.5% -1.6% 1.0% 1.6%Fund assets 2.1% 5.5% -11.1% 2.0% 9.3%
Company2010 2009 2008 2007 2006
R million R million R million R million R millionNet liability recognised in statement of financial position:Present value of fund obligations 1 092 1 012 804 827 839 Actuarial value of fund assets (1 255) (1 182) ( 920) ( 995) ( 940) Net (assets)/liabilities ( 163) ( 170) ( 116) ( 168) ( 101) Unrecognised actuarial gains 163 170 116 168 101
- - - - - Experience adjustments on:
Fund obligations -1.2% 0.6% -2.0% 1.2% 1.9%Fund assets 2.4% 6.1% -13.3% 2.5% 10.8%
Net liability recognised in statement of financial position:
The actuarial surplus is currently not recognised as an asset by the Group, as the extent of the surplus available to the company cannot be determined with certainty.
66
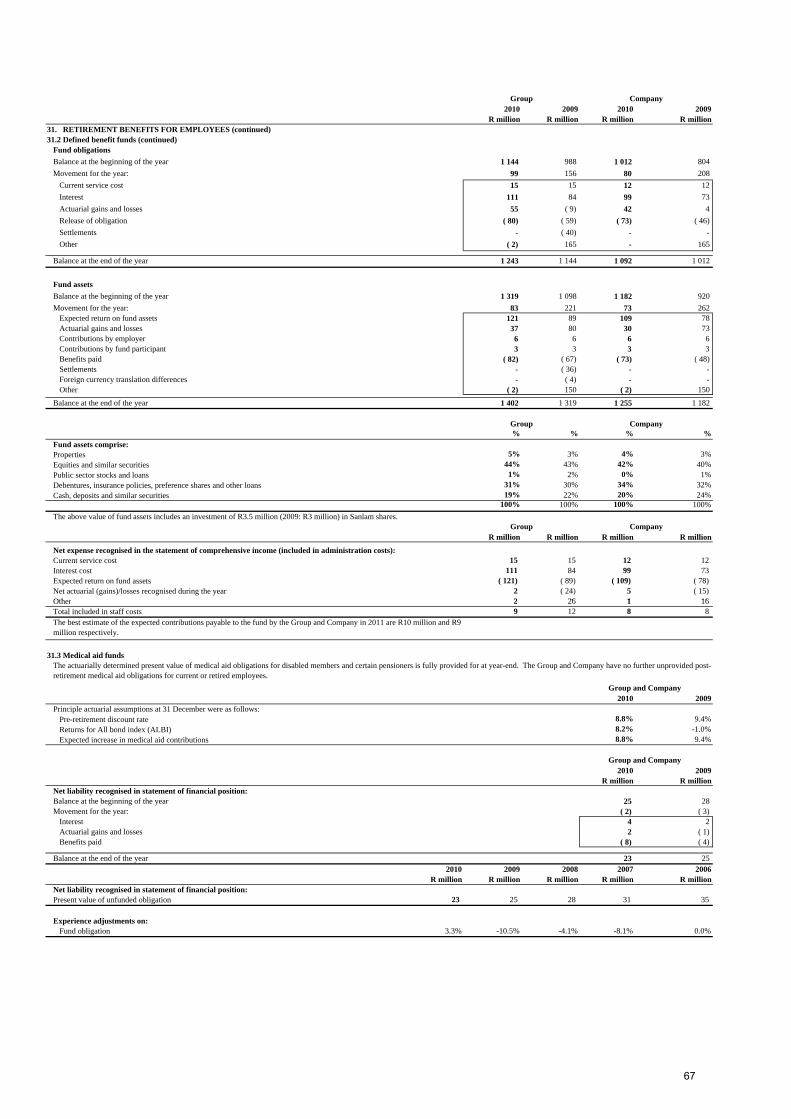
Group Company2010 2009 2010 2009
R million R million R million R million
Balance at the beginning of the year 1 144 988 1 012 804 Movement for the year: 99 156 80 208
Current service cost 15 15 12 12 Interest 111 84 99 73 Actuarial gains and losses 55 ( 9) 42 4 Release of obligation ( 80) ( 59) ( 73) ( 46)Settlements - ( 40) - - Other ( 2) 165 - 165
Balance at the end of the year 1 243 1 144 1 092 1 012
Balance at the beginning of the year 1 319 1 098 1 182 920 Movement for the year: 83 221 73 262
Expected return on fund assets 121 89 109 78 Actuarial gains and losses 37 80 30 73 Contributions by employer 6 6 6 6 Contributions by fund participant 3 3 3 3 Benefits paid ( 82) ( 67) ( 73) ( 48) Settlements - ( 36) - - Foreign currency translation differences - ( 4) - - Other ( 2) 150 ( 2) 150
Balance at the end of the year 1 402 1 319 1 255 1 182
Group Company% % % %
Fund assets comprise:Properties 5% 3% 4% 3%Equities and similar securities 44% 43% 42% 40%Public sector stocks and loans 1% 2% 0% 1%
31% 30% 34% 32%Cash, deposits and similar securities 19% 22% 20% 24%
100% 100% 100% 100%
Group CompanyR million R million R million R million
Net expense recognised in the statement of comprehensive income (included in administration costs):Current service cost 15 15 12 12 Interest cost 111 84 99 73 Expected return on fund assets ( 121) ( 89) ( 109) ( 78) Net actuarial (gains)/losses recognised during the year 2 ( 24) 5 ( 15) Oth 2 26 1 16
Fund obligations31.2 Defined benefit funds (continued)31. RETIREMENT BENEFITS FOR EMPLOYEES (continued)
Fund assets
Debentures, insurance policies, preference shares and other loans
The above value of fund assets includes an investment of R3.5 million (2009: R3 million) in Sanlam shares.
Other 2 26 1 16 Total included in staff costs 9 12 8 8
31.3 Medical aid funds
Group and Company2010 2009
Pre-retirement discount rate 8.8% 9.4%Returns for All bond index (ALBI) 8.2% -1.0%Expected increase in medical aid contributions 8.8% 9.4%
Group and Company2010 2009
R million R million
Balance at the beginning of the year 25 28 Movement for the year: ( 2) ( 3)
Interest 4 2 Actuarial gains and losses 2 ( 1)Benefits paid ( 8) ( 4)
Balance at the end of the year 23 25 2010 2009 2008 2007 2006
R million R million R million R million R millionNet liability recognised in statement of financial position:Present value of unfunded obligation 23 25 28 31 35
Experience adjustments on:Fund obligation 3.3% -10.5% -4.1% -8.1% 0.0%
Net liability recognised in statement of financial position:
The actuarially determined present value of medical aid obligations for disabled members and certain pensioners is fully provided for at year-end. The Group and Company have no further unprovided post-retirement medical aid obligations for current or retired employees.
Principle actuarial assumptions at 31 December were as follows:
The best estimate of the expected contributions payable to the fund by the Group and Company in 2011 are R10 million and R9 million respectively.
67
31.3 Medical aid funds (continued)% increase in assumed medical aid contributions
Sensitivity analysis -2% +2%
2 2 26 24
32. BORROWING POWERS
Group Company2010 2009 2010 2009
R million R million R million R million
33.1 Operating leases
Lease rentals due within one year 319 266 41 41 Lease rentals due within two to five years 503 464 39 27 Lease rentals due within more than five years 82 70 - - Total operating lease commitments 904 800 80 68
33.2 Services provided by JPMorgan
33.3 Other
33.4 Pension and retirement fund fraud investigation
34. RELATED PARTIESUltimate shareholderSanlam Limited is the ultimate holding company of Sanlam Life Insurance Ltd.Transactions with directors
Policy administration
Effect of change in assumed medical aid contributions (R million):
i i i h hi d li d h d i i i i i i f h l d i i h l h i d i i h l
Transactions with post-employment benefit plansContributions to the post-employment benefit plans were R213 million in 2010 (2009: R221 million). There are no amounts outstanding at year-end.
Remuneration is paid to directors in the form of fees to non-executive directors and remuneration to executive directors of the company. All directors of Sanlam Life Insurance Limited have notified that they did not have a material interest in any contract of significance with the company, which could have given rise to a conflict of interest during the year. Details relating to directors’ emoluments are included in note 24.
Total defined benefit obligation for post-employment medical benefits
As part of the disposal of Tasc Administration to JP Morgan during 2004, Sanlam Life agreed to outsource investment administration services to JP Morgan for a period of ten years. The fees payable under the agreement are based on the market value of the investments under administration.
Financial claims are lodged against the Group from time to time. Provisions are recognised for these claims based on best estimates of the expected outcome of the claims (refer to note 18). Provisions include allowance for the potential amount payable in terms of the Pension Funds Surplus Apportionment legislation. Given the high degree of uncertainty involved in determining the expected outcome, it is reasonably possible that outcomes in future financial years will be different to the current estimates. There are no other material commitments or contingencies that have not been provided for or fully disclosed, unless additional disclosures may potentially prejudice the legal arguments of the group.
33. COMMITMENTS AND CONTINGENCIES
Future operating lease commitments:
In terms of the articles of association of Sanlam Life Insurance Limited, the directors may at their discretion raise or borrow money for the purpose of the business of the company subject to the prior approvaof the Registrar of Long Term insurance.
31. RETIREMENT BENEFITS FOR EMPLOYEES (continued)
Material borrowings of the Group and Company are disclosed in note 16.
Aggregate of current service and interest costs
In 2010 we reached closure on some prominent and long outstanding legal cases, details of which are provided in the Sanlam Limited Chief Executive’s report. As a matter of course it is the Group’s policy to carry provisions to cover its estimated exposure in respect of legal or other claims. The level of and changes to these provisions are disclosed annually in the Group financial statements.
The settlement amounts in respect of the Datakor and Sanlam Health cases amounted to R175 million and R118 million respectively for the Sanlam Limited Group. Payment in respect of these claims was made from existing provisions and did not impact on the reported 2010 financial results.
Transactions with entities in the Sanlam group
The Company advanced, repaid and received loans from other subsidiaries in the Sanlam group during the current and previous years.
Company Total Transactions Balances outstanding2010 2009 2010 2009
Related Parties Transaction / Balance type R million R million R million R millionHolding companySanlam Ltd Inter-company balances - - ( 911) ( 315) SubsidiariesSantam Ltd Service fees 134 38 - -
Insurance premiums paid ( 16) ( 22) - - Insurance claims received 13 Inter-company balances - - 3 4 Financial instruments - - ( 25) ( 24) Distributions received 633 275 - -
Sanlam Investment Management (Pty) Ltd Service fees 205 244 - - Scrip lending fees 22 18 - - Distributions received 132 1 727 - -
Anglo African Finance (Pty) Ltd Interest received - 8 - - Inter-company balances - - ( 14) 15
Sanlam Linked Investments (Pty) Ltd Service & commission fees 61 63 - - Channel Life Ltd Reinsurance premiums received 51 45 - -
Reinsurance policies - - 25 24 Sanlam Customised Insurance Limited Service & commission fees 2 1 - -
Reinsurance premiums received 15 12 - - Distributions received - 6 - -
Sanlam Life Namibia Ltd Cost recoveries 4 4 - - Distributions received 66 90 - -
Details of investments in associated companies are disclosed in note 7.2 and note 7.4. Details of investments in subsidiaries are disclosed on pages 44 and 45.
Details of transactions that occurred during the financial period and outstanding balances with related parties, are listed below. A complete list of all related parties are disclosed on pages 82 to 83.
During the year the Company in the ordinary course of business entered into various transactions with subsidiary companies, associated companies, joint ventures and other stakeholders. These transactions occurred at arm’s length. Refer below for detail of transactions and balances outstanding with related parties.
Certain companies in the Group carry out third party policy and other administration activities for other related parties in the Sanlam Group. These transactions are entered into in the normal course obusiness, under terms that are no more favourable than those arranged with third parties.
Inter-company balances with subsidiaries are disclosed below other than loans which are disclosed on page 80.
68
34. RELATED PARTIES (continued)Total Transactions Balances outstanding
2010 2009 2010 2009Related Parties Transaction / Balance type R million R million R million R million
Sanlam Trust Ltd Service,commission and marketing fees 10 8 - - Distributions received 18 16 - -
Anson Holdings (Pty) Ltd Interest on loan account - 2 - - U.R.D. Investments (Pty) Ltd Distributions received 20 70 - - San Lameer Distributions received 21 - - - Champions Distributions received 18 - - Sanlam Developing Markets Ltd Service,commission and marketing fees 23 6 - -
Distributions received 144 237 - - Sanlam Namibia Holdings Ltd Distributions received 14 10 - - Sanlam Health Care Management (Pty) Ltd Distributions received 25 5 - - Sanlam Home Solutions (Pty) Ltd Service,commission and marketing fees - 8 - - Subsidiaries of subsidiariesSanlam Properties (Pty) Ltd Asset management fees - ( 36) - -
Handling fee - ( 1) - - Sales commission - ( 10) - -
Subsidiaries of fellow subsidiariesSanlam Collective Investments Ltd Service,commission and marketing fees 22 15 - -
Interest paid ( 14) ( 13) - - Inter-company balances - - ( 65) ( 81)
Sanlam Personal Investments (Pty) Ltd Service,commission and marketing fees 20 19 - - Glacier (Pty) Ltd Service,commission and marketing fees 314 254 - -
Inter-company balances - - ( 3) 4 Real Futures (Pty) Limited Service,commission and marketing fees 5 - - - Echelon Distribution Services Service,commission and marketing fees 1 - Sanlam Capital Markets Ltd Financial instruments - - 4 493 5 704
Inter-company balances - - 72 37 Umholi Investments (Pty) Ltd Inter-company balances - - - 22 Gensec Ireland Ltd Inter-company balances - - ( 354) ( 547) The Sanlam Limited Share Incentive Trust Inter-company balances - 460 464 Sanlam Investment Holdings Ltd Inter-company balances - - 177 176 Sanlam Netherlands Holdings Inter-company balances - - ( 320) - Associate of holding companyGensec Property Services Ltd Property Management fee ( 41) ( 50) - -
Tenant commission ( 21) ( 20) - - Coris Capital (Pty) Ltd Service fees received 6 7 - -
Service fees paid ( 57) ( 21) - -
Inter-company balances - 2 * 59 Associates `Vukile Property Fund Limited Asset management fees ( 34)
Sales and Handling fee ( 25) Joint VenturesSanlam Personal Loans (Pty) Ltd Interest on loan account - 50 - -
Financial instruments - - 143 31 Liquidity fees - 7 - - q y
Sanlam Home Loans (Pty) Ltd Service,commission and marketing fees - 3 - - Shareholders loan - - - 176 Financial instruments - - - 590 Inter-company balances - - - 47 *Interest received - 91 - -
* The company has subordinated its claim in favour of other creditors until such time as its assets fairly valued exceed its liabilities.
69
34. RELATED PARTIES (continued)2010 2009
R million R millionRelated Parties Transaction Total TransactionsGlacier International Multi-currency Fund Distributions received - - Sanlam Growth Institutional Fund Distributions received 24 44 Sanlam General Institutional Fund Distributions received 11 - Sanlam Institutional Special Opportunities Fund Distributions received 40 71 Sanlam Multi Managed Institutional Aggressive Equity Fund One Distributions received - 32 Sanlam Multi Managed Institutional All Bond Fund One Distributions received 67 62 Sanlam Multi Managed Institutional All Bond Fund Three Distributions received 27 26 Sanlam Multi Managed Institutional All Bond Fund Two Distributions received 40 46 Sanlam Multi Managed Institutional Bond Fund Distributions received 3 - Sanlam Multi Managed Institutional General Equity Fund One Distributions received - 43 Sanlam Multi Managed Institutional General Equity Fund Three Distributions received 3 10 Sanlam Multi Managed Institutional General Equity Fund Two Distributions received - 52 Sanlam Multi Managed Institutional General Equity Fund Four Distributions received 1 3 Sanlam Multi Managed Institutional Positive Return Fund Four Distributions received 36 36 Sanlam Multi Managed Institutional Positive Return Fund Fund One Distributions received 14 19 Sanlam Multi Managed Institutional Positive Return Fund Three Distributions received 30 33 Sanlam Multi Managed Institutional Positive Return Fund Two Distributions received 27 27 Sanlam Property Fund Distributions received 70 63 Sanlam Bond Index Fund Distributions received 2 - Sanlam Aggressive Fund of Funds Distributions received 6 - Sanlam Value Institutional Fund Distributions received 35 75 SIM Managed Moderate Fund of Funds Distributions received 34 36 Sanlam All Share Index Fund Distributions received 1 2 Sanlam Global Index Fund of Funds Distributions received 14 - SIM Managed Aggressive Fund of Funds Distributions received 2 5 SIM Managed Moderate Aggressive Fund of Funds Distributions received 6 1 SIM Managed Cautious Fund of funds Distributions received 18 18 Post-employment benefit fundsPension funds Pension fund admin charges ( 8) ( 8)
Pension fund contributions ( 104) ( 96) Key management personnel compensationShort-term employee benefits 127 125 Share-based payments 16 34 Contributions to defined contibution plans 7 11 Other long-term benefits 29 10
179 180
Group Total Transactions Balances outstanding
2010 2009 2010 2009Related Parties Transaction / Balance type R million R million R million R millionHolding companySanlam Ltd Inter-company balances - - ( 911) ( 345) Subsidiaries of fellow subsidiariesSanlam Collective Investments Ltd Service,commission and marketing fees 22 15 - -
Interest paid ( 14) ( 13) - - Inter-company balances (receivable) - - 13 ( 81) p y ( ) ( )Inter-company balances (payable) ( 66)
Sanlam Capital Markets Ltd Financial instruments - - 4 493 5 704 Inter-company balances (receivable) 79 Inter-company balances (payable) - - ( 371) ( 255)
Glacier (Pty) Ltd Service,commission and marketing fees 314 254 - - Inter-company balances - - ( 7) 4
Umholi Investments (Pty) Ltd Inter-company balances - - - 22 Gensec Ireland Ltd Inter-company balances - - ( 354) ( 547) Sanpref (Pty) Ltd Inter-company balances - - ( 405) ( 405) Sanlam Spec (Pty) Ltd Inter-company balances - - 32 32 The Sanlam Limited Share Incentive Trust Inter-company balances - - 534 499 Sanlam Investment Holdings Ltd Inter-company balances - - 307 307 Sanlam Netherlands Holdings Inter-company balances - - ( 320) - Sanlam International Inter-company balances 26 - Associate of holding company . Gensec Property Services Ltd Asset management fees ( 41) ( 50) - -
Tenant commission ( 21) ( 20) - - Coris Capital (Pty) Ltd Service fees received 6 7 - -
Service fees paid ( 57) ( 21) - -
Inter-company balances - - 2 * 59 Joint VenturesSanlam Personal Loans (Pty) Ltd Interest on loan account - 50 - -
Financial instruments - - 143 31 Inter-company balances - - - - Liquidity fees - 7 - -
Sanlam Home Loans (Pty) Ltd Service,commission and marketing fees - 3 - - Shareholders loan - - - 176 Financial instruments - - - 590 Inter-company balances - - - 47 *Interest received - 91 - -
2010 2009R million R million
Key management personnel compensationShort-term employee benefits 290 273 Share-based payments 34 49 Contributions to defined contibution plans 8 17 Other long-term benefits 36 21
368 360
70
Group Company2010 2009 2010 2009
R million R million R million R million
35.1 Cash utilised in operations Profit before tax per statement of comprehensive income 8 889 7 800 8 221 8 969 Net movement in policy liabilities (note 15.1) 20 409 16 535 17 756 14 143 Non-cash flow items (20 560) (14 970) (20 363) (12 856)
Depreciation 149 161 74 75 Bad debts written off 178 158 19 23 Share-based payments 73 64 - 2 Profit on disposal of subsidiaries/associates/businesses ( 486) ( 75) - - Fair value adjustments (20 181) (15 284) (20 405) (13 017) Amortisation of value of business acquired 73 63 - - Impairment of investments and goodwill ( 51) 57 ( 51) 61 Equity-accounted earnings ( 315) ( 114) - -
Items disclosed separately (13 006) (13 667) (11 372) (13 220) Interest and preference share dividends received (9 470) (10 070) (7 466) (7 768)
Interest paid (1) 397 535 191 191 Dividends received (3 933) (4 132) (4 097) (5 643)
Net purchase of fixed assets ( 185) ( 161) ( 79) ( 78) Net purchase of owner-occupied properties ( 1) ( 1) - - Decrease in net working capital assets and liabilities 1 233 1 870 543 3 206 Cash (utilised)/generated in operations (3 221) (2 594) (5 294) 164
35.2 Acquisition of subsidiaries
Net assets acquired 78 141 - - Minority and other interests acquired during 2010 78 141 - - Net assets acquired in 2009 (refer note 36.2) - - - -
Goodwill (note 3) 393 45 - - Total purchase consideration 471 186 - - Less: Net asset value contributed ( 6) ( 1) - - Cash, deposits and similar securities acquired ( 236) ( 2) - - Cash component of acquisition of subsidiaries 229 183 - -
35 3 Disposal of subsidiaries/associates
35. NOTES TO THE CASH FLOW STATEMENT
During the year, various subsidiaries were acquired within the Group. The fair value of assets acquired is as follows:
35.3 Disposal of subsidiaries/associates
Investments - - - Property, plant and equipment - 13 - - Trade and other receivables - 10 - - Cash, deposits and similar securities - 26 - - Long term loans - - - - Working capital liabilities - ( 50) - - (Profit)/loss on disposal of subsidiaries/associates - 75 - - Total disposal price - 74 - - Less: Cash, deposits and similar securities disposed of - ( 26) - - Cash component of disposal of subsidiaries/associates - 48 - -
Working capital: Cash, deposits and similar securities 9 251 8 593 701 941 Investment cash 47 900 47 059 37 592 36 501 Total cash, deposits and similar securities 57 151 55 652 38 293 37 442
(1) Other finance cost reclassified
The fair value of assets disposed of was as follows:
35.4 Cash, deposits and similar securities
71

36. BUSINESS COMBINATIONS
36.1 Material acquisitions of the Group consolidated in the 2010 financial year
There were no material business combinations during the 2010 financial year.
Other acquisitions relate to the following:- The acquisition of Indwe Broker Holdings (Pty) Ltd and Emerald Risk Transfer (Pty) Ltd by Santam;- Other smaller acquisitions. The contribution of these acquisitions to profit for 2010 is not material.
36.2 Material acquisitions of the Group consolidated in the 2009 financial year
The Group did not effect any individually material business combination transactions during the year.
72
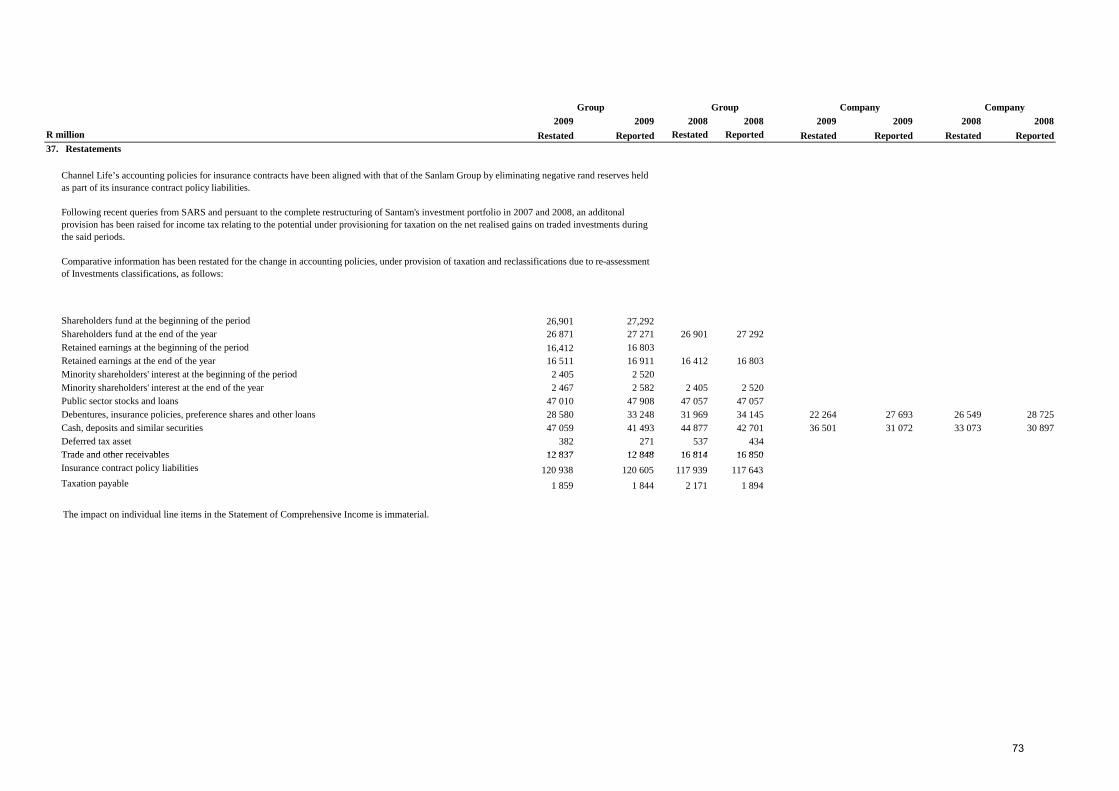
Group Group Company Company2009 2009 2008 2008 2009 2009 2008 2008
R million Restated Reported Restated Reported Restated Reported Restated Reported
Shareholders fund at the beginning of the period 26,901 27,292Shareholders fund at the end of the year 26 871 27 271 26 901 27 292Retained earnings at the beginning of the period 16,412 16 803Retained earnings at the end of the year 16 511 16 911 16 412 16 803Minority shareholders' interest at the beginning of the period 2 405 2 520Minority shareholders' interest at the end of the year 2 467 2 582 2 405 2 520Public sector stocks and loans 47 010 47 908 47 057 47 057Debentures, insurance policies, preference shares and other loans 28 580 33 248 31 969 34 145 22 264 27 693 26 549 28 725Cash, deposits and similar securities 47 059 41 493 44 877 42 701 36 501 31 072 33 073 30 897Deferred tax asset 382 271 537 434Trade and other receivables 12 837 12 848 16 814 16 850
37. Restatements
Channel Life’s accounting policies for insurance contracts have been aligned with that of the Sanlam Group by eliminating negative rand reserves held as part of its insurance contract policy liabilities.
Following recent queries from SARS and persuant to the complete restructuring of Santam's investment portfolio in 2007 and 2008, an additonal provision has been raised for income tax relating to the potential under provisioning for taxation on the net realised gains on traded investments during the said periods.
Comparative information has been restated for the change in accounting policies, under provision of taxation and reclassifications due to re-assessment of Investments classifications, as follows:
Trade and other receivables 12 837 12 848 16 814 16 850Insurance contract policy liabilities 120 938 120 605 117 939 117 643Taxation payable 1 859 1 844 2 171 1 894
The impact on individual line items in the Statement of Comprehensive Income is immaterial.
73
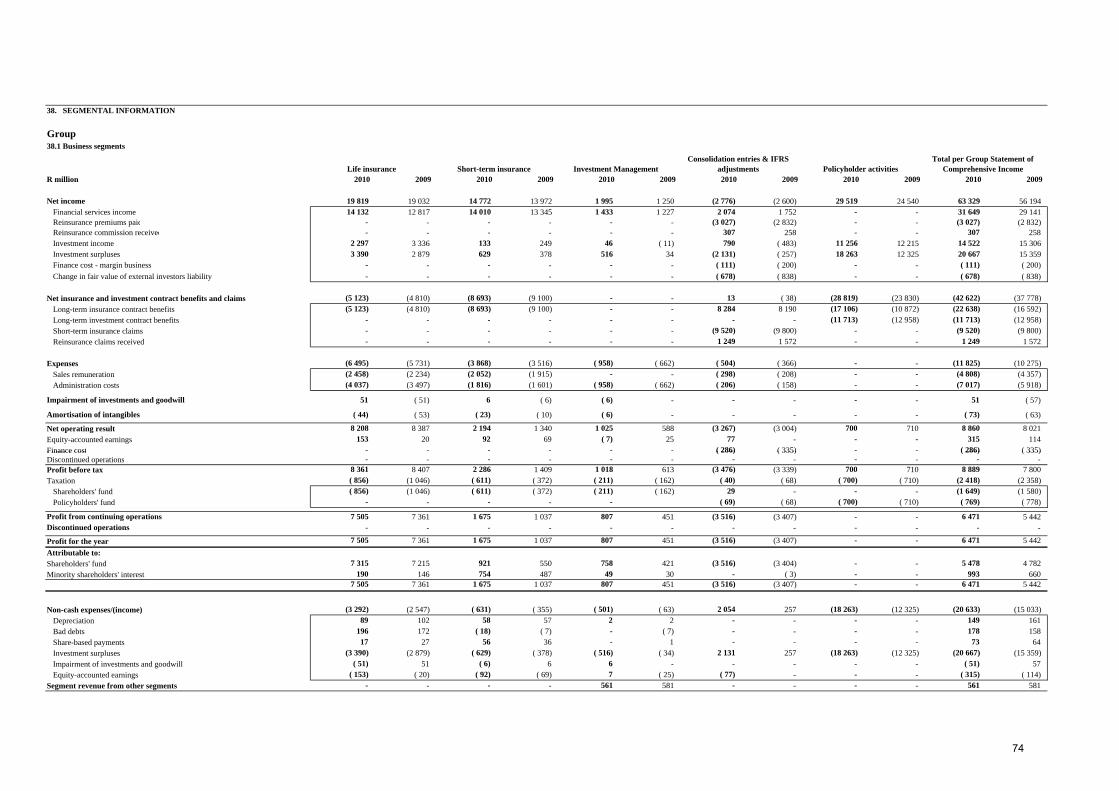
38. SEGMENTAL INFORMATION
Group38.1 Business segments
R million 2010 2009 2010 2009 2010 2009 2010 2009 2010 2009 2010 2009
Net income 19 819 19 032 14 772 13 972 1 995 1 250 (2 776) (2 600) 29 519 24 540 63 329 56 194 Financial services income 14 132 12 817 14 010 13 345 1 433 1 227 2 074 1 752 - - 31 649 29 141 Reinsurance premiums paid - - - - - - (3 027) (2 832) - - (3 027) (2 832) Reinsurance commission received - - - - - - 307 258 - - 307 258 Investment income 2 297 3 336 133 249 46 ( 11) 790 ( 483) 11 256 12 215 14 522 15 306 Investment surpluses 3 390 2 879 629 378 516 34 (2 131) ( 257) 18 263 12 325 20 667 15 359 Finance cost - margin business - - - - - - ( 111) ( 200) - - ( 111) ( 200) Change in fair value of external investors liability - - - - - - ( 678) ( 838) - - ( 678) ( 838)
Net insurance and investment contract benefits and claims (5 123) (4 810) (8 693) (9 100) - - 13 ( 38) (28 819) (23 830) (42 622) (37 778) Long-term insurance contract benefits (5 123) (4 810) (8 693) (9 100) - - 8 284 8 190 (17 106) (10 872) (22 638) (16 592) Long-term investment contract benefits - - - - - - - - (11 713) (12 958) (11 713) (12 958) Short-term insurance claims - - - - - - (9 520) (9 800) - - (9 520) (9 800) Reinsurance claims received - - - - - - 1 249 1 572 - - 1 249 1 572
Expenses (6 495) (5 731) (3 868) (3 516) ( 958) ( 662) ( 504) ( 366) - - (11 825) (10 275) Sales remuneration (2 458) (2 234) (2 052) (1 915) - - ( 298) ( 208) - - (4 808) (4 357) Administration costs (4 037) (3 497) (1 816) (1 601) ( 958) ( 662) ( 206) ( 158) - - (7 017) (5 918)
Impairment of investments and goodwill 51 ( 51) 6 ( 6) ( 6) - - - - - 51 ( 57)
Amortisation of intangibles ( 44) ( 53) ( 23) ( 10) ( 6) - - - - - ( 73) ( 63)
Net operating result 8 208 8 387 2 194 1 340 1 025 588 (3 267) (3 004) 700 710 8 860 8 021 Equity-accounted earnings 153 20 92 69 ( 7) 25 77 - - - 315 114 Finance cost - - - - - - ( 286) ( 335) - - ( 286) ( 335)
Life insurance Investment ManagementShort-term insuranceConsolidation entries & IFRS
adjustmentsTotal per Group Statement of
Comprehensive IncomePolicyholder activities
Finance cost - - - - - - ( 286) ( 335) - - ( 286) ( 335) Discontinued operations - - - - - - - - - - - - Profit before tax 8 361 8 407 2 286 1 409 1 018 613 (3 476) (3 339) 700 710 8 889 7 800 Taxation ( 856) (1 046) ( 611) ( 372) ( 211) ( 162) ( 40) ( 68) ( 700) ( 710) (2 418) (2 358)
Shareholders' fund ( 856) (1 046) ( 611) ( 372) ( 211) ( 162) 29 - - - (1 649) (1 580) Policyholders' fund - - - - - ( 69) ( 68) ( 700) ( 710) ( 769) ( 778)
Profit from continuing operations 7 505 7 361 1 675 1 037 807 451 (3 516) (3 407) - - 6 471 5 442 Discontinued operations - - - - - - - - - - - -
Profit for the year 7 505 7 361 1 675 1 037 807 451 (3 516) (3 407) - - 6 471 5 442 Attributable to:Shareholders' fund 7 315 7 215 921 550 758 421 (3 516) (3 404) - - 5 478 4 782 Minority shareholders' interest 190 146 754 487 49 30 - ( 3) - - 993 660
7 505 7 361 1 675 1 037 807 451 (3 516) (3 407) - - 6 471 5 442
Non-cash expenses/(income) (3 292) (2 547) ( 631) ( 355) ( 501) ( 63) 2 054 257 (18 263) (12 325) (20 633) (15 033) Depreciation 89 102 58 57 2 2 - - - - 149 161 Bad debts 196 172 ( 18) ( 7) - ( 7) - - - - 178 158 Share-based payments 17 27 56 36 - 1 - - - - 73 64 Investment surpluses (3 390) (2 879) ( 629) ( 378) ( 516) ( 34) 2 131 257 (18 263) (12 325) (20 667) (15 359) Impairment of investments and goodwill ( 51) 51 ( 6) 6 6 - - - - - ( 51) 57 Equity-accounted earnings ( 153) ( 20) ( 92) ( 69) 7 ( 25) ( 77) - - - ( 315) ( 114)
Segment revenue from other segments - - - - 561 581 - - - - 561 581
74
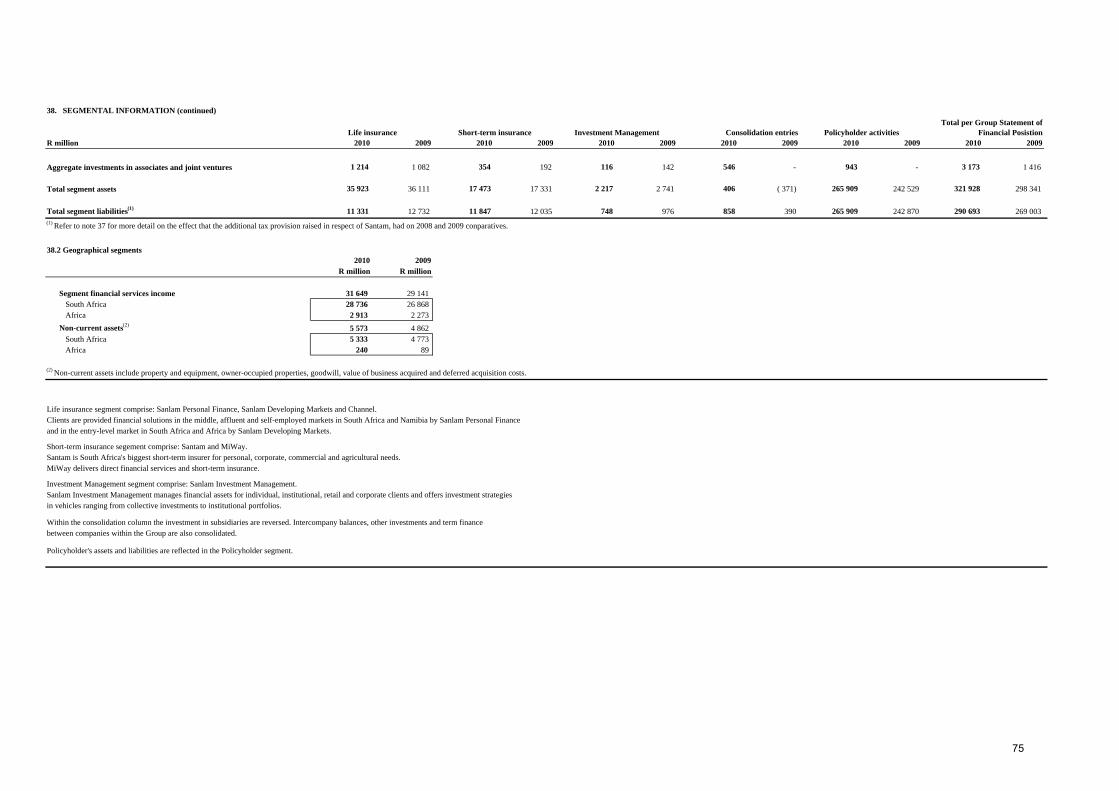
38. SEGMENTAL INFORMATION (continued)
R million 2010 2009 2010 2009 2010 2009 2010 2009 2010 2009 2010 2009
Aggregate investments in associates and joint ventures 1 214 1 082 354 192 116 142 546 - 943 - 3 173 1 416
Total segment assets 35 923 36 111 17 473 17 331 2 217 2 741 406 ( 371) 265 909 242 529 321 928 298 341
Total segment liabilities(1) 11 331 12 732 11 847 12 035 748 976 858 390 265 909 242 870 290 693 269 003 (1) Refer to note 37 for more detail on the effect that the additional tax provision raised in respect of Santam, had on 2008 and 2009 conparatives.
38.2 Geographical segments 2010 2009
R million R million
Segment financial services income 31 649 29 141 South Africa 28 736 26 868 Africa 2 913 2 273
Non-current assets(2) 5 573 4 862 South Africa 5 333 4 773 Africa 240 89
(2) Non-current assets include property and equipment, owner-occupied properties, goodwill, value of business acquired and deferred acquisition costs.
Life insurance segment comprise: Sanlam Personal Finance, Sanlam Developing Markets and Channel.Clients are provided financial solutions in the middle, affluent and self-employed markets in South Africa and Namibia by Sanlam Personal Finance and in the entry-level market in South Africa and Africa by Sanlam Developing Markets.
Short-term insurance segement comprise: Santam and MiWay.
Life insurance Short-term insurance Investment Management Total per Group Statement of
Financial Posistion Policyholder activities Consolidation entries
Santam is South Africa's biggest short-term insurer for personal, corporate, commercial and agricultural needs.MiWay delivers direct financial services and short-term insurance.
Investment Management segment comprise: Sanlam Investment Management.Sanlam Investment Management manages financial assets for individual, institutional, retail and corporate clients and offers investment strategies in vehicles ranging from collective investments to institutional portfolios.
Within the consolidation column the investment in subsidiaries are reversed. Intercompany balances, other investments and term finance between companies within the Group are also consolidated.
Policyholder's assets and liabilities are reflected in the Policyholder segment.
75

2010 2009 2010 2009R million R million R million R million
39. Impairments(Reversal of impairments)/Impairments of investmentsSanlam Home Loans - - - - Sanlam Personal Loans ( 51) 51 ( 51) 51 Alfinanz - - - 10 Other - 6 - -
( 51) 57 ( 51) 61
Group Company
Total (reversal of impairments)/impairments of investments and goodwill for the year
76
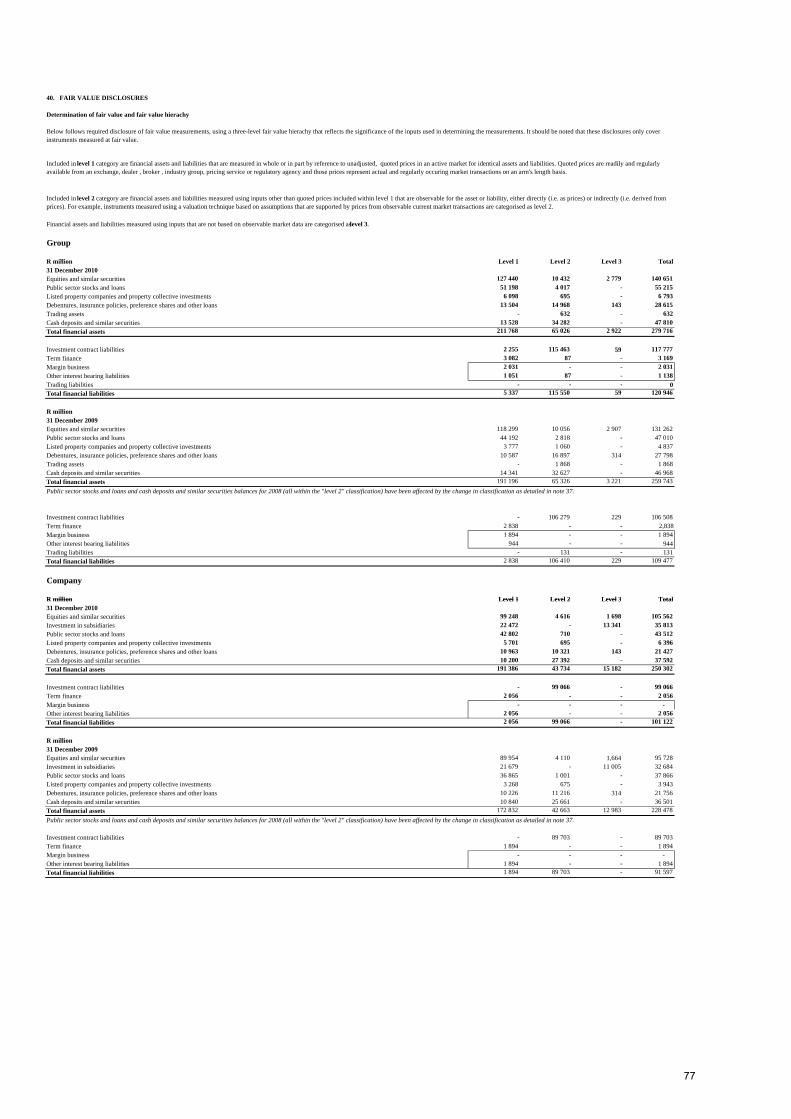
Determination of fair value and fair value hierachy
Group
R million Level 1 Level 2 Level 3 Total31 December 2010Equities and similar securities 127 440 10 432 2 779 140 651Public sector stocks and loans 51 198 4 017 - 55 215Listed property companies and property collective investments 6 098 695 - 6 793Debentures, insurance policies, preference shares and other loans 13 504 14 968 143 28 615Trading assets - 632 - 632Cash deposits and similar securities 13 528 34 282 - 47 810Total financial assets 211 768 65 026 2 922 279 716
Investment contract liabilities 2 255 115 463 59 117 777Term finance 3 082 87 - 3 169Margin business 2 031 - - 2 031Other interest bearing liabilities 1 051 87 - 1 138Trading liabilities - - - 0Total financial liabilities 5 337 115 550 59 120 946
R million31 December 2009Equities and similar securities 118 299 10 056 2 907 131 262Public sector stocks and loans 44 192 2 818 - 47 010Listed property companies and property collective investments 3 777 1 060 - 4 837Debentures, insurance policies, preference shares and other loans 10 587 16 897 314 27 798Trading assets - 1 868 - 1 868Cash deposits and similar securities 14 341 32 627 - 46 968Total financial assets 191 196 65 326 3 221 259 743Public sector stocks and loans and cash deposits and similar securities balances for 2008 (all within the "level 2" classification) have been affected by the change in classification as detailed in note 37.
Investment contract liabilities - 106 279 229 106 508Term finance 2 838 - - 2,838 Margin business 1 894 - - 1 894Other interest bearing liabilities 944 - - 944Trading liabilities - 131 - 131Total financial liabilities 2 838 106 410 229 109 477
Company
R million Level 1 Level 2 Level 3 Total
40. FAIR VALUE DISCLOSURES
Below follows required disclosure of fair value measurements, using a three-level fair value hierachy that reflects the significance of the inputs used in determining the measurements. It should be noted that these disclosures only cover instruments measured at fair value.
Included in level 1 category are financial assets and liabilities that are measured in whole or in part by reference to unadjusted, quoted prices in an active market for identical assets and liabilities. Quoted prices are readily and regularly available from an exchange, dealer , broker , industry group, pricing service or regulatory agency and those prices represent actual and regularly occuring market transactions on an arm's length basis.
Included in level 2 category are financial assets and liabilities measured using inputs other than quoted prices included within level 1 that are observable for the asset or liability, either directly (i.e. as prices) or indirectly (i.e. derived from prices). For example, instruments measured using a valuation technique based on assumptions that are supported by prices from observable current market transactions are categorised as level 2.
Financial assets and liabilities measured using inputs that are not based on observable market data are categorised as level 3.
R million Level 1 Level 2 Level 3 Total31 December 2010Equities and similar securities 99 248 4 616 1 698 105 562Investment in subsidiaries 22 472 - 13 341 35 813Public sector stocks and loans 42 802 710 - 43 512Listed property companies and property collective investments 5 701 695 - 6 396Debentures, insurance policies, preference shares and other loans 10 963 10 321 143 21 427Cash deposits and similar securities 10 200 27 392 - 37 592Total financial assets 191 386 43 734 15 182 250 302
Investment contract liabilities - 99 066 - 99 066Term finance 2 056 - - 2 056Margin business - - - - Other interest bearing liabilities 2 056 - - 2 056Total financial liabilities 2 056 99 066 - 101 122
R million31 December 2009Equities and similar securities 89 954 4 110 1,664 95 728Investment in subsidiaries 21 679 - 11 005 32 684Public sector stocks and loans 36 865 1 001 - 37 866Listed property companies and property collective investments 3 268 675 - 3 943Debentures, insurance policies, preference shares and other loans 10 226 11 216 314 21 756Cash deposits and similar securities 10 840 25 661 - 36 501Total financial assets 172 832 42 663 12 983 228 478Public sector stocks and loans and cash deposits and similar securities balances for 2008 (all within the "level 2" classification) have been affected by the change in classification as detailed in note 37.
Investment contract liabilities - 89 703 - 89 703Term finance 1 894 - - 1 894Margin business - - - - Other interest bearing liabilities 1 894 - - 1 894Total financial liabilities 1 894 89 703 - 91 597
77
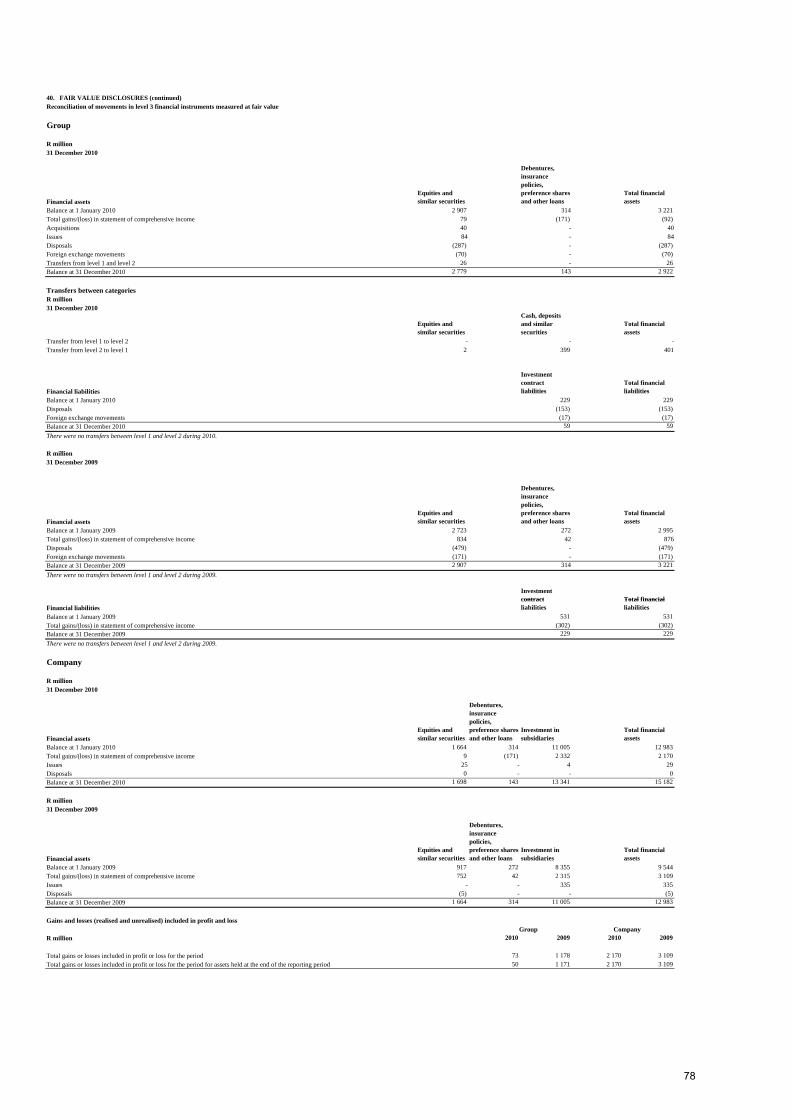
Reconciliation of movements in level 3 financial instruments measured at fair value
Group
R million31 December 2010
Financial assetsEquities and similar securities
Debentures, insurance policies, preference shares and other loans
Total financial assets
Balance at 1 January 2010 2 907 314 3 221 Total gains/(loss) in statement of comprehensive income 79 (171) (92)Acquisitions 40 - 40 Issues 84 - 84 Disposals (287) - (287)Foreign exchange movements (70) - (70)Transfers from level 1 and level 2 26 - 26Balance at 31 December 2010 2 779 143 2 922
Transfers between categoriesR million31 December 2010
Equities and similar securities
Cash, deposits and similar securities
Total financial assets
Transfer from level 1 to level 2 - - - Transfer from level 2 to level 1 2 399 401
Financial liabilities
Investment contract liabilities
Total financial liabilities
Balance at 1 January 2010 229 229Disposals (153) (153)Foreign exchange movements (17) (17)Balance at 31 December 2010 59 59There were no transfers between level 1 and level 2 during 2010.
R million31 December 2009
Financial assetsEquities and similar securities
Debentures, insurance policies, preference shares and other loans
Total financial assets
Balance at 1 January 2009 2 723 272 2 995 Total gains/(loss) in statement of comprehensive income 834 42 876 Disposals (479) - (479)Foreign exchange movements (171) - (171)Balance at 31 December 2009 2 907 314 3 221 There were no transfers between level 1 and level 2 during 2009.
Investment contract Total financial
40. FAIR VALUE DISCLOSURES (continued)
Financial liabilitiescontract liabilities
Total financial liabilities
Balance at 1 January 2009 531 531Total gains/(loss) in statement of comprehensive income (302) (302)Balance at 31 December 2009 229 229There were no transfers between level 1 and level 2 during 2009.
Company
R million31 December 2010
Financial assetsEquities and similar securities
Debentures, insurance policies, preference shares and other loans
Investment in subsidiaries
Total financial assets
Balance at 1 January 2010 1 664 314 11 005 12 983 Total gains/(loss) in statement of comprehensive income 9 (171) 2 332 2 170 Issues 25 - 4 29Disposals 0 - - 0Balance at 31 December 2010 1 698 143 13 341 15 182
R million31 December 2009
Financial assetsEquities and similar securities
Debentures, insurance policies, preference shares and other loans
Investment in subsidiaries
Total financial assets
Balance at 1 January 2009 917 272 8 355 9 544 Total gains/(loss) in statement of comprehensive income 752 42 2 315 3 109 Issues - - 335 335Disposals (5) - - (5)Balance at 31 December 2009 1 664 314 11 005 12 983
Gains and losses (realised and unrealised) included in profit and loss
R million 2010 2009 2010 2009
Total gains or losses included in profit or loss for the period 73 1 178 2 170 3 109 Total gains or losses included in profit or loss for the period for assets held at the end of the reporting period 50 1 171 2 170 3 109
Company Group
78
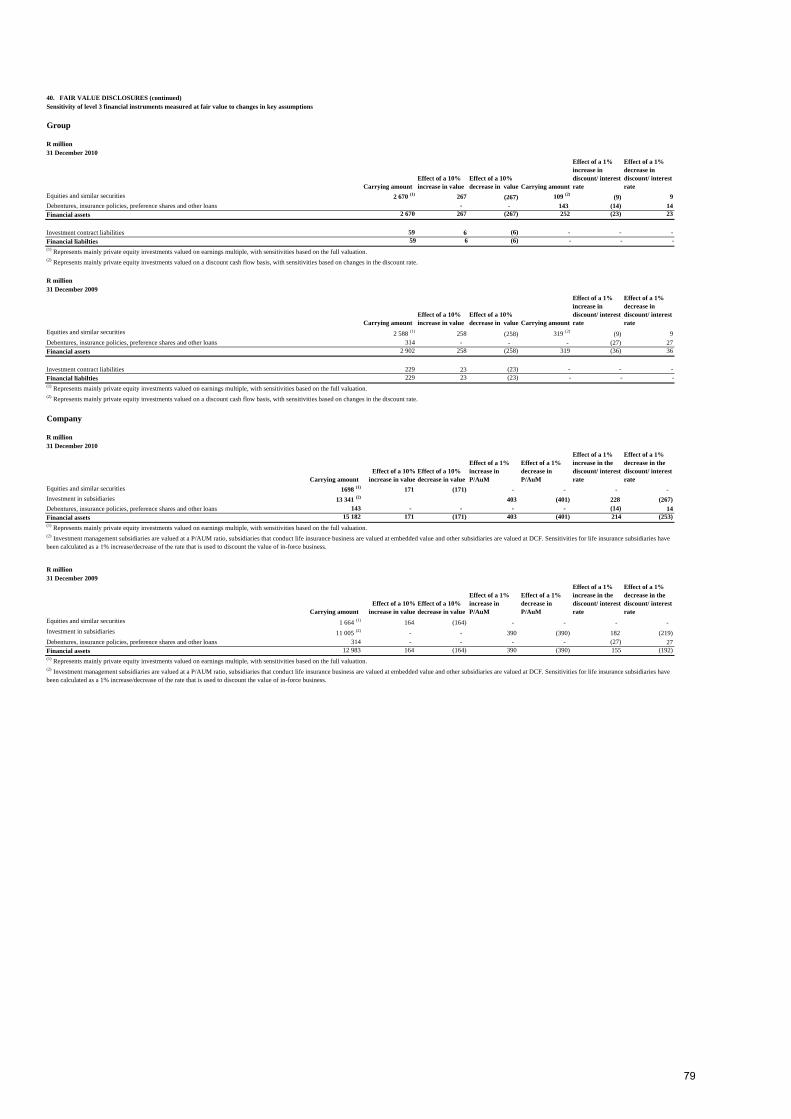
Sensitivity of level 3 financial instruments measured at fair value to changes in key assumptions
Group
R million31 December 2010
Carrying amount Effect of a 10% increase in value
Effect of a 10% decrease in value Carrying amount
Effect of a 1% increase in discount/ interest rate
Effect of a 1% decrease in discount/ interest rate
Equities and similar securities 2 670 (1) 267 (267) 109 (2) (9) 9 Debentures, insurance policies, preference shares and other loans - - 143 (14) 14Financial assets 2 670 267 (267) 252 (23) 23
Investment contract liabilities 59 6 (6) - - -Financial liabilties 59 6 (6) - - - (1) Represents mainly private equity investments valued on earnings multiple, with sensitivities based on the full valuation.(2) Represents mainly private equity investments valued on a discount cash flow basis, with sensitivities based on changes in the discount rate.
R million31 December 2009
Carrying amount Effect of a 10% increase in value
Effect of a 10% decrease in value Carrying amount
Effect of a 1% increase in discount/ interest rate
Effect of a 1% decrease in discount/ interest rate
Equities and similar securities 2 588 (1) 258 (258) 319 (2) (9) 9 Debentures, insurance policies, preference shares and other loans 314 - - - (27) 27Financial assets 2 902 258 (258) 319 (36) 36
Investment contract liabilities 229 23 (23) - - -Financial liabilties 229 23 (23) - - - (1) Represents mainly private equity investments valued on earnings multiple, with sensitivities based on the full valuation.(2) Represents mainly private equity investments valued on a discount cash flow basis, with sensitivities based on changes in the discount rate.
Company
R million31 December 2010
Carrying amountEffect of a 10%
increase in valueEffect of a 10% decrease in value
Effect of a 1% increase in P/AuM
Effect of a 1% decrease in P/AuM
Effect of a 1% increase in the discount/ interest rate
Effect of a 1% decrease in the discount/ interest rate
Equities and similar securities 1698 (1) 171 (171) - - - - Investment in subsidiaries 13 341 (2) 403 (401) 228 (267)Debentures, insurance policies, preference shares and other loans 143 - - - - (14) 14Financial assets 15 182 171 (171) 403 (401) 214 (253)(1) Represents mainly private equity investments valued on earnings multiple, with sensitivities based on the full valuation.
R million31 December 2009
Effect of a 1% Effect of a 1% Effect of a 1% increase in the
Effect of a 1% decrease in the
40. FAIR VALUE DISCLOSURES (continued)
(2) Investment management subsidiaries are valued at a P/AUM ratio, subsidiaries that conduct life insurance business are valued at embedded value and other subsidiaries are valued at DCF. Sensitivities for life insurance subsidiaries have been calculated as a 1% increase/decrease of the rate that is used to discount the value of in-force business.
Carrying amountEffect of a 10%
increase in valueEffect of a 10% decrease in value
increase in P/AuM
decrease in P/AuM
discount/ interest rate
discount/ interest rate
Equities and similar securities 1 664 (1) 164 (164) - - - - Investment in subsidiaries 11 005 (2) - - 390 (390) 182 (219)Debentures, insurance policies, preference shares and other loans 314 - - - - (27) 27Financial assets 12 983 164 (164) 390 (390) 155 (192)(1) Represents mainly private equity investments valued on earnings multiple, with sensitivities based on the full valuation.(2) Investment management subsidiaries are valued at a P/AUM ratio, subsidiaries that conduct life insurance business are valued at embedded value and other subsidiaries are valued at DCF. Sensitivities for life insurance subsidiaries have been calculated as a 1% increase/decrease of the rate that is used to discount the value of in-force business.
79
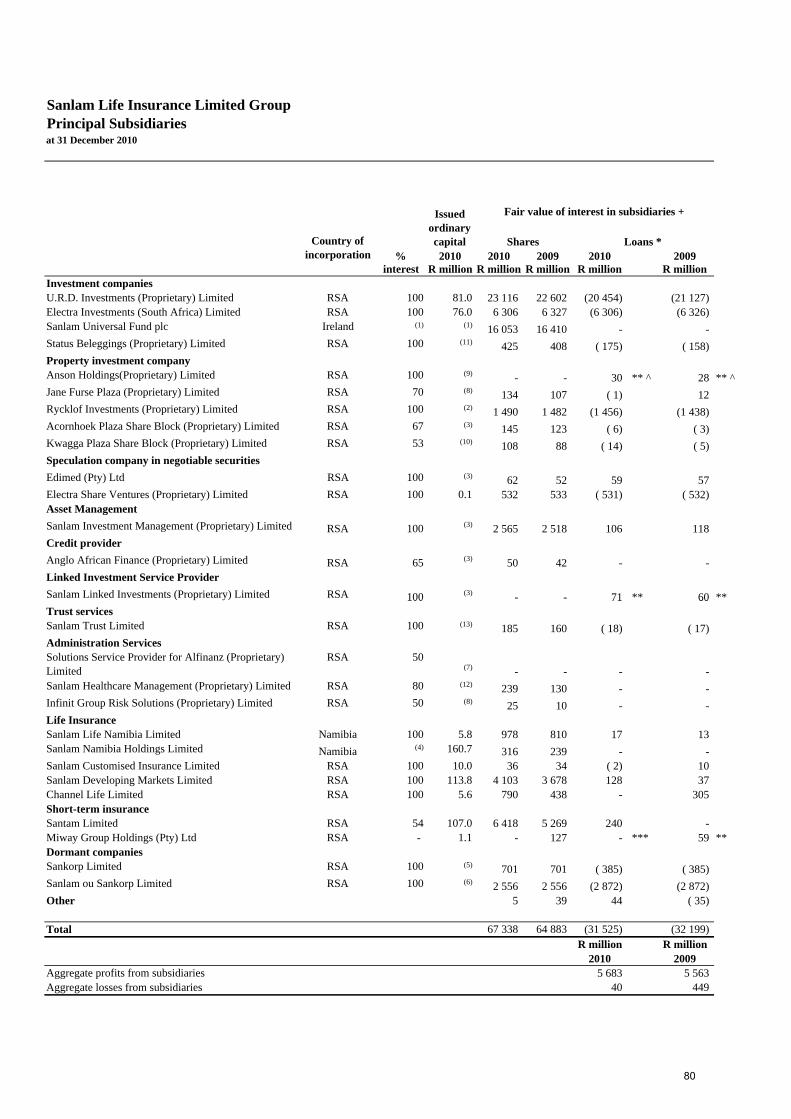
Sanlam Life Insurance Limited GroupPrincipal Subsidiariesat 31 December 2010
% 2010 2010 2009 2010 2009interest R million R million R million R million R million
Investment companiesU.R.D. Investments (Proprietary) Limited RSA 100 81.0 23 116 22 602 (20 454) (21 127) Electra Investments (South Africa) Limited RSA 100 76.0 6 306 6 327 (6 306) (6 326) Sanlam Universal Fund plc Ireland (1) (1) 16 053 16 410 - - Status Beleggings (Proprietary) Limited RSA 100 (11) 425 408 ( 175) ( 158) Property investment companyAnson Holdings(Proprietary) Limited RSA 100 (9) - - 30 ** ^ 28 ** ^Jane Furse Plaza (Proprietary) Limited RSA 70 (8) 134 107 ( 1) 12 Rycklof Investments (Proprietary) Limited RSA 100 (2) 1 490 1 482 (1 456) (1 438) Acornhoek Plaza Share Block (Proprietary) Limited RSA 67 (3) 145 123 ( 6) ( 3) Kwagga Plaza Share Block (Proprietary) Limited RSA 53 (10) 108 88 ( 14) ( 5) Speculation company in negotiable securitiesEdimed (Pty) Ltd RSA 100 (3) 62 52 59 57 Electra Share Ventures (Proprietary) Limited RSA 100 0.1 532 533 ( 531) ( 532) Asset ManagementSanlam Investment Management (Proprietary) Limited RSA 100 (3) 2 565 2 518 106 118 Credit providerAnglo African Finance (Proprietary) Limited RSA 65 (3) 50 42 - - Linked Investment Service ProviderSanlam Linked Investments (Proprietary) Limited RSA 100 (3) - - 71 ** 60 **
Issued ordinary capital SharesCountry of
incorporation
Fair value of interest in subsidiaries +
Loans *
100 71 60 Trust servicesSanlam Trust Limited RSA 100 (13) 185 160 ( 18) ( 17) Administration ServicesSolutions Service Provider for Alfinanz (Proprietary) Limited
RSA 50(7) - - - -
Sanlam Healthcare Management (Proprietary) Limited RSA 80 (12) 239 130 - - Infinit Group Risk Solutions (Proprietary) Limited RSA 50 (8) 25 10 - - Life InsuranceSanlam Life Namibia Limited Namibia 100 5.8 978 810 17 13 Sanlam Namibia Holdings Limited Namibia (4) 160.7 316 239 - - Sanlam Customised Insurance Limited RSA 100 10.0 36 34 ( 2) 10 Sanlam Developing Markets Limited RSA 100 113.8 4 103 3 678 128 37 Channel Life Limited RSA 100 5.6 790 438 - 305 Short-term insuranceSantam Limited RSA 54 107.0 6 418 5 269 240 - Miway Group Holdings (Pty) Ltd RSA - 1.1 - 127 - *** 59 **Dormant companiesSankorp Limited RSA 100 (5) 701 701 ( 385) ( 385) Sanlam ou Sankorp Limited RSA 100 (6) 2 556 2 556 (2 872) (2 872) Other 5 39 44 ( 35)
Total 67 338 64 883 (31 525) (32 199) R million R million
2010 2009Aggregate profits from subsidiaries 5 683 5 563 Aggregate losses from subsidiaries 40 449
80
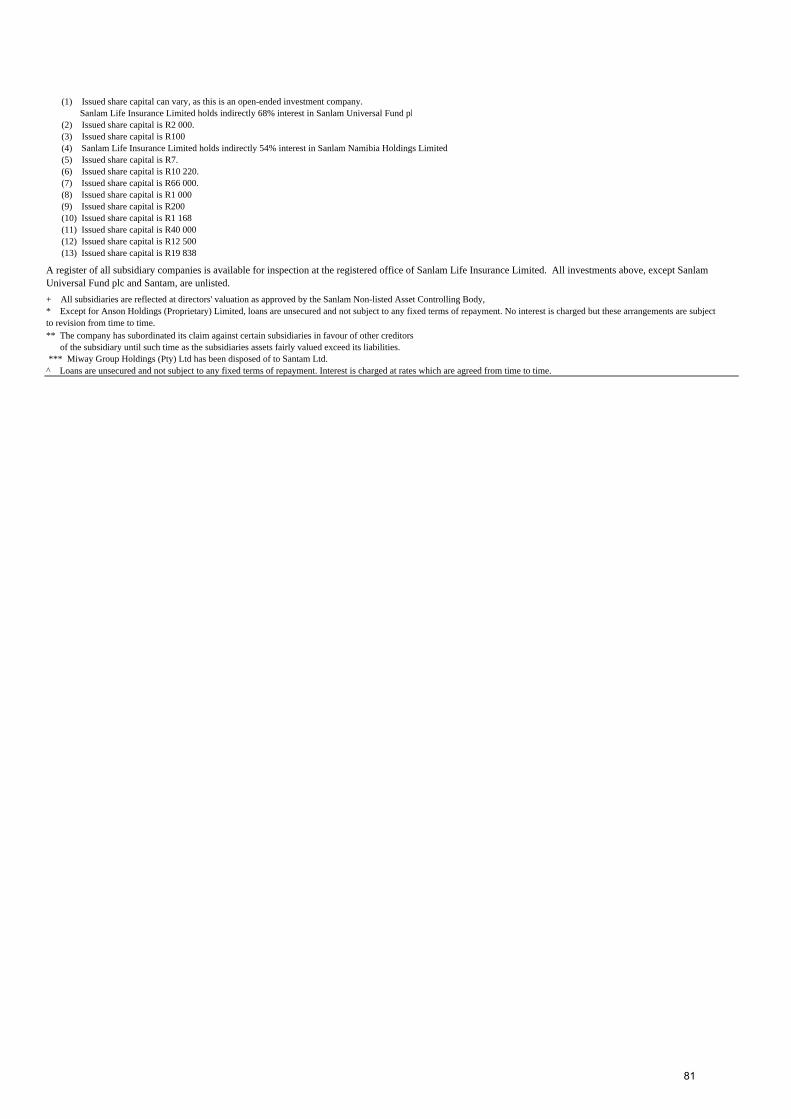
Sanlam Life Insurance Limited holds indirectly 68% interest in Sanlam Universal Fund pl
(4) Sanlam Life Insurance Limited holds indirectly 54% interest in Sanlam Namibia Holdings Limited
(8) Issued share capital is R1 000(9) Issued share capital is R200(10) Issued share capital is R1 168(11) Issued share capital is R40 000(12) Issued share capital is R12 500(13) Issued share capital is R19 838
+ All subsidiaries are reflected at directors' valuation as approved by the Sanlam Non-listed Asset Controlling Body,
** The company has subordinated its claim against certain subsidiaries in favour of other creditors of the subsidiary until such time as the subsidiaries assets fairly valued exceed its liabilities.*** Miway Group Holdings (Pty) Ltd has been disposed of to Santam Ltd.
^ Loans are unsecured and not subject to any fixed terms of repayment. Interest is charged at rates which are agreed from time to time.
* Except for Anson Holdings (Proprietary) Limited, loans are unsecured and not subject to any fixed terms of repayment. No interest is charged but these arrangements are subject to revision from time to time.
(1) Issued share capital can vary, as this is an open-ended investment company.
A register of all subsidiary companies is available for inspection at the registered office of Sanlam Life Insurance Limited. All investments above, except Sanlam Universal Fund plc and Santam, are unlisted.
(2) Issued share capital is R2 000.(3) Issued share capital is R100
(5) Issued share capital is R7.(6) Issued share capital is R10 220.(7) Issued share capital is R66 000.
81
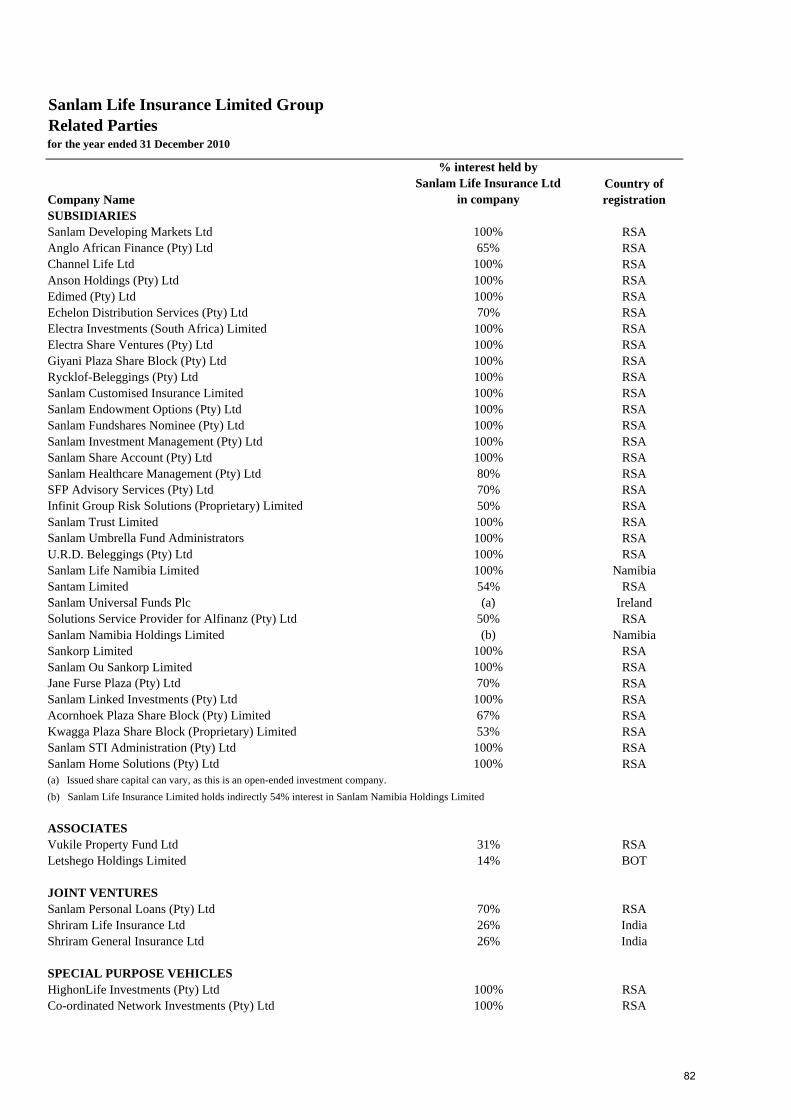
Sanlam Life Insurance Limited GroupRelated Partiesfor the year ended 31 December 2010
% interest held by Sanlam Life Insurance Ltd Country of
Company Name in company registrationSUBSIDIARIESSanlam Developing Markets Ltd 100% RSAAnglo African Finance (Pty) Ltd 65% RSAChannel Life Ltd 100% RSAAnson Holdings (Pty) Ltd 100% RSAEdimed (Pty) Ltd 100% RSAEchelon Distribution Services (Pty) Ltd 70% RSAElectra Investments (South Africa) Limited 100% RSAElectra Share Ventures (Pty) Ltd 100% RSAGiyani Plaza Share Block (Pty) Ltd 100% RSARycklof-Beleggings (Pty) Ltd 100% RSASanlam Customised Insurance Limited 100% RSASanlam Endowment Options (Pty) Ltd 100% RSASanlam Fundshares Nominee (Pty) Ltd 100% RSASanlam Investment Management (Pty) Ltd 100% RSASanlam Share Account (Pty) Ltd 100% RSASanlam Healthcare Management (Pty) Ltd 80% RSASFP Advisory Services (Pty) Ltd 70% RSAInfinit Group Risk Solutions (Proprietary) Limited 50% RSASanlam Trust Limited 100% RSASanlam Umbrella Fund Administrators 100% RSAU.R.D. Beleggings (Pty) Ltd 100% RSASanlam Life Namibia Limited 100% NamibiaSantam Limited 54% RSAS l U i l F d Pl ( ) I l dSanlam Universal Funds Plc (a) IrelandSolutions Service Provider for Alfinanz (Pty) Ltd 50% RSASanlam Namibia Holdings Limited (b) NamibiaSankorp Limited 100% RSASanlam Ou Sankorp Limited 100% RSAJane Furse Plaza (Pty) Ltd 70% RSASanlam Linked Investments (Pty) Ltd 100% RSAAcornhoek Plaza Share Block (Pty) Limited 67% RSAKwagga Plaza Share Block (Proprietary) Limited 53% RSASanlam STI Administration (Pty) Ltd 100% RSASanlam Home Solutions (Pty) Ltd 100% RSA(a) Issued share capital can vary, as this is an open-ended investment company.(b) Sanlam Life Insurance Limited holds indirectly 54% interest in Sanlam Namibia Holdings Limited
ASSOCIATESVukile Property Fund Ltd 31% RSALetshego Holdings Limited 14% BOT
JOINT VENTURESSanlam Personal Loans (Pty) Ltd 70% RSAShriram Life Insurance Ltd 26% IndiaShriram General Insurance Ltd 26% India
SPECIAL PURPOSE VEHICLESHighonLife Investments (Pty) Ltd 100% RSACo-ordinated Network Investments (Pty) Ltd 100% RSA
82
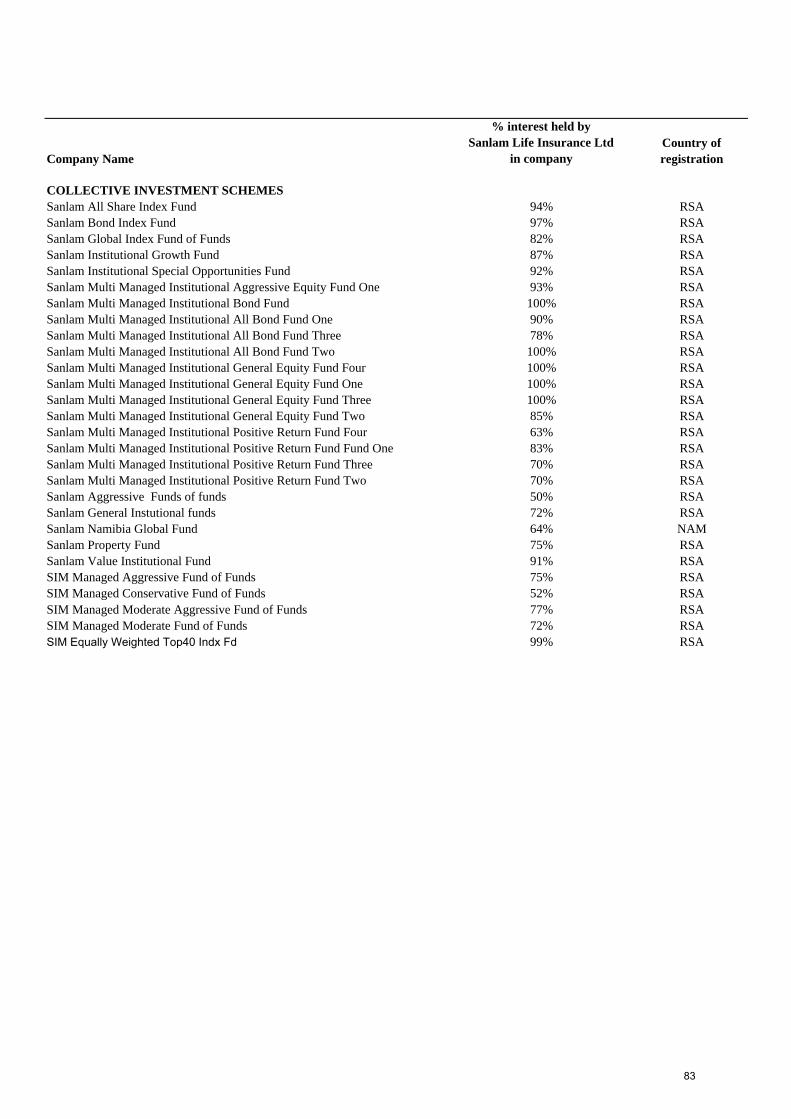
% interest held by Sanlam Life Insurance Ltd Country of
Company Name in company registration
COLLECTIVE INVESTMENT SCHEMESSanlam All Share Index Fund 94% RSASanlam Bond Index Fund 97% RSASanlam Global Index Fund of Funds 82% RSASanlam Institutional Growth Fund 87% RSASanlam Institutional Special Opportunities Fund 92% RSASanlam Multi Managed Institutional Aggressive Equity Fund One 93% RSASanlam Multi Managed Institutional Bond Fund 100% RSASanlam Multi Managed Institutional All Bond Fund One 90% RSASanlam Multi Managed Institutional All Bond Fund Three 78% RSASanlam Multi Managed Institutional All Bond Fund Two 100% RSASanlam Multi Managed Institutional General Equity Fund Four 100% RSASanlam Multi Managed Institutional General Equity Fund One 100% RSASanlam Multi Managed Institutional General Equity Fund Three 100% RSASanlam Multi Managed Institutional General Equity Fund Two 85% RSASanlam Multi Managed Institutional Positive Return Fund Four 63% RSASanlam Multi Managed Institutional Positive Return Fund Fund One 83% RSASanlam Multi Managed Institutional Positive Return Fund Three 70% RSASanlam Multi Managed Institutional Positive Return Fund Two 70% RSASanlam Aggressive Funds of funds 50% RSASanlam General Instutional funds 72% RSASanlam Namibia Global Fund 64% NAMSanlam Property Fund 75% RSASanlam Value Institutional Fund 91% RSASIM Managed Aggressive Fund of Funds 75% RSASIM Managed Conservative Fund of Funds 52% RSAgSIM Managed Moderate Aggressive Fund of Funds 77% RSASIM Managed Moderate Fund of Funds 72% RSASIM Equally Weighted Top40 Indx Fd 99% RSA
83
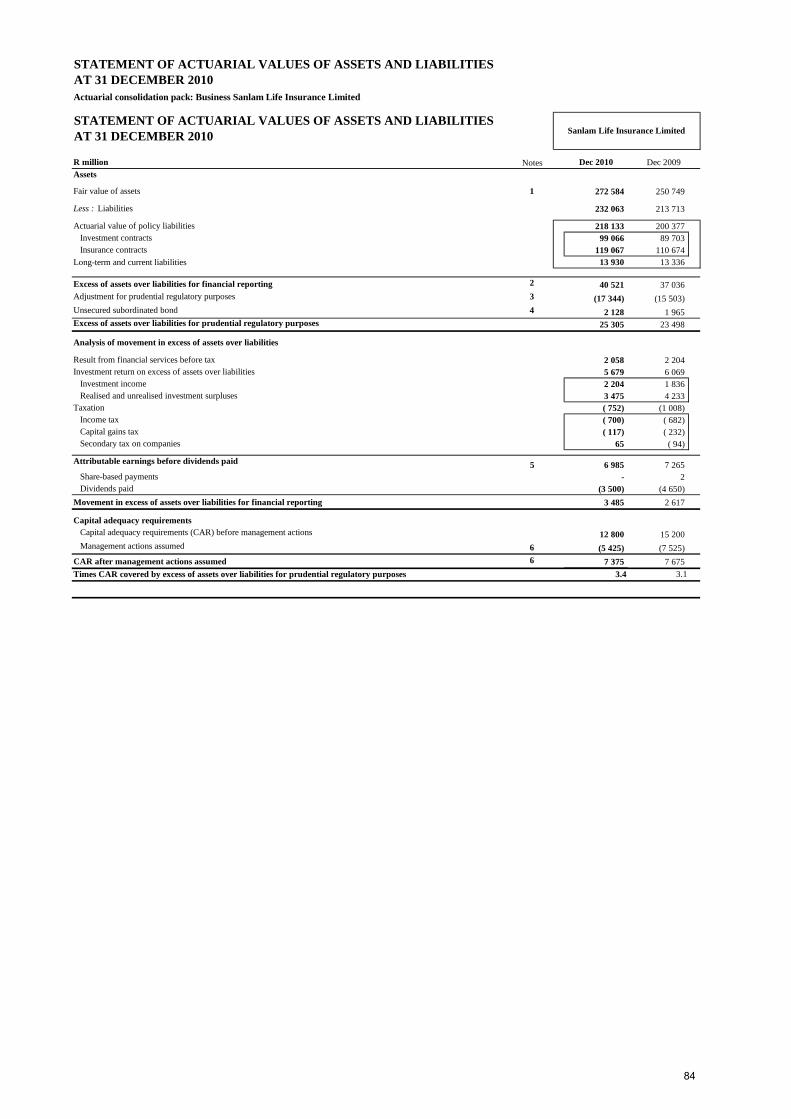
STATEMENT OF ACTUARIAL VALUES OF ASSETS AND LIABILITIESAT 31 DECEMBER 2010Actuarial consolidation pack: Business Sanlam Life Insurance Limited
STATEMENT OF ACTUARIAL VALUES OF ASSETS AND LIABILITIES AT 31 DECEMBER 2010
R million Notes Dec 2010 Dec 2009Assets
Fair value of assets 1 272 584 250 749
Less : Liabilities 232 063 213 713
Actuarial value of policy liabilities 218 133 200 377 Investment contracts 99 066 89 703 Insurance contracts 119 067 110 674
Long-term and current liabilities 13 930 13 336
Excess of assets over liabilities for financial reporting 2 40 521 37 036 Adjustment for prudential regulatory purposes 3 (17 344) (15 503) Unsecured subordinated bond 4 2 128 1 965 Excess of assets over liabilities for prudential regulatory purposes 25 305 23 498
Result from financial services before tax 2 058 2 204 Investment return on excess of assets over liabilities 5 679 6 069
Investment income 2 204 1 836 Realised and unrealised investment surpluses 3 475 4 233
Taxation ( 752) (1 008) Income tax ( 700) ( 682) Capital gains tax ( 117) ( 232) Secondary tax on companies 65 ( 94)
Attributable earnings before dividends paid 5 6 985 7 265 Share-based payments - 2 Dividends paid (3 500) (4 650)
Movement in excess of assets over liabilities for financial reporting 3 485 2 617
Capital adequacy requirementsCapital adequacy requirements (CAR) before management actions 12 800 15 200 Management actions assumed 6 (5 425) (7 525)
CAR after management actions assumed 6 7 375 7 675
Analysis of movement in excess of assets over liabilities
Sanlam Life Insurance Limited
CAR after management actions assumed 6 7 375 7 675 Times CAR covered by excess of assets over liabilities for prudential regulatory purposes 3.4 3.1
Required Capital allocated to covered business - -
84
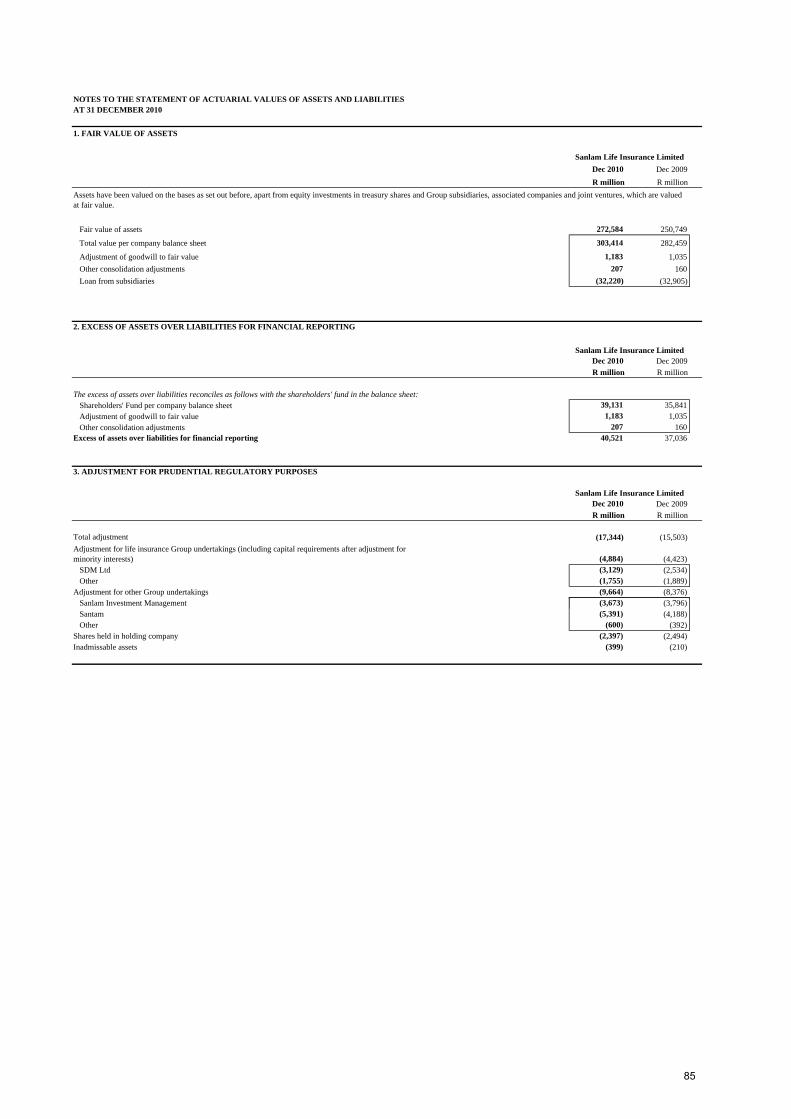
NOTES TO THE STATEMENT OF ACTUARIAL VALUES OF ASSETS AND LIABILITIES AT 31 DECEMBER 2010
1. FAIR VALUE OF ASSETS
Dec 2010 Dec 2009R million R million
Fair value of assets 272,584 250,749
Total value per company balance sheet 303,414 282,459
Adjustment of goodwill to fair value 1,183 1,035 Other consolidation adjustments 207 160 Loan from subsidiaries (32,220) (32,905)
2. EXCESS OF ASSETS OVER LIABILITIES FOR FINANCIAL REPORTING
Dec 2010 Dec 2009R million R million
39,131 35,841 1,183 1,035 207 160
Excess of assets over liabilities for financial reporting 40,521 37,036
3. ADJUSTMENT FOR PRUDENTIAL REGULATORY PURPOSES
Dec 2010 Dec 2009R million R million
check - -Total adjustment (17,344) (15,503)Adjustment for life insurance Group undertakings (including capital requirements after adjustment for minority interests) (4,884) (4,423)
SDM Ltd (3,129) (2,534)Other (1,755) (1,889)
Adjustment for other Group undertakings (9,664) (8,376)l (3 6 3) ( )
Shareholders' Fund per company balance sheetAdjustment of goodwill to fair valueOther consolidation adjustments
Sanlam Life Insurance Limited
Sanlam Life Insurance Limited
Assets have been valued on the bases as set out before, apart from equity investments in treasury shares and Group subsidiaries, associated companies and joint ventures, which are valued at fair value.
The excess of assets over liabilities reconciles as follows with the shareholders' fund in the balance sheet:
Sanlam Life Insurance Limited
Sanlam Investment Management (3,673) (3,796)Santam (5,391) (4,188)Other (600) (392)
Shares held in holding company (2,397) (2,494)Inadmissable assets (399) (210)
85
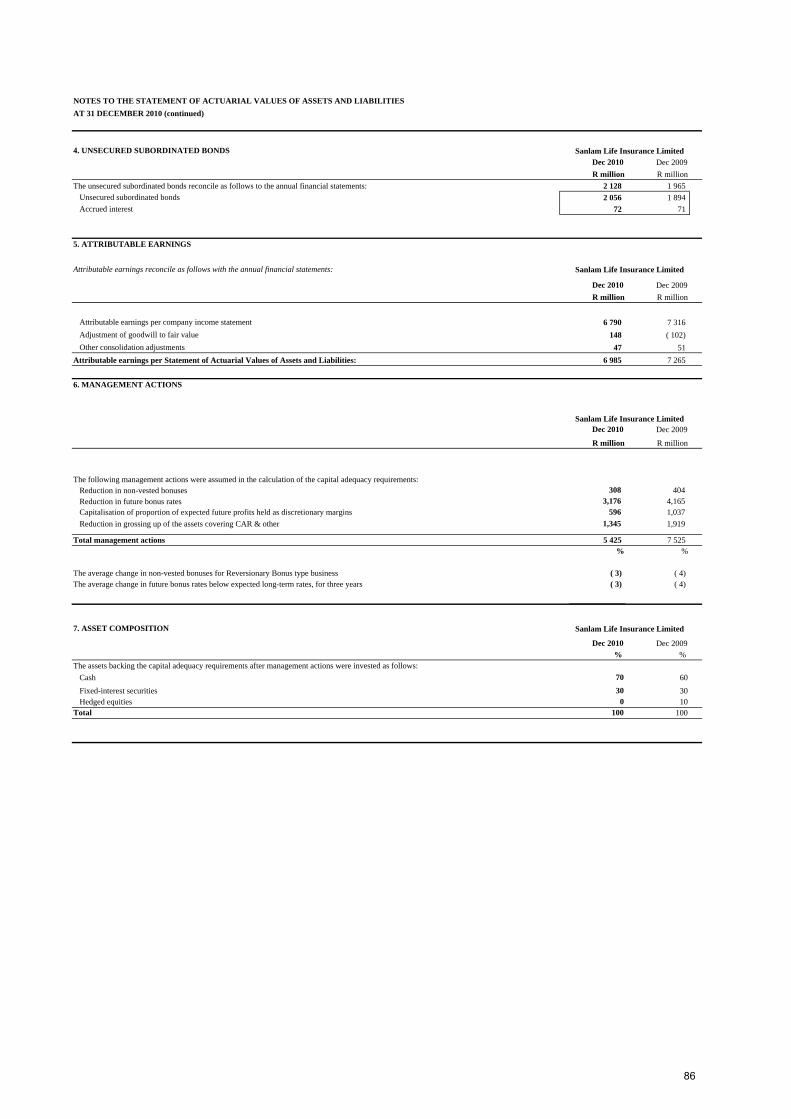
NOTES TO THE STATEMENT OF ACTUARIAL VALUES OF ASSETS AND LIABILITIES
4. UNSECURED SUBORDINATED BONDSDec 2010 Dec 2009R million R million
The unsecured subordinated bonds reconcile as follows to the annual financial statements: 2 128 1 965 Unsecured subordinated bonds 2 056 1 894 Accrued interest 72 71
5. ATTRIBUTABLE EARNINGS
Attributable earnings reconcile as follows with the annual financial statements:
Dec 2010 Dec 2009R million R million
Attributable earnings per company income statement 6 790 7 316 Adjustment of goodwill to fair value 148 ( 102) Other consolidation adjustments 47 51
6 985 7 265
6. MANAGEMENT ACTIONS
Dec 2010 Dec 2009
R million R million
308 404 3,176 4,165
Capitalisation of proportion of expected future profits held as discretionary margins 596 1,037 Reduction in grossing up of the assets covering CAR & other 1,345 1,919
5 425 7 525 % %
( 3) ( 4) ( 3) ( 4)
Reduction in non-vested bonuses
Sanlam Life Insurance Limited
AT 31 DECEMBER 2010 (continued)
Sanlam Life Insurance Limited
Attributable earnings per Statement of Actuarial Values of Assets and Liabilities:
Reduction in future bonus rates
Sanlam Life Insurance Limited
Total management actions
The average change in non-vested bonuses for Reversionary Bonus type businessThe average change in future bonus rates below expected long-term rates, for three years
The following management actions were assumed in the calculation of the capital adequacy requirements:
7. ASSET COMPOSITION
Dec 2010 Dec 2009% %
Cash 70 60Fixed-interest securities 30 30Hedged equities 0 10
Total 100 100check ok ok
Sanlam Life Insurance Limited
The assets backing the capital adequacy requirements after management actions were invested as follows:
86
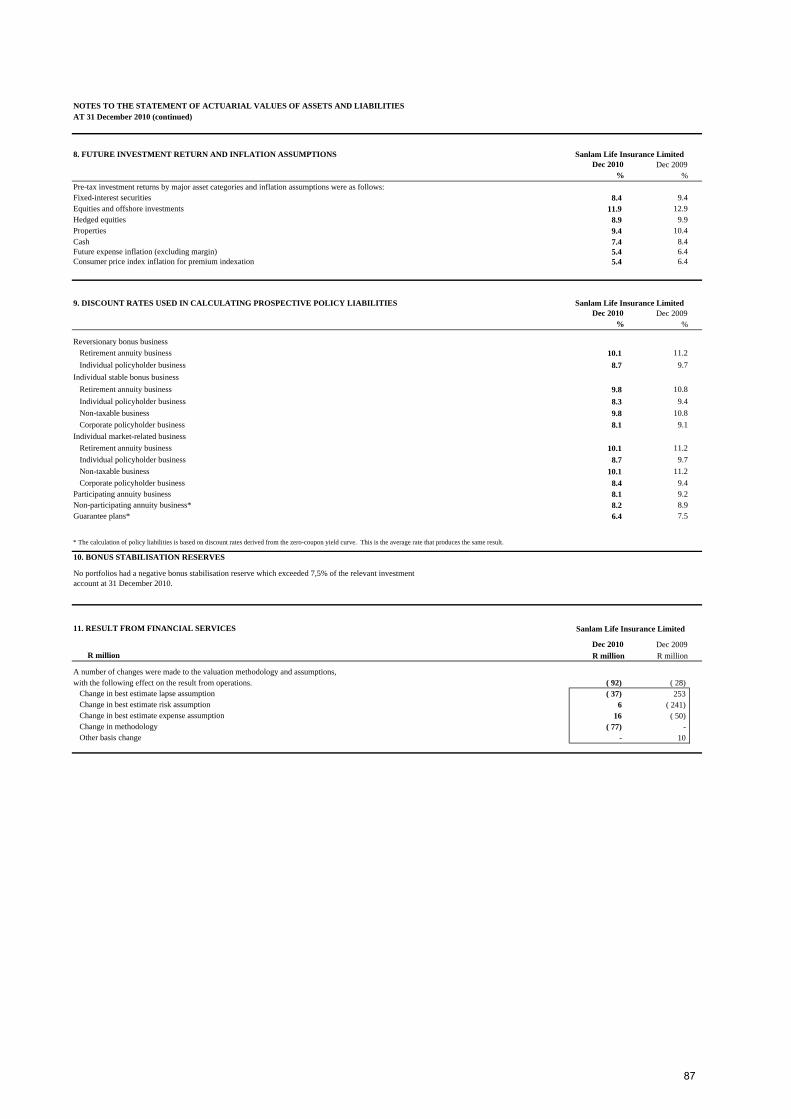
NOTES TO THE STATEMENT OF ACTUARIAL VALUES OF ASSETS AND LIABILITIES
8. FUTURE INVESTMENT RETURN AND INFLATION ASSUMPTIONS Dec 2010 Dec 2009
% %
Fixed-interest securities 8.4 9.4Equities and offshore investments 11.9 12.9Hedged equities 8.9 9.9Properties 9.4 10.4Cash 7.4 8.4Future expense inflation (excluding margin) 5.4 6.4Consumer price index inflation for premium indexation 5.4 6.4
9. DISCOUNT RATES USED IN CALCULATING PROSPECTIVE POLICY LIABILITIESDec 2010 Dec 2009
% %
Retirement annuity business 10.1 11.2Individual policyholder business 8.7 9.7
Individual stable bonus businessRetirement annuity business 9.8 10.8Individual policyholder business 8.3 9.4Non-taxable business 9.8 10.8Corporate policyholder business 8.1 9.1
Individual market-related businessRetirement annuity business 10.1 11.2Individual policyholder business 8.7 9.7Non-taxable business 10.1 11.2Corporate policyholder business 8.4 9.4
Participating annuity business 8.1 9.2Non-participating annuity business* 8.2 8.9Guarantee plans* 6.4 7.5
10. BONUS STABILISATION RESERVES
No portfolios had a negative bonus stabilisation reserve which exceeded 7,5% of the relevant investment account at 31 December 2010.
* The calculation of policy liabilities is based on discount rates derived from the zero-coupon yield curve. This is the average rate that produces the same result.
Sanlam Life Insurance Limited
Pre-tax investment returns by major asset categories and inflation assumptions were as follows:
Sanlam Life Insurance Limited
Reversionary bonus business
AT 31 December 2010 (continued)
11. RESULT FROM FINANCIAL SERVICES
Dec 2010 Dec 2009 R million R million R million
( 92) ( 28) Change in best estimate lapse assumption ( 37) 253 Change in best estimate risk assumption 6 ( 241) Change in best estimate expense assumption 16 ( 50) Change in methodology ( 77) - Other basis change - 10
Sanlam Life Insurance Limited
with the following effect on the result from operations.A number of changes were made to the valuation methodology and assumptions,
87
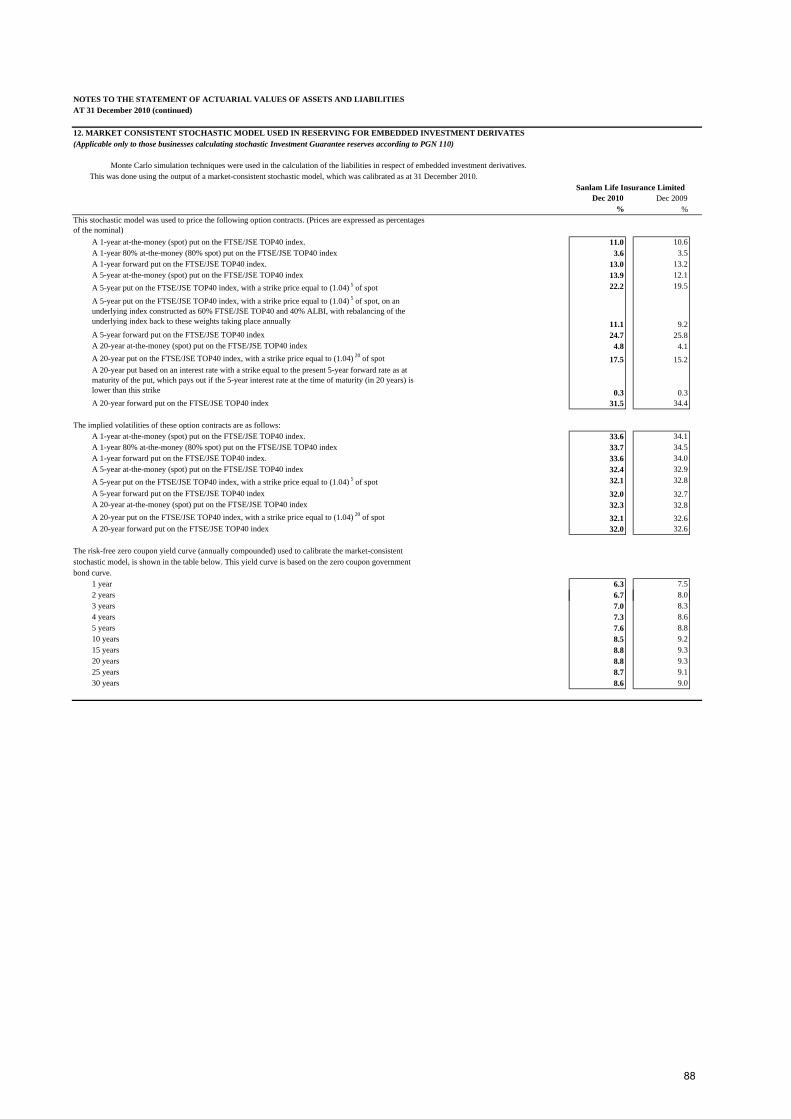
NOTES TO THE STATEMENT OF ACTUARIAL VALUES OF ASSETS AND LIABILITIES
Dec 2010 Dec 2009% %
This stochastic model was used to price the following option contracts. (Prices are expressed as percentages of the nominal)
A 1-year at-the-money (spot) put on the FTSE/JSE TOP40 index. 11.0 10.6A 1-year 80% at-the-money (80% spot) put on the FTSE/JSE TOP40 index 3.6 3.5A 1-year forward put on the FTSE/JSE TOP40 index. 13.0 13.2A 5-year at-the-money (spot) put on the FTSE/JSE TOP40 index 13.9 12.1A 5-year put on the FTSE/JSE TOP40 index, with a strike price equal to (1.04) 5 of spot 22.2 19.5
A 5-year put on the FTSE/JSE TOP40 index, with a strike price equal to (1.04) 5 of spot, on an underlying index constructed as 60% FTSE/JSE TOP40 and 40% ALBI, with rebalancing of the underlying index back to these weights taking place annually 11.1 9.2A 5-year forward put on the FTSE/JSE TOP40 index 24.7 25.8A 20-year at-the-money (spot) put on the FTSE/JSE TOP40 index 4.8 4.1A 20-year put on the FTSE/JSE TOP40 index, with a strike price equal to (1.04) 20 of spot 17.5 15.2A 20-year put based on an interest rate with a strike equal to the present 5-year forward rate as at maturity of the put, which pays out if the 5-year interest rate at the time of maturity (in 20 years) is lower than this strike 0.3 0.3A 20-year forward put on the FTSE/JSE TOP40 index 31.5 34.4
The implied volatilities of these option contracts are as follows:A 1-year at-the-money (spot) put on the FTSE/JSE TOP40 index. 33.6 34.1A 1-year 80% at-the-money (80% spot) put on the FTSE/JSE TOP40 index 33.7 34.5A 1-year forward put on the FTSE/JSE TOP40 index. 33.6 34.0A 5-year at-the-money (spot) put on the FTSE/JSE TOP40 index 32.4 32.9A 5-year put on the FTSE/JSE TOP40 index, with a strike price equal to (1.04) 5 of spot 32.1 32.8A 5-year forward put on the FTSE/JSE TOP40 index 32.0 32.7A 20-year at-the-money (spot) put on the FTSE/JSE TOP40 index 32.3 32.8A 20-year put on the FTSE/JSE TOP40 index, with a strike price equal to (1.04) 20 of spot 32.1 32.6A 20-year forward put on the FTSE/JSE TOP40 index 32.0 32.6
The risk-free zero coupon yield curve (annually compounded) used to calibrate the market-consistentstochastic model, is shown in the table below. This yield curve is based on the zero coupon governmentbond curve.
1 year 6.3 7.52 years 6.7 8.0
Sanlam Life Insurance Limited
AT 31 December 2010 (continued)
(Applicable only to those businesses calculating stochastic Investment Guarantee reserves according to PGN 110)12. MARKET CONSISTENT STOCHASTIC MODEL USED IN RESERVING FOR EMBEDDED INVESTMENT DERIVATES
Monte Carlo simulation techniques were used in the calculation of the liabilities in respect of embedded investment derivatives. This was done using the output of a market-consistent stochastic model, which was calibrated as at 31 December 2010.
y3 years 7.0 8.34 years 7.3 8.65 years 7.6 8.810 years 8.5 9.215 years 8.8 9.320 years 8.8 9.325 years 8.7 9.130 years 8.6 9.0
88
CAPITAL & RISK MANAGEMENT REPORT e CONTENTS Page
CAPITAL MANAGEMENT
Capital allocation methodology 90 Capital management 90
Covered business Other Group operations Group Capital Committee Discretionary capital
Capital adequacy 91 Credit rating 93 Risk management
RISK MANAGEMENT
Governance structure 94 Group risk policies and guidelines 96 Risk types 98 Risk management: general risks 100 Risk management: by business area 103
89
OBJECTIVE
CAPITAL MANAGEMENT
Effective capital management is an essential component of meeting the Group’s strategic objective of maximising shareholder value. The capital value used by the Group as the primary performance measurement base is Group Equity Value (GEV).The management of the Group’s capital base requires a continuous review of optimal capital levels, including the use of alternative sources of funding, to maximise return on GEV. The Group has an integrated capital and risk management approach. The amount of capital required by the various businesses is directly linked to their exposure to financial and operational risks. Risk management is accordingly an important component of effective capital management. Full information on the Sanlam Limited’s Group Equity Value is provided in the Sanlam Limited annual report. Capital allocation methodology Group businesses are each allocated an optimal level of capital and are measured against appropriate return hurdles. The following methodology is used to determine the allocation of required capital to covered business: The level and nature of the supporting capital is determined by minimum regulatory capital requirements as well as economic, risk and growth considerations. Regulatory capital must comply with specific requirements. For Sanlam Life a stochastic modelling process is used to assist in determining long-term required capital levels that, within a 95% confidence level, will be able to cover the minimum statutory capital adequacy requirement (CAR) at least 1,5 times over each of the next 10 year-ends. For the other smaller life insurers the Group sets supporting capital levels as a multiple of their respective regulatory capital adequacy requirements. The fair value of other Group operations includes the working capital allocated to the respective operations. The Group’s approach to ensure appropriate working capital levels in these operations is twofold: 1. The Group’s internal dividend policy is based on the annual declaration of all discretionary capital that is
not required for normal operations or expansion; and 2. Performance targets are set for other Group operations based on an expected return on the fair value of the
businesses, equal to their internal hurdle rates. This ensures that all non-productive working capital is declared as a dividend to the Group.
Capital management Covered business (life insurance operations) The Group’s covered business requires significantly higher levels of allocated capital than the other Group operations. The optimisation of long-term required capital is accordingly a primary focus area of the Group’s capital management philosophy given the significant potential to enhance shareholder value. The following main strategies are used to achieve this objective: Appropriate matching of assets and liabilities for policyholder solutions. This is especially important for long-
duration policyholder solutions that expose the Group to interest rate risk, e.g. non-participating annuities. Managing the impact of new business on capital requirements by limiting volumes of capital-intensive new
business. The asset mix of the long-term required capital also impacts the overall capital requirement. An increased
exposure to hedged equity and interest-bearing instruments reduces the volatility of the capital base and accordingly also the capital requirement. Over the longer term, the expected investment return on these instruments is however lower than equity with a potential negative impact on the return on GEV. There is accordingly a trade-off between lower capital levels and the return on capital. The Group’s stochastic capital model is used as input to determine the optimal asset mix in this regard.
90
The introduction of long-term debt into the life insurance operations’ capital structure and the concurrent investment of the proceeds in bonds and other liquid assets, to reduce the volatility in the regulatory capital base with a consequential lower overall capital requirement.
Management of operational risk. Internal controls and various other operational risk management processes are used to reduce operational risk and commensurately the allowance for this risk in the calculation of required capital.
The Group continues to improve and further develop its capital management models and processes in line with international best practice and the current significant international and South African developments surrounding solvency and capital requirements. Other Group operations The performance measurement of other Group operations is based on the return achieved on the fair value of the businesses. Risk-adjusted return targets are set for the businesses to ensure that each business’ return target takes cognisance of the inherent risks in the business. This approach ensures that the management teams are focused on operational strategies that will optimise the return on fair value, thereby contributing to the Group’s main objective of optimising return on GEV. Group Capital Committee The Group Capital committee, an internal management committee, is responsible to review and oversee the management of the Group’s capital base in terms of the specific strategies approved by the Board. Discretionary capital Any capital in excess of requirements, and not optimally utilised, is identified on a continuous basis. The pursuit of structural growth initiatives has been set as the preferred application of Group capital, subject to such initiatives yielding the applicable hurdle rate and being complementary to or in support of Group strategy. Any discretionary capital not being efficiently redeployed, will be returned to shareholders in the most effective form. Capital adequacy Capital adequacy for the South African operations is measured with reference to the cover provided by the Group’s prudential regulatory capital in relation to the Capital Adequacy Requirements.
The valuation of assets and policy liabilities for prudential capital adequacy purposes is generally in line with the methodology for the published results. Some adjustments are however required, as set out below. Reinsurance
Policy liabilities are valued net of reinsurance and the reinsurance asset is eliminated. Investment contracts with investment management services
The liabilities are set equal to the retrospectively accumulated fair value of the underlying assets less unrecouped expenses (set equal to the deferred acquisition cost (DAC) asset) in the case of individual business. These retrospective liabilities are higher than the prospective liabilities calculated as the present value of expected future benefits and expenses less future premiums at the relevant discount rates.
The DAC asset is eliminated. Group undertakings and inadmissible assets
The value of assets is reduced by taking into account the prescribed valuation bases for Group undertakings and to eliminate inadmissible assets (as defined in the relevant prudential regulations). Capital Adequacy Requirements (CAR)
The excess of assets over liabilities of life insurance operations on the prudential regulatory basis should be sufficient to cover the CAR in terms of the relevant regulations as well as professional guidance notes issued by the Actuarial
91
Society in South Africa. The CAR provides a buffer against experience worse than that assumed in the valuation of assets and liabilities.
On the valuation date, the ordinary CAR was used for the South African operations as they exceeded the termination and minimum CAR.
The largest element of the CAR relates to stabilised bonus business. Consistent with an assumed fall in the fair value of the assets (the “resilience scenario”), which is prescribed in the actuarial guidance notes, the calculation of the CAR takes into account a reduction in non-vesting bonuses and future bonus rates and for the capitalisation of some expected future profits (resulting from discretionary margins in the valuation basis and held as part of the liabilities).
At 31 December 2010, the resilience scenario assumes that: Equity values decline by 30.0%; Property values decline by 15%; Fixed interest yields and inflation-linked real yields increase or decrease by 25% of the nominal or real yields
(whichever gives the highest total capital adequacy requirements); and Assets denominated in foreign currencies decline by at least 20%
on the valuation date and do not subsequently recover within the short term. Provision is made for credit and operational risk in the calculation of the CAR. The excess of the actuarial values of assets over liabilities for the main life insurance holding companies is disclosed in the table below. The values disclosed for Sanlam Life capture the solvency position of the entire Sanlam Life Group, including subsidiaries such as Sanlam Life Namibia, SDM Limited, Channel Life and Botswana Insurance Holdings. All subsidiaries of Sanlam Life were adequately capitalised.
92
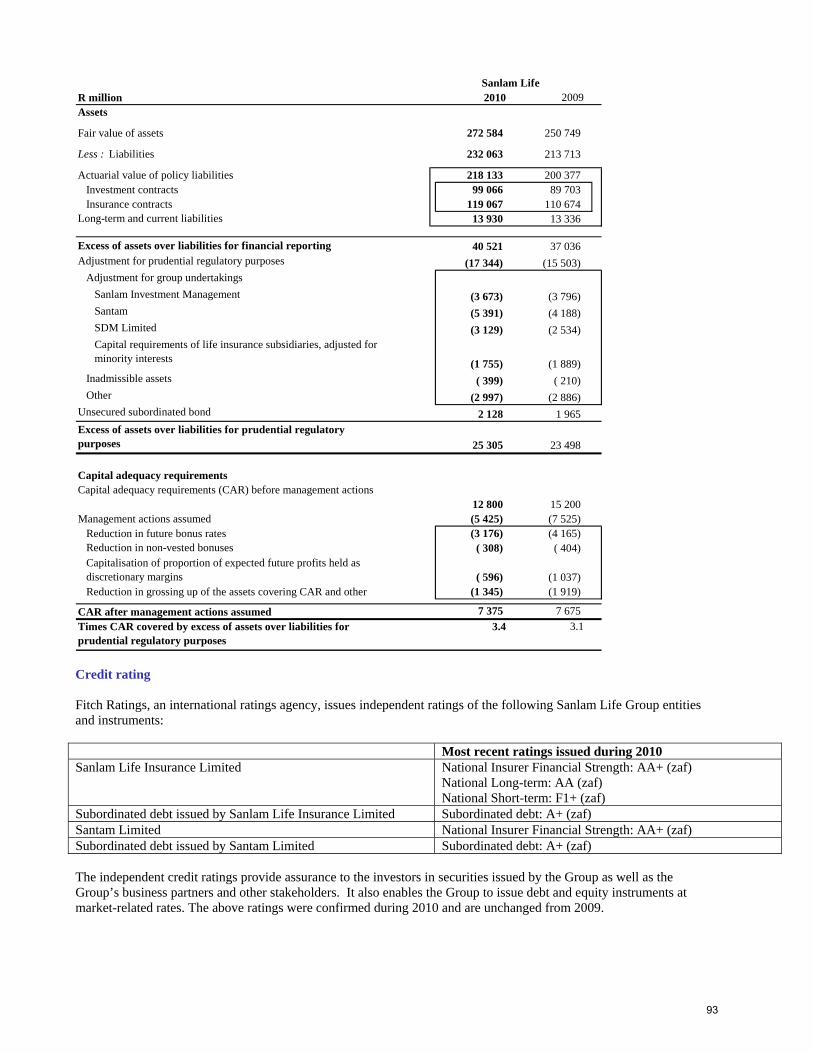
R million 2010 2009Assets
Fair value of assets 272 584 250 749
Less : Liabilities 232 063 213 713
Actuarial value of policy liabilities 218 133 200 377 Investment contracts 99 066 89 703 Insurance contracts 119 067 110 674
Long-term and current liabilities 13 930 13 336
Excess of assets over liabilities for financial reporting 40 521 37 036 Adjustment for prudential regulatory purposes (17 344) (15 503)
Adjustment for group undertakingsSanlam Investment Management (3 673) (3 796) Santam (5 391) (4 188) SDM Limited (3 129) (2 534) Capital requirements of life insurance subsidiaries, adjusted for minority interests (1 755) (1 889)
Inadmissible assets ( 399) ( 210) Other (2 997) (2 886)
Unsecured subordinated bond 2 128 1 965 Excess of assets over liabilities for prudential regulatory purposes 25 305 23 498
Capital adequacy requirementsCapital adequacy requirements (CAR) before management actions
12 800 15 200 Management actions assumed (5 425) (7 525)
(3 176) (4 165) Reduction in non-vested bonuses ( 308) ( 404) Capitalisation of proportion of expected future profits held as discretionary margins ( 596) (1 037)
(1 345) (1 919)
CAR after management actions assumed 7 375 7 675 Times CAR covered by excess of assets over liabilities for prudential regulatory purposes
3.4 3.1
Reduction in future bonus rates
Reduction in grossing up of the assets covering CAR and other
Sanlam Life
Credit rating Fitch Ratings, an international ratings agency, issues independent ratings of the following Sanlam Life Group entities and instruments: Most recent ratings issued during 2010 Sanlam Life Insurance Limited National Insurer Financial Strength: AA+ (zaf)
National Long-term: AA (zaf) National Short-term: F1+ (zaf)
Subordinated debt issued by Sanlam Life Insurance Limited Subordinated debt: A+ (zaf) Santam Limited National Insurer Financial Strength: AA+ (zaf) Subordinated debt issued by Santam Limited Subordinated debt: A+ (zaf) The independent credit ratings provide assurance to the investors in securities issued by the Group as well as the Group’s business partners and other stakeholders. It also enables the Group to issue debt and equity instruments at market-related rates. The above ratings were confirmed during 2010 and are unchanged from 2009.
93
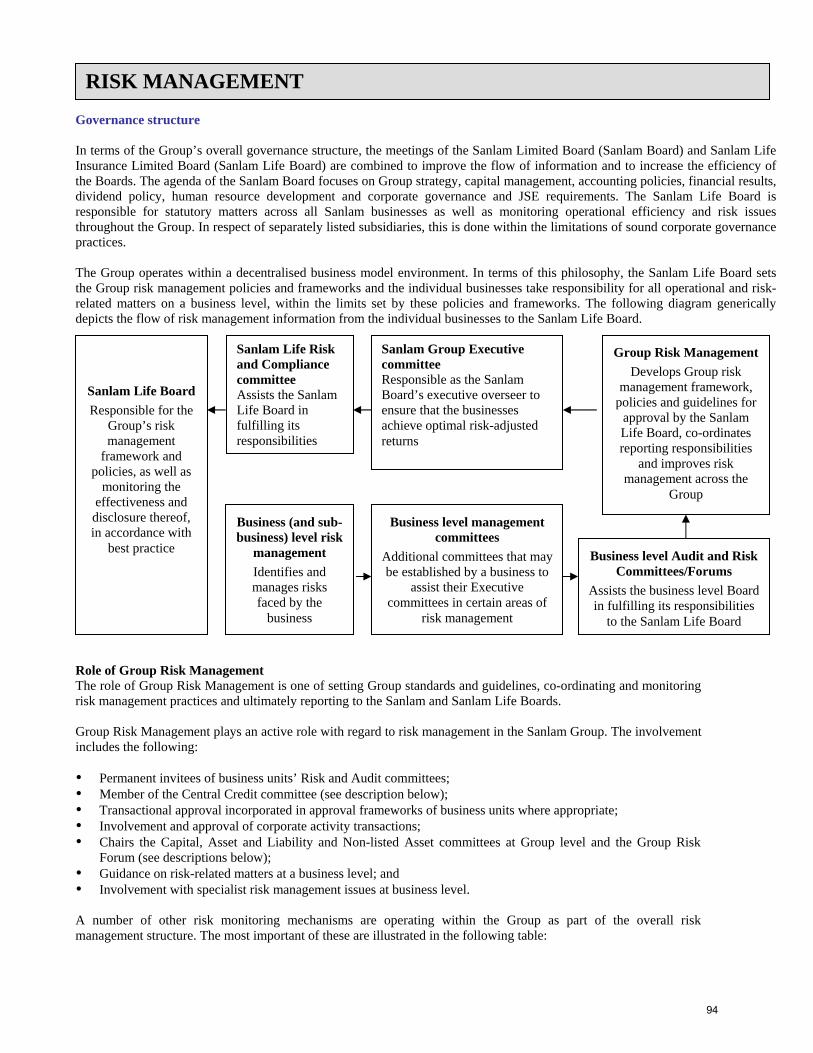
RISK MANAGEMENT
Governance structure In terms of the Group’s overall governance structure, the meetings of the Sanlam Limited Board (Sanlam Board) and Sanlam Life Insurance Limited Board (Sanlam Life Board) are combined to improve the flow of information and to increase the efficiency of the Boards. The agenda of the Sanlam Board focuses on Group strategy, capital management, accounting policies, financial results, dividend policy, human resource development and corporate governance and JSE requirements. The Sanlam Life Board is responsible for statutory matters across all Sanlam businesses as well as monitoring operational efficiency and risk issues throughout the Group. In respect of separately listed subsidiaries, this is done within the limitations of sound corporate governance practices. The Group operates within a decentralised business model environment. In terms of this philosophy, the Sanlam Life Board sets the Group risk management policies and frameworks and the individual businesses take responsibility for all operational and risk-related matters on a business level, within the limits set by these policies and frameworks. The following diagram generically depicts the flow of risk management information from the individual businesses to the Sanlam Life Board.
Group Risk Management Develops Group risk
management framework, policies and guidelines for
approval by the Sanlam Life Board, co-ordinates reporting responsibilities
and improves risk management across the
Group
Business level Audit and Risk Committees/Forums
Assists the business level Board in fulfilling its responsibilities
to the Sanlam Life Board
Business level management committees
Additional committees that may be established by a business to
assist their Executive committees in certain areas of
risk management
Business (and sub-business) level risk
management Identifies and manages risks faced by the
business
Sanlam Life Risk and Compliance committee Assists the Sanlam Life Board in fulfilling its responsibilities
Sanlam Group Executive committee Responsible as the Sanlam Board’s executive overseer to ensure that the businesses achieve optimal risk-adjusted returns
Sanlam Life Board Responsible for the
Group’s risk management
framework and policies, as well as
monitoring the effectiveness and disclosure thereof, in accordance with
best practice
Role of Group Risk Management The role of Group Risk Management is one of setting Group standards and guidelines, co-ordinating and monitoring risk management practices and ultimately reporting to the Sanlam and Sanlam Life Boards. Group Risk Management plays an active role with regard to risk management in the Sanlam Group. The involvement includes the following: Permanent invitees of business units’ Risk and Audit committees; Member of the Central Credit committee (see description below); Transactional approval incorporated in approval frameworks of business units where appropriate; Involvement and approval of corporate activity transactions; Chairs the Capital, Asset and Liability and Non-listed Asset committees at Group level and the Group Risk
Forum (see descriptions below); Guidance on risk-related matters at a business level; and Involvement with specialist risk management issues at business level.
A number of other risk monitoring mechanisms are operating within the Group as part of the overall risk management structure. The most important of these are illustrated in the following table:
94
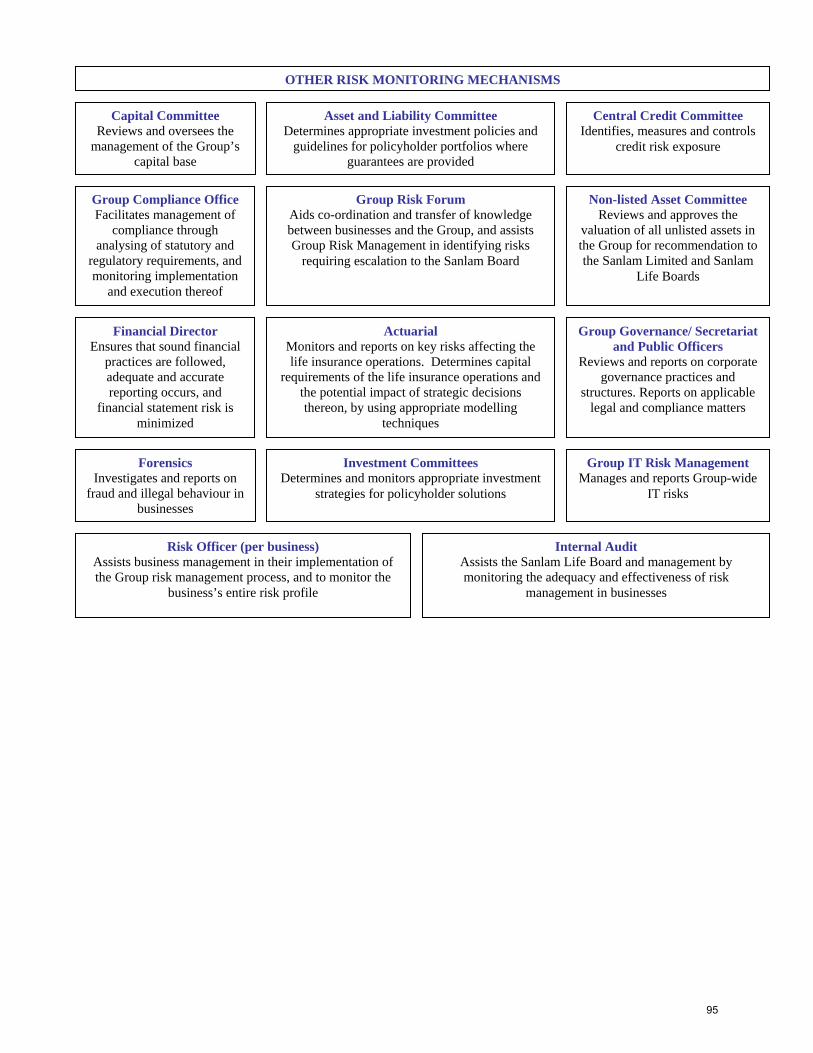
OTHER RISK MONITORING MECHANISMS
Capital Committee Reviews and oversees the
management of the Group’s capital base
Asset and Liability Committee Determines appropriate investment policies and
guidelines for policyholder portfolios where guarantees are provided
Central Credit Committee Identifies, measures and controls
credit risk exposure
Group Compliance Office Facilitates management of
compliance through analysing of statutory and
regulatory requirements, and monitoring implementation
and execution thereof
Group Risk Forum Aids co-ordination and transfer of knowledge between businesses and the Group, and assists Group Risk Management in identifying risks
requiring escalation to the Sanlam Board
Non-listed Asset Committee Reviews and approves the
valuation of all unlisted assets in the Group for recommendation to the Sanlam Limited and Sanlam
Life Boards
Financial Director Ensures that sound financial
practices are followed, adequate and accurate reporting occurs, and
financial statement risk is minimized
Actuarial Monitors and reports on key risks affecting the life insurance operations. Determines capital
requirements of the life insurance operations and the potential impact of strategic decisions thereon, by using appropriate modelling
techniques
Group Governance/ Secretariat and Public Officers
Reviews and reports on corporate governance practices and
structures. Reports on applicable legal and compliance matters
Forensics Investigates and reports on
fraud and illegal behaviour in businesses
Investment Committees Determines and monitors appropriate investment
strategies for policyholder solutions
Group IT Risk Management Manages and reports Group-wide
IT risks
Risk Officer (per business) Assists business management in their implementation of the Group risk management process, and to monitor the
business’s entire risk profile
Internal Audit Assists the Sanlam Life Board and management by monitoring the adequacy and effectiveness of risk
management in businesses
95
Group risk policies, standards and guidelines The main policies, standards and guidelines are: The Sanlam Group Enterprise Risk Management (ERM) policy and plan; Sanlam Group Risk Escalation policy; Sanlam Group Business Continuity Management policy; Definitions of Risk categories standard; Risk Appetite guidance note; Sanlam Group Risk Appetite Statement; Sanlam Risk Management Maturity Model; Sanlam Life Risk and Compliance committee charter; and Group Risk forum terms of reference.
A standard endeavours to ensure consistent use of terminology. [Key A guidance note is aimed at providing information.]
: A policy sets out mandatory minimum standards for all businesses.
The following also cover aspects with linkage to risk management: Sanlam Group Information and Information Technology (I and IT) Risk Management policy; Representations from Group businesses to the Sanlam and Sanlam Life Audit, Actuarial and Finance
committees; Sanlam Corporate Credit Risk strategy and policy; Sanlam Financial Crime Combating policy; Sanlam Human Resources policies; Sanlam Group governance structures; Sanlam Life Insurance Audit, Actuarial and Finance committee charter.
Sanlam Group Enterprise Risk Management policy The Group ERM policy includes the following main components:
• The broad objectives and philosophy of risk management in the Group; • The roles and responsibilities of the various functionaries in the Group tasked with risk management; and • The Group’s minimum standards for implementation of risk management in the businesses.
Sanlam Group Risk Escalation policy The Risk Escalation policy defines the circumstances in which risk events and emerging risks should be escalated to the Sanlam Group level. This includes quantifiable and unquantifiable measures. Summary of Sanlam Group Risk Appetite
The Sanlam Group consists of a number of decentralised businesses. These businesses have different risk profiles and appetites. They are capitalised appropriately based on these risk profiles.
The Group determines the hurdle rates required from these businesses. These hurdle rates are set out for each business in accordance with its risk profile. On average the Sanlam Group aims to yield a return on GEV equal to at least 1% above its cost of capital, being equal to the return on 9-year government bonds plus 4%.
Each decentralised business needs to operate within the restrictions of its allocated capital. For businesses using Value at Risk (VAR) as measurement, a 99,5% confidence level is required over a one-year time horizon. For businesses using capital adequacy (risk-based capital) techniques, a 95% confidence over a 10-year time horizon is required.
Each business needs to manage their risks within the Group ERM policy parameters.
96
Risk Process and Status
The risk assessment process in the individual businesses comprises three distinct phases:
Detailed identification of risk factors.
Performance measurement by means of Key Risk Indicators and Key Performance Indicators. These can be measured in terms of financial and non-financial indicators.
Stress testing and scenario analysis as a forward-looking methodology.
The individual businesses have fully adopted and implemented the ERM policy, the Group Risk Escalation policy and Business Continuity Management policy as part of the individual governance structures. The other policies are adopted by businesses where appropriate, although in the vast majority of cases this implies full adoption (as determined by business size/Group governance principles and the tight/loose principles). Risk management has formally been incorporated into the charters of the various Risk and/or Finance committees.
Independent Assurance reviews
During 2009, the Group developed with an external assurance provider, a Risk Management Maturity Model to assess the risk management processes across the Group. Annually, all businesses conduct self-assessments against the Maturity Model. Larger businesses were assessed by an external assurance provider against the Maturity Model. Internal audit conducts assessments on a rolling annual basis and the overall results are presented to the Sanlam Life Risk and Compliance committee. Restatement of comparatives Comparative information for 2009 were restated for all items affected by the restatements identified on page 73.
97
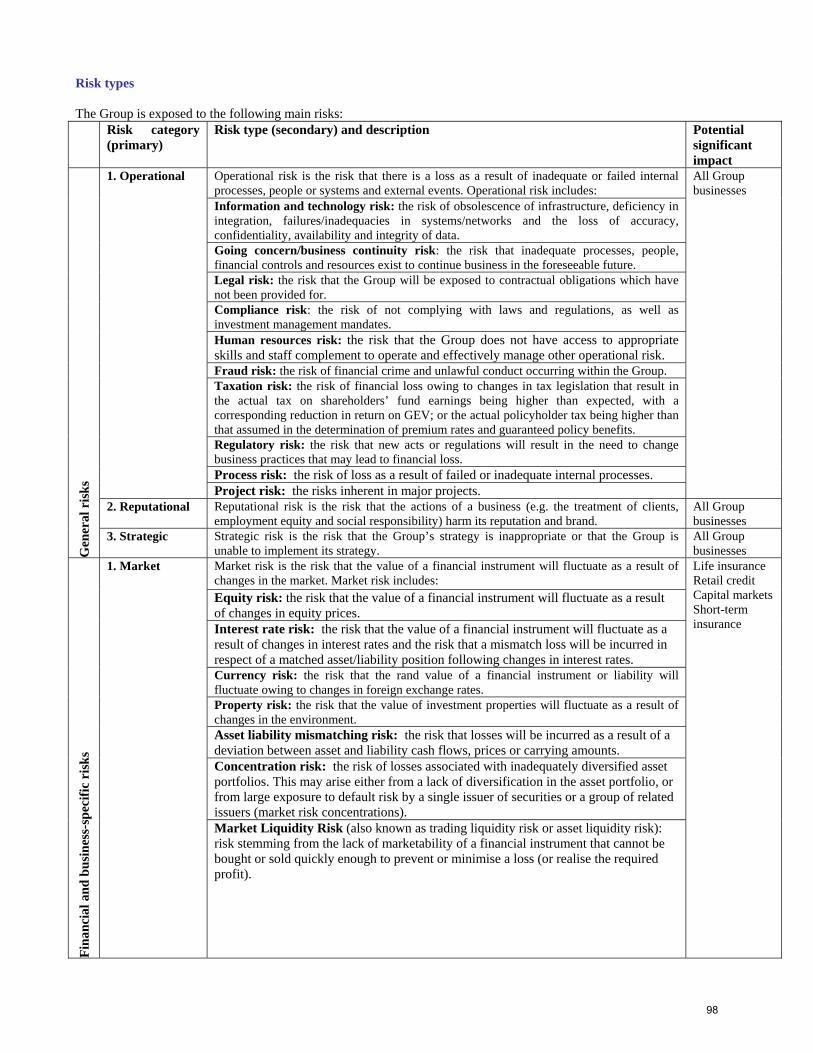
Risk types The Group is exposed to the following main risks: Risk category
(primary) Risk type (secondary) and description Potential
significant impact
Gen
eral
ris
ks
1. Operational
Operational risk is the risk that there is a loss as a result of inadequate or failed internal processes, people or systems and external events. Operational risk includes:
All Group businesses
Information and technology risk: the risk of obsolescence of infrastructure, deficiency in integration, failures/inadequacies in systems/networks and the loss of accuracy, confidentiality, availability and integrity of data. Going concern/business continuity risk: the risk that inadequate processes, people, financial controls and resources exist to continue business in the foreseeable future. Legal risk: the risk that the Group will be exposed to contractual obligations which have not been provided for. Compliance risk: the risk of not complying with laws and regulations, as well as investment management mandates. Human resources risk: the risk that the Group does not have access to appropriate skills and staff complement to operate and effectively manage other operational risk. Fraud risk: the risk of financial crime and unlawful conduct occurring within the Group.
Taxation risk: the risk of financial loss owing to changes in tax legislation that result in the actual tax on shareholders’ fund earnings being higher than expected, with a corresponding reduction in return on GEV; or the actual policyholder tax being higher than that assumed in the determination of premium rates and guaranteed policy benefits.
Regulatory risk: the risk that new acts or regulations will result in the need to change business practices that may lead to financial loss.
Process risk: the risk of loss as a result of failed or inadequate internal processes. Project risk: the risks inherent in major projects. 2. Reputational Reputational risk is the risk that the actions of a business (e.g. the treatment of clients,
employment equity and social responsibility) harm its reputation and brand. All Group businesses
3. Strategic Strategic risk is the risk that the Group’s strategy is inappropriate or that the Group is unable to implement its strategy.
All Group businesses
Fina
ncia
l and
bus
ines
s-sp
ecifi
c ri
sks
1. Market
Market risk is the risk that the value of a financial instrument will fluctuate as a result of changes in the market. Market risk includes:
Life insurance Retail credit Capital markets Short-term insurance
Equity risk: the risk that the value of a financial instrument will fluctuate as a result of changes in equity prices. Interest rate risk: the risk that the value of a financial instrument will fluctuate as a result of changes in interest rates and the risk that a mismatch loss will be incurred in respect of a matched asset/liability position following changes in interest rates. Currency risk: the risk that the rand value of a financial instrument or liability will fluctuate owing to changes in foreign exchange rates. Property risk: the risk that the value of investment properties will fluctuate as a result of changes in the environment. Asset liability mismatching risk: the risk that losses will be incurred as a result of a deviation between asset and liability cash flows, prices or carrying amounts. Concentration risk: the risk of losses associated with inadequately diversified asset portfolios. This may arise either from a lack of diversification in the asset portfolio, or from large exposure to default risk by a single issuer of securities or a group of related issuers (market risk concentrations). Market Liquidity Risk (also known as trading liquidity risk or asset liquidity risk): risk stemming from the lack of marketability of a financial instrument that cannot be bought or sold quickly enough to prevent or minimise a loss (or realise the required profit).
98
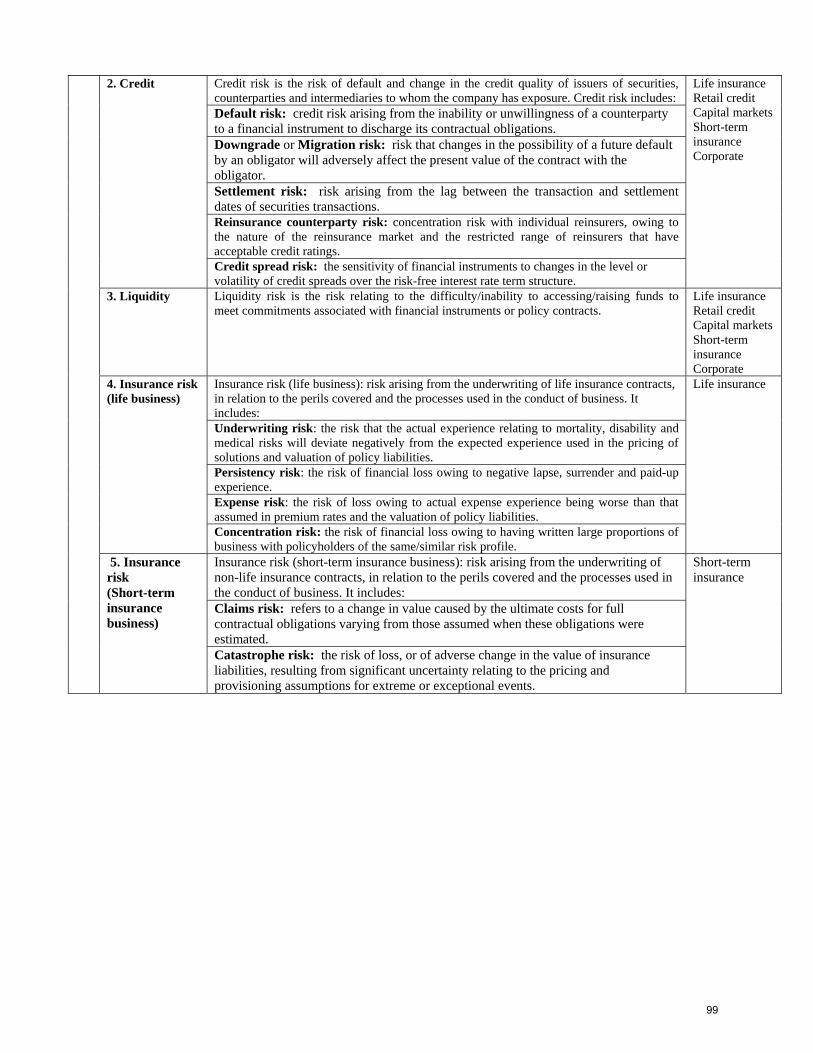
2. Credit
Credit risk is the risk of default and change in the credit quality of issuers of securities, counterparties and intermediaries to whom the company has exposure. Credit risk includes:
Life insurance Retail credit Capital markets Short-term insurance Corporate
Default risk: credit risk arising from the inability or unwillingness of a counterparty to a financial instrument to discharge its contractual obligations. Downgrade or Migration risk: risk that changes in the possibility of a future default by an obligator will adversely affect the present value of the contract with the obligator. Settlement risk: risk arising from the lag between the transaction and settlement dates of securities transactions. Reinsurance counterparty risk: concentration risk with individual reinsurers, owing to the nature of the reinsurance market and the restricted range of reinsurers that have acceptable credit ratings.
Credit spread risk: the sensitivity of financial instruments to changes in the level or volatility of credit spreads over the risk-free interest rate term structure.
3. Liquidity
Liquidity risk is the risk relating to the difficulty/inability to accessing/raising funds to meet commitments associated with financial instruments or policy contracts.
Life insurance Retail credit Capital markets Short-term insurance Corporate
4. Insurance risk (life business)
Insurance risk (life business): risk arising from the underwriting of life insurance contracts, in relation to the perils covered and the processes used in the conduct of business. It includes:
Life insurance
Underwriting risk: the risk that the actual experience relating to mortality, disability and medical risks will deviate negatively from the expected experience used in the pricing of solutions and valuation of policy liabilities. Persistency risk: the risk of financial loss owing to negative lapse, surrender and paid-up experience. Expense risk: the risk of loss owing to actual expense experience being worse than that assumed in premium rates and the valuation of policy liabilities. Concentration risk: the risk of financial loss owing to having written large proportions of business with policyholders of the same/similar risk profile.
5. Insurance risk (Short-term insurance business)
Insurance risk (short-term insurance business): risk arising from the underwriting of non-life insurance contracts, in relation to the perils covered and the processes used in the conduct of business. It includes:
Short-term insurance
Claims risk: refers to a change in value caused by the ultimate costs for full contractual obligations varying from those assumed when these obligations were estimated.
Catastrophe risk: the risk of loss, or of adverse change in the value of insurance liabilities, resulting from significant uncertainty relating to the pricing and provisioning assumptions for extreme or exceptional events.
99
Risk management: General risks
1. OPERATIONAL RISK
The Group mitigates this risk through its culture and values, a comprehensive system of internal controls, internal audit, forensic and compliance functions and other measures such as back-up facilities, contingency planning and insurance. The initiation of transactions and their administration is conducted on the basis of the segregation of duties, designed to ensure the correctness, completeness and validity of all transactions. The management of risks associated with human resources is not addressed in this Report. The following functionaries assist in mitigating operational risk: Internal audit A Board-approved internal audit charter governs internal audit activity within the Group. Regular risk-focused reviews of internal control and risk management systems are carried out. The chief audit executive of Sanlam is appointed in consultation with the chairman of the Audit, Actuarial and Finance committee and has unrestricted access to the chairman of the committee. The authority, resources, scope of work and effectiveness of the functions are reviewed regularly. External audit The Group’s external auditors are Ernst & Young Inc.. The report of the independent auditors for the year under review is contained on page 6 of the Annual Report. The external auditors provide an independent assessment of certain systems of internal financial control which they may rely on to express an independent opinion on the annual financial statements. Non-audit services rendered by the external auditors are strictly governed by a Group policy in this regard. The Group applies a policy of compulsory rotation of audit partners. Information and technology risk The “Group Information and Technology (I&IT) Risk Management policy” is authorised by the Group Risk forum and the Group IT Governance committee and ratified by the Group Executive committee. It stipulates the role of the Information and IT Risk manager that each business is responsible for appointing. Furthermore, it provides a framework of IT risk management, the methods of reporting, assessment and action, appropriate documentation and management of all risk-related IT incidents that have occurred, timing of communication and liaison with other functions in the Group. Reliance on and the continuous availability of IT systems and processes are inherent to the nature of the Group’s operations. An important objective of the Group Information and Technology Risk Management policy is accordingly to ensure that the Group’s IT resources and platforms are maintained and developed in line with changes in the Group’s business environment and requirements, and that proper back-up processes and disaster recovery measures are in place. Going concern/business continuity risk The Board regularly considers and records the facts and assumptions on which it relies to conclude that Sanlam will continue as a going concern. Reflecting on the year under review, the Directors considered a number of facts and circumstances and are of the opinion that adequate resources exist to continue business and that Sanlam will remain a going concern in the foreseeable future. The Board’s statement to this effect is also contained in the statement on the responsibility of directors in the annual financial statements. Legal risk During the development stage of any new product and for material transactions entered into by the Group, the legal resources of the Group monitor the drafting of the contract documents to ensure that rights and obligations of all parties are clearly set out. Sanlam seeks to minimise uncertainties through continuous consultation with internal and external legal advisers, to understand the nature of risks and to ensure that transactions are appropriately structured and documented.
100
Compliance risk Laws and regulations: Sanlam considers compliance with applicable laws, industry regulations and codes an integral part of doing business. The Group Compliance Office, together with the compliance functions of the Group businesses, facilitates the management of compliance through the analysis of statutory and regulatory requirements, and monitoring the implementation and execution thereof. Compliance with client mandates: Rules for clients’ investment instructions are loaded on an order management system, which produces post-trade compliance reports that are continuously monitored. On a monthly basis, these reports are manually compared with the investment instructions. When a possible breach is detected, the portfolio manager is requested to confirm whether a breach has taken place, to explain the reason for the breach and indicate when it will be rectified (which is expected to be as soon as possible). Further action may be taken, depending on the type of breach. The detailed results of the mandate monitoring process are discussed with the head of investment operations on a monthly basis. Fraud risk The Sanlam Group recognises that financial crime and unlawful conduct are in conflict with the principles of ethical behaviour, as set out in the Group’s code of ethics, and undermines the organisational integrity of the Group. The financial crime combating policy for the Sanlam Group is designed to counter the threat of financial crime and unlawful conduct. A zero-tolerance approach is applied in combating financial crime and all offenders are prosecuted. The forensic services function at Group level oversees the prevention, detection and investigation of incidents of unlawful conduct that are of such a nature that they may have an impact on the Group or the executive of a business cluster. Group Forensic Services is also responsible for the formulation of Group standards in respect of the combating of unlawful conduct and the implementation of measures to monitor compliance with these standards. The chief executive of each business cluster is responsible for the implementation of the policy in his or her respective business and is accountable to the Group Chief Executive and the Sanlam Board. Quarterly reports are submitted by Group Forensic Services to the Sanlam Life Risk and Compliance committee on the incidence of financial crime and unlawful conduct in the Group and on measures taken to prevent, detect, investigate and deal with such conduct. Taxation risk The risk is addressed through clear contracting to ensure that policy contracts entitle policyholders to after-tax returns, where applicable. The Group’s internal tax resources monitor the impact of changes in tax legislation, participate in discussions with the tax legislator to comment on changes in legislation and are involved in the development of new products. External tax advice is obtained as required. Regulatory risk Regulatory risk is mitigated by ensuring that the Group has dedicated personnel that are involved in and therefore informed of relevant developments in legislation. The Group takes a proactive approach in investigating and formulating views on all applicable issues facing the financial services industry. The risk is also managed as far as possible through clear contracting. The Group monitors and influences events to the extent possible by participation in discussions with legislators, directly and through industry organisations. Process risk The risk of failed or inadequate internal processes is addressed through a combination of the following: A risk-based approach is followed in the design of operational processes and internal controls; Operational processes are properly documented; Staff training and the employment of a performance-based remuneration philosophy; and Internal audit review of key operational processes.
101
Project risk A formalised, risk-based approach is followed for the management of major projects to ensure that projects are effectively implemented and the project hurdle rate is achieved. Key deliverables, progress and risks are monitored on a continuous basis throughout the project life cycle. Internal specialists and external consultants are used as required to provide specialist knowledge and experience.
2. REPUTATIONAL RISK
Risks with a potential reputational impact are escalated to the appropriate level of senior management. The Audit and Risk committees are involved as required. Events with an industry-wide reputational impact are addressed through industry representative groups. The Group’s governance structure and various monitoring tools ensure that any events that affect the achievement of the Group’s strategy are escalated and addressed at the earliest opportunity. The Board has no tolerance for any breach of guidance.
3. STRATEGIC RISK
Group strategy is addressed on a continuous basis at various forums within the Group, the most important of which are: The Group’s strategic direction and success is discussed and evaluated at an annual special strategic session
of the Sanlam Life Board as well as at the scheduled Board meetings during the year; As part of the annual budgeting process, the Group businesses present their strategic plans and budgets to the
Sanlam Group Executive committee, which ensures that the businesses’ strategies are aligned with the overall Group strategy; and
The Sanlam Group Executive committee, which includes the chief executives of the various Group businesses, meets on a regular basis to discuss, among others, the achievement of the businesses’ and Group’s strategies. Any strategic issues are identified at these meetings and corrective actions are immediately implemented.
102
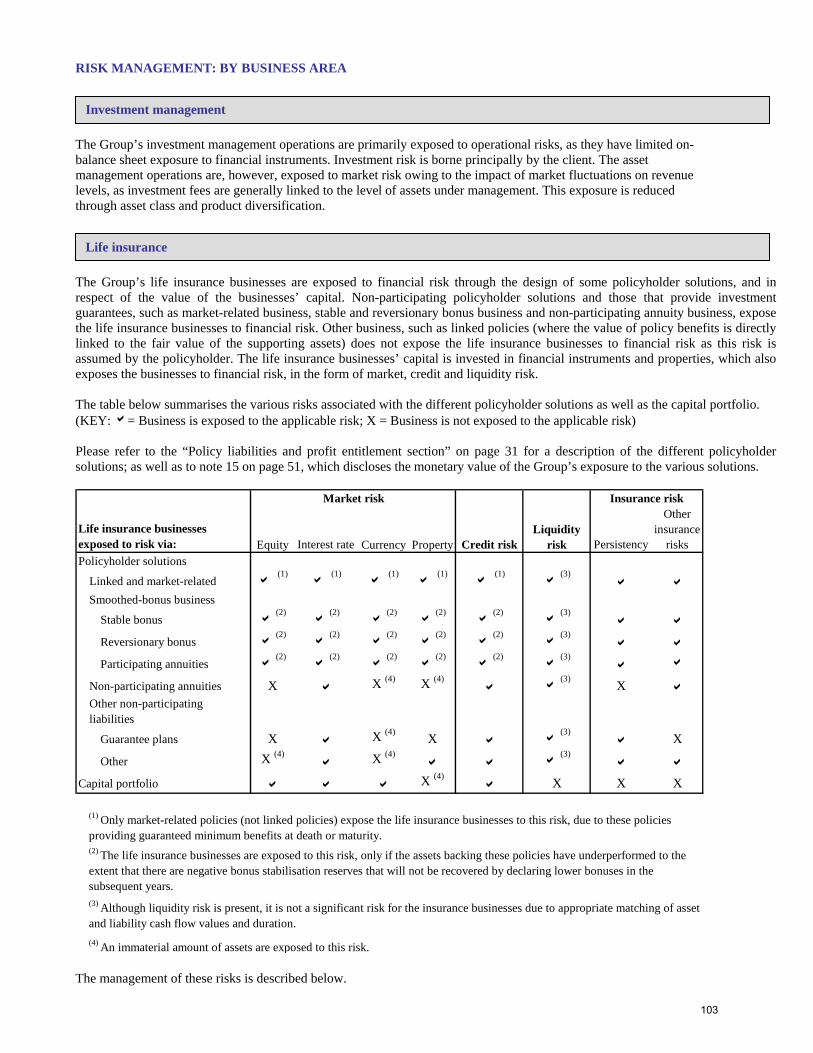
RISK MANAGEMENT: BY BUSINESS AREA
Investment management
The Group’s investment management operations are primarily exposed to operational risks, as they have limited on-balance sheet exposure to financial instruments. Investment risk is borne principally by the client. The asset management operations are, however, exposed to market risk owing to the impact of market fluctuations on revenue levels, as investment fees are generally linked to the level of assets under management. This exposure is reduced through asset class and product diversification.
Life insurance
The Group’s life insurance businesses are exposed to financial risk through the design of some policyholder solutions, and in respect of the value of the businesses’ capital. Non-participating policyholder solutions and those that provide investment guarantees, such as market-related business, stable and reversionary bonus business and non-participating annuity business, expose the life insurance businesses to financial risk. Other business, such as linked policies (where the value of policy benefits is directly linked to the fair value of the supporting assets) does not expose the life insurance businesses to financial risk as this risk is assumed by the policyholder. The life insurance businesses’ capital is invested in financial instruments and properties, which also exposes the businesses to financial risk, in the form of market, credit and liquidity risk. The table below summarises the various risks associated with the different policyholder solutions as well as the capital portfolio. (KEY: a= Business is exposed to the applicable risk; X = Business is not exposed to the applicable risk) Please refer to the “Policy liabilities and profit entitlement section” on page 31 for a description of the different policyholder solutions; as well as to note 15 on page 51, which discloses the monetary value of the Group’s exposure to the various solutions.
Market risk
Life insurance businesses exposed to risk via: Equity Interest rate Currency Property Persistency
Other insurance
risksPolicyholder solutions
Linked and market-related (1)
(1)
(1)
(1)
(1) (3)
Smoothed-bonus business
Stable bonus (2) (2) (2) (2) (2) (3)
Reversionary bonus (2) (2) (2) (2) (2) (3)
Participating annuities (2) (2) (2) (2) (2) (3)
Non-participating annuities X X (4) X (4) (3) XOther non-participating liabilities
Guarantee plans X X (4) X (3) X
Other X (4) X (4) (3)
Capital portfolio X (4) X X X
(4) An immaterial amount of assets are exposed to this risk.
(2) The life insurance businesses are exposed to this risk, only if the assets backing these policies have underperformed to the extent that there are negative bonus stabilisation reserves that will not be recovered by declaring lower bonuses in the subsequent years.(3) Although liquidity risk is present, it is not a significant risk for the insurance businesses due to appropriate matching of asset and liability cash flow values and duration.
Credit riskLiquidity
risk
Insurance risk
(1) Only market-related policies (not linked policies) expose the life insurance businesses to this risk, due to these policies providing guaranteed minimum benefits at death or maturity.
The management of these risks is described below.
103

1. MARKET RISK
Market risk
Life insurance businesses exposed to risk via: Equity Interest rate Currency PropertyPolicyholder solutions
Linked and market-relatedSmoothed-bonus business
Stable bonus
Reversionary bonus
Participating annuities
Non-participating annuities X X XOther non-participating liabilities
Guarantee plans X X X
Other X XCapital portfolio X Linked and market-related Linked and market-related business relates to contracts where there is a direct relationship between the returns earned on the underlying portfolio and the returns credited to the contract. Policyholders carry the full market risk in respect of linked business. Market-related policies, however, provide for guaranteed minimum benefits at death or maturity, and therefore expose the life insurance businesses to market risk. The risk relating to guaranteed minimum benefits is managed by appropriate investment policies, determined by the Asset Liability Committee (ALCO), and by adjusting the level of guarantees for new policies to prevailing market conditions. These investment policies are then reflected in the investment guidelines for the policyholder portfolios. The Group’s long-term policy liabilities include a specific provision for investment guarantees. The current provision for investment guarantees in insurance contracts has been calculated on a market-consistent basis in accordance with guidance issued by the Actuarial Society of South Africa. Smoothed bonus business These policies provide for the payment of an after-tax and after-cost investment return to the policyholder, in the form of bonuses. The use of bonuses is a mechanism to smooth returns to policyholders in order to reduce the effects of volatile investment performance, and bonus rates are determined in line with the product design, policyholder reasonable expectations, affordability and the approved bonus philosophy. Any returns not yet distributed are retained in a policyholder bonus stabilisation reserve, for future distribution to policyholders. In the event of adverse investment performance, this reserve may become negative. Negative bonus stabilisation reserves are allowed for in the valuation of these liabilities to the extent that the shortfall is expected to be recovered by declaring lower bonuses in the subsequent three years. The funding level of portfolios is bolstered through loans from the capital portfolio in instances where negative stabilisation reserves will not be eliminated by these management actions. At 31 December 2010, all stable and reversionary bonus business portfolios had a funding level in excess of the minimum reporting level of 92,5%. Market risk is borne by policyholders to the extent that the after-tax and after-cost investment return is declared as bonuses. The capital portfolio is however exposed to some market risk as an under performance in investment markets may result in an under funded position that will require financial support by the capital portfolio. The Group manages this risk through an appropriate investment policy. ALCO oversees the investment policy for the various smoothed-bonus portfolios, while the Sanlam Personal Finance Investment Committee also considers these portfolios as part of its overall brief. The aim is to find the optimum balance between high investment returns (to be able to declare competitive bonus rates) and stable investment returns given the need to meet guaranteed benefits and to
104
support the granting of stable bonus rates. The requirements for the investment management of each portfolio are set out in investment guidelines, which cover, inter alia, the following: Limitations on exposure to volatile assets; The benchmarks for the performance measurement of each asset class and limits on deviations from these
benchmarks; Credit risk limits; Limits on asset concentration – with regard to strategic investments, the exposure of policyholders’ portfolios to
these investments is based on portfolio investment considerations and restricted with reference to a specific counter’s weight in the benchmark portfolio;
Limits on exposure to some particular types of assets, such as unlisted equities, derivative instruments, property and hedge funds; and
Regulatory constraints. Feedback on the investment policy and its implementation and the performance of the smoothed-bonus portfolios is provided quarterly to the Sanlam Life Board and the Policyholders’ Interest Committee. Non-participating annuities Non-participating annuity business relates to contracts where income is paid to an annuitant for life or for a fixed term, in return for a lump sum consideration paid on origination of the policy. The income may be fixed, or increased at a fixed rate or in line with inflation. The Group guarantees this income and is therefore subject to interest rate risk. Liabilities are matched as far as possible with assets, mostly interest-bearing, to ensure that the change in value of assets and liabilities is closely matched for a change in interest rates. The impact of changes in interest rates is continuously tested, and for a 1% parallel movement in interest rates the impact on profit will be immaterial. The management of credit risk is also of particular importance for non-participating annuities given the exposure to interest-bearing instruments (refer to section 2 below). Guarantee plans These single premium policies provide for guaranteed maturity amounts. The life insurance businesses are therefore exposed to interest rate risk, if the assets backing these liabilities do not provide a comparable yield to the guaranteed value. Interest rate risk is managed by matching the liabilities with assets that have similar investment return profiles as the liabilities. Other non-participating business The Group is exposed to market risk to the extent of the investment of the underlying assets in interest-bearing and property investments. The risk is managed through investments in appropriate asset classes. Currency risk The majority of currency exposure within the policyholder portfolios results from offshore assets held in respect of linked and smoothed bonus business. Offshore exposure within these portfolios is desirable from a diversification perspective. Capital Comprehensive measures and limits are in place to control the exposure of the life insurance businesses’ capital to market and credit risks. Continuous monitoring takes place to ensure that appropriate assets are held in support of the capital and investment return targets. Limits are applied in respect of the exposure to asset classes and individual counters. The exposure of the life insurance operations’ shareholders’ funds to various classes of investments is reflected in the following table:
105
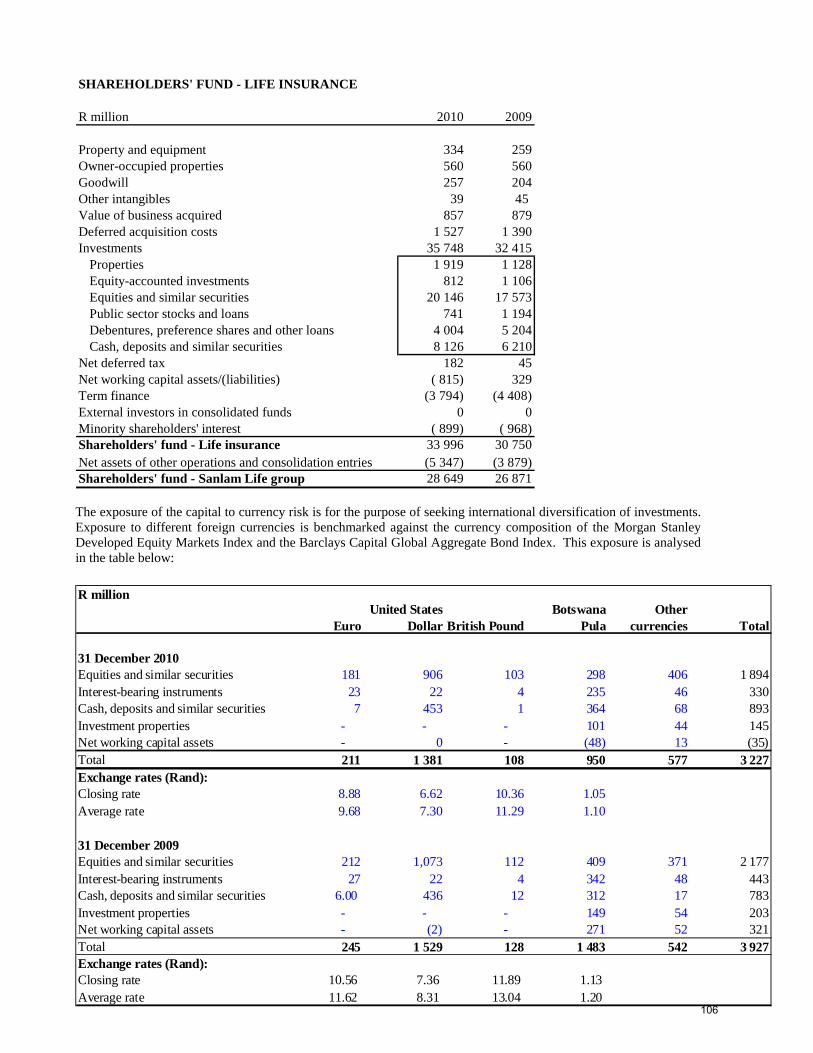
SHAREHOLDERS' FUND - LIFE INSURANCE
R million 2010 2009
Property and equipment 334 259Owner-occupied properties 560 560Goodwill 257 204Other intangibles 39 45 Value of business acquired 857 879Deferred acquisition costs 1 527 1 390Investments 35 748 32 415
Properties 1 919 1 128Equity-accounted investments 812 1 106Equities and similar securities 20 146 17 573Public sector stocks and loans 741 1 194Debentures, preference shares and other loans 4 004 5 204Cash, deposits and similar securities 8 126 6 210
Net deferred tax 182 45Net working capital assets/(liabilities) ( 815) 329Term finance (3 794) (4 408)External investors in consolidated funds 0 0Minority shareholders' interest ( 899) ( 968)Shareholders' fund - Life insurance 33 996 30 750Net assets of other operations and consolidation entries (5 347) (3 879)Shareholders' fund - Sanlam Life group 28 649 26 871 The exposure of the capital to currency risk is for the purpose of seeking international diversification of investments. Exposure to different foreign currencies is benchmarked against the currency composition of the Morgan Stanley Developed Equity Markets Index and the Barclays Capital Global Aggregate Bond Index. This exposure is analysed in the table below:
R million
EuroUnited States
Dollar British PoundBotswana
PulaOther
currencies Total
31 December 2010Equities and similar securities 181 906 103 298 406 1 894Interest-bearing instruments 23 22 4 235 46 330Cash, deposits and similar securities 7 453 1 364 68 893Investment properties - - - 101 44 145Net working capital assets - 0 - (48) 13 (35)Total 211 1 381 108 950 577 3 227Exchange rates (Rand):Closing rate 8.88 6.62 10.36 1.05Average rate 9.68 7.30 11.29 1.10
31 December 2009Equities and similar securities 212 1,073 112 409 371 2 177Interest-bearing instruments 27 22 4 342 48 443Cash, deposits and similar securities 6.00 436 12 312 17 783Investment properties - - - 149 54 203Net working capital assets - (2) - 271 52 321Total 245 1 529 128 1 483 542 3 927Exchange rates (Rand):Closing rate 10.56 7.36 11.89 1.13 Average rate 11.62 8.31 13.04 1.20
106
The capital portfolio has limited exposure to investment properties and accordingly the related property risk. Diversification in property type, geographical location and tenant exposure are all used to reduce the risk exposure. Sensitivities Changes in investment return assumptions have an impact on the return on the Group’s capital, as changes in the market value of the capital portfolio’s investments will have a commensurate impact on earnings for the year, and the future profitability of the life insurance operations as reflected in the impact on the value of in-force business (the present value of future after-tax profit to be earned from covered business). If investment return (and inflation) assumptions were to decrease by 1%, coupled with a 1% decrease in risk discount rates, and with bonus rates changing commensurately, the impact on the present value of future after-tax profits would be an increase of R501 million (2009: increase of R531 million). The impact on current year profit of the above scenarios is limited, due to the Group’s policy of closely matching assets and liabilities together with the fact that any mismatch profits and losses in respect of non-participating life business are absorbed by the asset mismatch reserve, while this reserve has a positive balance.
2. CREDIT RISK – POLICYHOLDER SOLUTIONS & CAPITAL
Life insurance businesses exposed to risk via: Credit riskPolicyholder solutions YesCapital portfolio Yes
Sanlam recognises that a sound credit risk policy is essential to minimise the effect on the Group as a result of loss owing to a major corporate failure and the possible systemic risk such a failure could lead to. The Sanlam Investment Cluster Credit Risk policy and strategy has been established for this purpose. Credit risk occurs owing to trading, investment, structured transactions and lending activities. These activities in the Group are conducted mostly by either Sanlam Capital Markets (SCM) or Sanlam Investments Management (SIM) in terms of the investment guidelines granted to them by the life insurance operations. The Boards of SIM and SCM have delegated responsibility for credit risk management to the Central Credit committee. On a smaller scale, Botswana Insurance Fund Management (BIFM) also performs investment activities in the Group. The governance structures ensure that an appropriate credit culture and environment is maintained, such that no transactions are concluded outside areas of competence, nor without following normal procedures. This credit culture is the product of a formal credit risk strategy and credit risk policy. The credit risk strategy stipulates the parameters for approval of credit applications, such as: economic sector; risk concentration; maximum exposure per obligor, group and industry; geographical location; product type; currency; maturity, anticipated profitability or excess spread; economic capital limits; and cyclical aspects of the economy. The credit risk policy highlights the processes and procedures to be followed in order to maintain sound credit granting standards, to monitor and manage credit risk, to properly evaluate new business opportunities and identify and administer problem credits. Credit analysis is a structured process of investigation and assessment, involving identifying the obligor, determining whether a group of connected obligors should be consolidated as a group exposure, and analysing the financial information of the obligor. A credit rating, being a ranking of creditworthiness, is allocated to the obligor. External ratings (e.g. Moody’s Investor Services, Standard and Poors, Fitch Ratings and Global Credit Ratings) are used when available. In addition to external ratings, internal rating assessments are conducted, whereby the latest financial and related information is analysed in a specified and standardised manner, to ensure a consistent and systematic evaluation process. All facilities are reviewed on at least an annual basis by the appropriate approval authority. Where possible, Sanlam’s interest is protected by obtaining acceptable security. Covenants are also stipulated in the loan agreements,
107
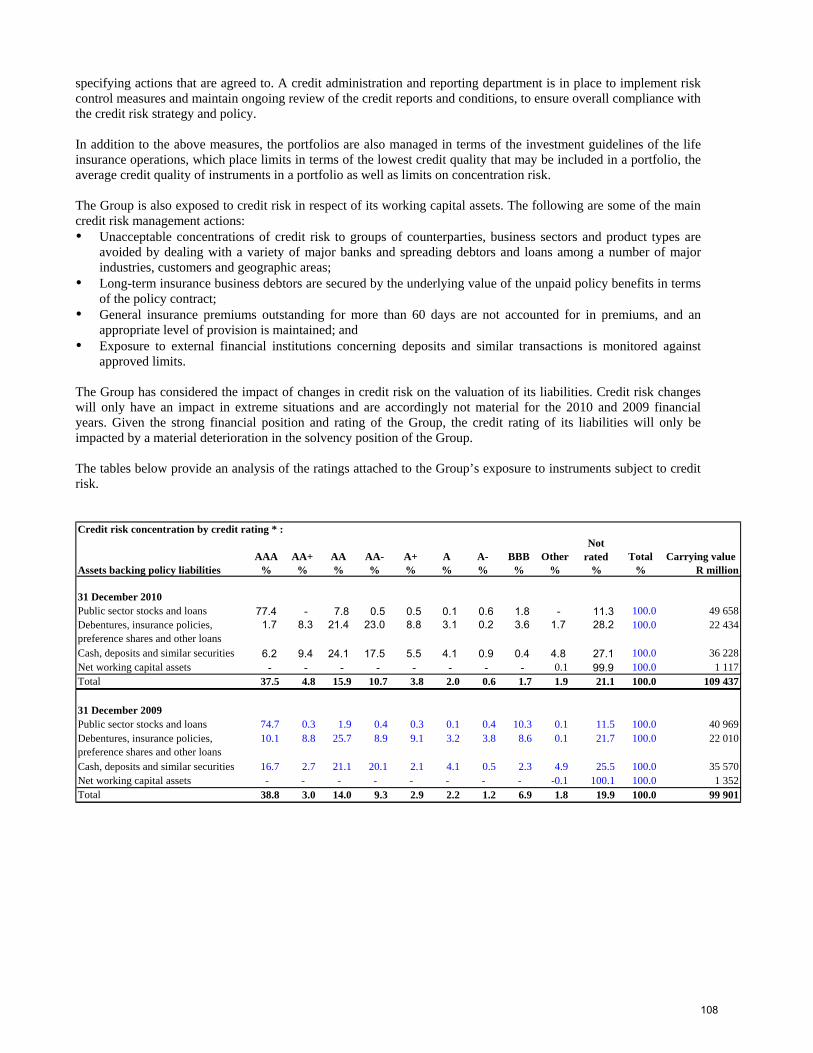
specifying actions that are agreed to. A credit administration and reporting department is in place to implement risk control measures and maintain ongoing review of the credit reports and conditions, to ensure overall compliance with the credit risk strategy and policy. In addition to the above measures, the portfolios are also managed in terms of the investment guidelines of the life insurance operations, which place limits in terms of the lowest credit quality that may be included in a portfolio, the average credit quality of instruments in a portfolio as well as limits on concentration risk. The Group is also exposed to credit risk in respect of its working capital assets. The following are some of the main credit risk management actions: Unacceptable concentrations of credit risk to groups of counterparties, business sectors and product types are
avoided by dealing with a variety of major banks and spreading debtors and loans among a number of major industries, customers and geographic areas;
Long-term insurance business debtors are secured by the underlying value of the unpaid policy benefits in terms of the policy contract;
General insurance premiums outstanding for more than 60 days are not accounted for in premiums, and an appropriate level of provision is maintained; and
Exposure to external financial institutions concerning deposits and similar transactions is monitored against approved limits.
The Group has considered the impact of changes in credit risk on the valuation of its liabilities. Credit risk changes will only have an impact in extreme situations and are accordingly not material for the 2010 and 2009 financial years. Given the strong financial position and rating of the Group, the credit rating of its liabilities will only be impacted by a material deterioration in the solvency position of the Group. The tables below provide an analysis of the ratings attached to the Group’s exposure to instruments subject to credit risk. Credit risk concentration by credit rating * :
AAA AA+ AA AA- A+ A A- BBB OtherNot
rated Total Carrying valueAssets backing policy liabilities % % % % % % % % % % % R million
31 December 2010Public sector stocks and loans 77.4 - 7.8 0.5 0.5 0.1 0.6 1.8 - 11.3 100.0 49 658Debentures, insurance policies, preference shares and other loans
1.7 8.3 21.4 23.0 8.8 3.1 0.2 3.6 1.7 28.2 100.0 22 434
Cash, deposits and similar securities 6.2 9.4 24.1 17.5 5.5 4.1 0.9 0.4 4.8 27.1 100.0 36 228Net working capital assets - - - - - - - - 0.1 99.9 100.0 1 117Total 37.5 4.8 15.9 10.7 3.8 2.0 0.6 1.7 1.9 21.1 100.0 109 437
31 December 2009Public sector stocks and loans 74.7 0.3 1.9 0.4 0.3 0.1 0.4 10.3 0.1 11.5 100.0 40 969Debentures, insurance policies, preference shares and other loans
10.1 8.8 25.7 8.9 9.1 3.2 3.8 8.6 0.1 21.7 100.0 22 010
Cash, deposits and similar securities 16.7 2.7 21.1 20.1 2.1 4.1 0.5 2.3 4.9 25.5 100.0 35 570Net working capital assets - - - - - - - - -0.1 100.1 100.0 1 352Total 38.8 3.0 14.0 9.3 2.9 2.2 1.2 6.9 1.8 19.9 100.0 99 901
108
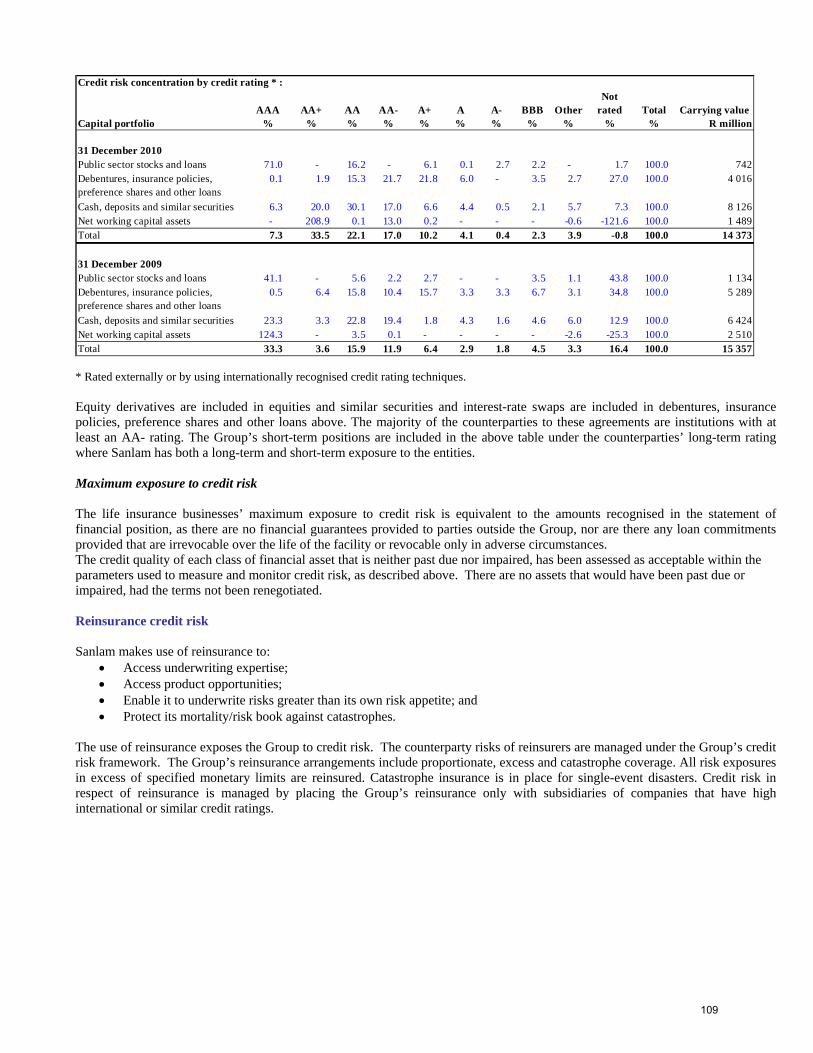
Credit risk concentration by credit rating * :
AAA AA+ AA AA- A+ A A- BBB OtherNot
rated Total Carrying valueCapital portfolio % % % % % % % % % % % R millio
31 December 2010Public sector stocks and loans 71.0 - 16.2 - 6.1 0.1 2.7 2.2 - 1.7 100.0 742Debentures, insurance policies, preference shares and other loans
0.1 1.9 15.3 21.7 21.8 6.0 - 3.5 2.7 27.0 100.0 4 016
Cash, deposits and similar securities 6.3 20.0 30.1 17.0 6.6 4.4 0.5 2.1 5.7 7.3 100.0 8 126Net working capital assets - 208.9 0.1 13.0 0.2 - - - -0.6 -121.6 100.0 1 489Total 7.3 33.5 22.1 17.0 10.2 4.1 0.4 2.3 3.9 -0.8 100.0 14 373
31 December 2009Public sector stocks and loans 41.1 - 5.6 2.2 2.7 - - 3.5 1.1 43.8 100.0 1 134Debentures, insurance policies, preference shares and other loans
0.5 6.4 15.8 10.4 15.7 3.3 3.3 6.7 3.1 34.8 100.0 5 289
Cash, deposits and similar securities 23.3 3.3 22.8 19.4 1.8 4.3 1.6 4.6 6.0 12.9 100.0 6 424Net working capital assets 124.3 - 3.5 0.1 - - - - -2.6 -25.3 100.0 2 510Total 33.3 3.6 15.9 11.9 6.4 2.9 1.8 4.5 3.3 16.4 100.0 15 357
n
* Rated externally or by using internationally recognised credit rating techniques. Equity derivatives are included in equities and similar securities and interest-rate swaps are included in debentures, insurance policies, preference shares and other loans above. The majority of the counterparties to these agreements are institutions with at least an AA- rating. The Group’s short-term positions are included in the above table under the counterparties’ long-term rating where Sanlam has both a long-term and short-term exposure to the entities. Maximum exposure to credit risk The life insurance businesses’ maximum exposure to credit risk is equivalent to the amounts recognised in the statement of financial position, as there are no financial guarantees provided to parties outside the Group, nor are there any loan commitments provided that are irrevocable over the life of the facility or revocable only in adverse circumstances. The credit quality of each class of financial asset that is neither past due nor impaired, has been assessed as acceptable within the parameters used to measure and monitor credit risk, as described above. There are no assets that would have been past due or impaired, had the terms not been renegotiated. Reinsurance credit risk Sanlam makes use of reinsurance to:
• Access underwriting expertise; • Access product opportunities; • Enable it to underwrite risks greater than its own risk appetite; and • Protect its mortality/risk book against catastrophes.
The use of reinsurance exposes the Group to credit risk. The counterparty risks of reinsurers are managed under the Group’s credit risk framework. The Group’s reinsurance arrangements include proportionate, excess and catastrophe coverage. All risk exposures in excess of specified monetary limits are reinsured. Catastrophe insurance is in place for single-event disasters. Credit risk in respect of reinsurance is managed by placing the Group’s reinsurance only with subsidiaries of companies that have high international or similar credit ratings.
109
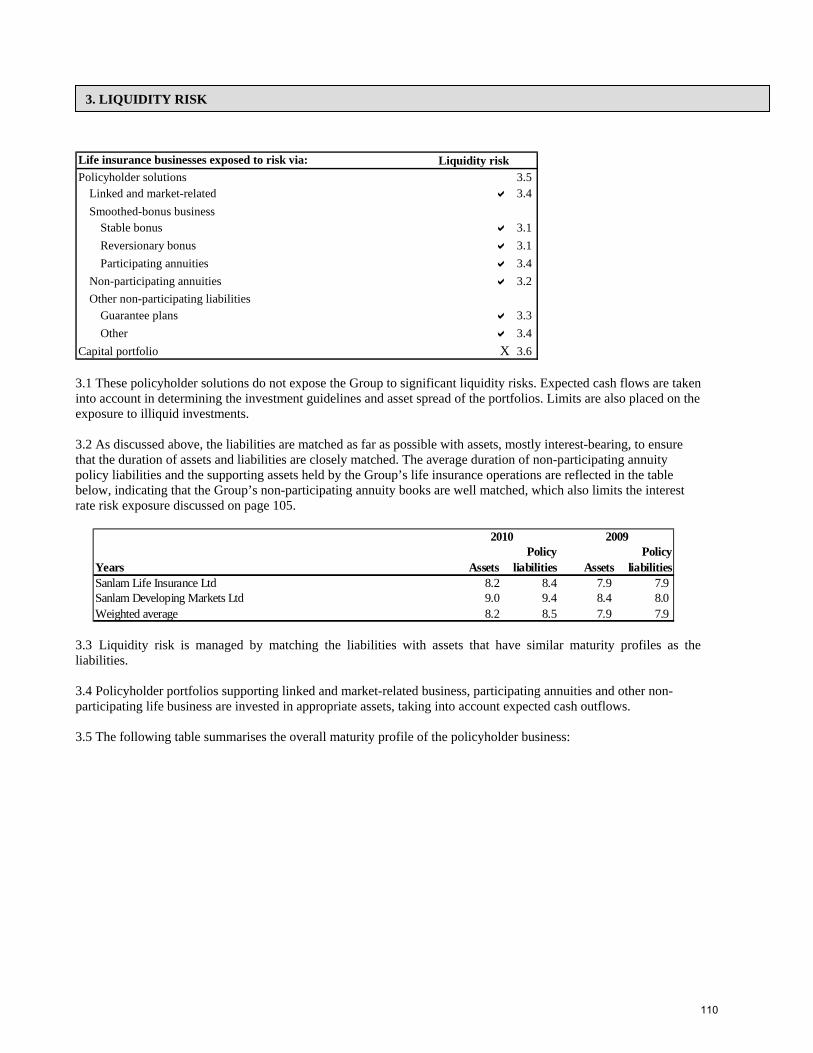
3. LIQUIDITY RISK
Life insurance businesses exposed to risk via: Liquidity riskPolicyholder solutions 3.5
Linked and market-related 3.4 Smoothed-bonus business
Stable bonus 3.1 Reversionary bonus 3.1 Participating annuities 3.4
Non-participating annuities 3.2 Other non-participating liabilities
Guarantee plans 3.3 Other 3.4
Capital portfolio X 3.6 3.1 These policyholder solutions do not expose the Group to significant liquidity risks. Expected cash flows are taken into account in determining the investment guidelines and asset spread of the portfolios. Limits are also placed on the exposure to illiquid investments. 3.2 As discussed above, the liabilities are matched as far as possible with assets, mostly interest-bearing, to ensure that the duration of assets and liabilities are closely matched. The average duration of non-participating annuity policy liabilities and the supporting assets held by the Group’s life insurance operations are reflected in the table below, indicating that the Group’s non-participating annuity books are well matched, which also limits the interest rate risk exposure discussed on page 105.
2010 2009
Years AssetsPolicy
liabilities AssetsPolicy
liabilitiesSanlam Life Insurance Ltd 8.2 8.4 7.9 7.9 Sanlam Developing Markets Ltd 9.0 9.4 8.4 8.0 Weighted average 8.2 8.5 7.9 7.9
3.3 Liquidity risk is managed by matching the liabilities with assets that have similar maturity profiles as the liabilities. 3.4 Policyholder portfolios supporting linked and market-related business, participating annuities and other non-participating life business are invested in appropriate assets, taking into account expected cash outflows. 3.5 The following table summarises the overall maturity profile of the policyholder business:
110
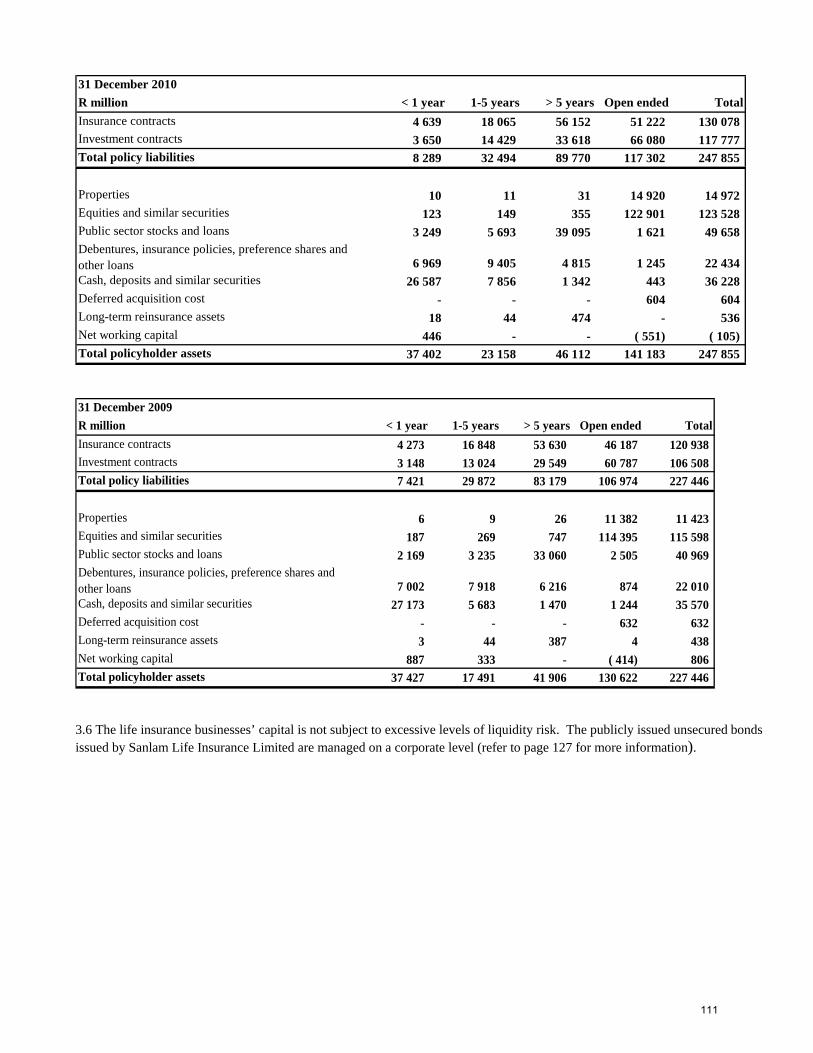
31 December 2010R million < 1 year 1-5 years > 5 years Open ended TotalInsurance contracts 4 639 18 065 56 152 51 222 130 078 Investment contracts 3 650 14 429 33 618 66 080 117 777 Total policy liabilities 8 289 32 494 89 770 117 302 247 855
Properties 10 11 31 14 920 14 972 Equities and similar securities 123 149 355 122 901 123 528 Public sector stocks and loans 3 249 5 693 39 095 1 621 49 658 Debentures, insurance policies, preference shares and other loans 6 969 9 405 4 815 1 245 22 434 Cash, deposits and similar securities 26 587 7 856 1 342 443 36 228 Deferred acquisition cost - - - 604 604 Long-term reinsurance assets 18 44 474 - 536 Net working capital 446 - - ( 551) ( 105) Total policyholder assets 37 402 23 158 46 112 141 183 247 855
31 December 2009R million < 1 year 1-5 years > 5 years Open ended TotalInsurance contracts 4 273 16 848 53 630 46 187 120 938 Investment contracts 3 148 13 024 29 549 60 787 106 508 Total policy liabilities 7 421 29 872 83 179 106 974 227 446
Properties 6 9 26 11 382 11 423 Equities and similar securities 187 269 747 114 395 115 598 Public sector stocks and loans 2 169 3 235 33 060 2 505 40 969 Debentures, insurance policies, preference shares and other loans 7 002 7 918 6 216 874 22 010 Cash, deposits and similar securities 27 173 5 683 1 470 1 244 35 570 Deferred acquisition cost - - - 632 632 Long-term reinsurance assets 3 44 387 4 438 Net working capital 887 333 - ( 414) 806 Total policyholder assets 37 427 17 491 41 906 130 622 227 446
3.6 The life insurance businesses’ capital is not subject to excessive levels of liquidity risk. The publicly issued unsecured bonds issued by Sanlam Life Insurance Limited are managed on a corporate level (refer to page 127 for more information).
111
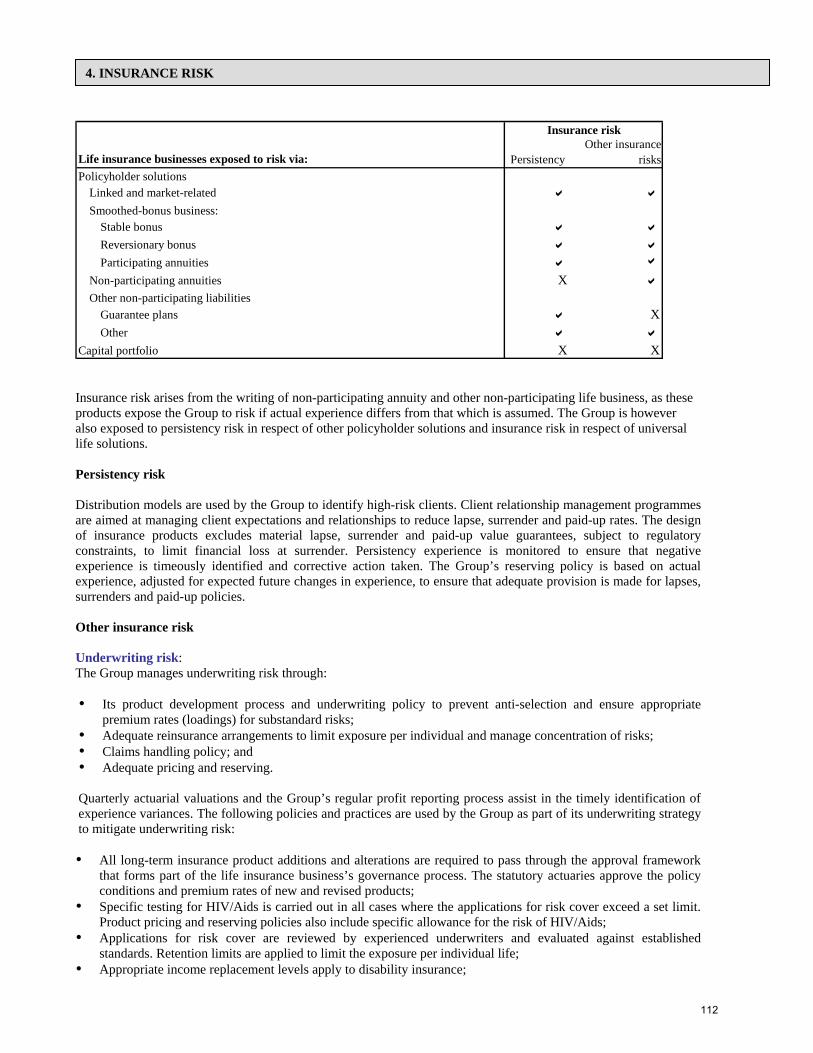
4. INSURANCE RISK
Life insurance businesses exposed to risk via: PersistencyOther insurance
risksPolicyholder solutions
Linked and market-relatedSmoothed-bonus business:
Stable bonusReversionary bonusParticipating annuities
Non-participating annuities XOther non-participating liabilities
Guarantee plans XOther
Capital portfolio X X
Insurance risk
Insurance risk arises from the writing of non-participating annuity and other non-participating life business, as these products expose the Group to risk if actual experience differs from that which is assumed. The Group is however also exposed to persistency risk in respect of other policyholder solutions and insurance risk in respect of universal life solutions. Persistency risk Distribution models are used by the Group to identify high-risk clients. Client relationship management programmes are aimed at managing client expectations and relationships to reduce lapse, surrender and paid-up rates. The design of insurance products excludes material lapse, surrender and paid-up value guarantees, subject to regulatory constraints, to limit financial loss at surrender. Persistency experience is monitored to ensure that negative experience is timeously identified and corrective action taken. The Group’s reserving policy is based on actual experience, adjusted for expected future changes in experience, to ensure that adequate provision is made for lapses, surrenders and paid-up policies. Other insurance risk Underwriting risk: The Group manages underwriting risk through:
Its product development process and underwriting policy to prevent anti-selection and ensure appropriate premium rates (loadings) for substandard risks;
Adequate reinsurance arrangements to limit exposure per individual and manage concentration of risks; Claims handling policy; and Adequate pricing and reserving.
Quarterly actuarial valuations and the Group’s regular profit reporting process assist in the timely identification of experience variances. The following policies and practices are used by the Group as part of its underwriting strategy to mitigate underwriting risk: All long-term insurance product additions and alterations are required to pass through the approval framework
that forms part of the life insurance business’s governance process. The statutory actuaries approve the policy conditions and premium rates of new and revised products;
Specific testing for HIV/Aids is carried out in all cases where the applications for risk cover exceed a set limit. Product pricing and reserving policies also include specific allowance for the risk of HIV/Aids;
Applications for risk cover are reviewed by experienced underwriters and evaluated against established standards. Retention limits are applied to limit the exposure per individual life;
Appropriate income replacement levels apply to disability insurance;
112

The experience of reinsurers is used where necessary for the rating of substandard risks; The risk premiums for Group risk business and some of the in-force individual risk business can be adjusted
within 12 months should claims experience deteriorate to the extent that such an adjustment is considered necessary. Most of the individual new business is sold with a guarantee that risk premiums would not be increased for the first 5 to 15 years;
Risk profits are determined on a regular basis; and Regular investigations into mortality and morbidity experience are conducted to ensure that corrective action,
for example rerating of premiums, is taken where necessary. Expense risk: Expenses are managed through the Group’s budgeting process and continuous monitoring of actual versus budgeted expenses is conducted and reported on. Sensitivity to insurance risk: The table below illustrates the change in the present value of future after-tax profit for changes in insurance risk:
2010 2009Sensitivity to insurance risk R million R million
Expenses and persistency• Maintenance unit expenses (excluding investment expenses)
decrease by 10% 560 483• Discontinuance rates decrease by 10% 397 282
Insurance risk• Base mortality and morbidity rates decreased by 5% for life
assurance business 788 706• Base mortality and morbidity rates decreased by 5% for life
assurance annuity business (159) (105) Concentration risk: The Group writes a diverse mix of business, and continually monitors this risk and the opportunities for mitigating actions through reinsurance. The Group’s life insurance businesses are focused on different market segments, resulting in a mix of individual and institutional clients, as well as entry-level, middle market and high net worth clients. The Group’s operations in the entry-level market segment is not exposed to excessive concentration risk given the nature of business sold in this market, which comprises small value policies to a large number of policyholders. The main concentration risk is assumed by Sanlam Life, which serves the middle-income and high net worth market segments in South Africa and Namibia. The tables below provide an analysis of the exposure to the value of benefits insured in respect of non-participating life business as well as the annuity payable per policy in respect of non-participating annuities for the Group’s operations in the middle income and high net worth markets.
113
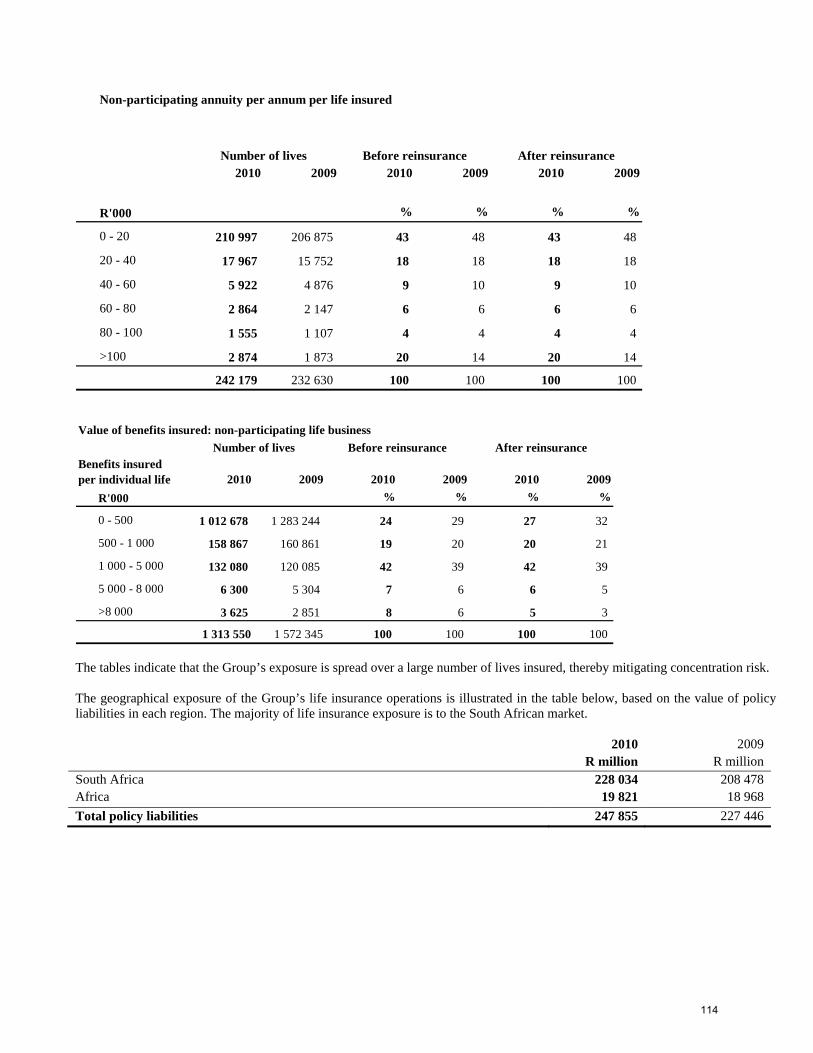
Non-participating annuity per annum per life insured
2010 2009 2010 2009 2010 2009
R'000 % % % %
0 - 20 210 997 206 875 43 48 43 48
20 - 40 17 967 15 752 18 18 18 18
40 - 60 5 922 4 876 9 10 9 10
60 - 80 2 864 2 147 6 6 6 6
80 - 100 1 555 1 107 4 4 4 4
>100 2 874 1 873 20 14 20 14
242 179 232 630 100 100 100 100
Before reinsurance After reinsuranceNumber of lives
Value of benefits insured: non-participating life business
Benefits insured per individual life 2010 2009 2010 2009 2010 2009
R'000 % % % %
0 - 500 1 012 678 1 283 244 24 29 27 32
500 - 1 000 158 867 160 861 19 20 20 21
1 000 - 5 000 132 080 120 085 42 39 42 39
5 000 - 8 000 6 300 5 304 7 6 6 5
>8 000 3 625 2 851 8 6 5 3
1 313 550 1 572 345 100 100 100 100
Before reinsurance After reinsuranceNumber of lives
The tables indicate that the Group’s exposure is spread over a large number of lives insured, thereby mitigating concentration risk. The geographical exposure of the Group’s life insurance operations is illustrated in the table below, based on the value of policy liabilities in each region. The majority of life insurance exposure is to the South African market. 2010 2009
R million R million 228 034 South Africa 208 478
Africa 19 821 18 968 Total policy liabilities 247 855 227 446
114
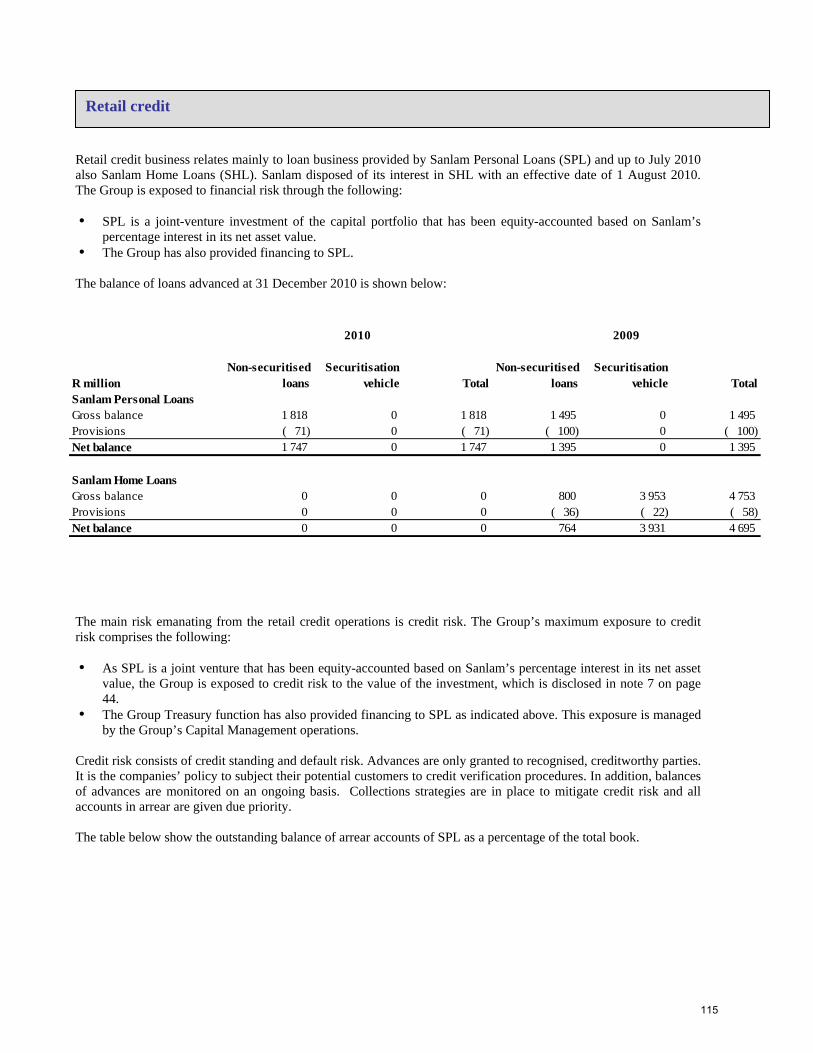
Retail credit
Retail credit business relates mainly to loan business provided by Sanlam Personal Loans (SPL) and up to July 2010 also Sanlam Home Loans (SHL). Sanlam disposed of its interest in SHL with an effective date of 1 August 2010. The Group is exposed to financial risk through the following:
SPL is a joint-venture investment of the capital portfolio that has been equity-accounted based on Sanlam’s percentage interest in its net asset value.
The Group has also provided financing to SPL. The balance of loans advanced at 31 December 2010 is shown below:
2010 2009
R millionNon-securitised
loansSecuritisation
vehicle TotalNon-securitised
loansSecuritisation
vehicle TotalSanlam Personal LoansGross balance 1 818 0 1 818 1 495 0 1 495 Provisions ( 71) 0 ( 71) ( 100) 0 ( 100)Net balance 1 747 0 1 747 1 395 0 1 395
Sanlam Home LoansGross balance 0 0 0 800 3 953 4 753 Provisions 0 0 0 ( 36) ( 22) ( 58)Net balance 0 0 0 764 3 931 4 695 The main risk emanating from the retail credit operations is credit risk. The Group’s maximum exposure to credit risk comprises the following:
As SPL is a joint venture that has been equity-accounted based on Sanlam’s percentage interest in its net asset value, the Group is exposed to credit risk to the value of the investment, which is disclosed in note 7 on page 44.
The Group Treasury function has also provided financing to SPL as indicated above. This exposure is managed by the Group’s Capital Management operations.
Credit risk consists of credit standing and default risk. Advances are only granted to recognised, creditworthy parties. It is the companies’ policy to subject their potential customers to credit verification procedures. In addition, balances of advances are monitored on an ongoing basis. Collections strategies are in place to mitigate credit risk and all accounts in arrear are given due priority. The table below show the outstanding balance of arrear accounts of SPL as a percentage of the total book.
115
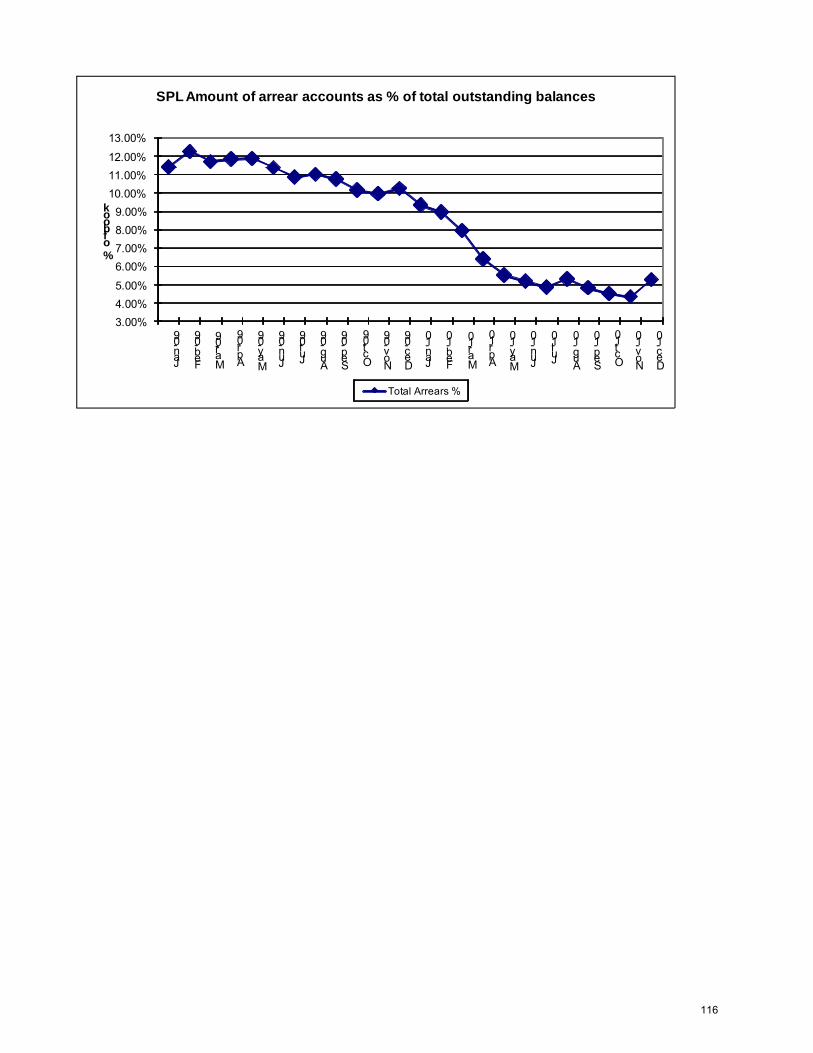
3.00%4.00%5.00%
6.00%7.00%8.00%9.00%
10.00%11.00%12.00%
13.00%
Jan-09
Feb-09
Mar-09
Apr-09
May-09
Jun-09
Jul-09
Aug-09
Sep-09
Oct-09
Nov-09
Dec-09
Jan-10
Feb-10
Mar-10
Apr-10
May-10
Jun-10
Jul-10
Aug-10
Sep-10
Oct-10
Nov-10
Dec-10
% of book
SPL Amount of arrear accounts as % of total outstanding balances
Total Arrears %
116
Short-term insurance
The Group’s short-term insurance operations include Santam and MiWay, the direct financial services company launched during 2008. Risk management framework Santam has an established enterprise risk management framework that is designed to identify, assess, measure and manage exposure to risk. Its primary objective is to protect the Group from events that hinder the sustainable achievement of the Group’s performance objectives, including failing to exploit opportunities. Regulatory impact on risk and risk assessments Santam’s short-term insurance operations are subject to regulatory requirements that prescribe the type, quality and concentrations of investments, and the level of assets to be maintained in local currency to meet insurance liabilities. These requirements help to maintain market risk at an acceptable level. Santam monitors specific risks on a regular basis through its risk monitoring framework. Business units are required to disclose to the Group risk function all material risks, along with information on likelihood and severity of risks, and the mitigating actions taken or planned. This enables Santam to assess its overall risk exposure and to develop a Group-wide risk map, identifying any concentration of risk that may exist, and to define which risks and what level of risk Santam is prepared to accept. The risk map is refreshed quarterly, and business units are required to escalate material changes intra-quarter. Market risk Market risk arises in business units due to fluctuations in both the value of liabilities and the value of investments held. At a Santam Group level, it also arises in relation to the value of investment assets owned directly by the shareholders’ fund. Santam has established a policy on market risk which sets out the principles that businesses are expected to adopt in respect of management of the key market risks to which Santam is exposed. Santam monitors adherence to this market risk policy and regularly reviews how business units are managing these risks through the Santam Investment committee. For each of the major components of market risk, described in more detail below, Santam has put in place additional policies and procedures to set out how each risk should be managed and monitored, and the approach to setting an appropriate risk appetite. Price risk Santam is subject to price risk due to daily changes in the market values of its equity and debt securities portfolios. Santam is not exposed to commodity price risk. The objective is to earn competitive relative returns by investing in a diverse portfolio of high-quality, liquid securities. Portfolio characteristics are analysed regularly and equity price risk is actively managed through a variety of modelling methods. Holdings are diversified across industries, and concentrations in any one company or industry are limited by parameters established by management and statutory requirements. At 31 December 2010, Santam’s listed equities were recorded at their fair value of R3 498 million (2009: R2 872 million. These figures include linked policy investments to the value of R252 million (2009: R152 million). Santam is not exposed to significant price risk in respect of this investment. A hypothetical 10% decline in each individual share price would have the net effect of decreasing profit before taxation by R350 million (2009: R287 million). A hypothetical 10% increase in each individual share price would have the net effect of increasing profit before taxation by R350 million (2009: R287 million), before taking into account the effect of the derivative. Short-term insurance liabilities are not directly sensitive to equity price risk. Long-term investment contract liabilities are sensitive to price risk of linked assets. The Santam Board actively monitors equity assets owned directly by Santam, which include some material shareholdings in the strategic business partners. Concentrations of specific equity holdings, e.g. strategic holdings, are also monitored.
117
Interest rate risk Interest rate risk arises primarily from investments in long-term debt and fixed income securities, which are exposed to fluctuations in interest rates. Exposure to interest rate risk is monitored through several measures that include scenario testing and stress testing using measures such as duration. Interest rate risk is also managed using derivative instruments, including futures, options and swaps, to provide a degree of hedging against unfavourable market movements in interest rates inherent in the assets backing technical liabilities. At 31 December 2010, Santam had an interest rate swap agreement to partially mitigate the effects of potential adverse interest rate movements on financial assets underlying the unsecured subordinated callable notes.
Short-term insurance liabilities are not directly sensitive to the level of market interest rates, as they are undiscounted and contractually non-interest-bearing.
Foreign currency risk Santam’s exposure to currency risk is mainly in respect of foreign investments made in line with the long-term strategy approved by the Board for seeking desirable international diversification of investments to expand its income stream. The company has investments in foreign subsidiaries whose net assets are exposed to currency translation risk, primarily to the British pound. In addition, the Southern African operations have foreign exchange exposure in respect of net monetary assets denominated in foreign currency, predominantly US dollar and the British pound.
Santam does not take cover on foreign currency balances, but evaluates the need for cover on transactions on a case by case basis.
The following assets and liabilities denominated in foreign currencies are included in the Statement of financial position (including non-current assets classified as held for sale in 2009):
31 December 2010
Euro
United States
Dollar
British
Pound Total
Equities and similar securities - - - -
Debentures, insurance policies, public sector stocks and other loans - - - -
Cash, deposits and similar securities 3 377 54 434
Net other liabilities - (25) - (25)
Net working capital - 2 (133) (131)
Foreign currency exposure 3 354 (79) 278
31 December 2009
Equities and similar securities - - - -
Debentures, insurance policies, public sector stocks and other loans - - - -
Cash, deposits and similar securities 1 347 77 425
Net other liabilities (7) (48) - (55)
Net working capital - 66 (149) (83)
Foreign currency exposure (6) 365 (72) 287
118
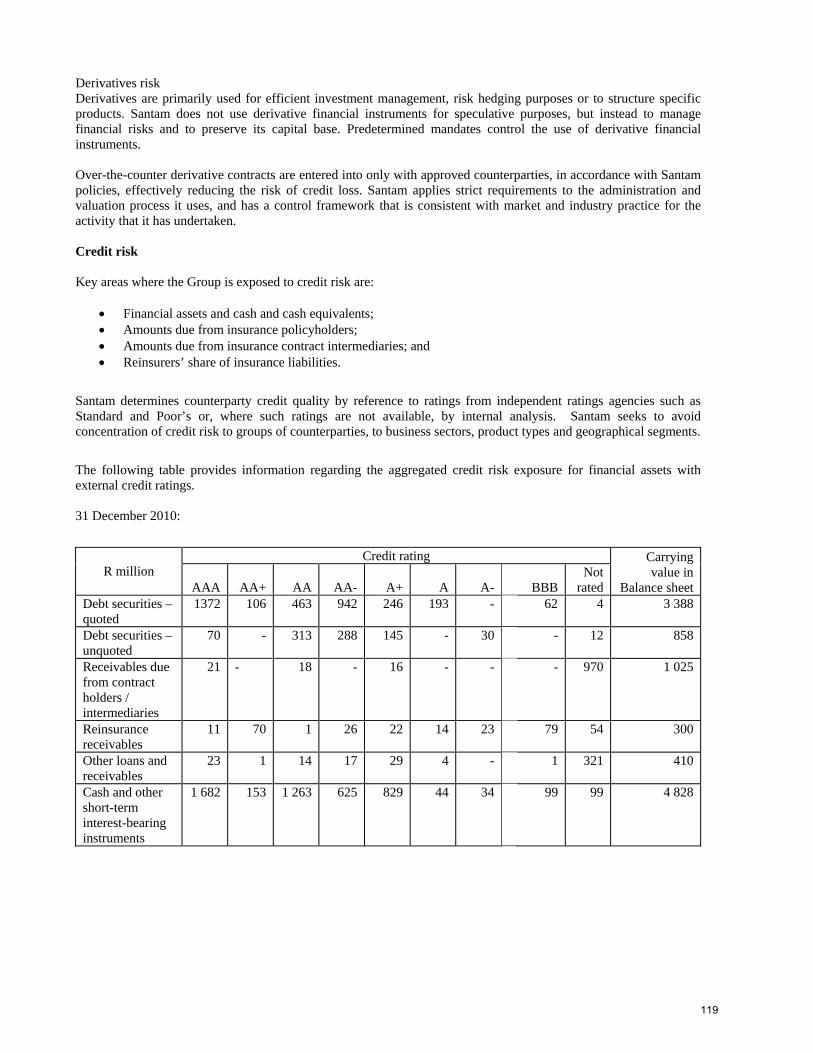
Derivatives risk Derivatives are primarily used for efficient investment management, risk hedging purposes or to structure specific products. Santam does not use derivative financial instruments for speculative purposes, but instead to manage financial risks and to preserve its capital base. Predetermined mandates control the use of derivative financial instruments. Over-the-counter derivative contracts are entered into only with approved counterparties, in accordance with Santam policies, effectively reducing the risk of credit loss. Santam applies strict requirements to the administration and valuation process it uses, and has a control framework that is consistent with market and industry practice for the activity that it has undertaken. Credit risk Key areas where the Group is exposed to credit risk are:
• Financial assets and cash and cash equivalents; • Amounts due from insurance policyholders; • Amounts due from insurance contract intermediaries; and • Reinsurers’ share of insurance liabilities.
Santam determines counterparty credit quality by reference to ratings from independent ratings agencies such as Standard and Poor’s or, where such ratings are not available, by internal analysis. Santam seeks to avoid concentration of credit risk to groups of counterparties, to business sectors, product types and geographical segments.
The following table provides information regarding the aggregated credit risk exposure for financial assets with external credit ratings. 31 December 2010:
Credit rating Carrying value in
Balance sheet R million
A+ A A-
AAA AA+ AA AA- BBB Not
rated Debt securities – quoted
1372 106 463 942 246 193 - 62 4 3 388
Debt securities – unquoted
70 - 313 288 145 - 30 - 12 858
Receivables due from contract holders / intermediaries
21 - 18 - 16 - - - 970 1 025
Reinsurance receivables
11 70 1 26 22 14 23 79 54 300
Other loans and receivables
23 1 14 17 29 4 - 1
321 410
Cash and other short-term interest-bearing instruments
1 682 153 1 263 625 829 44 34 99 99 4 828
119
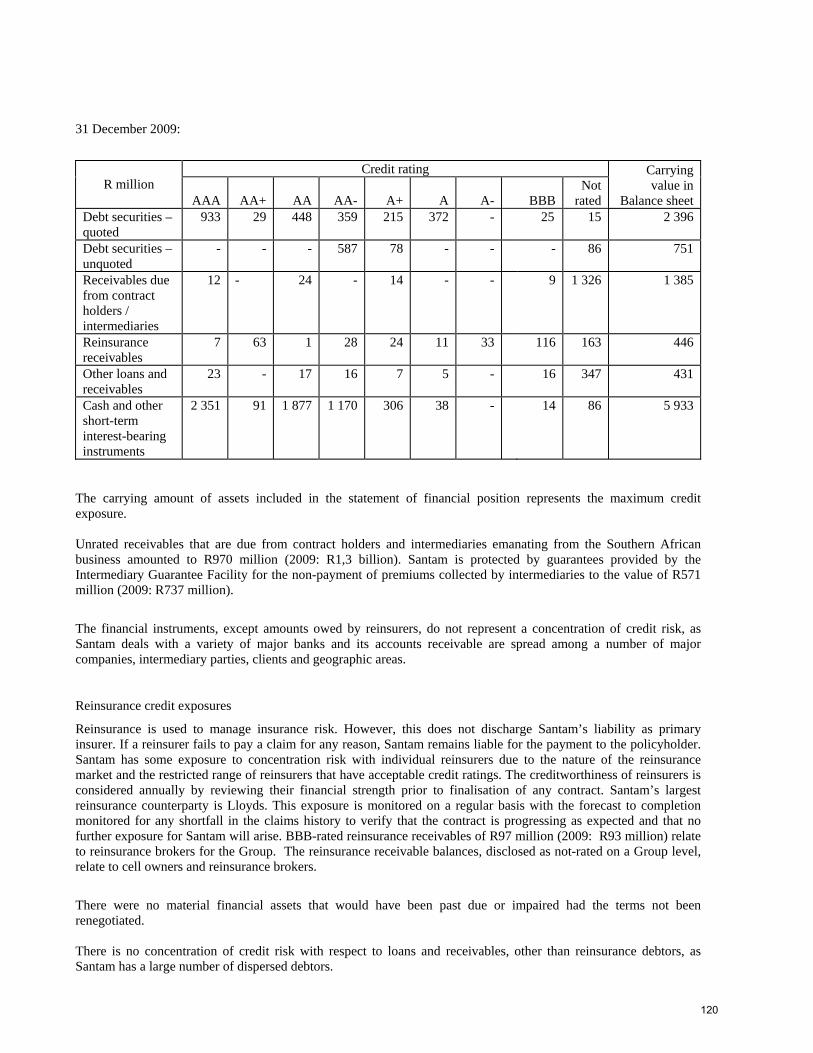
31 December 2009:
Credit rating Carrying value in
Balance sheet R million
A+ A A-
AAA AA+ AA AA- BBB Not
rated Debt securities – quoted
933 29 448 359 215 372 - 25 15 2 396
Debt securities – unquoted
- - - 587 78 - - - 86 751
Receivables due from contract holders / intermediaries
12 - 24 - 14 - - 9 1 326 1 385
Reinsurance receivables
7 63 1 28 24 11 33 116 163 446
Other loans and receivables
23 - 17 16 7 5 - 16
The carrying amount of assets included in the statement of financial position represents the maximum credit exposure. Unrated receivables that are due from contract holders and intermediaries emanating from the Southern African business amounted to R970 million (2009: R1,3 billion). Santam is protected by guarantees provided by the Intermediary Guarantee Facility for the non-payment of premiums collected by intermediaries to the value of R571 million (2009: R737 million).
The financial instruments, except amounts owed by reinsurers, do not represent a concentration of credit risk, as Santam deals with a variety of major banks and its accounts receivable are spread among a number of major companies, intermediary parties, clients and geographic areas.
Reinsurance credit exposures
347 431
Cash and other short-term interest-bearing instruments
2 351 91 1 877 1 170 306 38 - 14 86 5 933
Reinsurance is used to manage insurance risk. However, this does not discharge Santam’s liability as primary insurer. If a reinsurer fails to pay a claim for any reason, Santam remains liable for the payment to the policyholder. Santam has some exposure to concentration risk with individual reinsurers due to the nature of the reinsurance market and the restricted range of reinsurers that have acceptable credit ratings. The creditworthiness of reinsurers is considered annually by reviewing their financial strength prior to finalisation of any contract. Santam’s largest reinsurance counterparty is Lloyds. This exposure is monitored on a regular basis with the forecast to completion monitored for any shortfall in the claims history to verify that the contract is progressing as expected and that no further exposure for Santam will arise. BBB-rated reinsurance receivables of R97 million (2009: R93 million) relate to reinsurance brokers for the Group. The reinsurance receivable balances, disclosed as not-rated on a Group level, relate to cell owners and reinsurance brokers.
There were no material financial assets that would have been past due or impaired had the terms not been renegotiated. There is no concentration of credit risk with respect to loans and receivables, other than reinsurance debtors, as Santam has a large number of dispersed debtors.
120

Insurance risk Santam issues contracts that transfer insurance risk or financial risk or both. This section summarises these risks and the way Santam manages them. Terms and conditions of insurance contracts Engineering – Provides cover for risks relating to The possession, use or ownership of machinery or equipment, other than a motor vehicle, in the carrying on of a
business; The erection of buildings or other structures or the undertaking of other works; and The installation of machinery or equipment.
Guarantee – A contract whereby the insurer assumes an obligation to discharge the debts or other obligations of another person in the event of the failure of that person to do so. Liability – Provides cover for risks relating to the incurring of a liability other than relating to a risk covered more specifically under another insurance contract. Motor – Covers risks relating to the possession, use or ownership of a motor vehicle. This cover can include risks relating to vehicle accident, theft or damage to third-party property or legal liability arising from the possession, use or ownership of the insured vehicle. Accident and health – Provides cover for death, disability and certain health events. This excludes the benefits to the provider of health services, and is linked directly to the expenditure in respect of health services. Property – Covers risks relating to the use, ownership, loss of or damage to movable or immovable property other than a risk covered more specifically under another insurance contract. Transportation – Covers risks relating to the possession, use or ownership of a vessel, aircraft or other craft or for the conveyance of persons or goods by air, space, land or water. It also covers risks relating to the storage, treatment or handling of goods that are conveyed. Crop – Provides indemnity for crops while still on the field against hail, drought and excessive rainfall. Cover ceases as soon as harvesting has taken place. Alternative risk transfer (ART) – The use of techniques, other than traditional insurance, that include at least an element of insurance risk, to provide entities with risk coverage or protection. Insurance risk in Santam arises from:
Fluctuations in the timing, frequency and severity of claims and claim settlements relative to expectations; Unexpected claims arising from a single source; Inaccurate pricing of risks when underwritten; Inadequate reinsurance protection or other risk transfer techniques; and Inadequate reserving.
The risks under any one insurance contract are the frequency with which the insured event occurs and the uncertainty of the amount of the resulting claims. For a portfolio of insurance contracts where the theory of probability is applied to pricing and reserving, the principal risks Santam face are that the actual claims and benefit payments exceed the premiums charged for the risks assumed and that the reserves set aside for policyholders’ liabilities, whether they are known or still to be reported, prove to be insufficient. By the very nature of an insurance contract, this risk is random and therefore unpredictable. Changing risk parameters and unforeseen factors, such as patterns of crime, economic and geographical circumstances, may result in unexpectedly large claims. Insurance events are random and the actual number of claims and benefits will vary from year to year from the estimate established using statistical techniques.
121
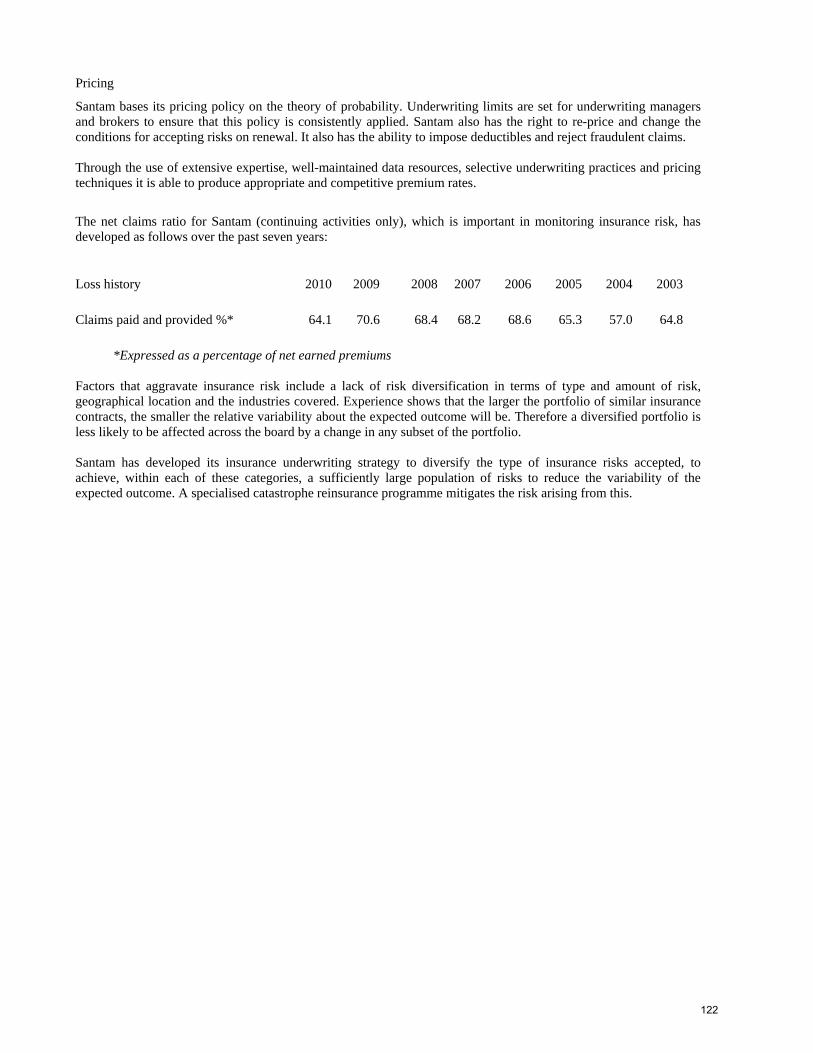
Pricing
Santam bases its pricing policy on the theory of probability. Underwriting limits are set for underwriting managers and brokers to ensure that this policy is consistently applied. Santam also has the right to re-price and change the conditions for accepting risks on renewal. It also has the ability to impose deductibles and reject fraudulent claims. Through the use of extensive expertise, well-maintained data resources, selective underwriting practices and pricing techniques it is able to produce appropriate and competitive premium rates.
The net claims ratio for Santam (continuing activities only), which is important in monitoring insurance risk, has developed as follows over the past seven years:
Loss history 2010 2009 2008 2007 2006 2005 2004 2003 Claims paid and provided %* 64.1 70.6 68.4 68.2 68.6 65.3 57.0 64.8 *Expressed as a percentage of net earned premiums Factors that aggravate insurance risk include a lack of risk diversification in terms of type and amount of risk, geographical location and the industries covered. Experience shows that the larger the portfolio of similar insurance contracts, the smaller the relative variability about the expected outcome will be. Therefore a diversified portfolio is less likely to be affected across the board by a change in any subset of the portfolio. Santam has developed its insurance underwriting strategy to diversify the type of insurance risks accepted, to achieve, within each of these categories, a sufficiently large population of risks to reduce the variability of the expected outcome. A specialised catastrophe reinsurance programme mitigates the risk arising from this.
122
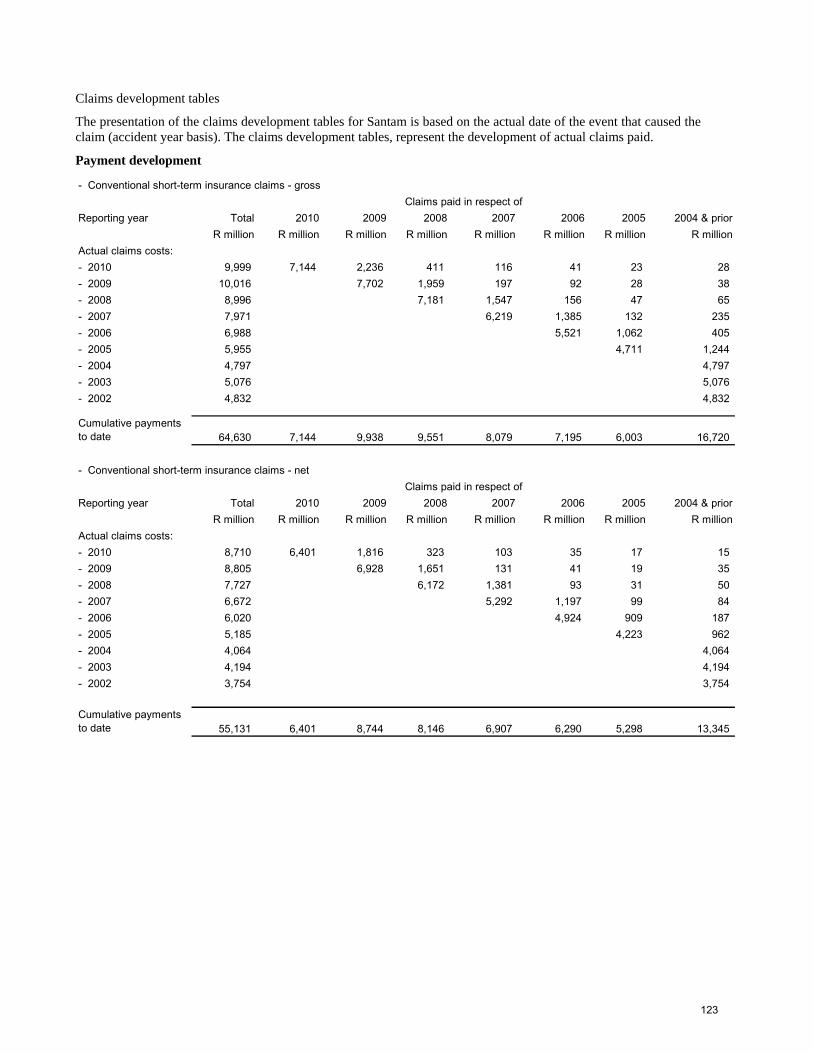
Claims development tables
The presentation of the claims development tables for Santam is based on the actual date of the event that caused the claim (accident year basis). The claims development tables, represent the development of actual claims paid.
Payment development
- Conventional short-term insurance claims - gross
Reporting year Total 2010 2009 2008 2007 2006 2005 2004 & priorR million R million R million R million R million R million R million R million
Actual claims costs:- 2010 9,999 7,144 2,236 411 116 41 23 28 - 2009 10,016 7,702 1,959 197 92 28 38 - 2008 8,996 7,181 1,547 156 47 65 - 2007 7,971 6,219 1,385 132 235 - 2006 6,988 5,521 1,062 405 - 2005 5,955 4,711 1,244 - 2004 4,797 4,797 - 2003 5,076 5,076 - 2002 4,832 4,832
Cumulative payments to date 64,630 7,144 9,938 9,551 8,079 7,195 6,003 16,720
- Conventional short-term insurance claims - net
Reporting year Total 2010 2009 2008 2007 2006 2005 2004 & priorR million R million R million R million R million R million R million R million
Actual claims costs:- 2010 8,710 6,401 1,816 323 103 35 17 15 - 2009 8,805 6,928 1,651 131 41 19 35 - 2008 7,727 6,172 1,381 93 31 50 - 2007 6,672 5,292 1,197 99 84 - 2006 6,020 4,924 909 187 - 2005 5,185 4,223 962 - 2004 4,064 4,064 - 2003 4,194 4,194 - 2002 3,754 3,754
Cumulative payments to date 55,131 6,401 8,744 8,146 6,907 6,290 5,298 13,345
Claims paid in respect of
Claims paid in respect of
123
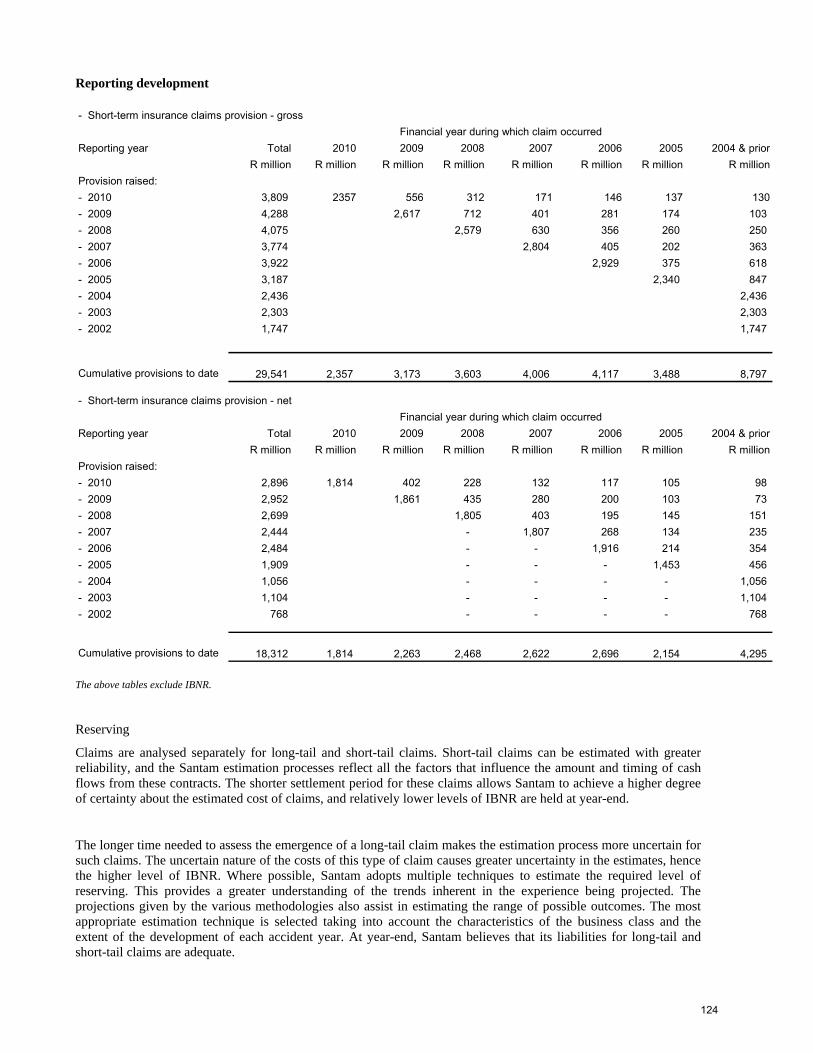
Reporting development - Short-term insurance claims provision - gross
Reporting year Total 2010 2009 2008 2007 2006 2005 2004 & priorR million R million R million R million R million R million R million R million
Provision raised:- 2010 3,809 2357 556 312 171 146 137 130- 2009 4,288 2,617 712 401 281 174 103 - 2008 4,075 2,579 630 356 260 250 - 2007 3,774 2,804 405 202 363 - 2006 3,922 2,929 375 618 - 2005 3,187 2,340 847 - 2004 2,436 2,436 - 2003 2,303 2,303 - 2002 1,747 1,747
Cumulative provisions to date 29,541 2,357 3,173 3,603 4,006 4,117 3,488 8,797
- Short-term insurance claims provision - net
Reporting year Total 2010 2009 2008 2007 2006 2005 2004 & priorR million R million R million R million R million R million R million R million
Provision raised:- 2010 2,896 1,814 402 228 132 117 105 98 - 2009 2,952 1,861 435 280 200 103 73 - 2008 2,699 1,805 403 195 145 151 - 2007 2,444 - 1,807 268 134 235 - 2006 2,484 - - 1,916 214 354 - 2005 1,909 - - - 1,453 456 - 2004 1,056 - - - - 1,056 - 2003 1,104 - - - - 1,104 - 2002 768 - - - - 768
Cumulative provisions to date 18,312 1,814 2,263 2,468 2,622 2,696 2,154 4,295
Financial year during which claim occurred
Financial year during which claim occurred
The above tables exclude IBNR. Reserving
Claims are analysed separately for long-tail and short-tail claims. Short-tail claims can be estimated with greater reliability, and the Santam estimation processes reflect all the factors that influence the amount and timing of cash flows from these contracts. The shorter settlement period for these claims allows Santam to achieve a higher degree of certainty about the estimated cost of claims, and relatively lower levels of IBNR are held at year-end.
The longer time needed to assess the emergence of a long-tail claim makes the estimation process more uncertain for such claims. The uncertain nature of the costs of this type of claim causes greater uncertainty in the estimates, hence the higher level of IBNR. Where possible, Santam adopts multiple techniques to estimate the required level of reserving. This provides a greater understanding of the trends inherent in the experience being projected. The projections given by the various methodologies also assist in estimating the range of possible outcomes. The most appropriate estimation technique is selected taking into account the characteristics of the business class and the extent of the development of each accident year. At year-end, Santam believes that its liabilities for long-tail and short-tail claims are adequate.
124
In calculating the estimated cost of unpaid claims, Santam’s estimation methodology is based on standard statistical techniques. For claims that have been reported to Santam by the valuation date, expert assessors estimate the expected cost of final settlement. In addition to this, testing of the entire portfolio is done to determine whether or not these estimates are likely to be sufficient in aggregate or if an additional reserve amount is required.
For claims that have not been reported to Santam by the valuation date, the chain-ladder methodology is used to determine the expected cost of these unreported claims.
A stochastic reserving process is performed and Santam holds its reserves for unpaid claims at at least the 75th percentile level of sufficiency.
Claim provisions for all classes of business are regularly reviewed and audited internally to make sure they are sufficient. These analyses draw on the expertise and experience of a wide range of specialists, such as actuaries, underwriting and accounting experts.
Accumulation risk Santam is exposed to accumulation risk in the form of geographical (large metropolitan) areas as well as class of business concentrations of risk. The risk appetite policy dictates how much capital the company is willing to put at risk in the pursuit of value. It is within this risk appetite framework that the reinsurance program has been selected to mitigate accumulation risk within its portfolio. Reinsurance Santam obtains third-party reinsurance cover to reduce risks from single events or accumulations of risk that could have a significant impact on the current year’s earnings or capital. This cover is placed on the local and international reinsurance market. Santam uses a number of modelling tools to monitor aggregation and to simulate catastrophe losses to measure the effectiveness of the reinsurance programme and the net exposure of Santam. The core components of the reinsurance programme comprise: Individual excess-of-loss cover for property, liability and engineering risks, which provides protection to limit
losses to R50 million per event, excluding reinstatement premiums due as a result of the claim against the cover; and
Catastrophe cover to the extent of 1,6% (2009: 1,6%) of the total exposure of the significant geographical areas, amounting to protection of up to R6,5 billion per event.
The Santam Board approves the reinsurance renewal process on an annual basis. The major portion of the reinsurance programme is placed with external reinsurers that have an international credit rating of no less than A- from Standard and Poor’s or AM Best.
Liquidity risk Liquidity risk is the risk that the business will encounter difficulty in raising funds to meet commitments associated with financial instruments. Liquidity risk arises when there is mismatching between the maturities of liabilities and assets.
Santam is exposed to daily calls on its available cash resources from claims. Liquidity risk is the risk that cash may not be available to pay obligations when due at a reasonable cost. The Santam Board sets limits on the minimum proportion of maturing funds available to meet such calls.
Santam actively manages its cash resources, split between short-term and long-term to ensure sufficient cash is at hand to settle insurance liabilities, based on monthly float projections. Santam has sufficient cash resources to cover its obligations. R6,4 billion (2009: R6,5 billion) of insurance liabilities are payable within one year, with the
125

remaining balance predominantly payable within two to five years. Cell owners’ interest liabilities are predominantly payable within two to five years.
126
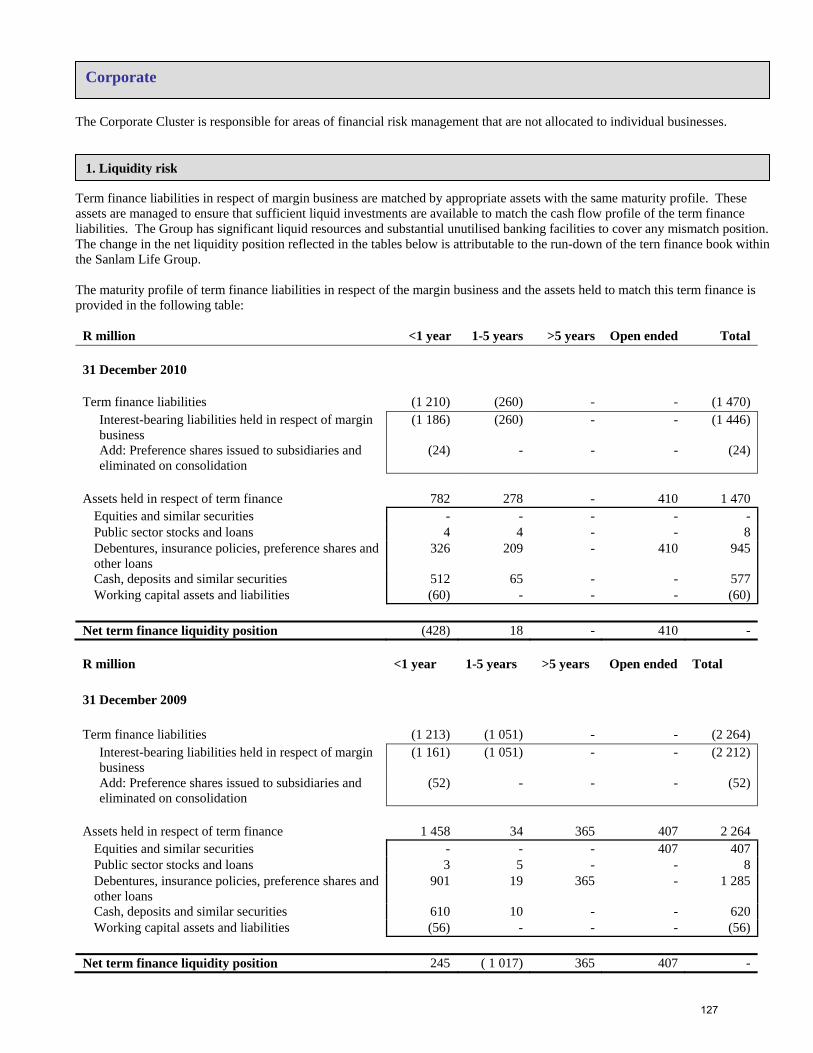
The Corporate Cluster is responsible for areas of financial risk management that are not allocated to individual businesses. Term finance liabilities in respect of margin business are matched by appropriate assets with the same maturity profile. These assets are managed to ensure that sufficient liquid investments are available to match the cash flow profile of the term finance liabilities. The Group has significant liquid resources and substantial unutilised banking facilities to cover any mismatch position. The change in the net liquidity position reflected in the tables below is attributable to the run-down of the tern finance book within the Sanlam Life Group. The maturity profile of term finance liabilities in respect of the margin business and the assets held to match this term finance is provided in the following table:
R million <1 year 1-5 years >5 years Open ended Total 31 December 2010 Term finance liabilities (1 210) (260) - - (1 470)
Interest-bearing liabilities held in respect of margin business
(1 186) (260) - - (1 446)
Add: Preference shares issued to subsidiaries and eliminated on consolidation
(24) - - - (24)
Assets held in respect of term finance 782 278 - 410 1 470
Equities and similar securities - - - - -Public sector stocks and loans 4 4 - - 8Debentures, insurance policies, preference shares and other loans
326 209 - 410 945
Cash, deposits and similar securities 512 65 - - 577Working capital assets and liabilities (60) - - - (60)
Net term finance liquidity position (428) 18 - 410 -
R million <1 year 1-5 years >5 years Open ended Total 31 December 2009 Term finance liabilities (1 213) (1 051) - - (2 264)
Interest-bearing liabilities held in respect of margin business
(1 161) (1 051) - - (2 212)
Add: Preference shares issued to subsidiaries and eliminated on consolidation
(52) - - - (52)
Assets held in respect of term finance 1 458 34 365 407 2 264
Equities and similar securities - - - 407 407Public sector stocks and loans 3 5 - - 8Debentures, insurance policies, preference shares and other loans
901 19 365 - 1 285
Cash, deposits and similar securities 610 10 - - 620Working capital assets and liabilities (56) - - - (56)
Net term finance liquidity position 245 ( 1 017) 365 407 -
1. Liquidity risk
Corporate
127
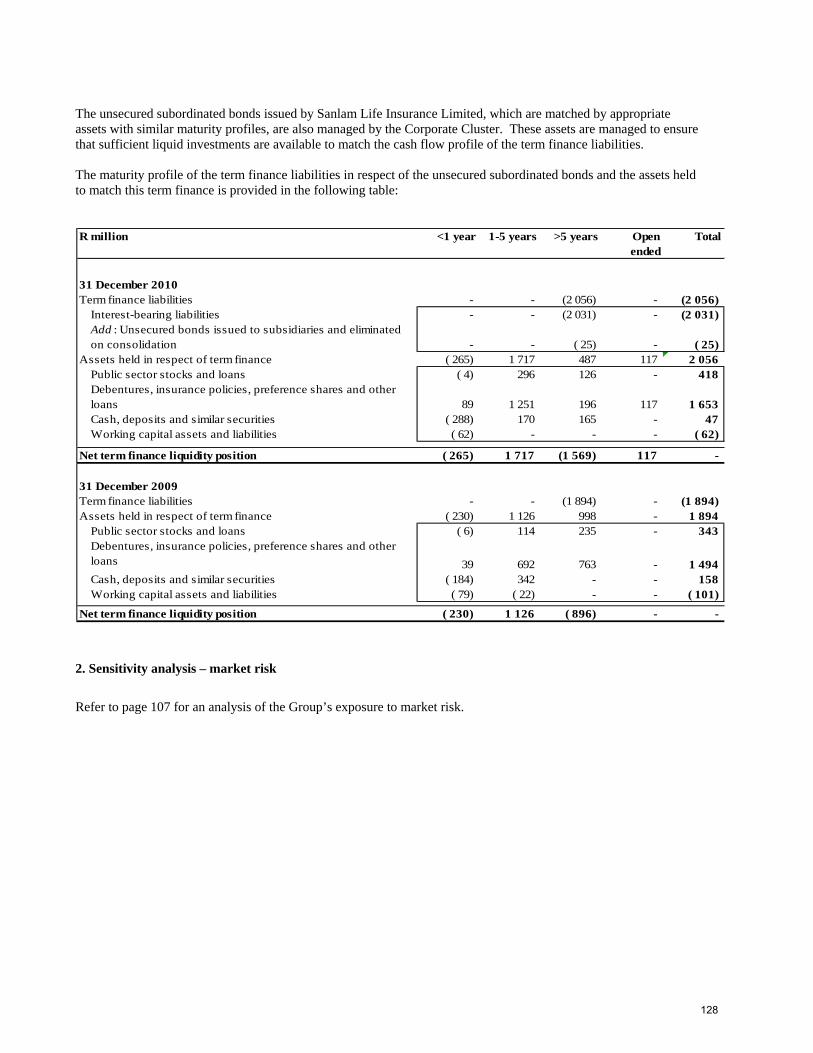
The unsecured subordinated bonds issued by Sanlam Life Insurance Limited, which are matched by appropriate assets with similar maturity profiles, are also managed by the Corporate Cluster. These assets are managed to ensure that sufficient liquid investments are available to match the cash flow profile of the term finance liabilities. The maturity profile of the term finance liabilities in respect of the unsecured subordinated bonds and the assets held to match this term finance is provided in the following table:
2. Sensitivity analysis – market risk
R million <1 year 1-5 years >5 years Open ended
Total
31 December 2010Term finance liabilities - - (2 056) - (2 056)
Interest-bearing liabilities - - (2 031) - (2 031) Add : Unsecured bonds issued to subsidiaries and eliminated on consolidation - - ( 25) - ( 25)
Assets held in respect of term finance ( 265) 1 717 487 117 2 056 Public sector stocks and loans ( 4) 296 126 - 418 Debentures, insurance policies, preference shares and other loans 89 1 251 196 117 1 653 Cash, deposits and similar securities ( 288) 170 165 - 47 Working capital assets and liabilities ( 62) - - - ( 62)
Net term finance liquidity position ( 265) 1 717 (1 569) 117 -
31 December 2009Term finance liabilities - - (1 894) - (1 894) Assets held in respect of term finance ( 230) 1 126 998 - 1 894
Public sector stocks and loans ( 6) 114 235 - 343 Debentures, insurance policies, preference shares and other loans 39 692 763 - 1 494 Cash, deposits and similar securities ( 184) 342 - - 158 Working capital assets and liabilities ( 79) ( 22) - - ( 101)
Net term finance liquidity position ( 230) 1 126 ( 896) - -
Refer to page 107 for an analysis of the Group’s exposure to market risk.
128
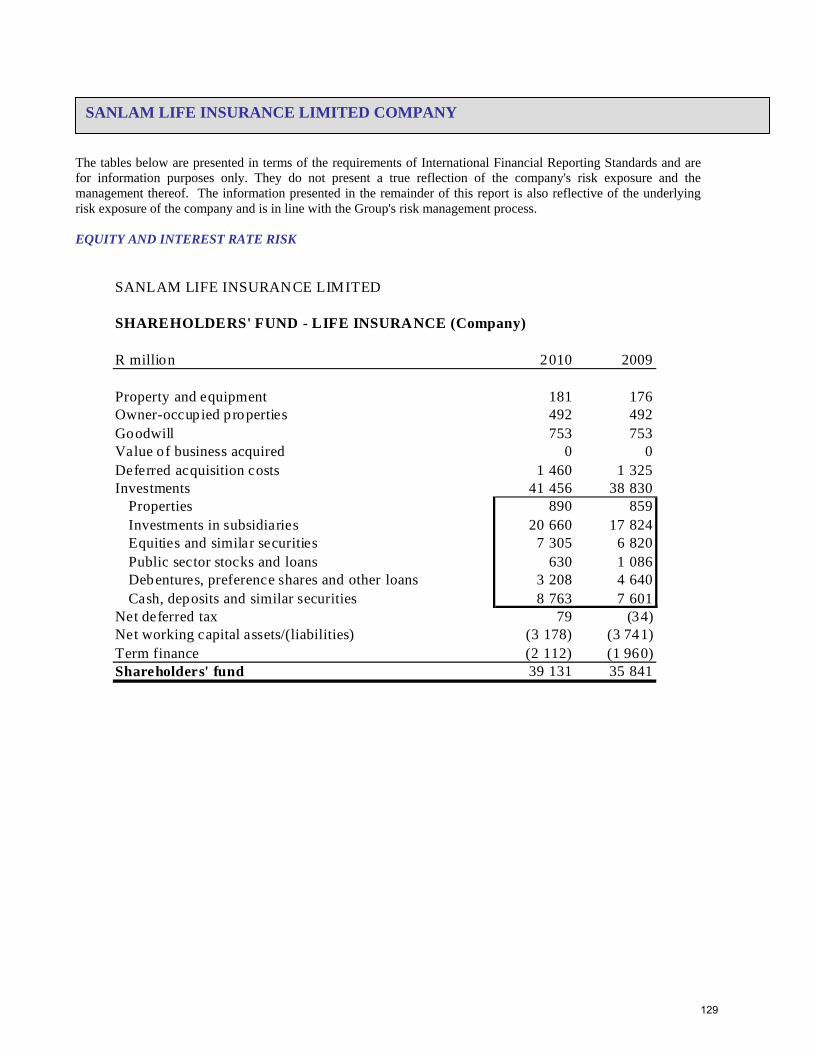
OBJECTIVE
SANLAM LIFE INSURANCE LIMITED COMPANY
The tables below are presented in terms of the requirements of International Financial Reporting Standards and are for information purposes only. They do not present a true reflection of the company's risk exposure and the management thereof. The information presented in the remainder of this report is also reflective of the underlying risk exposure of the company and is in line with the Group's risk management process. EQUITY AND INTEREST RATE RISK
SANLAM LIFE INSURANCE LIMITED
SHAREHOLDERS' FUND - LIFE INSURANCE (Company)
R million 2010 2009
Property and equipment 181 176Owner-occupied properties 492 492Goodwill 753 753Value of business acquired 0 0Deferred acquisition costs 1 460 1 325Investments 41 456 38 830
Properties 890 859Investments in subsidiaries 20 660 17 824Equities and similar securities 7 305 6 820Public sector stocks and loans 630 1 086Debentures, preference shares and other loans 3 208 4 640Cash, deposits and similar securities 8 763 7 601
Net deferred tax 79 (34)Net working capital assets/(liabilities) (3 178) (3 741)Term finance (2 112) (1 960)Shareholders' fund 39 131 35 841
129
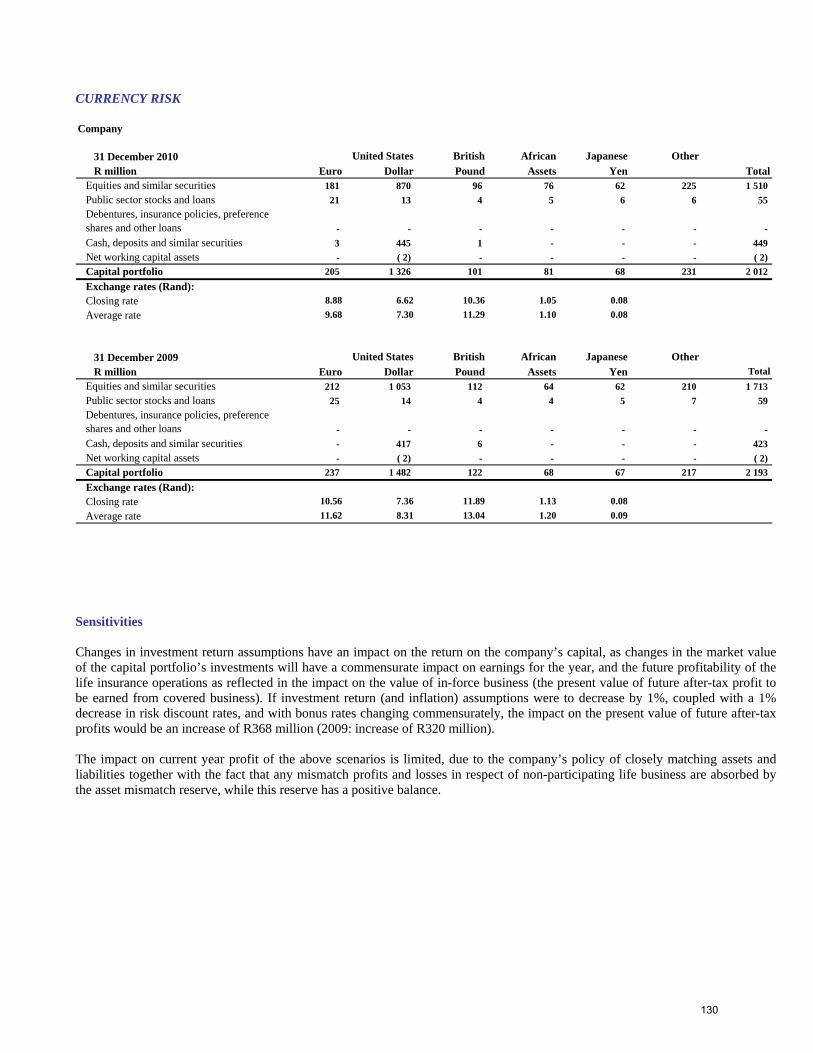
CURRENCY RISK Company
31 December 2010 United States British African Japanese OtherR million Euro Dollar Pound Assets Yen Total
Equities and similar securities 181 870 96 76 62 225 1 510 Public sector stocks and loans 21 13 4 5 6 6 55 Debentures, insurance policies, preference shares and other loans - - - - - - - Cash, deposits and similar securities 3 445 1 - - - 449 Net working capital assets - ( 2) - - - - ( 2) Capital portfolio 205 1 326 101 81 68 231 2 012 Exchange rates (Rand):Closing rate 8.88 6.62 10.36 1.05 0.08Average rate 9.68 7.30 11.29 1.10 0.08
31 December 2009 United States British African Japanese OtherR million Euro Dollar Pound Assets Yen Total
Equities and similar securities 212 1 053 112 64 62 210 1 713 Public sector stocks and loans 25 14 4 4 5 7 59 Debentures, insurance policies, preference shares and other loans - - - - - - - Cash, deposits and similar securities - 417 6 - - - 423 Net working capital assets - ( 2) - - - - ( 2) Capital portfolio 237 1 482 122 68 67 217 2 193 Exchange rates (Rand):Closing rate 10.56 7.36 11.89 1.13 0.08Average rate 11.62 8.31 13.04 1.20 0.09
Sensitivities Changes in investment return assumptions have an impact on the return on the company’s capital, as changes in the market value of the capital portfolio’s investments will have a commensurate impact on earnings for the year, and the future profitability of the life insurance operations as reflected in the impact on the value of in-force business (the present value of future after-tax profit to be earned from covered business). If investment return (and inflation) assumptions were to decrease by 1%, coupled with a 1% decrease in risk discount rates, and with bonus rates changing commensurately, the impact on the present value of future after-tax profits would be an increase of R368 million (2009: increase of R320 million). The impact on current year profit of the above scenarios is limited, due to the company’s policy of closely matching assets and liabilities together with the fact that any mismatch profits and losses in respect of non-participating life business are absorbed by the asset mismatch reserve, while this reserve has a positive balance.
130
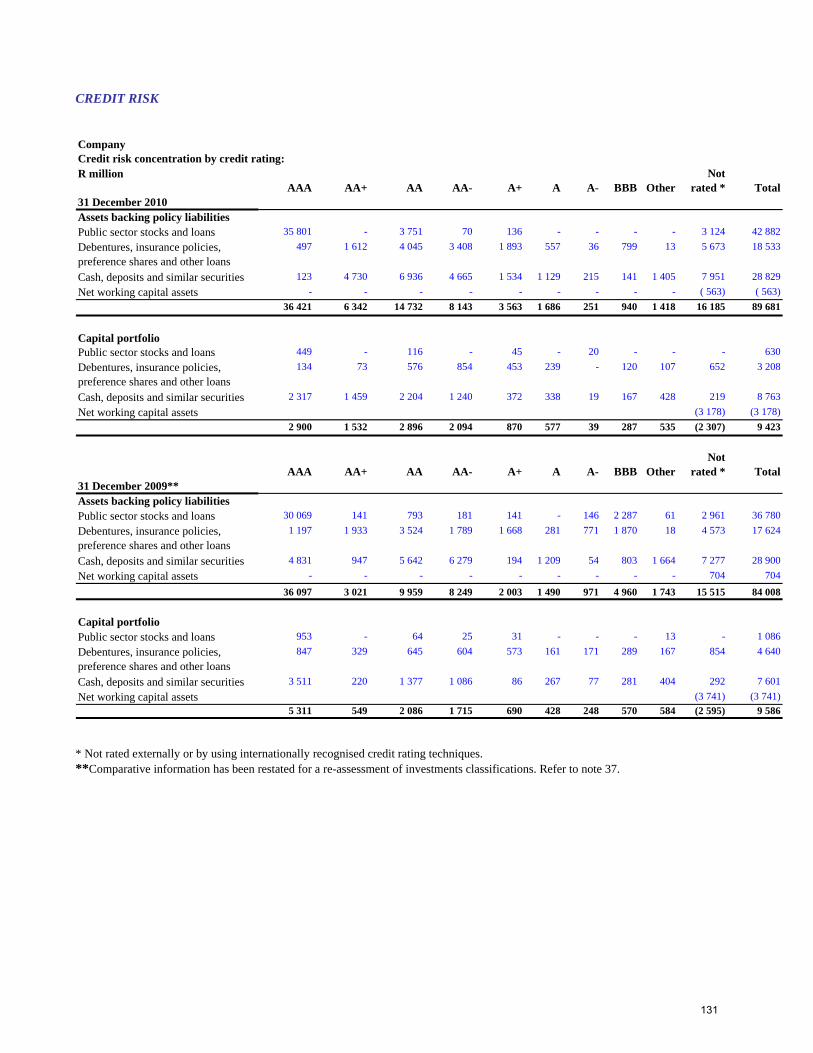
CREDIT RISK CompanyCredit risk concentration by credit rating:R million
AAA AA+ AA AA- A+ A A- BBB OtherNot
rated * Total31 December 2010Assets backing policy liabilitiesPublic sector stocks and loans 35 801 - 3 751 70 136 - - - - 3 124 42 8Debentures, insurance policies, preference shares and other loans
497 1 612 4 045 3 408 1 893 557 36 799 13 5 673 18 533
Cash, deposits and similar securities 123 4 730 6 936 4 665 1 534 1 129 215 141 1 405 7 951 28 829Net working capital assets - - - - - - - - - ( 563) ( 56
36 421 6 342 14 732 8 143 3 563 1 686 251 940 1 418 16 185 89 681
Capital portfolioPublic sector stocks and loans 449 - 116 - 45 - 20 - - - 630Debentures, insurance policies, preference shares and other loans
134 73 576 854 453 239 - 120 107 652 3 208
Cash, deposits and similar securities 2 317 1 459 2 204 1 240 372 338 19 167 428 219 8 763Net working capital assets (3 178) (3 178)
2 900 1 532 2 896 2 094 870 577 39 287 535 (2 307) 9 423
AAA AA+ AA AA- A+ A A- BBB OtherNot
rated * Total31 December 2009**Assets backing policy liabilitiesPublic sector stocks and loans 30 069 141 793 181 141 - 146 2 287 61 2 961 36 780Debentures, insurance policies, preference shares and other loans
1 197 1 933 3 524 1 789 1 668 281 771 1 870 18 4 573 17 624
Cash, deposits and similar securities 4 831 947 5 642 6 279 194 1 209 54 803 1 664 7 277 28 900Net working capital assets - - - - - - - - - 704 7
36 097 3 021 9 959 8 249 2 003 1 490 971 4 960 1 743 15 515 84 008
Capital portfolioPublic sector stocks and loans 953 - 64 25 31 - - - 13 - 1 086Debentures, insurance policies, preference shares and other loans
847 329 645 604 573 161 171 289 167 854 4 640
Cash, deposits and similar securities 3 511 220 1 377 1 086 86 267 77 281 404 292 7 601Net working capital assets (3 741) (3 741)
5 311 549 2 086 1 715 690 428 248 570 584 (2 595) 9 586
82
3)
04
* Not rated externally or by using internationally recognised credit rating techniques. **Comparative information has been restated for a re-assessment of investments classifications. Refer to note 37.
131
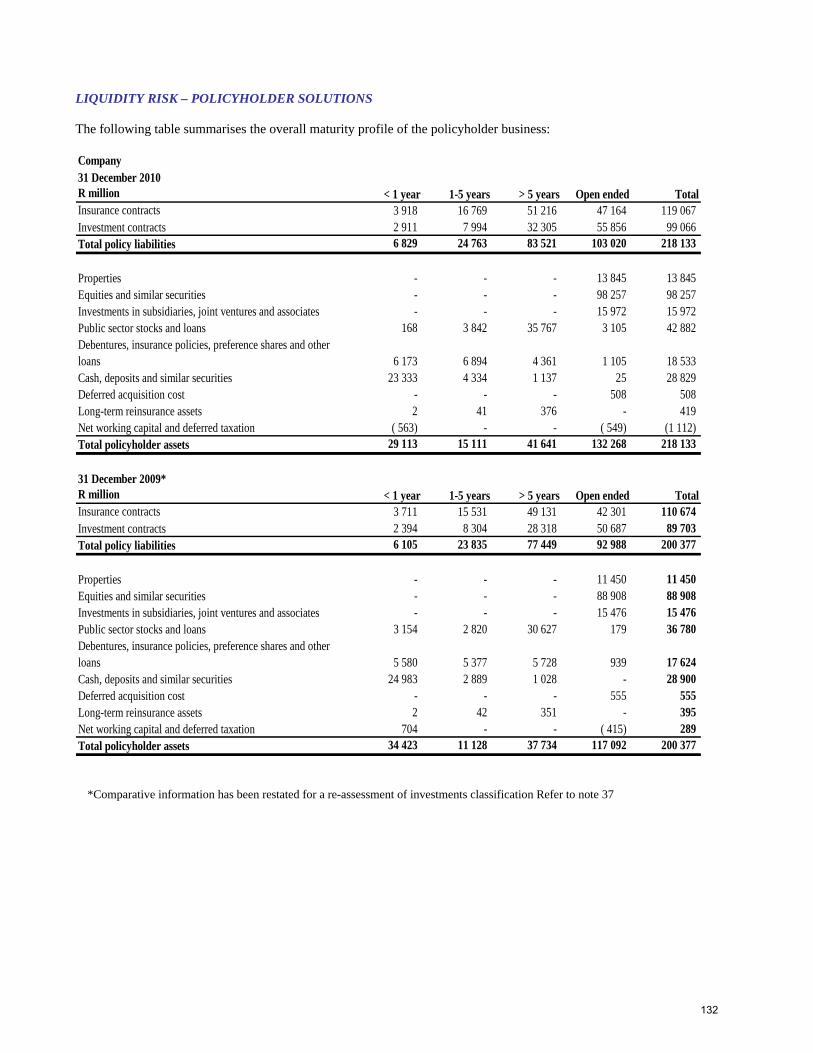
LIQUIDITY RISK – POLICYHOLDER SOLUTIONS The following table summarises the overall maturity profile of the policyholder business: Company31 December 2010R million < 1 year 1-5 years > 5 years Open ended TotalInsurance contracts 3 918 16 769 51 216 47 164 119 067 Investment contracts 2 911 7 994 32 305 55 856 99 066 Total policy liabilities 6 829 24 763 83 521 103 020 218 133
Properties - - - 13 845 13 845 Equities and similar securities - - - 98 257 98 257 Investments in subsidiaries, joint ventures and associates - - - 15 972 15 972 Public sector stocks and loans 168 3 842 35 767 3 105 42 882 Debentures, insurance policies, preference shares and other loans 6 173 6 894 4 361 1 105 18 533 Cash, deposits and similar securities 23 333 4 334 1 137 25 28 829 Deferred acquisition cost - - - 508 508 Long-term reinsurance assets 2 41 376 - 419 Net working capital and deferred taxation ( 563) - - ( 549) (1 112) Total policyholder assets 29 113 15 111 41 641 132 268 218 133
31 December 2009*R million < 1 year 1-5 years > 5 years Open ended TotalInsurance contracts 3 711 15 531 49 131 42 301 110 674 Investment contracts 2 394 8 304 28 318 50 687 89 703 Total policy liabilities 6 105 23 835 77 449 92 988 200 377
Properties - - - 11 450 11 450 Equities and similar securities - - - 88 908 88 908 Investments in subsidiaries, joint ventures and associates - - - 15 476 15 476 Public sector stocks and loans 3 154 2 820 30 627 179 36 780 Debentures, insurance policies, preference shares and other loans 5 580 5 377 5 728 939 17 624 Cash, deposits and similar securities 24 983 2 889 1 028 - 28 900 Deferred acquisition cost - - - 555 555 Long-term reinsurance assets 2 42 351 - 395 Net working capital and deferred taxation 704 - - ( 415) 289 Total policyholder assets 34 423 11 128 37 734 117 092 200 377
*Comparative information has been restated for a re-assessment of investments classification Refer to note 37
132
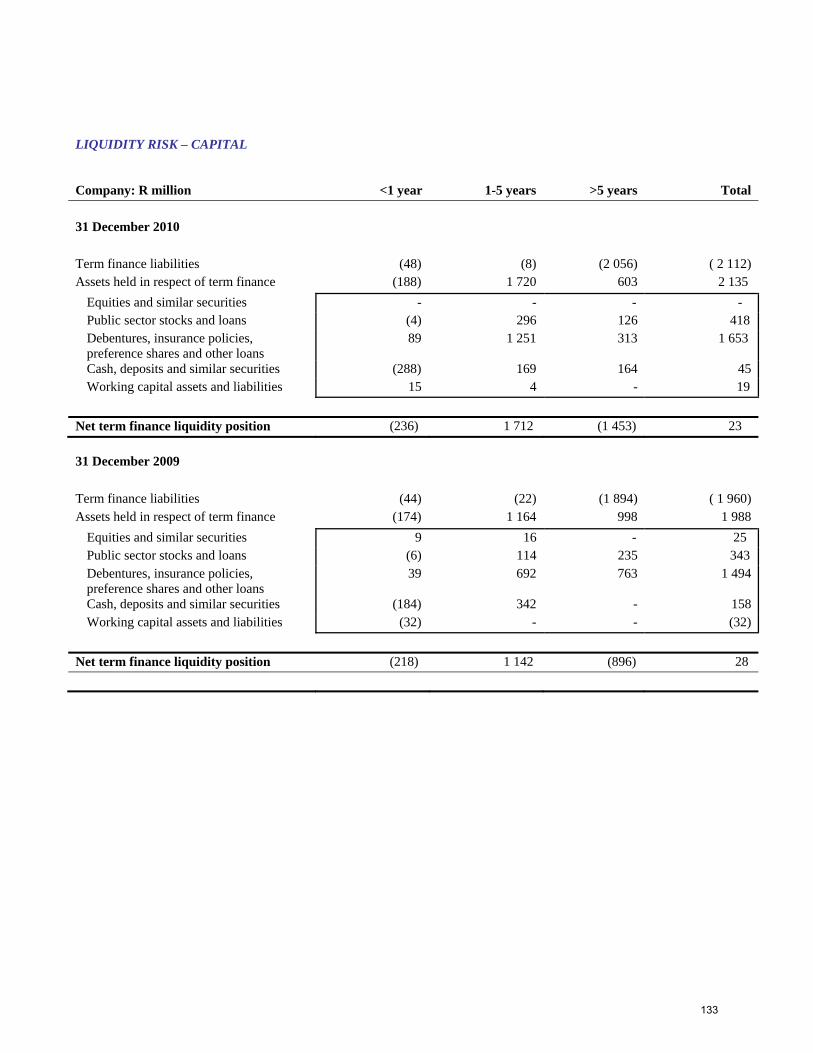
LIQUIDITY RISK – CAPITAL
ompany: R million <1 year 1-5 years >5 years Total
C 31 December 2010
(2
A nce (188 1 72
Term finance liabilities (48) (8) 056) ( 2 112)
ssets held in respect of term fina ) 0 603 2 135Equities and similar securities - - - - Public sector stocks and loans (4) 296 126 418 Debentures, insurance policies, preference shares and other loans
89 1 251 313 1 653
Cash, deposits and similar securities (2 16 1688) 9 4 45Working capital assets and liabilities 15 4 - 19
Net term finance liquidity position (236) 1 712 (1 453) 23 31 December 2009
(1 (
A nce (17 1 1
Term finance liabilities (44) (22) 894) 1 960)
ssets held in respect of term fina 4) 64 998 1 988 Equities and similar securities 9 16 - 25 Public sector stocks and loans (6) 114 235 343 Debentures, insurance policies, preference shares and other loans
39 692 763 1 494
Cash, deposits and similar securities ( 34184) 2 - 158Working capital assets and liabilities (32) - - (32)
Net term finance liquidity position (218) 1 142 (896) 28
133
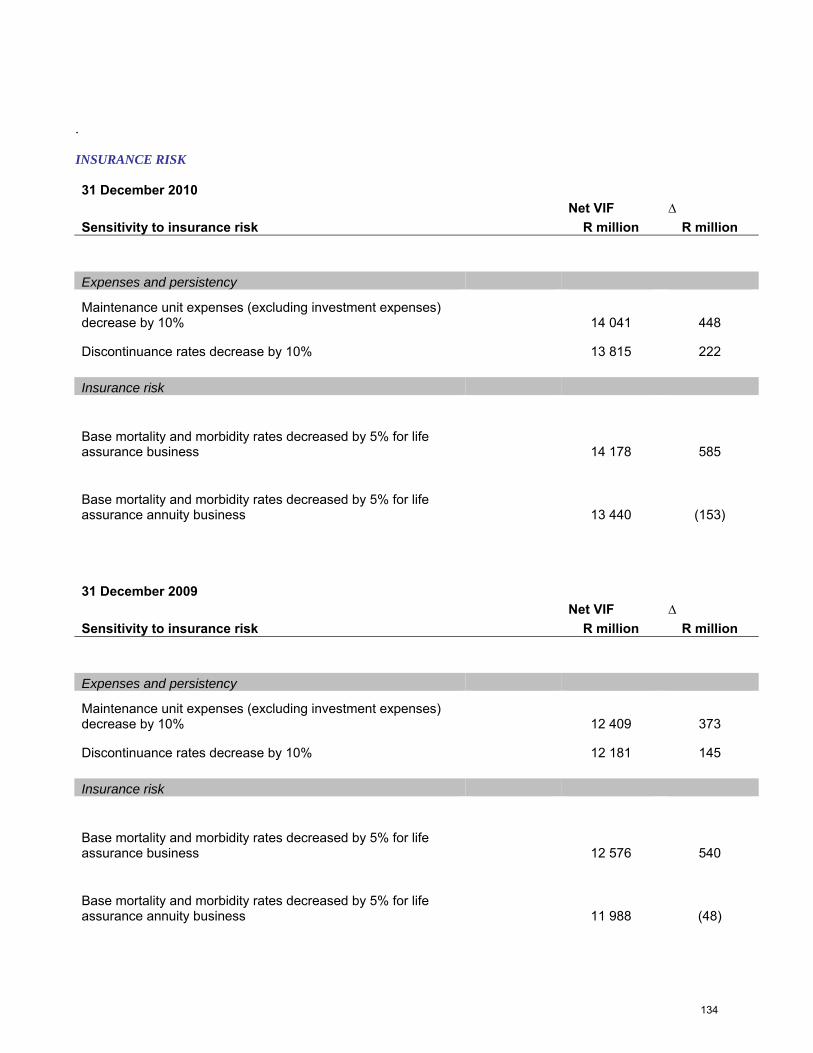
.
SURANCE RISK
IN
31 December 2010 Net VIF ∆ Sensitivity to insurance risk R million R million Expenses and persistency
Maintenance unit expenses (excluding investment expenses) decrease by 10% 14 041 448
Discontinuance rates decrease by 10% 13 815 222
Insurance risk
Base mortality and morbidity rates decreased by 5% for life assurance business 14 178 585
Base mortality and morbidity rates decreased by 5% for life assurance annuity business 13 440 (153)
31 December 2009 Net VIF ∆ Sensitivity to insurance risk R million R million Expenses and persistency
Maintenance unit expenses (excluding investment expenses) decrease by 10% 12 409 373
Discontinuance rates decrease by 10% 12 181 145
Insurance risk
Base mortality and morbidity rates decreased by 5% for life assurance business 12 576 540
Base mortality and morbidity rates decreased by 5% for life assurance annuity business 11 988 (48)
134

CONCENTRATION RISK
CompanyValue of benefits insured: non-participating life business
Benefits insured per individual life
2010 2009 2010 2009 2010 2009
R'000 % % % %
0 - 500 937 272 1 071 362 24 29 27 32
500 - 1 000 156 348 158 486 19 20 20 20
1 000 - 5 000 131 087 119 125 43 39 42 39
5 000 - 8 000 6 298 5 299 7 6 6 5
>8 000 3 625 2 845 7 6 5 4
1 234 630 1 357 117 100 100 100 100
Before reinsurance After reinsuranceNumber of lives
Non-participating annuity payable per annum per life insured
2010 2009 2010 2009 2010 2009
R'000 % % % %
0 - 20 208 930 200 477 46 47 46 47
20 - 40 16 782 15 211 18 18 18 18
40 - 60 5 151 4 709 10 10 10 10
60 - 80 2 399 2 067 7 6 7 6
80 - 100 1 200 1 074 4 4 4 4
> 100 2 036 1 791 15 15 15 15
236 498 225 329 100 100 100 100
Before reinsurance After reinsuranceNumber of lives
135
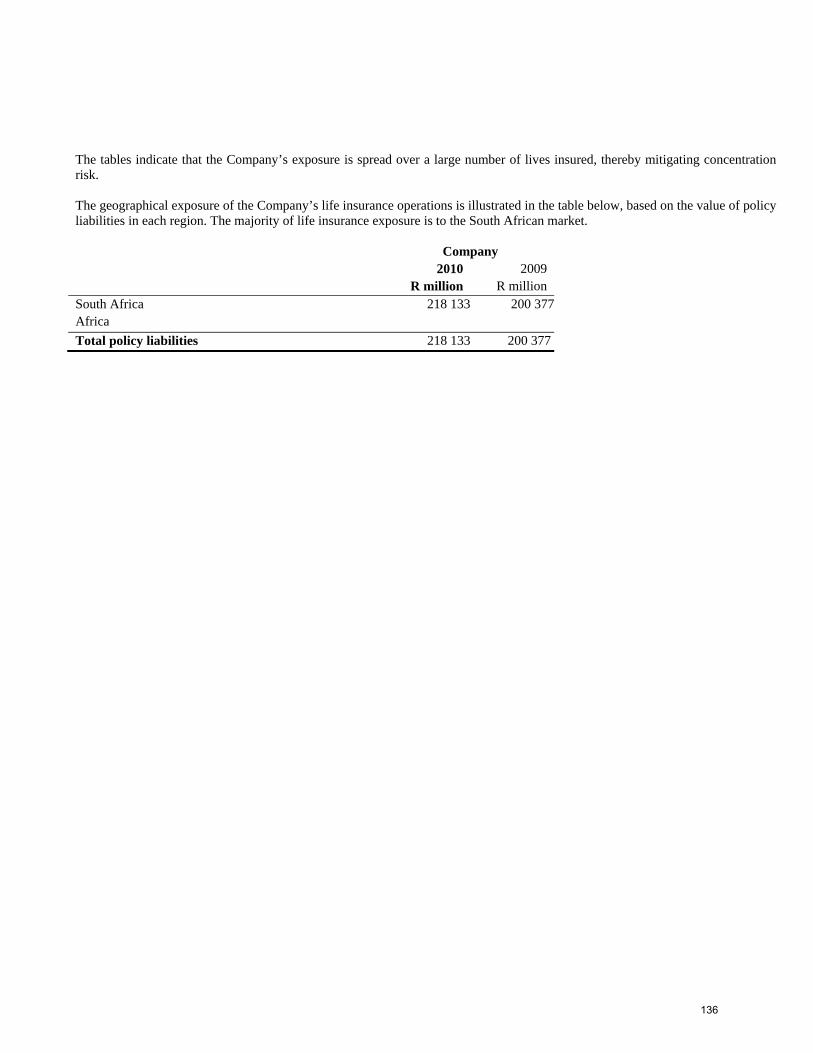
ables indicate that the Company’s exposure is spread over a large number of lives insured, thereby mitigating concentration sk.
elow, based on the value of policy abilities in each region. The majority of life insurance exposure is to the South African market.
pany
frica 218 133 200 377
The tri The geographical exposure of the Company’s life insurance operations is illustrated in the table bli Com 2010 2009 R million R million South A Africa Total policy liabilities 218 133 200 377
136
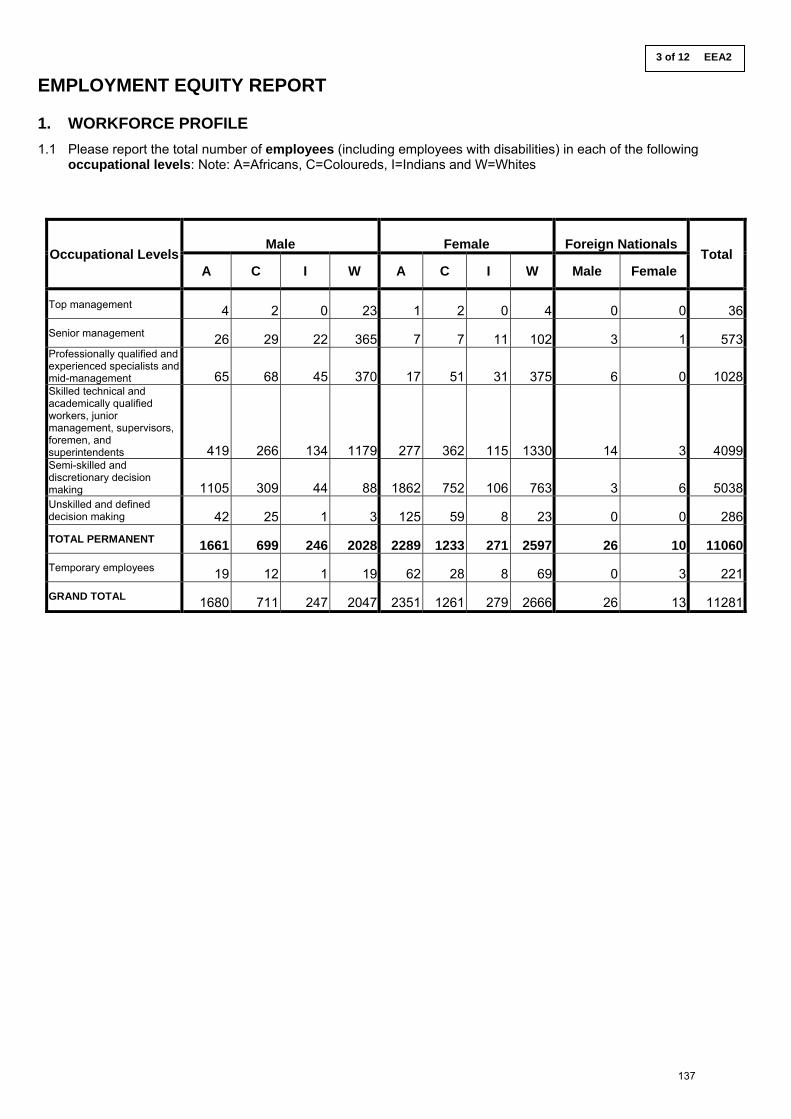
3 of 12 EEA2 EMPLOYMENT EQUITY REPORT 1. WORKFORCE PROFILE
1.1 Please report the total number of employees (including employees with disabilities) in each of the following occupational levels: Note: A=Africans, C=Coloureds, I=Indians and W=Whites
Occupational Levels
Male
Female
Foreign Nationals
Total A C I W A C I W Male Female
Top management 4 2 0 23 1 2 0 4 0 0 36Senior management 26 29 22 365 7 7 11 102 3 1 573Professionally qualified and experienced specialists and mid-management 65 68 45 370 17 51 31 375 6 0 1028Skilled technical and academically qualified workers, junior management, supervisors, foremen, and superintendents 419 266 134 1179 277 362 115 1330 14 3 4099Semi-skilled and discretionary decision making 1105 309 44 88 1862 752 106 763 3 6 5038Unskilled and defined decision making 42 25 1 3 125 59 8 23 0 0 286TOTAL PERMANENT 1661 699 246 2028 2289 1233 271 2597 26 10 11060Temporary employees 19 12 1 19 62 28 8 69 0 3 221GRAND TOTAL 1680 711 247 2047 2351 1261 279 2666 26 13 11281
137
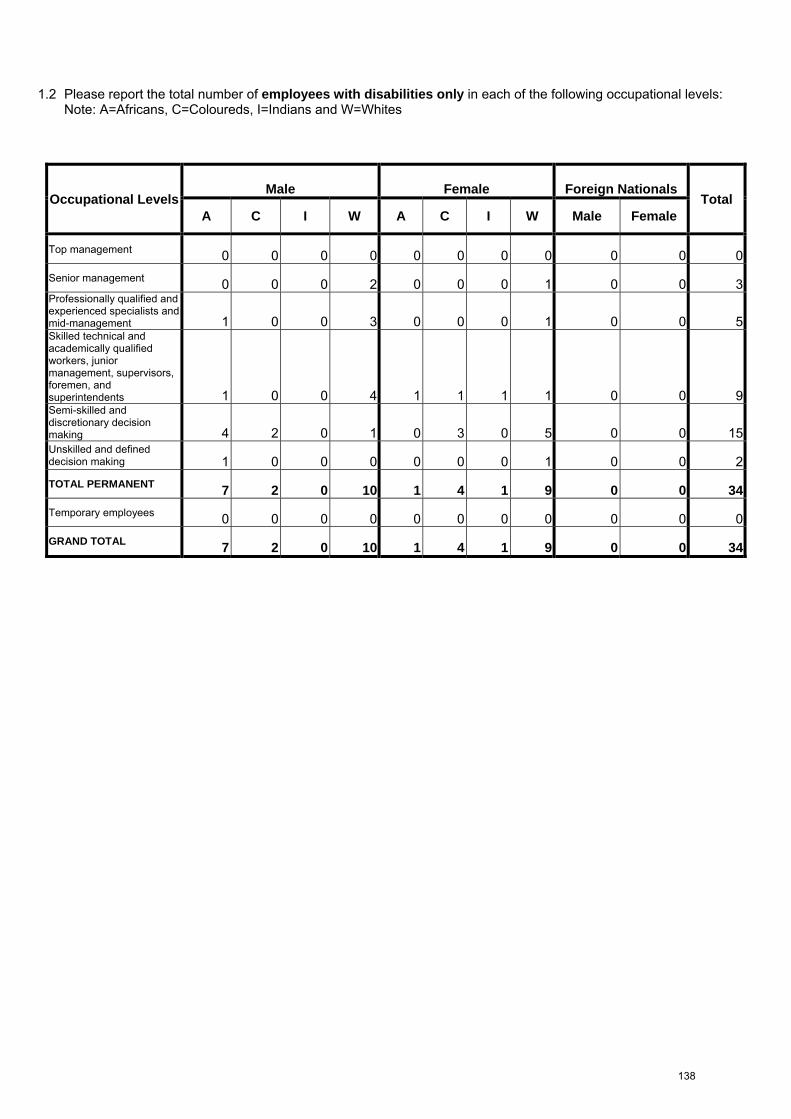
1.2 Please report the total number of employees with disabilities only in each of the following occupational levels:
Note: A=Africans, C=Coloureds, I=Indians and W=Whites
Occupational Levels
Male
Female
Foreign Nationals
Total A C I W A C I W Male Female
Top management 0 0 0 0 0 0 0 0 0 0 0Senior management 0 0 0 2 0 0 0 1 0 0 3Professionally qualified and experienced specialists and mid-management 1 0 0 3 0 0 0 1 0 0 5Skilled technical and academically qualified workers, junior management, supervisors, foremen, and superintendents 1 0 0 4 1 1 1 1 0 0 9Semi-skilled and discretionary decision making 4 2 0 1 0 3 0 5 0 0 15Unskilled and defined decision making 1 0 0 0 0 0 0 1 0 0 2TOTAL PERMANENT 7 2 0 10 1 4 1 9 0 0 34Temporary employees 0 0 0 0 0 0 0 0 0 0 0GRAND TOTAL 7 2 0 10 1 4 1 9 0 0 34
138