Embed Size (px)
Citation preview
Sangam Advisors Limited
Sponsored by BSE Investor Protection Fund ICRA Online Limited |Page | 1
SANGAM ADVISORS LIMITEDIndustry: Financial Services
Sangam Advisors Limited
• Financial ServicesSector
• June 22, 1999Date of Incorporation
• 33/34, 3rd Floor, Printing House, 28 ‐ D, Police Court Lane, Behind Old Handloom House, Fort, Mumbai 400001
Registered Office
• Mr. Gauri Shankar BajajManaging Director
• Ms. Supriya AroraCompany Secretary
• M/s Mahesh Bairat & AssociatesAuditor
• www.sangamadvisors.comWebsite
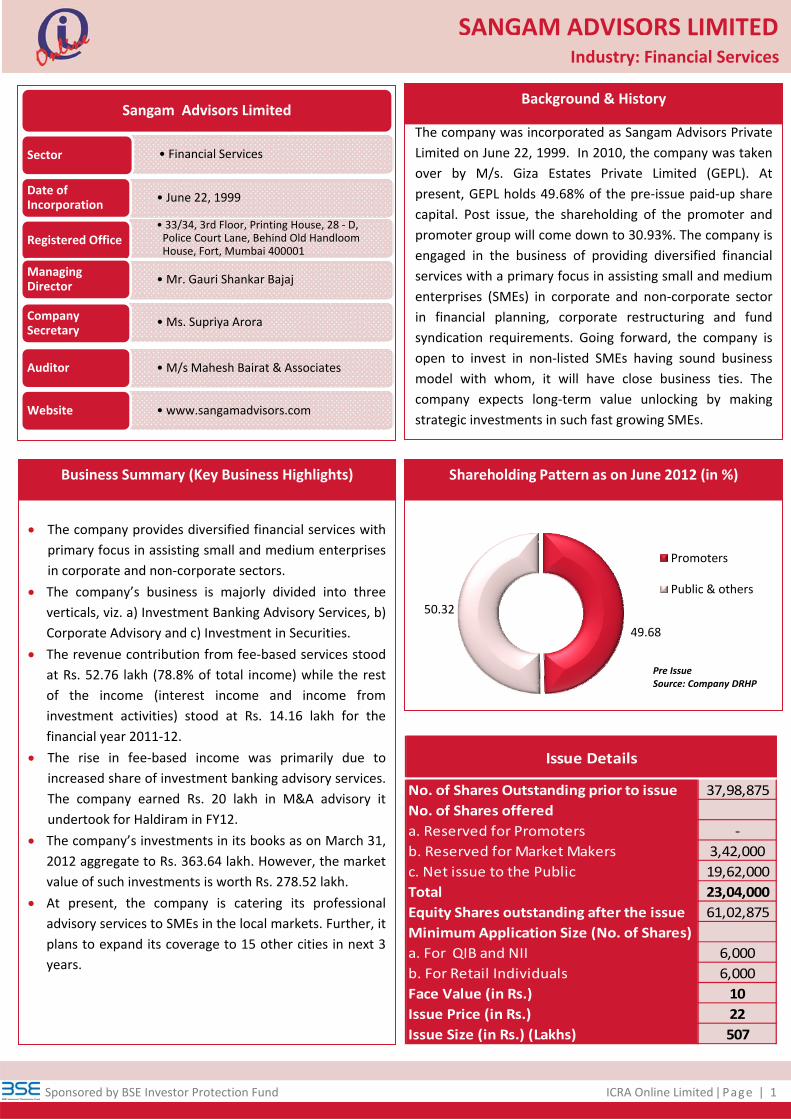
49.68
50.32
Promoters
Public & others
Pre Issue Source: Company DRHP
The company provides diversified financial services with
primary focus in assisting small and medium enterprises
in corporate and non‐corporate sectors.
The company’s business is majorly divided into three
verticals, viz. a) Investment Banking Advisory Services, b)
Corporate Advisory and c) Investment in Securities.
The revenue contribution from fee‐based services stood
at Rs. 52.76 lakh (78.8% of total income) while the rest
of the income (interest income and income from
investment activities) stood at Rs. 14.16 lakh for the
financial year 2011‐12.
The rise in fee‐based income was primarily due to
increased share of investment banking advisory services.
The company earned Rs. 20 lakh in M&A advisory it
undertook for Haldiram in FY12.
The company’s investments in its books as on March 31,
2012 aggregate to Rs. 363.64 lakh. However, the market
value of such investments is worth Rs. 278.52 lakh.
At present, the company is catering its professional
advisory services to SMEs in the local markets. Further, it
plans to expand its coverage to 15 other cities in next 3
years.
Business Summary (Key Business Highlights)
ackground & History
Shareholding Pattern as on June 2012 (in %)
No. of Shares Outstanding prior to issue 37,98,875
No. of Shares offered
a. Reserved for Promoters ‐
b. Reserved for Market Makers 3,42,000
c. Net issue to the Public 19,62,000
Total 23,04,000
Equity Shares outstanding after the issue 61,02,875
Minimum Application Size (No. of Shares)
a. For QIB and NII 6,000
b. For Retail Individuals 6,000
Face Value (in Rs.) 10
Issue Price (in Rs.) 22
Issue Size (in Rs.) (Lakhs) 507
Issue Details
The company was incorporated as Sangam Advisors Private
Limited on June 22, 1999. In 2010, the company was taken
over by M/s. Giza Estates Private Limited (GEPL). At
present, GEPL holds 49.68% of the pre‐issue paid‐up share
capital. Post issue, the shareholding of the promoter and
promoter group will come down to 30.93%. The company is
engaged in the business of providing diversified financial
services with a primary focus in assisting small and medium
enterprises (SMEs) in corporate and non‐corporate sector
in financial planning, corporate restructuring and fund
syndication requirements. Going forward, the company is
open to invest in non‐listed SMEs having sound business
model with whom, it will have close business ties. The
company expects long‐term value unlocking by making
strategic investments in such fast growing SMEs.
Background & History
Sponsored by BSE Investor Protection Fund ICRA Online Limited |Page | 2
SANGAM ADVISORS LIMITED
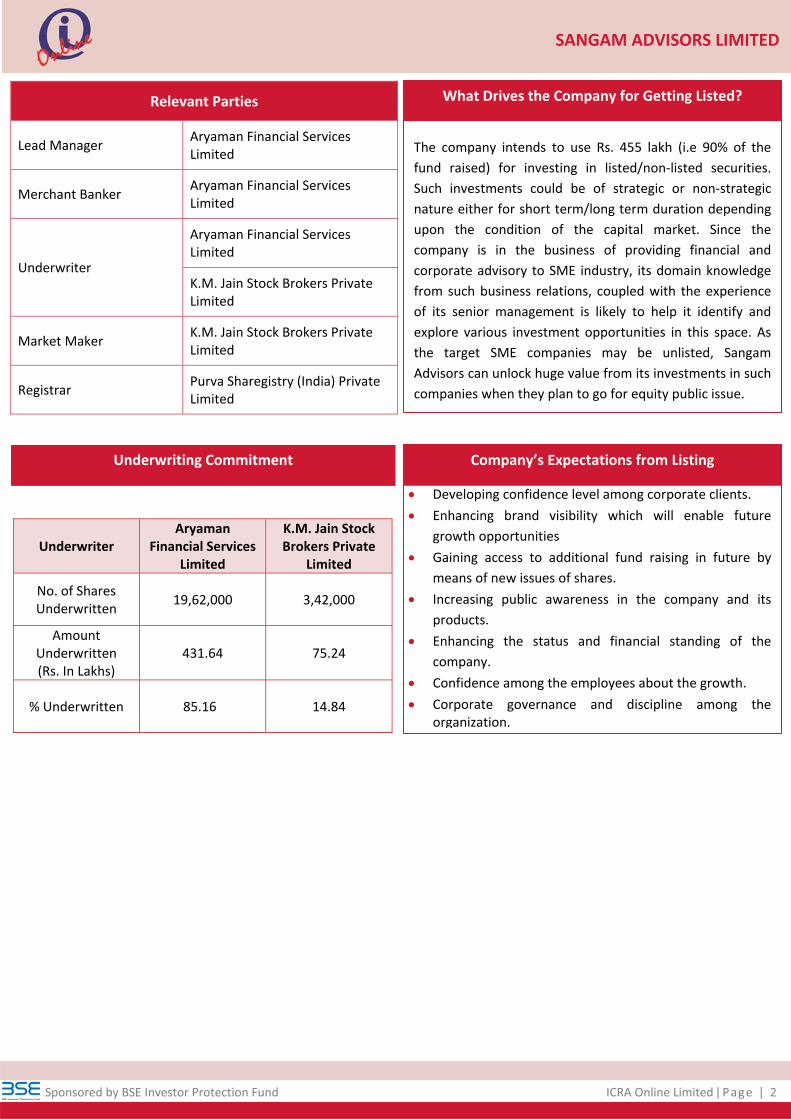
Relevant Parties
Lead Manager Aryaman Financial Services Limited
Merchant Banker Aryaman Financial Services Limited
Underwriter
Aryaman Financial Services Limited
K.M. Jain Stock Brokers Private Limited
Market Maker K.M. Jain Stock Brokers Private Limited
Registrar Purva Sharegistry (India) Private Limited
The company intends to use Rs. 455 lakh (i.e 90% of the
fund raised) for investing in listed/non‐listed securities.
Such investments could be of strategic or non‐strategic
nature either for short term/long term duration depending
upon the condition of the capital market. Since the
company is in the business of providing financial and
corporate advisory to SME industry, its domain knowledge
from such business relations, coupled with the experience
of its senior management is likely to help it identify and
explore various investment opportunities in this space. As
the target SME companies may be unlisted, Sangam
Advisors can unlock huge value from its investments in such
companies when they plan to go for equity public issue.
What Drives the Company for Getting Listed?
Underwriter Aryaman
Financial Services Limited
K.M. Jain Stock Brokers Private
Limited
No. of Shares Underwritten
19,62,000 3,42,000
Amount Underwritten (Rs. In Lakhs)
431.64 75.24
% Underwritten 85.16 14.84
Underwriting Commitment
Developing confidence level among corporate clients.
Enhancing brand visibility which will enable future
growth opportunities
Gaining access to additional fund raising in future by
means of new issues of shares.
Increasing public awareness in the company and its
products.
Enhancing the status and financial standing of the
company.
Confidence among the employees about the growth.
Corporate governance and discipline among the organization.
Company’s Expectations from Listing
Sponsored by BSE Investor Protection Fund ICRA Online Limited |Page | 3
SANGAM ADVISORS LIMITED
Financial Data
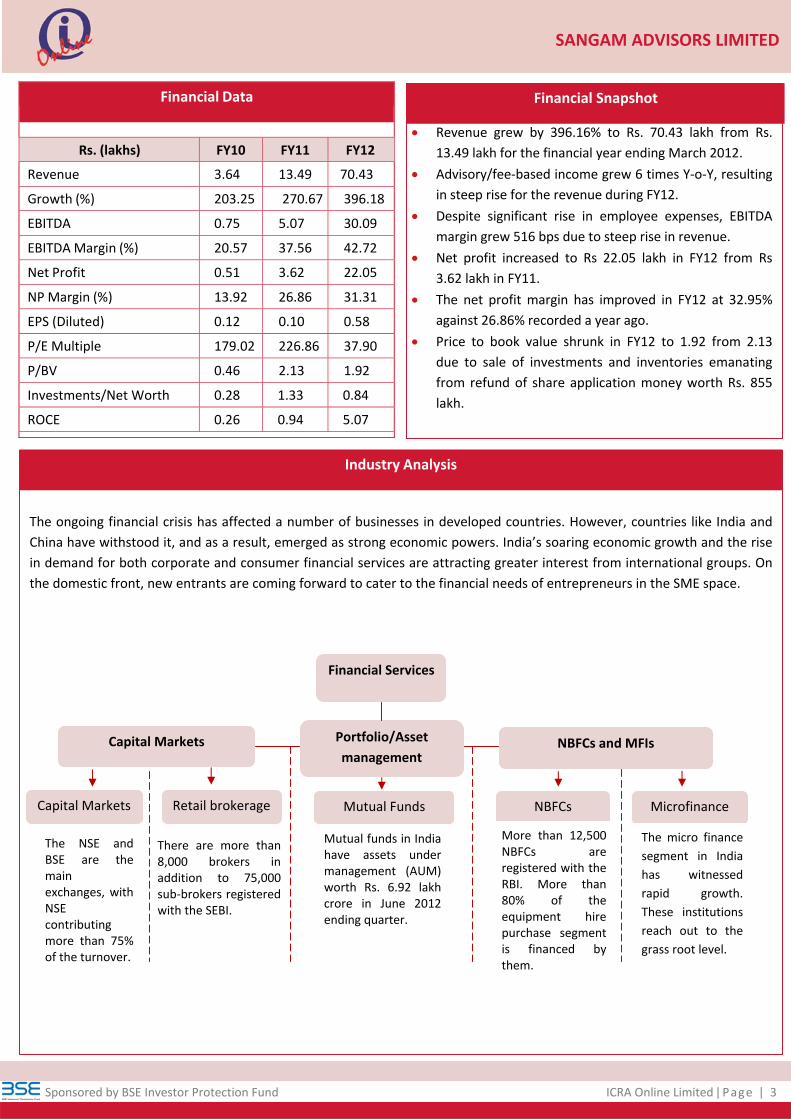
Rs. (lakhs) FY10 FY11 FY12
Revenue 3.64 13.49 70.43
Growth (%) 203.25 270.67 396.18
EBITDA 0.75 5.07 30.09
EBITDA Margin (%) 20.57 37.56 42.72
Net Profit 0.51 3.62 22.05
NP Margin (%) 13.92 26.86 31.31
EPS (Diluted) 0.12 0.10 0.58
P/E Multiple 179.02 226.86 37.90
P/BV 0.46 2.13 1.92
Investments/Net Worth 0.28 1.33 0.84
ROCE 0.26 0.94 5.07
Revenue grew by 396.16% to Rs. 70.43 lakh from Rs.
13.49 lakh for the financial year ending March 2012.
Advisory/fee‐based income grew 6 times Y‐o‐Y, resulting
in steep rise for the revenue during FY12.
Despite significant rise in employee expenses, EBITDA
margin grew 516 bps due to steep rise in revenue.
Net profit increased to Rs 22.05 lakh in FY12 from Rs
3.62 lakh in FY11.
The net profit margin has improved in FY12 at 32.95%
against 26.86% recorded a year ago.
Price to book value shrunk in FY12 to 1.92 from 2.13
due to sale of investments and inventories emanating
from refund of share application money worth Rs. 855
lakh.
The ongoing financial crisis has affected a number of businesses in developed countries. However, countries like India and
China have withstood it, and as a result, emerged as strong economic powers. India’s soaring economic growth and the rise
in demand for both corporate and consumer financial services are attracting greater interest from international groups. On
the domestic front, new entrants are coming forward to cater to the financial needs of entrepreneurs in the SME space.
Industry Analysis
Financial Snapshot
Financial Services
Capital Markets Portfolio/Asset
management NBFCs and MFIs
Capital Markets Retail brokerage Mutual Funds NBFCs Microfinance
There are more than 8,000 brokers in addition to 75,000 sub‐brokers registered with the SEBI.
Mutual funds in India have assets under management (AUM) worth Rs. 6.92 lakh crore in June 2012 ending quarter.
More than 12,500 NBFCs are registered with the RBI. More than 80% of the equipment hire purchase segment is financed by them.
The micro finance
segment in India
has witnessed
rapid growth.
These institutions
reach out to the
grass root level.
The NSE and BSE are the main exchanges, with NSE contributing more than 75% of the turnover.
Sponsored by BSE Investor Protection Fund ICRA Online Limited |Page | 4
SANGAM ADVISORS LIMITED
Key Drivers of the Industry
Key Drivers of
the Industry
Progressive & regulatory reforms
Indian economy‐one of the fastest‐growing in the
world
Higher saving rate of the
working class
Tremendous growth
potential of Indian capital
market
FIIs viewing Indian capital market as an attractive destination
Favourable demographic
profile
Technology advancement
& online platform
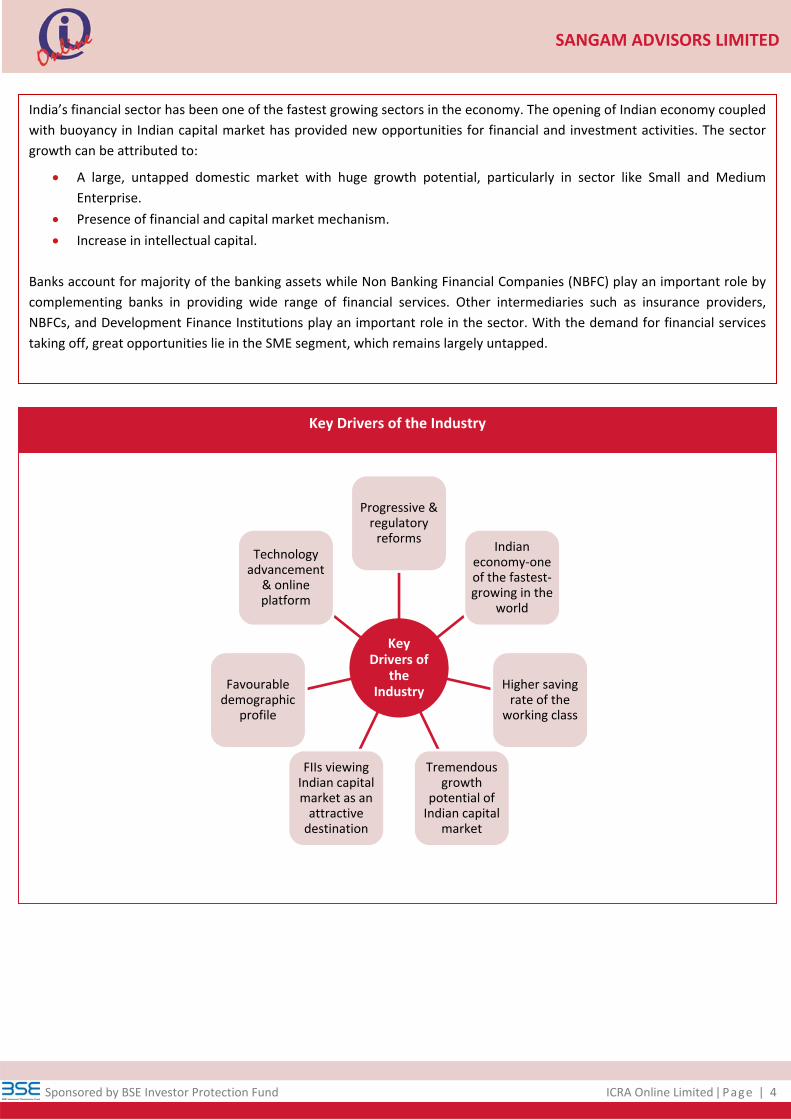
India’s financial sector has been one of the fastest growing sectors in the economy. The opening of Indian economy coupled
with buoyancy in Indian capital market has provided new opportunities for financial and investment activities. The sector
growth can be attributed to:
A large, untapped domestic market with huge growth potential, particularly in sector like Small and Medium
Enterprise.
Presence of financial and capital market mechanism.
Increase in intellectual capital.
Banks account for majority of the banking assets while Non Banking Financial Companies (NBFC) play an important role by
complementing banks in providing wide range of financial services. Other intermediaries such as insurance providers,
NBFCs, and Development Finance Institutions play an important role in the sector. With the demand for financial services
taking off, great opportunities lie in the SME segment, which remains largely untapped.
Sponsored by BSE Investor Protection Fund ICRA Online Limited |Page | 5
SANGAM ADVISORS LIMITED
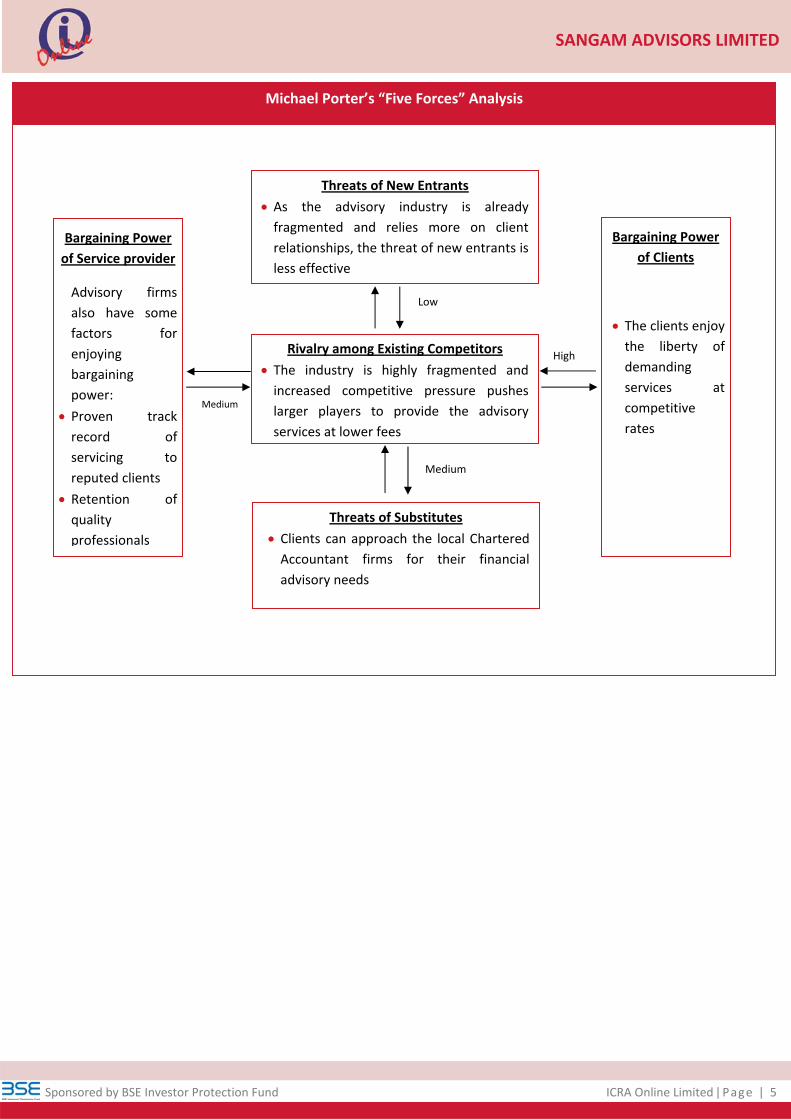
Michael Porter’s “Five Forces” Analysis
High
Low
Medium
Medium
Rivalry among Existing Competitors
The industry is highly fragmented and
increased competitive pressure pushes
larger players to provide the advisory
services at lower fees
Threats of New Entrants
As the advisory industry is already
fragmented and relies more on client
relationships, the threat of new entrants is
less effective
Threats of Substitutes
Clients can approach the local Chartered Accountant firms for their financial
advisory needs
Bargaining Power
of Service provider
Advisory firms
also have some
factors for
enjoying
bargaining
power:
Proven track
record of
servicing to
reputed clients
Retention of
quality
professionals
Bargaining Power
of Clients
The clients enjoy the liberty of
demanding
services at
competitive
rates
Sponsored by BSE Investor Protection Fund ICRA Online Limited |Page | 6
SANGAM ADVISORS LIMITED
Corporate Governance ‐ The Company emphasizes on the corporate governance for establishing and maintaining integrity,
transparency, accountability and fairness. It has complied with the corporate governance code in accordance with SME
Equity Listing Agreement.
Importantly, the company has undertaken necessary steps to comply with the provisions of the SEBI (Prohibition of Insider
Trading) Regulations, 1992 after listing of the company’s equity shares on the Stock Exchanges. The company’s Chief
Financial Officer and Compliance Officer will be responsible for setting forth policies, procedures, monitoring and
adherences to the rules for preservation of price‐sensitive information and implementation of the code of conduct under
the overall supervision of the Board.
Expansion Plan – The company is constantly marketing itself on various national and international platforms like JITO (Jain
International Trade Organization), ICFAI and CFA Forum. The company plans to expand its customer base from Mumbai
and Nagpur to 15 new cities. Sangam Advisors will execute this expansion plan in a staged manner (over the next 3 years)
by entering into agreements with new co‐associates.
Management Overview ‐ The company is engaged in the business of providing diversified financial services with a primary
focus in assisting small and medium enterprises (SMEs) in corporate and non‐corporate sector in their financial planning,
corporate restructuring and fund syndication requirements. The company believes that strong management and technical
experience along with industry networks will help in achieving key business strategies. Even existing business presence and
elite clientele in advisory and consultancy business will further increase opportunities in expanding investment portfolio.
The company’s current relationship and healthy client base will help generate future revenues as well as open up
possibilities for new businesses through cross references. The company believes that these relationships will provide an
extra edge in sourcing and executing more deals for a growing clientele. After going public, the company believes that it
will further be able to offer attractive stock‐based incentives to talented professionals, which will aid recruitment effort
and retention of key employees.
HR Practices ‐ The company currently has eleven people in its payroll. The permanent employees include personnel
engaged in management, administration, marketing and operations. The employees are not covered by collective
bargaining agreements. The Board of Directors of the company has an optimum combination of Executive and Non‐
Executive Directors. There are six Directors on the Board out of which two are Independent Directors and the Chairman is
an Independent and Non‐Executive Director.
As per the company’s draft prospect, the average experience of their key personnel is 2.76 years. The company is not
providing any others benefits to the employees except for the payment of salaries and yearly bonus.
Business Analysis
Sponsored by BSE Investor Protection Fund ICRA Online Limited |Page | 7
SANGAM ADVISORS LIMITED
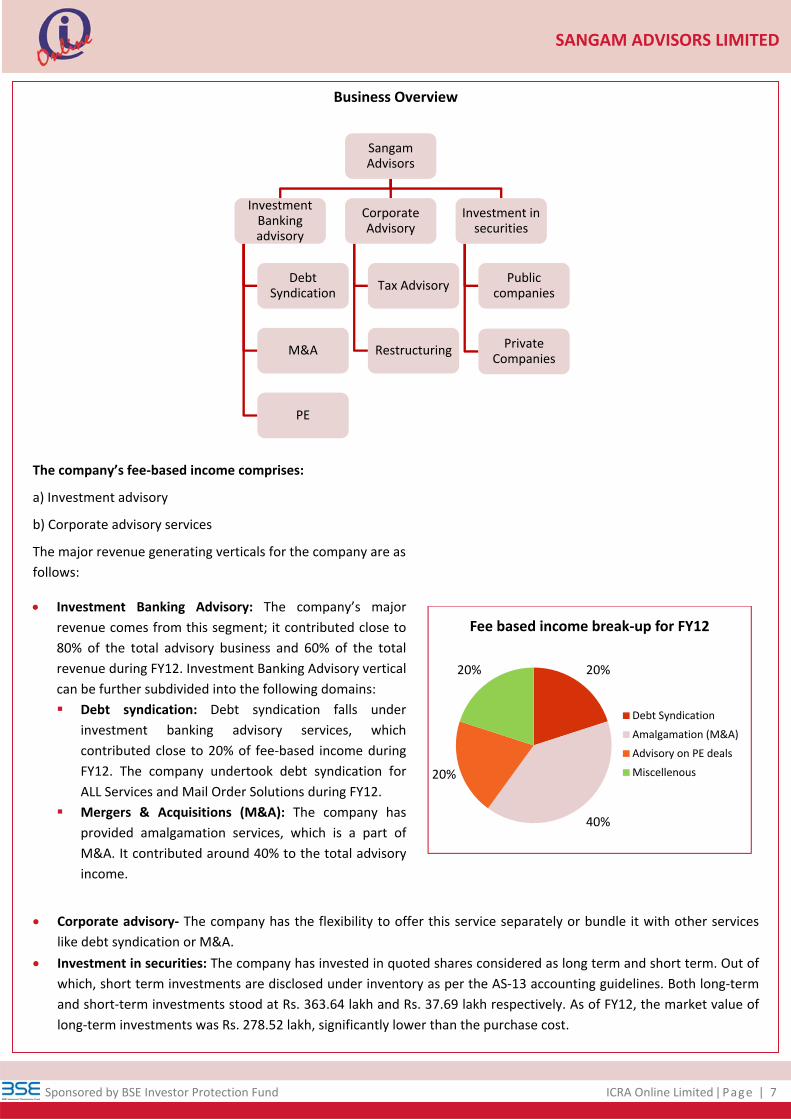
Business Overview
The company’s fee‐based income comprises:
a) Investment advisory
b) Corporate advisory services
The major revenue generating verticals for the company are as
follows:
Investment Banking Advisory: The company’s major
revenue comes from this segment; it contributed close to
80% of the total advisory business and 60% of the total
revenue during FY12. Investment Banking Advisory vertical
can be further subdivided into the following domains:
Debt syndication: Debt syndication falls under
investment banking advisory services, which
contributed close to 20% of fee‐based income during
FY12. The company undertook debt syndication for
ALL Services and Mail Order Solutions during FY12.
Mergers & Acquisitions (M&A): The company has
provided amalgamation services, which is a part of
M&A. It contributed around 40% to the total advisory
income.
Sangam Advisors
Investment Banking advisory
Debt Syndication
M&A
PE
Corporate Advisory
Tax Advisory
Restructuring
Investment in securities
Public companies
PrivateCompanies
Corporate advisory‐ The company has the flexibility to offer this service separately or bundle it with other services
like debt syndication or M&A.
Investment in securities: The company has invested in quoted shares considered as long term and short term. Out of
which, short term investments are disclosed under inventory as per the AS‐13 accounting guidelines. Both long‐term
and short‐term investments stood at Rs. 363.64 lakh and Rs. 37.69 lakh respectively. As of FY12, the market value of
long‐term investments was Rs. 278.52 lakh, significantly lower than the purchase cost.
20%
40%
20%
20%
Fee based income break‐up for FY12
Debt Syndication
Amalgamation (M&A)
Advisory on PE deals
Miscellenous
Sponsored by BSE Investor Protection Fund ICRA Online Limited |Page | 8
SANGAM ADVISORS LIMITED
SWOT Analysis
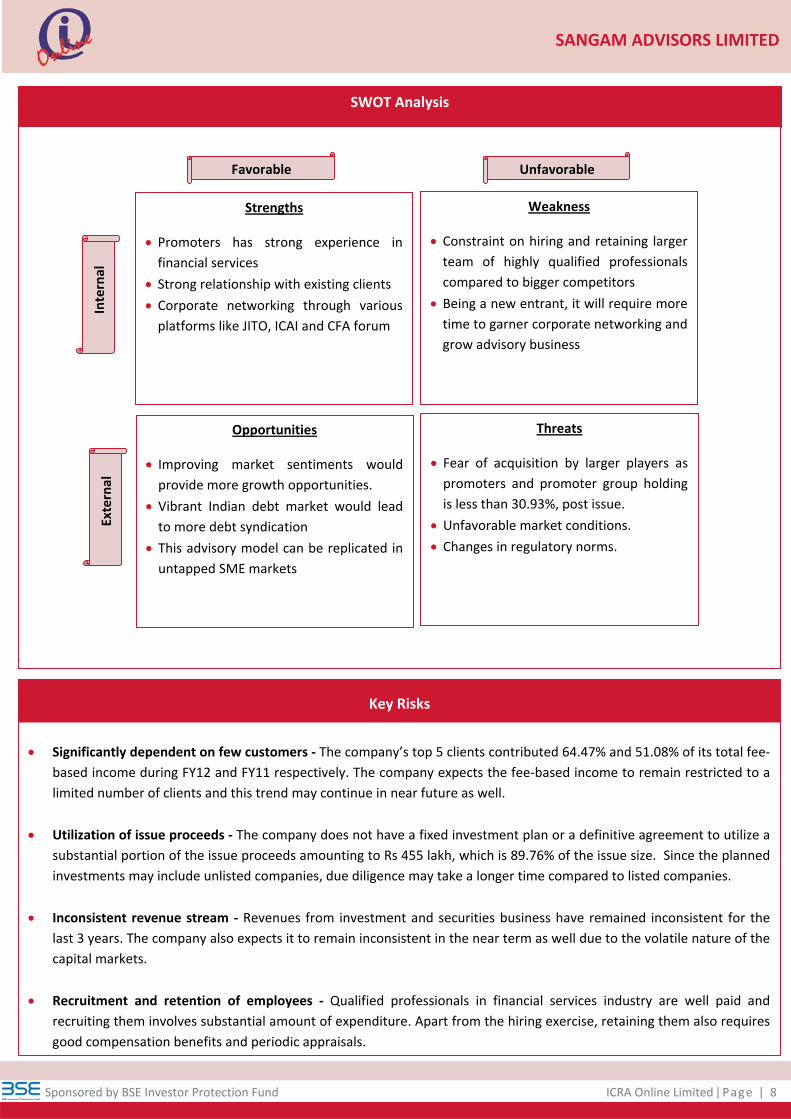
Significantly dependent on few customers ‐ The company’s top 5 clients contributed 64.47% and 51.08% of its total fee‐
based income during FY12 and FY11 respectively. The company expects the fee‐based income to remain restricted to a
limited number of clients and this trend may continue in near future as well.
Utilization of issue proceeds ‐ The company does not have a fixed investment plan or a definitive agreement to utilize a
substantial portion of the issue proceeds amounting to Rs 455 lakh, which is 89.76% of the issue size. Since the planned
investments may include unlisted companies, due diligence may take a longer time compared to listed companies.
Inconsistent revenue stream ‐ Revenues from investment and securities business have remained inconsistent for the
last 3 years. The company also expects it to remain inconsistent in the near term as well due to the volatile nature of the
capital markets.
Recruitment and retention of employees ‐ Qualified professionals in financial services industry are well paid and
recruiting them involves substantial amount of expenditure. Apart from the hiring exercise, retaining them also requires
good compensation benefits and periodic appraisals.
Key Risks
External
Strengths
Promoters has strong experience in
financial services
Strong relationship with existing clients Corporate networking through various platforms like JITO, ICAI and CFA forum
Weakness
Constraint on hiring and retaining larger team of highly qualified professionals
compared to bigger competitors
Being a new entrant, it will require more
time to garner corporate networking and
grow advisory business
Opportunities
Improving market sentiments would
provide more growth opportunities.
Vibrant Indian debt market would lead
to more debt syndication
This advisory model can be replicated in
untapped SME markets
Threats
Fear of acquisition by larger players as promoters and promoter group holding
is less than 30.93%, post issue.
Unfavorable market conditions.
Changes in regulatory norms.
In
ternal
Favorable Unfavorable
Sponsored by BSE Investor Protection Fund ICRA Online Limited |Page | 9
SANGAM ADVISORS LIMITED
New Initiatives
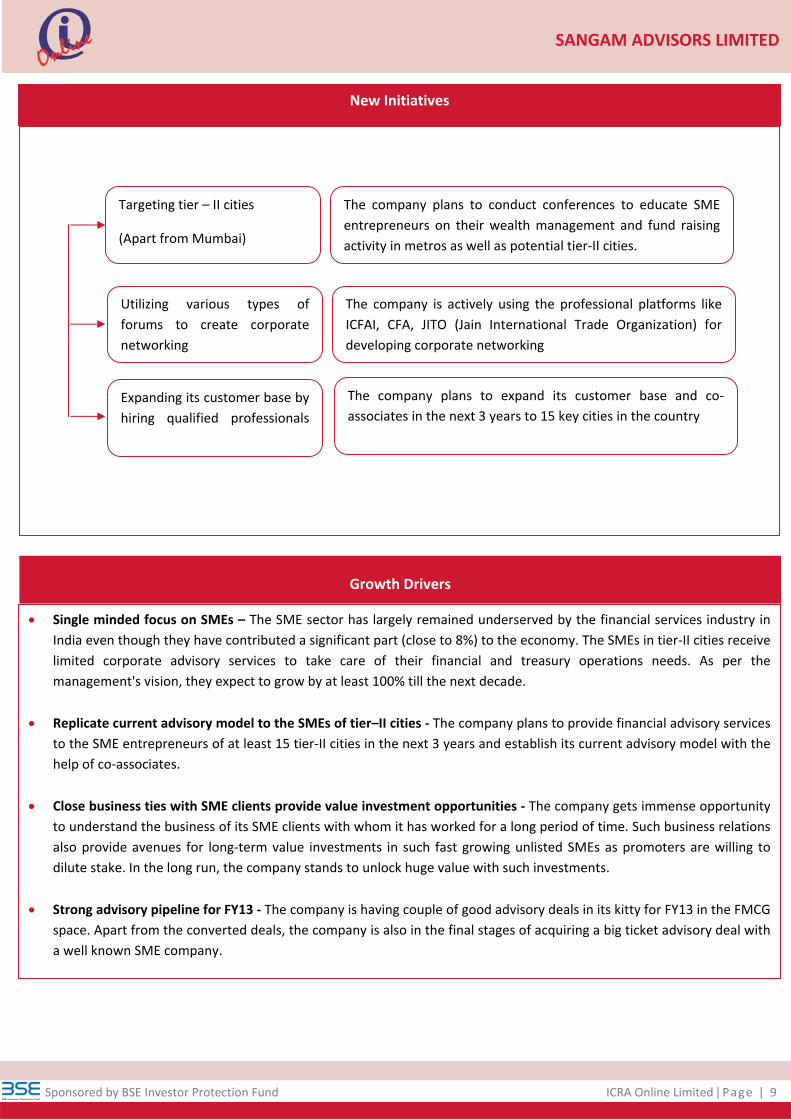
Single minded focus on SMEs – The SME sector has largely remained underserved by the financial services industry in
India even though they have contributed a significant part (close to 8%) to the economy. The SMEs in tier‐II cities receive
limited corporate advisory services to take care of their financial and treasury operations needs. As per the
management's vision, they expect to grow by at least 100% till the next decade.
Replicate current advisory model to the SMEs of tier–II cities ‐ The company plans to provide financial advisory services
to the SME entrepreneurs of at least 15 tier‐II cities in the next 3 years and establish its current advisory model with the
help of co‐associates.
Close business ties with SME clients provide value investment opportunities ‐ The company gets immense opportunity
to understand the business of its SME clients with whom it has worked for a long period of time. Such business relations
also provide avenues for long‐term value investments in such fast growing unlisted SMEs as promoters are willing to
dilute stake. In the long run, the company stands to unlock huge value with such investments.
Strong advisory pipeline for FY13 ‐ The company is having couple of good advisory deals in its kitty for FY13 in the FMCG
space. Apart from the converted deals, the company is also in the final stages of acquiring a big ticket advisory deal with
a well known SME company.
Growth Drivers
Targeting tier – II cities
(Apart from Mumbai)
Utilizing various types of
forums to create corporate
networking
Expanding its customer base by
hiring qualified professionals
The company plans to conduct conferences to educate SME
entrepreneurs on their wealth management and fund raising
activity in metros as well as potential tier‐II cities.
The company is actively using the professional platforms like
ICFAI, CFA, JITO (Jain International Trade Organization) for
developing corporate networking
The company plans to expand its customer base and co‐
associates in the next 3 years to 15 key cities in the country
Sponsored by BSE Investor Protection Fund ICRA Online Limited|Page | 10
SANGAM ADVISORS LIMITED
Financial Analysis
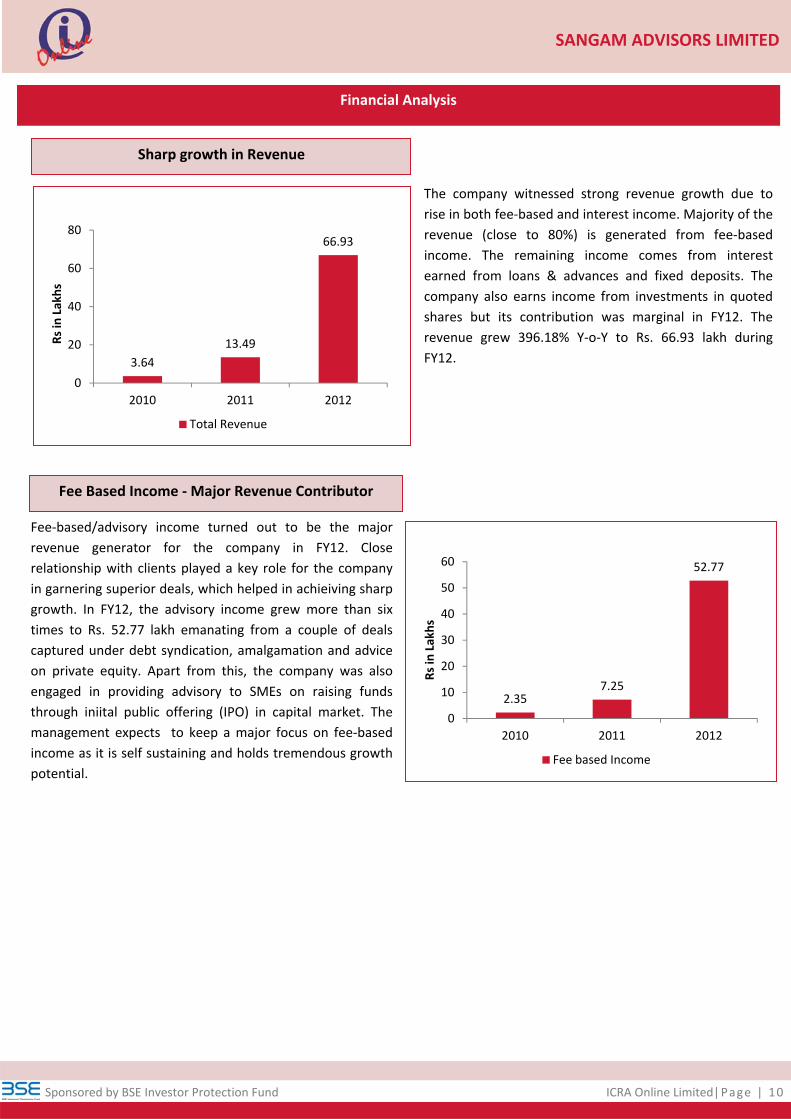
3.64
13.49
66.93
0
20
40
60
80
2010 2011 2012
Rs in Lakhs
Total Revenue
2.357.25
52.77
0
10
20
30
40
50
60
2010 2011 2012
Rs in Lakhs
Fee based Income
The company witnessed strong revenue growth due to
rise in both fee‐based and interest income. Majority of the
revenue (close to 80%) is generated from fee‐based
income. The remaining income comes from interest
earned from loans & advances and fixed deposits. The
company also earns income from investments in quoted
shares but its contribution was marginal in FY12. The
revenue grew 396.18% Y‐o‐Y to Rs. 66.93 lakh during
FY12.
Fee‐based/advisory income turned out to be the major
revenue generator for the company in FY12. Close
relationship with clients played a key role for the company
in garnering superior deals, which helped in achieiving sharp
growth. In FY12, the advisory income grew more than six
times to Rs. 52.77 lakh emanating from a couple of deals
captured under debt syndication, amalgamation and advice
on private equity. Apart from this, the company was also
engaged in providing advisory to SMEs on raising funds
through iniital public offering (IPO) in capital market. The
management expects to keep a major focus on fee‐based
income as it is self sustaining and holds tremendous growth
potential.
Sharp growth in Revenue
Fee Based Income ‐ Major Revenue Contributor
Sponsored by BSE Investor Protection Fund ICRA Online Limited|Page | 11
SANGAM ADVISORS LIMITED
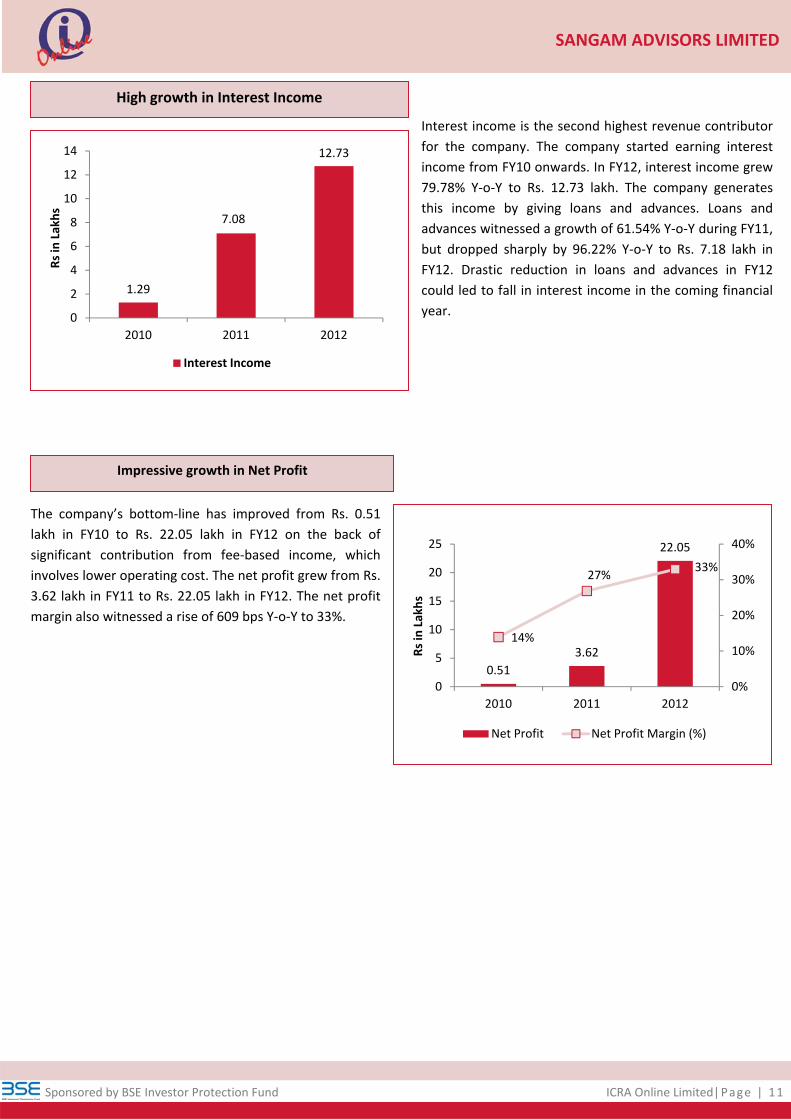
1.29
7.08
12.73
0
2
4
6
8
10
12
14
2010 2011 2012
Rs in Lakhs
Interest Income
0.51
3.62
22.05
14%
27%33%
0%
10%
20%
30%
40%
0
5
10
15
20
25
2010 2011 2012
Rs in Lakhs
Net Profit Net Profit Margin (%)
Interest income is the second highest revenue contributor
for the company. The company started earning interest
income from FY10 onwards. In FY12, interest income grew
79.78% Y‐o‐Y to Rs. 12.73 lakh. The company generates
this income by giving loans and advances. Loans and
advances witnessed a growth of 61.54% Y‐o‐Y during FY11,
but dropped sharply by 96.22% Y‐o‐Y to Rs. 7.18 lakh in
FY12. Drastic reduction in loans and advances in FY12
could led to fall in interest income in the coming financial
year.
The company’s bottom‐line has improved from Rs. 0.51
lakh in FY10 to Rs. 22.05 lakh in FY12 on the back of
significant contribution from fee‐based income, which
involves lower operating cost. The net profit grew from Rs.
3.62 lakh in FY11 to Rs. 22.05 lakh in FY12. The net profit
margin also witnessed a rise of 609 bps Y‐o‐Y to 33%.
High growth in Interest Income
Impressive growth in Net Profit
Sponsored by BSE Investor Protection Fund ICRA Online Limited|Page | 12
SANGAM ADVISORS LIMITED
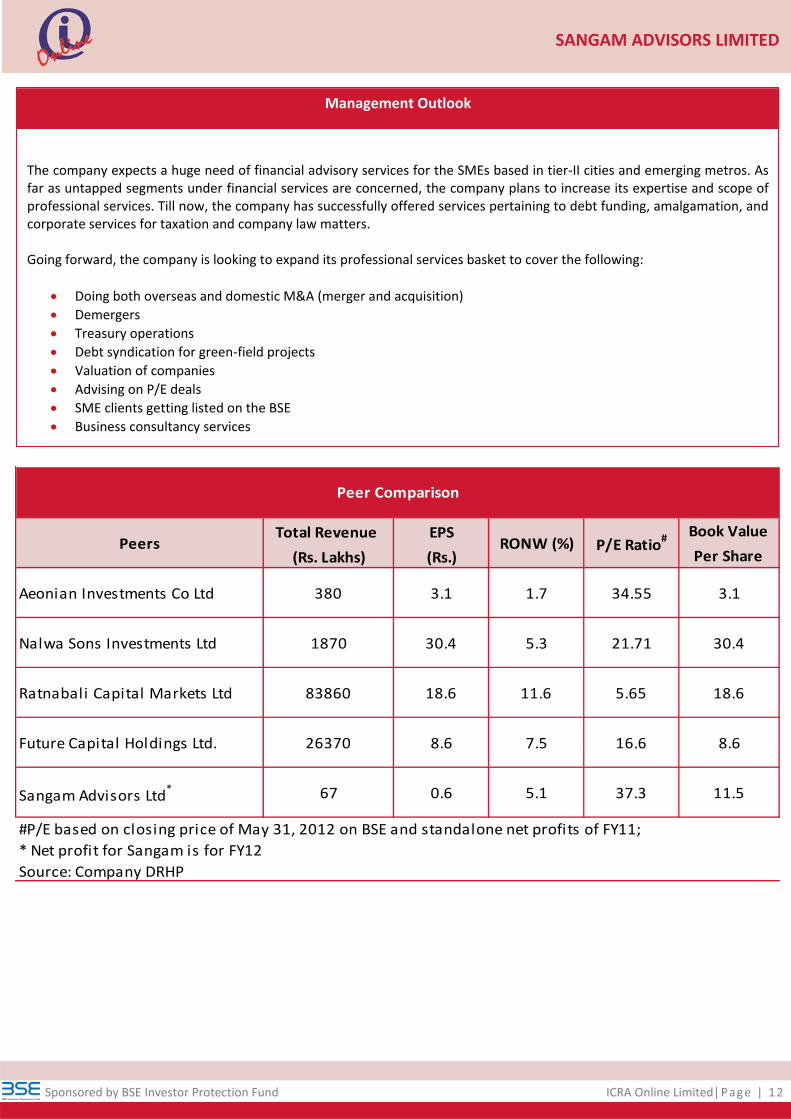
Total Revenue EPS Book Value
(Rs. Lakhs) (Rs.) Per Share
Aeonian Investments Co Ltd 380 3.1 1.7 34.55 3.1
Ratnabali Capital Markets Ltd 83860 18.6 11.6 5.65 18.6
Future Capital Holdings Ltd. 26370 8.6 7.5 16.6 8.6
Sangam Advisors Ltd* 67 0.6 5.1 37.3 11.5
#P/E based on closing price of May 31, 2012 on BSE and standalone net profits of FY11;
* Net profit for Sangam is for FY12
Source: Company DRHP
Peers RONW (%) P/E Ratio#
Peer Comparison
1870 30.4 5.3 21.71 30.4Nalwa Sons Investments Ltd
The company expects a huge need of financial advisory services for the SMEs based in tier‐II cities and emerging metros. As far as untapped segments under financial services are concerned, the company plans to increase its expertise and scope of professional services. Till now, the company has successfully offered services pertaining to debt funding, amalgamation, and corporate services for taxation and company law matters. Going forward, the company is looking to expand its professional services basket to cover the following:
Doing both overseas and domestic M&A (merger and acquisition)
Demergers
Treasury operations
Debt syndication for green‐field projects
Valuation of companies
Advising on P/E deals
SME clients getting listed on the BSE
Business consultancy services
Management Outlook
Sponsored by BSE Investor Protection Fund ICRA Online Limited|Page | 13
SANGAM ADVISORS LIMITED
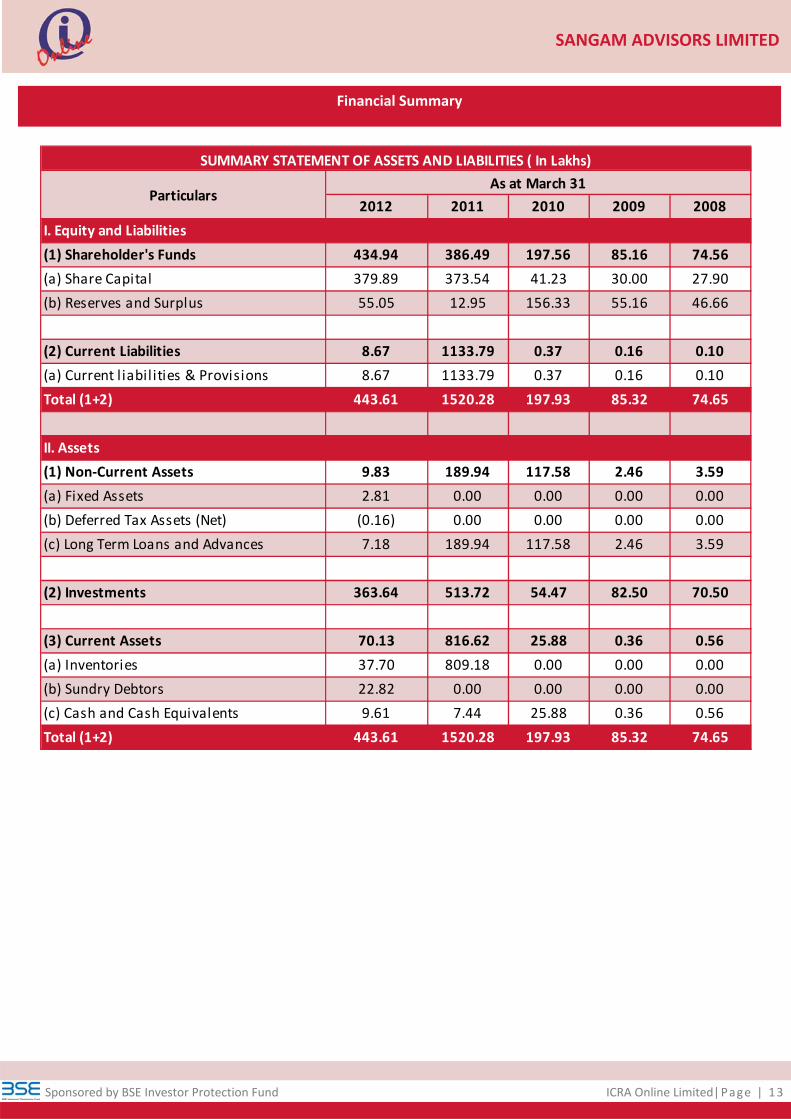
Financial Summary
2012 2011 2010 2009 2008
434.94 386.49 197.56 85.16 74.56
379.89 373.54 41.23 30.00 27.90
55.05 12.95 156.33 55.16 46.66
8.67 1133.79 0.37 0.16 0.10
8.67 1133.79 0.37 0.16 0.10
443.61 1520.28 197.93 85.32 74.65
9.83 189.94 117.58 2.46 3.59
2.81 0.00 0.00 0.00 0.00
(0.16) 0.00 0.00 0.00 0.00
7.18 189.94 117.58 2.46 3.59
363.64 513.72 54.47 82.50 70.50
70.13 816.62 25.88 0.36 0.56
37.70 809.18 0.00 0.00 0.00
22.82 0.00 0.00 0.00 0.00
9.61 7.44 25.88 0.36 0.56
443.61 1520.28 197.93 85.32 74.65
(b) Deferred Tax Assets (Net)
(c) Long Term Loans and Advances
Total (1+2)
(a) Inventories
(b) Sundry Debtors
(c) Cash and Cash Equivalents
(2) Investments
(3) Current Assets
(1) Non‐Current Assets
(a) Fixed Assets
Total (1+2)
II. Assets
(2) Current Liabilities
(a) Current l iabil ities & Provisions
(1) Shareholder's Funds
(a) Share Capital
(b) Reserves and Surplus
ParticularsAs at March 31
SUMMARY STATEMENT OF ASSETS AND LIABILITIES ( In Lakhs)
I. Equity and Liabilities
Sponsored by BSE Investor Protection Fund ICRA Online Limited|Page | 14
SANGAM ADVISORS LIMITED
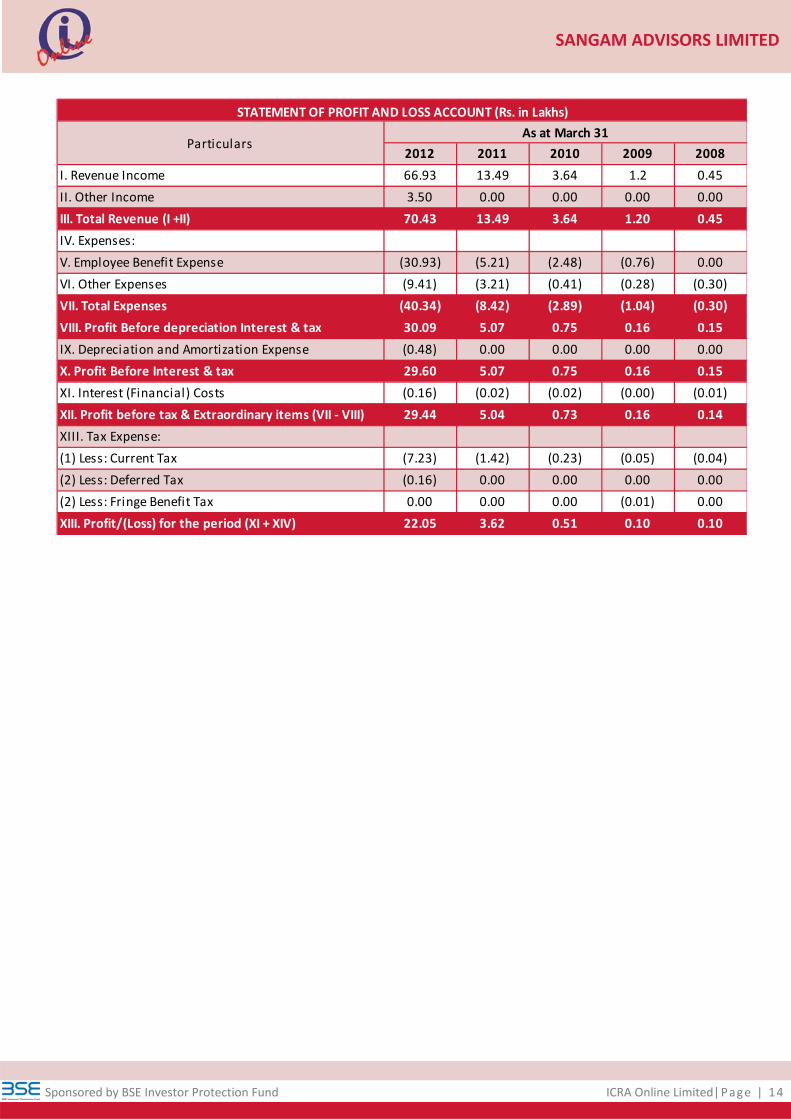
2012 2011 2010 2009 2008
66.93 13.49 3.64 1.2 0.45
3.50 0.00 0.00 0.00 0.00
70.43 13.49 3.64 1.20 0.45
(30.93) (5.21) (2.48) (0.76) 0.00
(9.41) (3.21) (0.41) (0.28) (0.30)
(40.34) (8.42) (2.89) (1.04) (0.30)
30.09 5.07 0.75 0.16 0.15
(0.48) 0.00 0.00 0.00 0.00
29.60 5.07 0.75 0.16 0.15
(0.16) (0.02) (0.02) (0.00) (0.01)
29.44 5.04 0.73 0.16 0.14
(7.23) (1.42) (0.23) (0.05) (0.04)
(0.16) 0.00 0.00 0.00 0.00
0.00 0.00 0.00 (0.01) 0.00
22.05 3.62 0.51 0.10 0.10
XI. Interest (Financial) Costs
IX. Depreciation and Amortization Expense
(2) Less: Fringe Benefit Tax
XIII. Profit/(Loss) for the period (XI + XIV)
(2) Less: Deferred Tax
XII. Profit before tax & Extraordinary items (VII ‐ VIII)
XIII. Tax Expense:
(1) Less: Current Tax
X. Profit Before Interest & tax
ParticularsAs at March 31
I. Revenue Income
STATEMENT OF PROFIT AND LOSS ACCOUNT (Rs. in Lakhs)
II. Other Income
III. Total Revenue (I +II)
IV. Expenses:
V. Employee Benefit Expense
VIII. Profit Before depreciation Interest & tax
VI. Other Expenses
VII. Total Expenses
Sponsored by BSE Investor Protection Fund ICRA Online Limited|Page | 15
SANGAM ADVISORS LIMITED
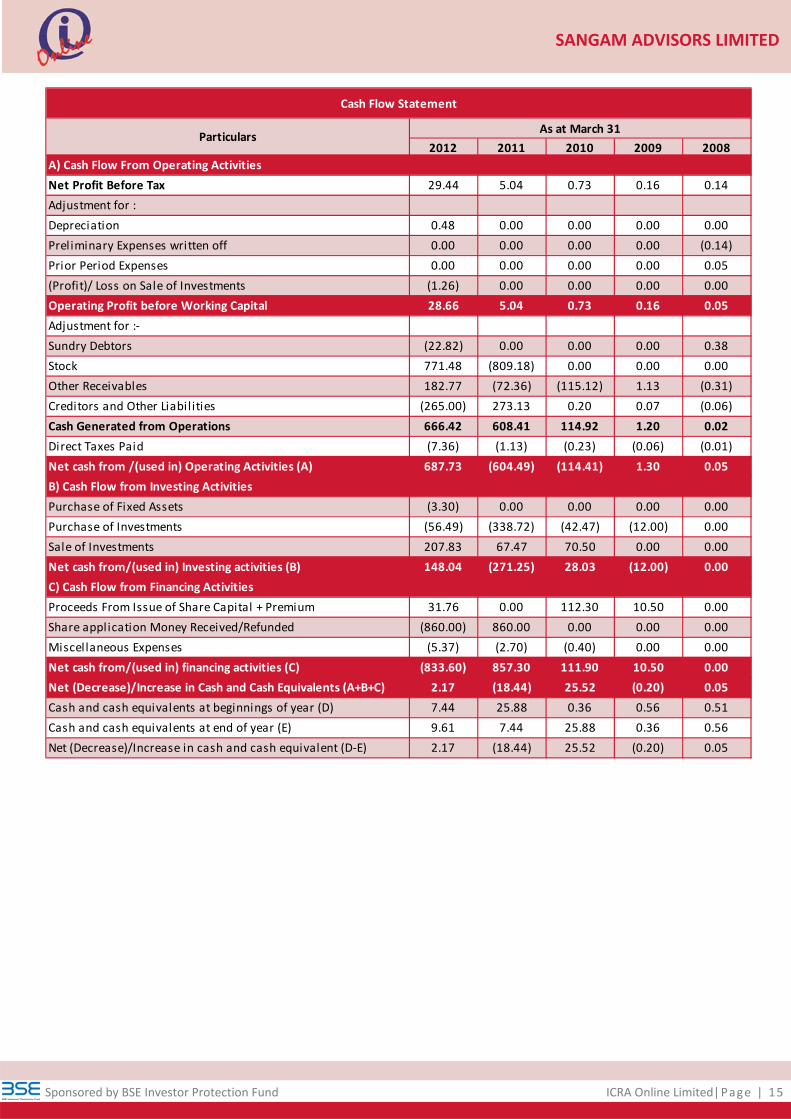
2012 2011 2010 2009 2008
29.44 5.04 0.73 0.16 0.14
0.48 0.00 0.00 0.00 0.00
0.00 0.00 0.00 0.00 (0.14)
0.00 0.00 0.00 0.00 0.05
(1.26) 0.00 0.00 0.00 0.00
28.66 5.04 0.73 0.16 0.05
(22.82) 0.00 0.00 0.00 0.38
771.48 (809.18) 0.00 0.00 0.00
182.77 (72.36) (115.12) 1.13 (0.31)
(265.00) 273.13 0.20 0.07 (0.06)
666.42 608.41 114.92 1.20 0.02
(7.36) (1.13) (0.23) (0.06) (0.01)
687.73 (604.49) (114.41) 1.30 0.05
(3.30) 0.00 0.00 0.00 0.00
(56.49) (338.72) (42.47) (12.00) 0.00
207.83 67.47 70.50 0.00 0.00
148.04 (271.25) 28.03 (12.00) 0.00
31.76 0.00 112.30 10.50 0.00
(860.00) 860.00 0.00 0.00 0.00
(5.37) (2.70) (0.40) 0.00 0.00
(833.60) 857.30 111.90 10.50 0.00
2.17 (18.44) 25.52 (0.20) 0.05
7.44 25.88 0.36 0.56 0.51
9.61 7.44 25.88 0.36 0.56
2.17 (18.44) 25.52 (0.20) 0.05
Share application Money Received/Refunded
Net cash from/(used in) financing activities (C)
Cash and cash equivalents at end of year (E)
Net (Decrease)/Increase in cash and cash equivalent (D‐E)
Net (Decrease)/Increase in Cash and Cash Equivalents (A+B+C)
Cash and cash equivalents at beginnings of year (D)
Miscellaneous Expenses
Purchase of Fixed Assets
Purchase of Investments
Sale of Investments
Net cash from/(used in) Investing activities (B)
Proceeds From Issue of Share Capital + Premium
Cash Generated from Operations
Creditors and Other Liabilities
Other Receivables
Direct Taxes Paid
Net cash from /(used in) Operating Activities (A)
Cash Flow Statement
B) Cash Flow from Investing Activities
C) Cash Flow from Financing Activities
(Profit)/ Loss on Sale of Investments
A) Cash Flow From Operating Activities
ParticularsAs at March 31
Net Profit Before Tax
Adjustment for :
Depreciation
Preliminary Expenses written off
Prior Period Expenses
Operating Profit before Working Capital
Adjustment for :‐
Sundry Debtors
Stock
Sponsored by BSE Investor Protection Fund ICRA Online Limited|Page | 16
SANGAM ADVISORS LIMITED
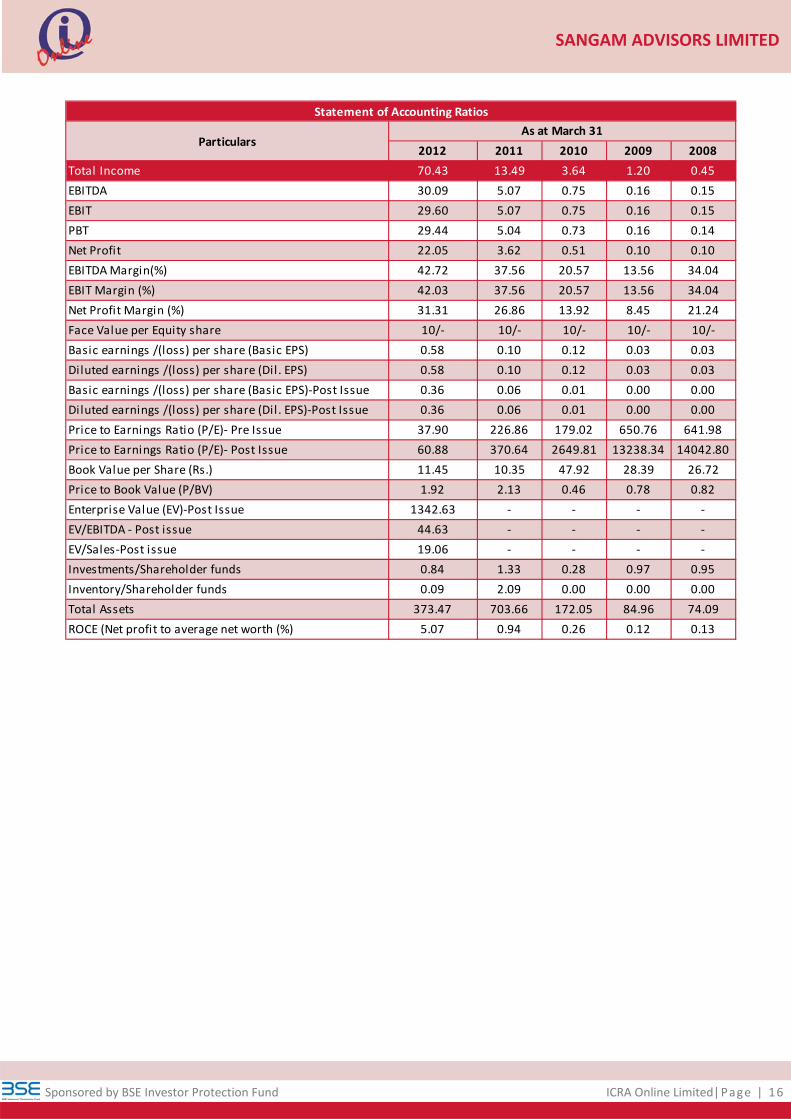
2012 2011 2010 2009 2008
70.43 13.49 3.64 1.20 0.45
30.09 5.07 0.75 0.16 0.15
29.60 5.07 0.75 0.16 0.15
29.44 5.04 0.73 0.16 0.14
22.05 3.62 0.51 0.10 0.10
42.72 37.56 20.57 13.56 34.04
42.03 37.56 20.57 13.56 34.04
31.31 26.86 13.92 8.45 21.24
10/‐ 10/‐ 10/‐ 10/‐ 10/‐
0.58 0.10 0.12 0.03 0.03
0.58 0.10 0.12 0.03 0.03
0.36 0.06 0.01 0.00 0.00
0.36 0.06 0.01 0.00 0.00
37.90 226.86 179.02 650.76 641.98
60.88 370.64 2649.81 13238.34 14042.80
11.45 10.35 47.92 28.39 26.72
1.92 2.13 0.46 0.78 0.82
1342.63 ‐ ‐ ‐ ‐
44.63 ‐ ‐ ‐ ‐
19.06 ‐ ‐ ‐ ‐
0.84 1.33 0.28 0.97 0.95
0.09 2.09 0.00 0.00 0.00
373.47 703.66 172.05 84.96 74.09
5.07 0.94 0.26 0.12 0.13
ParticularsAs at March 31
Face Value per Equity share
Price to Book Value (P/BV)
Price to Earnings Ratio (P/E)‐ Pre Issue
Statement of Accounting Ratios
Basic earnings /(loss) per share (Basic EPS)
ROCE (Net profit to average net worth (%)
EV/Sales‐Post issue
Investments/Shareholder funds
Inventory/Shareholder funds
Total Income
EBITDA
EBIT
Net Profit
PBT
EBITDA Margin(%)
EBIT Margin (%)
Net Profit Margin (%)
Total Assets
Diluted earnings /(loss) per share (Dil . EPS)
Price to Earnings Ratio (P/E)‐ Post Issue
Book Value per Share (Rs.)
Enterprise Value (EV)‐Post Issue
EV/EBITDA ‐ Post issue
Basic earnings /(loss) per share (Basic EPS)‐Post Issue
Diluted earnings /(loss) per share (Dil . EPS)‐Post Issue
Sponsored by BSE Investor Protection Fund ICRA Online Limited|Page | 17
SANGAM ADVISORS LIMITED
Contact Details
All information contained in this document has been obtained by ICRA Online Limited from sources believed by it to be
accurate and reliable. The report has been prepared after management discussion. Although reasonable care has been
taken to ensure that the information herein is true, such information is provided 'as is' without any warranty of any kind,
and ICRA Online Limited in particular, makes no representation or warranty, express or implied, as to the accuracy,
timeliness or completeness of any such information. All information contained herein must be construed solely as
statements of opinion, and ICRA Online Limited shall not be liable for any losses incurred by users from any use of this
document or its contents in any manner. Opinions expressed in this document are not the opinions of our holding company
and of the subsidiary companies and should not be construed as any indication of credit rating or grading of ICRA for any
instruments that have been issued or are to be issued by any entity.
Disclaimer
Analyst Email ID Contact No.
Head of Research
Tarun Chaturvedi [email protected] + 91 33 4017 0170
Consultant
Lahar Bhasin [email protected] + 91 22 6781 6100
Senior Analysts & Team Leads
Abhijit Shirke [email protected] + 91 22 6781 6159
Amol Wakekar [email protected] + 91 22 6781 6163
Niraj Agarwal [email protected] + 91 33 4017 0145
Sumit Somani [email protected] + 91 33 4017 0144
Analysts
Moumita Pal [email protected] + 91 33 4017 0104
Priyanka Banerjee [email protected] + 91 33 4017 0180
Rachna Gurnani [email protected] + 91 22 6781 6106
Rahul Jain [email protected] + 91 22 6781 6159
Rinki Jumrani [email protected] + 91 33 4017 0149
Sonali Rani Rustagi [email protected] + 91 33 4017 0180
Tanusree Mukherjee [email protected] + 91 33 4017 0145
Published on behalf of The Stock Exchange Investors' Protection Fund
Bombay Stock Exchange Ltd.
P J Towers, Dalal Street, Mumbai. Tel: 2272 3817 www.bsesme.com
Mumbai
Atul Sharma
107, Raheja Arcade, 1st Floor
Plot No. 61, Sector XI, CBD Belapur
Navi Mumbai—400614, India
Tel: +91-22-6781 6100
Fax: +91-22-2756 3057
Kolkata
Sayon Dasgupta
2nd, 3rd, 5th & 6th Floor,
Convergence Contact Centre
Plot D2/2, Block EP & GP
Sector V, Salt Lake City
Kolkata—700091, India
Tel: +91-33-4017 0100, 4017 0400
Fax: +91-33-4017 0101
New Delhi
Pramod Kumar
1105, Kailash Building, 11th Floor
26, Kasturba Gandhi Marg
New Delhi—110001, India
Tel: +91-11-2335 7940-50
Fax: +91-11-2335 7014
Chennai
Jayakannan Singamuthu
5th Floor, JVL Plaza 626
Anna Salai, Teynampet
Chennai—600018, India
Tel: +91-44-2432 1856
Fax: +91-44-2434 3663
For further details or more information, please contact: www.icraonline.com/ www.mutualfundsindia.com
[email protected] Majumdar +91 98197 85027
Sales Team Details
Region Name Email Id Contact No.
Sayon Dasgupta
Pramod Kumar
Jayakannan Singamuthu
East
North
South [email protected]
West Atul Sharma [email protected] +91 96191 12544
+91 98300 50445
+91 99993 95783
+91 95000 40495
Our Offices
Head Sales
Name Email Id Contact No.


![Sagar [ Sangam Electronic ]](https://img.pdfslide.us/doc/110x75/55cf9291550346f57b97825d/sagar-sangam-electronic-.jpg)