Embed Size (px)
Citation preview
Sanford Bernstein 19Sanford Bernstein 19thth Annual Annual Strategic Decisions ConferenceStrategic Decisions Conference
June 2003June 2003
Jim Robbins – President and CEOJim Robbins – President and CEO
The Evolution of Our Success The Evolution of Our Success
Safe HarborSafe HarborDuring this presentation, we will be making certain forward During this presentation, we will be making certain forward looking statements within the meaning of Section 21E of the looking statements within the meaning of Section 21E of the Securities Exchange Act of 1934, as amended, about business Securities Exchange Act of 1934, as amended, about business strategies and goals, market potential, future financial strategies and goals, market potential, future financial performance, new service and product launches and other performance, new service and product launches and other matters. These statements address matters that involve matters. These statements address matters that involve significant risks and uncertainties that could cause actual significant risks and uncertainties that could cause actual results to differ materially from such statements, including, results to differ materially from such statements, including, without limitation, possible changes in expected market without limitation, possible changes in expected market acceptance of new products or services, impact of rate acceptance of new products or services, impact of rate changes, ability of vendors to meet contractual obligations, changes, ability of vendors to meet contractual obligations, competitive issues, regulatory issues and continued access to competitive issues, regulatory issues and continued access to capital on terms acceptable to the Company.capital on terms acceptable to the Company.Please refer to publicly filed documents of the Company, Please refer to publicly filed documents of the Company, including the Company’s most recent Form 10-K for additional including the Company’s most recent Form 10-K for additional information about the Company and for additional information information about the Company and for additional information about the risks and uncertainties related to the Company. about the risks and uncertainties related to the Company.
Use of Non-GAAP MeasuresUse of Non-GAAP Measures
This presentation contains certain non-GAAP This presentation contains certain non-GAAP financial measures including operating cash financial measures including operating cash flow (also referred to as EBITDA) and free cash flow (also referred to as EBITDA) and free cash flow. For full disclosure of the use of these non-flow. For full disclosure of the use of these non-GAAP measures and a reconciliation between GAAP measures and a reconciliation between the non-GAAP financial measures and the the non-GAAP financial measures and the GAAP financial measures, please see our GAAP financial measures, please see our quarterly earnings press release, 10K or 10Q quarterly earnings press release, 10K or 10Q available at www.cox.com/investor.available at www.cox.com/investor.
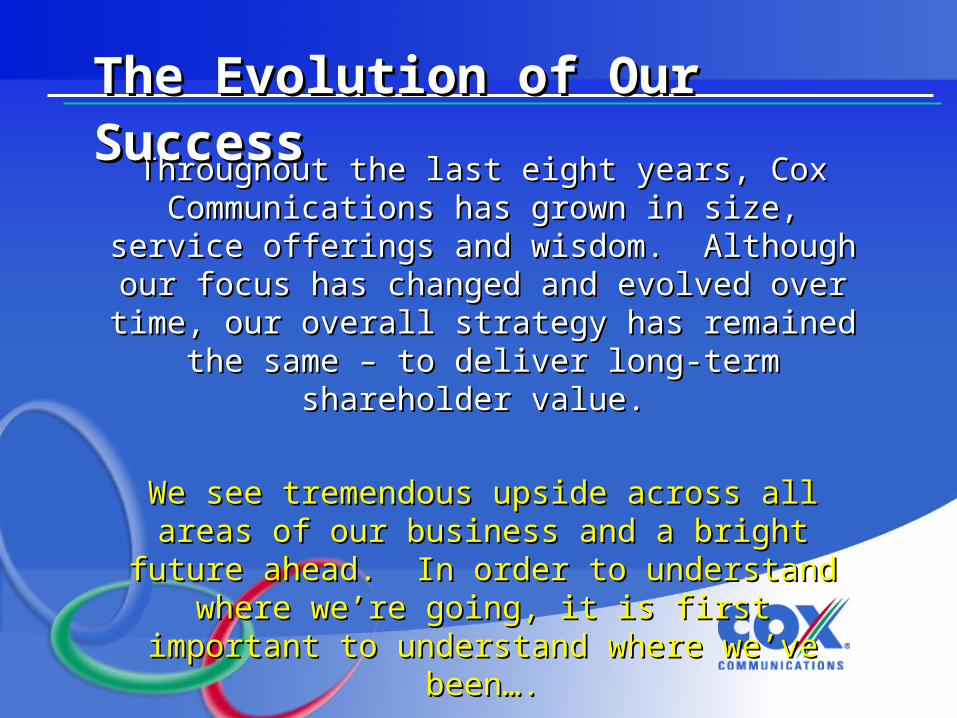
Throughout the last eight years, Cox Throughout the last eight years, Cox Communications has grown in size, service offerings Communications has grown in size, service offerings and wisdom. Although our focus has changed and and wisdom. Although our focus has changed and
evolved over time, our overall strategy has remained evolved over time, our overall strategy has remained the same – to deliver long-term shareholder value. the same – to deliver long-term shareholder value.
We see tremendous upside across all areas of our We see tremendous upside across all areas of our business and a bright future ahead. In order to business and a bright future ahead. In order to
understand where we’re going, it is first important to understand where we’re going, it is first important to understand where we’ve been….understand where we’ve been….
The Evolution of Our SuccessThe Evolution of Our Success
The Evolution of Our Success The Evolution of Our Success
19951995 200020001997199719961996 20012001 20022002
20032003
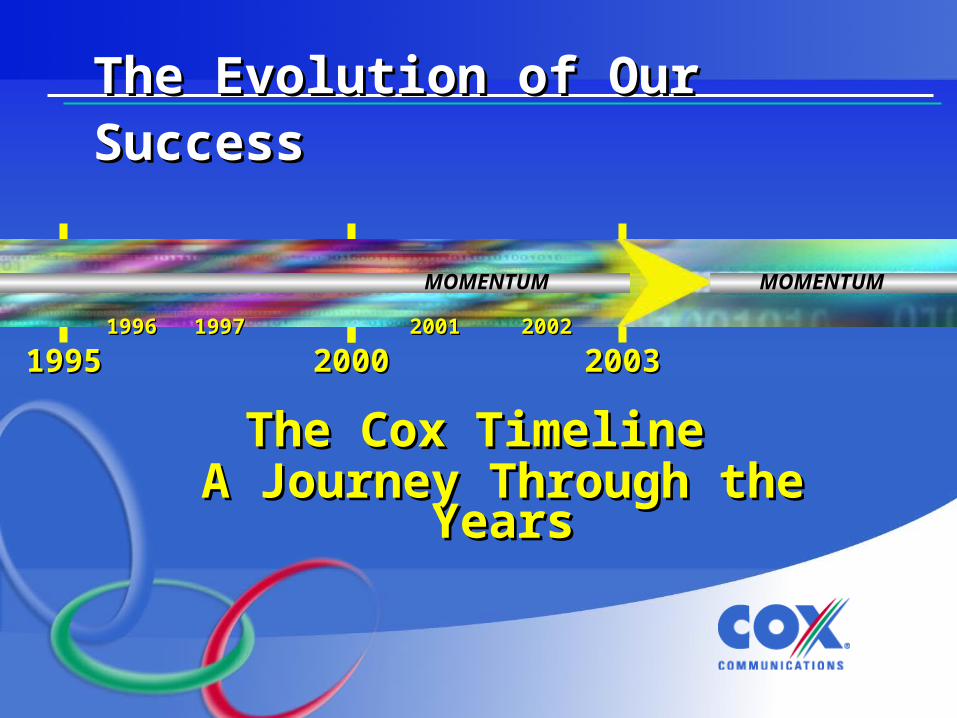
A Journey Through the YearsA Journey Through the YearsThe Cox TimelineThe Cox Timeline
MOMENTUMMOMENTUM
The Evolution of Our Success The Evolution of Our Success
19951995 20002000
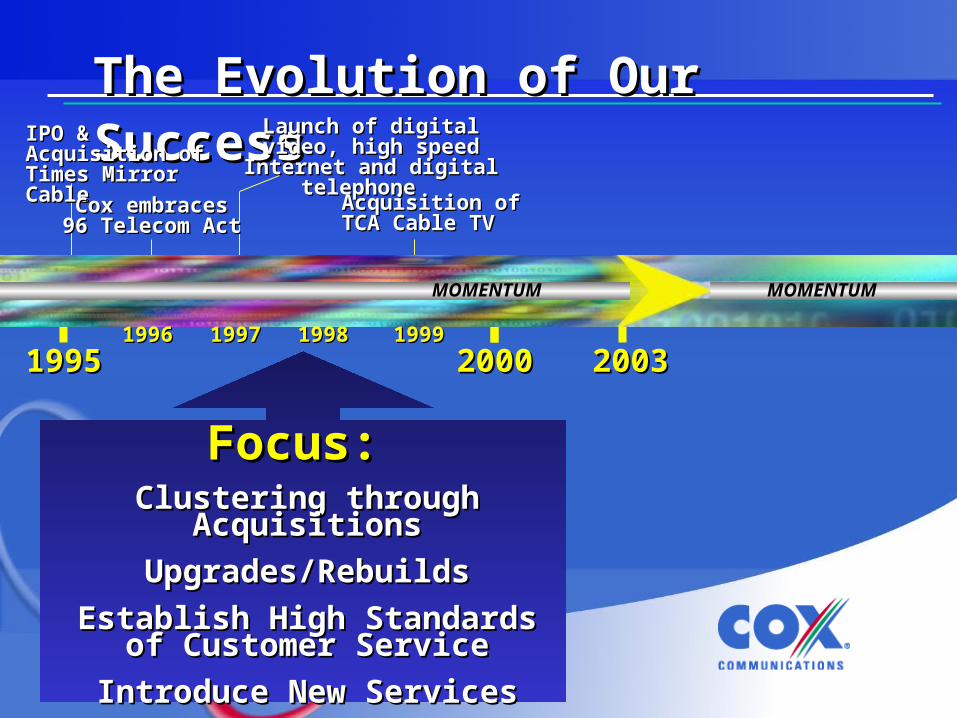
Focus: Focus: Clustering through AcquisitionsClustering through Acquisitions
Upgrades/RebuildsUpgrades/Rebuilds
Establish High Standards of Establish High Standards of Customer ServiceCustomer Service
Introduce New ServicesIntroduce New Services
IPO & Acquisition IPO & Acquisition of Times Mirror of Times Mirror CableCable
Cox embraces 96 Cox embraces 96 Telecom ActTelecom Act
Launch of digital video, Launch of digital video, high speed Internet and high speed Internet and
digital telephone digital telephone
20032003
MOMENTUMMOMENTUM
1997199719961996 19981998 19991999
Acquisition of Acquisition of TCA Cable TV TCA Cable TV
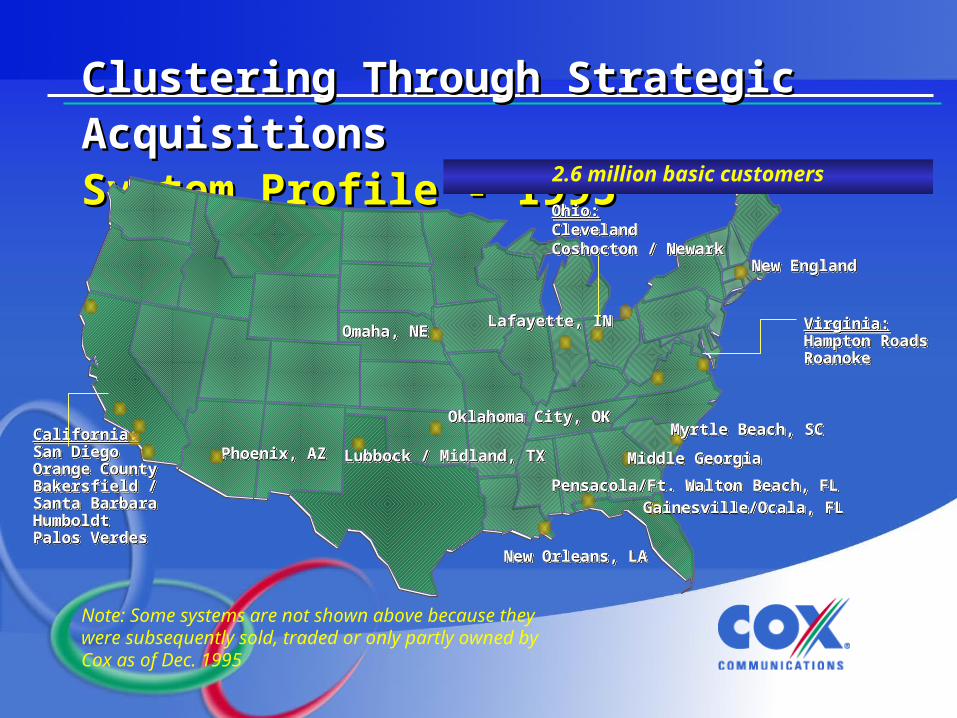
Clustering Through Strategic AcquisitionsClustering Through Strategic AcquisitionsSystem Profile - 1995System Profile - 1995
California:California:San DiegoSan DiegoOrange CountyOrange CountyBakersfield /Bakersfield /Santa BarbaraSanta BarbaraHumboldtHumboldtPalos VerdesPalos Verdes
California:California:San DiegoSan DiegoOrange CountyOrange CountyBakersfield /Bakersfield /Santa BarbaraSanta BarbaraHumboldtHumboldtPalos VerdesPalos Verdes
Phoenix, AZPhoenix, AZPhoenix, AZPhoenix, AZ
Pensacola/Ft. Walton Beach, FLPensacola/Ft. Walton Beach, FLPensacola/Ft. Walton Beach, FLPensacola/Ft. Walton Beach, FL
New EnglandNew EnglandNew EnglandNew England
Gainesville/Ocala, FLGainesville/Ocala, FLGainesville/Ocala, FLGainesville/Ocala, FL
Middle GeorgiaMiddle GeorgiaMiddle GeorgiaMiddle Georgia
Ohio:Ohio:ClevelandClevelandCoshocton / NewarkCoshocton / Newark
Ohio:Ohio:ClevelandClevelandCoshocton / NewarkCoshocton / Newark
Lubbock / Midland, TXLubbock / Midland, TXLubbock / Midland, TXLubbock / Midland, TX
New Orleans, LANew Orleans, LANew Orleans, LANew Orleans, LA
Omaha, NEOmaha, NEOmaha, NEOmaha, NE Virginia:Virginia:Hampton RoadsHampton RoadsRoanokeRoanoke
Virginia:Virginia:Hampton RoadsHampton RoadsRoanokeRoanoke
Oklahoma City, OKOklahoma City, OKOklahoma City, OKOklahoma City, OK
Lafayette, INLafayette, INLafayette, INLafayette, IN
Note: Some systems are not shown above because they were subsequently sold, traded or only partly owned by Cox as of Dec. 1995
Myrtle Beach, SCMyrtle Beach, SCMyrtle Beach, SCMyrtle Beach, SC
2.6 million basic customers
California:California:San DiegoSan DiegoOrange CountyOrange CountyBakersfield /Bakersfield / Santa BarbaraSanta BarbaraHumboldtHumboldt
California:California:San DiegoSan DiegoOrange CountyOrange CountyBakersfield /Bakersfield / Santa BarbaraSanta BarbaraHumboldtHumboldt
Phoenix, AZPhoenix, AZPhoenix, AZPhoenix, AZ
Pensacola/Ft. Walton Beach, FLPensacola/Ft. Walton Beach, FLPensacola/Ft. Walton Beach, FLPensacola/Ft. Walton Beach, FL
New EnglandNew England(includes parts of Rhode Island,(includes parts of Rhode Island,Connecticut, & MassachusettsConnecticut, & Massachusetts))
New EnglandNew England(includes parts of Rhode Island,(includes parts of Rhode Island,Connecticut, & MassachusettsConnecticut, & Massachusetts))
Sun Valley, IDSun Valley, IDSun Valley, IDSun Valley, ID
Tucson/Sierra Vista, AZTucson/Sierra Vista, AZTucson/Sierra Vista, AZTucson/Sierra Vista, AZ
Gainesville/Ocala, FLGainesville/Ocala, FLGainesville/Ocala, FLGainesville/Ocala, FL
Middle GeorgiaMiddle GeorgiaMiddle GeorgiaMiddle Georgia
Cleveland, OHCleveland, OHCleveland, OHCleveland, OH
Texas:Texas:BryanBryanGeorgetownGeorgetownTylerTylerVictoriaVictoriaWest Texas West Texas (includes Lubbock, Midland,(includes Lubbock, Midland,Amarillo, San Angelo, Abilene and nearby areas,Amarillo, San Angelo, Abilene and nearby areas,+ Clovis, NM)+ Clovis, NM)
Texas:Texas:BryanBryanGeorgetownGeorgetownTylerTylerVictoriaVictoriaWest Texas West Texas (includes Lubbock, Midland,(includes Lubbock, Midland,Amarillo, San Angelo, Abilene and nearby areas,Amarillo, San Angelo, Abilene and nearby areas,+ Clovis, NM)+ Clovis, NM)
Louisiana:Louisiana:AlexandriaAlexandriaBaton RougeBaton RougeBossier CityBossier CityLafayetteLafayetteLake CharlesLake CharlesNew IberiaNew IberiaNew OrleansNew Orleans
Louisiana:Louisiana:AlexandriaAlexandriaBaton RougeBaton RougeBossier CityBossier CityLafayetteLafayetteLake CharlesLake CharlesNew IberiaNew IberiaNew OrleansNew Orleans
Omaha, NEOmaha, NE(includes Council Bluffs, IA)(includes Council Bluffs, IA)Omaha, NEOmaha, NE(includes Council Bluffs, IA)(includes Council Bluffs, IA)
Virginia:Virginia:Northern VANorthern VAHampton RoadsHampton RoadsRoanokeRoanoke
Virginia:Virginia:Northern VANorthern VAHampton RoadsHampton RoadsRoanokeRoanoke
North Carolina:North Carolina:Rocky Mt.Rocky Mt.GreenvilleGreenvilleNew BernNew Bern
North Carolina:North Carolina:Rocky Mt.Rocky Mt.GreenvilleGreenvilleNew BernNew Bern
Oklahoma:Oklahoma:Oklahoma CityOklahoma CityTulsaTulsaEnidEnidMuskogeeMuskogeeStillwaterStillwater
Oklahoma:Oklahoma:Oklahoma CityOklahoma CityTulsaTulsaEnidEnidMuskogeeMuskogeeStillwaterStillwater
Arkansas:Arkansas:Fayetteville/Fayetteville/ SpringdaleSpringdaleFort SmithFort SmithBentonvilleBentonvilleRussellvilleRussellvilleJonesboroJonesboro(+S.W. Missouri(+S.W. Missouri))
Arkansas:Arkansas:Fayetteville/Fayetteville/ SpringdaleSpringdaleFort SmithFort SmithBentonvilleBentonvilleRussellvilleRussellvilleJonesboroJonesboro(+S.W. Missouri(+S.W. Missouri))
Kansas:Kansas:WichitaWichitaTopekaTopekaManhattan/Junction CityManhattan/Junction CitySoutheast KansasSoutheast KansasSalinaSalinaDodge City/Garden CityDodge City/Garden City
Kansas:Kansas:WichitaWichitaTopekaTopekaManhattan/Junction CityManhattan/Junction CitySoutheast KansasSoutheast KansasSalinaSalinaDodge City/Garden CityDodge City/Garden City
Las Vegas, NVLas Vegas, NV
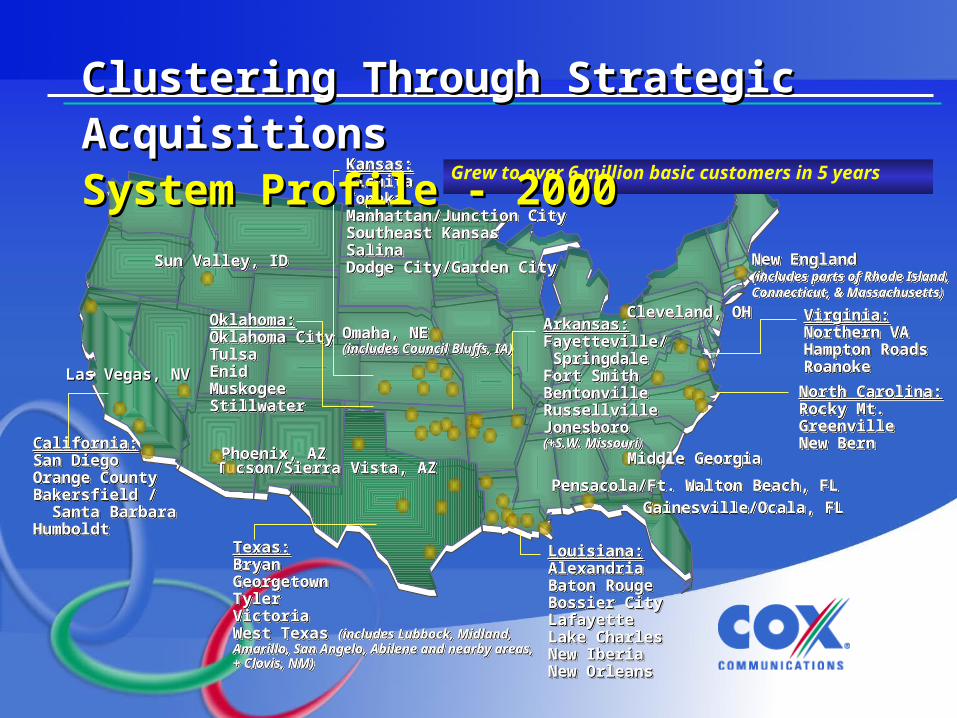
Grew to over 6 million basic customers in 5 years
Clustering Through Strategic AcquisitionsClustering Through Strategic AcquisitionsSystem Profile - 2000System Profile - 2000
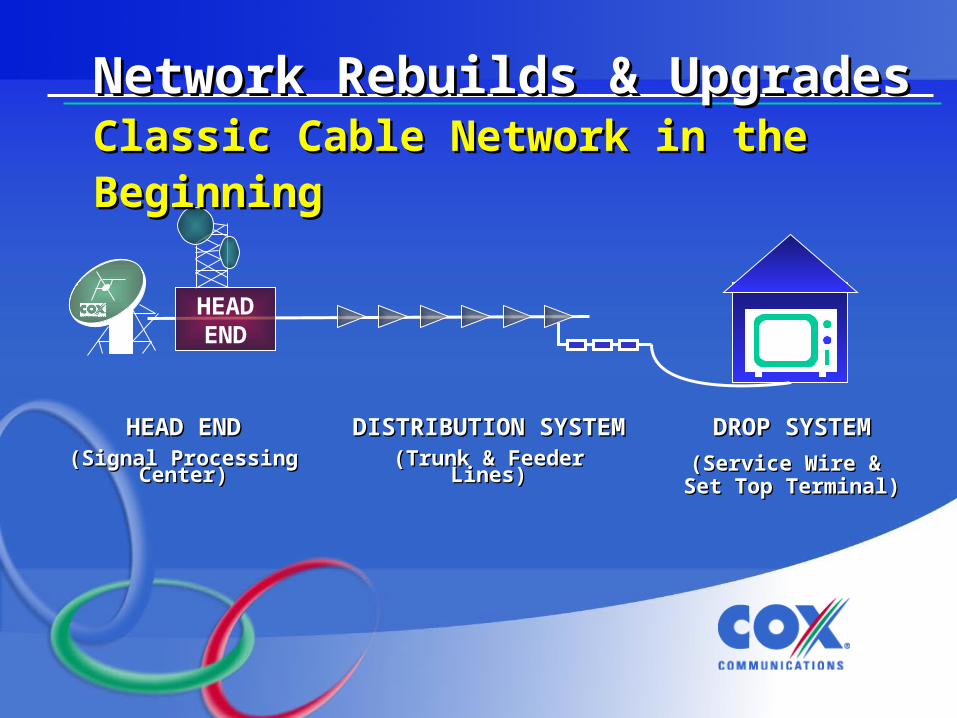
HEAD ENDHEAD END(Signal Processing (Signal Processing
Center)Center)
DISTRIBUTION SYSTEMDISTRIBUTION SYSTEM(Trunk & Feeder Lines)(Trunk & Feeder Lines)
DROP SYSTEMDROP SYSTEM
(Service Wire & (Service Wire & Set Top Terminal)Set Top Terminal)
HEADEND
Network Rebuilds & UpgradesNetwork Rebuilds & UpgradesClassic Cable Network in the BeginningClassic Cable Network in the Beginning
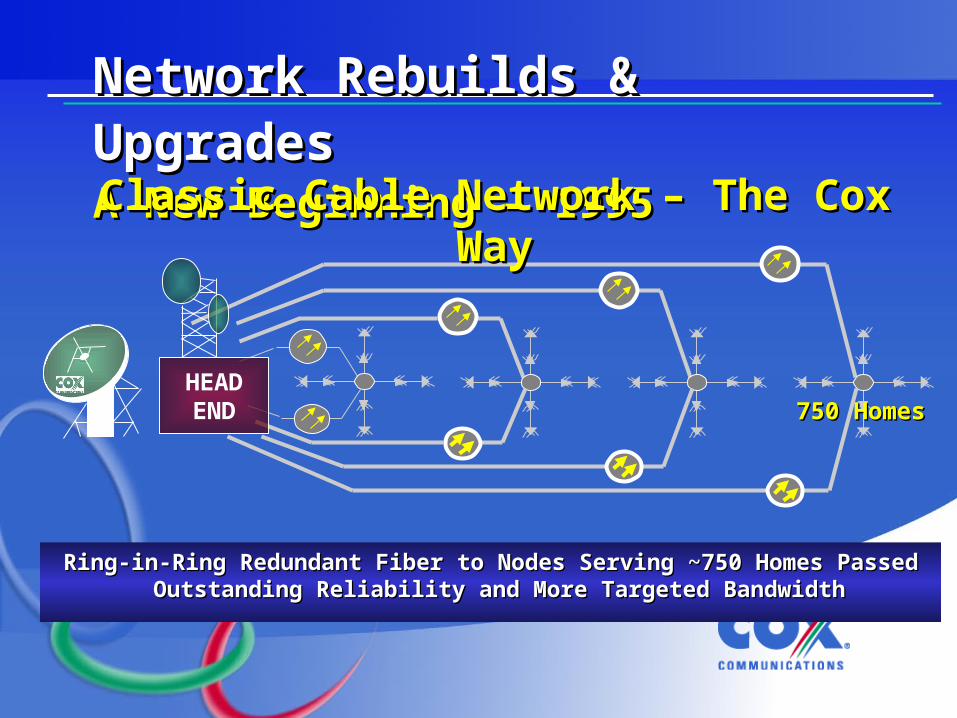
Ring-in-Ring Redundant Fiber to Nodes Serving ~750 Homes Passed Ring-in-Ring Redundant Fiber to Nodes Serving ~750 Homes Passed Outstanding Reliability and More Targeted Bandwidth Outstanding Reliability and More Targeted Bandwidth
Network Rebuilds & UpgradesNetwork Rebuilds & UpgradesA New Beginning – 1995A New Beginning – 1995
750 Homes750 Homes
Classic Cable Network – The Cox WayClassic Cable Network – The Cox Way
HEADEND
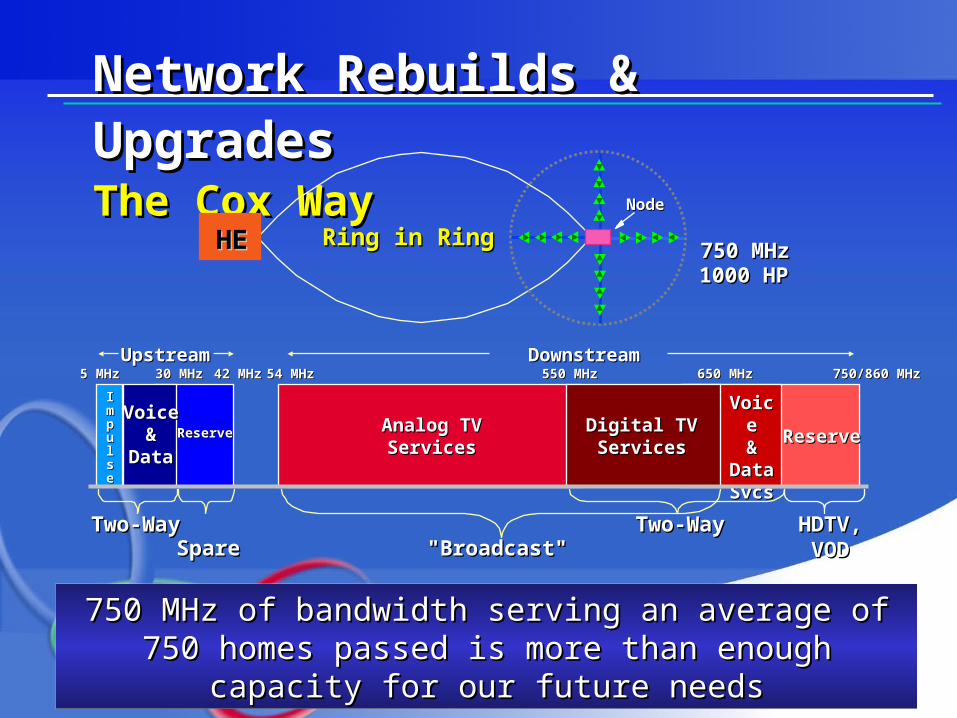
Network Rebuilds & UpgradesNetwork Rebuilds & UpgradesThe Cox WayThe Cox Way
5 MHz5 MHz 42 MHz42 MHz 54 MHz54 MHzDownstreamDownstream
750/860 MHz750/860 MHzUpstreamUpstream
Two-WayTwo-Way"Broadcast""Broadcast"
Two-WayTwo-Way
ReserveReserve
550 MHz550 MHz
VoiceVoice& &
DataDataSvcsSvcs
Digital TVDigital TVServicesServices
Analog TVAnalog TVServicesServices
IImmppuullssee
VoiceVoice&&
DataData
650 MHz650 MHz30 MHz30 MHz
SpareSpareHDTV,HDTV,VODVOD
ReserveReserve
750 MHz of bandwidth serving an average of 750 homes 750 MHz of bandwidth serving an average of 750 homes passed is more than enough capacity for our future needspassed is more than enough capacity for our future needs
750 MHz750 MHz1000 HP1000 HP
HEHE Ring in RingRing in Ring
NodeNode
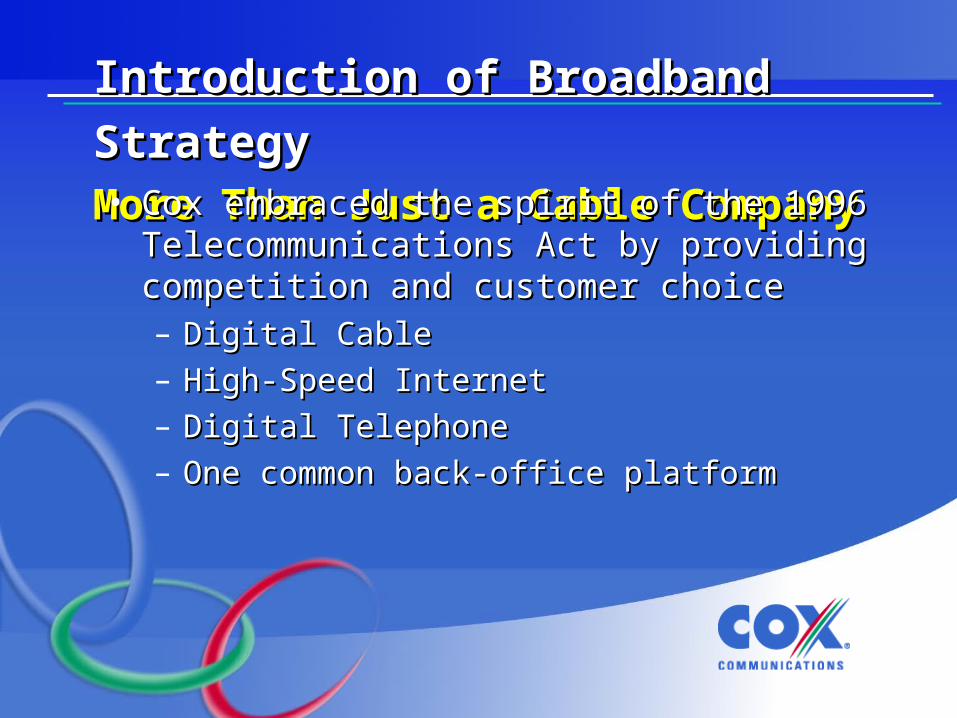
Introduction of Broadband StrategyIntroduction of Broadband Strategy
More Than Just a Cable CompanyMore Than Just a Cable Company• Cox embraced the spirit of the 1996 Cox embraced the spirit of the 1996
Telecommunications Act by providing Telecommunications Act by providing competition and customer choicecompetition and customer choice– Digital CableDigital Cable– High-Speed InternetHigh-Speed Internet– Digital TelephoneDigital Telephone– One common back-office platformOne common back-office platform
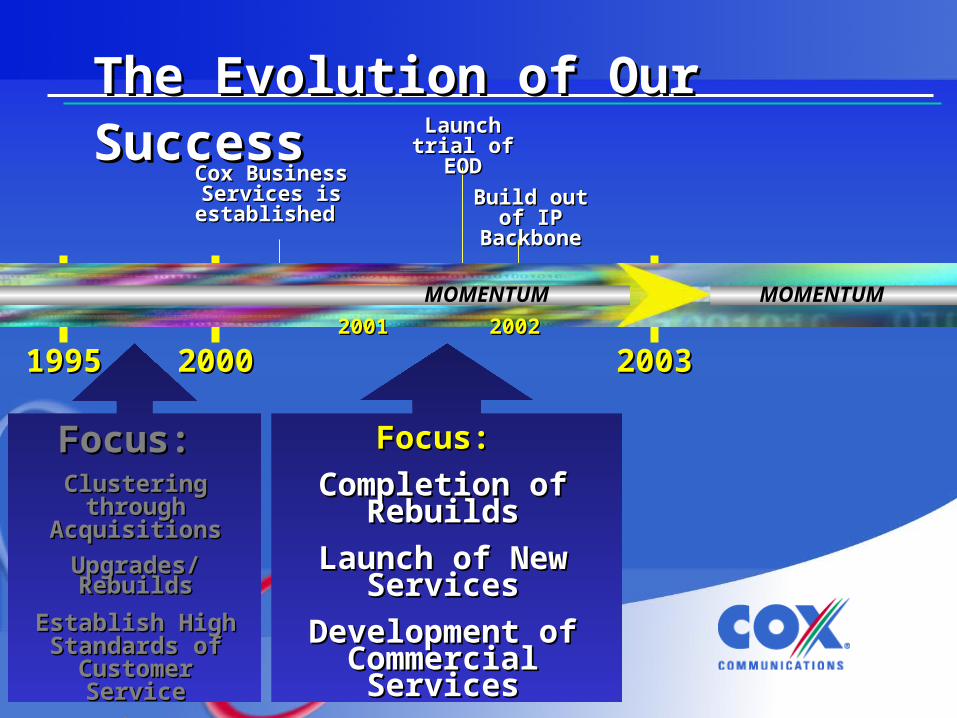
The Evolution of Our SuccessThe Evolution of Our Success
19951995 20002000 20032003
Focus: Focus:
Completion of Completion of RebuildsRebuilds
Launch of New Launch of New ServicesServices
Development of Development of Commercial Commercial
ServicesServices
Cox Business Cox Business Services is Services is established established
Launch trial Launch trial of EODof EOD
20012001
Focus: Focus: Clustering through Clustering through
AcquisitionsAcquisitions
Upgrades/RebuildsUpgrades/Rebuilds
Establish High Establish High Standards of Standards of
Customer ServiceCustomer Service
Introduce New Introduce New ServicesServices
20022002
Build out of IP Build out of IP BackboneBackbone
MOMENTUMMOMENTUM
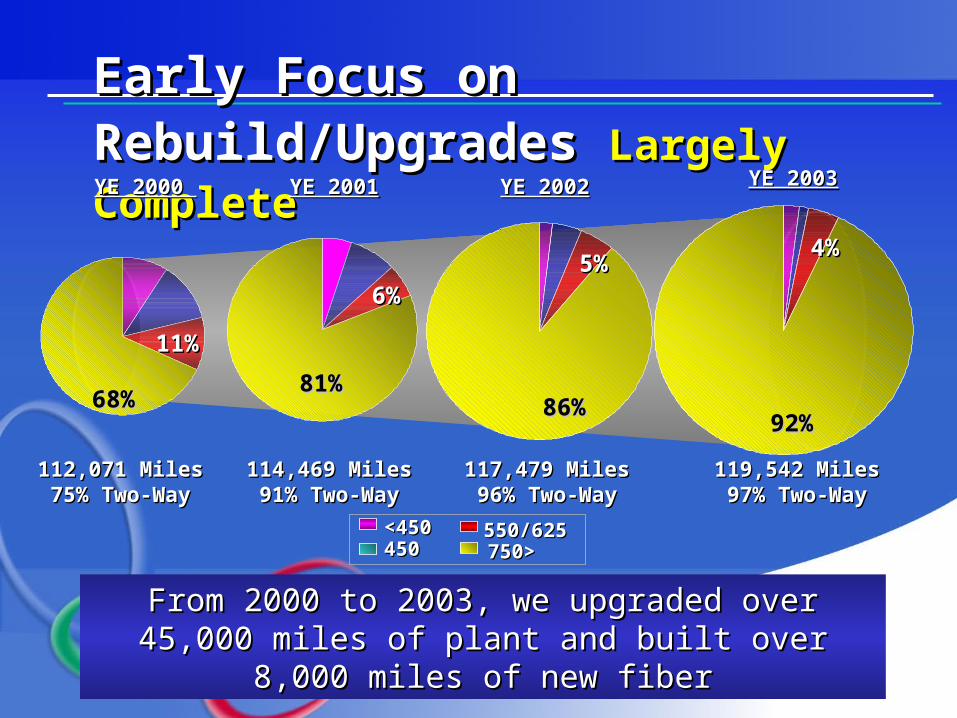
Early Focus on Rebuild/Upgrades Early Focus on Rebuild/Upgrades Largely CompleteLargely Complete
114,469 Miles114,469 Miles91% Two-Way91% Two-Way
YE 2000 YE 2000
112,071 Miles112,071 Miles75% Two-Way75% Two-Way
YE 2001YE 2001 YE 2002YE 2002
117,479 Miles117,479 Miles96% Two-Way96% Two-Way
YE 2003YE 2003
119,542 Miles119,542 Miles97% Two-Way97% Two-Way
<450<450450450
550/625550/625750>750>
68%68%
11%11%
81%81% 86%86%
92%92%
6%6%
4%4%5%5%
From 2000 to 2003, we upgraded over 45,000 miles of From 2000 to 2003, we upgraded over 45,000 miles of plant and built over 8,000 miles of new fiberplant and built over 8,000 miles of new fiber
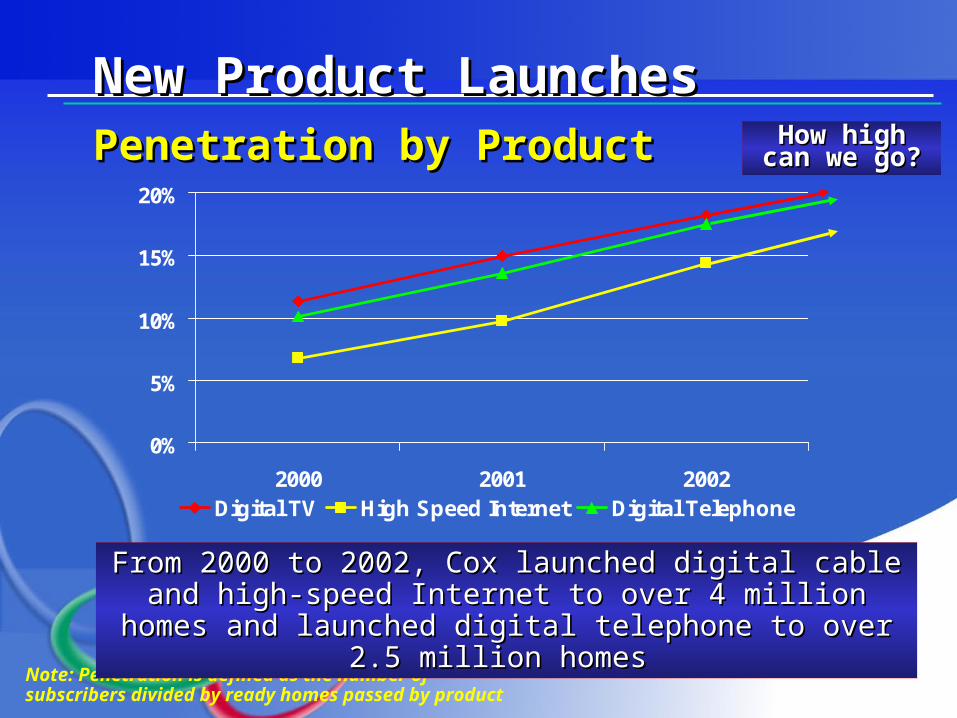
New Product LaunchesNew Product LaunchesPenetration by ProductPenetration by Product
0%
5%
10%
15%
20%
2000 2001 2002
Digital TV High Speed Internet Digital Telephone
Note: Penetration is defined as the number of subscribers divided by ready homes passed by product
From 2000 to 2002, Cox launched digital cable and high-From 2000 to 2002, Cox launched digital cable and high-speed Internet to over 4 million homes and launched digital speed Internet to over 4 million homes and launched digital
telephone to over 2.5 million homes telephone to over 2.5 million homes
How high can How high can we go?we go?

New Product DevelopmentNew Product DevelopmentCommercial ServicesCommercial Services• Launched Cox Business Services in 2000 and today Launched Cox Business Services in 2000 and today
CBS contributes 5% of total company revenuesCBS contributes 5% of total company revenues
• Significant opportunity with over 320,000 businesses Significant opportunity with over 320,000 businesses within 100 feet of our existing HFC networkwithin 100 feet of our existing HFC network
• We are leveraging the residential infrastructureWe are leveraging the residential infrastructure– Same NOCSame NOC– Same switchesSame switches– Same trucks, employees, etc. Same trucks, employees, etc.
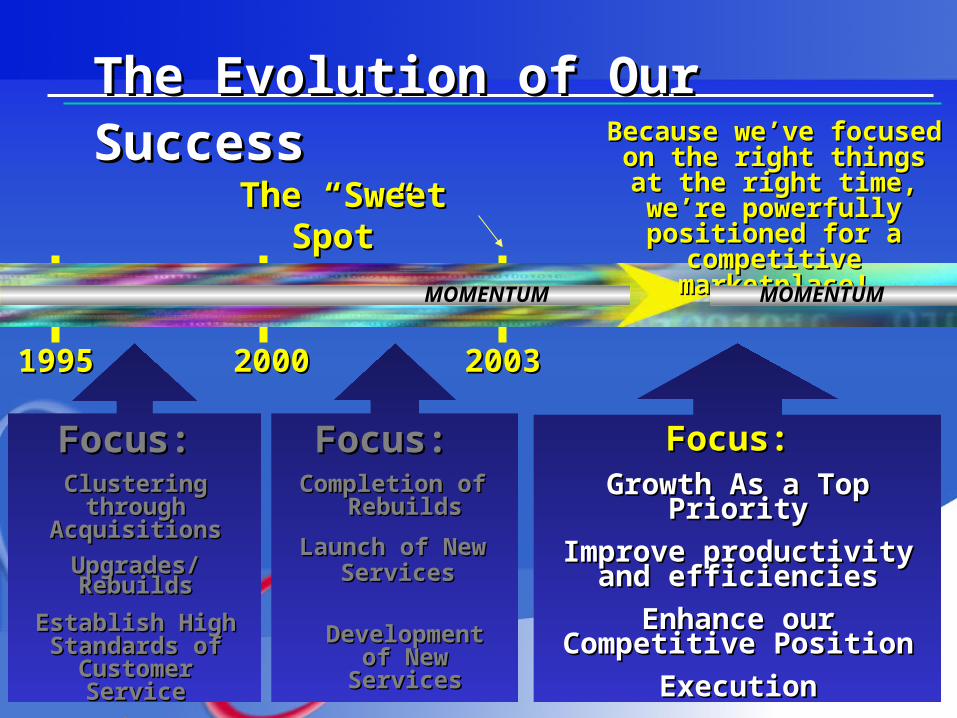
The Evolution of Our SuccessThe Evolution of Our Success
19951995 20002000 20032003
Focus: Focus: Completion of Completion of
RebuildsRebuilds
Launch of New Launch of New Services Services
Development of Development of New ServicesNew Services
Focus: Focus: Growth As a Top PriorityGrowth As a Top Priority
Improve productivity and Improve productivity and efficienciesefficiencies
Enhance our Competitive Enhance our Competitive PositionPosition
ExecutionExecution
Because we’ve focused on Because we’ve focused on the right things at the right the right things at the right
time, we’re powerfully time, we’re powerfully positioned for a positioned for a
competitive marketplace!competitive marketplace!
Focus: Focus: Clustering through Clustering through
AcquisitionsAcquisitions
Upgrades/RebuildsUpgrades/Rebuilds
Establish High Establish High Standards of Standards of
Customer ServiceCustomer Service
Introduce New Introduce New ServicesServices
The “Sweet Spot”The “Sweet Spot”
MOMENTUMMOMENTUM
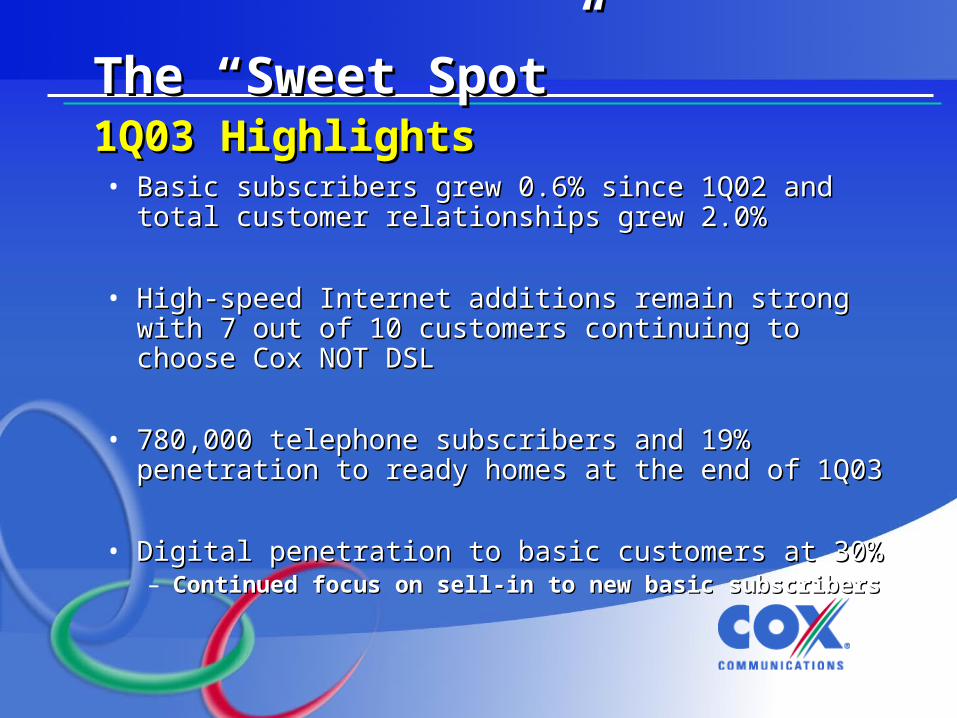
The “Sweet Spot”The “Sweet Spot”1Q03 Highlights1Q03 Highlights• Basic subscribers grew 0.6% since 1Q02 and total Basic subscribers grew 0.6% since 1Q02 and total
customer relationships grew 2.0%customer relationships grew 2.0%
• High-speed Internet additions remain strong with 7 High-speed Internet additions remain strong with 7 out of 10 customers continuing to choose Cox NOT out of 10 customers continuing to choose Cox NOT DSL DSL
• 780,000 telephone subscribers and 19% penetration 780,000 telephone subscribers and 19% penetration to ready homes at the end of 1Q03to ready homes at the end of 1Q03
• Digital penetration to basic customers at 30%Digital penetration to basic customers at 30%– Continued focus on sell-in to new basic subscribersContinued focus on sell-in to new basic subscribers
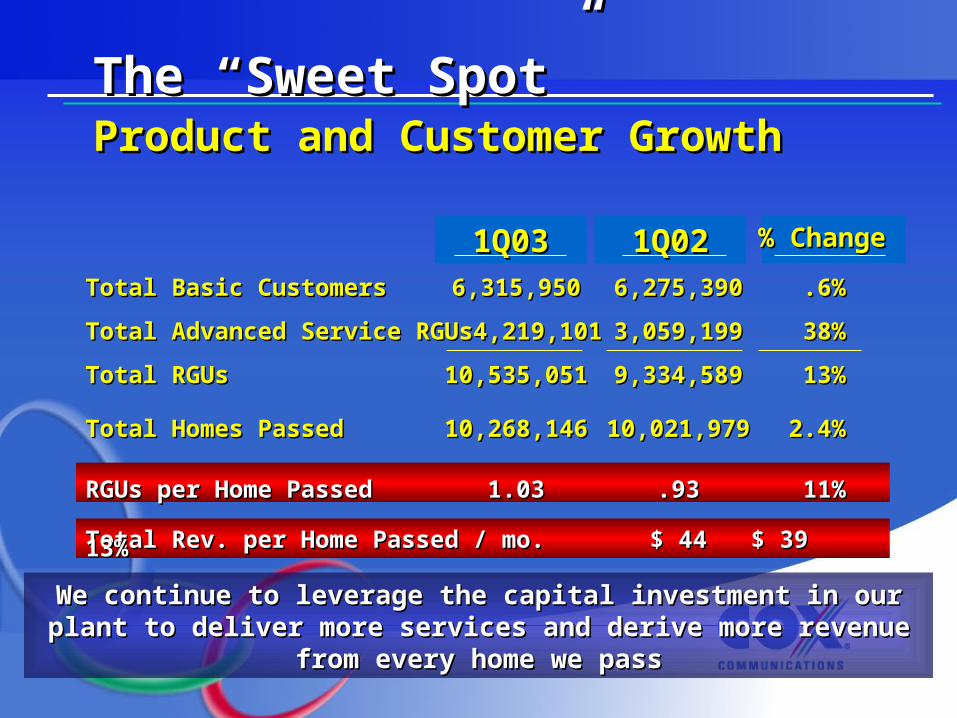
The “Sweet Spot”The “Sweet Spot”Product and Customer GrowthProduct and Customer Growth
We continue to leverage the capital investment in our plant to deliver We continue to leverage the capital investment in our plant to deliver more services and derive more revenue from every home we passmore services and derive more revenue from every home we pass
Total Basic CustomersTotal Basic Customers 6,315,9506,315,950 6,275,3906,275,390 .6%.6%
Total Advanced Service RGUsTotal Advanced Service RGUs 4,219,1014,219,101 3,059,1993,059,199 38%38%
Total RGUs Total RGUs 10,535,05110,535,051 9,334,5899,334,589 13%13%
Total Homes PassedTotal Homes Passed 10,268,14610,268,146 10,021,97910,021,979 2.4%2.4%
RGUs per Home PassedRGUs per Home Passed 1.031.03 .93.93 11%11%
Total Rev. per Home Passed / mo.Total Rev. per Home Passed / mo. $ 44$ 44 $ 39$ 39 13%13%
1Q031Q03 1Q021Q02 % Change% Change
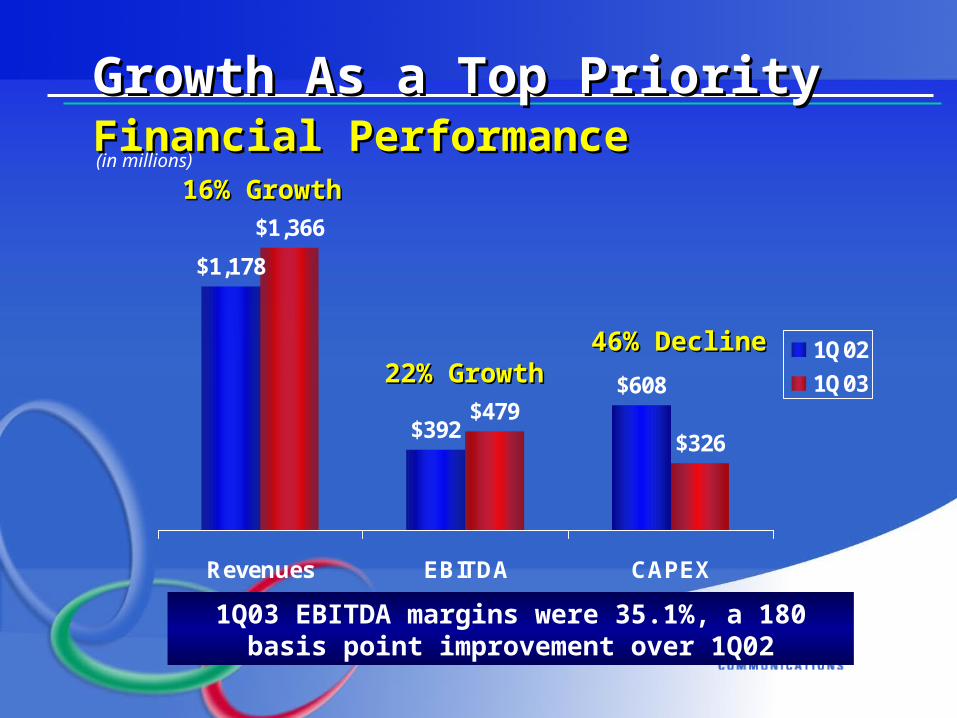
Growth As a Top PriorityGrowth As a Top PriorityFinancial PerformanceFinancial Performance
$1,178
$392
$608
$1,366
$479$326
Revenues EBITDA CAPEX
1Q02
1Q03
16% Growth16% Growth
22% Growth22% Growth
(in millions)
46% Decline46% Decline
1Q03 EBITDA margins were 35.1%, a 180 basis point improvement over 1Q02
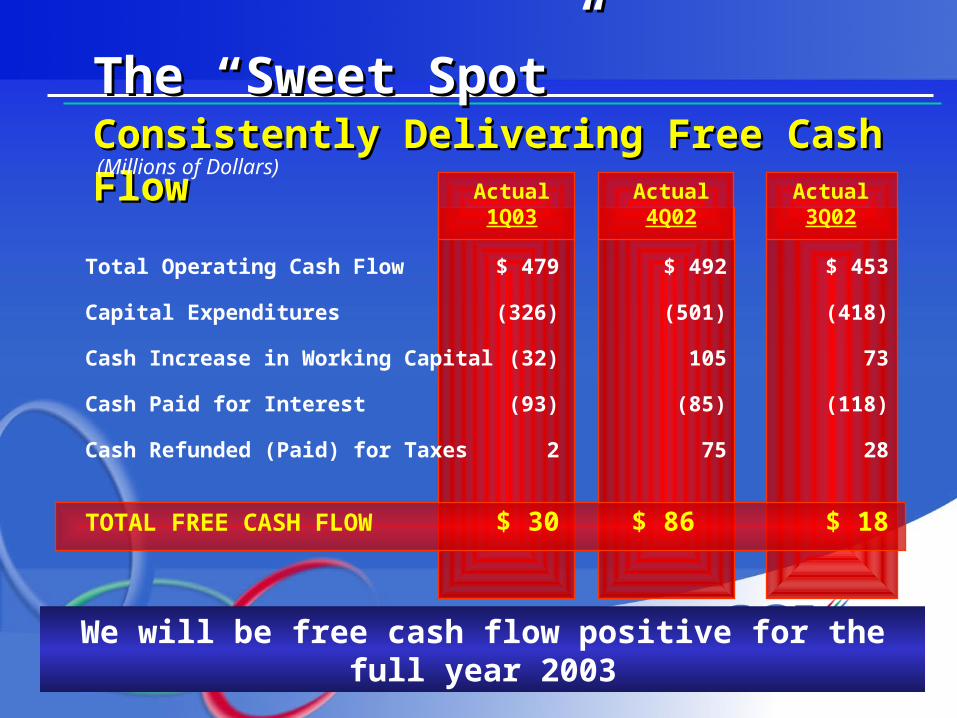
The “Sweet Spot”The “Sweet Spot”Consistently Delivering Free Cash FlowConsistently Delivering Free Cash Flow(Millions of Dollars)
We will be free cash flow positive for the full year 2003
Actual1Q03
Actual3Q02
Actual4Q02
Total Operating Cash Flow $ 479 $ 492 $ 453
Capital Expenditures (326) (501) (418)
Cash Increase in Working Capital (32) 105 73
Cash Paid for Interest (93) (85) (118)
Cash Refunded (Paid) for Taxes 2 75 28
TOTAL FREE CASH FLOW $ 30 $ 86 $ 18
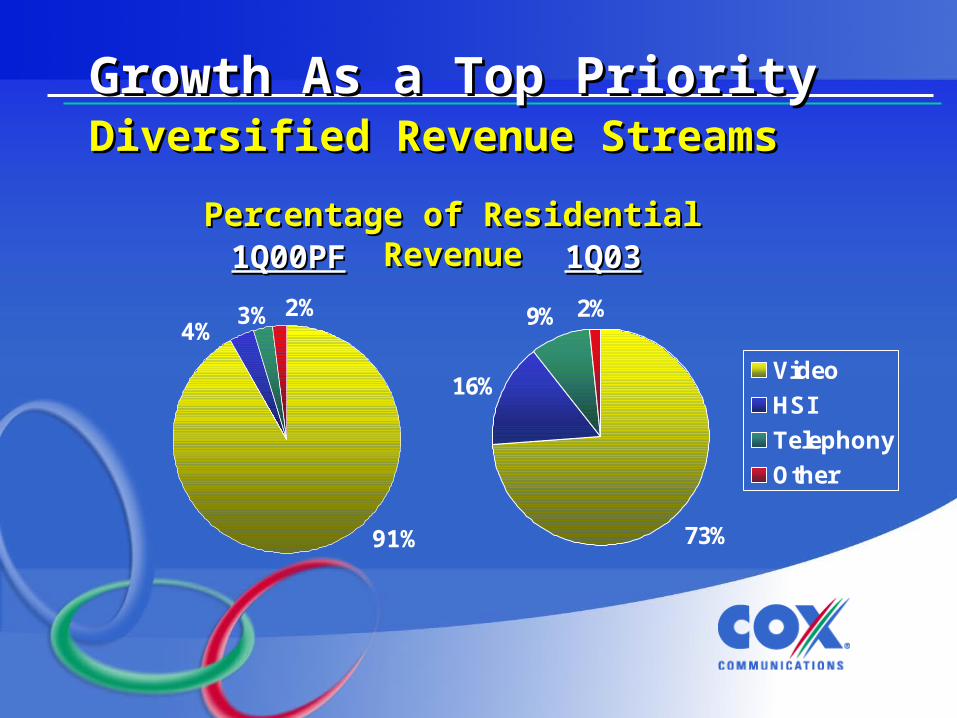
Growth As a Top PriorityGrowth As a Top PriorityDiversified Revenue StreamsDiversified Revenue Streams
73%
16%
9% 2%
Video
HSI
Telephony
Other
1Q00PF1Q00PF 1Q031Q03Percentage of Residential RevenuePercentage of Residential Revenue
91%
4%3% 2%
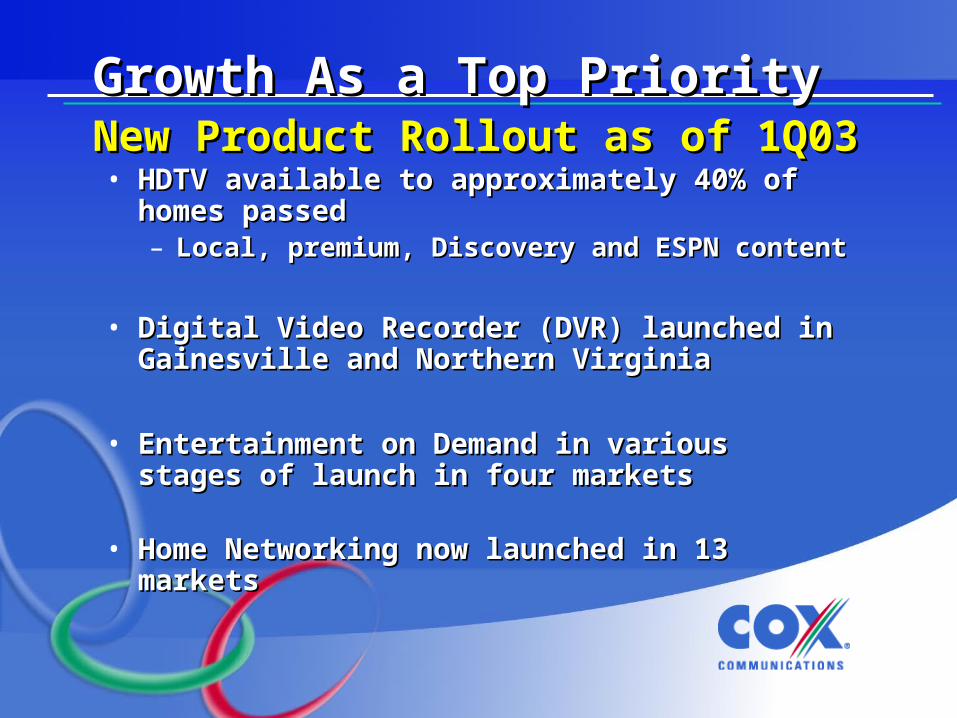
Growth As a Top PriorityGrowth As a Top PriorityNew Product Rollout as of 1Q03New Product Rollout as of 1Q03• HDTV available to approximately 40% of HDTV available to approximately 40% of
homes passedhomes passed– Local, premium, Discovery and ESPN contentLocal, premium, Discovery and ESPN content
• Digital Video Recorder (DVR) launched in Digital Video Recorder (DVR) launched in Gainesville and Northern Virginia Gainesville and Northern Virginia
• Entertainment on Demand in various stages of Entertainment on Demand in various stages of launch in four marketslaunch in four markets
• Home Networking now launched in 13 marketsHome Networking now launched in 13 markets
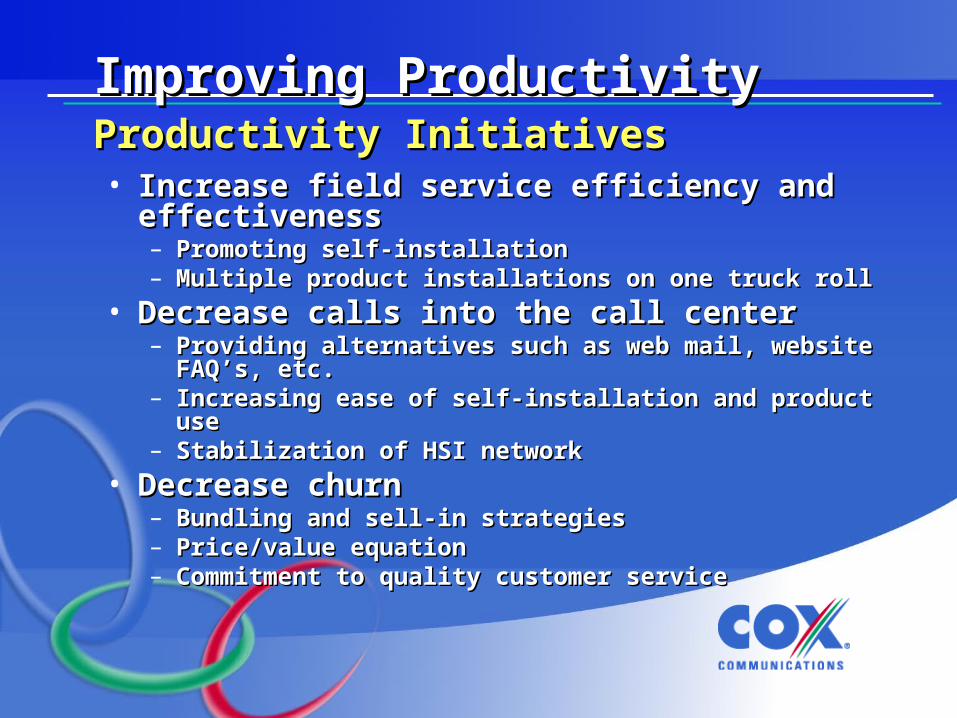
Improving ProductivityImproving ProductivityProductivity InitiativesProductivity Initiatives• Increase field service efficiency and Increase field service efficiency and
effectivenesseffectiveness– Promoting self-installation Promoting self-installation – Multiple product installations on one truck roll Multiple product installations on one truck roll
• Decrease calls into the call centerDecrease calls into the call center– Providing alternatives such as web mail, website FAQ’s, Providing alternatives such as web mail, website FAQ’s,
etc.etc.– Increasing ease of self-installation and product useIncreasing ease of self-installation and product use– Stabilization of HSI networkStabilization of HSI network
• Decrease churnDecrease churn– Bundling and sell-in strategiesBundling and sell-in strategies– Price/value equationPrice/value equation– Commitment to quality customer service Commitment to quality customer service
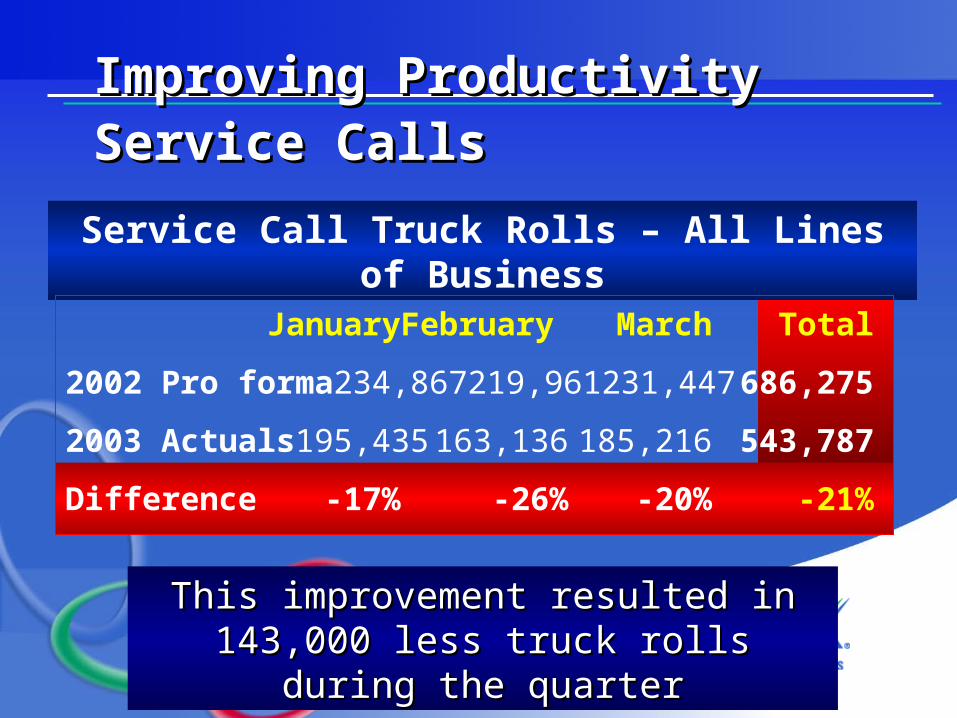
Improving ProductivityImproving ProductivityService CallsService Calls
January February March Total
2002 Pro forma 234,867 219,961 231,447 686,275
2003 Actuals 195,435 163,136 185,216 543,787
Difference -17% -26% -20% -21%
Service Call Truck Rolls – All Lines of Business
This improvement resulted in 143,000 This improvement resulted in 143,000 less truck rolls during the quarterless truck rolls during the quarter
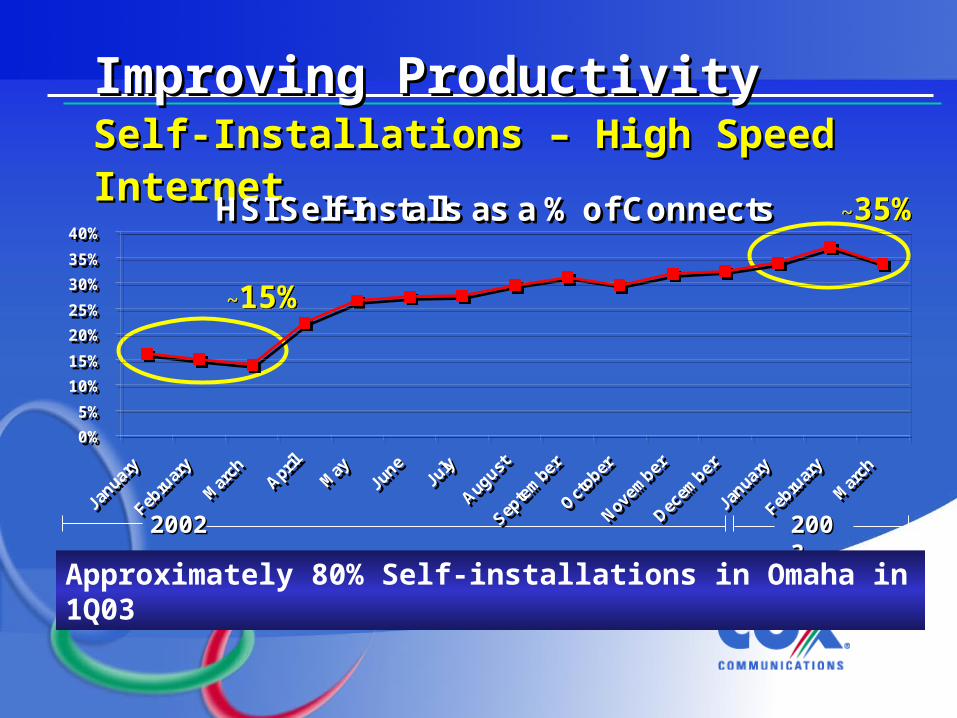
Improving ProductivityImproving ProductivitySelf-Installations – High Speed InternetSelf-Installations – High Speed Internet
~15%~15%
~35%~35%
20022002 20032003
Approximately 80% Self-installations in Omaha in 1Q03
HSI Self-Installs as a % of Connects
0%
5%
10%
15%
20%
25%
30%
35%
40%
HSI Self-Installs as a % of Connects
0%
5%
10%
15%
20%
25%
30%
35%
40%
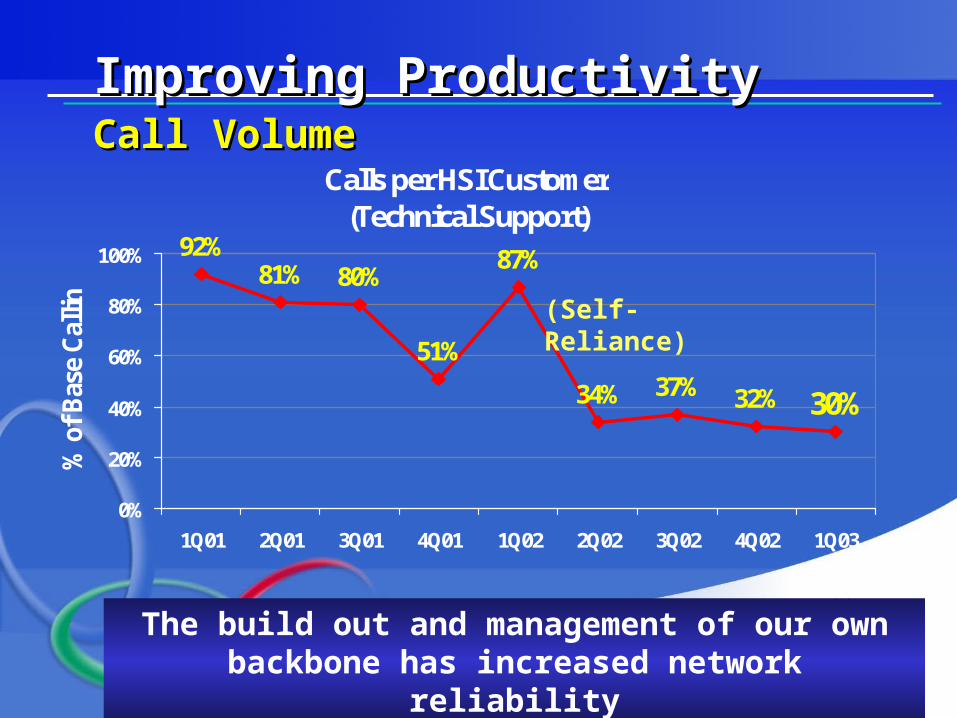
Improving ProductivityImproving ProductivityCall VolumeCall Volume
Calls per HSI Customer(Technical Support)
92%81% 80%
51%
87%
34% 37% 32% 30%
0%
20%
40%
60%
80%
100%
1Q01 2Q01 3Q01 4Q01 1Q02 2Q02 3Q02 4Q02 1Q03
% o
f B
ase
Cal
ling
(Self-Reliance)
The build out and management of our own backbone has increased network reliability
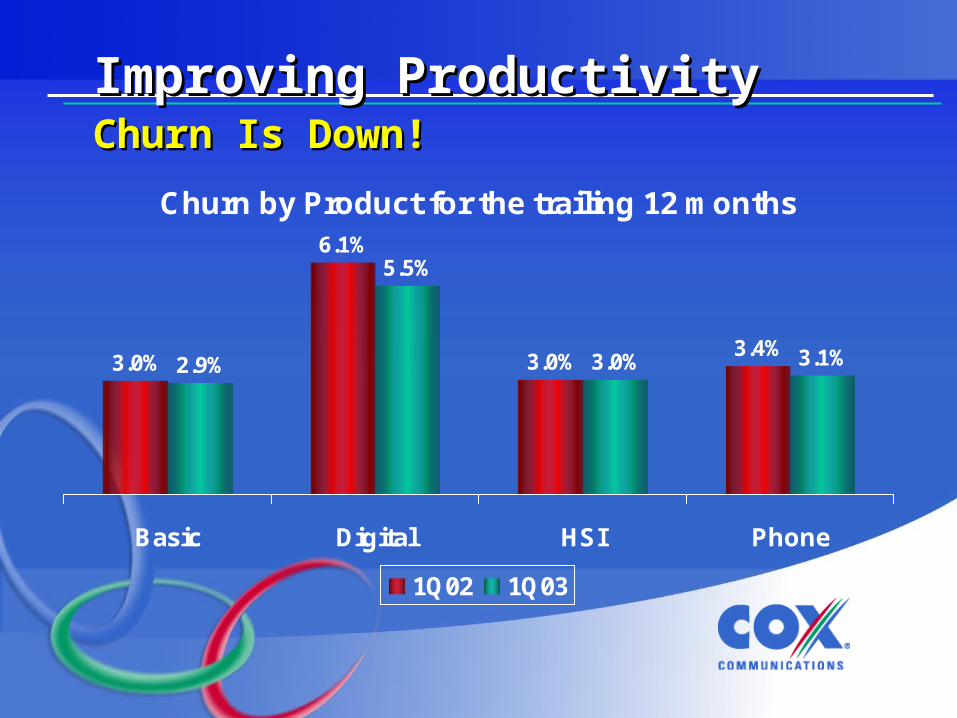
Improving ProductivityImproving ProductivityChurn Is Down!Churn Is Down!
Churn by Product for the trailing 12 months
3.0%
6.1%
3.0%3.4%
2.9%
5.5%
3.0% 3.1%
Basic Digital HSI Phone
1Q02 1Q03
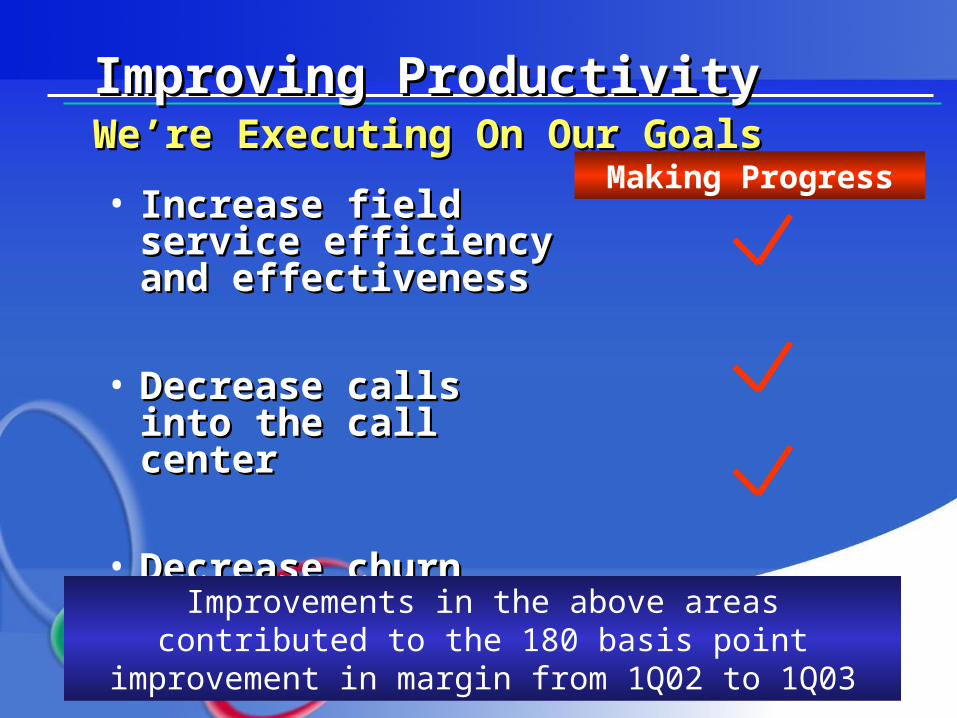
Improving ProductivityImproving ProductivityWe’re Executing On Our GoalsWe’re Executing On Our Goals
• Increase field service Increase field service efficiency and efficiency and effectivenesseffectiveness
• Decrease calls into Decrease calls into the call centerthe call center
• Decrease churnDecrease churn
Making Progress
Improvements in the above areas contributed to the 180 basis point improvement in margin from 1Q02 to 1Q03
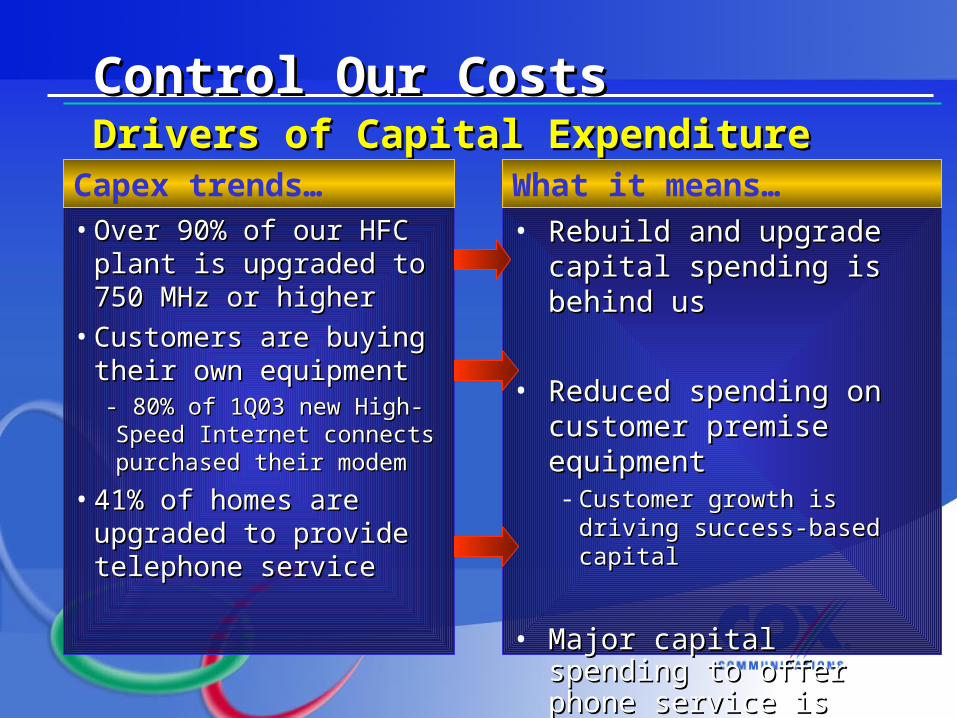
Control Our CostsControl Our CostsDrivers of Capital Expenditure ReductionDrivers of Capital Expenditure Reduction
• Over 90% of our HFC Over 90% of our HFC plant is upgraded to 750 plant is upgraded to 750 MHz or higher MHz or higher
• Customers are buying Customers are buying their own equipment their own equipment - 80% of 1Q03 new High-- 80% of 1Q03 new High-Speed Internet connects Speed Internet connects purchased their modempurchased their modem
• 41% of homes are 41% of homes are upgraded to provide upgraded to provide telephone service telephone service
• Rebuild and upgrade capital Rebuild and upgrade capital spending is behind usspending is behind us
• Reduced spending on Reduced spending on customer premise equipmentcustomer premise equipment- Customer growth is driving Customer growth is driving
success-based capitalsuccess-based capital
• Major capital spending to Major capital spending to offer phone service is behind offer phone service is behind usus
Capex trends… What it means…
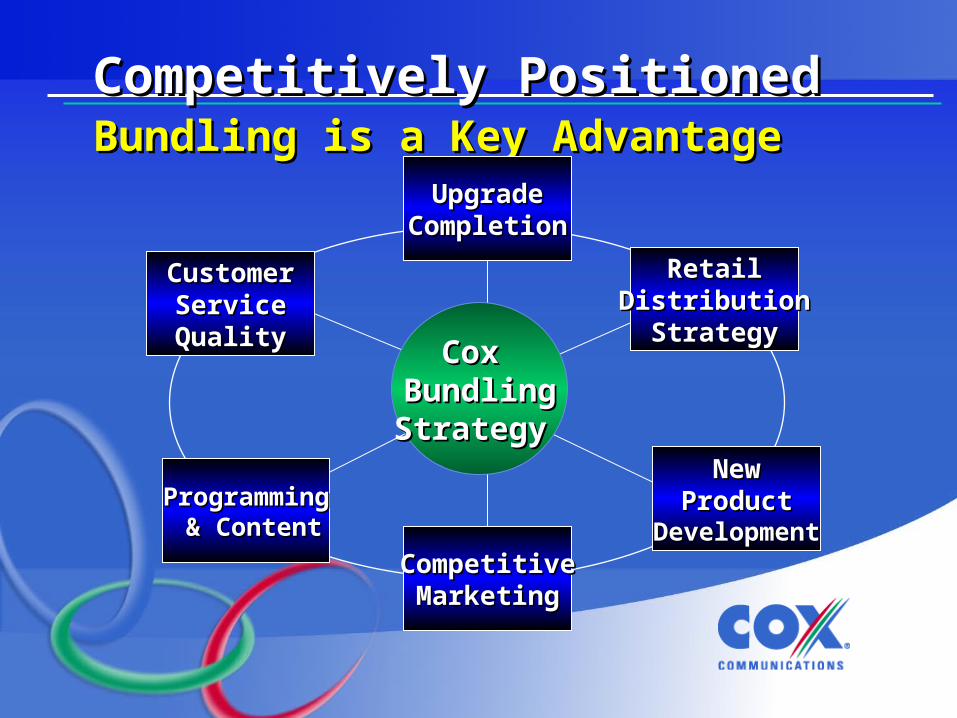
Competitively PositionedCompetitively PositionedBundling is a Key AdvantageBundling is a Key Advantage
Cox Cox BundlingBundlingStrategy Strategy
NewNewProductProduct
DevelopmentDevelopmentCompetitiveCompetitiveMarketingMarketing
RetailRetailDistributionDistribution
StrategyStrategy
CustomerCustomerServiceServiceQualityQuality
UpgradeUpgradeCompletionCompletion
ProgrammingProgramming & Content& Content
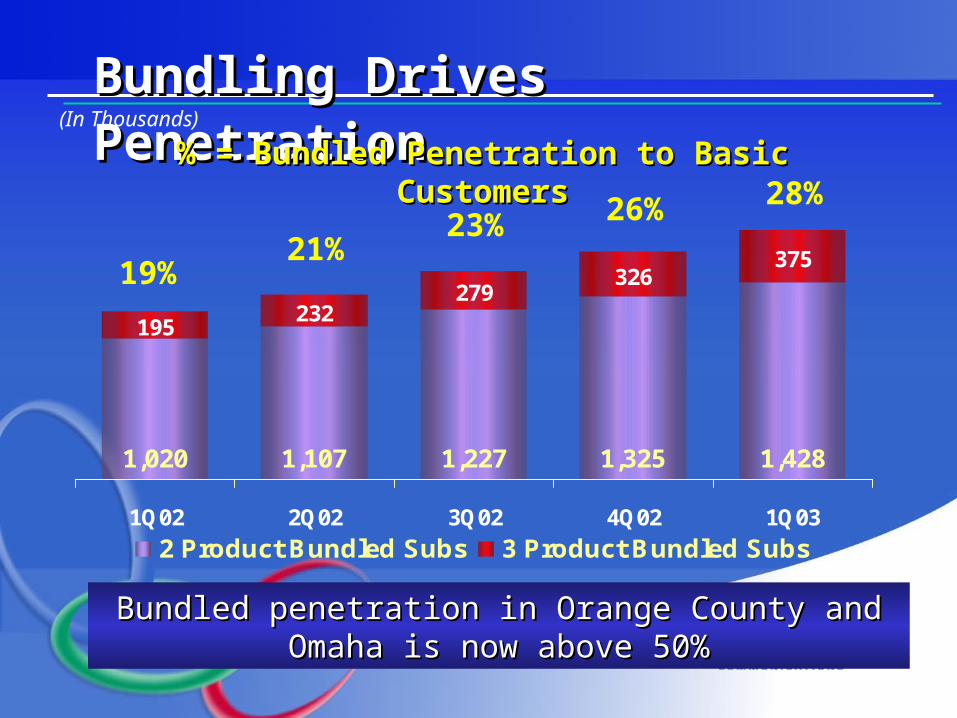
Bundling Drives PenetrationBundling Drives Penetration(In Thousands)
1,020 1,107 1,227 1,325 1,428
195232
279326
375
1Q02 2Q02 3Q02 4Q02 1Q03
2 Product Bundled Subs 3 Product Bundled Subs
% = Bundled Penetration to Basic Customers% = Bundled Penetration to Basic Customers
19%21%
23% 26% 28%
Bundled penetration in Orange County and Omaha is Bundled penetration in Orange County and Omaha is now above 50%now above 50%
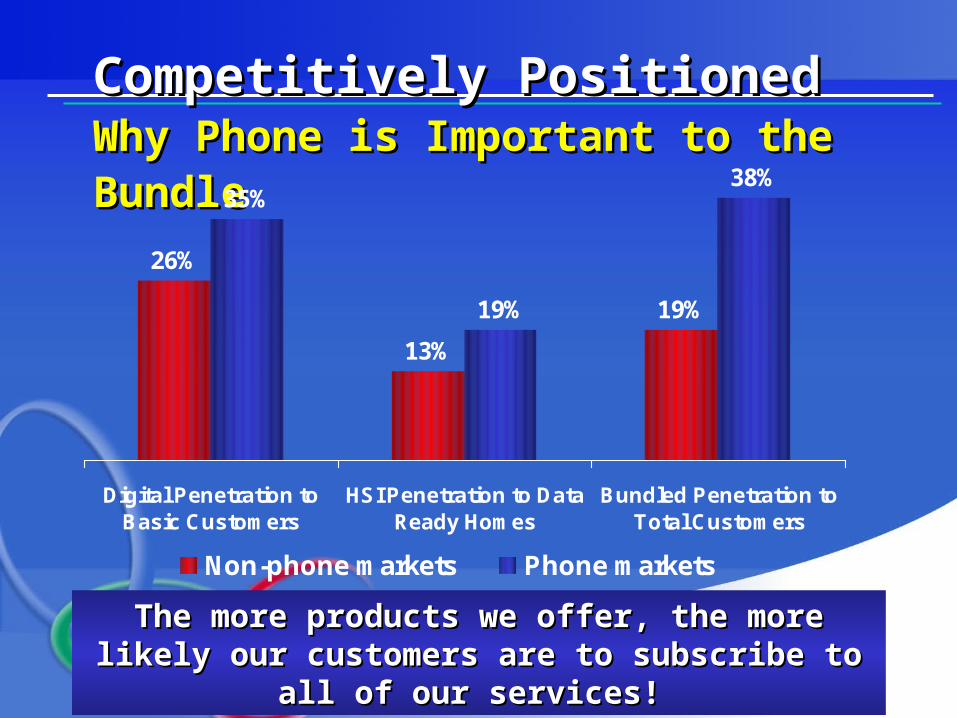
Competitively PositionedCompetitively PositionedWhy Phone is Important to the BundleWhy Phone is Important to the Bundle
26%
13%
19%
35%
19%
38%
Digital Penetration toBasic Customers
HSI Penetration to DataReady Homes
Bundled Penetration toTotal Customers
Non-phone markets Phone markets
The more products we offer, the more likely our The more products we offer, the more likely our customers are to subscribe to all of our services!customers are to subscribe to all of our services!
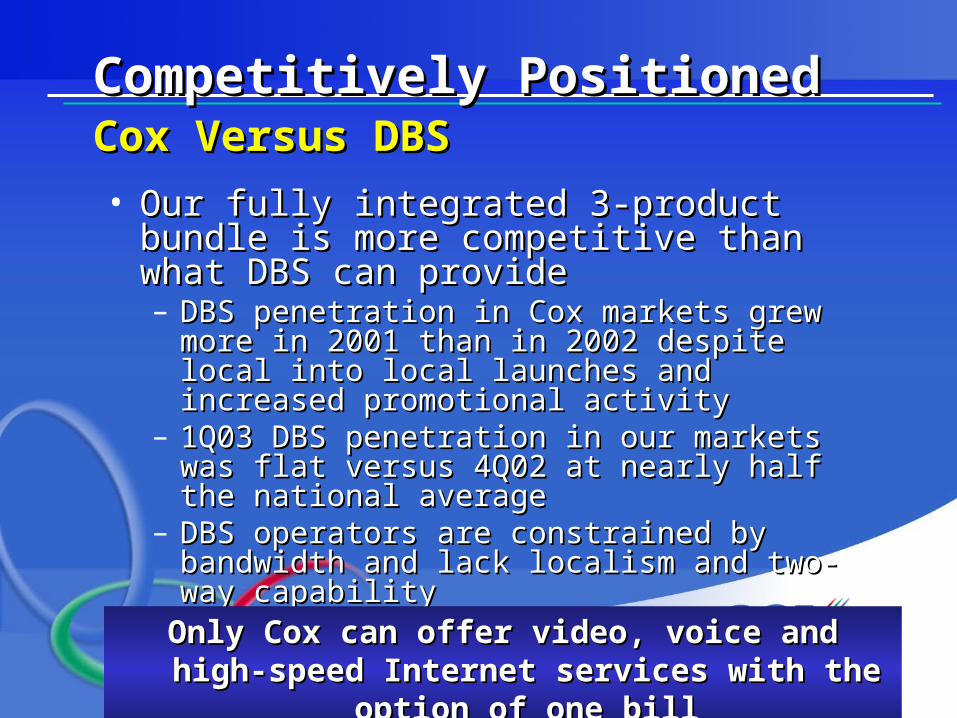
Competitively PositionedCompetitively PositionedCox Versus DBSCox Versus DBS
• Our fully integrated 3-product bundle is Our fully integrated 3-product bundle is more competitive than what DBS can more competitive than what DBS can provideprovide– DBS penetration in Cox markets grew more in DBS penetration in Cox markets grew more in
2001 than in 2002 despite local into local 2001 than in 2002 despite local into local launches and increased promotional activitylaunches and increased promotional activity
– 1Q03 DBS penetration in our markets was flat 1Q03 DBS penetration in our markets was flat versus 4Q02 at nearly half the national versus 4Q02 at nearly half the national averageaverage
– DBS operators are constrained by bandwidth DBS operators are constrained by bandwidth and lack localism and two-way capabilityand lack localism and two-way capability
Only Cox can offer video, voice and high-speed Only Cox can offer video, voice and high-speed Internet services with the option of one billInternet services with the option of one bill
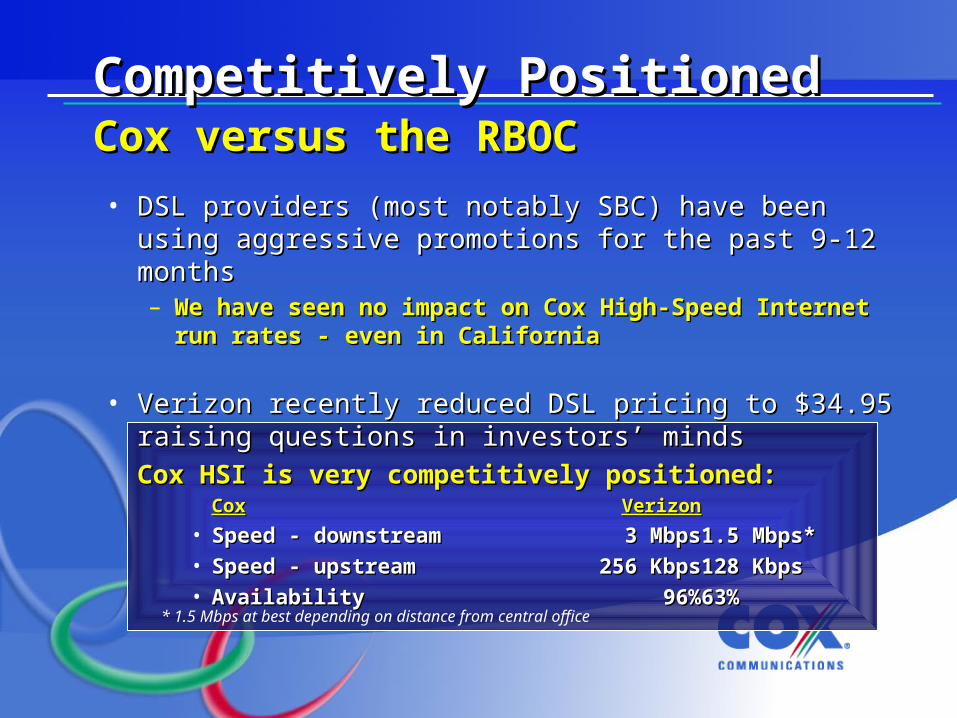
Competitively PositionedCompetitively PositionedCox versus the RBOC Cox versus the RBOC
• DSL providers (most notably SBC) have been using DSL providers (most notably SBC) have been using aggressive promotions for the past 9-12 months aggressive promotions for the past 9-12 months – We have seen no impact on Cox High-Speed Internet run rates - We have seen no impact on Cox High-Speed Internet run rates -
even in Californiaeven in California
• Verizon recently reduced DSL pricing to $34.95 raising Verizon recently reduced DSL pricing to $34.95 raising questions in investors’ minds questions in investors’ minds
Cox HSI is very competitively positioned:Cox HSI is very competitively positioned:CoxCox VerizonVerizon
• Speed - downstreamSpeed - downstream 3 Mbps3 Mbps 1.5 Mbps*1.5 Mbps*• Speed - upstreamSpeed - upstream 256 Kbps256 Kbps 128 Kbps128 Kbps• AvailabilityAvailability 96%96% 63%63%
* 1.5 Mbps at best depending on distance from central office
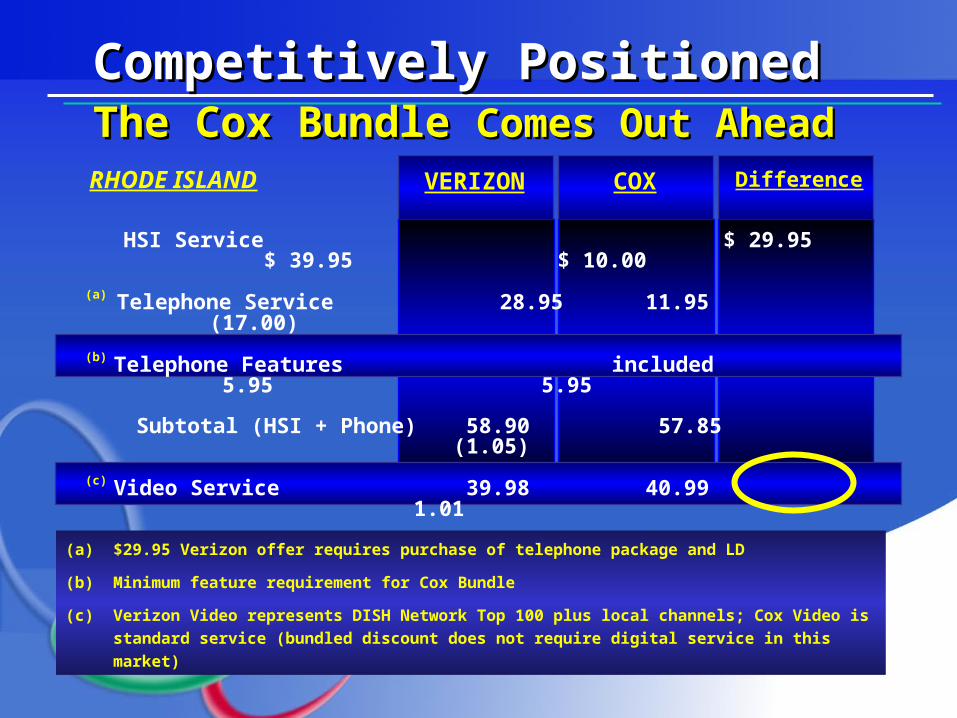
Competitively PositionedCompetitively PositionedThe Cox Bundle The Cox Bundle Comes Out AheadComes Out Ahead
Difference
HSI Service $ 29.95 $ 39.95 $ 10.00
(a) Telephone Service 28.95 11.95 (17.00)
(b) Telephone Features included 5.95 5.95
Subtotal (HSI + Phone) 58.90 57.85(1.05)
(c) Video Service 39.98 40.99 1.01
Bundle Value/Discount (10.00) (10.00)
Total $ 98.88 $ 88.84 $ (10.04)
COXVERIZON
(a) $29.95 Verizon offer requires purchase of telephone package and LD
(b) Minimum feature requirement for Cox Bundle
(c) Verizon Video represents DISH Network Top 100 plus local channels; Cox Video is standard service
(bundled discount does not require digital service in this market)
RHODE ISLAND
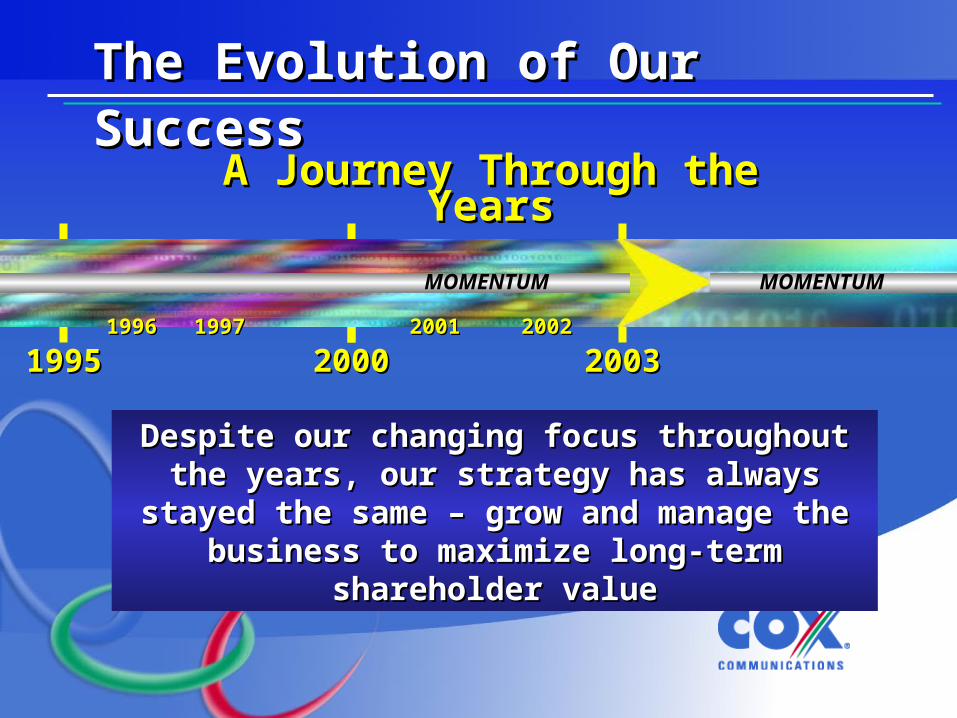
The Evolution of Our SuccessThe Evolution of Our Success
Despite our changing focus throughout the Despite our changing focus throughout the years, our strategy has always stayed the same – years, our strategy has always stayed the same –
grow and manage the business to maximize grow and manage the business to maximize long-term shareholder valuelong-term shareholder value
A Journey Through the YearsA Journey Through the Years
19951995 200020001997199719961996 20012001 20022002
20032003
MOMENTUMMOMENTUM
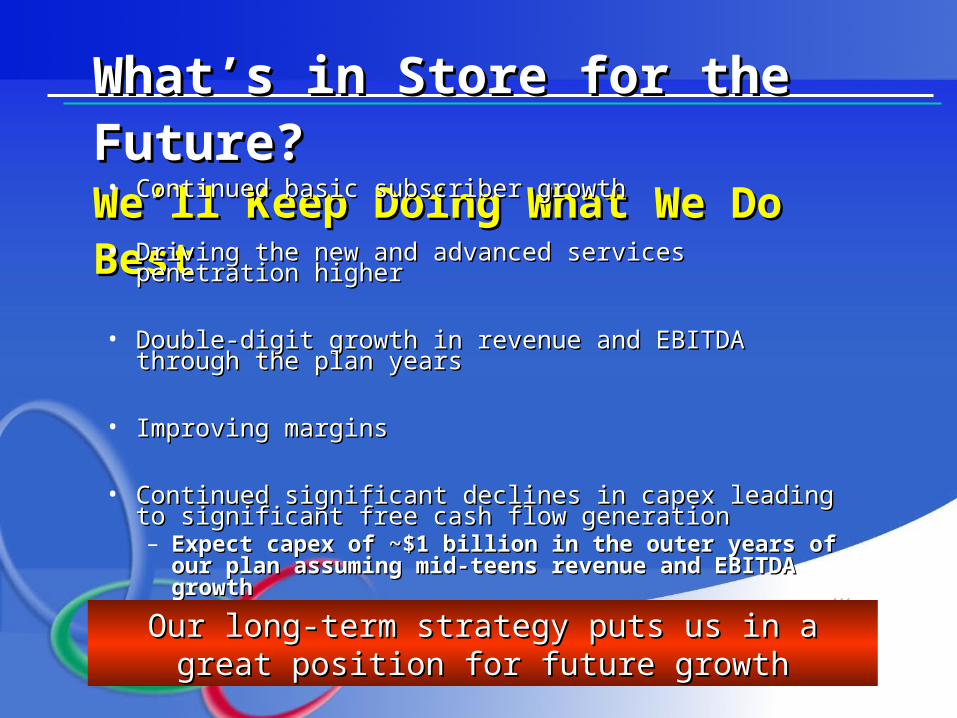
What’s in Store for the Future?What’s in Store for the Future?We’ll Keep Doing What We Do BestWe’ll Keep Doing What We Do Best• Continued basic subscriber growth Continued basic subscriber growth
• Driving the new and advanced services penetration Driving the new and advanced services penetration higherhigher
• Double-digit growth in revenue and EBITDA through the Double-digit growth in revenue and EBITDA through the plan yearsplan years
• Improving marginsImproving margins
• Continued significant declines in capex leading to Continued significant declines in capex leading to significant free cash flow generationsignificant free cash flow generation– Expect capex of ~$1 billion in the outer years of our Expect capex of ~$1 billion in the outer years of our
plan assuming mid-teens revenue and EBITDA growthplan assuming mid-teens revenue and EBITDA growth
Our long-term strategy puts us in a great position for Our long-term strategy puts us in a great position for future growthfuture growth
Sanford Bernstein 19Sanford Bernstein 19thth Annual Annual Strategic Decisions ConferenceStrategic Decisions Conference
June 2003June 2003
Jim Robbins – President and CEOJim Robbins – President and CEO
The Evolution of Our Success The Evolution of Our Success


![20979600 Cadbury Presentation by Todd Spitzer CEO at Sanford Bernstein Strategic Decisions Conference September 16 2009[1]](https://img.pdfslide.us/doc/110x75/577d22821a28ab4e1e978ee0/20979600-cadbury-presentation-by-todd-spitzer-ceo-at-sanford-bernstein-strategic.jpg)