Embed Size (px)
DESCRIPTION
Maps of distribution of ethnic groups in Sandwell from 2001 Census
Citation preview
2001 Census: Sandwell Atlas of Urban Conditions2001 Census: Sandwell Atlas of Urban Conditions2001 Census: Sandwell Atlas of Urban Conditions Page Page Page 131313
EthnicityEthnicity
Ethnic Diversity Number of ethnic groups exceeding 1% of the population
Ethnicity Ethnicity
The question asked in the 2001 Census about residents’ ethnicity included the same categories as the equivalent question ten years earlier. However, it also gave residents new, additional options to describe their ethnicity.
In particular, it differentiated between three different White groups and identified four separate categories of mixed ethnicity.
Using the more detailed set of responses to this new question we can see that White residents categorised themselves as British (98% of all White residents in Sandwell), Irish (1%) and ‘White Other’ (a further 1%). This was also the first time in an English Census that Irish residents were able to identify themselves as an ethnic group.
In 2001, one in every fifty residents of Sandwell (2%) described themselves as having mixed ethnicity. While the 1991 census results do not identify a separate category of mixed ethnicity, it is possible that those residents who considered themselves in these terms used the categories of ‘Black Other’ or ‘Other’, which
Ethnic Groups
9 or more7 to 95 to 73 to 5Fewer than 3
© Crown © Crown © Crown copyright.copyright.copyright. All rights All rights All rights reserved. reserved. reserved.
Sandwell MBC Sandwell MBC Sandwell MBC Licence No. Licence No. Licence No.
LA 100032119 LA 100032119 LA 100032119 (2004)(2004)(2004)
© Crown © Crown © Crown copyright.copyright.copyright. All rights All rights All rights reserved. reserved. reserved.
Sandwell MBC Sandwell MBC Sandwell MBC Licence No. Licence No. Licence No.
LA 100032119 LA 100032119 LA 100032119 (2004)(2004)(2004)
together totalled more than 3,000 residents in 1991. Although the 2001 census revealed nearly six thousand Sandwell residents of mixed ethnicity, the differences in categorisation between 1991 and 2001 prevent us knowing what change there might have been in the size of this group.
Ethnic Diversity The 2001 Census not only allows us to see the distribution of individual ethnic groups, but also to consider the ethnic diversity of the local population. If we define diversity as the number of ethnic groups which make up more than 1% of the residents of any given area, we can map the diversity of the various parts of the Borough.
By this measure, Soho & Victoria ward was ranked 8th most diverse out of the 162 wards in the county, while Cradley Heath & Old Hill was one of the least diverse.
Geographic Concentration We can also consider how much individual ethnic minority groups were concentrated
For Sandwell ward and
neighbourhood names, see
pages 2 and 3

2001 Census: Sandwell Atlas of Urban Conditions2001 Census: Sandwell Atlas of Urban Conditions2001 Census: Sandwell Atlas of Urban Conditions Page Page Page 141414
Ethnicity Ethnicity
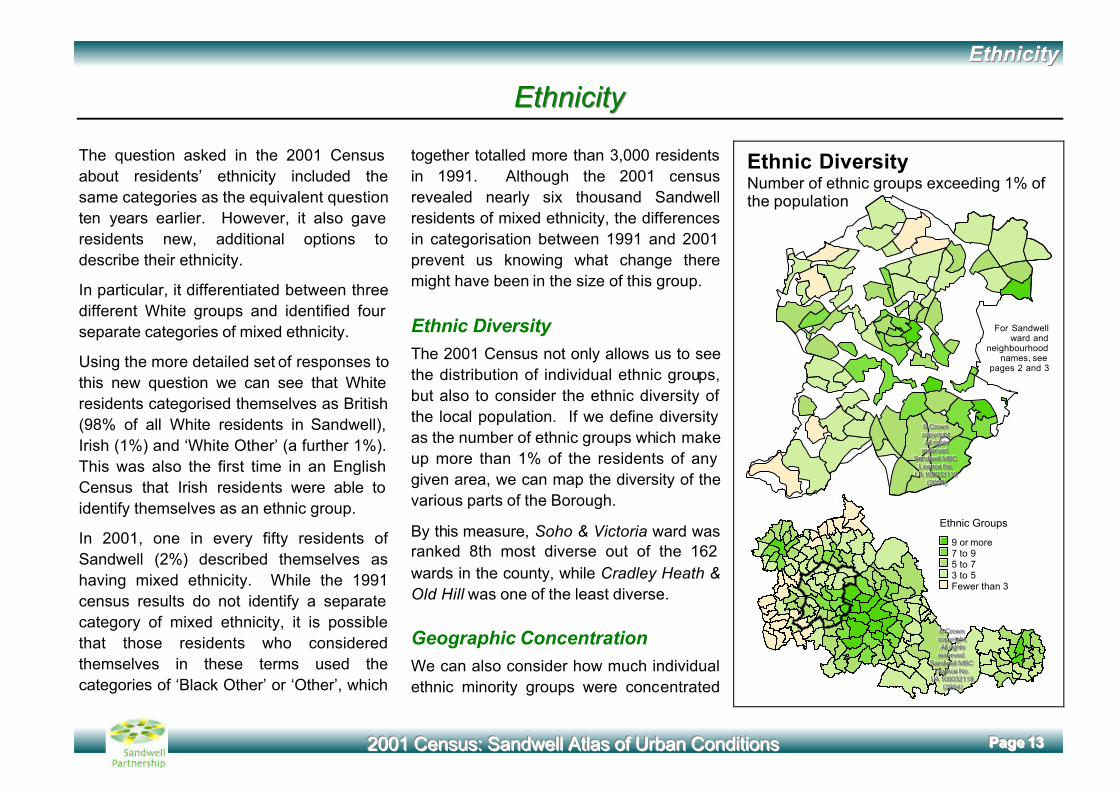
% White British
90 or more75 to 9060 to 7535 to 6035 or less
© Crown © Crown © Crown copyright.copyright.copyright. All rights All rights All rights reserved. reserved. reserved.
Sandwell MBC Sandwell MBC Sandwell MBC Licence No. Licence No. Licence No.
LA 100032119 LA 100032119 LA 100032119 (2004)(2004)(2004)
© Crown © Crown © Crown copyright.copyright.copyright. All rights All rights All rights reserved. reserved. reserved.
Sandwell MBC Sandwell MBC Sandwell MBC Licence No. Licence No. Licence No.
LA 100032119 LA 100032119 LA 100032119 (2004)(2004)(2004)
or dispersed across the Borough. Bangladeshi residents were the least dispersed. As many as 80% were living in just five of Sandwell’s 24 wards. Conversely, the Black Caribbean ethnic group was the most dispersed outside of the White population. The total Black Caribbean population of 13 wards would have needed to have been added together before 80% of the this community could have been accounted for.
Ethnic Groups in Sandwell
The White Population
There are 220,542 residents of Sandwell who identify themselves as White British, 78% of the total. In most Sandwell Neighbourhoods White British are the majority, with only 10 (all in Smethwick and West Bromwich) where this is not the case.
About 2,600 Sandwell residents define their ethnicity as Irish (the only other White ethnic group identified), which is just less than 1% of the total. This compares to the 2,386 residents who were born in either Northern Ireland or the Irish Republic.
% White Irish
4 or more3 to 42 to 31 to 21 or less
Residents Who Identify Themselves as White Irish
© Crown © Crown © Crown copyright.copyright.copyright. All rights All rights All rights reserved. reserved. reserved.
Sandwell MBC Sandwell MBC Sandwell MBC Licence No. Licence No. Licence No.
LA 100032119 LA 100032119 LA 100032119 (2004)(2004)(2004)
© Crown © Crown © Crown copyright.copyright.copyright. All rights All rights All rights reserved. reserved. reserved.
Sandwell MBC Sandwell MBC Sandwell MBC Licence No. Licence No. Licence No.
LA 100032119 LA 100032119 LA 100032119 (2004)(2004)(2004)
Residents Who Identify Themselves as White British
For Sandwell ward and neighbourhood names,
see pages 2 and 3

2001 Census: Sandwell Atlas of Urban Conditions2001 Census: Sandwell Atlas of Urban Conditions2001 Census: Sandwell Atlas of Urban Conditions Page Page Page 151515
EthnicityEthnicity
% Indian
13 or more8 to 135 to 84 to 54 or less
© Crown © Crown © Crown copyright.copyright.copyright. All rights All rights All rights reserved. reserved. reserved.
Sandwell MBC Sandwell MBC Sandwell MBC Licence No. Licence No. Licence No.
LA 100032119 LA 100032119 LA 100032119 (2004)(2004)(2004)
© Crown © Crown © Crown copyright.copyright.copyright. All rights All rights All rights reserved. reserved. reserved.
Sandwell MBC Sandwell MBC Sandwell MBC Licence No. Licence No. Licence No.
LA 100032119 LA 100032119 LA 100032119 (2004)(2004)(2004)
% Pakistani
6 or more4 to 62 to 41 to 21 or less
Residents Who Identify Themselves as Pakistani
© Crown © Crown © Crown copyright.copyright.copyright. All rights All rights All rights reserved. reserved. reserved.
Sandwell MBC Sandwell MBC Sandwell MBC Licence No. Licence No. Licence No.
LA 100032119 LA 100032119 LA 100032119 (2004)(2004)(2004)
© Crown © Crown © Crown copyright.copyright.copyright. All rights All rights All rights reserved. reserved. reserved.
Sandwell MBC Sandwell MBC Sandwell MBC Licence No. Licence No. Licence No.
LA 100032119 LA 100032119 LA 100032119 (2004)(2004)(2004)
Residents Who Identify Themselves as Indian
% Bangladeshi
4 or more3 to 42 to 31 to 21 or less
Residents Who Identify Themselves as Bangladeshi
© Crown © Crown © Crown copyright.copyright.copyright. All rights All rights All rights reserved. reserved. reserved.
Sandwell MBC Sandwell MBC Sandwell MBC Licence No. Licence No. Licence No. LA 076309 LA 076309 LA 076309
(2004)(2004)(2004)
© Crown © Crown © Crown copyright.copyright.copyright. All rights All rights All rights reserved. reserved. reserved.
Sandwell MBC Sandwell MBC Sandwell MBC Licence No. Licence No. Licence No. LA 076309 LA 076309 LA 076309
(2004)(2004)(2004)
For Sandwell ward and neighbourhood names,
see pages 2 and 3
For Sandwell ward and neighbourhood names,
see pages 2 and 3

2001 Census: Sandwell Atlas of Urban Conditions2001 Census: Sandwell Atlas of Urban Conditions2001 Census: Sandwell Atlas of Urban Conditions Page Page Page 161616
Ethnicity Ethnicity
% Black Caribbean
6 or more4 to 63 to 42 to 32 or less
© Crown © Crown © Crown copyright.copyright.copyright. All rights All rights All rights reserved. reserved. reserved.
Sandwell MBC Sandwell MBC Sandwell MBC Licence No. Licence No. Licence No.
LA 100032119 LA 100032119 LA 100032119 (2004)(2004)(2004)
© Crown © Crown © Crown copyright.copyright.copyright. All rights All rights All rights reserved. reserved. reserved.
Sandwell MBC Sandwell MBC Sandwell MBC Licence No. Licence No. Licence No.
LA 100032119 LA 100032119 LA 100032119 (2004)(2004)(2004)
The Asian Population
One in every seven Sandwell residents was recorded as Asian or Asian British— a total of 39,592 and 14% of the population.
The Indian population, the largest of Sandwell’s Asian ethnic groups and by far the largest ethnic minority overall, comprised 25,855 residents, 9% of the Sandwell population. The two other large Asian groups in Sandwell were Pakistanis (of which there were 8,342, 3% of the population) and Bangladeshis (3,432 residents, 1% of the total).
The Black Population
Residents who defined themselves as Black or Black British accounted for 4% of Sandwell residents (10,816) and were categorised by the Census as either Caribbean, African or Other. The largest of these groups was Black Caribbean, making up 3% (9,403) of the population. Black Caribbean was also a component of the largest of the mixed ethnic groups (i.e. ‘Mixed White and Black Caribbean’). Black African residents were a relatively small group in Sandwell comprising 578 residents, 0.2% of the population.
% Mixed White/Carib.
4 or more3 to 42 to 31 to 21 or less
Residents Who Identify Themselves as Mixed White/Black Caribbean
© Crown © Crown © Crown copyright.copyright.copyright. All rights All rights All rights reserved. reserved. reserved.
Sandwell MBC Sandwell MBC Sandwell MBC Licence No. Licence No. Licence No.
LA 100032119 LA 100032119 LA 100032119 (2004)(2004)(2004)
© Crown © Crown © Crown copyright.copyright.copyright. All rights All rights All rights reserved. reserved. reserved.
Sandwell MBC Sandwell MBC Sandwell MBC Licence No. Licence No. Licence No.
LA 100032119 LA 100032119 LA 100032119 (2004)(2004)(2004)
Residents Who Identify Themselves as Black Caribbean
For Sandwell ward and neighbourhood names,
see pages 2 and 3