Embed Size (px)
Citation preview

Sanderson, D.C.W., Cresswell, A.J., Murphy, S., and McLeod, J.J. (2001) An Airborne Gamma-Ray Spectrometry Survey of Nuclear Sites in Belgium. Technical Report. Scottish Universities Research and Reactor Centre, East Kilbride.
Copyright © 2001 The Authors.
A copy can be downloaded for personal non-commercial research or study, without prior permission or charge The content must not be changed in any way or reproduced in any format or medium without the formal permission of the copyright holder(s) When referring to this work, full bibliographic details must be given http://eprints.gla.ac.uk/39222/ Deposited on: 20 April 2015.
Enlighten – Research publications by members of the University of Glasgow http://eprints.gla.ac.uk

An Airborne Gamma-Ray Spectrometry Survey of
Nuclear Sites in Belgium
D.C.W. Sanderson, A.J. Cresswell, S. Murphy, J.J. McLeod
January 2001
Scottish Universities Research and Reactor Centre

SUMMARY
An Airborne Gamma Spectrometry (AGS) survey was conducted to establish the contemporary radiationenvironment of the Belgian nuclear sites of Mol-Dessel and Fleurus. The project was commissioned jointlyby the Belgian Nuclear Research Centre (SCK-CEN) near Mol, and the National Institute forRadioelements (IRE Fleurus) as part of a contract under NIRAS/ONDRAF, the authority responsible forthe management of radioactive wastes arising from nuclear sites. The survey was conducted in May 2000by the SURRC AGS team using a twin-engined AS355 aircraft equipped and tested in the UK andtransferred to Belgium for the survey.
The site near Mol in northern Belgium incorporates a complex of nuclear facilities operated by the BelgianNuclear Research Centre (SCK-CEN), Belgoprocess, Belgonucléaire, and FBFC International. Thecomplex also includes a non-nuclear technical research centre, VITO, operated by the Flemish authorities.The European Commission’s Joint Research Centre - Institute for Reference Materials and Measurements(IRMM) is located south-west of SCK-CEN, near Geel. The Institut National des Radioelements (IRE)is located at Fleurus near Charleroi, south of Brussels. The aircraft arrived on the 9th May and completedthe survey of the Mol-Dessel area on the 10th-11th May. The IRE site at Fleurus was surveyed on the 12thMay and the aircraft returned to the UK the following day.
More than 12000 spectra were recorded using a 16 litre NaI(Tl) and approximately 6000 spectra wererecorded with a 50% efficiency Ge (GMX) spectrometer during the survey together with positionalinformation from GPS and ground clearance data from radar altimetry. The results were used to prepareradiometric maps of 137Cs, 60Co, 40K, 214Bi and 208Tl activity, along with the total gamma-ray dose rate foreach of the survey areas, which together with spectral information can be used to evaluate the radiometricimpact of each site.The natural radiation background levels observed in the areas are typical of radiometricsurveys, the Mol-Dessel area having generally lower levels than the Fleurus area. The data sets reveal avariety of signals associated with the nuclear sites, representing known sources of radioactivity or radiationfrom materials contained onsite, varying in response to the type of operation and radioactivity on each site.Small signals observed at IRMM are characteristic of machine sources, with high energy components andannihilation radiation present. Those at FBFC are associated with uranium and MOX fuel materials, whichgive rise to signals from 234mPa, 214Bi and 662keV radiation. The SCK-CEN complex produced a range ofsignals including 41Ar from the BR1 reactor, and 134Cs from agricultural research plots to the west of the site.The Belgoprocess sites produced a range of signals including 137Cs and 60Co from stored materials on bothsites, and 214Bi signals, mainly from 226Ra. At the IRE site small anomalies associated with 99Mo and 131Iwere observed. The gamma dose rate maps show the relative importance of the anthropogenic radiationfields on the nuclear sites and their surroundings. The spatial distribution and nature of these signals is highlyconsistent with expectations based on the types of operation taking place within the sites.
The data sets serve as a reference against which future changes can be measured. Whether in response toan internal or external event, or simply as part of a regular series of campaigns to document the changingenvironments of the sites, as new construction and decommissioning of old plant, or development of newwaste-management approaches take place, it would be possible to repeat this survey rapidly to documentchange.
i

ACKNOWLEDGEMENTS
The survey was commissioned jointly by the Belgian Nuclear Research Centre (SCK-CEN) near Mol, andthe National Institute for Radioelements (IRE Fleurus) as part of a contract with NIPAS/ONDRAF. Weare grateful for the support given by Ir Mark Loos, Dr Frank Hardeman, and Dr Carlos Rojas-Palma ofSCK-CEN and by Dr Antoine Debauche of IRE for initiating and coordinating the project, and for theirsupport in general. We are also grateful for the support and cooperation given to the survey by Dr WalterBlommaert of Belgoprocess, Freddy Goens of FBFC, and Dr Luc Peeters of IRMM and Ir Mark VanReusel of VITO. We appreciate the practical support support given by SCK-CEN and IRE for provisionof office accommodation and for facilitating the airborne operations.
We are also greateful to PDG Helicopters for their support with aircraft engineering, operations support andespecially Dominic Lawlor for making arrangements for transfer of the aircraft and systems to Belgium withappropriate permissions from the Belgian aviation authorities to conduct the low level operations in thesurvey areas. We are particularly grateful to John Constable for his expert contribution to the project, whichresulted in a safe, highly efficient and accurate survey operation.
ii

CONTENTS
1. Introduction.................................................................................................................................11.1 Airborne Gamma Spectrometry..................................................................................................11.2 The Survey Areas.........................................................................................................................2
2. Methodology..................................................................................................................................52.1 Instrumentation...........................................................................................................................52.2 Installation, Testing and Deployment for Survey.................................................................52.3 Measurement Procedure...............................................................................................................62.4 Data Analysis...............................................................................................................................7
3. Results............................................................................................................................................93.1 Mol-Dessel area.........................................................................................................................123.2 Fleurus site................................................................................................................................20
4. Discussion and Conclusions.........................................................................................................27
References.................................................................................................................................28
APPENDICES
Appendix A. Summary of Detector Calibration and Data Processing
Appendix B. Coordinate Transformation
Appendix C. Detailed Maps and Spectra
iii

FIGURES
Figure 1.1 Map showing the location of the institutes and facilities surveyed in this work.........4Figure 3.1 Flight track recorded by the Garmin GPS89 unit for the Mol survey.....................10Figure 3.2 Flight track recorded by the Garmin GPS89 unit for the Fleurus survey................11Figure 3.3 The distribution of 137Cs signals (662 keV) in the Mol survey area...........................14Figure 3.4 The distribution of 60Co signals (1.1-1.3 MeV) in the Mol survey area....................15Figure 3.5 The distribution of 40K signals (1.46 MeV) in the Mol survey area............................16Figure 3.6 The distribution of 214Bi signals (1.76 MeV) in the Mol survey area........................17Figure 3.7 The distribution of 208Tl signals (2.6 MeV) in the Mol survey area...........................18Figure 3.8 Ground level gamma-ray dose rates (mGy a-1) in the Mol survey area. Net dose rates aftersubtraction of cosmic ray and detector background...........................................................................19Figure 3.9 The distribution of 137Cs signals (662 keV) in the vicinity of the IRE site.................21Figure 3.10 The distribution of 60Co signals (1.1-1.3 MeV) in the vicinity of the IRE site........22Figure 3.11 The distribution of 40K signals (1.46 MeV) in the vicinity of the IRE site..............23Figure 3.12 The distribution of 214Bi signals (1.76 MeV) in the vicinity of the IRE site............24Figure 3.13 The distribution of 208Tl signals (2.6 MeV) in the vicinity of the IRE site..............25Figure 3.14 Ground level gamma-ray dose rates (mGy a-1) in the vicinity of the IRE site. Net dose ratesafter subtraction of cosmic ray and detector background...................................................................26
APPENDIX C
Figure C.1 Gamma-dose rate map for the area surrounding the SCK-CEN site, C 3incorporating observations affected by 41Ar released from BR1Figure C.2 Gamma-ray spectra in the vicinity of SCK-CEN showing (i) 41Ar C 4from the BR1 reactor, (ii) 134Cs from labelled cultivation plots near the siteFigure C.3 Gamma-dose rate map showing interference from the 41Ar plume from BR1. C 5Note that the dose rate calibration is based on a terrestrial radionuclide distribution, andtherefore does not quantify the dose rate due to 41Ar at ground levelFigure C.4 Gamma-dose rate map in the location of figure C.3, when BR1 is not C 6operating, showing the position of the labelled cultivation plots to the west of the SCK-CEN site.Figure C.5 Gamma-ray spectra for three areas within Belgoprocess site 1 C 9Figure C.6 137Cs signal distribution around Belgoprocess site 1, as measured from the C 10 airborne survey. Note that source geometries, shielding and local configurations arerelevant to interpretation.Figure C.7 60Co signal distribution around Belgoprocess site1, as measured from the C 11airborne survey. Note that source geometries, shielding and local configurations arerelevant to interpretation.Figure C.8 214Bi signal distribution around Belgoprocess site 1, as measured from the C 12airborne survey. Note that source geometries, shielding and local configurations arerelevant to interpretation.Figure C.9 Gamma-ray dose ratedistribution around Belgoprocess site 1, as measured C 13from the airborne survey. Note that source geometries, shielding and local configurationsare relevant to interpretation.Figure C.10 Gamma-ray spectra for two areas within Belgoprocess site 2 C 14
iv

Figure C.11 137Cs signal distribution around Belgoprocess site 2, as measured from the C 15airborne survey. Note that source geometries, shielding and local configurations arerelevant to interpretation.Figure C.12 60Co signal distribution around Belgoprocess site 2, as measured from the C 16airborne survey. Note that source geometries, shielding and local configurations arerelevant to interpretation.Figure C.13 214Bi signal distribution around Belgoprocess site 2, as measured from the C 17airborne survey. Note that source geometries, shielding and local configurations arerelevant to interpretation.Figure C.14 208Tl signal distribution around Belgoprocess site 2, as measured from the C 18airborne survey. Note that source geometries, shielding and local configurations arerelevant to interpretation.Figure C.15 Gamma-ray dose ratedistribution around Belgoprocess site 2, as measured C 19from the airborne survey. Note that source geometries, shielding and local configurationsare relevant to interpretation.Figure C.16 Gamma-ray spectra from the FBFC site showing evidence of 234mPa and C 22662 keV radiation in addition to naturally occurring componentsFigure C.17137Cs equivalent activity distribution around the FBFC site C 23Figure C.18 234mPasignal distribution around the FBFC site C 24Figure C.19 214Bi signal distribution around the FBFC site C 25Figure C.20 Gamma-ray dose rate distribution around the FBFC site C 26Figure C.21 Gamma-ray spectra recorded in the vicinity of the IRMM LINAC C 28Figure C.22137Cs signal distribution around the IRMM site. Note that the low level C 29anomalies seen at this scale are not due to 137Cs, but arise as a consequenceof spectral interference from activation products and scattered radiation generated inthe vicinity of the LINAC acceleratorFigure C.23 208Tl signal distribution around the IRMM site. Note that the anomaly is C 30attributed to the presence of high energy scattered radiation in the vicinity of theLINAC acceleratorFigure C.24 Gamma-ray dose ratedistribution around the IRMM site C 31Figure C.25 Gamma-ray spectra from the IRE site C 33Figure C.26137Cs signal distribution within the IRE site C 34Figure C.27 60Co signal distribution within the IRE site. Note that the anomaly is not C 35located above the shielded 60Co irradiator. It may reflect the presence of other nuclideswith photon emission in the 1-1.5 MeV energy range associated with theradiochemical laboratories or waste stores.Figure C.28 Gamma-ray dose ratedistribution within the IRE site C 36Figure C.29 Net counts in the GMX detector <300 keV within the IRE site C 37
v

TABLES
Table 2.1 Summary of measurements taken from the field at the IRE site.............................................8
APPENDIX A
Table A.1 Spectral windows for NaI(Tl) detector A 3Table A.2 Background count rates (cps) recorded over water A 3Table A.3 Stripping ratios measured November 2000 A 4Table A.4 Calibration Constants A 4Table A.5 16 litre NaI(Tl) detector daily performance check A 5Table A.6 Summary of survey data files A 5
vi
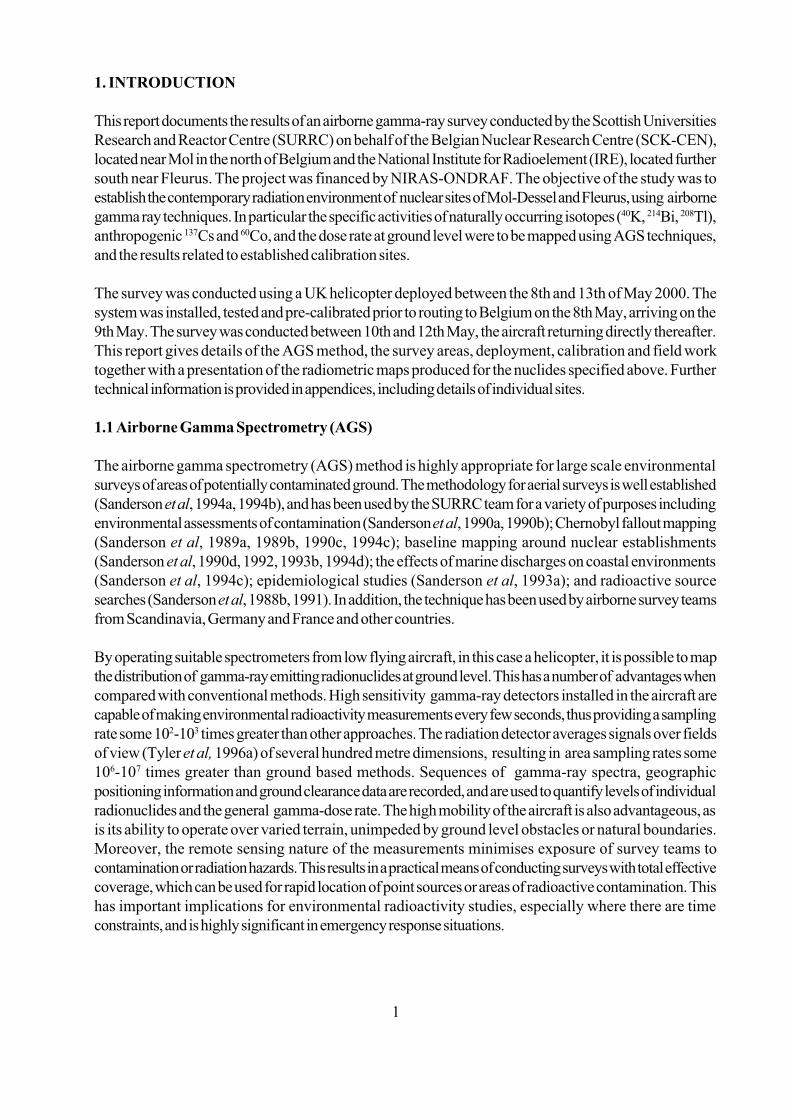
1. INTRODUCTION
This report documents the results of an airborne gamma-ray survey conducted by the Scottish UniversitiesResearch and Reactor Centre (SURRC) on behalf of the Belgian Nuclear Research Centre (SCK-CEN),located near Mol in the north of Belgium and the National Institute for Radioelement (IRE), located furthersouth near Fleurus. The project was financed by NIRAS-ONDRAF. The objective of the study was toestablish the contemporary radiation environment of nuclear sites of Mol-Dessel and Fleurus, using airbornegamma ray techniques. In particular the specific activities of naturally occurring isotopes (40K, 214Bi, 208Tl),anthropogenic 137Cs and 60Co, and the dose rate at ground level were to be mapped using AGS techniques,and the results related to established calibration sites.
The survey was conducted using a UK helicopter deployed between the 8th and 13th of May 2000. Thesystem was installed, tested and pre-calibrated prior to routing to Belgium on the 8th May, arriving on the9th May. The survey was conducted between 10th and 12th May, the aircraft returning directly thereafter.This report gives details of the AGS method, the survey areas, deployment, calibration and field worktogether with a presentation of the radiometric maps produced for the nuclides specified above. Furthertechnical information is provided in appendices, including details of individual sites.
1.1 Airborne Gamma Spectrometry (AGS)
The airborne gamma spectrometry (AGS) method is highly appropriate for large scale environmentalsurveys of areas of potentially contaminated ground. The methodology for aerial surveys is well established(Sandersonet al, 1994a, 1994b), and has been used by the SURRC team for a variety of purposes includingenvironmental assessments of contamination (Sanderson et al, 1990a, 1990b); Chernobyl fallout mapping(Sanderson et al, 1989a, 1989b, 1990c, 1994c); baseline mapping around nuclear establishments(Sanderson et al, 1990d, 1992, 1993b, 1994d); the effects of marine discharges on coastal environments(Sanderson et al, 1994c); epidemiological studies (Sanderson et al, 1993a); and radioactive sourcesearches (Sanderson et al, 1988b, 1991). In addition, the technique has been used by airborne survey teamsfrom Scandinavia, Germany and France and other countries.
By operating suitable spectrometers from low flying aircraft, in this case a helicopter, it is possible to mapthe distribution of gamma-ray emitting radionuclides at ground level. This has a number of advantages whencompared with conventional methods. High sensitivity gamma-ray detectors installed in the aircraft arecapable of making environmental radioactivity measurements every few seconds, thus providing a samplingrate some 102-103 times greater than other approaches. The radiation detector averages signals over fieldsof view (Tyler et al, 1996a) of several hundred metre dimensions, resulting in area sampling rates some106-107 times greater than ground based methods. Sequences of gamma-ray spectra, geographicpositioning information and ground clearance data are recorded, and are used to quantify levels of individualradionuclides and the general gamma-dose rate. The high mobility of the aircraft is also advantageous, asis its ability to operate over varied terrain, unimpeded by ground level obstacles or natural boundaries.Moreover, the remote sensing nature of the measurements minimises exposure of survey teams tocontamination or radiation hazards. This results in a practical means of conducting surveys with total effectivecoverage, which can be used for rapid location of point sources or areas of radioactive contamination. Thishas important implications for environmental radioactivity studies, especially where there are timeconstraints, and is highly significant in emergency response situations.
1

The SURRC team has also utilised a combined detector system, utilising both a 16 litre NaI(Tl) detectorand one or two cryogenically cooled germanium (Ge) semiconductor detectors, for airborne radionuclidemonitoring. Whilst the use of NaI(Tl) detectors is well established and used frequently in airborne surveys,the use of Ge detectors is relatively new. Ge detectors have a much higher energy resolution than the NaI(Tl)scintillator detector, and so are better able to identify the nuclides contributing to the gamma ray spectrum,particularly where complex fission product sources are present. However, they are considerably lesssensitive than NaI(Tl) requiring the use of longer integration times with a resulting loss of spatial resolutionin all but the most active environments. In the current work a single 50% efficiency Ge (GMX) detectormounted inside the aircraft was used.
1.2 The Survey Areas
The survey area comprised the nuclear site complex near Mol, and the environment of the IRE site nearFleurus. Figure 1.1 indicates the location of these sites, showing some of the facilities and institutes at eachsite.
The site near Mol, approximately 80km north east of Brussels, is a complex of several nuclear facilities. Thesite is occupied by a number of institutes: (i) the Belgian Nuclear Research Centre (SCK-CEN) is primarilyconcerned with research into nuclear safety, waste management and radiation protection, and its facilitiesinclude research reactors and laboratories handling radioactive materials; (ii) Belgoprocess specialises inradioactive waste management and decommissioning of nuclear facilities; (iii) Belgonucléaire producesmixed oxide (MOX) fuel material; and (iv) FBFC International is a fuel fabrication plant making uranium fuelelements and assembling MOX fuel elements. The European Commission’s Joint Research Centre - Institutefor Reference Materials and Measurements (IRMM) is located approximately 5km south west of the SCK-CEN site, and is a centre of excellence for measurement sciences with a number of nuclear facilities includingaccelerators. The location of the principal facilities and institutes within the Mol area are included in figure1.1. Permission was granted to over-fly all areas, with the exception of the Belgonucléaire site, subject toconstraints agreed with individual site safety officers.
The facilities of SCK-CEN which could be expected to have radiometric signals include three researchreactors: BR1, a 700kW air-cooled graphite moderated reactor which discharges gaseous 41Ar whileoperating; BR2, a high flux materials research reactor, which is licensed to operate at approximately 100MWt; and BR3, a PWR in process of decommissioning. Other facilities include various laboratorieshandling radioactive materials, and several small plots of land deliberately contaminated with 137Cs, 134Csand 85Sr (which has subsequently decayed to very low levels) to investigate radionuclide uptake by plants.
Belgoprocess occupies two sites in the complex, handling and storing a wide variety of radioactive materialsincluding those derived from the nuclear fuel cycle and from decommissioning. There is a considerablequantity of waste material stored on these sites in well shielded buildings, although there is some dischargeof 222Rn gas from 226Ra and uranium-series wastes through filtration systems.
2

The FBFC International site is concerned with nuclear fuel fabrication, based on uranium in oxide forms, andon MOX. Materials on site include depleted, natural and enriched uranium. MOX-fuel elements areassembled in one building, starting from fuel rods. Other buildings, containing fissile material, are associatedwith storage and/or production of nuclear fuel based on uranium.
The IRMM site has both electron LINAC and Van de Graaff accelerators, as well as a range ofradiochemical laboratories, stores and other non-active buildings. The 150 MeV linear acceleratorincorporates a Bremsstrahlung target resulting in neutron production from subthermal energies to 20 MeV.The two Van de Graaff accelerators produce mainly charged particle beams, which are mostly used forneutron production by interaction with low atomic number targets. Thus, in addition to the high energyphotons associated with these machines, there is potential for production of a wide range of activationproducts, some of which may be detectable, depending on the configuration of local shielding to radiationdirected upwards.
The VITO laboratories are located both in the same complex as SCK-CEN, and in the vicinity of IRMM.
The Institut National des Radioelements (IRE) is situated at Fleurus near Charleroi. The site includes anumber of irradiation and radiochemical facilities. A large 60Co irradiator on the north east side of thecomplex is used for medical sterilisation and, irradiation of materials and foodstuffs. Two cyclotrons of 100MeV and 30 MeV are used for radioisotope production. Radiochemical laboratories and associated wastestorage facilities are used to prepare a range ofisotopic products including radio-pharmaceutical tracers, mainly 99Mo for which IRE is the second producerin the world (first in Europe). The location of some of these facilities is also included in figure 1.1.
3

Bru
sse
ls
Antw
erp
Ge
nt
Ch
arl
ero
i
Lie
ge
Mo
l
IRE
site
SC
K-C
EN
and a
ssocia
ted institu
t
Fig
ure
1.1
Ma
p s
ho
win
g t
he
lo
ca
tion o
f th
e inst
itute
s a
nd
fa
cilitie
s su
rve
yed
in t
his
wo
rk.
4

2. METHODOLOGY
2.1 Instrumentation
The AGS system used consisted of a high volume 16 litre thallium doped sodium iodide (NaI(Tl))spectrometer, a single 50% efficiency Ge semiconductor (GMX) detector, an electronics rackcontaining power supplies, nucleonics and computer, and two GPS systems consisting of a NavstarDGPS4 unit and a Garmin unit. Both were differentially corrected using an FM carrier wave DGPScorrection service (based on an RDS 3000 receiver). The local DGPS service was provided byGeometius NV from The Netherlands. The Navstar unit, which was attached to the electronic rack andconnected to the logging computer, was used to log aircraft position at the start and end of each spectrumrecorded. The Garmin unit was programmed with waypoints for the survey grids and used by the pilotfor navigation. The aircraft used was a twin engine AS355 Squirrel helicopter, supplied by PDGHelicopters, and fitted with a radar altimeter, and appropriate auxiliary power supplies. All equipmentwas mounted on custom built base plates approved by the appropriate aviation authority. A videocamera was fitted on the inside of the aircraft, looking downward through the front window bubble infront of the electronics rack. This records a continuous record of each flight, from which a total videotrack or images of selected features could be extracted.
2.2 Installation, Testing and Deployment for Survey
The equipment consisting of the combined system of NaI(Tl) and Ge detector and associatedinstrumentation was installed in the helicopter at Cumbernauld airport, Scotland on the 8th May, andtested prior to deployment for the survey. An initial test flight at Cumbernauld confirmed the correctfunctioning of all components, the radar altimeter calibration, and working values for the aircraftbackground. The aircraft routed to the Solway Firth for calibration manoeuvres early in the afternoonof the 8th May, the remainder of the technical team travelling by car to the calibration site.
Calibration manoeuvres were conducted on route to Belgium and again during the return flight over thesalt marshes at Caerlaverock on the Solway Firth in SW Scotland. These consisted of measurementsrecorded while hovering at a series of altitudes above a calibration pattern consisting of concentrichexagons at 8, 32, 128 and 256m from the central point. Cores were collected from this site in February1992 (Sanderson et al, 1992) and April 1999 (Sanderson et al, 2000). Data from these manoeuvreswas used to determine altitude correction and sensitivity calibration factors before the start of survey.
Having verified the calibration, the aircraft together with one operator continued to route towardsBelgium, overnighting in Kent, clearing customs in the UK on the morning of the 9th May, and in Antwerpin the middle of the day, arriving at the SCK-CEN site in the afternoon. The remaining two team memberstravelled by air to Brussels on the 8th May, and established the data processing facilities at SCK-CENon the morning of the 9th May prior to aircraft arrival.
5

In this manner, a fully functional AGS system and ground station was established at SCK-CEN one dayafter deployment from SURRC. The DGPS service used in the UK was supplied by a different operatorthan that available in Belgium. Minor difficulties were experienced in getting the RDS3000 unit to transferfrom the UK operator to the network managed by Geometius. This turned out to be due to the presenceof a high sided metal building directly adjacent to the landing site, which was blocking the registrationtransmissions from being received on site. Having substituted antennae, and an alternative RDS unit, thiswas overcome in time for the Charleroi survey. Fortunately, however, the quality of GPS locationachieved at Mol (typically 5-15 m depending on satellite configuration) was comparable with thatachieved near Charleroi (typically 4-12 m depending on satellite configuration), since the USDepartment of Defence had in any case discontinued the Selective Availability function approximatelytwo weeks prior to start of survey.
Prior to start of survey, a safety briefing was held to allow the pilot, Captain John Constable, and thesafety representatives of the nuclear sites to discuss specific areas of concern within the nuclear sites,and how best to conduct the surveys. It was decided at this meeting to conduct reconnaissance flightsearly on the 10th May with the safety representatives on board the aircraft to identify hazardous areasto the pilot. Data were collected over the individual sites during these flights, and the rest of the surveyconducted according to pre-planned navigational routes thereafter. The area surveys in Mol weresuccessfully completed on the 10th and 11th May, despite a severe electrical storm in the afternoon andevening of the 10th May. Initial survey results, including a demonstration of the spectral analysis, andmaps were presented to sponsors on the 11th May.
The aircraft was transferred to IRE Fleurus on the morning of the 12th May, with the ground supportteam travelling by car. Following initial briefings at IRE, the survey was conducted in the evening of the12th May, with short demonstration flights being concluded on the 13th. The aircraft cleared Belgiumcustoms at midday at Charleroi, and returned to Cumbernauld the same day, repeating calibrationmeasurements at the Caerlaverock site en-route.
2.3 Measurement Procedure
The procedures specified and used for this survey work were based on normal practice in environmentalairborne gamma spectrometry (Sanderson et al 1994a,b). The NaI(Tl) spectra were initially reducedinto standard energy windows corresponding to nuclides which are frequently encountered inenvironmental surveys. The calibration procedures are based on standard models for the response(Allyson et al 1998), and traced to spatially representative calibration sites (Tyler et al 1996a,Sandersonet al 1997a,b) of known mass depth (Tyler et al 1996b). It should be realised however thatin the vicinity of nuclear sites and similar facilities there may be other isotopic or radiation features present,and local deviations from open field geometries. The effects of spectral interferences to isotopeidentification, and of finite or collimated geometries, and local shielding, on quantitative estimates needto be considered in interpreting data and maps generated in this way.
The detector system performance (gain, resolution and sensitivity) was checked at the start of each day,and trimmed as necessary. Background measurements were made over open water at least once eachday. During flight the NaI(Tl) detector gain was monitored by using the 40K peak at 1462 keV. Spectrawere recorded from the NaI(Tl) spectrometer with a 2s integration time, and 4s for the GMX detector.Files containing 2 NaI(Tl) spectra and one GMX spectrum were written to disk, together with timinginformation, GPS positioning data and time-averaged radar altimetry data.
6
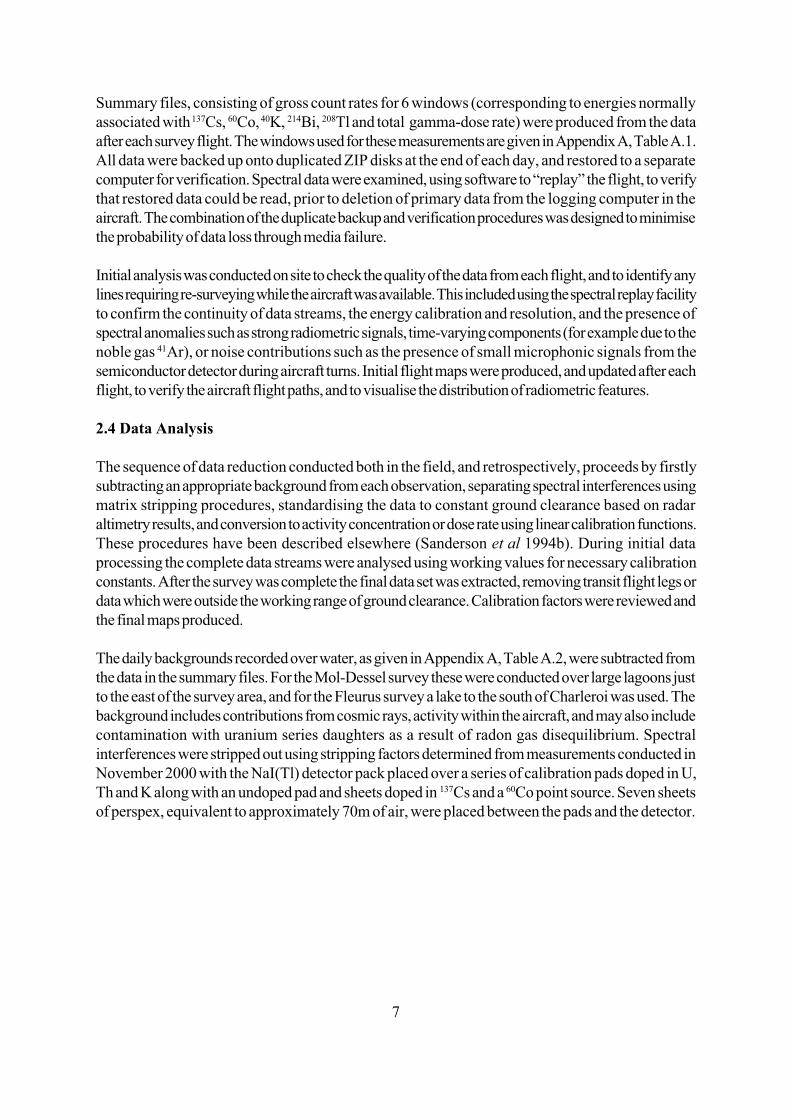
Summary files, consisting of gross count rates for 6 windows (corresponding to energies normallyassociated with 137Cs, 60Co, 40K, 214Bi, 208Tl and total gamma-dose rate) were produced from the dataafter each survey flight. The windows used for these measurements are given in Appendix A, Table A.1.All data were backed up onto duplicated ZIP disks at the end of each day, and restored to a separatecomputer for verification. Spectral data were examined, using software to “replay” the flight, to verifythat restored data could be read, prior to deletion of primary data from the logging computer in theaircraft. The combination of the duplicate backup and verification procedures was designed to minimisethe probability of data loss through media failure.
Initial analysis was conducted on site to check the quality of the data from each flight, and to identify anylines requiring re-surveying while the aircraft was available. This included using the spectral replay facilityto confirm the continuity of data streams, the energy calibration and resolution, and the presence ofspectral anomalies such as strong radiometric signals, time-varying components (for example due to thenoble gas 41Ar), or noise contributions such as the presence of small microphonic signals from thesemiconductor detector during aircraft turns. Initial flight maps were produced, and updated after eachflight, to verify the aircraft flight paths, and to visualise the distribution of radiometric features.
2.4 Data Analysis
The sequence of data reduction conducted both in the field, and retrospectively, proceeds by firstlysubtracting an appropriate background from each observation, separating spectral interferences usingmatrix stripping procedures, standardising the data to constant ground clearance based on radaraltimetry results, and conversion to activity concentration or dose rate using linear calibration functions.These procedures have been described elsewhere (Sanderson et al 1994b). During initial dataprocessing the complete data streams were analysed using working values for necessary calibrationconstants. After the survey was complete the final data set was extracted, removing transit flight legs ordata which were outside the working range of ground clearance. Calibration factors were reviewed andthe final maps produced.
The daily backgrounds recorded over water, as given in Appendix A, Table A.2, were subtracted fromthe data in the summary files. For the Mol-Dessel survey these were conducted over large lagoons justto the east of the survey area, and for the Fleurus survey a lake to the south of Charleroi was used. Thebackground includes contributions from cosmic rays, activity within the aircraft, and may also includecontamination with uranium series daughters as a result of radon gas disequilibrium. Spectralinterferences were stripped out using stripping factors determined from measurements conducted inNovember 2000 with the NaI(Tl) detector pack placed over a series of calibration pads doped in U,Th and K along with an undoped pad and sheets doped in 137Cs and a 60Co point source. Seven sheetsof perspex, equivalent to approximately 70m of air, were placed between the pads and the detector.
7
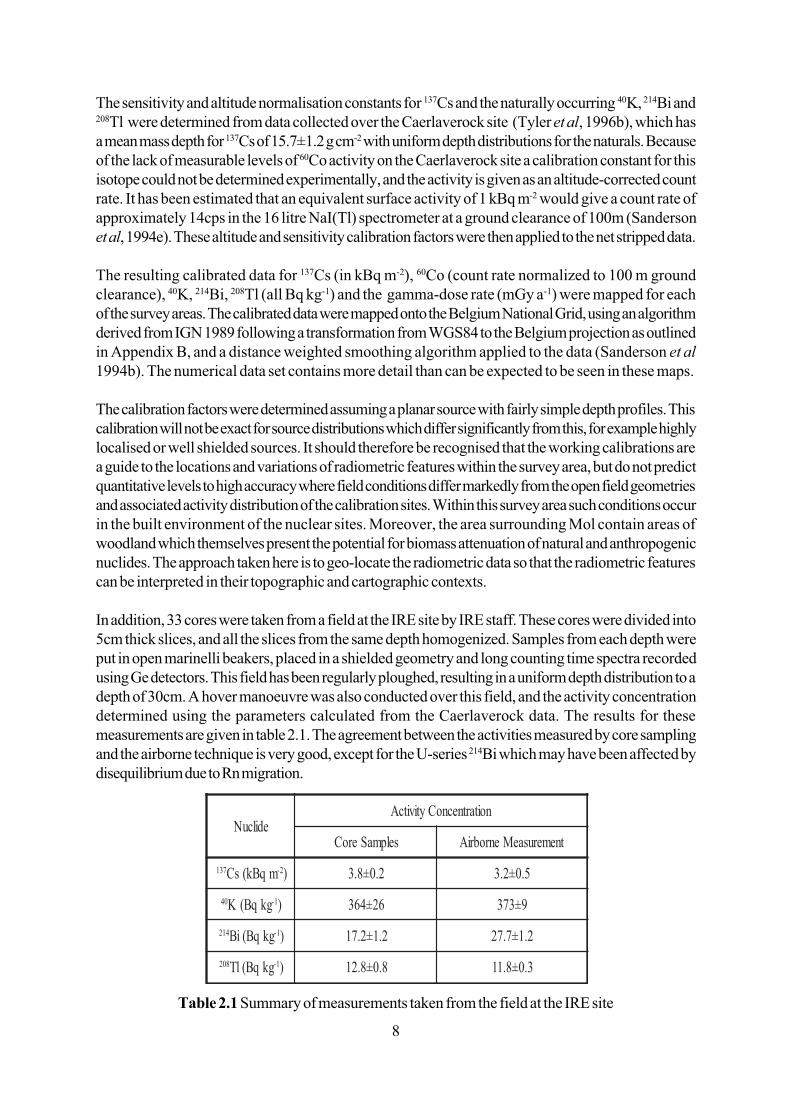
The sensitivity and altitude normalisation constants for 137Cs and the naturally occurring 40K, 214Bi and208Tl were determined from data collected over the Caerlaverock site (Tyler et al, 1996b), which hasa mean mass depth for 137Cs of 15.7±1.2 g cm-2 with uniform depth distributions for the naturals. Becauseof the lack of measurable levels of 60Co activity on the Caerlaverock site a calibration constant for thisisotope could not be determined experimentally, and the activity is given as an altitude-corrected countrate. It has been estimated that an equivalent surface activity of 1 kBq m-2 would give a count rate ofapproximately 14cps in the 16 litre NaI(Tl) spectrometer at a ground clearance of 100m (Sandersonet al, 1994e). These altitude and sensitivity calibration factors were then applied to the net stripped data.
The resulting calibrated data for 137Cs (in kBq m-2), 60Co (count rate normalized to 100 m groundclearance), 40K, 214Bi, 208Tl (all Bq kg-1) and the gamma-dose rate (mGy a-1) were mapped for eachof the survey areas. The calibrated data were mapped onto the Belgium National Grid, using an algorithmderived from IGN 1989 following a transformation from WGS84 to the Belgium projection as outlinedin Appendix B, and a distance weighted smoothing algorithm applied to the data (Sanderson et al
1994b). The numerical data set contains more detail than can be expected to be seen in these maps.
The calibration factors were determined assuming a planar source with fairly simple depth profiles. Thiscalibration will not be exact for source distributions which differ significantly from this, for example highlylocalised or well shielded sources. It should therefore be recognised that the working calibrations area guide to the locations and variations of radiometric features within the survey area, but do not predictquantitative levels to high accuracy where field conditions differ markedly from the open field geometriesand associated activity distribution of the calibration sites. Within this survey area such conditions occurin the built environment of the nuclear sites. Moreover, the area surrounding Mol contain areas ofwoodland which themselves present the potential for biomass attenuation of natural and anthropogenicnuclides. The approach taken here is to geo-locate the radiometric data so that the radiometric featurescan be interpreted in their topographic and cartographic contexts.
In addition, 33 cores were taken from a field at the IRE site by IRE staff. These cores were divided into5cm thick slices, and all the slices from the same depth homogenized. Samples from each depth wereput in open marinelli beakers, placed in a shielded geometry and long counting time spectra recordedusing Ge detectors. This field has been regularly ploughed, resulting in a uniform depth distribution to adepth of 30cm. A hover manoeuvre was also conducted over this field, and the activity concentrationdetermined using the parameters calculated from the Caerlaverock data. The results for thesemeasurements are given in table 2.1. The agreement between the activities measured by core samplingand the airborne technique is very good, except for the U-series 214Bi which may have been affected bydisequilibrium due to Rn migration.
Table 2.1 Summary of measurements taken from the field at the IRE site
edilcuNnoitartnecnoCytivitcA
selpmaSeroC tnemerusaeMenrobriA
731 mqBk(sC 2- ) 2.0±8.3 5.0±2.3
04 gkqB(K 1- ) 62±463 9±373
412 gkqB(iB 1- ) 2.1±2.71 2.1±7.72
802 gkqB(lT 1- ) 8.0±8.21 3.0±8.11
8

3. RESULTS
The survey of the Mol sites and surrounding areas was conducted during the 10th-11th May. Some 7500NaI(Tl) and 3750 GMX spectra were recorded over 5½ hours. Figure 3.1 shows the flight trackrecorded at 15s intervals during these survey flights by the Garmin GPS.
The survey of the IRE site and surrounding areas at Fleurus was conducted on the 12th May. Some 5400NaI(Tl) and 2700 GMX spectra were recorded over 4 hours. Figure 3.2 shows the flight track recordedat 15s intervals during these survey flights by the Garmin GPS.
The calibration used is based on comparison between altitude corrected stripped counts from the surveyarea and the calibration response of the system determined in open area conditions on calibration sites.In addition to being sensitive to variations in the mass depth distribution of any sources of depositedactivity, there are potential geometrical effects particularly in the built environment of nuclear sites whichmay affect quantitative response. Where the spatial extent of a radiometric feature is significantly smallerthan the field of view of the AGS detector, which is frequently the case in the vicinity of nuclear sites, theAGS system is expected to underestimate equivalent activity. Local shielding compounds this effect butcan also lead to changes in the amount of scattered radiation observed and therefore influence spectralstripping. In the case of radioactive gases, including 41Ar and 222Rn, the relationship between airborneand ground based dose rates may be expected to differ markedly from open field conditions; in additionto dependence on local meteorological conditions. For these reasons, the maps themselves should betaken as an indication of the location of sources of enhanced radioactivity or radiation and only used incombination with other information for the purposes of radiological assessments. Bearing in mind thatradiation fields can extend for up to a few hundred metres from the source, site specific investigationsare helpful to determine whether features observed at or close to site perimeters are associated with localcontamination, or with radiation fields projecting from the site. Moreover, where spectral componentsnot considered in the standard model are evident the possibility of uncorrected interferences resultingin anomalies appearing in more than one nuclide specific map should be borne in mind.
Despite these qualifications the maps reveal an interesting range of radiometric features which correlatewell with the locations and characteristics of activity associated with the individual nuclear sites. The mapsare especially effective as an aid to visualisation of the spatial extent of enhancement to the ambientradiation fields in the immediate surroundings of the nuclear sites. They permit a general assessment ofthe magnitude of the radiometric impact of the sites on their local environment, and provide a basis forassessing change as the inventories of materials used and stored develops, and as old facilities are subjectto decommissioning and site restoration.
The radiometric maps presented here cover the full survey areas of both the Mol-Dessel and Fleurusareas. Radiometric maps of individual sites along with summed spectra for active areas in these sites areincluded in Appendix C.
9

Fig
ure
3.1
Flig
ht tr
ack
reco
rded
by
the
Gar
min
GPS
89 u
nit f
or th
e M
ol su
rvey
.
10
01
2km
200
202
199
201
203
208
210
198
196
194
206
195
197
205
207
209
216
212
214
211
213
215
MOL
N18N18
BR2
BR3
Belgo
Nucleair
BR1 SCK-CEN
DESSEL
Belgoprocess
Belgoprocess
FBFC
IRMM
Eupopese
School
Kanaal B
ocholt-H
ere
nta
ls
N118
N118
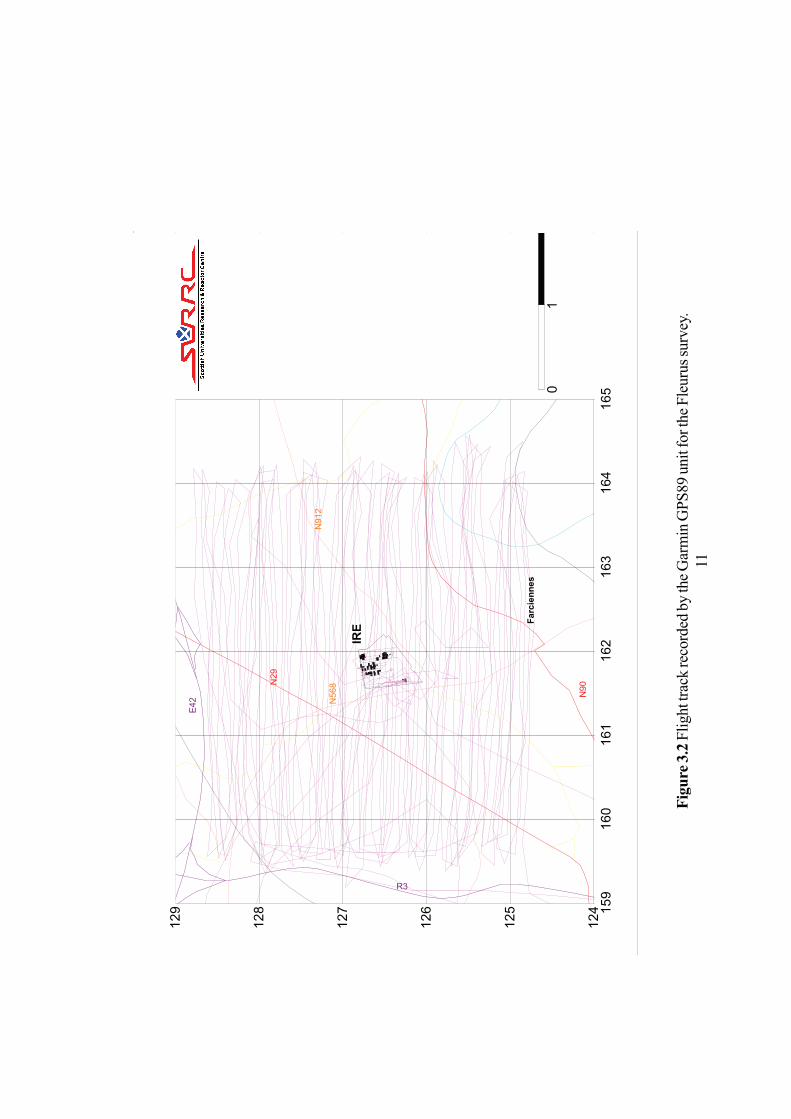
Fig
ure
3.2
Flig
ht tr
ack
reco
rded
by
the
Gar
min
GPS
89 u
nit f
or th
e Fl
euru
s sur
vey.
11
N568
E42
N912
N29
IRE
Farciennes
R3
N90
16
51
63
16
4
01
16
01
62
16
11
59
12
4
12
5
12
6
12
7
12
8
12
9
3.1 Mol-Dessel area
The survey included flights over all the nuclear sites in the area, with the exception of the Belgonucléairesite. The data provides a complete record of the radiation environment of all the sites over flown, butonly the radiation projected over the fence of the Belgonucléaire site.
The 137Cs map, shown in figure 3.3, shows a number of features. Away from the nuclear sites the levelsof 137Cs are generally low reflecting the combination of deposition due to global fallout from theatmospheric testing of nuclear weapons, and the relatively low levels of Chernobyl deposition to the area.These levels typically range from below 2kBq m-2 to approximately 5-10 kBq m-2, the extent to whichspatial variations correspond to land cover features being as yet undetermined. A negative feature whichcorresponds clearly to the path of the Bocholt-Herentals canal is evident at western and north easternparts of the map. A small enhancement is evident in the vicinity of IRMM, although this is largely attributedto interference from high energy radiation of machine origin. Distinct radiometric features are alsoobserved at the FBFC site, which are attributed to a combination of 662 keV radiation associated withMOX materials, and spectral interferences from 234mPa and to a lesser extent 214Bi associated withuranium derived materials. The large radiometric anomalies on the Belgoprocess sites 1 and 2 areassociated with 137Cs activity from stored radioactive materials on the sites, with some contributions fromscattered radiation from other stored materials. The radiometric anomalies on and to the west of theSCK-CEN site are attributed to spectral interferences from 41Ar discharged from the BR1 reactor, andits meandering plume, coupled to radiation fields around the site, and the Cs labelled cultivated plots tothe west of the site.
The 60Co map, shown in figure 3.4, shows a number of features. Outwith the nuclear sites the levels of60Co are, as expected, very low with activities less than 14 cps, corresponding to less than approximately1kBq m-2. A slight enhanced signal from the FBFC site is attributed to spectral interferences from 234mPa,which has a 1001 keV gamma-ray the peak of which slightly overlaps the 60Co window. The largeanomalies on the Belgoprocess sites 1 and 2 are associated with 60Co activity from stored materials onthe sites, with some contributions from scattered radiation from other stored materials. To the west ofthe SCK-CEN site a signal in the 60Co channel results from the 1294keV 41Ar gamma -ray whichcorresponds to the 60Co window for 1173keV and 1332keV gamma-rays.
The 40K map, shown in figure 3.5, shows a number of features. There is a large range of natural variation,with enhanced activity to the south and the far north of the region, reflecting the combination of geologicaland land cover variations. To the north and north west of the SCK-CEN the negative features associatedwith lagoons or lakes are clearly visible. There are small anomalies on Belgoprocess sites 1 and 2. Thefirst of these is of relatively small extent, and may simply reflect the different natural radioelement contentof the built environment of this site in contrast with its surrounding environment. On site 2 there are areaswhere the levels of radiation due to stored materials are sufficiently high to produce scattered radiationin the 40K energy region and the onset of spectral distortion at high count rates. Interestingly, the anomalypresent is on the north west side of the storage areas suggesting that scattered radiation from materialsstored within the facilities is a substantial component. In the vicinity of BR1 and to the west there is a signalin the 40K channel due to interference from 41Ar emitted from the research reactor during its operationson the 10th May.
12

The 214Bi map, shown in figure 3.6, shows a number of features. There is natural variation outwith thenuclear sites, with higher levels to the south of the survey area, and to the northwest of the SCK-CENcomplex. Major anomalies associated with the nuclear sites is from Belgoprocess site 2, which is knownto contain substantial stocks of 226Ra, thus explaining the radiometric feature, which is observed inprecisely the locations expected. A minor anomaly is also detected at the FBFC site. 214Bi is not expectedto be a major radiation contribution from purified uranium materials, and therefore the possibility that thissignal indicates the presence of uranium ores on the site, perhaps associated with past activities, maymerit further consideration.
The 208Tl map, shown in figure 3.7, shows a number of features. There is natural variation outwith thenuclear sites, with higher activity in the southern side of the survey area and significantly higher activityto the north of the SCK-CEN site. There are reduced activity areas associated with the lagoons to thenorth and west of the SCK-CEN site. There is a slight anomaly on the IRMM site, as a result ofinterference from high energy photons generated by the LINAC accelerator. There is also an anomalyon Belgoprocess site 2, where there are areas where the levels of radiation due to stored materials aresufficiently high to produce scattered radiation in the 208Tl energy region and the onset of spectraldistortion at high count rates.
The gamma-dose rate map, shown in figure 3.8, shows a number of features. There are natural variationsreflecting the variations in 40K, 214Bi and 208Tl activities, with higher levels to the south of the survey area,and to the north west of the SCK-CEN site.
13

Fig
ure
3.3
The
dis
trib
utio
n of
137 C
s sig
nals
(662
keV
) in
the
Mol
surv
ey a
rea.
14
01
2km
20
02
02
19
92
01
20
3
20
8
21
0
19
81
96
19
4
20
6
19
51
97
20
5
20
7
20
9
21
6
21
2
21
4
21
1
21
3
21
5
MOL
N18N18
BR2
BR3
Belgo
Nucleair
BR1 SCK-CEN
DESSEL
Belgoprocess
Belgoprocess
FBFC
IRMM
Eupopese
School
Kanaal B
ocholt-H
ere
nta
ls
N118
N118
Ca
libra
tio
n b
ase
d o
n u
nifo
rmp
lan
ar
so
urc
e g
eo
me
try

Fig
ure
3.4
The
dis
trib
utio
n of
60C
o si
gnal
s (1.
1-1.
3 M
eV) i
n th
e M
ol su
rvey
are
a.15
01
2km
20
02
02
19
92
01
20
3
20
8
21
0
19
81
96
19
4
20
6
19
51
97
20
5
20
7
20
9
21
6
21
2
21
4
21
1
21
3
21
5
MOL
N18N18
BR2
BR3
Belgo
Nucleair
BR1 SCK-CEN
DESSEL
Belgoprocess
Belgoprocess
FBFC
IRMM
Eupopese
School
Kanaal B
ocholt-H
ere
nta
ls
N118
N118

Fig
ure
3.5
The
dis
trib
utio
n of
40K
sign
als (
1.46
MeV
) in
the
Mol
surv
ey a
rea.
16
01
2km
200
202
199
201
203
208
210
198
196
194
206
195
197
205
207
209
216
212
214
211
213
215
MOL
N18N18
BR2
BR3
Belgo
Nucleair
BR1 SCK-CEN
DESSEL
Belgoprocess
Belgoprocess
FBFC
IRMM
Eupopese
School
Kanaal B
ocholt-H
ere
nta
ls
N118
N118
Calib
ration b
ased o
n u
niform
pla
nar
sourc
e g
eom
etr
y
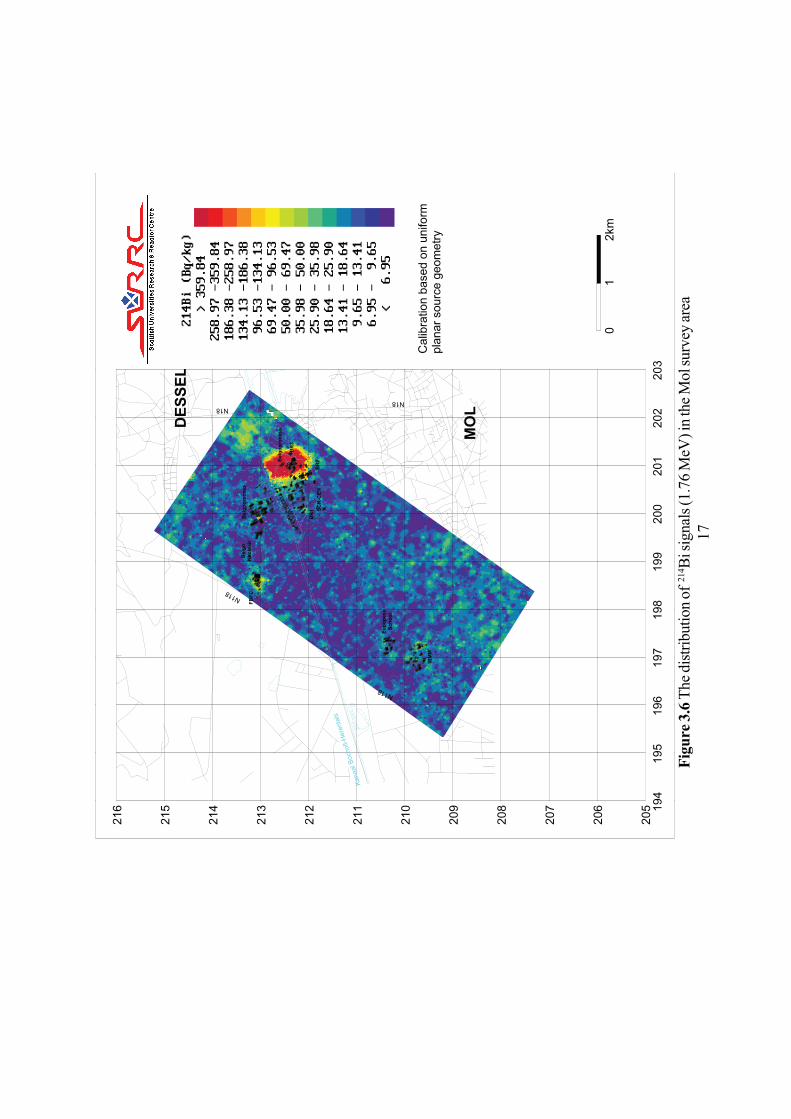
Fig
ure
3.6
The
dis
trib
utio
n of
214
Bi s
igna
ls (1
.76
MeV
) in
the
Mol
surv
ey a
rea
17
01
2km
200
202
199
201
203
208
210
198
196
194
206
195
197
205
207
209
216
212
214
211
213
215
MOL
N18N18
BR2
BR3
Belgo
Nucleair
BR1 SCK-CEN
DESSEL
Belgoprocess
Belgoprocess
FBFC
IRMM
Eupopese
School
Kanaal B
ocholt-H
ere
nta
ls
N118
N118C
alib
ration b
ased o
n u
niform
pla
nar
sourc
e g
eom
etr
y

Fig
ure
3.7
The
dis
trib
utio
n of
208 T
l sig
nals
(2.6
MeV
) in
the
Mol
surv
ey a
rea
18
01
2km
20
02
02
19
92
01
20
3
20
8
21
0
19
81
96
19
4
20
6
19
51
97
20
5
20
7
20
9
21
6
21
2
21
4
21
1
21
3
21
5
MOL
N18N18
BR2
BR3
Belgo
Nucleair
BR1 SCK-CEN
DESSEL
Belgoprocess
Belgoprocess
FBFC
IRMM
Eupopese
School
Kanaal B
ocholt-H
ere
nta
ls
N118
N118
Ca
libra
tio
n b
ase
d o
n u
nifo
rmp
lan
ar
so
urc
e g
eo
me
try

Fig
ure
3.8
Gro
und
leve
l gam
ma-
ray
dose
rate
s (m
Gy
a-1) i
n th
e M
ol su
rvey
are
a. N
et d
ose
rate
saf
ter s
ubtr
actio
n of
cos
mic
ray
and
dete
ctor
bac
kgro
und.
19
01
2km
200
202
199
201
203
208
210
198
196
194
206
195
197
205
207
209
216
212
214
211
213
215
MOL
N18N18
BR2
BR3
Belgo
Nucleair
BR1 SCK-CEN
DESSEL
Belgoprocess
Belgoprocess
FBFC
IRMM
Eupopese
School
Kanaal B
ocholt-H
ere
nta
ls
N118
N118
Calib
ration b
ased o
n u
niform
pla
nar
sourc
e g
eom
etr
y

3.2 Fleurus site
The 137Cs map, shown in figure 3.9, shows slightly higher levels of 137Cs in the area outwith the nuclearsite than was observed in the Mol-Dessel area, typically ranging from 1-2 kBq m-2 to 10-12 kBq m-2,it was noted that the airborne survey data overestimated the 137Cs activity on the sampled field at IREsuggesting a slight problem with the processing of this data. The higher of these levels are associated withhigher levels of 40K, suggesting that there may be some residual interferences in this data set due toincorrect stripping. There is an anomaly within the IRE site associated with materials in the vicinity of theradiochemical laboratories and waste store. In addition to small levels of 137Cs, there are also gamma-rays from 214Bi (609keV) and 99Mo (739keV) which contribute to this channel. There is a highlylocalised signal of unknown origin to the north of the IRE site.
The 60Co map, shown in figure 3.10, shows some activity outwith the nuclear site where no 60Co wouldbe expected. These correspond to areas with higher levels of 40K and are almost certainly due to aproblem with spectral stripping. There is an anomaly within the IRE site in the vicinity of the radiochemicallaboratories and waste store. There are unidentified gamma -rays at 1236keV and 1333keV evidentin the GMX spectrometer data which contribute to this channel.
The 40K map, shown in figure 3.11, shows the natural variation within the survey area as a result ofgeological and land cover variation. The activity levels in the Fleurus area are higher than those observedin the Mol-Dessel area. There are higher activity areas to the east and south east of the IRE site, withlow levels in areas to the west and south east of the IRE site associated with woodland. There is noenhancement in 40K signals associated with the IRE site.
The214Bi map, shown in figure 3.12, shows the natural variation within the survey area. The activity levelsin the Fleurus area are higher than those observed in the Mol-Dessel area. There are slightly higher levelsto the northern and eastern sides of the survey area, with lower levels to the west of the IRE site. Thereis no enhancement in 214Bi signals associated with the IRE site.
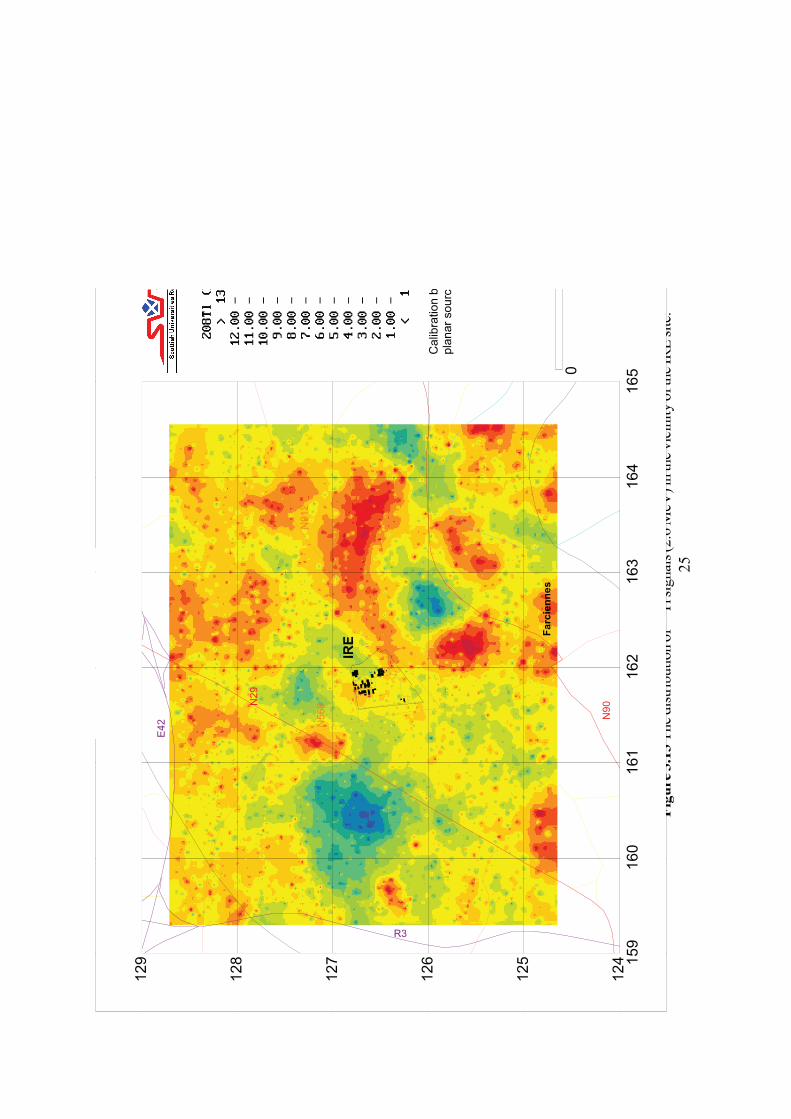
The208Tl map, shown in figure 3.13, shows the natural variation within the survey area, showing the samepattern as the other natural channels. The activity levels in the Fleurus area are higher than those observedin the Mol-Dessel area. There is no evidence of enhanced 208Tl levels associated with the IRE site.
The gamma-ray dose map, shown in figure 3.14, shows the natural variation outwith the nuclear site, withhigher levels to the east of the survey area and low levels to the west and south east of the IRE site. Thereare enhanced dose rate levels associated with the previously noted anthropogenic signals in the vicinityof the radiochemical laboratories and waste stores.
20
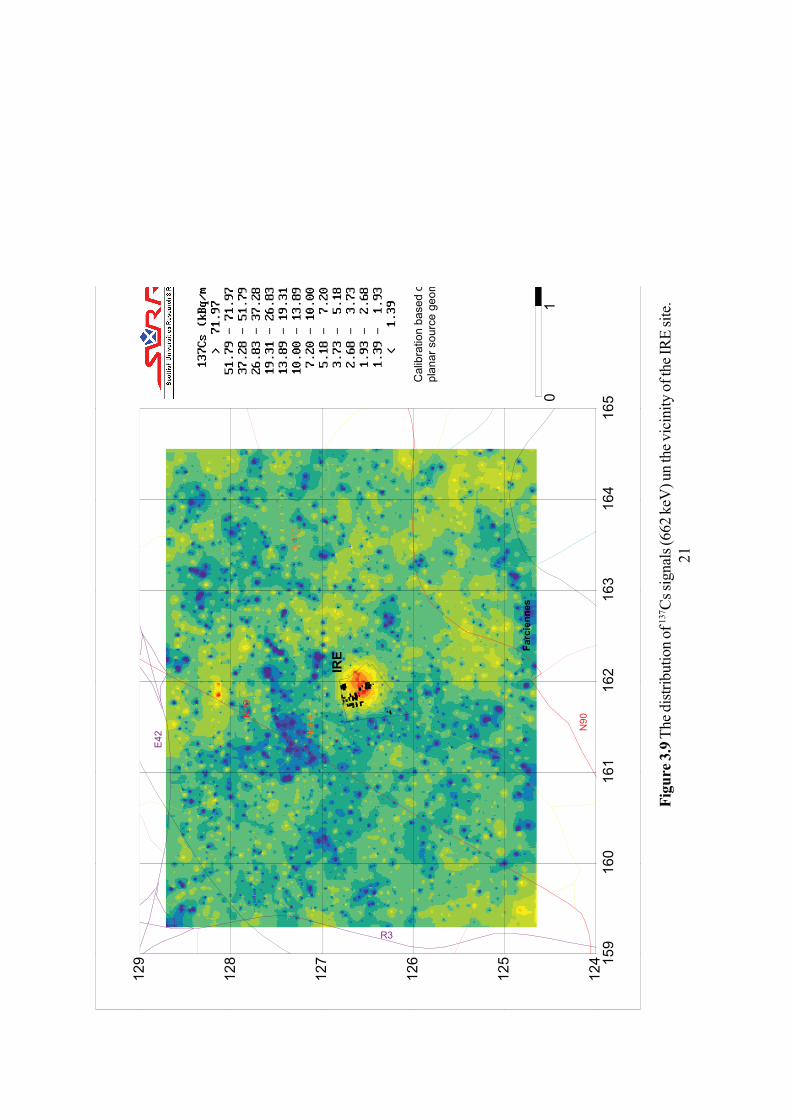
Fig
ure
3.9
The
dis
trib
utio
n of
137 C
s sig
nals
(662
keV
) un
the
vici
nity
of t
he IR
E si
te.
21
N5
68
E4
2
N9
12
N2
9
IRE
Farciennes
R3
N9
0
Calib
ration b
ased o
pla
nar
sourc
e g
eo
m
16
51
63
16
4
01
16
01
62
16
11
59
12
4
12
5
12
6
12
7
12
8
12
9

Fig
ure
3.1
0 T
he d
istr
ibut
ion
of 60
Co
sign
als (
1.1-
1.3
MeV
) in
the
vici
nity
of t
he IR
E si
te22
N568
E42
N912
N29
IRE
Farciennes
R3
N90
16
51
63
16
4
01
16
01
62
16
11
59
12
4
12
5
12
6
12
7
12
8
12
9

Fig
ure
3.1
1 T
he d
istr
ibut
ion
of 40
K si
gnal
s (1.
46 M
eV) i
n th
e vi
cini
ty o
f the
IRE
site
.23
N568
E4
2
N912
N29
IRE
Farciennes
R3
N90
Ca
libra
tio
n b
as
pla
na
r so
urc
e g
165
163
164
01
160
162
161
159
124
125
126
127
128
129

Fig
ure
3.1
2 T
he d
istr
ibut
ion
of 21
4 Bi s
igna
ls (1
.76
MeV
) in
the
vici
nity
of t
he IR
E si
te.
24
N5
68
E4
2
N9
12
N2
9
IRE
Farciennes
R3
N9
0
Calib
ration b
ased
pla
nar
sourc
e g
eo
165
163
164
01
160
162
161
159
124
125
126
127
128
129
Fig
ure
3.1
3 T
he d
istr
ibut
ion
of 20
8 Tl s
igna
ls (2
.6 M
eV) i
n th
e vi
cini
ty o
f the
IRE
site
.25
N5
68
E4
2
N9
12
N2
9
IRE
Farciennes
R3
N9
0
Calib
ration
bp
lan
ar
so
urc
16
51
63
16
4
0
16
01
62
16
11
59
12
4
12
5
12
6
12
7
12
8
12
9

Fig
ure
3.1
4 G
roun
d le
vel g
amm
a-ra
y do
se ra
tes (
mG
y a-
1) in
the
vici
nity
of t
he IR
E si
te. N
et d
ose
rate
s aft
er su
btra
ctio
n of
cos
mic
ray
and
dete
ctor
bac
kgro
und
26
N568
E4
2
N912
N29
IRE
Farciennes
R3
N90
Ca
libra
tio
n b
as
pla
na
r so
urc
e
165
163
164
0
160
162
161
159
124
125
126
127
128
129

4. DISCUSSION AND CONCLUSIONS
The Airborne Gamma Spectrometry (AGS) survey was conducted around the vicinity of nuclear sitesin two regions of Belgium, near Mol and Fleurus. The sites at Mol were surveyed during the 10th-11thMay 2000, with 7500 NaI(Tl) and 3750 GMX spectra recorded during 5½ hours. The IRE site atFleurus was surveyed on the 12th May 2000, with 5400 NaI(Tl) and 2700 GMX spectra recordedduring 4 hours. Spectra were recorded using a 16 litre NaI(Tl) and a 50% efficiency Ge (GMX)spectrometer mounted on the inside of a twin engine Squirrel helicopter. Differential GPS systems wereused to aid aircraft navigation and to log the position of each spectrum recorded.
The survey was conducted within one week and was successful, showing that it is feasible to conductsuch an operation efficiently using local landing sites and infrastructure support. The technical outputshave confirmed that abundant spectrometric information about the radiation environment of these nuclearsites can be gathered using the airborne survey technique.
The data sets reveal a wide variety of signals associated with the nuclear sites and their facilities, generallyconfirming the highly localised nature of radiometric anomalies associated with the facilities. Thecharacteristics of the radiometric signals vary in response to the type of operation and radioactivity oneach site. Signals observed at IRMM are largely characteristic of machine sources, with high energycomponents and annihilation radiation present. Those at FBFC by contrast are largely associated with234mPa reflecting the uranium distribution around the site, although 662 keV radiation, associated withMOX activities, and 214Bi signals are also present. The SCK-CEN complex produced a range of signalsnotably including the discharge of 41Ar from the BR1 reactor. It was also possible to observe signalsassociated with the agricultural research plots to the west of the site. The Belgoprocess sites produceda striking range of signals of which 137Cs and 60Co contributions are associated with nuclear fuel cycleand activated materials, and 214Bi signals are associated with 226Ra and/or uranium series activity. Atthe IRE site it was possible to see small anomalies associated with short lived nuclides including 99Moand 131I. The gamma dose rate maps show the relative importance of the anthropogenic radiation fieldson the nuclear sites and their surroundings. It is reassuring to note that the spatial distribution and natureof these signals is so highly consistent with expectations based on the types of operation taking placewithin the sites, and that the signals are so highly localised to the facilities.
The data sets serve as a reference against which future changes can be measured. Whether in responseto an internal or external event, or simply as part of a regular series of campaigns to document the changingenvironments of the sites, as new construction and decommissioning of old plant, or development of newwaste-management approaches take place, it would be possible to repeat this survey rapidly todocument change.
27

REFERENCES
Allyson, J.D. & Sanderson, D.C.W. (1998). Monte Carlo Simulation of Environmental AirborneGamma-Spectrometry, Journal of Environmental Radioactivity, 38(3), 259-282.
Institut Géographique National (1989). Systèmes de référence et formules de transformation en usageen Belgique. NGI-IGN Report (May 1989), Brussels.
Sanderson, D.C.W. & Scott, E.M. (1989a). An aerial radiometric survey in West Cumbria in 1988,MAFF Food Science Report N611.
Sanderson, D.C.W., East, B.W., Scott, E.M. (1989b). Aerial radiometric survey of parts of NorthWales in July 1989, SURRC report 8901.
Sanderson, D.C.W., Scott, E.M., Baxter, M.S. (1990a). Use of Airborne Radiometric Measurementsfor Monitoring Environmental Radioactive Contamination, IAEA SM-306/138, 411-421, Vienna.
Sanderson, D.C.W, Scott, E.M., Baxter, M.S. (1990b). The use and potential of aerial radiometricsfor monitoring environmental radioactivity, in “Nuclear Contamination of Water Resources”, Institute ofCivil Engineers, pages 99-106.
Sanderson, D.C.W., Allyson, J.D., Martin, E., Tyler, A.N., Scott, E.M. (1990c). An Aerial Gamma-ray Survey of Three Ayrshire Districts. Commissioned by the District Councils of Cunninghame,Kilmarnock and Loudoun, and Kyle and Carrick, SURRC 9001.
Sanderson, D.C.W., Allyson, J.D., Cairns, K.J., MacDonald, P.A. (1990d). A brief aerial survey in thevicinity of Sellafield in September 1990, SURRC report 9101.
Sanderson, D.C.W. and Allyson, J.D. (1991). An aerial gamma ray search for a missing 137Cs sourcein the Niger Delta, SURRC report.
Sanderson, D.C.W., Allyson, J.D., Tyler, A.N. (1992). An aerial gamma ray survey of Chapelcross andits surroundings in February 1992, SURRC report 9201.
Sanderson D.C.W., Scott E.M., Baxter M.S., Martin E., Ni Riain S. (1993a). The use of aerialradiometrics for epidemiological studies of leukaemia, Scottish Universities Research & Reactor Centre,East Kilbride, 165p.
Sanderson, D.C.W., Allyson, J.D., Tyler, A.N. (1993b). An aerial gamma ray survey of Springfieldsand the Ribble Estuary in September 1992, SURRC report 9301.
Sanderson, D.C.W., Allyson, J.D., Tyler, A.N., Scott, E.M. (1994a). Environmental Applications ofAirborne Gamma Spectrometry. Application of Uranium Exploration Data and Techniques in
Environmental Studies, IAEA-TECDOC-827, 71-91.
28

Sanderson, D.C.W., Allyson, J.D., Tyler, A.N. (1994b). Rapid Quantification of Radiometric Data forAnthropogenic and Technologically Enhanced Natural Nuclides. Application of Uranium
Exploration Data and Techniques in Environmental Studies, IAEA-TECDOC-827, 197-216.
Sanderson D.C.W., Allyson J.D., Tyler A.N., Ni Riain S., Murphy S. (1994c). An Airborne GammaRay Survey of parts of SW Scotland, Scottish Universities Research & Reactor Centre, East Kilbride,118p.
Sanderson, D.C.W., Allyson, J.D., Riain, S. Ni, Gordon, G., Murphy, S., Fisk, S. (1994d). An AerialGamma Ray Survey of Torness Nuclear Power Station 27-30 March 1994. SURRC Report.
Sanderson, D.C.W., Allyson, J.D., Gordon, G., Murphy, S., Tyler, A.N., Fisk, S. (1994e). An AerialGamma Ray Survey of Hunterston Nuclear Power Station on 14-15th April and 4th May 1994. SURRCReport.
Sanderson, D.C.W., Allyson, J.D., Toivonen, H., Honkamaa, T. (1997a). Gamma Ray SpectrometryResults from Core Samples Collected for RÉSUMÉ 95, September 1995, Scottish UniversitiesResearch and Reactor Centre, East Kilbride, 51p.
Sanderson, D.C.W., Allyson, J.D., McConville, P., Murphy, S., Smith, J. (1997b). AirborneMeasurements Conducted during an International Trial in Finland. In: RÉSUMÉ 95: “. Published byNKS-Secretariat, FRIT, Denmark. pp237-253.
Sanderson, D.C.W., Cresswell, A.J., McLeod, J., Murphy, S., Tyler,A.N., Atkin,P.A. (2000).Investigation of Spatial and Temporal Aspects of Airborne Gamma Spectrometry. Report on Phase ISurvey Conducted April 1999. SURRC Report.
Tyler, A.N., Sanderson, D.C.W., Scott, E.M., Allyson, J.D. (1996a). Accounting for spatial variabilityand fields of view in environmental gamma-ray spectrometry. Journal of Environmental Radioactivity,33 (3), 213-235.
Tyler, A.N., Sanderson, D.C.W., Scott, E.M. (1996b). Estimating and accounting for 137Cs sourceburial through in-situ gamma spectrometry in salt marsh environments. Journal of EnvironmentalRadioactivity,33 (3), 195-212.
29

APPENDICES
Appendix A: Summary of Detector Calibration and Data Processing
Appendix B: Coordinate Transformation
Appendix C: Detailed Maps and Spectra

APPENDIX A: SUMMARY OF DETECTOR CALIBRATION AND DATA
PROCESSING
1. DESCRIPTION OF DATA PROCESSING ALGORITHMS
Selected windows in the NaI(Tl) spectra are integrated to produce gross count rates for these
channels. The standard windows used are given in Table A.1, along with a window around the
1001keV 234mPa peak which was used for analysis of data recorded around the FBFC International
site. Background count rates, recorded over water, are subtracted from the gross count rate data
to generate net count rates. The background values used for this survey are given in Table A.2.
Spectral interferences between channels are then stripped from the net count rate data. A
stripping matrix, giving the fractional interference for each nuclide window in the other nuclide
windows, is formed from data collected from a series of calibration pads with perspex absorber
sheets to simulate an air path of several 10s of metres. The stripping matrix used for this work,
measured in November 2000 with 7 absorber sheets, equivalent to 70m of air, is given in Table
A.3.
The inverse of the stripping matrix is applied to a vector containing the net count rates in each of
the five radionuclide channels, producing a vector containing the stripped counts in these
channels. This is readily coded as a series of linear equations in which the stripped count rate, Ys,
for channel k is the sum over all channels j of the products of the net count rate, Yn, for channel
j and the element for k, j of the inverted stripping matrix S�.
Altitude correction coefficients and sensitivity calibration constants are determined from hover
manoeuvres above a calibration site. The calibration site is systematically sampled in a spatially
representative expanding hexagonal pattern to give values of activity concentration for
anthropogenic 137Cs (kBq m-2) and naturally occurring 40K, 214Bi and 208Tl (Bq kg-1). In most
situations the naturally occurring radioisotopes are uniformly distributed with depth, however
for 137Cs more complex depth profiles are common and these will affect the calibration.
The altitude correction coefficients normalize the stripped data to a ground clearance of 100m,
using an exponential altitude dependence. The altitude corrected count rates, Yac
, are determined
from the stripped count rates, Ys, by:
where A is the ground clearance and acc
the altitude correction coefficient. The altitude correction
coefficient is determined from the gradient of a plot of the logarithm of stripped count rates
against altitude at the calibration site.
The sensitivity calibration constants convert the altitude corrected stripped count rates to
calibrated activity concentration units (kBq m-2 or Bq kg-1). They are determined by simply
dividing the activity concentration on the calibration site found from ground sampling by the
stripped altitude corrected count rates from the calibration manoeuvre data. Table A.4 shows the
altitude correction and sensitivity calibration constants used for this survey.
∑ ′=j
ns jkSjYkY ),()()(
ccaA
sac eYY)100( −=
A 1

The principle source of uncertainties for open field geometries is the statistical counting error in
the gross count rate. This could be reduced by using a longer integration time, but at the expense
of spatial precision of the reading. Typically in this survey using a 2s integration time these
correspond to uncertainties of approximately 5% for 137Cs, 10% for naturals and 2.5% for the
dose rate in the predominantly low activity areas outwith the nuclear sites. Within the sites where
activity levels are much higher these uncertainties will be significantly reduced.
In situations which closely match the assumed open field geometry with a radiation field
consisting of natural components and a small number of anthropogenic nuclides additional small
uncertainties will be introduced during spectral stripping and sensitivity calibration. However, in
situations where the source geometry and isotopic contribution differs significantly from this
these uncertainties may become significant. For example, the presence of other radioisotopes
would introduce additional errors in the spectral stripping, and may require the use of a different
set of windows and stripping matrix. Highly localised sources and local shielding would
introduce errors in the sensitivity calibration.
A 2

2. DETECTOR AND DATA COLLECTION SYSTEM
16 litre NaI(Tl) detector array (4 crystal pack):
Serial numbers: IA510, 022100AR, IV43, HR762
EHT: 1000V (nominal)
Single 50% efficiency Ge semiconductor (GMX) detector operated in parallel with scintillation
detector:
Serial number: 32-TN30665A (EHT: -3000V)
Table A.1 Spectral windows for NaI(Tl) detector
Table A.2 Background count rates (cps) recorded over water
A 3
wodniW edilcunoidaR egnarlennahC )Vek(egnaRygrenE
1 731 )Vek266(sC 631-501 557-055
2 06 )Vek2711(oC 012-571 0521-5101
3 04 )Vek1641(K 762-122 0361-0231
4 412 )Vek4671(iB 113-762 0291-0361
5 802 )Vek5162(lT 164-873 0292-5632
6 Vek053>latoT 005-57 0813-053
m432 )Vek1001(aP 581-051 0801-058
etaD 1.hC 2.hC 3.hC 4.hC 5.hC 6.hC
0002/5/01 1.04 5.71 7.02 7.9 2.7 561
0002/5/11 4.43 1.51 6.71 6.8 3.7 541
0002/5/21)0051(
0.36 7.52 3.52 1.61 8.8 532
0002/5/21)5102(
0.25 9.12 4.22 5.31 6.8 202

Table A.4 Calibration Constants
Each row indicates the fractional interferences between a nuclide and the other nuclides
represented in the columns.
Table A.3 Stripping ratios measured November 2000
wodniW edilcunoidaRedutitlAlaitnenopxE
m(tneiciffeoC 1- )noitarbilaCfoepolS
eniL
1 731 sC 2310.0 043.0
2 06 oC 110.0 0.1
3 04 K 00100.0 718.6
4 412 iB 16600.0 910.2
5 802 lT 86700.0 575.0
6esodammag
etar54900.0 7000.0
731 sC 06 oC 04 K 412 iB 802 lT
731 sC 1 500.0 0 0 0
06 oC 15.0 1 25.0 730.0 420.0
04 K 76.0 94.0 1 0 0
412 iB 73.3 25.1 69.0 1 570.0
802 lT 35.2 96.0 26.0 54.0 1
A 4

etaD166tanoituloseR
)%(VeKssorG 731 tnuocsC
etarteN 731 etartnuocsC
0002/5/8 2.9 4012 2461
0002/5/01 1.9 6012 9461
0002/5/11 0.9 5802 8361
0002/5/21 2.9 1822 0261
0002/5/31 4.9 9322 6261
emaneliftooR etaD emiT selifforebmuN stnemmoC
1ALOM 0002/5/01 0301-0390 796ecnassiannoceR
thgilf
2ALOM 0002/5/01 0511-5011 435
3ALOM 0002/5/11 5390-5180 669
4ALOM 0002/5/11 5101-5390 964
5ALOM 0002/5/11 0521-5011 999
6ALOM 0002/5/11 5521-0521 06
7ALOM 0002/5/11 0071-0361 262
1AERI 0002/5/21 0551-0541 177
2AERI 0002/5/21 5181-0561 079
3AERI 0002/5/21 5281-5181 09
4AERI 0002/5/21 5302-0091 888
Table A.5 16 litre Nal(Tl) detector daily performance check
Table A.6 Summary of survey data files
A 5

APPENDIX B: COORDINATE TRANSFORMATION
1. INTRODUCTION
Data recorded by the Airborne Gamma Spectrometry system deployed by the SURRC team uses
a Navstar GPS to log the position of each measurement. This unit was set to record position as
latitude and longitude in the WGS84 datum, although other datums are available this unit can not
give the position in a more suitable datum. For the purposes of mapping the data recorded by this
system it is necessary to convert the position from WGS84 to the Belgium National Grid. This
grid is defined by a latitude and longitude from a Hayford ellipsoid. There are two steps in the
conversion from WGS84 to the national grid; conversion to the Hayford ellipsoid, and then to the
national grid.
2. WGS84 TO HAYFORD ELLIPSOID
The conversion of latitude and longitude in the WGS84 datum to the Hayford ellipsoid is a three
step process; the WGS84 latitude and longitude is converted to a 3D Cartesian coordinate, a
Helmert transformation is then applied to convert these 3D Cartesian coordinates to 3D
Cartesian coordinates on the Hayford ellipsoid, which are then converted back to latitude and
longitude in the Hayford ellipsoid.
For any ellipsoid defined by a semi-major axis length a and eccentricity squared e2, 3D Cartesian
coordinates (X,Y,Z) are obtained from latitude ( ) and longitude ( ) by:
where
For the WGS84 datum a=6378138m and e2=0.006694380.
The Helmert transformation assumes that the rotational parameters rX, r
Y, r
Z (angles in radians)
about the X,Y and Z axes are small. The Cartesian coordinates of a point in system B are derived
from Cartesian coordinates in system A by:
λφν coscos=X
λφν sincos=Y
φν sin)1(2
eZ −=
φν
22 sin1 e
a
−=
A
xy
xz
yz
z
y
x
B
z
y
x
srr
rsr
rrs
y
t
t
z
y
x
+−−+
−++
=
1
1
1
B 1

where tX, t
Y and t
Z are translations along the X,Y and Z axes, and s is a scale factor. For the
transformation between WGS84 and the Hayford ellipsoid these parameters are:
The 3D Cartesian coordinates in the Hayford ellipsoid produced by this transformation are then
converted back into latitude and longitude by:
where for the Hayford ellipsoid, e2=0.00672267.
3. HAYFORD ELLIPSOID TO BELGIUM NATIONAL GRID
The algorithm to convert from the Hayford ellipsoid to the Belgium grid was developed from
equations given in the report by the Institut Géographique National (1989).
The Hayford ellipsoid is defined by a major axis radius a=6378388 m with a deformation f=1/
297. The Belgium grid is based on a Lambert projection, defined by n = 0.7716421928 and K =
11565915.812935 and a reference meridian 0 = 4°21�24"983. The rotational transformation
parameter = 29"2985 and translational parameters X = 0.01256 m and Y = 88.4378 m.
The transformation from latitude and longitude ( , ) to the Belgium grid position (X, Y) is given
by:
where
retemaraP rx
ry
rz
tx
ty
tz
s
eulaV dar914.0- dar038.0 dar588.1- m950.99 m223.35- m684.211 999999.0
=
X
Yarctanλ
−
=Xe
Z
)1(
cosarctan
2
λφ
( )αθ −+∆+= sin150000 RXX
( )αθ −−∆+= sin5400000 RYY
( )nzKR2
tan=
( )2
sin1
sin1tantan
242
e
e
ez
−+
−=φφφπ
)1( fab −=
)( 0λλθ −= n
B 2

These equations were encoded in a program which was tested by comparing the results of the
resulting code with the output from a website incorporating a Javascript transformation (http:/
/web.inter.nl.net/hcc/Ed.Stevenhagen/groeven/geo/lambert1.htm). The conversion from the
Hayford ellipsoid to the Belgian grid using the algorithm above and the website agreed to within
50cm. The conversion between WGS84 and the Hayford ellipsoid and hence to the Belgian
national grid were included into the standard analysis program used for AGS data.
2
222
a
bae
−=
B 3

APPENDIX C: DETAILED MAPS AND SPECTRA
Appendix C contains detailed maps for each site and a brief discussion of their main features.
Each site is represented by a short series of maps. This page lists the site index. The individual
maps for each site are listed together with a short discussion at the beginning of each section.
The purpose of these maps is to provide more spatial detail of the configuration of the different
sites in relation to the radiation fields observed in the survey. Since the nature and levels of
radiation associated with individual sites differ markedly, it is not considered practicable to
produce a single set of colour scales appropriate to each nuclide and site. For comparative
purposes the general maps in the main report may be of greater interest. The detailed maps
produced here attempt to illustrate the local configuration of the most pronounced or relevant
features associated with each site. As pointed out in section 2.4 the numerical data set serves as
the primary source of further detailed information.
1 Belgian Nuclear Research Centre (SCK-CEN) Site...............................................................C 2
2 Belgoprocess Site..................................................................................................................C 7
3 FBFC Site............................................................................................................................C 20
4 IRMM Site..........................................................................................................................C 27
5 IRE Site...............................................................................................................................C 32
C 1

1. BELGIAN NUCLEAR RESEARCH CENTRE (SCK-CEN) SITE
During the morning of the 10th May the BR1 reactor was operating, and as a result was releasing41Ar into the atmosphere. Spectra recorded down wind of the reactor at that time clearly show the
1293.6 keV 41Ar peak, which produces radiometric signals influencing 40K, 60Co, 137Cs and the
gamma dose rate maps. Figure C.1 shows the gamma dose rate map for the site in greater detail.
Whereas the largest radiometric feature in this map originates from Belgoprocess site 2, in the
vicinity of the BR2 and BR3 reactors; the main signals due to current activities from SCK-CEN
are located at the western side of the site. Figure C.2 shows spectra recorded during BR1
operations, with clear registration of 41Ar, and also summed spectra at the plots of land
deliberately contaminated by 134Cs and other short lived nuclides for agricultural research
purposes. Figures C.3 and C.4 show respectively the area to the west of the site both while the
BR1 reactor was operating, and at times when it was not. The first of these shows the 41Ar signal
clearly, while the latter shows the signals associated with the agricultural research plots clearly
in the absence of 41Ar.
FIGURES
Figure C.1 Gamma-dose rate map for the area surrounding the SCK-CEN site, C 3
incorporating observations affected by 41Ar released from BR1
Figure C.2 Gamma-ray spectra in the vicinity of SCK-CEN showing (i) 41Ar C 4
from the BR1 reactor, (ii) 134Cs from labelled cultivation plots near the site
Figure C.3 Gamma-dose rate map showing interference from the 41Ar plume from BR1. C 5
Note that the dose rate calibration is based on a terrestrial radionuclide distribution, and
therefore does not quantify the dose rate due to 41Ar at ground level
Figure C.4 Gamma-dose rate map in the location of figure C.3, when BR1 is not C 6
operating, showing the position of the labelled cultivation plots to the west of the
SCK-CEN site.
C 2

Fig
ure
C.1
Gam
ma-
do
se r
ate
map
fo
r th
e ar
ea s
urr
ou
nd
ing
th
e S
CK
-CE
N s
ite,
in
corp
ora
tin
g
ob
serv
atio
ns
affe
cted
by
41A
r re
leas
ed f
rom
BR
1
C 3
BR
2
Belg
op
rocess
BR
3
gp
BR
1
SC
K-C
EN
Belg
oN
ucle
air
e
lsFC
201.0
200.5
201.5
199.0
199.5
200.0
211.5
212.0
212.5
213.0
Calib
ration b
ased o
n infinite
pla
nar
sourc
e g
eom
etr
y

Figure C.2 Gamma-ray spectra in the vicinity of SCK-CEN showing (i) 41Ar from the BR1
reactor, (ii) 134Cs from labelled cultivation plots near the site
GM
X C
ou
nt
rate
(cp
s)
0.01
0.1
1
10
NaI(
Tl)
Co
un
t R
ate
(cp
s)
0.01
0.1
1
10
1004
0K
41A
r
208T
l
Energy (keV)
0 500 1000 1500 2000 2500 3000
0.1
1
0.1
1
10
100
(i)
(ii)
208T
l
40K
134C
s
C 4
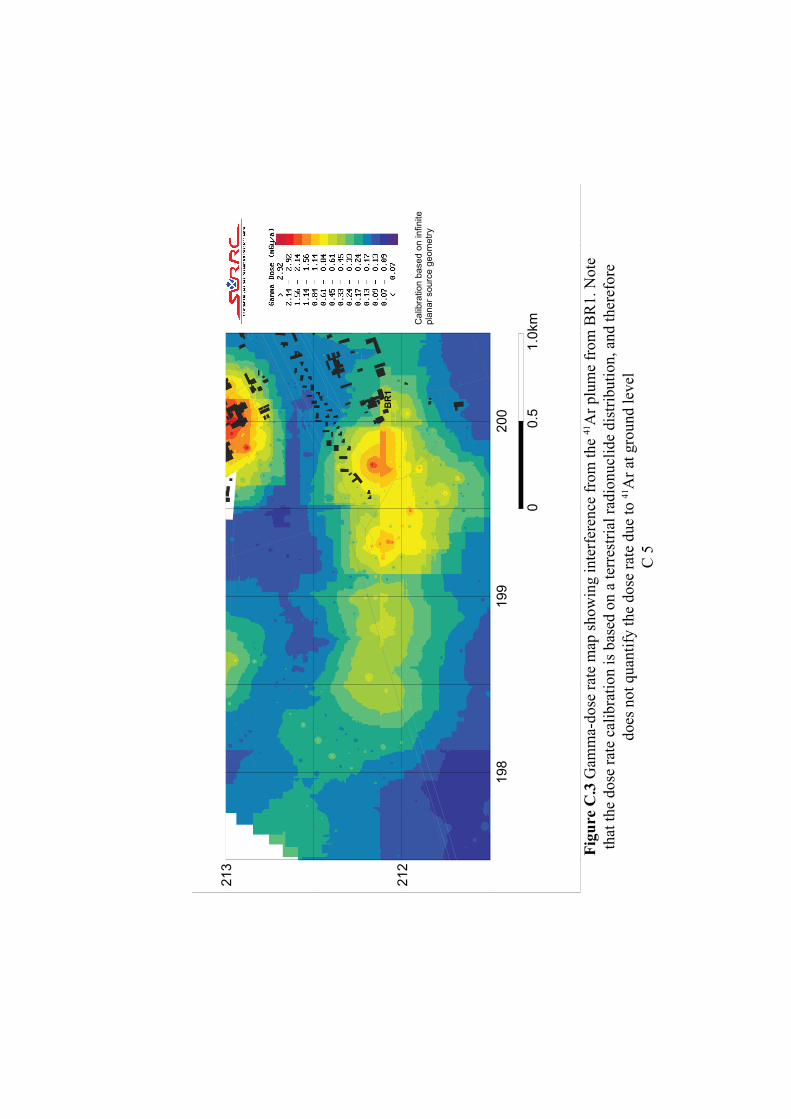
Fig
ure
C.3
Gam
ma-
dose
rat
e m
ap s
how
ing i
nte
rfer
ence
fro
m t
he
41A
r plu
me
from
BR
1. N
ote
that
th
e d
ose
rat
e ca
lib
rati
on
is
bas
ed o
n a
ter
rest
rial
rad
ion
ucl
ide
dis
trib
uti
on
, an
d t
her
efo
re
do
es n
ot
qu
anti
fy t
he
do
se r
ate
du
e to
41A
r at
gro
un
d l
evel
C 5
BR
3
BR
1
19
9
00.5
1.0
km
20
019
8
212
213
Ca
libra
tio
n b
ase
d o
n in
fin
ite
pla
na
r so
urc
e g
eo
me
try

Fig
ure
C.4
Gam
ma-
do
se r
ate
map
in
th
e lo
cati
on
of
fig
ure
C.3
, w
hen
BR
1 i
s n
ot
op
erat
ing
,
sho
win
g t
he
po
siti
on
of
the
lab
elle
d c
ult
ivat
ion
plo
ts t
o t
he
wes
t o
f th
e S
CK
-CE
N s
ite.
C 6
BR
3
BR
1
19
9
00
.51
.0km
20
01
98
21
2
21
3
Ca
libra
tio
n b
ase
d o
n in
fin
ite
pla
na
r so
urc
e g
eo
me
try

2. BELGOPROCESS SITE
The two Belgoprocess sites have different radiometric characteristics as shown in the succeeding
figures.
Belgoprocess site 1, to the north of the Kanaal Bocholt-Herentals, shows strong signals due to137Cs, 60Co and U series activity, in proportions which change in different parts of the site. Figure
C.5 shows spectra recorded on the western, central and eastern parts of the site; whereas 60Co and
uranium derived signals are present in central and western areas, the eastern areas show relatively
greater proportions of 137Cs. The extent of shielding of these sources can also be judged by the
extent of forward scattering around the 137Cs peaks, indicating the presence of massive shielding
in particular in the eastern features. Figures C.6, C.7 and C.8 shows the distribution of 137Cs, 60Co
and 214Bi on the site. 137Cs is distributed more evenly across the central and eastern parts of the
site than 60Co and 214Bi which mainly occupy central areas. The apparently low level of 214Bi on
the western side of the site may be related to the combination of source distribution and radiation
scattering in the vicinities of buildings. The possibility that part of this signal is associated with
the release of 222Rn from Belgoprocess site 2, and its weather-related entrainment in buildings
should also be considered. The dose rate within this site is driven largely by 60Co distribution,
which is concentrated around the centre of the site.
Belgoprocess site 2, in the NE areas of the SCK-CEN complex includes facilities for the storage
of low level nuclear waste, and shows very strong signals due to 137Cs, 60Co and U and Th series
activity. Spectra are shown in figures C.10 which indicate the presence of these nuclides, and also
the high intensities of scattered radiation associated with the facilities. Whereas the Ge detectors
maintain good spectral performance despite the high radiation levels recorded, there is evidence
of spectral distortion, coincidence summing, and high levels of scattered radiation in the NaI
detectors. This provides clear confirmation of the value of Ge detectors for work in areas with
substantially enhanced radiation fields. The maps in figures C.11 to C.15 show the distributions
of 137Cs, 60Co, 214Bi, 208Tl and gamma dose rate respectively at site 2. 214Bi activity is high across
the entire site, resulting from continuous discharges of gaseous 222Rn from radium wastes stored
in buildings on the site. 137Cs and 60Co activity is more localised around the central and northern
parts of the site, with the Co activity relatively higher in the northern part. There is a strong 208Tl
signal in the south of the site from a more localised source.
FIGURES
Figure C.5 Gamma-ray spectra for three areas within Belgoprocess site 1 C 9
Figure C.6 137Cs signal distribution around Belgoprocess site 1, as measured from the C 10
airborne survey. Note that source geometries, shielding and local configurations are
relevant to interpretation.
Figure C.7 60Co signal distribution around Belgoprocess site 1, as measured from the C 11
airborne survey. Note that source geometries, shielding and local configurations are
relevant to interpretation.
Figure C.8 214Bi signal distribution around Belgoprocess site 1, as measured from the C 12
airborne survey. Note that source geometries, shielding and local configurations are
relevant to interpretation.
C 7

Figure C.9 Gamma-ray dose rate distribution around Belgoprocess site 1, as measured C 13
from the airborne survey. Note that source geometries, shielding and local configurations
are relevant to interpretation.
Figure C.10 Gamma-ray spectra for two areas within Belgoprocess site 2 C 14
Figure C.11 137Cs signal distribution around Belgoprocess site 2, as measured from the C 15
airborne survey. Note that source geometries, shielding and local configurations are
relevant to interpretation.
Figure C.12 60Co signal distribution around Belgoprocess site 2, as measured from the C 16
airborne survey. Note that source geometries, shielding and local configurations are
relevant to interpretation.
Figure C.13 214Bi signal distribution around Belgoprocess site 2, as measured from the C 17
airborne survey. Note that source geometries, shielding and local configurations are
relevant to interpretation.
Figure C.14 208Tl signal distribution around Belgoprocess site 2, as measured from the C 18
airborne survey. Note that source geometries, shielding and local configurations are
relevant to interpretation.
Figure C.15 Gamma-ray dose rate distribution around Belgoprocess site 2, as measured C 19
from the airborne survey. Note that source geometries, shielding and local configurations
are relevant to interpretation.
C 8

Figure C.5 Gamma-ray spectra for three areas within Belgoprocess site 1
Energy (keV)
0 500 1000 1500 2000 2500 3000
0.1
1
10
0.1
1
10
100
GM
X C
ou
nt
rate
(c
ps
)
0.1
1
10
0.1
1
10
100
0.1
1
NaI(
Tl)
Co
un
t R
ate
(cp
s)
0.1
1
10
100
West of site
Centre of site
13
7C
s
60C
o6
0C
o
East of site
40K
20
8T
l2
08T
l2
08T
l
13
7C
s1
37C
s
60C
o6
0C
o
60C
o6
0C
o40K
40K
C 9

Fig
ure
C.6
137C
s si
gn
al d
istr
ibu
tio
n a
rou
nd
Bel
go
pro
cess
sit
e 1
, as
mea
sure
d f
rom
th
e ai
rbo
rne
surv
ey. N
ote
th
at
sou
rce
geo
met
ries
, sh
ield
ing
an
d l
oca
l co
nfi
gu
rati
on
s ar
e re
lev
ant
to i
nte
rpre
tati
on
.
C 1
0
25
0
20
0.5
05
00
m
20
0.0
19
9.5
212.5
213.0
213.5
Calib
ration b
ased o
n infinite
pla
nar
sourc
e g
eom
etr
y
Me
asu
rem
en
t ce
ntr
e

Fig
ure
C.7
60C
o s
ign
al d
istr
ibu
tio
n a
rou
nd
Bel
go
pro
cess
sit
e 1, as
mea
sure
d f
rom
the
airb
orn
e su
rvey
. N
ote
th
at s
ou
rce
geo
met
ries
, sh
ield
ing
an
d l
oca
l co
nfi
gu
rati
on
s ar
e re
lev
ant
to i
nte
rpre
tati
on
.
C 1
1
25
0
20
0.5
05
00
m
20
0.0
19
9.5
212.5
213.0
213.5
Measu
rem
ent
centr
e
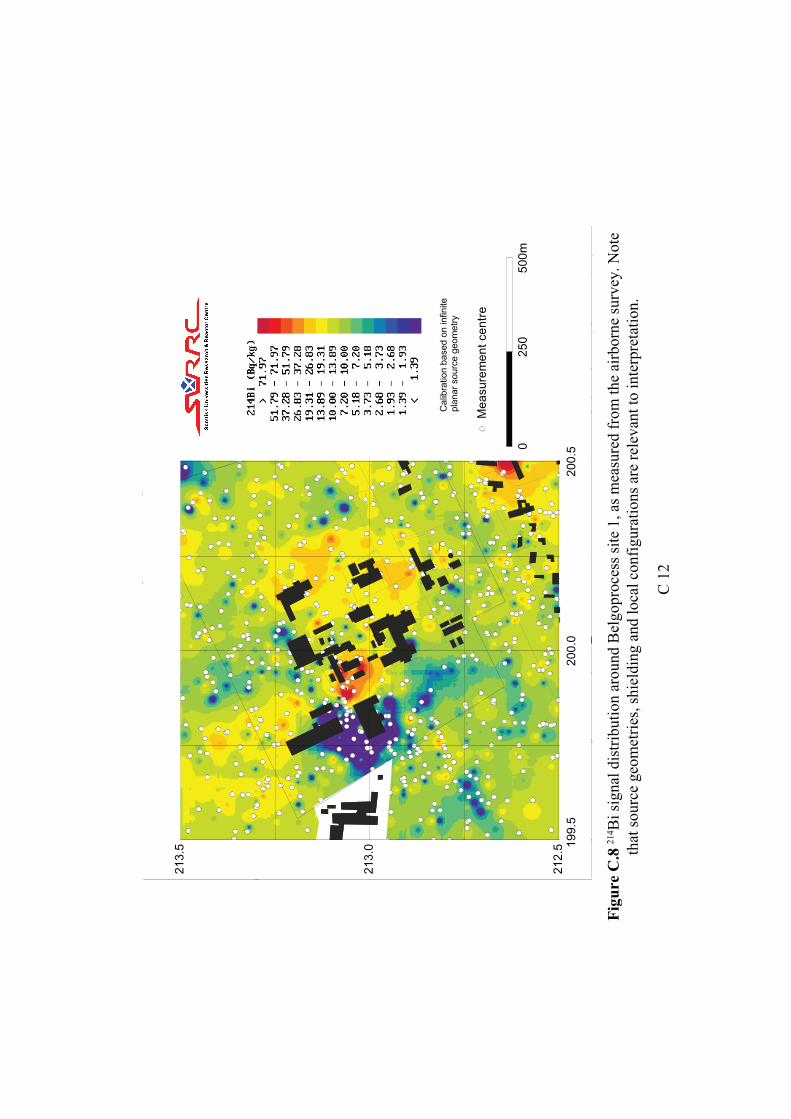
Fig
ure
C.8
214B
i si
gn
al d
istr
ibu
tio
n a
rou
nd
Bel
go
pro
cess
sit
e 1
, as
mea
sure
d f
rom
th
e ai
rbo
rne
surv
ey. N
ote
that
so
urc
e g
eom
etri
es, sh
ield
ing
an
d l
oca
l co
nfi
gura
tio
ns
are
rele
van
t to
in
terp
reta
tio
n.
C 1
2
25
0
20
0.5
05
00
m
20
0.0
19
9.5
212.5
213.0
213.5
Calib
ration b
ased o
n infinite
pla
nar
sourc
e g
eom
etr
y
Me
asu
rem
en
t ce
ntr
e

Fig
ure
C.9
Gam
ma-
ray d
ose
rat
e d
istr
ibu
tio
n a
rou
nd
Bel
go
pro
cess
sit
e 1
, as
mea
sure
d f
rom
th
e ai
rbo
rne
surv
ey. N
ote
th
at s
ou
rce
geo
met
ries
, sh
ield
ing
an
d l
oca
l co
nfi
gu
rati
on
s ar
e re
lev
ant
to i
nte
rpre
tati
on.
C 1
3
25
0
20
0.5
05
00
m
20
0.0
19
9.5
212.5
213.0
213.5
Calib
ration b
ased o
n infinite
pla
nar
sourc
e g
eom
etr
y
Me
asu
rem
en
t ce
ntr
e

GM
X C
ou
nt
rate
(c
ps)
0.1
1
10
NaI(
Tl)
Co
un
t R
ate
(cp
s)
1
10
100
1000
Energy (keV)
0 500 1000 1500 2000 2500 3000
0.1
1
10
1
10
100
1000
South of site
North of site
137C
s
60C
o
214B
i
137C
s
60C
o
60C
o60C
o
Figure C.10 Gamma-ray spectra for two areas within Belgoprocess site 2
C 14
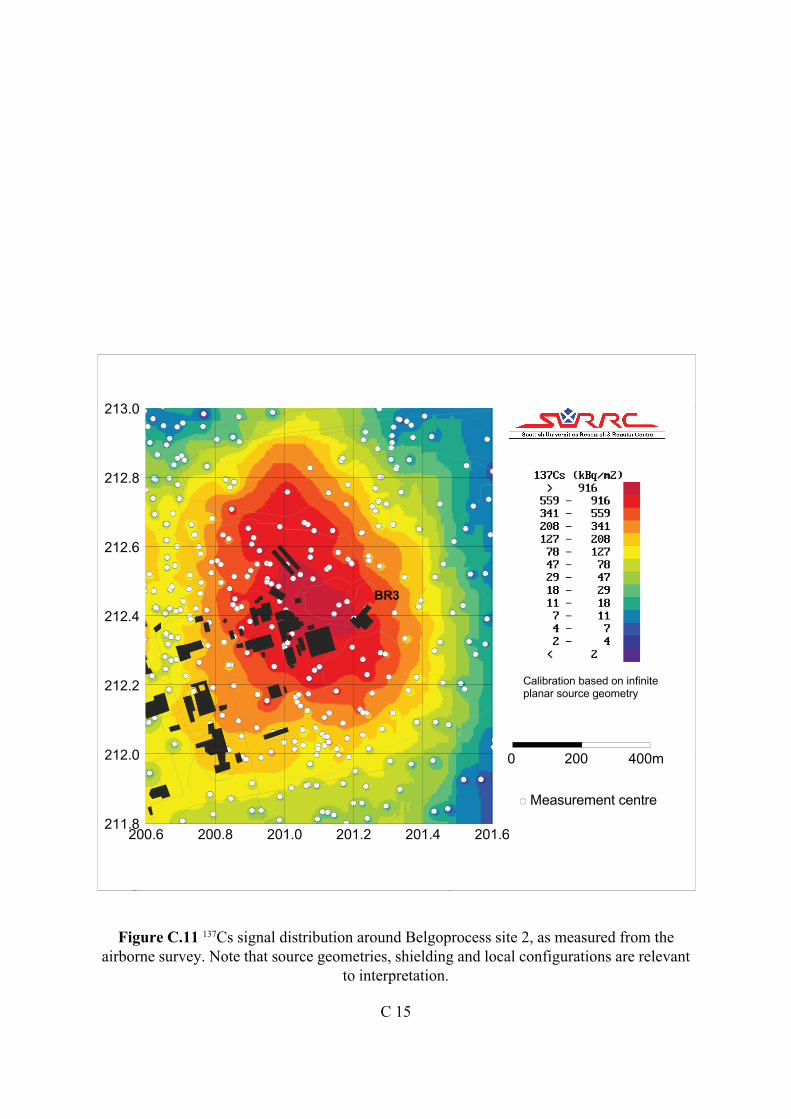
Figure C.11 137Cs signal distribution around Belgoprocess site 2, as measured from the
airborne survey. Note that source geometries, shielding and local configurations are relevant
to interpretation.
C 15
BR3
201.2 201.4 201.6
400m0 200
201.0
212.0
200.8200.6
212.2
211.8
212.8
213.0
212.4
212.6
Calibration based on infiniteplanar source geometry
Measurement centre

Figure C.12 60Co signal distribution around Belgoprocess site 2, as measured from the
airborne survey. Note that source geometries, shielding and local configurations are relevant
to interpretation.
C 16
BR3
201.2 201.4 201.6
400m0 200
201.0
212.0
200.8200.6
212.2
211.8
212.8
213.0
212.4
212.6
Measurement centre
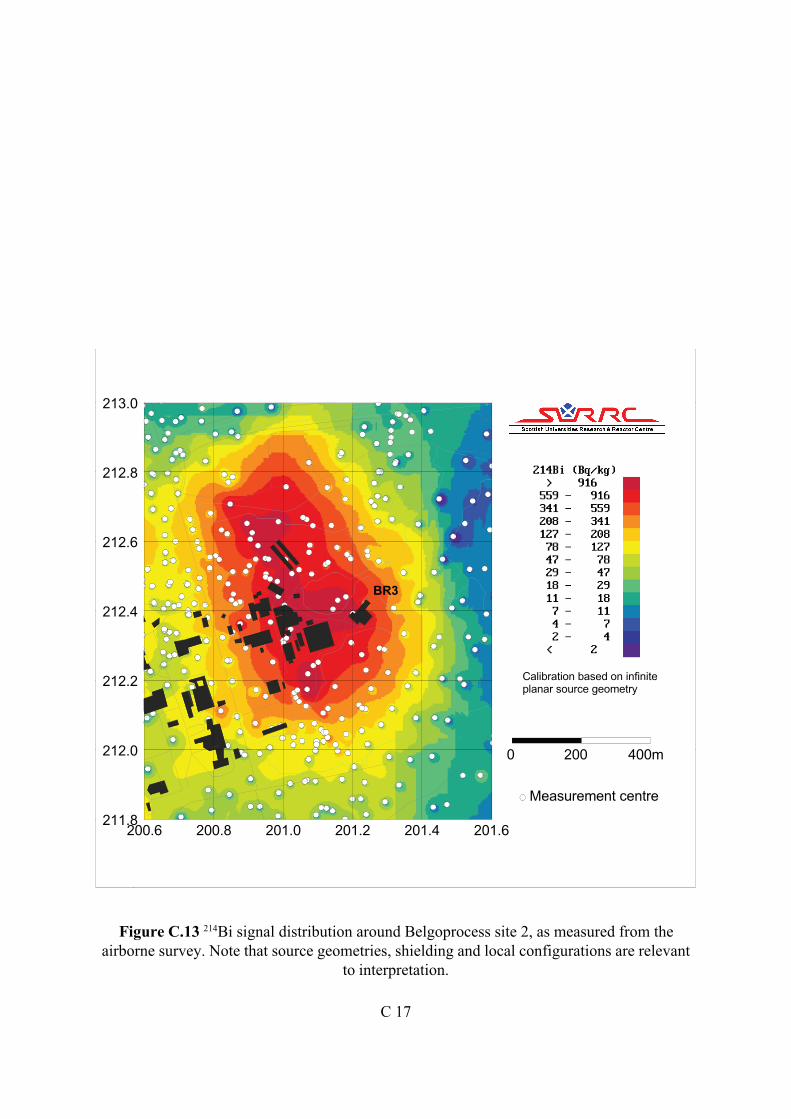
Figure C.13 214Bi signal distribution around Belgoprocess site 2, as measured from the
airborne survey. Note that source geometries, shielding and local configurations are relevant
to interpretation.
C 17
BR3
201.2 201.4 201.6
400m0 200
201.0
212.0
200.8200.6
212.2
211.8
212.8
213.0
212.4
212.6
Calibration based on infiniteplanar source geometry
Measurement centre

Figure C.14 208Tl signal distribution around Belgoprocess site 2, as measured from the
airborne survey. Note that source geometries, shielding and local configurations are relevant
to interpretation.
C 18
BR3
201.2 201.4 201.6
400m0 200
201.0
212.0
200.8200.6
212.2
211.8
212.8
213.0
212.4
212.6
Calibration based on infiniteplanar source geometry
Measurement centre

Figure C.15 Gamma-ray dose rate distribution around Belgoprocess site 2, as measured from
the airborne survey. Note that source geometries, shielding and local configurations are
relevant to interpretation.
C 19
BR3
201.2 201.4 201.6
400m0 200
201.0
212.0
200.8200.6
212.2
211.8
212.8
213.0
212.4
212.6
Calibration based on infiniteplanar source geometry
Measurement centre

3. FBFC SITE
The FBFC fuel fabrication site shows signals due to 137Cs and U series activity and some activity
in the spectral window normally associated with 60Co. The spectra recorded over the FBFC do not
include any 60Co gamma-ray peaks but do include gamma -rays for 234mPa at 1001.0 keV from
refined uranium, part of this peak is within the window used for 60Co and generates an apparent
signal due to 60Co within the FBFC site. Figure C.16 shows spectra from the FBFC site, showing
clear evidence of 662 keV radiation, normally attributed to 137Cs, 234mPa, and enhanced levels of214Bi relative to normal natural abundances. The data for this site were reanalysed, using a
window for 234mPa instead of 60Co and revised stripping matrix including the 234mPa interferences.
Figure C.17 shows the 662 keV signal distribution after correcting for the presence of 234mPa,
showing low levels of equivalent 137Cs activity(1) on the southern side of the site. The 662 keV
signals are most probably associated with MOX materials on site. Figure C.18 shows the 234mPa
signal distribution which is largely associated with the eastern side of the site. The 214Bi signal in
figure C.19 is considered to be due to uranium or radium bearing materials associated with past
or present activities on site. The gamma dose rate distribution shown in figure C.20 is probably
mainly due to the uranium based materials on site.
(1) Equivalent activity of 137Cs (kBq m-2) represents the activity per unit area of 137Cs which would
give rise to the observed signal levels under open field conditions.
C 20

FIGURES
Figure C.16 Gamma-ray spectra from the FBFC site showing evidence of 234mPa and C 22
662 keV radiation in addition to naturally occurring components
Figure C.17 137Cs equivalent activity distribution around the FBFC site C 23
Figure C.18 234mPa signal distribution around the FBFC site C 24
Figure C.19 214Bi signal distribution around the FBFC site C 25
Figure C.20 Gamma-ray dose rate distribution around the FBFC site C 26
C 21

Energy (keV)0 500 1000 1500 2000 2500 3000
GM
X C
ou
nt
rate
(cp
s)
0.1
1
10
NaI(
Tl)
Co
un
t R
ate
(cp
s)
0.1
1
10
100
40K
21
4B
i
20
8T
l
23
4mP
a
662keV
Figure C.16 Gamma-ray spectra from the FBFC site showing evidence of 234mPa and 662 keV
radiation in addition to naturally occuring components
C 22

Fig
ure
C.1
7 1
37C
s eq
uiv
alen
t ac
tiv
ity
dis
trib
uti
on
aro
un
d t
he
FB
FC
sit
e.
C 2
3
19
9.0
20
0400m
19
8.8
21
3.0
0
19
8.6
19
8.4
19
8.2
21
2.8
21
3.2
21
3.4
Calib
ration b
ased o
n infinite
pla
na
r so
urc
e g
eo
me
try
Me
asu
rem
en
t ce
ntr
e

Fig
ure
C.1
8 2
34mP
a si
gn
al d
istr
ibu
tio
n a
rou
nd t
he
FB
FC
sit
e.
199.0
200
400m
198.8
213.0
0
198.6
198.4
198.2
212.8
213.2
213.4
Calib
ration b
ased o
n infinite
pla
nar
sourc
e g
eom
etr
y
Measure
ment centr
e

Fig
ure
C.1
9 2
14B
i si
gn
al d
istr
ibu
tio
n a
rou
nd
th
e F
BF
C s
ite
C 2
5
199.0
200
400m
198.8
213.0
0
198.6
198.4
198.2
212.8
213.2
213.4
Calib
ration b
ased
on infinite
pla
nar
sou
rce g
eom
etr
y
Measu
rem
ent
centr
e

Fig
ure
C.2
0 G
amm
a-ra
y d
ose
rat
e d
istr
ibu
tio
n a
rou
nd
th
eFB
FC
sit
e
C 2
6
19
9.0
200
400m
198.8
213.0
0
198.6
198.4
198.2
212.8
213.2
213.4
Ca
libra
tion b
ased
on infinite
pla
nar
sourc
e g
eom
etr
y
Measure
ment
centr
e

4. IRMM SITE
The IRMM site to the south of the survey area contains two accelerators, a LINAC and a Van de
Graaff. Slightly enhanced signals in the 208Tl, 137Cs and gamma-dose rate channels were observed
associated with the LINAC.
FIGURES
Figure C.21 Gamma-ray spectra recorded in the vicinity of the IRMM LINAC C 28
Figure C.22 137Cs signal distribution around the IRMM site. Note that the low level C 29
anomalies seen at this scale are not due to 137Cs, but arise as a consequence
of spectral interference from activation products and scattered radiation generated in
the vicinity of the LINAC accelerator
Figure C.23 208Tl signal distribution around the IRMM site. Note that the anomaly is C 30
attributed to the presence of high energy scattered radiation in the vicinity of the
LINAC accelerator
Figure C.24 Gamma-ray dose rate distribution around the IRMM site C 31
C 27

Figure C.21 Gamma-ray spectra recorded in the vicinity of the IRMM LINAC
Energy (keV)0 500 1000 1500 2000 2500 3000
GM
X C
ou
nt
rate
(cp
s)
0.1
1
NaI(
Tl)
Co
un
t R
ate
(cp
s)
0.01
0.1
1
10
100
40K
21
4B
i
20
8T
l
21
4P
b5
11
22
8A
c
21
4B
i
C 28

Fig
ure
C.2
2 1
37C
s si
gn
al d
istr
ibu
tio
n a
rou
nd
th
e IR
MM
sit
e. N
ote
th
at t
he
low
lev
el a
no
mal
ies
are
no
t d
ue
to 1
37C
s, b
ut
aris
e as
a
con
seq
uen
ce o
f sp
ectr
al i
nte
rfer
ence
fro
m a
ctiv
atio
n p
rod
uct
s an
d s
catt
ered
rad
iati
on
gen
erat
ed i
n t
he
vic
init
y o
f th
e L
INA
C a
cce
lera
tor
C 2
9
LIN
AC
Va
n d
e G
raa
ff
19
7.4
19
7.6
02
00
40
0m
19
7.2
19
7.0
210
.0
210
.2
20
9.8
20
9.4
20
9.6 19
6.8
Calib
ration b
ased o
n infinite
pla
nar
sourc
e g
eom
etr
y
Measure
ment centr
e

Fig
ure
C.2
3 2
08T
l si
gn
al d
istr
ibu
tio
n a
rou
nd
th
e IR
MM
sit
e. N
ote
th
at t
he
ano
mal
y i
s at
trib
ute
d t
o t
he
pre
sen
ce o
f h
igh
ener
gy
sca
tter
ed r
adia
tio
n i
n t
he
vic
init
y o
f th
e L
INA
C a
ccel
erat
or
C 3
0
LIN
AC
Va
n d
e G
raa
ff
19
7.4
19
7.6
02
00
40
0m
19
7.2
19
7.0
210
.0
210
.2
20
9.8
20
9.4
20
9.6 19
6.8
Calib
ration b
ased o
n infinite
pla
nar
sourc
e g
eom
etr
y
Measure
ment centr
e

Fig
ure
C.2
4 G
amm
a-ra
y d
ose
rat
e d
istr
ibu
tio
n a
rou
nd t
he
IRM
M s
ite
C 3
1
LIN
AC
Va
n d
e G
raa
ff
19
7.4
19
7.6
02
00
40
0m
19
7.2
19
7.0
210
.0
210
.2
20
9.8
20
9.4
20
9.6 19
6.8
Calib
ration b
ased o
n infinite
pla
nar
sourc
e g
eom
etr
y
Measure
ment centr
e

5. IRE SITE
The distribution of anthropogenic activity is almost exclusively confined to the IRE site, with a
small unidentified 137Cs source to the north of the site. Outside the IRE site the radiation field is
almost entirely natural, with a small contribution from 137Cs that could be attributed to weapons
testing fallout with a possible contribution from Chernobyl.
Activity on the site is associated with the radiochemistry laboratories and waste stores. Figure
C.25 shows spectra. Again the merits of the combined NaI-Ge spectrometer are apparent. The Ge
detector shows characteristic lines from 133Xe, 131I and 99Mo at levels which cannot be readily
distinguished using the NaI spectra. The anomalies present in the maps of 137Cs and 60Co and
gamma dose rate in figures C.26, C.27 and C.28 based on NaI(Tl) spectra include contributions
from these isotopes.
The site includes two potentially large radiation sources which do not contribute to the observed
activity levels determined by the NaI(Tl) spectrometry system; a 30 MeV cyclotron and a 3 MCi60Co irradiator. An analysis was made of the low energy (<300 keV) component of the spectra
recorded with the GMX spectrometer. Figure C.29 shows the net count rate for this part of the
GMX spectra over the IRE site, which does show additional low energy features associated with
the cyclotron and 60Co irradiators. These signals are due to scattered radiation from very well
shielded sources.
FIGURES
Figure C.25 Gamma-ray spectra from the IRE site C 33
Figure C.26 137Cs signal distribution within the IRE site C 34
Figure C.27 60Co signal distribution within the IRE SITE. Note that the anomaly is not C 35
located above the shielded 60Co irradiator. It may reflect the presence of other nuclides
with photon emission in the 1-1.5 MeV energy range associated with the
radiochemical laboratories or waste stores.
Figure C.28 Gamma-ray dose rate distribution within the IRE site C 36
Figure C.29 Net counts in the GMX detector <300 keV within the IRE site C 37
C 32

Energy (keV)
0 500 1000 1500 2000 2500 3000
GM
X C
ou
nt
rate
(cp
s)
0.1
1
10
NaI(
Tl)
Co
un
t R
ate
(cp
s)
0.1
1
10
100
40K
20
8T
l
13
7C
s9
9M
o
13
1I
21
4B
i2
14B
i
21
4B
i
1236
1333
13
3mX
e
Figure C.25 Gamma-ray spectra from the IRE site
C 33

Fig
ure
C.2
6 1
37C
s si
gn
al d
istr
ibu
tio
n w
ith
in t
he
IRE
sit
e
C 3
4
16
2.2
16
2.4
20
04
00
m0
16
2.0
16
1.8
16
1.6
126
.2
126
.4
126
.8
126
.6
127.0
Calib
ration b
ased o
n infinite
pla
nar
sourc
e g
eom
etr
y
Co irr
adia
tor
Cyclo
trons
Waste
sto
re
60
Radio
chem
istr
yLabora
tory
sta
ck
Measure
ment centr
e

Fig
ure
C.2
7 6
0C
o s
ign
al d
istr
ibu
tio
n w
ith
in t
he
IRE
sit
e. N
ote
th
at t
he
ano
mal
y i
s n
ot
loca
ted
ab
ov
e th
e sh
ield
ed 6
0C
o
irra
dia
tor.
It
may
ref
lect
th
e p
rese
nce
of
oth
er n
ucl
ides
wit
h p
ho
ton
em
issi
on
in
th
e 1
-1.5
MeV
en
erg
y r
ang
e as
soci
ated
wit
h t
he
rad
ioch
emic
al l
abo
rato
ries
or
was
te s
tore
s.
C 3
5
16
2.2
16
2.4
20
0400
m0
16
2.0
16
1.8
16
1.6
126
.2
126
.4
126
.8
126
.6
127.0
Co irr
adia
tor
Cyclo
trons
Wa
ste
sto
re
60
Radio
chem
istr
yLabora
tory
sta
ck
Me
asu
rem
en
t ce
ntr
e

Fig
ure
C.2
8 G
amm
a-ra
y d
ose
rat
e d
istr
ibu
tio
n w
ith
in t
he
IRE
sit
e
C 3
6
162.2
162.4
200
400m
0
162.0
161.8
161.6
126.2
126.4
126.8
126.6
127.0
Calib
ration b
ased o
n infinite
pla
nar
sourc
e g
eom
etr
y
Co irr
adia
tor
Cyclo
trons
Waste
sto
re
60
Radio
chem
istr
yLabora
tory
sta
ck
Measure
ment centr
e

Fig
ure
C.2
9 N
et c
ou
nts
in
th
e G
MX
det
ecto
r <
30
0 k
eV w
ith
in t
he
IRE
sit
e
C 3
7
16
2.2
16
2.4
20
0400m
0
16
2.0
16
1.8
16
1.6
126
.2
126
.4
126
.8
126
.6
127.0
Co irr
adia
tor
Cyclo
trons
Wa
ste
sto
re
60
Radio
chem
istr
yLabora
tory
sta
ck
Me
asu
rem
en
t ce
ntr
e