Embed Size (px)
Citation preview
1 Strictly Confidential. Do Not Duplicate or Distribute.
Refresh Bob Evans A Plan for Comprehensive Change April 2014
2 Strictly Confidential. Do Not Duplicate or Distribute.
Disclaimer
THIS PRESENTATION WITH RESPECT TO BOB EVANS FARMS, INC. (“BOB EVANS” OR THE “COMPANY’”) IS FOR GENERAL INFORMATIONAL PURPOSES ONLY. IT DOES NOT HAVE REGARD TO THE SPECIFIC INVESTMENT OBJECTIVE, FINANCIAL SITUATION, SUITABILITY OR PARTICULAR NEED OF ANY SPECIFIC PERSON WHO MAY RECEIVE THIS PRESENTATION, AND SHOULD NOT BE TAKEN AS ADVICE ON THE MERITS OF ANY INVESTMENT DECISION. THE VIEWS EXPRESSED HEREIN REPRESENT THE OPINIONS OF SANDELL ASSET MANAGEMENT CORP. (“SAMC”), AND ARE BASED ON PUBLICLY AVAILABLE INFORMATION AND SAMC ANALYSES. CERTAIN FINANCIAL INFORMATION AND DATA USED HEREIN HAVE BEEN DERIVED OR OBTAINED FROM FILINGS MADE WITH THE SEC BY THE COMPANY OR OTHER COMPANIES CONSIDERED COMPARABLE, AND FROM OTHER THIRD PARTY REPORTS.
SAMC HAS NOT SOUGHT OR OBTAINED CONSENT FROM ANY THIRD PARTY TO USE ANY STATEMENTS OR INFORMATION INDICATED HEREIN AS HAVING BEEN OBTAINED OR DERIVED FROM A THIRD PARTY. ANY SUCH STATEMENTS OR INFORMATION SHOULD NOT BE VIEWED AS INDICATING THE SUPPORT OF SUCH THIRD PARTY FOR THE VIEWS EXPRESSED HEREIN.
THERE IS NO ASSURANCE OR GUARANTEE WITH RESPECT TO THE PRICES AT WHICH ANY SECURITIES OF THE COMPANY WILL TRADE, AND SUCH SECURITIES MAY NOT TRADE AT PRICES THAT MAY BE IMPLIED HEREIN. THE ESTIMATES, PROJECTIONS, PRO FORMA INFORMATION AND POTENTIAL IMPACT OF SAMC’S ACTION PLAN SET FORTH HEREIN ARE BASED ON ASSUMPTIONS THAT SAMC BELIEVES TO BE REASONABLE, BUT THERE CAN BE NO ASSURANCE OR GUARANTEE THAT ACTUAL RESULTS OR PERFORMANCE OF THE COMPANY WILL NOT DIFFER, AND SUCH DIFFERENCES MAY BE MATERIAL. THIS PRESENTATION DOES NOT RECOMMEND THE PURCHASE OR SALE OF ANY SECURITY. SAMC RESERVES THE RIGHT TO CHANGE ANY OF ITS OPINIONS EXPRESSED HEREIN AT ANY TIME AS IT DEEMS APPROPRIATE. SAMC DISCLAIMS ANY OBLIGATION TO UPDATE THE INFORMATION CONTAINED HEREIN.
UNDER NO CIRCUMSTANCES IS THIS PRESENTATION TO BE USED OR CONSIDERED AS AN OFFER TO SELL OR A SOLICITATION OF AN OFFER TO BUY ANY SECURITY. PRIVATE INVESTMENT FUNDS ADVISED BY SAMC CURRENTLY HOLD SHARES OF COMMON STOCK AND SECURITIES REPRESENTING AGGREGATE BENEFICAL OWNERSHIP OF APPROXIMATELY 6.8%1 OF THE OUTSTANDING COMMON STOCK OF THE COMPANY. SAMC MANAGES INVESTMENT FUNDS THAT ARE IN THE BUSINESS OF TRADING – BUYING AND SELLING – PUBLIC SECURITIES. IT IS POSSIBLE THAT THERE WILL BE DEVELOPMENTS IN THE FUTURE THAT CAUSE SAMC AND/OR ONE OR MORE OF THE INVESTMENT FUNDS IT MANAGES, FROM TIME TO TIME (IN OPEN MARKET OR PRIVATELY NEGOTIATED TRANSACTIONS OR OTHERWISE), TO SELL ALL OR A PORTION OF THEIR SHARES (INCLUDING VIA SHORT SALES), BUY ADDITIONAL SHARES OR TRADE IN OPTIONS, PUTS, CALLS OR OTHER DERIVATIVE INSTRUMENTS RELATING TO SUCH SHARES. SAMC AND SUCH INVESTMENT FUNDS ALSO RESERVE THE RIGHT TO TAKE ANY ACTIONS WITH RESPECT TO THEIR INVESTMENTS IN THE COMPANY AS THEY MAY DEEM APPROPRIATE, INCLUDING, BUT NOT LIMITED TO, COMMUNICATING WITH MANAGEMENT OF THE COMPANY, THE BOARD OF DIRECTORS OF THE COMPANY AND OTHER INVESTORS AND THIRD PARTIES, AND CONDUCTING A PROXY OR CONSENT SOLICITATION WITH RESPECT TO POTENTIAL GOVERNANCE CHANGES, INCLUDING THE ELECTION OF PERSONS TO THE BOARD OF DIRECTORS OF THE COMPANY.
1 This amount excludes certain funds that are managed by Sandell affiliates that are not participating in this solicitation
3 Strictly Confidential. Do Not Duplicate or Distribute.
Additional Information Regarding the Solicitation
SANDELL ASSET MANAGEMENT CORP., CASTLERIGG MASTER INVESTMENTS LTD., CASTLERIGG INTERNATIONAL LIMITED, CASTLERIGG INTERNATIONAL HOLDINGS LIMITED, CASTLERIGG OFFSHORE HOLDINGS, LTD., CASTLERIGG MERGER ARBITRAGE AND EQUITY EVENT FUND, LTD., CASTLERIGG MERGER ARBITRAGE AND EQUITY EVENT INTERMEDIATE FUND, L.P., CASTLERIGG MERGER ARBITRAGE AND EQUITY EVENT MASTER FUND, LTD., CASTLERIGG GLOBAL EQUITY SPECIAL EVENT FUND, LTD., CASTLERIGG GLOBAL EQUITY SPECIAL EVENT INTERMEDIATE FUND, L.P., CASTLERIGG GLOBAL EQUITY SPECIAL EVENT MASTER FUND, LTD., PULTENEY STREET PARTNERS, L.P. AND THOMAS E. SANDELL (COLLECTIVELY, "SANDELL") AND DOUGLAS N. BENHAM, CHARLES M. ELSON, DAVID W. HEAD, C. STEPHEN LYNN, ANNELISE T. OSBORNE, ARON I. SCHWARTZ, MICHAEL WEINSTEIN AND LEE S. WIELANSKY (TOGETHER WITH SANDELL, THE "PARTICIPANTS") INTEND TO FILE WITH THE SECURITIES AND EXCHANGE COMMISSION (THE "SEC") A DEFINITIVE PROXY STATEMENT AND ACCOMPANYING FORM OF PROXY CARD TO BE USED IN CONNECTION WITH THE SOLICITATION OF PROXIES FROM THE STOCKHOLDERS OF BOB EVANS FARMS, INC. (THE "COMPANY") IN CONNECTION WITH THE COMPANY’S 2014 ANNUAL MEETING OF STOCKHOLDERS. ALL STOCKHOLDERS OF THE COMPANY ARE ADVISED TO READ THE DEFINITIVE PROXY STATEMENT AND OTHER DOCUMENTS RELATED TO THE SOLICITATION OF PROXIES BY SANDELL WHEN THEY BECOME AVAILABLE, AS THEY WILL CONTAIN IMPORTANT INFORMATION, INCLUDING ADDITIONAL INFORMATION RELATED TO THE PARTICIPANTS. WHEN COMPLETED, THE DEFINITIVE PROXY STATEMENT AND AN ACCOMPANYING PROXY CARD WILL BE FURNISHED TO SOME OR ALL OF THE COMPANY'S STOCKHOLDERS AND WILL BE, ALONG WITH OTHER RELEVANT DOCUMENTS, AVAILABLE AT NO CHARGE ON THE SEC'S WEBSITE AT HTTP://WWW.SEC.GOV/. IN ADDITION, MACKENZIE PARTNERS, INC., SANDELL'S PROXY SOLICITOR, WILL PROVIDE COPIES OF THE DEFINITIVE PROXY STATEMENT AND ACCOMPANYING PROXY CARD, WHEN AVAILABLE, WITHOUT CHARGE UPON REQUEST BY CALLING (800) 322-2885.
INFORMATION ABOUT THE PARTICIPANTS AND A DESCRIPTION OF THEIR DIRECT OR INDIRECT INTERESTS BY SECURITY HOLDINGS IS CONTAINED IN AN EXHIBIT TO THE SCHEDULE 14A TO BE FILED BY SANDELL ASSET MANAGEMENT CORP. WITH THE SEC ON APRIL 24, 2014. THIS DOCUMENT CAN BE OBTAINED FREE OF CHARGE FROM THE SOURCES INDICATED ABOVE.
4 Strictly Confidential. Do Not Duplicate or Distribute.
Table of Contents
Executive Summary I
Bob Evans: Numerous Problems II
Source of Problems: A Stale and Entrenched Board III
Solution: A Fresh, Independent, Highly-Qualified Board to Effect Change IV
Comprehensive Improvements: Operational, Financial, Strategic V
Potential Upside for Shareholders VI
Appendix VII
5 Strictly Confidential. Do Not Duplicate or Distribute.
Executive Summary
Refresh Bob Evans
6 Strictly Confidential. Do Not Duplicate or Distribute.
About Sandell Asset Management
■ Sandell Asset Management Corp. (“Sandell”) is a leading private, alternative asset management firm specializing in global corporate event-driven investing
■ Over 16 years of managing event-driven strategies across both equity- and credit-oriented opportunities
■ Combines bottom-up and top-down analysis to create a portfolio with low downside volatility
■ Chief Executive Officer and Portfolio Manager, Tom Sandell, founded Sandell Asset Management in 1998, and has been investing in global corporate events since the late 1980’s
■ Global presence with offices in New York (since 1998) and London (since 2001)
7 Strictly Confidential. Do Not Duplicate or Distribute.
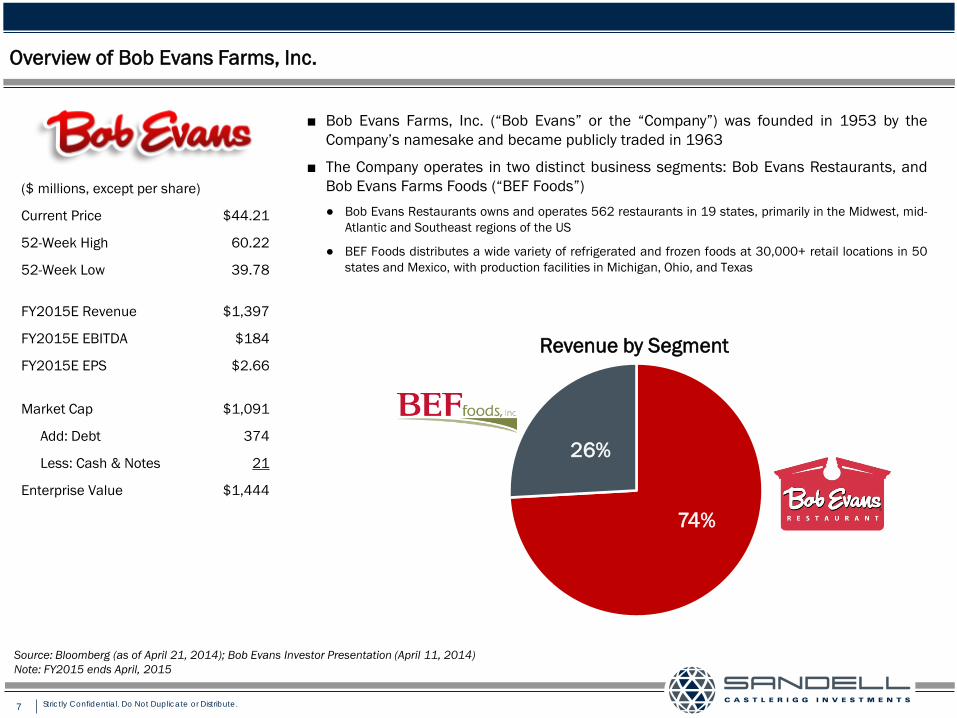
($ millions, except per share)
Current Price $44.21
52-Week High 60.22
52-Week Low 39.78
FY2015E Revenue $1,397
FY2015E EBITDA $184
FY2015E EPS $2.66
Market Cap $1,091
Add: Debt 374
Less: Cash & Notes 21
Enterprise Value $1,444
Overview of Bob Evans Farms, Inc.
■ Bob Evans Farms, Inc. (“Bob Evans” or the “Company”) was founded in 1953 by the Company’s namesake and became publicly traded in 1963
■ The Company operates in two distinct business segments: Bob Evans Restaurants, and Bob Evans Farms Foods (“BEF Foods”) ● Bob Evans Restaurants owns and operates 562 restaurants in 19 states, primarily in the Midwest, mid-
Atlantic and Southeast regions of the US
● BEF Foods distributes a wide variety of refrigerated and frozen foods at 30,000+ retail locations in 50 states and Mexico, with production facilities in Michigan, Ohio, and Texas
Source: Bloomberg (as of April 21, 2014); Bob Evans Investor Presentation (April 11, 2014) Note: FY2015 ends April, 2015
74%
26%
Revenue by Segment
8 Strictly Confidential. Do Not Duplicate or Distribute.
Executive Summary
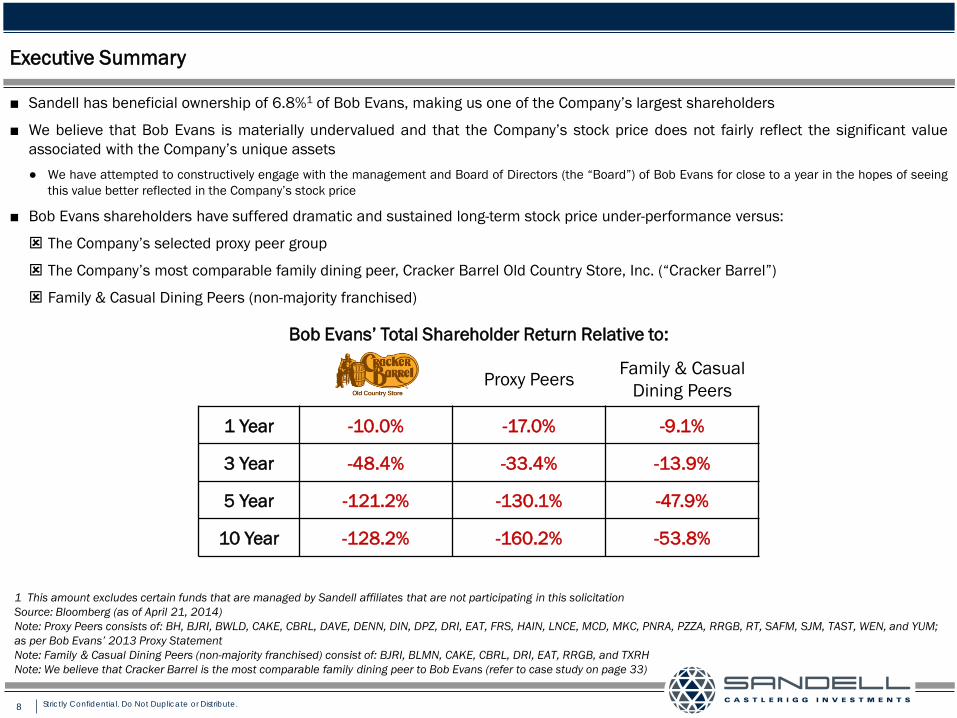
■ Sandell has beneficial ownership of 6.8%1 of Bob Evans, making us one of the Company’s largest shareholders
■ We believe that Bob Evans is materially undervalued and that the Company’s stock price does not fairly reflect the significant value associated with the Company’s unique assets ● We have attempted to constructively engage with the management and Board of Directors (the “Board”) of Bob Evans for close to a year in the hopes of seeing
this value better reflected in the Company’s stock price
■ Bob Evans shareholders have suffered dramatic and sustained long-term stock price under-performance versus:
The Company’s selected proxy peer group
The Company’s most comparable family dining peer, Cracker Barrel Old Country Store, Inc. (“Cracker Barrel”)
Family & Casual Dining Peers (non-majority franchised)
Bob Evans’ Total Shareholder Return Relative to:
Proxy Peers Family & Casual Dining Peers
1 Year -10.0% -17.0% -9.1%
3 Year -48.4% -33.4% -13.9%
5 Year -121.2% -130.1% -47.9%
10 Year -128.2% -160.2% -53.8%
1 This amount excludes certain funds that are managed by Sandell affiliates that are not participating in this solicitation Source: Bloomberg (as of April 21, 2014) Note: Proxy Peers consists of: BH, BJRI, BWLD, CAKE, CBRL, DAVE, DENN, DIN, DPZ, DRI, EAT, FRS, HAIN, LNCE, MCD, MKC, PNRA, PZZA, RRGB, RT, SAFM, SJM, TAST, WEN, and YUM; as per Bob Evans’ 2013 Proxy Statement Note: Family & Casual Dining Peers (non-majority franchised) consist of: BJRI, BLMN, CAKE, CBRL, DRI, EAT, RRGB, and TXRH Note: We believe that Cracker Barrel is the most comparable family dining peer to Bob Evans (refer to case study on page 33)
9 Strictly Confidential. Do Not Duplicate or Distribute.
Executive Summary
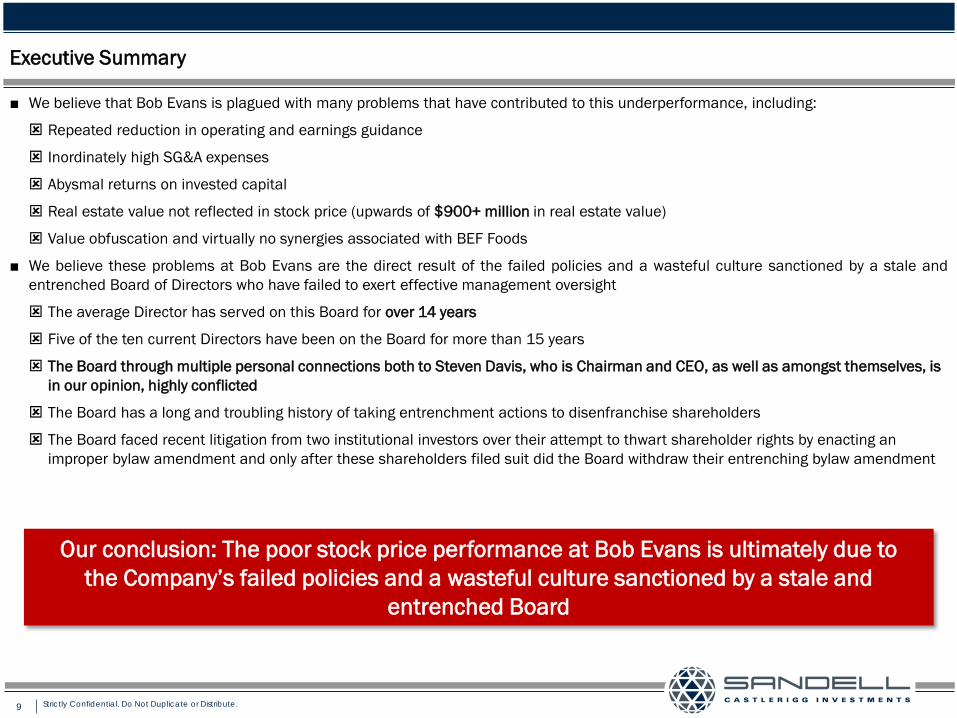
Our conclusion: The poor stock price performance at Bob Evans is ultimately due to the Company’s failed policies and a wasteful culture sanctioned by a stale and
entrenched Board
■ We believe that Bob Evans is plagued with many problems that have contributed to this underperformance, including:
Repeated reduction in operating and earnings guidance
Inordinately high SG&A expenses
Abysmal returns on invested capital
Real estate value not reflected in stock price (upwards of $900+ million in real estate value)
Value obfuscation and virtually no synergies associated with BEF Foods
■ We believe these problems at Bob Evans are the direct result of the failed policies and a wasteful culture sanctioned by a stale and entrenched Board of Directors who have failed to exert effective management oversight
The average Director has served on this Board for over 14 years
Five of the ten current Directors have been on the Board for more than 15 years
The Board through multiple personal connections both to Steven Davis, who is Chairman and CEO, as well as amongst themselves, is in our opinion, highly conflicted
The Board has a long and troubling history of taking entrenchment actions to disenfranchise shareholders
The Board faced recent litigation from two institutional investors over their attempt to thwart shareholder rights by enacting an improper bylaw amendment and only after these shareholders filed suit did the Board withdraw their entrenching bylaw amendment
10 Strictly Confidential. Do Not Duplicate or Distribute.
Executive Summary
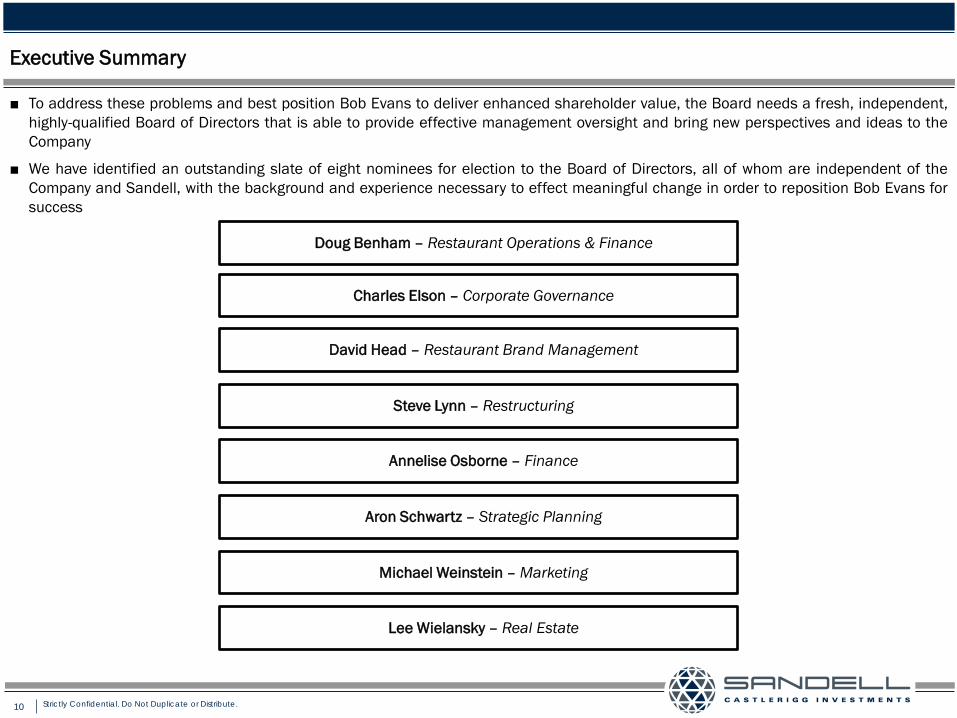
Doug Benham – Restaurant Operations & Finance
David Head – Restaurant Brand Management
Charles Elson – Corporate Governance
Aron Schwartz – Strategic Planning
Michael Weinstein – Marketing
Lee Wielansky – Real Estate
Steve Lynn – Restructuring
Annelise Osborne – Finance
■ To address these problems and best position Bob Evans to deliver enhanced shareholder value, the Board needs a fresh, independent, highly-qualified Board of Directors that is able to provide effective management oversight and bring new perspectives and ideas to the Company
■ We have identified an outstanding slate of eight nominees for election to the Board of Directors, all of whom are independent of the Company and Sandell, with the background and experience necessary to effect meaningful change in order to reposition Bob Evans for success
11 Strictly Confidential. Do Not Duplicate or Distribute.
Executive Summary
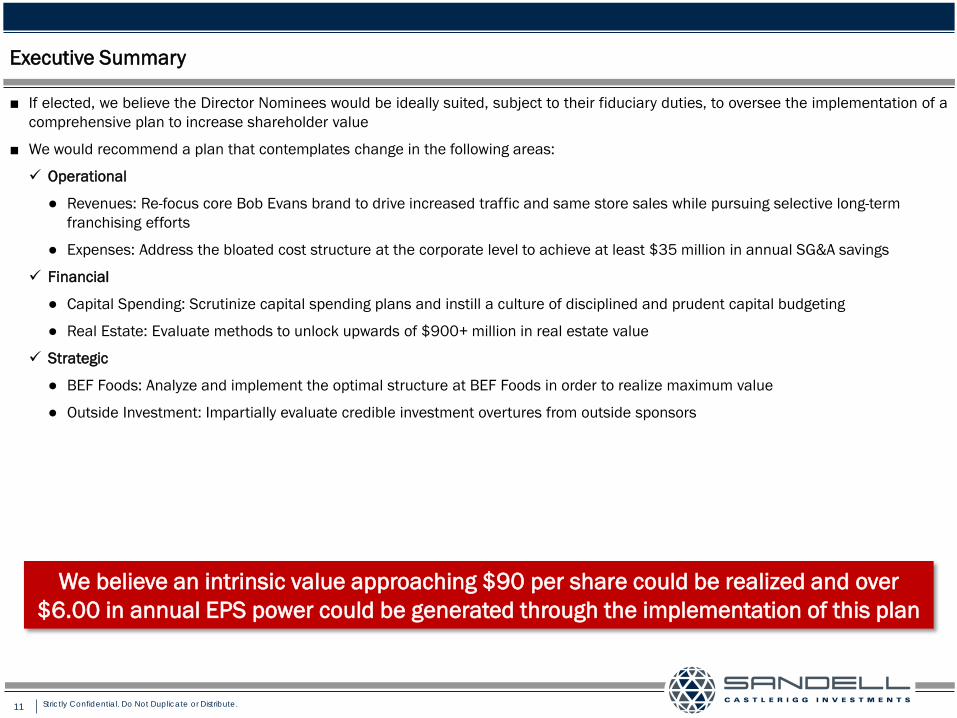
■ If elected, we believe the Director Nominees would be ideally suited, subject to their fiduciary duties, to oversee the implementation of a comprehensive plan to increase shareholder value
■ We would recommend a plan that contemplates change in the following areas:
Operational
● Revenues: Re-focus core Bob Evans brand to drive increased traffic and same store sales while pursuing selective long-term franchising efforts
● Expenses: Address the bloated cost structure at the corporate level to achieve at least $35 million in annual SG&A savings
Financial
● Capital Spending: Scrutinize capital spending plans and instill a culture of disciplined and prudent capital budgeting
● Real Estate: Evaluate methods to unlock upwards of $900+ million in real estate value
Strategic
● BEF Foods: Analyze and implement the optimal structure at BEF Foods in order to realize maximum value
● Outside Investment: Impartially evaluate credible investment overtures from outside sponsors
We believe an intrinsic value approaching $90 per share could be realized and over $6.00 in annual EPS power could be generated through the implementation of this plan
12 Strictly Confidential. Do Not Duplicate or Distribute.
Bob Evans: Numerous Problems
Refresh Bob Evans
13 Strictly Confidential. Do Not Duplicate or Distribute.
Numerous Problems
■ The problems plaguing Bob Evans are numerous
● Chronic and Severe Stock Price Underperformance
● Repeated Reduction in Operating and Earnings Guidance
● SG&A Expense Far in Excess of Peers, due to:
Bloated Corporate Infrastructure
Unnecessary Expenditures
Extravagant New Corporate Headquarters
Farm and Homestead Museum, Company Airplane
● Abysmal Returns from “Farm Fresh Refresh” Remodeling Initiative
● Real Estate Value Not Reflected in Stock Price
● BEF Foods: Virtually No Synergies and Value Disconnect
14 Strictly Confidential. Do Not Duplicate or Distribute.
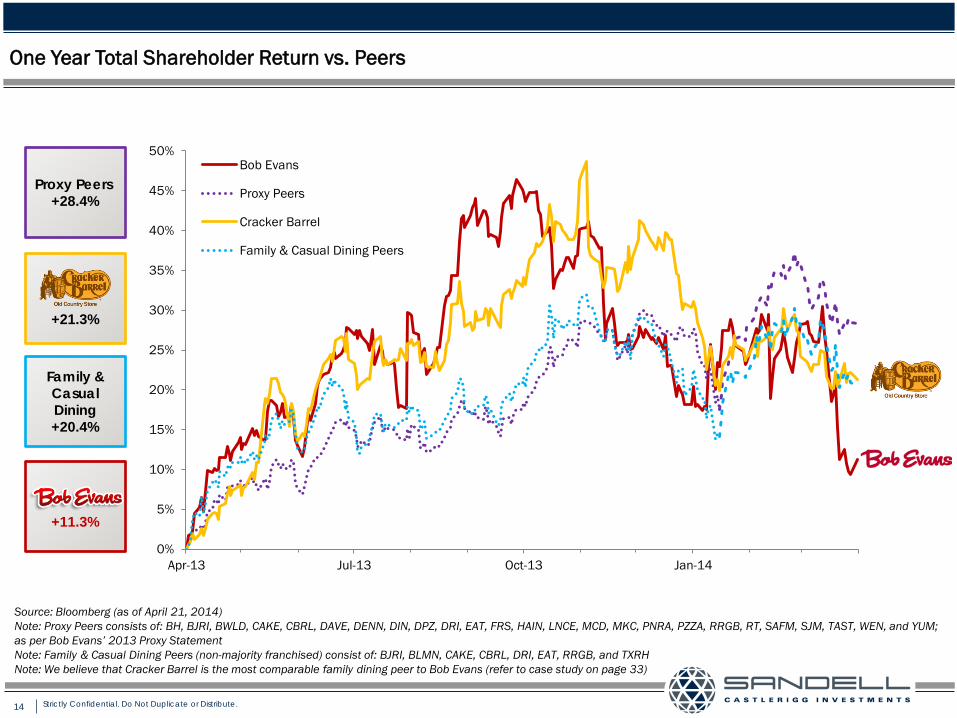
One Year Total Shareholder Return vs. Peers
0%
5%
10%
15%
20%
25%
30%
35%
40%
45%
50%
Apr-13 Jul-13 Oct-13 Jan-14
Bob Evans
Proxy Peers
Cracker Barrel
Family & Casual Dining Peers
Proxy Peers +28.4%
Family & Casual Dining +20.4%
+21.3%
+11.3%
Source: Bloomberg (as of April 21, 2014) Note: Proxy Peers consists of: BH, BJRI, BWLD, CAKE, CBRL, DAVE, DENN, DIN, DPZ, DRI, EAT, FRS, HAIN, LNCE, MCD, MKC, PNRA, PZZA, RRGB, RT, SAFM, SJM, TAST, WEN, and YUM; as per Bob Evans’ 2013 Proxy Statement Note: Family & Casual Dining Peers (non-majority franchised) consist of: BJRI, BLMN, CAKE, CBRL, DRI, EAT, RRGB, and TXRH Note: We believe that Cracker Barrel is the most comparable family dining peer to Bob Evans (refer to case study on page 33)
15 Strictly Confidential. Do Not Duplicate or Distribute.
-40%
-20%
0%
20%
40%
60%
80%
100%
120%
140%
160%
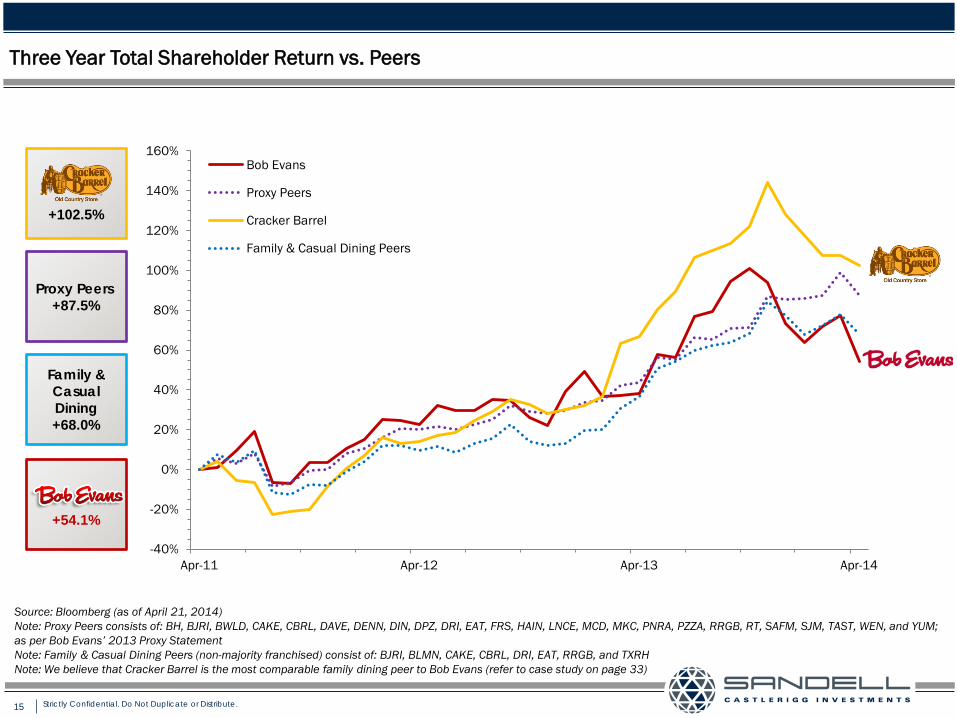
Apr-11 Apr-12 Apr-13 Apr-14
Bob Evans
Proxy Peers
Cracker Barrel
Family & Casual Dining Peers
Proxy Peers +87.5%
Family & Casual Dining +68.0%
Three Year Total Shareholder Return vs. Peers
+102.5%
+54.1%
Source: Bloomberg (as of April 21, 2014) Note: Proxy Peers consists of: BH, BJRI, BWLD, CAKE, CBRL, DAVE, DENN, DIN, DPZ, DRI, EAT, FRS, HAIN, LNCE, MCD, MKC, PNRA, PZZA, RRGB, RT, SAFM, SJM, TAST, WEN, and YUM; as per Bob Evans’ 2013 Proxy Statement Note: Family & Casual Dining Peers (non-majority franchised) consist of: BJRI, BLMN, CAKE, CBRL, DRI, EAT, RRGB, and TXRH Note: We believe that Cracker Barrel is the most comparable family dining peer to Bob Evans (refer to case study on page 33)
16 Strictly Confidential. Do Not Duplicate or Distribute.
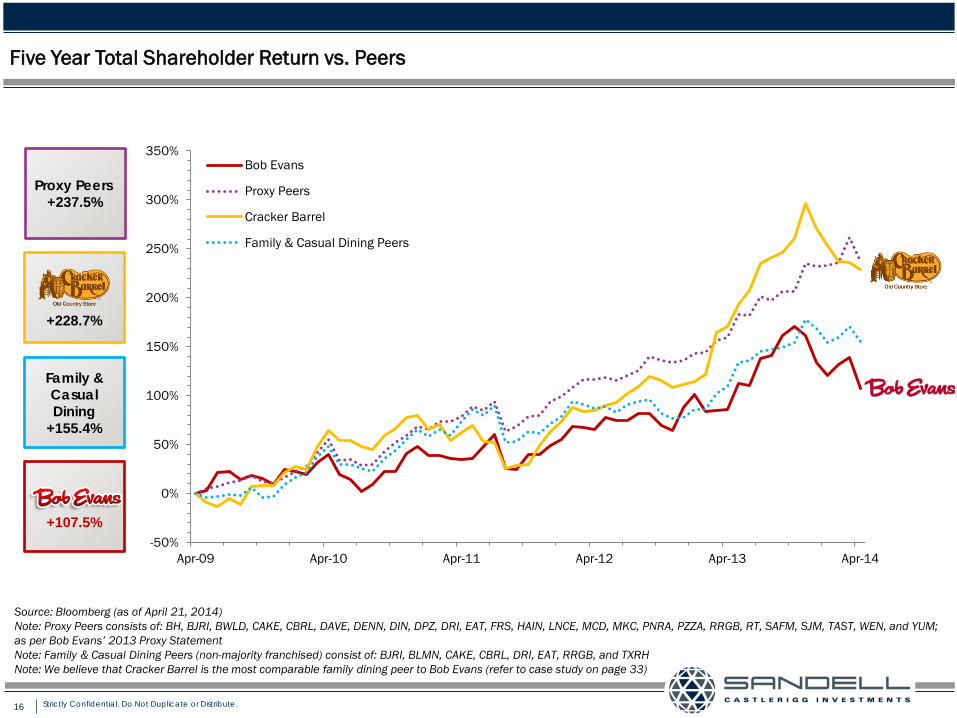
Five Year Total Shareholder Return vs. Peers
-50%
0%
50%
100%
150%
200%
250%
300%
350%
Apr-09 Apr-10 Apr-11 Apr-12 Apr-13 Apr-14
Bob Evans
Proxy Peers
Cracker Barrel
Family & Casual Dining Peers
Proxy Peers +237.5%
Family & Casual Dining
+155.4%
+228.7%
+107.5%
Source: Bloomberg (as of April 21, 2014) Note: Proxy Peers consists of: BH, BJRI, BWLD, CAKE, CBRL, DAVE, DENN, DIN, DPZ, DRI, EAT, FRS, HAIN, LNCE, MCD, MKC, PNRA, PZZA, RRGB, RT, SAFM, SJM, TAST, WEN, and YUM; as per Bob Evans’ 2013 Proxy Statement Note: Family & Casual Dining Peers (non-majority franchised) consist of: BJRI, BLMN, CAKE, CBRL, DRI, EAT, RRGB, and TXRH Note: We believe that Cracker Barrel is the most comparable family dining peer to Bob Evans (refer to case study on page 33)
17 Strictly Confidential. Do Not Duplicate or Distribute.
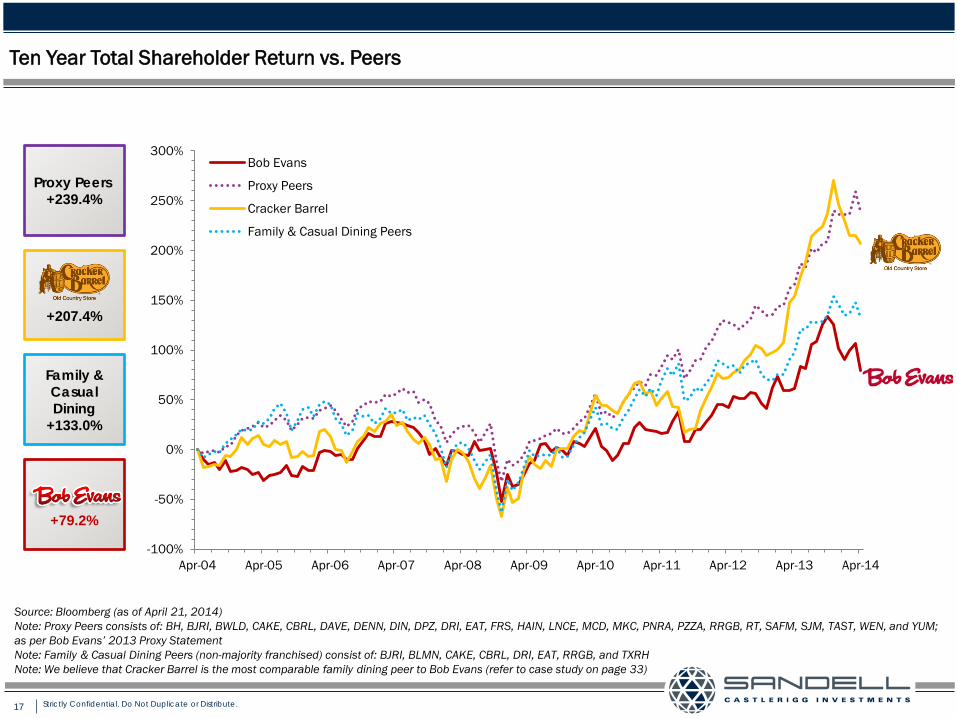
Ten Year Total Shareholder Return vs. Peers
-100%
-50%
0%
50%
100%
150%
200%
250%
300%
Apr-04 Apr-05 Apr-06 Apr-07 Apr-08 Apr-09 Apr-10 Apr-11 Apr-12 Apr-13 Apr-14
Bob Evans
Proxy Peers
Cracker Barrel
Family & Casual Dining Peers
Proxy Peers +239.4%
Family & Casual Dining
+133.0%
+207.4%
+79.2%
Source: Bloomberg (as of April 21, 2014) Note: Proxy Peers consists of: BH, BJRI, BWLD, CAKE, CBRL, DAVE, DENN, DIN, DPZ, DRI, EAT, FRS, HAIN, LNCE, MCD, MKC, PNRA, PZZA, RRGB, RT, SAFM, SJM, TAST, WEN, and YUM; as per Bob Evans’ 2013 Proxy Statement Note: Family & Casual Dining Peers (non-majority franchised) consist of: BJRI, BLMN, CAKE, CBRL, DRI, EAT, RRGB, and TXRH Note: We believe that Cracker Barrel is the most comparable family dining peer to Bob Evans (refer to case study on page 33)
18 Strictly Confidential. Do Not Duplicate or Distribute.
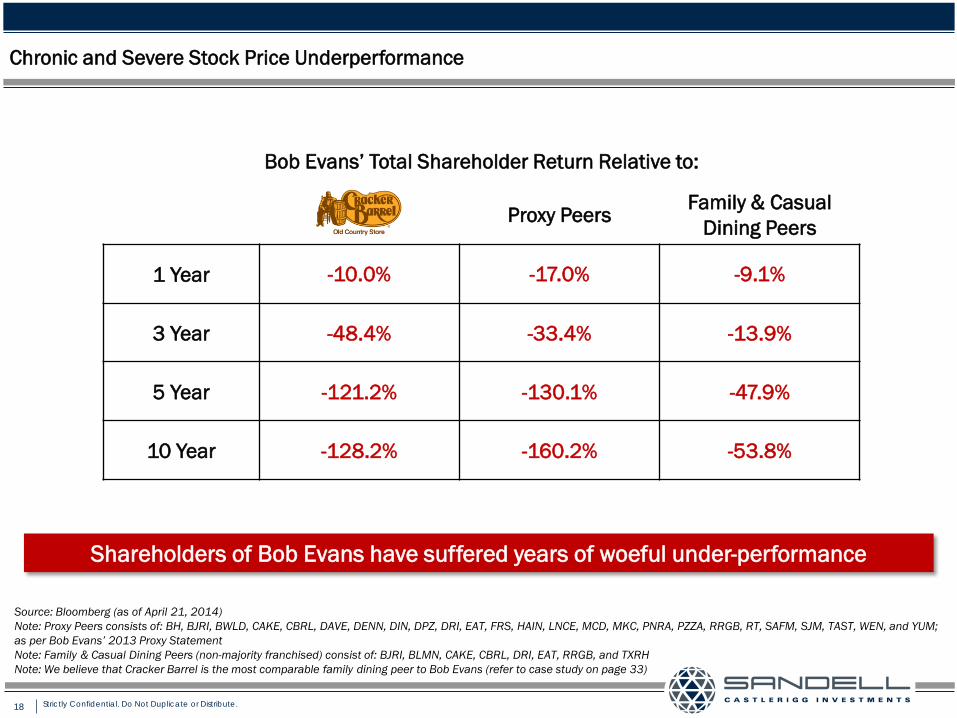
Chronic and Severe Stock Price Underperformance
Bob Evans’ Total Shareholder Return Relative to:
Proxy Peers Family & Casual Dining Peers
1 Year -10.0% -17.0% -9.1%
3 Year -48.4% -33.4% -13.9%
5 Year -121.2% -130.1% -47.9%
10 Year -128.2% -160.2% -53.8%
Shareholders of Bob Evans have suffered years of woeful under-performance
Source: Bloomberg (as of April 21, 2014) Note: Proxy Peers consists of: BH, BJRI, BWLD, CAKE, CBRL, DAVE, DENN, DIN, DPZ, DRI, EAT, FRS, HAIN, LNCE, MCD, MKC, PNRA, PZZA, RRGB, RT, SAFM, SJM, TAST, WEN, and YUM; as per Bob Evans’ 2013 Proxy Statement Note: Family & Casual Dining Peers (non-majority franchised) consist of: BJRI, BLMN, CAKE, CBRL, DRI, EAT, RRGB, and TXRH Note: We believe that Cracker Barrel is the most comparable family dining peer to Bob Evans (refer to case study on page 33)
19 Strictly Confidential. Do Not Duplicate or Distribute.
4%
5%
6%
7%
8%
9%
Oct. 22, 2013 Dec. 4, 2013 Jan. 27, 2014 Mar. 4, 2014
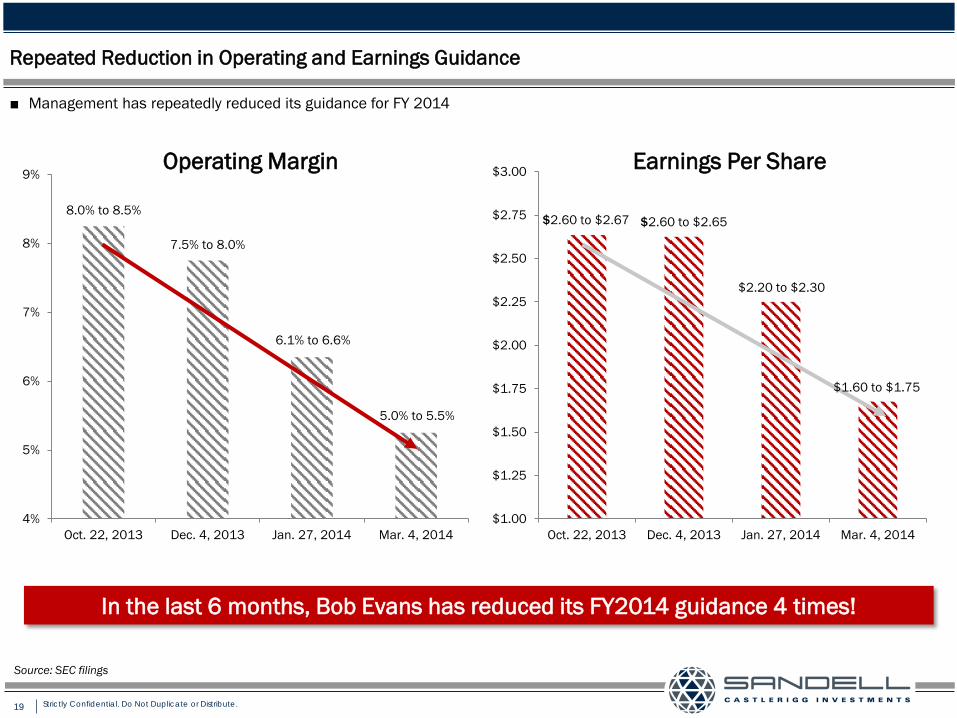
Operating Margin
Repeated Reduction in Operating and Earnings Guidance
$1.00
$1.25
$1.50
$1.75
$2.00
$2.25
$2.50
$2.75
$3.00
Oct. 22, 2013 Dec. 4, 2013 Jan. 27, 2014 Mar. 4, 2014
Earnings Per Share
$2.60 to $2.67 $2.60 to $2.65
$2.20 to $2.30
$1.60 to $1.75
8.0% to 8.5%
7.5% to 8.0%
6.1% to 6.6%
5.0% to 5.5%
In the last 6 months, Bob Evans has reduced its FY2014 guidance 4 times!
Source: SEC filings
■ Management has repeatedly reduced its guidance for FY 2014
20 Strictly Confidential. Do Not Duplicate or Distribute.
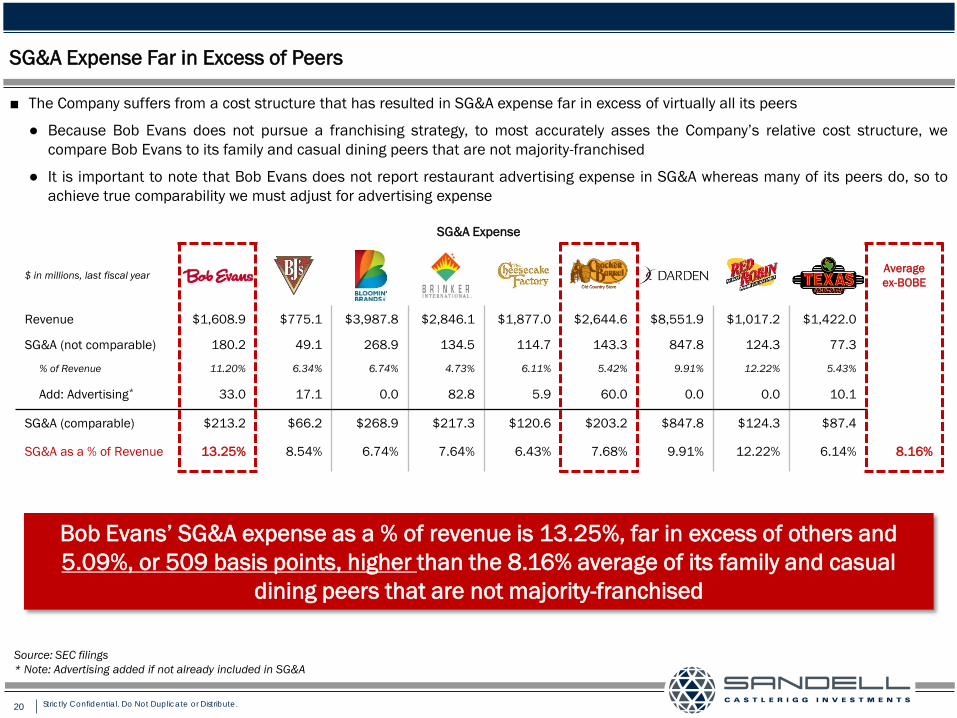
SG&A Expense
$ in millions, last fiscal year Average ex-BOBE
Revenue $1,608.9 $775.1 $3,987.8 $2,846.1 $1,877.0 $2,644.6 $8,551.9 $1,017.2 $1,422.0
SG&A (not comparable) 180.2 49.1 268.9 134.5 114.7 143.3 847.8 124.3 77.3
% of Revenue 11.20% 6.34% 6.74% 4.73% 6.11% 5.42% 9.91% 12.22% 5.43%
Add: Advertising* 33.0 17.1 0.0 82.8 5.9 60.0 0.0 0.0 10.1
SG&A (comparable) $213.2 $66.2 $268.9 $217.3 $120.6 $203.2 $847.8 $124.3 $87.4
SG&A as a % of Revenue 13.25% 8.54% 6.74% 7.64% 6.43% 7.68% 9.91% 12.22% 6.14% 8.16%
SG&A Expense Far in Excess of Peers
■ The Company suffers from a cost structure that has resulted in SG&A expense far in excess of virtually all its peers
● Because Bob Evans does not pursue a franchising strategy, to most accurately asses the Company’s relative cost structure, we compare Bob Evans to its family and casual dining peers that are not majority-franchised
● It is important to note that Bob Evans does not report restaurant advertising expense in SG&A whereas many of its peers do, so to achieve true comparability we must adjust for advertising expense
Bob Evans’ SG&A expense as a % of revenue is 13.25%, far in excess of others and 5.09%, or 509 basis points, higher than the 8.16% average of its family and casual
dining peers that are not majority-franchised
Source: SEC filings * Note: Advertising added if not already included in SG&A
21 Strictly Confidential. Do Not Duplicate or Distribute.
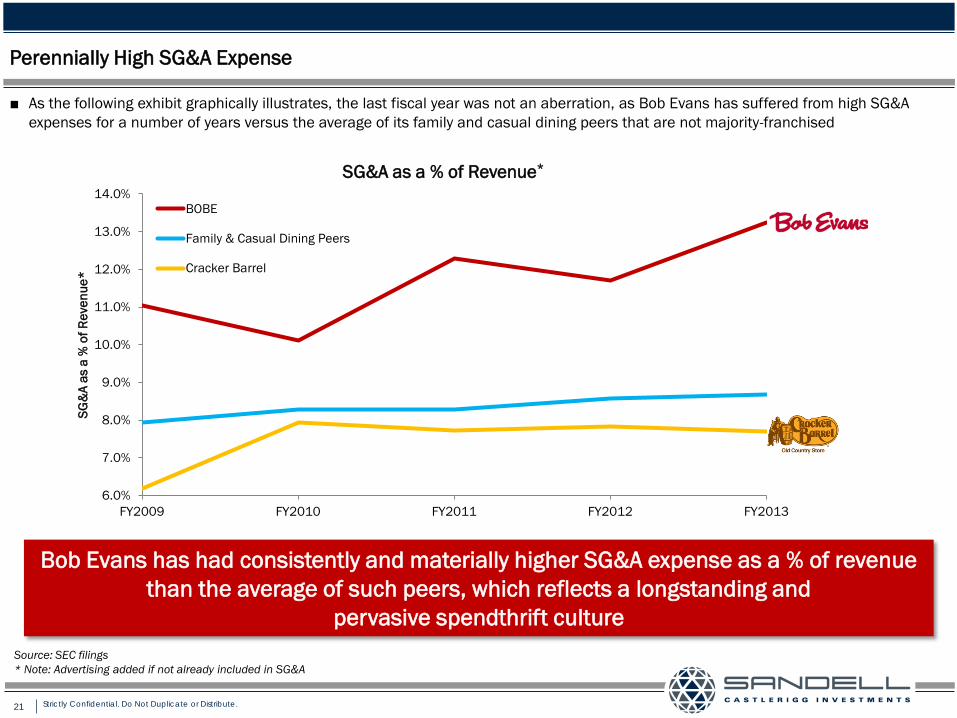
Perennially High SG&A Expense
■ As the following exhibit graphically illustrates, the last fiscal year was not an aberration, as Bob Evans has suffered from high SG&A expenses for a number of years versus the average of its family and casual dining peers that are not majority-franchised
Bob Evans has had consistently and materially higher SG&A expense as a % of revenue than the average of such peers, which reflects a longstanding and
pervasive spendthrift culture
6.0%
7.0%
8.0%
9.0%
10.0%
11.0%
12.0%
13.0%
14.0%
FY2009 FY2010 FY2011 FY2012 FY2013
SG&
A as
a %
of R
even
ue*
SG&A as a % of Revenue*
BOBE
Family & Casual Dining Peers
Cracker Barrel
Source: SEC filings * Note: Advertising added if not already included in SG&A
22 Strictly Confidential. Do Not Duplicate or Distribute.
Bloated Corporate Infrastructure
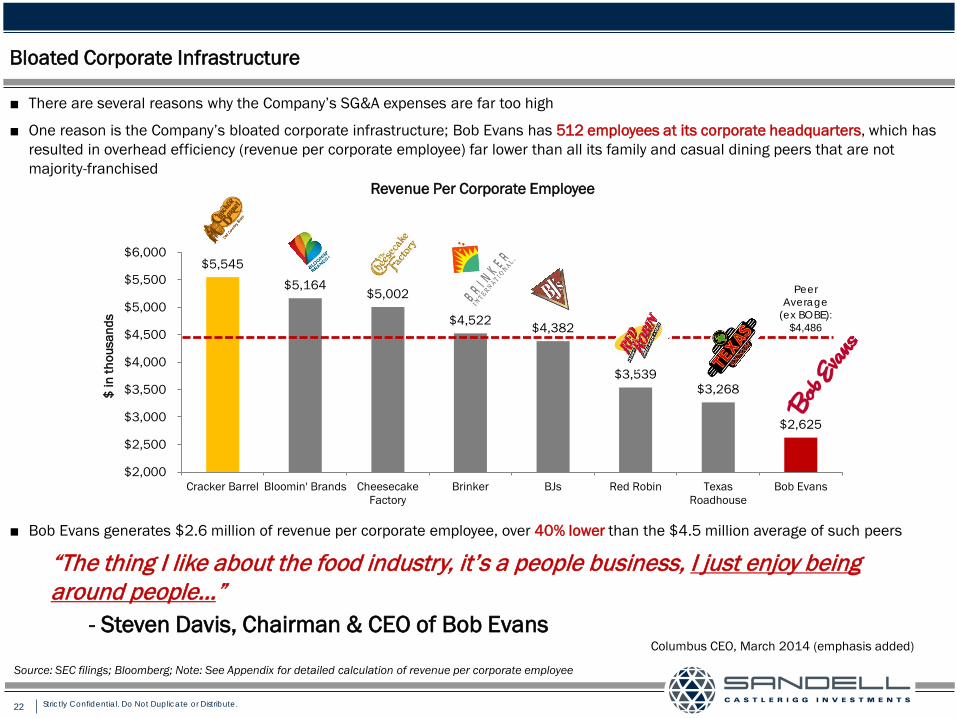
■ There are several reasons why the Company’s SG&A expenses are far too high
■ One reason is the Company’s bloated corporate infrastructure; Bob Evans has 512 employees at its corporate headquarters, which has resulted in overhead efficiency (revenue per corporate employee) far lower than all its family and casual dining peers that are not majority-franchised
$5,545 $5,164
$5,002
$4,522 $4,382
$3,539 $3,268
$2,625
$2,000
$2,500
$3,000
$3,500
$4,000
$4,500
$5,000
$5,500
$6,000
Cracker Barrel Bloomin' Brands CheesecakeFactory
Brinker BJs Red Robin TexasRoadhouse
Bob Evans
$ in
thou
sand
s
Revenue Per Corporate Employee
“The thing I like about the food industry, it’s a people business, I just enjoy being around people…”
- Steven Davis, Chairman & CEO of Bob Evans Columbus CEO, March 2014 (emphasis added)
Source: SEC filings; Bloomberg; Note: See Appendix for detailed calculation of revenue per corporate employee
Peer Average
(ex BOBE): $4,486
■ Bob Evans generates $2.6 million of revenue per corporate employee, over 40% lower than the $4.5 million average of such peers
23 Strictly Confidential. Do Not Duplicate or Distribute.
Unnecessary Expenditures
■ Also contributing to the Company’s inflated SG&A is the fact that Bob Evans has incurred expenses far in excess of its peers for what are, in our view, several unnecessary and extravagant pursuits
■ New Corporate Headquarters – The Company recently opened a new 40 acre, $48.2 million corporate headquarters campus in New Albany, Ohio and must incur additional expenses in its maintenance
● Its palatial character (see next page) is best described by the following:
■ Bob Evans Farm and Homestead Museum – The Company owns the 937-acre Bob Evans Farm in Rio Grande, Ohio, complete with a large brick farmhouse known as the Homestead, which serves as a company museum and historical center, and is now on the National Register of Historic Places
■ Company Airplane – Bob Evans appears to have only recently (in November 2013) sold its ASTRA SPX (Gulfstream G-100) 14-seat company airplane that it had owned for several years
“The result is a headquarters building, training center and shipping and receiving building nestled among infant chestnut trees and blueberry bushes, garden and ponds, and encircled by a 1-mile walking path. On the exterior of the 138,000 square-foot main building, metal window louvers and stairwell towers suggest the vents and silos of a barn…A restaurant-size, red neon Bob Evans Farms logo welcomes visitors to a two-story lobby with polished concrete floors. Wood barn slats line hallways, where pieces of Bob Evans history or corporate values are displayed.”
The Columbus Dispatch, October 31, 2013
The current Board’s shameful culture of waste has paved the way for a Company-wide culture of excess
24 Strictly Confidential. Do Not Duplicate or Distribute.
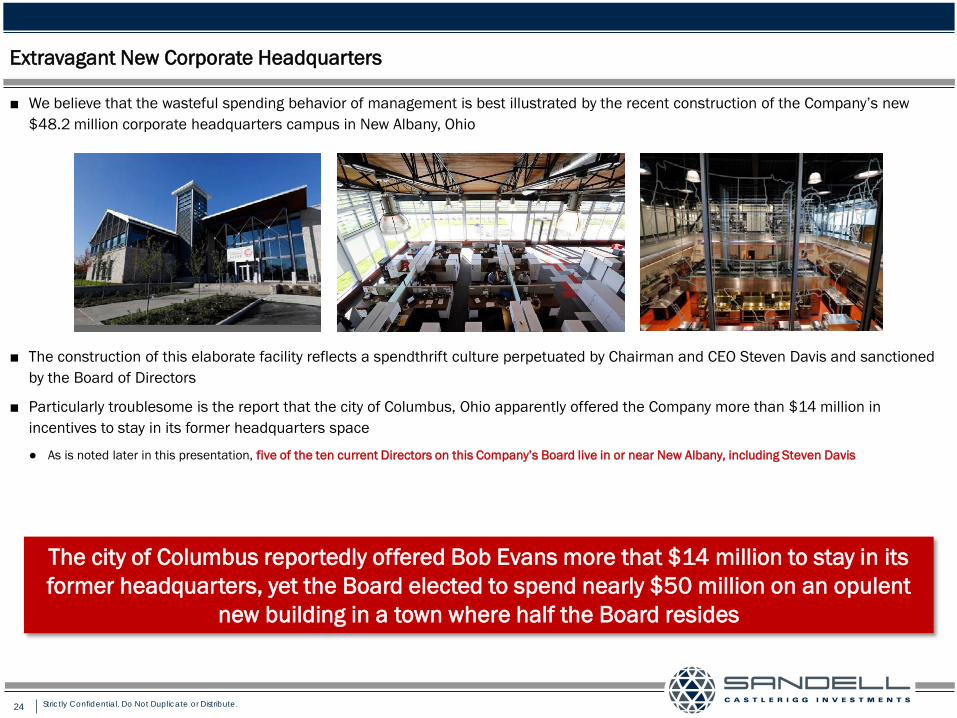
■ We believe that the wasteful spending behavior of management is best illustrated by the recent construction of the Company’s new $48.2 million corporate headquarters campus in New Albany, Ohio
■ The construction of this elaborate facility reflects a spendthrift culture perpetuated by Chairman and CEO Steven Davis and sanctioned by the Board of Directors
■ Particularly troublesome is the report that the city of Columbus, Ohio apparently offered the Company more than $14 million in incentives to stay in its former headquarters space
● As is noted later in this presentation, five of the ten current Directors on this Company’s Board live in or near New Albany, including Steven Davis
Extravagant New Corporate Headquarters
The city of Columbus reportedly offered Bob Evans more that $14 million to stay in its former headquarters, yet the Board elected to spend nearly $50 million on an opulent
new building in a town where half the Board resides
25 Strictly Confidential. Do Not Duplicate or Distribute.
Extravagant New Corporate Headquarters (cont.)
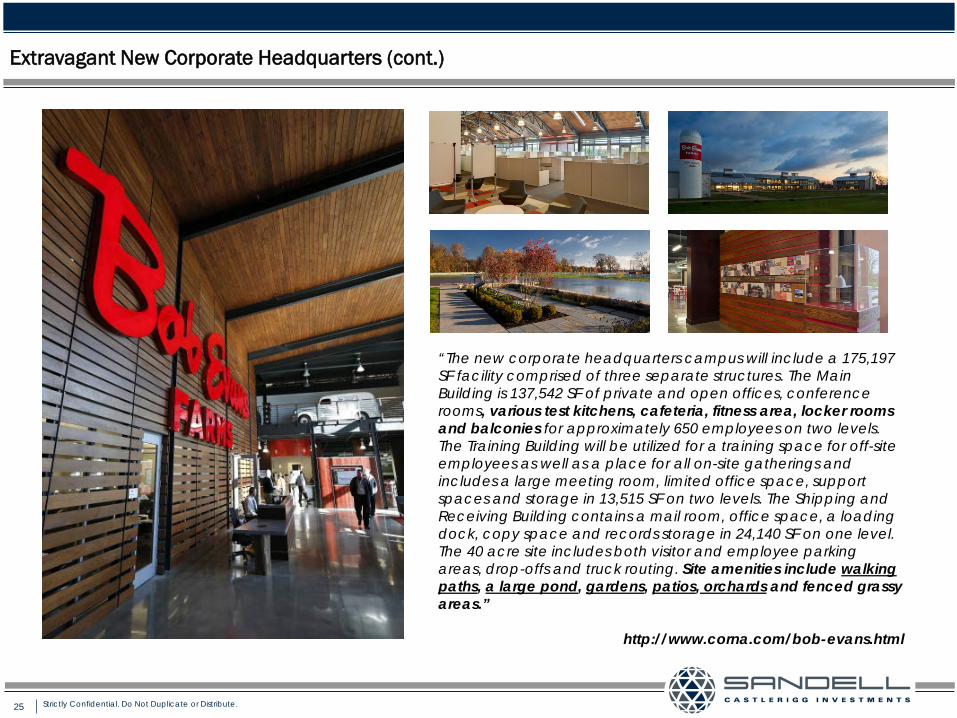
“The new corporate headquarters campus will include a 175,197 SF facility comprised of three separate structures. The Main Building is 137,542 SF of private and open offices, conference rooms, various test kitchens, cafeteria, fitness area, locker rooms and balconies for approximately 650 employees on two levels. The Training Building will be utilized for a training space for off-site employees as well as a place for all on-site gatherings and includes a large meeting room, limited office space, support spaces and storage in 13,515 SF on two levels. The Shipping and Receiving Building contains a mail room, office space, a loading dock, copy space and records storage in 24,140 SF on one level. The 40 acre site includes both visitor and employee parking areas, drop-offs and truck routing. Site amenities include walking paths, a large pond, gardens, patios, orchards and fenced grassy areas.”
http://www.corna.com/bob-evans.html
26 Strictly Confidential. Do Not Duplicate or Distribute.
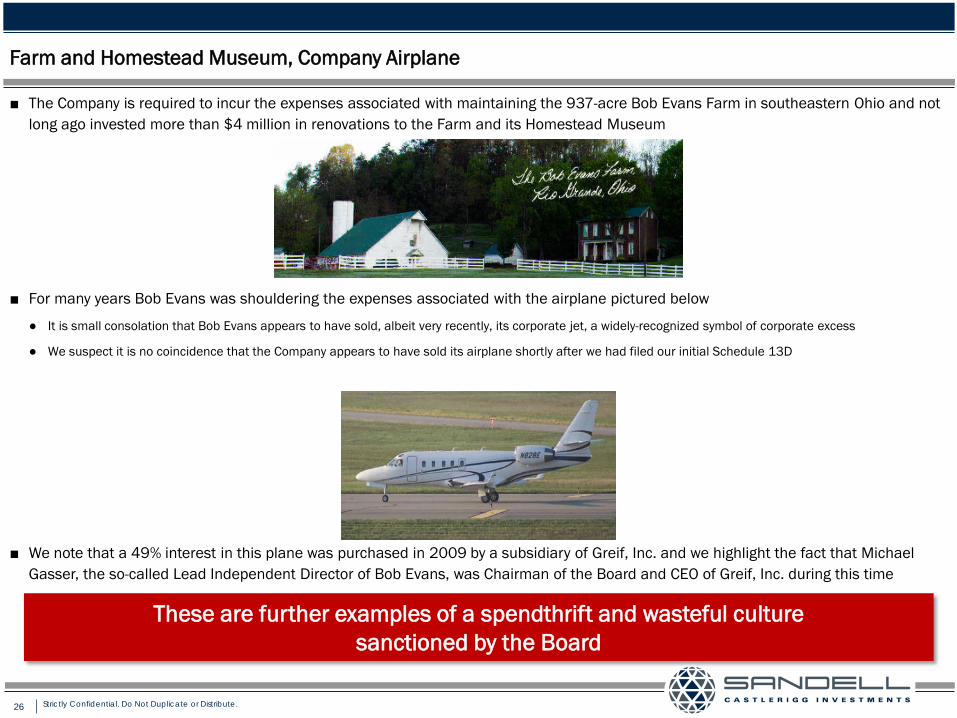
■ The Company is required to incur the expenses associated with maintaining the 937-acre Bob Evans Farm in southeastern Ohio and not long ago invested more than $4 million in renovations to the Farm and its Homestead Museum
■ For many years Bob Evans was shouldering the expenses associated with the airplane pictured below
● It is small consolation that Bob Evans appears to have sold, albeit very recently, its corporate jet, a widely-recognized symbol of corporate excess
● We suspect it is no coincidence that the Company appears to have sold its airplane shortly after we had filed our initial Schedule 13D
■ We note that a 49% interest in this plane was purchased in 2009 by a subsidiary of Greif, Inc. and we highlight the fact that Michael Gasser, the so-called Lead Independent Director of Bob Evans, was Chairman of the Board and CEO of Greif, Inc. during this time
These are further examples of a spendthrift and wasteful culture sanctioned by the Board
Farm and Homestead Museum, Company Airplane
27 Strictly Confidential. Do Not Duplicate or Distribute.
Disastrous “Farm Fresh Refresh” Remodeling Results
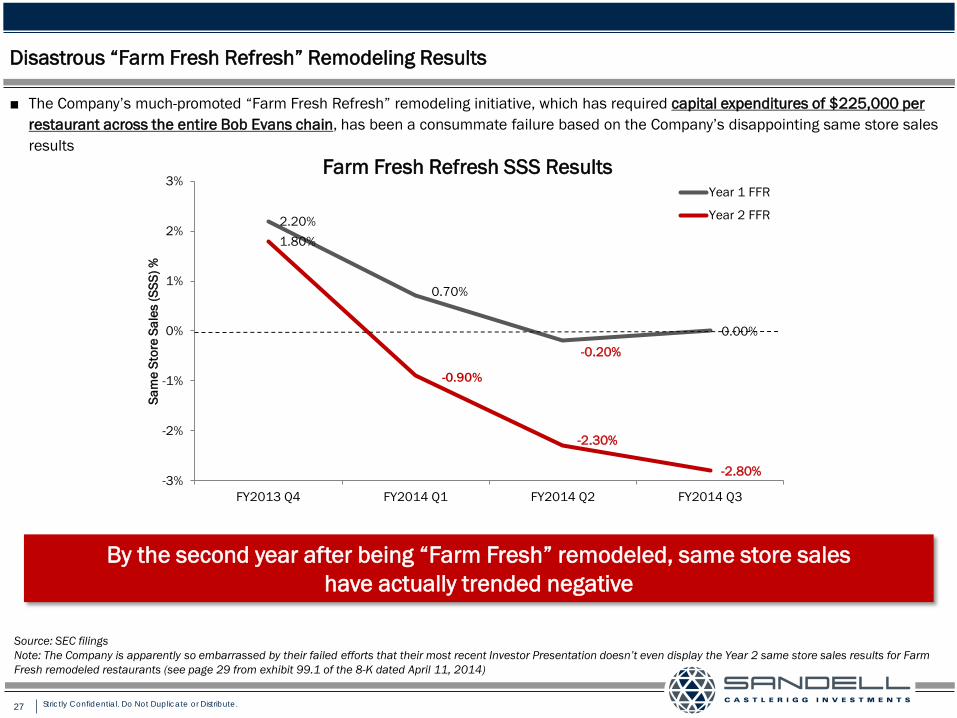
■ The Company’s much-promoted “Farm Fresh Refresh” remodeling initiative, which has required capital expenditures of $225,000 per restaurant across the entire Bob Evans chain, has been a consummate failure based on the Company’s disappointing same store sales results
2.20%
0.70%
-0.20% 0.00%
1.80%
-0.90%
-2.30%
-2.80% -3%
-2%
-1%
0%
1%
2%
3%
FY2013 Q4 FY2014 Q1 FY2014 Q2 FY2014 Q3
Sam
e St
ore
Sale
s (S
SS) %
Farm Fresh Refresh SSS Results
Year 1 FFR
Year 2 FFR
By the second year after being “Farm Fresh” remodeled, same store sales have actually trended negative
Source: SEC filings Note: The Company is apparently so embarrassed by their failed efforts that their most recent Investor Presentation doesn’t even display the Year 2 same store sales results for Farm Fresh remodeled restaurants (see page 29 from exhibit 99.1 of the 8-K dated April 11, 2014)
28 Strictly Confidential. Do Not Duplicate or Distribute.
Abysmal Return on Invested Capital
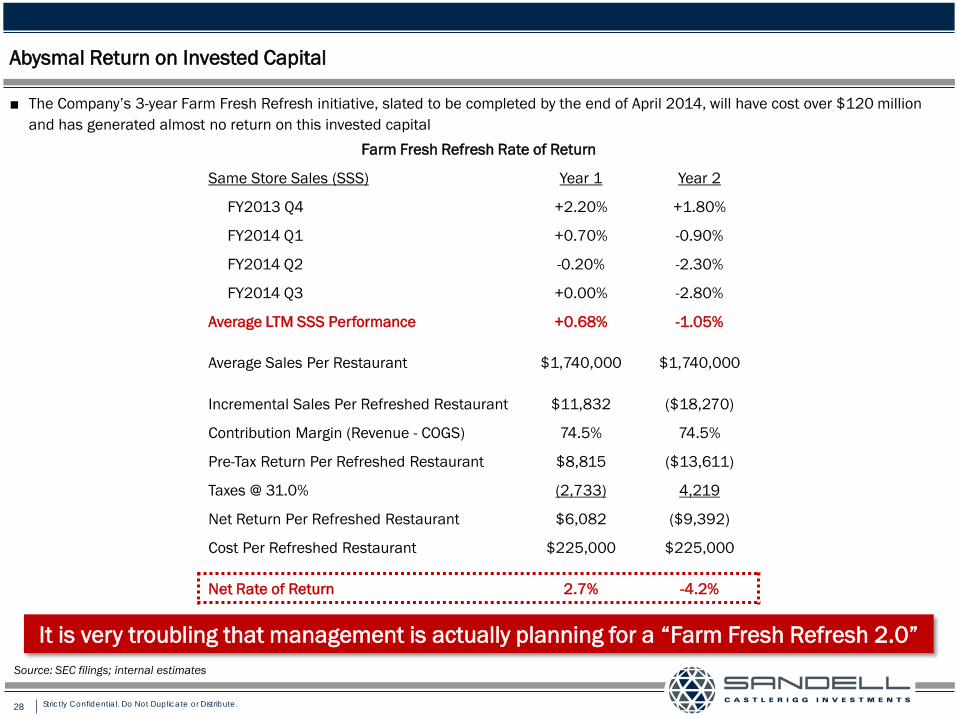
■ The Company’s 3-year Farm Fresh Refresh initiative, slated to be completed by the end of April 2014, will have cost over $120 million and has generated almost no return on this invested capital
It is very troubling that management is actually planning for a “Farm Fresh Refresh 2.0” Source: SEC filings; internal estimates
Farm Fresh Refresh Rate of Return
Same Store Sales (SSS) Year 1 Year 2
FY2013 Q4 +2.20% +1.80%
FY2014 Q1 +0.70% -0.90%
FY2014 Q2 -0.20% -2.30%
FY2014 Q3 +0.00% -2.80%
Average LTM SSS Performance +0.68% -1.05%
Average Sales Per Restaurant $1,740,000 $1,740,000
Incremental Sales Per Refreshed Restaurant $11,832 ($18,270)
Contribution Margin (Revenue - COGS) 74.5% 74.5%
Pre-Tax Return Per Refreshed Restaurant $8,815 ($13,611)
Taxes @ 31.0% (2,733) 4,219
Net Return Per Refreshed Restaurant $6,082 ($9,392)
Cost Per Refreshed Restaurant $225,000 $225,000
Net Rate of Return 2.7% -4.2%
29 Strictly Confidential. Do Not Duplicate or Distribute.
Extensive Real Estate Holdings
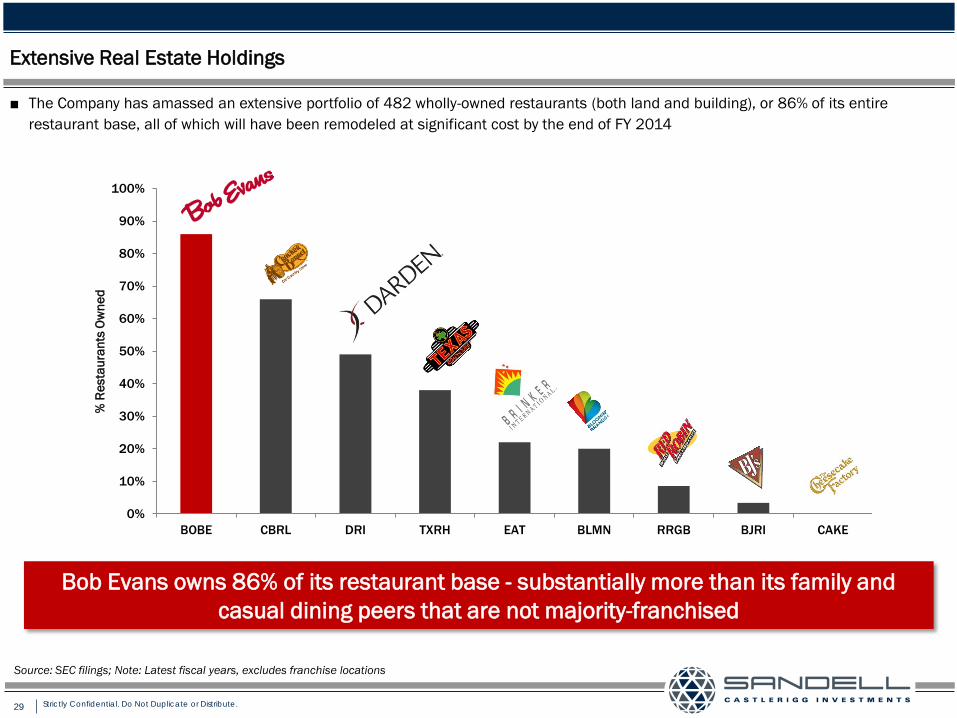
■ The Company has amassed an extensive portfolio of 482 wholly-owned restaurants (both land and building), or 86% of its entire restaurant base, all of which will have been remodeled at significant cost by the end of FY 2014
0%
10%
20%
30%
40%
50%
60%
70%
80%
90%
100%
BOBE CBRL DRI TXRH EAT BLMN RRGB BJRI CAKE
% R
esta
uran
ts O
wne
d
Bob Evans owns 86% of its restaurant base - substantially more than its family and casual dining peers that are not majority-franchised
Source: SEC filings; Note: Latest fiscal years, excludes franchise locations
30 Strictly Confidential. Do Not Duplicate or Distribute.
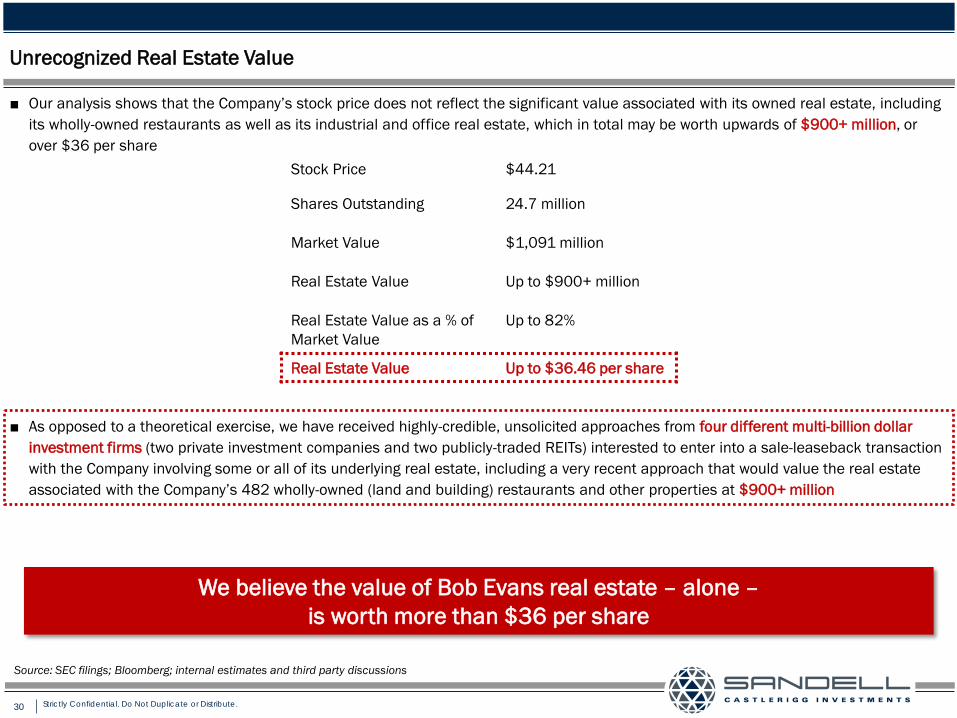
■ As opposed to a theoretical exercise, we have received highly-credible, unsolicited approaches from four different multi-billion dollar investment firms (two private investment companies and two publicly-traded REITs) interested to enter into a sale-leaseback transaction with the Company involving some or all of its underlying real estate, including a very recent approach that would value the real estate associated with the Company’s 482 wholly-owned (land and building) restaurants and other properties at $900+ million
Unrecognized Real Estate Value
■ Our analysis shows that the Company’s stock price does not reflect the significant value associated with its owned real estate, including its wholly-owned restaurants as well as its industrial and office real estate, which in total may be worth upwards of $900+ million, or over $36 per share
We believe the value of Bob Evans real estate – alone – is worth more than $36 per share
Stock Price $44.21
Shares Outstanding 24.7 million
Market Value $1,091 million
Real Estate Value Up to $900+ million
Real Estate Value as a % of Market Value
Up to 82%
Real Estate Value Up to $36.46 per share
Source: SEC filings; Bloomberg; internal estimates and third party discussions
31 Strictly Confidential. Do Not Duplicate or Distribute.
BEF Foods: Virtually No Synergies and Value Disconnect
■ BEF Foods, the Company’s packaged foods division, contributes little in the way of synergies
■ Volatile sow prices, a significant cost to BEF Foods, have had a dramatic, negative impact on the Company’s earnings
■ BEF Foods operates independently, has a separate management team, and provides little in the way of either revenue or cost synergies to Bob Evans
● Revenue synergies associated with the ownership of BEF Foods appear insignificant to nonexistent, as intersegment net sales of food products were a nominal 1.1% of total Company revenue for the first nine months of FY2014
● Management has not identified any specific cost synergies aside from vague, buzz-word laden commentary and has never to our knowledge quantified the cost savings derived from ownership of BEF Foods
● Dis-synergies may in fact exist due to the combined ownership of Bob Evans Restaurants and BEF Foods; as an example, note that the affiliation of BEF Foods with Bob Evans Restaurants may deter other competing restaurant chains from purchasing BEF Foods products, significantly curtailing the private label opportunities that may exist
■ Management is fighting a “two front war” and is already having difficulty managing the Bob Evans Restaurants business
● BEF Foods poses another challenge which management seems clearly incapable of addressing (note the bungled Sulfur Springs expansion, which resulted in $2.1 million of excess costs and inefficiencies in 3Q of FY2014 and an additional $1.5 million to $2.0 million of inefficiencies expected in 4Q of FY2014, along with the “supplier dispute” at BEF Foods, which led to an adverse $7 million sales impact in 3Q 2014)
Bob Evans should focus on getting its core restaurant business fixed rather than search for virtually nonexistent synergies with the BEF Foods business
Source: SEC filings
32 Strictly Confidential. Do Not Duplicate or Distribute.
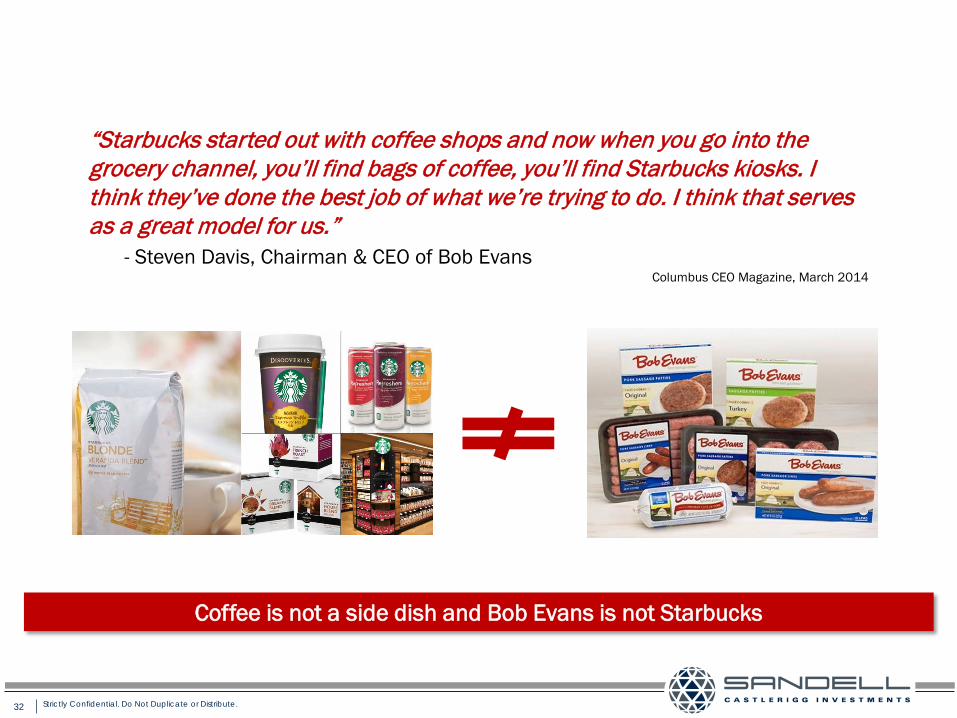
“Starbucks started out with coffee shops and now when you go into the grocery channel, you’ll find bags of coffee, you’ll find Starbucks kiosks. I think they’ve done the best job of what we’re trying to do. I think that serves as a great model for us.”
- Steven Davis, Chairman & CEO of Bob Evans Columbus CEO Magazine, March 2014
Coffee is not a side dish and Bob Evans is not Starbucks
33 Strictly Confidential. Do Not Duplicate or Distribute.
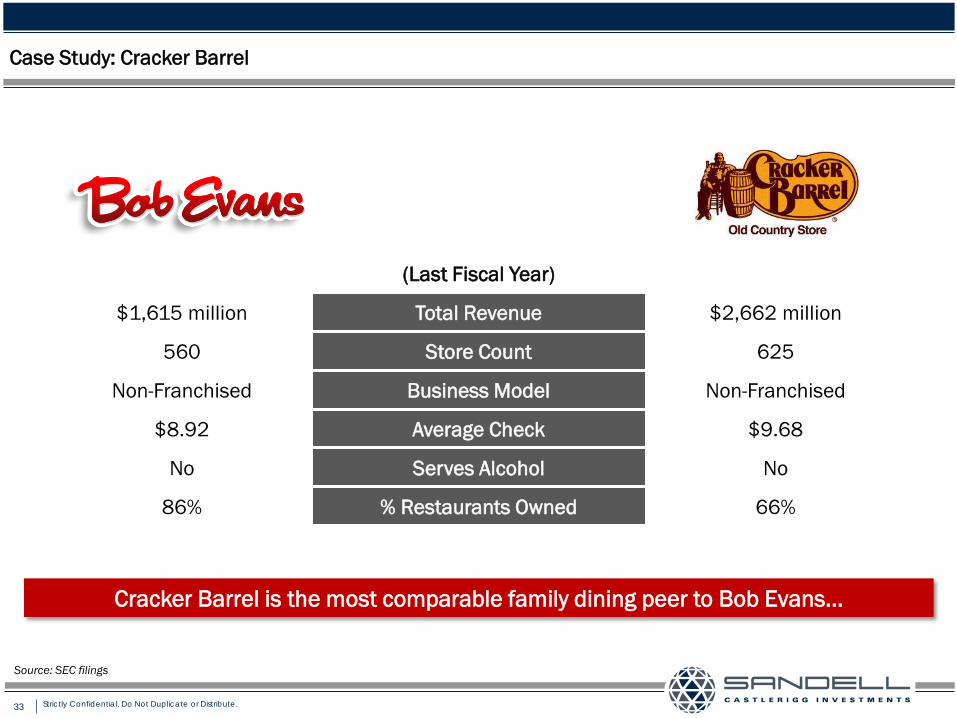
Case Study: Cracker Barrel
(Last Fiscal Year)
$1,615 million Total Revenue $2,662 million
560 Store Count 625
Non-Franchised Business Model Non-Franchised
$8.92 Average Check $9.68
No Serves Alcohol No
86% % Restaurants Owned 66%
Cracker Barrel is the most comparable family dining peer to Bob Evans…
Source: SEC filings
34 Strictly Confidential. Do Not Duplicate or Distribute.
Case Study: Cracker Barrel (cont.)
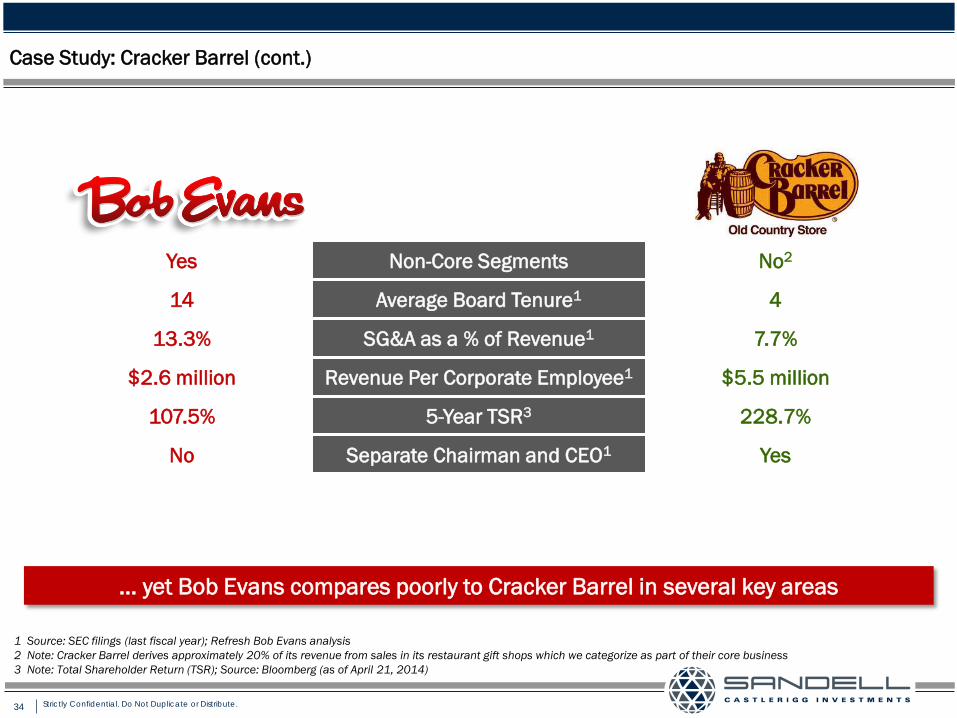
Yes Non-Core Segments No2
14 Average Board Tenure1 4
13.3% SG&A as a % of Revenue1 7.7%
$2.6 million Revenue Per Corporate Employee1 $5.5 million
107.5% 5-Year TSR3 228.7%
No Separate Chairman and CEO1 Yes
… yet Bob Evans compares poorly to Cracker Barrel in several key areas
1 Source: SEC filings (last fiscal year); Refresh Bob Evans analysis 2 Note: Cracker Barrel derives approximately 20% of its revenue from sales in its restaurant gift shops which we categorize as part of their core business 3 Note: Total Shareholder Return (TSR); Source: Bloomberg (as of April 21, 2014)
35 Strictly Confidential. Do Not Duplicate or Distribute.
Case Study: Cracker Barrel (cont.)
Bob Evans could learn from Cracker Barrel's recent value-creating maneuvers
1 Source: Cracker Barrel Q4 2011 Earnings Call, September 13, 2011 2 Source: Bloomberg (as of April 21, 2014)
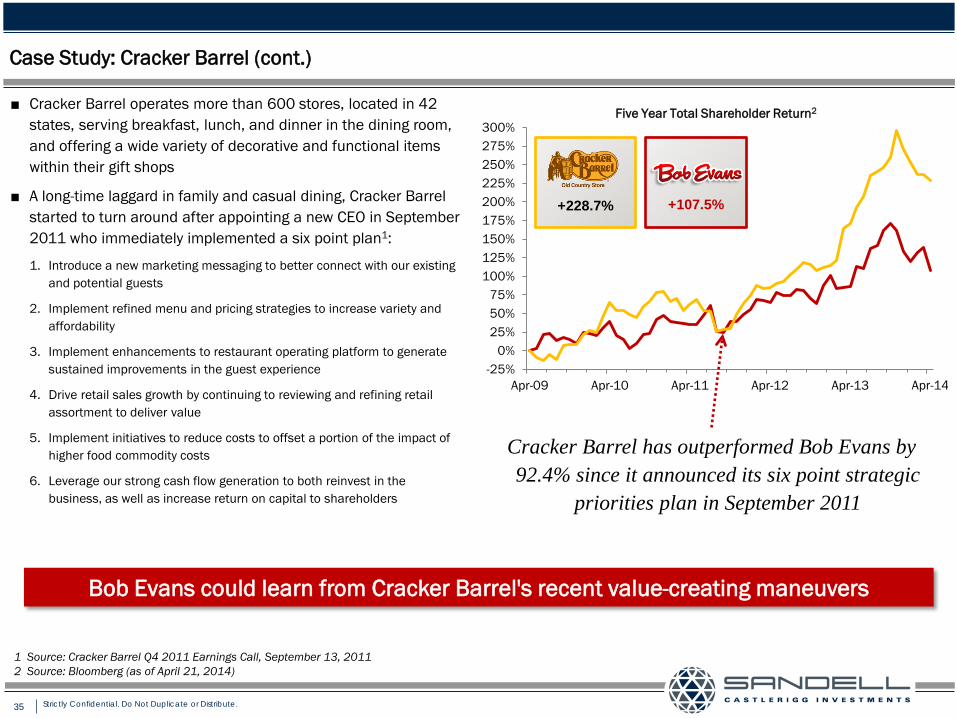
■ Cracker Barrel operates more than 600 stores, located in 42 states, serving breakfast, lunch, and dinner in the dining room, and offering a wide variety of decorative and functional items within their gift shops
■ A long-time laggard in family and casual dining, Cracker Barrel started to turn around after appointing a new CEO in September 2011 who immediately implemented a six point plan1:
1. Introduce a new marketing messaging to better connect with our existing and potential guests
2. Implement refined menu and pricing strategies to increase variety and affordability
3. Implement enhancements to restaurant operating platform to generate sustained improvements in the guest experience
4. Drive retail sales growth by continuing to reviewing and refining retail assortment to deliver value
5. Implement initiatives to reduce costs to offset a portion of the impact of higher food commodity costs
6. Leverage our strong cash flow generation to both reinvest in the business, as well as increase return on capital to shareholders
-25%0%
25%50%75%
100%125%150%175%200%225%250%275%300%
Apr-09 Apr-10 Apr-11 Apr-12 Apr-13 Apr-14
Five Year Total Shareholder Return2
+228.7% +107.5%
Cracker Barrel has outperformed Bob Evans by 92.4% since it announced its six point strategic
priorities plan in September 2011
36 Strictly Confidential. Do Not Duplicate or Distribute.
Source of Problems: A Stale and Entrenched Board
Refresh Bob Evans
37 Strictly Confidential. Do Not Duplicate or Distribute.
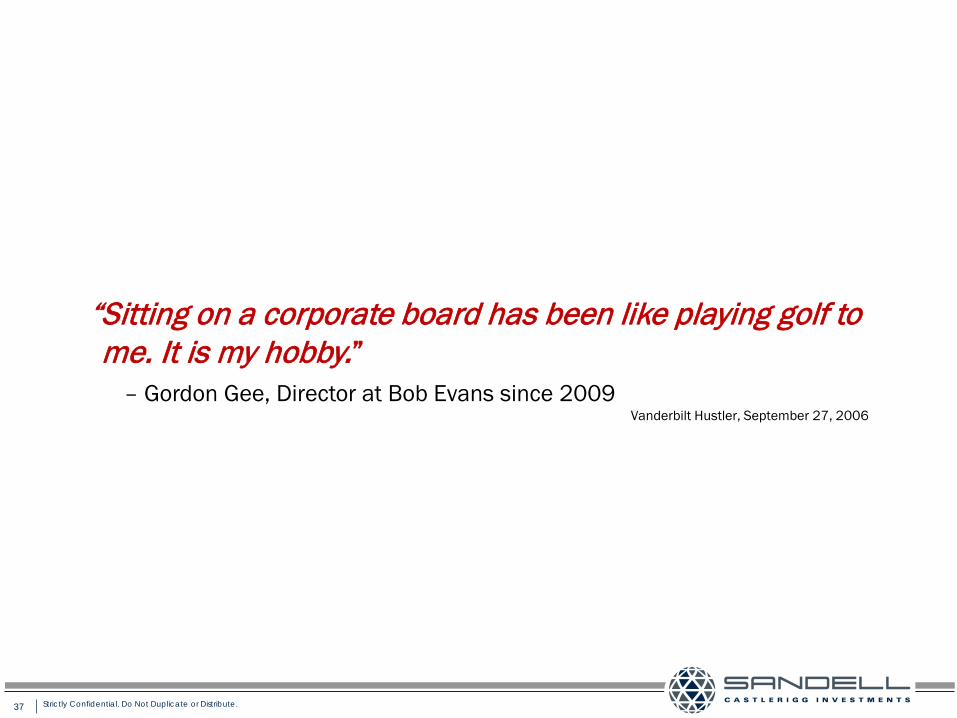
“Sitting on a corporate board has been like playing golf to me. It is my hobby.”
– Gordon Gee, Director at Bob Evans since 2009 Vanderbilt Hustler, September 27, 2006
38 Strictly Confidential. Do Not Duplicate or Distribute.
A Stale Board
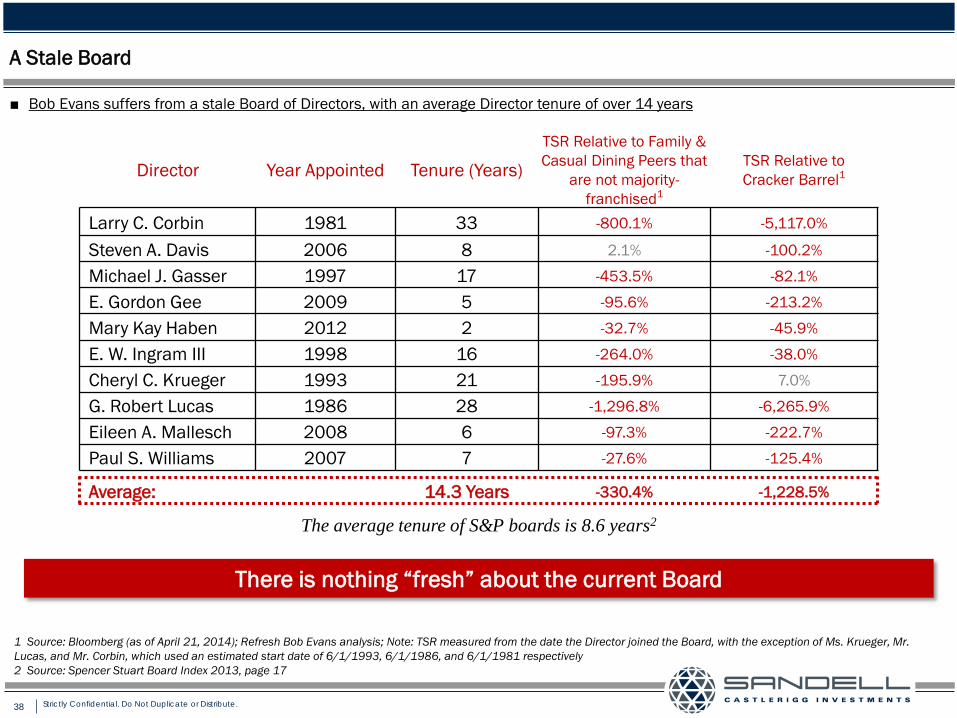
■ Bob Evans suffers from a stale Board of Directors, with an average Director tenure of over 14 years
Director Year Appointed Tenure (Years) TSR Relative to Family & Casual Dining Peers that
are not majority-franchised1
TSR Relative to Cracker Barrel1
Larry C. Corbin 1981 33 -800.1% -5,117.0%
Steven A. Davis 2006 8 2.1% -100.2%
Michael J. Gasser 1997 17 -453.5% -82.1%
E. Gordon Gee 2009 5 -95.6% -213.2%
Mary Kay Haben 2012 2 -32.7% -45.9%
E. W. Ingram III 1998 16 -264.0% -38.0%
Cheryl C. Krueger 1993 21 -195.9% 7.0%
G. Robert Lucas 1986 28 -1,296.8% -6,265.9%
Eileen A. Mallesch 2008 6 -97.3% -222.7%
Paul S. Williams 2007 7 -27.6% -125.4%
Average: 14.3 Years -330.4% -1,228.5%
There is nothing “fresh” about the current Board
1 Source: Bloomberg (as of April 21, 2014); Refresh Bob Evans analysis; Note: TSR measured from the date the Director joined the Board, with the exception of Ms. Krueger, Mr. Lucas, and Mr. Corbin, which used an estimated start date of 6/1/1993, 6/1/1986, and 6/1/1981 respectively 2 Source: Spencer Stuart Board Index 2013, page 17
The average tenure of S&P boards is 8.6 years2
39 Strictly Confidential. Do Not Duplicate or Distribute.
Board Inaction: The History of Mimi’s Café
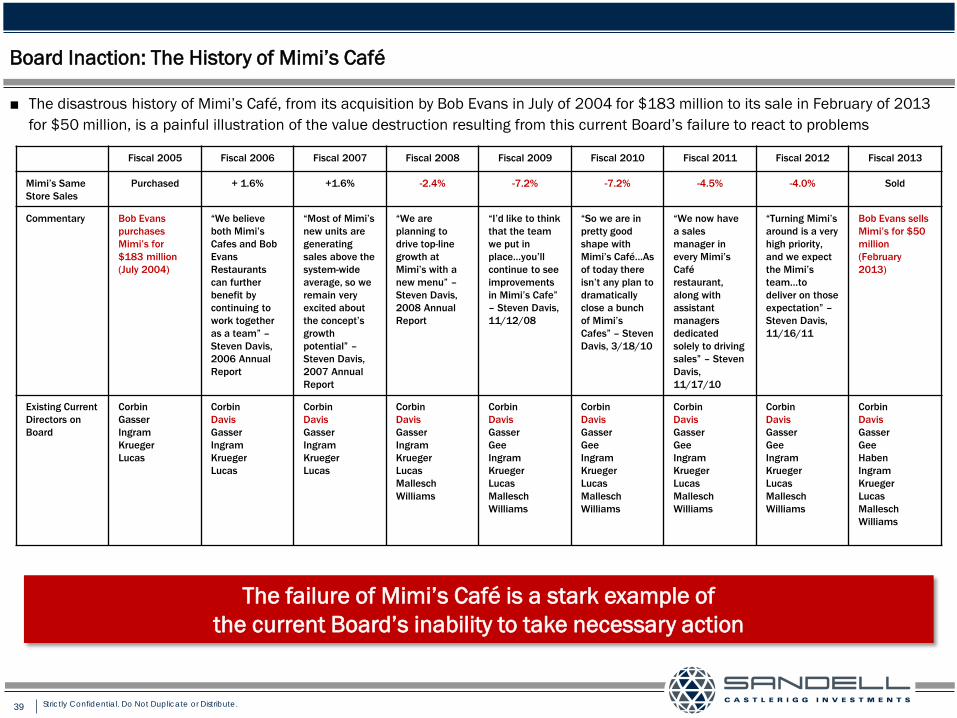
■ The disastrous history of Mimi’s Café, from its acquisition by Bob Evans in July of 2004 for $183 million to its sale in February of 2013 for $50 million, is a painful illustration of the value destruction resulting from this current Board’s failure to react to problems
Fiscal 2005 Fiscal 2006 Fiscal 2007 Fiscal 2008 Fiscal 2009 Fiscal 2010 Fiscal 2011 Fiscal 2012 Fiscal 2013
Mimi’s Same Store Sales
Purchased + 1.6% +1.6% -2.4% -7.2% -7.2% -4.5% -4.0% Sold
Commentary Bob Evans purchases Mimi’s for $183 million (July 2004)
“We believe both Mimi’s Cafes and Bob Evans Restaurants can further benefit by continuing to work together as a team” – Steven Davis, 2006 Annual Report
“Most of Mimi’s new units are generating sales above the system-wide average, so we remain very excited about the concept’s growth potential” – Steven Davis, 2007 Annual Report
“We are planning to drive top-line growth at Mimi’s with a new menu” – Steven Davis, 2008 Annual Report
“I’d like to think that the team we put in place…you’ll continue to see improvements in Mimi’s Cafe” – Steven Davis, 11/12/08
“So we are in pretty good shape with Mimi’s Café…As of today there isn’t any plan to dramatically close a bunch of Mimi’s Cafes” – Steven Davis, 3/18/10
“We now have a sales manager in every Mimi’s Café restaurant, along with assistant managers dedicated solely to driving sales” – Steven Davis, 11/17/10
“Turning Mimi’s around is a very high priority, and we expect the Mimi’s team…to deliver on those expectation” – Steven Davis, 11/16/11
Bob Evans sells Mimi’s for $50 million (February 2013)
Existing Current Directors on Board
Corbin Gasser Ingram Krueger Lucas
Corbin Davis Gasser Ingram Krueger Lucas
Corbin Davis Gasser Ingram Krueger Lucas
Corbin Davis Gasser Ingram Krueger Lucas Mallesch Williams
Corbin Davis Gasser Gee Ingram Krueger Lucas Mallesch Williams
Corbin Davis Gasser Gee Ingram Krueger Lucas Mallesch Williams
Corbin Davis Gasser Gee Ingram Krueger Lucas Mallesch Williams
Corbin Davis Gasser Gee Ingram Krueger Lucas Mallesch Williams
Corbin Davis Gasser Gee Haben Ingram Krueger Lucas Mallesch Williams
The failure of Mimi’s Café is a stark example of the current Board’s inability to take necessary action
40 Strictly Confidential. Do Not Duplicate or Distribute.
Mimi’s Café: Even Less than Meets the Eye
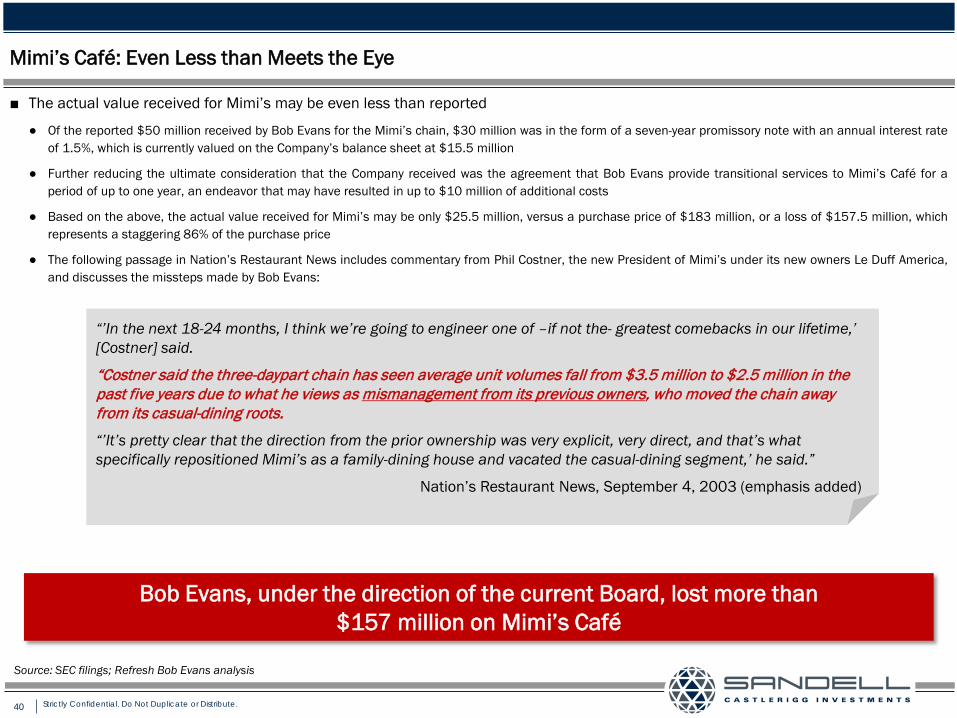
■ The actual value received for Mimi’s may be even less than reported
● Of the reported $50 million received by Bob Evans for the Mimi’s chain, $30 million was in the form of a seven-year promissory note with an annual interest rate of 1.5%, which is currently valued on the Company’s balance sheet at $15.5 million
● Further reducing the ultimate consideration that the Company received was the agreement that Bob Evans provide transitional services to Mimi’s Café for a period of up to one year, an endeavor that may have resulted in up to $10 million of additional costs
● Based on the above, the actual value received for Mimi’s may be only $25.5 million, versus a purchase price of $183 million, or a loss of $157.5 million, which represents a staggering 86% of the purchase price
● The following passage in Nation’s Restaurant News includes commentary from Phil Costner, the new President of Mimi’s under its new owners Le Duff America, and discusses the missteps made by Bob Evans:
Bob Evans, under the direction of the current Board, lost more than $157 million on Mimi’s Café
“’In the next 18-24 months, I think we’re going to engineer one of –if not the- greatest comebacks in our lifetime,’ [Costner] said.
“Costner said the three-daypart chain has seen average unit volumes fall from $3.5 million to $2.5 million in the past five years due to what he views as mismanagement from its previous owners, who moved the chain away from its casual-dining roots.
“’It’s pretty clear that the direction from the prior ownership was very explicit, very direct, and that’s what specifically repositioned Mimi’s as a family-dining house and vacated the casual-dining segment,’ he said.”
Nation’s Restaurant News, September 4, 2003 (emphasis added)
Source: SEC filings; Refresh Bob Evans analysis
41 Strictly Confidential. Do Not Duplicate or Distribute.
A Highly Conflicted Board
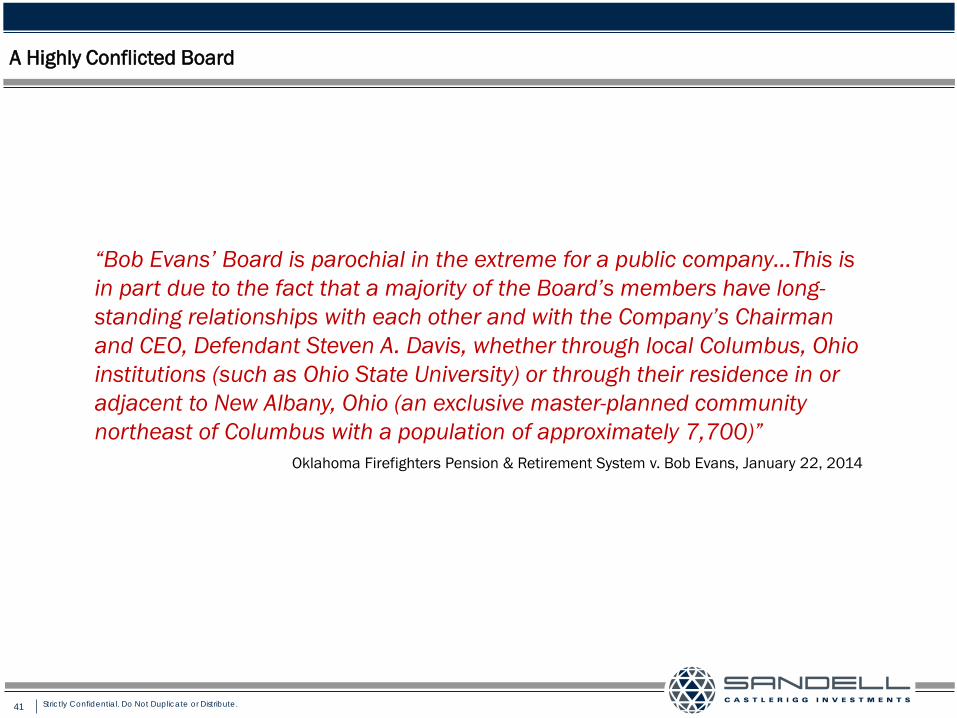
“Bob Evans’ Board is parochial in the extreme for a public company…This is in part due to the fact that a majority of the Board’s members have long-standing relationships with each other and with the Company’s Chairman and CEO, Defendant Steven A. Davis, whether through local Columbus, Ohio institutions (such as Ohio State University) or through their residence in or adjacent to New Albany, Ohio (an exclusive master-planned community northeast of Columbus with a population of approximately 7,700)”
Oklahoma Firefighters Pension & Retirement System v. Bob Evans, January 22, 2014
42 Strictly Confidential. Do Not Duplicate or Distribute.
A Highly Conflicted Board
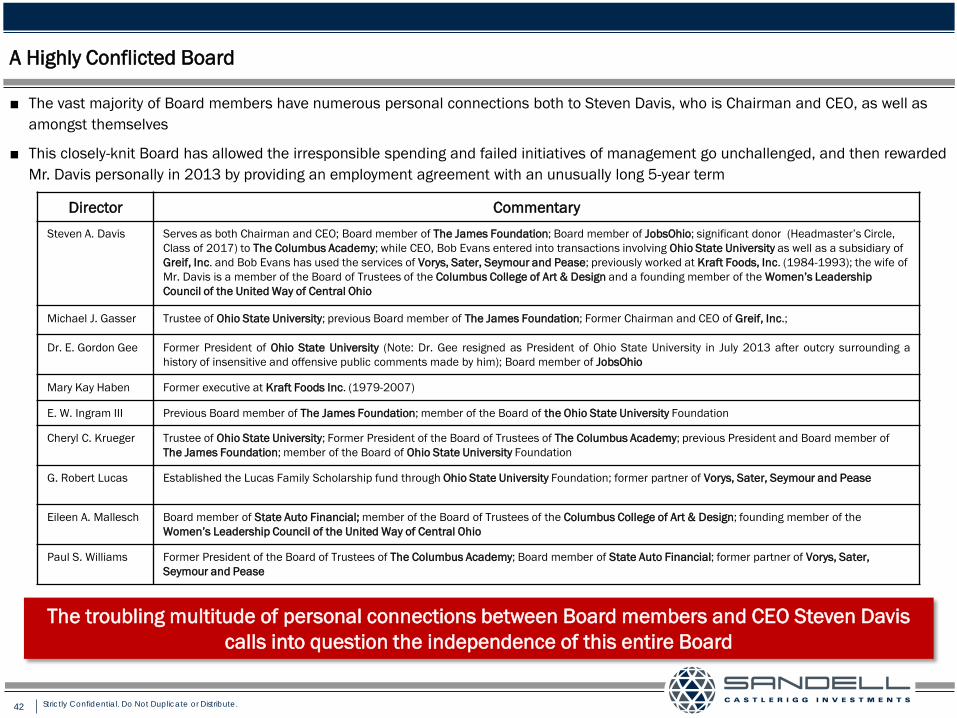
■ The vast majority of Board members have numerous personal connections both to Steven Davis, who is Chairman and CEO, as well as amongst themselves
■ This closely-knit Board has allowed the irresponsible spending and failed initiatives of management go unchallenged, and then rewarded Mr. Davis personally in 2013 by providing an employment agreement with an unusually long 5-year term
Director Commentary Steven A. Davis Serves as both Chairman and CEO; Board member of The James Foundation; Board member of JobsOhio; significant donor (Headmaster’s Circle,
Class of 2017) to The Columbus Academy; while CEO, Bob Evans entered into transactions involving Ohio State University as well as a subsidiary of Greif, Inc. and Bob Evans has used the services of Vorys, Sater, Seymour and Pease; previously worked at Kraft Foods, Inc. (1984-1993); the wife of Mr. Davis is a member of the Board of Trustees of the Columbus College of Art & Design and a founding member of the Women’s Leadership Council of the United Way of Central Ohio
Michael J. Gasser Trustee of Ohio State University; previous Board member of The James Foundation; Former Chairman and CEO of Greif, Inc.;
Dr. E. Gordon Gee Former President of Ohio State University (Note: Dr. Gee resigned as President of Ohio State University in July 2013 after outcry surrounding a history of insensitive and offensive public comments made by him); Board member of JobsOhio
Mary Kay Haben Former executive at Kraft Foods Inc. (1979-2007)
E. W. Ingram III Previous Board member of The James Foundation; member of the Board of the Ohio State University Foundation
Cheryl C. Krueger Trustee of Ohio State University; Former President of the Board of Trustees of The Columbus Academy; previous President and Board member of The James Foundation; member of the Board of Ohio State University Foundation
G. Robert Lucas Established the Lucas Family Scholarship fund through Ohio State University Foundation; former partner of Vorys, Sater, Seymour and Pease
Eileen A. Mallesch Board member of State Auto Financial; member of the Board of Trustees of the Columbus College of Art & Design; founding member of the Women’s Leadership Council of the United Way of Central Ohio
Paul S. Williams Former President of the Board of Trustees of The Columbus Academy; Board member of State Auto Financial; former partner of Vorys, Sater, Seymour and Pease
The troubling multitude of personal connections between Board members and CEO Steven Davis calls into question the independence of this entire Board
43 Strictly Confidential. Do Not Duplicate or Distribute.
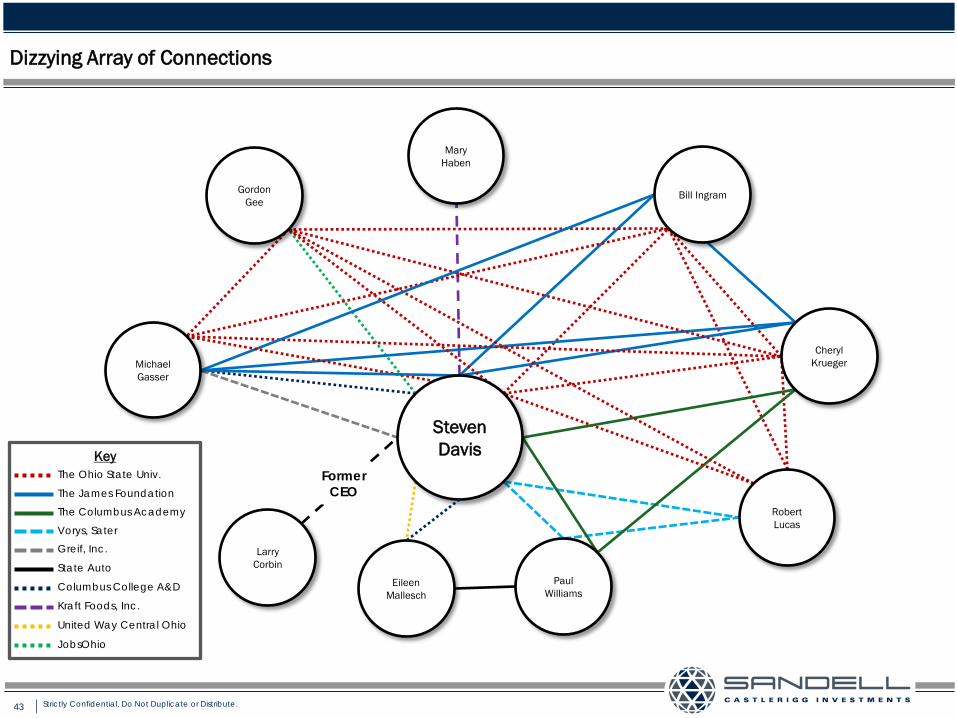
Key
United Way Central Ohio
The James Foundation
The Columbus Academy
Vorys, Sater
Greif, Inc.
State Auto
Columbus College A&D
Kraft Foods, Inc.
The Ohio State Univ.
JobsOhio
Dizzying Array of Connections
Gordon Gee
Mary Haben
Eileen Mallesch
Paul Williams
Robert Lucas
Cheryl Krueger
Bill Ingram
Michael Gasser
Steven Davis
Larry Corbin
FormerCEO
44 Strictly Confidential. Do Not Duplicate or Distribute.
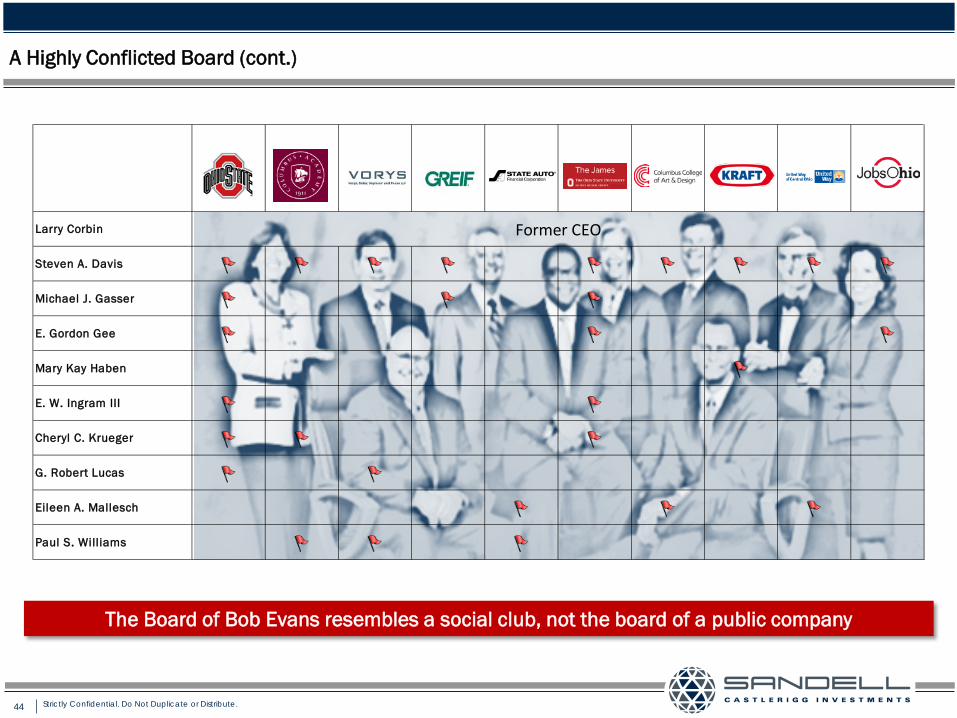
The Board of Bob Evans resembles a social club, not the board of a public company
Larry Corbin Former CEO
Steven A. Davis
Michael J. Gasser
E. Gordon Gee
Mary Kay Haben
E. W. Ingram III
Cheryl C. Krueger
G. Robert Lucas
Eileen A. Mallesch
Paul S. Williams
A Highly Conflicted Board (cont.)
45 Strictly Confidential. Do Not Duplicate or Distribute.
Board’s Entrenchment Action Forced Sandell Litigation
■ In November of 2011, the Board sought to impose an improper Bylaw restriction on shareholders that would have further entrenched the Board by severely limiting the ability of shareholders to effect change by amending the Company’s Bylaws
● Specifically, the Board unilaterally adopted, without shareholder approval, a requirement that an 80% supermajority shareholder vote be obtained in order for shareholders to amend the Bylaws
● This amendment was made less than three months after shareholders had overwhelmingly voted to reduce such a supermajority requirement to a majority threshold, and in any event was made in contravention of the terms of the then existing, Board-proposed bylaw
■ Due to this Board’s action, Sandell filed a lawsuit against the Company and its Directors in the Court of Chancery of the State of Delaware in January of 2014 in order to restore the rights of shareholders to amend the Company’s Bylaws by majority vote
■ Shortly after this lawsuit was filed the Company reversed its improper previous Bylaw restriction
■ We are confident that this Board would not have reversed its improper attempt to disenfranchise shareholders without our efforts and the threat of judicial scrutiny
We believe that the Board’s recent attempt at entrenchment clearly demonstrates its contempt for the Company’s shareholders
46 Strictly Confidential. Do Not Duplicate or Distribute.
Oklahoma Firefighters vs. Bob Evans
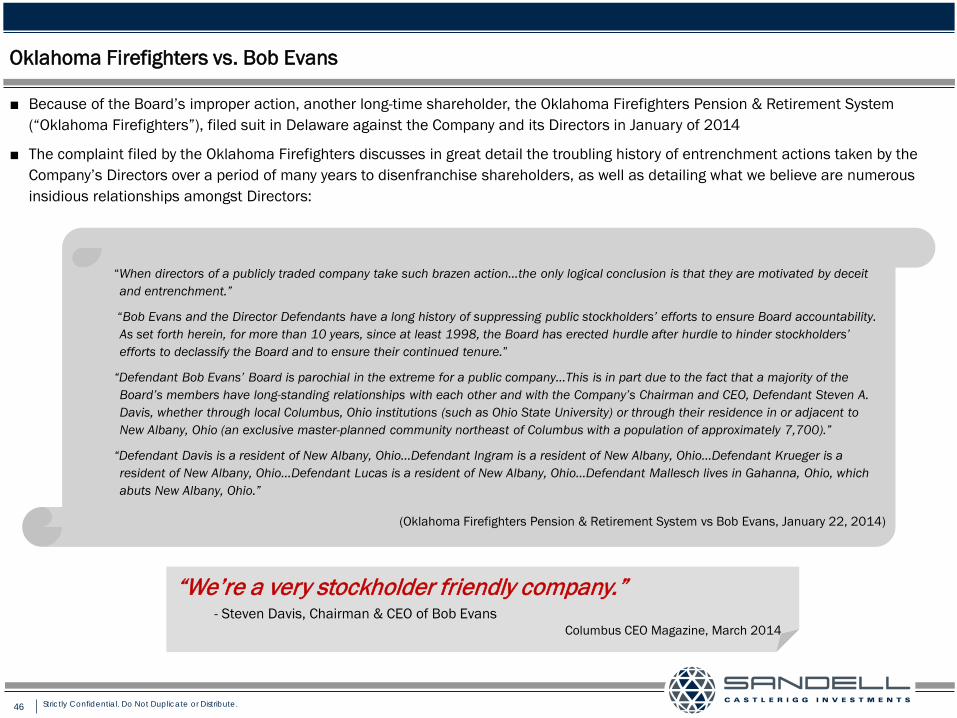
■ Because of the Board’s improper action, another long-time shareholder, the Oklahoma Firefighters Pension & Retirement System (“Oklahoma Firefighters”), filed suit in Delaware against the Company and its Directors in January of 2014
■ The complaint filed by the Oklahoma Firefighters discusses in great detail the troubling history of entrenchment actions taken by the Company’s Directors over a period of many years to disenfranchise shareholders, as well as detailing what we believe are numerous insidious relationships amongst Directors:
“When directors of a publicly traded company take such brazen action…the only logical conclusion is that they are motivated by deceit and entrenchment.”
“Bob Evans and the Director Defendants have a long history of suppressing public stockholders’ efforts to ensure Board accountability. As set forth herein, for more than 10 years, since at least 1998, the Board has erected hurdle after hurdle to hinder stockholders’ efforts to declassify the Board and to ensure their continued tenure.”
“Defendant Bob Evans’ Board is parochial in the extreme for a public company…This is in part due to the fact that a majority of the Board’s members have long-standing relationships with each other and with the Company’s Chairman and CEO, Defendant Steven A. Davis, whether through local Columbus, Ohio institutions (such as Ohio State University) or through their residence in or adjacent to New Albany, Ohio (an exclusive master-planned community northeast of Columbus with a population of approximately 7,700).”
“Defendant Davis is a resident of New Albany, Ohio…Defendant Ingram is a resident of New Albany, Ohio…Defendant Krueger is a resident of New Albany, Ohio…Defendant Lucas is a resident of New Albany, Ohio…Defendant Mallesch lives in Gahanna, Ohio, which abuts New Albany, Ohio.”
(Oklahoma Firefighters Pension & Retirement System vs Bob Evans, January 22, 2014)
“We’re a very stockholder friendly company.” - Steven Davis, Chairman & CEO of Bob Evans
Columbus CEO Magazine, March 2014
47 Strictly Confidential. Do Not Duplicate or Distribute.
Solution: A Fresh, Independent, Highly-Qualified Board to Effect Change
Refresh Bob Evans
48 Strictly Confidential. Do Not Duplicate or Distribute.
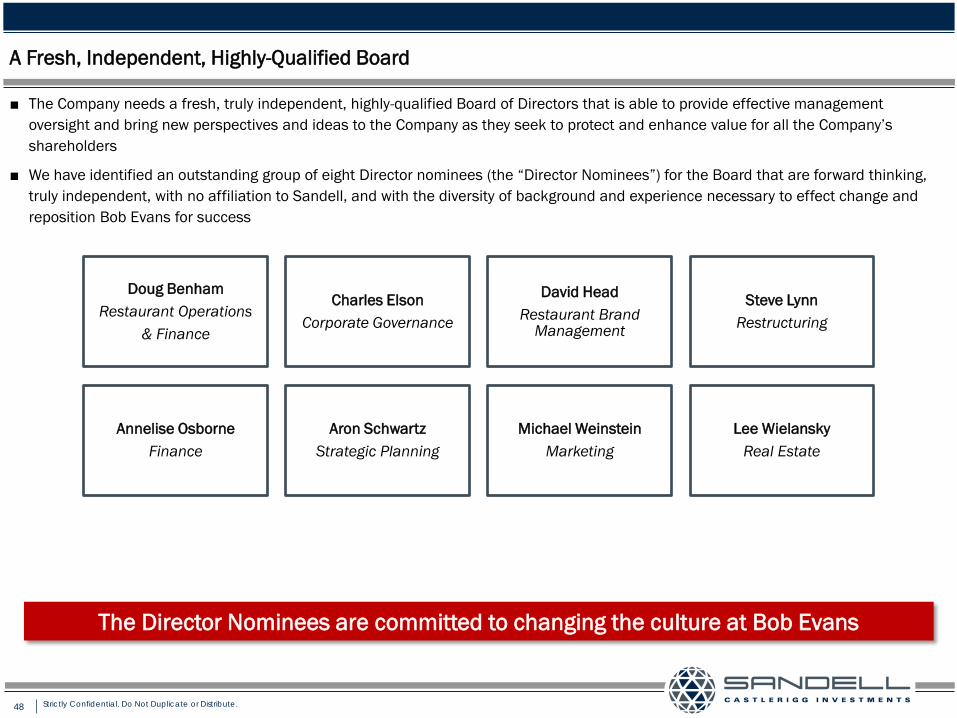
A Fresh, Independent, Highly-Qualified Board
■ The Company needs a fresh, truly independent, highly-qualified Board of Directors that is able to provide effective management oversight and bring new perspectives and ideas to the Company as they seek to protect and enhance value for all the Company’s shareholders
■ We have identified an outstanding group of eight Director nominees (the “Director Nominees”) for the Board that are forward thinking, truly independent, with no affiliation to Sandell, and with the diversity of background and experience necessary to effect change and reposition Bob Evans for success
Doug Benham Restaurant Operations
& Finance
Charles Elson Corporate Governance
David Head Restaurant Brand
Management
Steve Lynn Restructuring
Annelise Osborne Finance
Aron Schwartz Strategic Planning
Michael Weinstein Marketing
Lee Wielansky Real Estate
The Director Nominees are committed to changing the culture at Bob Evans
49 Strictly Confidential. Do Not Duplicate or Distribute.
Doug Benham – Restaurant Operations & Finance
Former President and CEO of Arby’s Restaurant Group, Doug Benham led the revitalization of the $3 billion Arby’s chain of 3,500 restaurants, increasing company-operated restaurant EBITDA by over 100%
Mr. Benham was previously Chief Financial Officer and a director of RTM Restaurant Group, the largest franchisee of any nature in the United States, where he was instrumental in leading the strategic and financial planning for the company as its store base increased from 212 to 773 restaurants
Mr. Benham has served on the board of directors of several companies, including the publicly-traded restaurant companies O’Charley’s Inc. from 2008 until its sale in 2012 and Sonic Corporation from 2009 to 2014
Mr. Benham is a Certified Public Accountant and has a wide range of expertise that spans all areas of restaurant operations and finance
50 Strictly Confidential. Do Not Duplicate or Distribute.
Charles Elson – Corporate Governance
Director of the John L. Weinberg Center for Corporate Governance at the University of Delaware, Charles Elson is one of the foremost authorities on corporate governance issues in the United States
Professor Elson is “Of Counsel” to the law firm of Holland & Knight and holds the Edgar S. Woolard, Jr. Chair in Corporate Governance at the University of Delaware
Professor Elson has written extensively on the subject of boards of directors and is Vice Chairman of the ABA Business Law Section’s Committee on Corporate Governance
In addition to his extensive knowledge of and experience in matters relating to corporate governance, Professor Elson has served on the board of directors of HealthSouth since 2004, in addition to the previous boards of AutoZone, Alderwoods Group, Nuevo Energy, Sunbeam, and Circon
51 Strictly Confidential. Do Not Duplicate or Distribute.
David Head – Restaurant Brand Management
President and CEO of Primanti Brothers, Inc., David Head has a broad skill set and deep operational experience in the restaurant industry, bringing valuable perspective through his track record of refining and repositioning restaurant brands
With over 35 years of experience in the industry, Mr. Head is widely regarded as one of the leading brand revitalization experts in the U.S.
Mr. Head was formerly President and CEO of O’Charley’s Inc. where he oversaw its successful turnaround and subsequent sale in 2012
In addition, Mr. Head was previously CEO and President of Captain D’s Seafood Kitchen, an operator and franchisor of over 500 quick-service seafood restaurants generating nearly $500 million in annual revenue, as well as President and CEO of Romacorp and CEO of the former Houlihan’s Restaurant Group
52 Strictly Confidential. Do Not Duplicate or Distribute.
Steve Lynn– Restructuring
Founder and Partner of Reconstruction Partners, LLC, a firm that offers strategy, restructuring, refranchising, and interim management services to chain restaurant companies, Steve Lynn has over 40 years of experience in the restaurant industry
Mr. Lynn spent 12 years as Chairman and CEO of Sonic Corporation, where he built the management team that transformed the company into the nation’s largest chain of drive-in restaurants with over $3 billion in system-wide sales
Subsequent to Sonic, Mr. Lyon led Shoney’s, Inc. as the company’s Chairman and CEO, where he oversaw a chain of over 1,500 owned and franchised restaurants
Mr. Lynn currently sits on the board of Krispy Kreme Doughnuts Inc. and was the past Chairman of the International Franchise Association
53 Strictly Confidential. Do Not Duplicate or Distribute.
Annelise Osborne – Finance
Credit Officer at Moody’s Investor Services, Annelise Osborne has over 15 years of finance experience that encompasses a wide range of transactions
Ms. Osborne has a deep knowledge of real estate and has led sizeable teams of analysts involved in assessing transactions involving floating and fixed rate credits across various asset classes
Ms. Osborne, a CMBS committee chair, has been a voting member of various REIT, CDO, and Public Finance ratings committees and led the Moody’s team responsible for developing the firm-wide methodology and quantitative framework for the valuation and analysis of loans secured by office properties
Ms. Osborne previously worked as a Deputy Director and Senior Consultant at Jones Lang LaSalle and was an Associate at W.P. Carey
Ms. Osborne graduated from The College of William and Mary with a B.A. in Economics and has an M.B.A. from Columbia Business School
54 Strictly Confidential. Do Not Duplicate or Distribute.
Aron Schwartz – Strategic Planning
Founder of Constructivist Capital, LLC, Aron Schwartz has been a private equity professional for over 15 years and has been involved in the acquisition, supervision, and growth of many companies
Mr. Schwartz was a Managing Director at the private equity firm Fenway Partners from 1999 to 2011, where he actively served on the boards of directors and was intimately involved in the financing and operations of several portfolio companies, with significant experience in many functional areas including strategic planning, corporate finance, and management selection
Mr. Schwartz was previously an Associate in the Financial Entrepreneurs Group at Salomon Smith Barney
Mr. Schwartz received a J.D. and an M.B.A. with honors from UCLA and graduated cum laude with a B.A. in International relations and a B.S.E. in Economics from The Wharton School at the University of Pennsylvania
Mr. Schwartz is a Certified Management Accountant and a member of the California State Bar
55 Strictly Confidential. Do Not Duplicate or Distribute.
Michael Weinstein – Marketing
Former CEO of the Triarc Beverage Group, where he successfully orchestrated the purchase of Snapple for $300 million and its subsequent sale three years later for $1.5 billion, Mr. Weinstein is a highly-respected professional who has delivered tremendous value to shareholders at several companies
Previously, Mr. Weinstein was President and COO of A&W Brands subsequent to its IPO through to its sale to Cadbury Schweppes, which returned initial equity holders over 200 times their original investment in a seven year period
Mr. Weinstein brings significant sales, marketing, and product development expertise, particularly as it relates to food and beverage products, and has served on the board of Dr Pepper Snapple from 2009 to 2012 as well as the board of the HJ Heinz Company from 2006 until its sale to 3G Capital in 2013
Mr. Weinstein graduated with a B.A. degree with honors in Economics from Lafayette College and received an M.B.A. from Harvard Business School
56 Strictly Confidential. Do Not Duplicate or Distribute.
Lee Wielansky– Real Estate
Chairman and CEO of Midland Development Group, which focuses on the development of retail properties in the mid-west and southeast and was the largest developer of Kroger supermarket-anchored shopping centers in the United States, Lee Wielansky has over 37 years of real estate experience
Mr. Wielansky was previously President and CEO of JDN Development Company, which was a wholly-owned subsidiary of JDN Realty Corporation, a publicly-traded REIT with more than $1 billion in assets that merged with Developers Diversified Realty Corporation
Mr. Wielansky was formerly Managing Director – Investments and on the board of Regency Centers Corporation, a leading operator and developer of shopping centers encompassing more than 30 million square feet of real estate in 300 centers across in the United States
Mr. Wielansky is Lead Trustee of the $1.5 billion publicly-traded REIT Acadia Realty as well as a director of Isle of Capri Casinos and Pulaski Financial Corp
57 Strictly Confidential. Do Not Duplicate or Distribute.
Continuity and Transition Planning
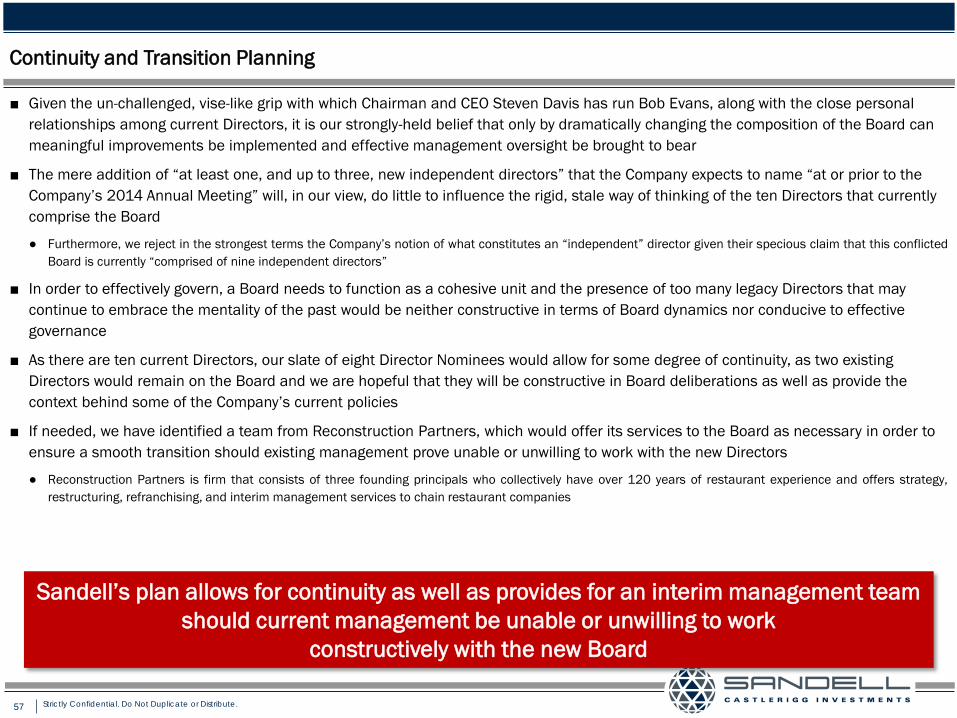
■ Given the un-challenged, vise-like grip with which Chairman and CEO Steven Davis has run Bob Evans, along with the close personal relationships among current Directors, it is our strongly-held belief that only by dramatically changing the composition of the Board can meaningful improvements be implemented and effective management oversight be brought to bear
■ The mere addition of “at least one, and up to three, new independent directors” that the Company expects to name “at or prior to the Company’s 2014 Annual Meeting” will, in our view, do little to influence the rigid, stale way of thinking of the ten Directors that currently comprise the Board
● Furthermore, we reject in the strongest terms the Company’s notion of what constitutes an “independent” director given their specious claim that this conflicted Board is currently “comprised of nine independent directors”
■ In order to effectively govern, a Board needs to function as a cohesive unit and the presence of too many legacy Directors that may continue to embrace the mentality of the past would be neither constructive in terms of Board dynamics nor conducive to effective governance
■ As there are ten current Directors, our slate of eight Director Nominees would allow for some degree of continuity, as two existing Directors would remain on the Board and we are hopeful that they will be constructive in Board deliberations as well as provide the context behind some of the Company’s current policies
■ If needed, we have identified a team from Reconstruction Partners, which would offer its services to the Board as necessary in order to ensure a smooth transition should existing management prove unable or unwilling to work with the new Directors
● Reconstruction Partners is firm that consists of three founding principals who collectively have over 120 years of restaurant experience and offers strategy, restructuring, refranchising, and interim management services to chain restaurant companies
Sandell’s plan allows for continuity as well as provides for an interim management team should current management be unable or unwilling to work
constructively with the new Board
58 Strictly Confidential. Do Not Duplicate or Distribute.
Comprehensive Improvements: Operational, Financial, Strategic
Refresh Bob Evans
59 Strictly Confidential. Do Not Duplicate or Distribute.
Comprehensive Improvements: Operational, Financial, Strategic
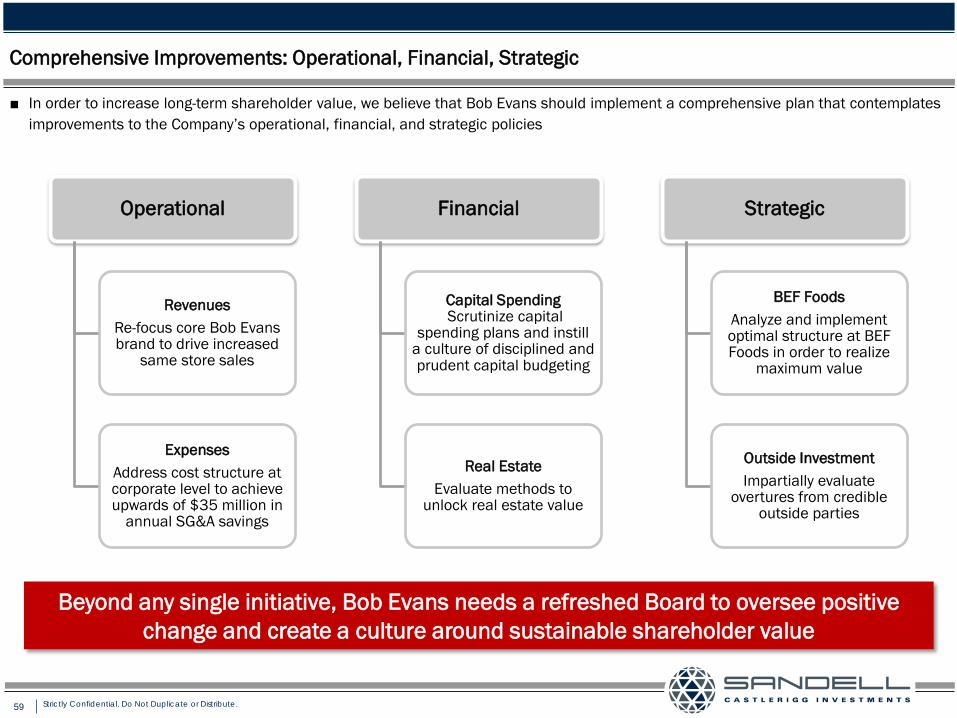
■ In order to increase long-term shareholder value, we believe that Bob Evans should implement a comprehensive plan that contemplates improvements to the Company’s operational, financial, and strategic policies
Operational
Revenues Re-focus core Bob Evans brand to drive increased
same store sales
Expenses Address cost structure at corporate level to achieve upwards of $35 million in
annual SG&A savings
Financial
Capital Spending Scrutinize capital
spending plans and instill a culture of disciplined and prudent capital budgeting
Real Estate Evaluate methods to
unlock real estate value
Strategic
BEF Foods Analyze and implement optimal structure at BEF Foods in order to realize
maximum value
Outside Investment Impartially evaluate
overtures from credible outside parties
Beyond any single initiative, Bob Evans needs a refreshed Board to oversee positive change and create a culture around sustainable shareholder value

60 Strictly Confidential. Do Not Duplicate or Distribute.
Operational – Revenue Enhancing Opportunities
■ New ideas are needed to re-focus the core Bob Evans restaurant brand in order to reverse the Company’s same store sales declines and begin to deliver increased revenue
■ We believe that Bob Evans should work to drive traffic by re-focusing its core brand on what made it great: fresh home-style cooking
■ Key Steps:
Simplify menu back to its roots and reduce the number of items to promote product excellence
Add regional favorites to take advantage of regional tastes and preferences
Move from freezer foods to fresh foods
Position price points in a tighter band
Develop marketing strategy that is product-based
Media message to focus on key ideas of “food,” “value,” “comfort,” and “family”
■ We believe the Company’s long-term strategy should contemplate the establishment of a dedicated franchise sales department and a robust refranchising program in order to generate supplemental revenue by selective franchising efforts
We believe the Company should seek to re-focus the core Bob Evans restaurant brand
61 Strictly Confidential. Do Not Duplicate or Distribute.
Operational – Cost Reduction Opportunities
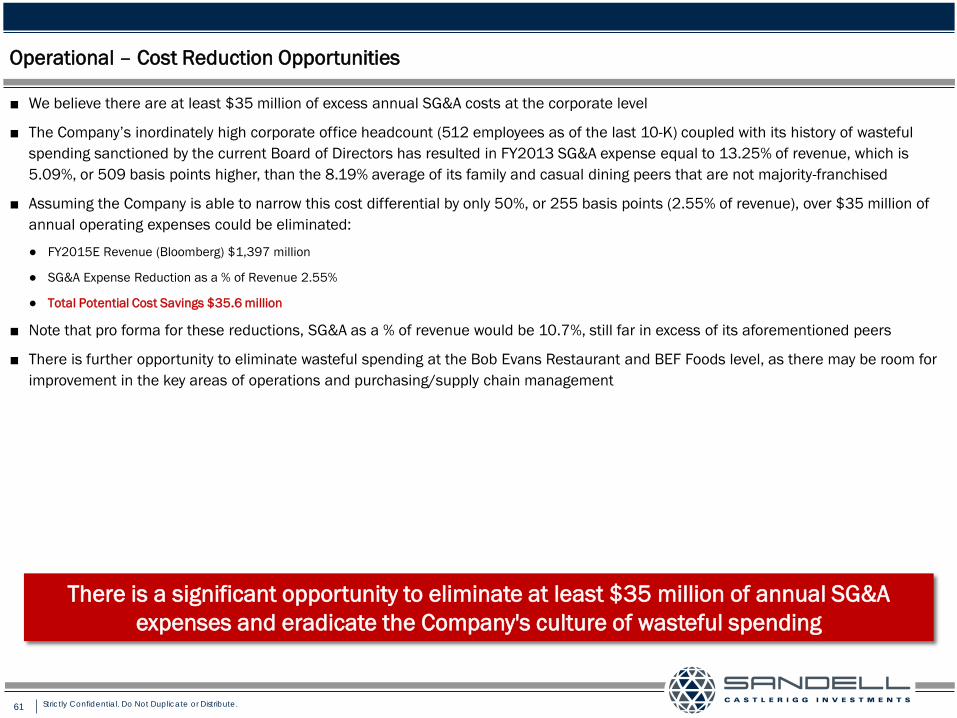
■ We believe there are at least $35 million of excess annual SG&A costs at the corporate level
■ The Company’s inordinately high corporate office headcount (512 employees as of the last 10-K) coupled with its history of wasteful spending sanctioned by the current Board of Directors has resulted in FY2013 SG&A expense equal to 13.25% of revenue, which is 5.09%, or 509 basis points higher, than the 8.19% average of its family and casual dining peers that are not majority-franchised
■ Assuming the Company is able to narrow this cost differential by only 50%, or 255 basis points (2.55% of revenue), over $35 million of annual operating expenses could be eliminated:
● FY2015E Revenue (Bloomberg) $1,397 million
● SG&A Expense Reduction as a % of Revenue 2.55%
● Total Potential Cost Savings $35.6 million
■ Note that pro forma for these reductions, SG&A as a % of revenue would be 10.7%, still far in excess of its aforementioned peers
■ There is further opportunity to eliminate wasteful spending at the Bob Evans Restaurant and BEF Foods level, as there may be room for improvement in the key areas of operations and purchasing/supply chain management
There is a significant opportunity to eliminate at least $35 million of annual SG&A expenses and eradicate the Company's culture of wasteful spending
62 Strictly Confidential. Do Not Duplicate or Distribute.
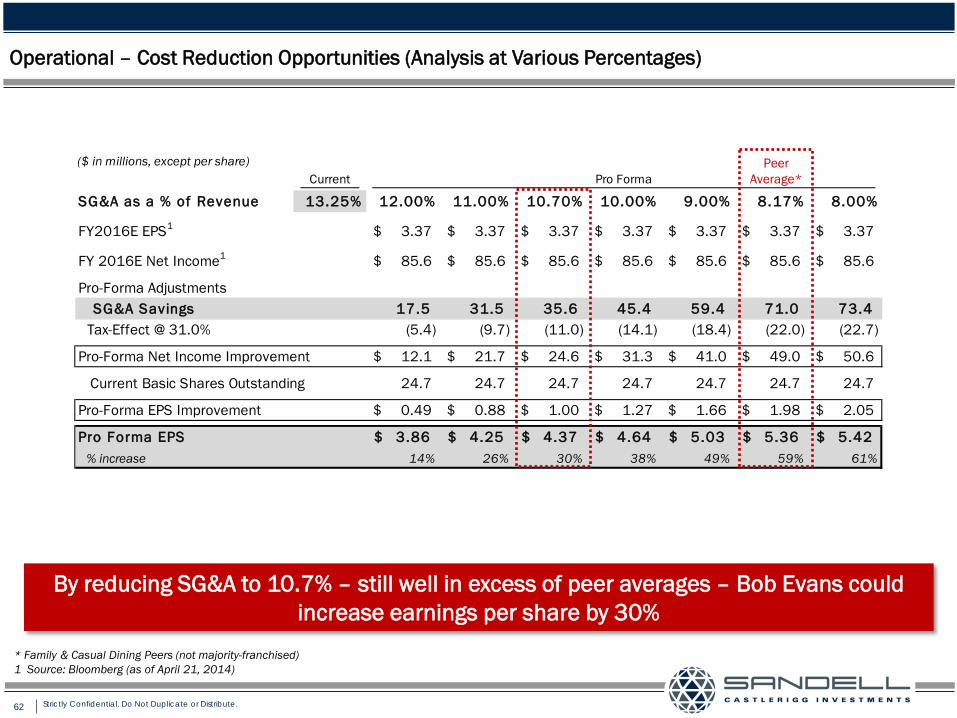
($ in millions, except per share)Current Pro Forma
SG&A as a % of Revenue 13.25% 12.00% 11.00% 10.70% 10.00% 9.00% 8.17% 8.00%
FY2016E EPS1 3.37$ 3.37$ 3.37$ 3.37$ 3.37$ 3.37$ 3.37$
FY 2016E Net Income1 85.6$ 85.6$ 85.6$ 85.6$ 85.6$ 85.6$ 85.6$
Pro-Forma Adjustments SG&A Savings 17.5 31.5 35.6 45.4 59.4 71.0 73.4
Tax-Effect @ 31.0% (5.4) (9.7) (11.0) (14.1) (18.4) (22.0) (22.7)
Pro-Forma Net Income Improvement 12.1$ 21.7$ 24.6$ 31.3$ 41.0$ 49.0$ 50.6$
Current Basic Shares Outstanding 24.7 24.7 24.7 24.7 24.7 24.7 24.7
Pro-Forma EPS Improvement 0.49$ 0.88$ 1.00$ 1.27$ 1.66$ 1.98$ 2.05$
Pro Forma EPS 3.86$ 4.25$ 4.37$ 4.64$ 5.03$ 5.36$ 5.42$ % increase 14% 26% 30% 38% 49% 59% 61%
Operational – Cost Reduction Opportunities (Analysis at Various Percentages)
By reducing SG&A to 10.7% – still well in excess of peer averages – Bob Evans could increase earnings per share by 30%
* Family & Casual Dining Peers (not majority-franchised) 1 Source: Bloomberg (as of April 21, 2014)
Peer Average*
63 Strictly Confidential. Do Not Duplicate or Distribute.
Financial – Capital Spending Discipline
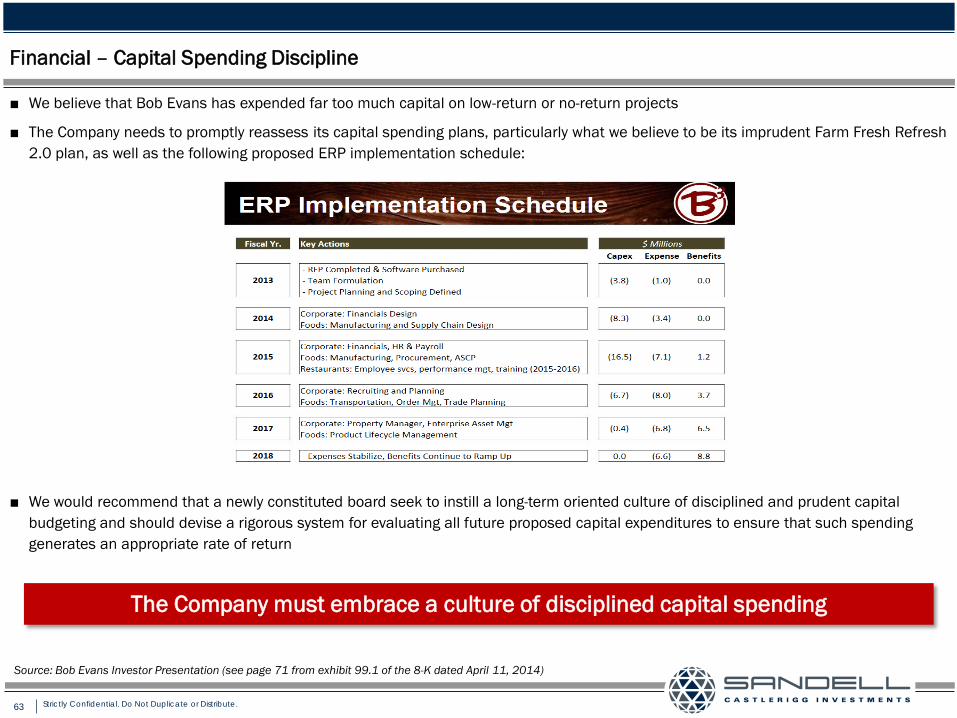
■ We believe that Bob Evans has expended far too much capital on low-return or no-return projects
■ The Company needs to promptly reassess its capital spending plans, particularly what we believe to be its imprudent Farm Fresh Refresh 2.0 plan, as well as the following proposed ERP implementation schedule:
■ We would recommend that a newly constituted board seek to instill a long-term oriented culture of disciplined and prudent capital budgeting and should devise a rigorous system for evaluating all future proposed capital expenditures to ensure that such spending generates an appropriate rate of return
The Company must embrace a culture of disciplined capital spending
Source: Bob Evans Investor Presentation (see page 71 from exhibit 99.1 of the 8-K dated April 11, 2014)
64 Strictly Confidential. Do Not Duplicate or Distribute.
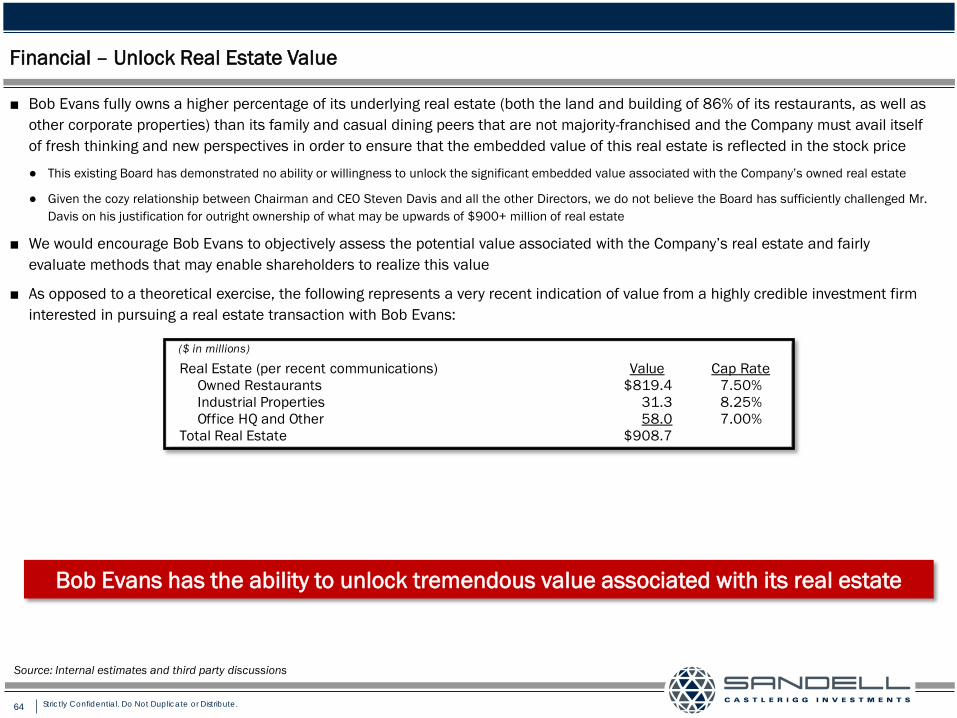
Financial – Unlock Real Estate Value
■ Bob Evans fully owns a higher percentage of its underlying real estate (both the land and building of 86% of its restaurants, as well as other corporate properties) than its family and casual dining peers that are not majority-franchised and the Company must avail itself of fresh thinking and new perspectives in order to ensure that the embedded value of this real estate is reflected in the stock price
● This existing Board has demonstrated no ability or willingness to unlock the significant embedded value associated with the Company’s owned real estate
● Given the cozy relationship between Chairman and CEO Steven Davis and all the other Directors, we do not believe the Board has sufficiently challenged Mr. Davis on his justification for outright ownership of what may be upwards of $900+ million of real estate
■ We would encourage Bob Evans to objectively assess the potential value associated with the Company’s real estate and fairly evaluate methods that may enable shareholders to realize this value
■ As opposed to a theoretical exercise, the following represents a very recent indication of value from a highly credible investment firm interested in pursuing a real estate transaction with Bob Evans:
Bob Evans has the ability to unlock tremendous value associated with its real estate
($ in millions)
Real Estate (per recent communications) Value Cap RateOwned Restaurants $819.4 7.50%Industrial Properties 31.3 8.25%Office HQ and Other 58.0 7.00%
Total Real Estate $908.7
Source: Internal estimates and third party discussions
65 Strictly Confidential. Do Not Duplicate or Distribute.
Strategic – Structural Repositioning of BEF Foods
■ We find no strategic rationale for combined ownership of Bob Evans Restaurants and BEF Foods
● The business profile of a packaged foods company is very different from that of a restaurant, a fundamental principle that this current Board apparently does not understand
● We do not believe that management’s repeated claims of the “synergies” derived from ownership of BEF Foods have been sufficiently challenged by this current Board
■ We have no preconceived notion as to the best ultimate structure for BEF Foods and would encourage the retention of a qualified and impartial financial advisor to determine the best path to reposition BEF Foods
● Should such path contemplate a separation of BEF Foods through either a sale or a spin-off, such separation should be timed appropriately relative to the lifecycle of BEF Foods
■ Prior to any strategic repositioning of BEF Foods, we believe the Company should seek to accelerate growth at BEF Foods through revamped marketing efforts and the pursuit of private label opportunities
We would advocate action to ensure that the ultimate structure of BEF Foods best enables shareholders to realize its underlying value
66 Strictly Confidential. Do Not Duplicate or Distribute.
Strategic – Impartially Evaluate Outside Investment Proposals
■ Transactions with credible outside parties should not be reflexively dismissed
● We are aware of at least one private equity firm that was rebuffed by the Company’s financial advisors after indicating their interest in exploring a transaction with Bob Evans
− We believe there have been other firms who have indicated their interest in making an investment in Bob Evans in the past and have been similarly rebuffed by management
● We do not believe that this current Board of Directors has any interest in engaging in discussions with any outside parties contemplating a transaction with the Company
■ We believe that Bob Evans should review investment proposals from credible outside parties with an open-mind
Investment proposals from credible outside parties should be evaluated impartially and with a view towards maximizing shareholder value

67 Strictly Confidential. Do Not Duplicate or Distribute.
Potential Upside for Shareholders
Refresh Bob Evans
68 Strictly Confidential. Do Not Duplicate or Distribute.
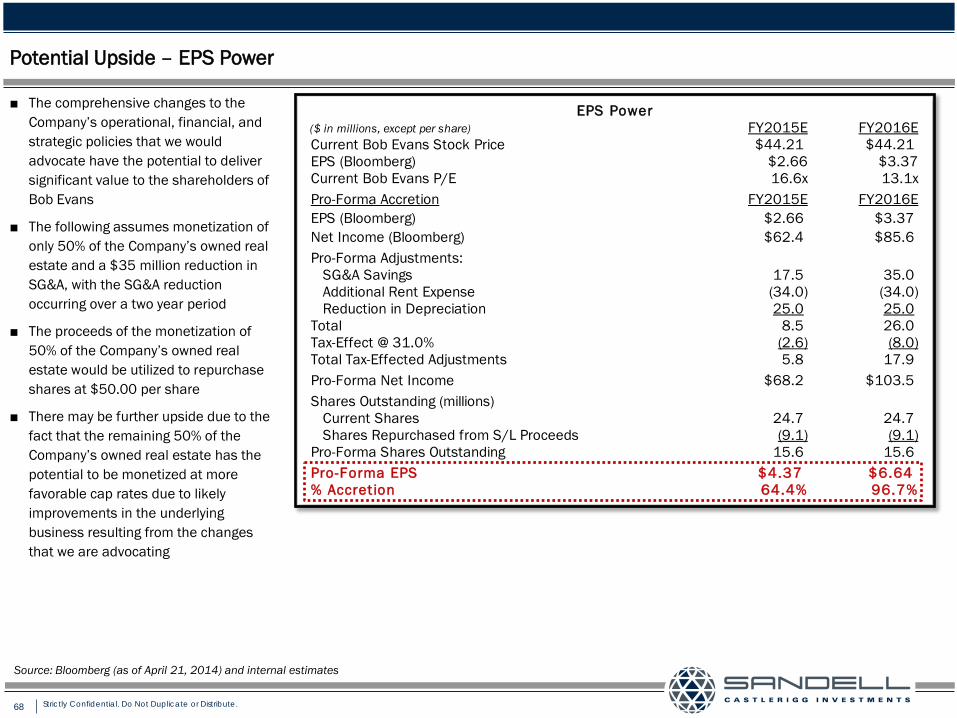
EPS Power($ in millions, except per share) FY2015E FY2016ECurrent Bob Evans Stock Price $44.21 $44.21EPS (Bloomberg) $2.66 $3.37Current Bob Evans P/E 16.6x 13.1xPro-Forma Accretion FY2015E FY2016EEPS (Bloomberg) $2.66 $3.37Net Income (Bloomberg) $62.4 $85.6Pro-Forma Adjustments: SG&A Savings 17.5 35.0 Additional Rent Expense (34.0) (34.0) Reduction in Depreciation 25.0 25.0Total 8.5 26.0Tax-Effect @ 31.0% (2.6) (8.0)Total Tax-Effected Adjustments 5.8 17.9Pro-Forma Net Income $68.2 $103.5Shares Outstanding (millions) Current Shares 24.7 24.7 Shares Repurchased from S/L Proceeds (9.1) (9.1)Pro-Forma Shares Outstanding 15.6 15.6Pro-Forma EPS $4.37 $6.64% Accretion 64.4% 96.7%
Potential Upside – EPS Power
■ The comprehensive changes to the Company’s operational, financial, and strategic policies that we would advocate have the potential to deliver significant value to the shareholders of Bob Evans
■ The following assumes monetization of only 50% of the Company’s owned real estate and a $35 million reduction in SG&A, with the SG&A reduction occurring over a two year period
■ The proceeds of the monetization of 50% of the Company’s owned real estate would be utilized to repurchase shares at $50.00 per share
■ There may be further upside due to the fact that the remaining 50% of the Company’s owned real estate has the potential to be monetized at more favorable cap rates due to likely improvements in the underlying business resulting from the changes that we are advocating
Source: Bloomberg (as of April 21, 2014) and internal estimates
69 Strictly Confidential. Do Not Duplicate or Distribute.
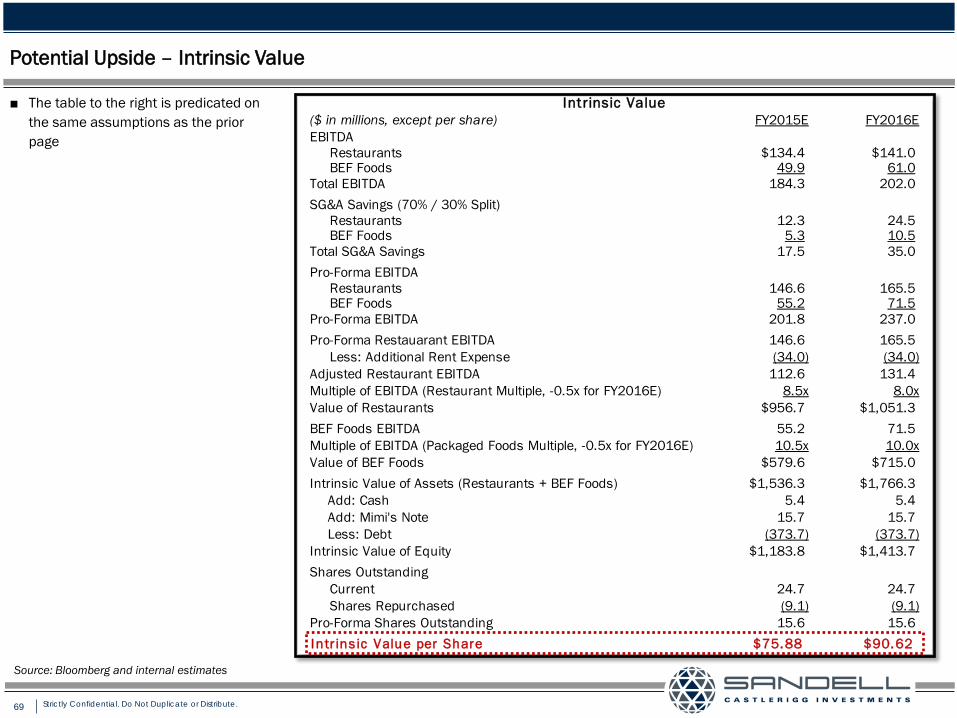
Intrinsic Value($ in millions, except per share) FY2015E FY2016EEBITDA Restaurants $134.4 $141.0 BEF Foods 49.9 61.0Total EBITDA 184.3 202.0SG&A Savings (70% / 30% Split) Restaurants 12.3 24.5 BEF Foods 5.3 10.5Total SG&A Savings 17.5 35.0Pro-Forma EBITDA Restaurants 146.6 165.5 BEF Foods 55.2 71.5Pro-Forma EBITDA 201.8 237.0Pro-Forma Restauarant EBITDA 146.6 165.5 Less: Additional Rent Expense (34.0) (34.0)Adjusted Restaurant EBITDA 112.6 131.4Multiple of EBITDA (Restaurant Multiple, -0.5x for FY2016E) 8.5x 8.0xValue of Restaurants $956.7 $1,051.3BEF Foods EBITDA 55.2 71.5Multiple of EBITDA (Packaged Foods Multiple, -0.5x for FY2016E) 10.5x 10.0xValue of BEF Foods $579.6 $715.0Intrinsic Value of Assets (Restaurants + BEF Foods) $1,536.3 $1,766.3
Add: Cash 5.4 5.4Add: Mimi's Note 15.7 15.7Less: Debt (373.7) (373.7)
Intrinsic Value of Equity $1,183.8 $1,413.7Shares Outstanding Current 24.7 24.7 Shares Repurchased (9.1) (9.1)Pro-Forma Shares Outstanding 15.6 15.6Intr ins ic Value per Share $75.88 $90.62
Potential Upside – Intrinsic Value
■ The table to the right is predicated on the same assumptions as the prior page
Source: Bloomberg and internal estimates
70 Strictly Confidential. Do Not Duplicate or Distribute.
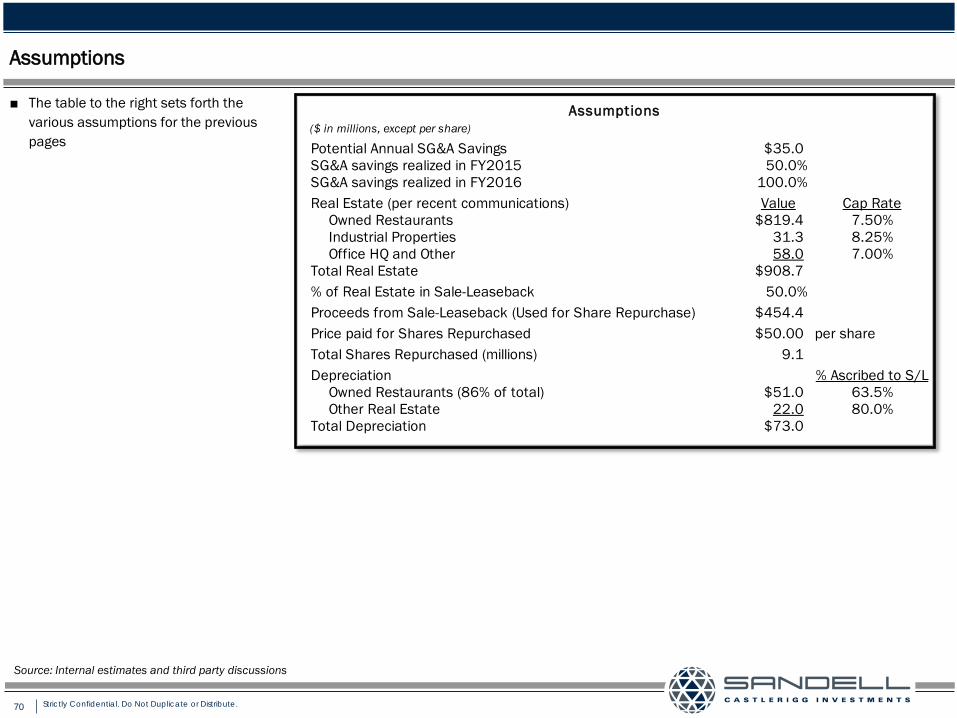
Assumptions
■ The table to the right sets forth the various assumptions for the previous pages
Source: Internal estimates and third party discussions
Assumptions($ in millions, except per share)
Potential Annual SG&A Savings $35.0SG&A savings realized in FY2015 50.0%SG&A savings realized in FY2016 100.0%Real Estate (per recent communications) Value Cap Rate
Owned Restaurants $819.4 7.50%Industrial Properties 31.3 8.25%Office HQ and Other 58.0 7.00%
Total Real Estate $908.7% of Real Estate in Sale-Leaseback 50.0%Proceeds from Sale-Leaseback (Used for Share Repurchase) $454.4Price paid for Shares Repurchased $50.00 per shareTotal Shares Repurchased (millions) 9.1Depreciation % Ascribed to S/L
Owned Restaurants (86% of total) $51.0 63.5%Other Real Estate 22.0 80.0%
Total Depreciation $73.0
71 Strictly Confidential. Do Not Duplicate or Distribute.
Appendix
Refresh Bob Evans
72 Strictly Confidential. Do Not Duplicate or Distribute.
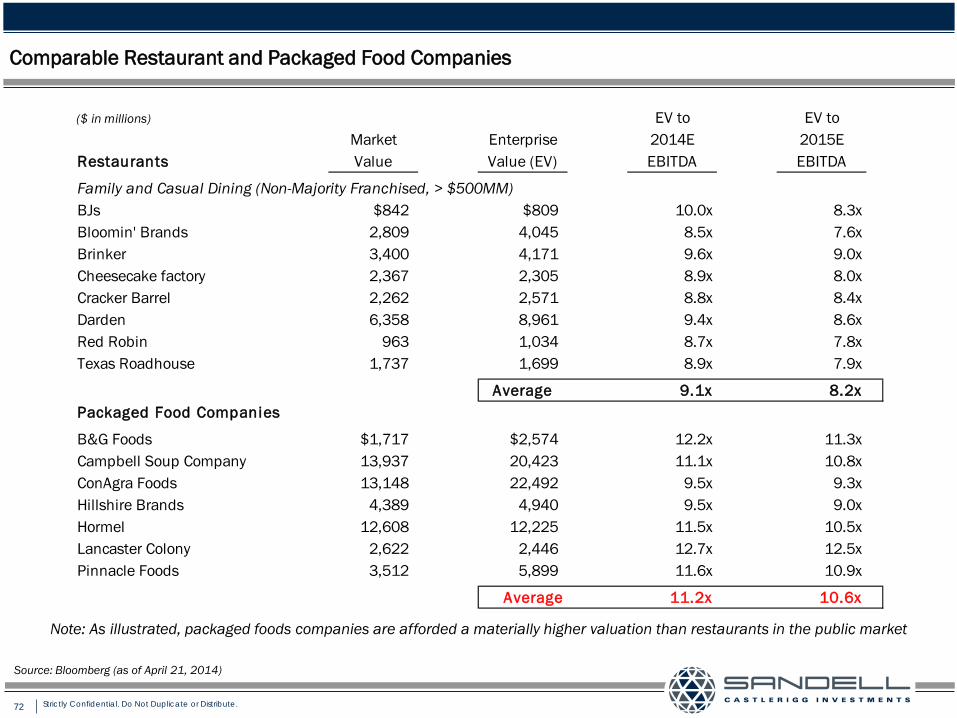
Comparable Restaurant and Packaged Food Companies
Note: As illustrated, packaged foods companies are afforded a materially higher valuation than restaurants in the public market
Source: Bloomberg (as of April 21, 2014)
($ in millions) EV to EV toMarket Enterprise 2014E 2015E
Restaurants Value Value (EV) EBITDA EBITDA
Family and Casual Dining (Non-Majority Franchised, > $500MM)BJs $842 $809 10.0x 8.3xBloomin' Brands 2,809 4,045 8.5x 7.6xBrinker 3,400 4,171 9.6x 9.0xCheesecake factory 2,367 2,305 8.9x 8.0xCracker Barrel 2,262 2,571 8.8x 8.4xDarden 6,358 8,961 9.4x 8.6xRed Robin 963 1,034 8.7x 7.8xTexas Roadhouse 1,737 1,699 8.9x 7.9x
Average 9.1x 8.2xPackaged Food Companies
B&G Foods $1,717 $2,574 12.2x 11.3xCampbell Soup Company 13,937 20,423 11.1x 10.8xConAgra Foods 13,148 22,492 9.5x 9.3xHillshire Brands 4,389 4,940 9.5x 9.0xHormel 12,608 12,225 11.5x 10.5xLancaster Colony 2,622 2,446 12.7x 12.5xPinnacle Foods 3,512 5,899 11.6x 10.9x
Average 11.2x 10.6x
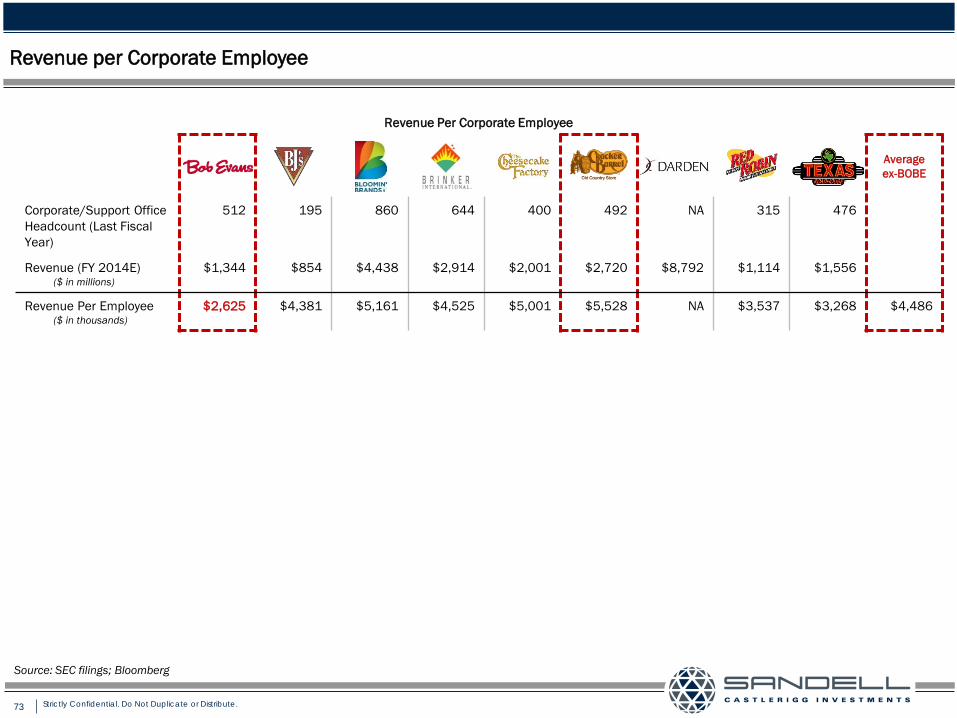
73 Strictly Confidential. Do Not Duplicate or Distribute.
Revenue Per Corporate Employee
Average ex-BOBE
Corporate/Support Office Headcount (Last Fiscal Year)
512 195 860 644 400 492 NA 315 476
Revenue (FY 2014E) ($ in millions)
$1,344 $854 $4,438 $2,914 $2,001 $2,720 $8,792 $1,114 $1,556
Revenue Per Employee ($ in thousands)
$2,625 $4,381 $5,161 $4,525 $5,001 $5,528 NA $3,537 $3,268 $4,486
Revenue per Corporate Employee
Source: SEC filings; Bloomberg
74 Strictly Confidential. Do Not Duplicate or Distribute.
Investors: MacKenzie Partners, Inc.
Dan Burch or Larry Dennedy (212) 929-5500
Press/Media:
Sloane & Company Elliot Sloane or Dan Zacchei
(212) 446-1860 or (212) 446-1882