Embed Size (px)
Citation preview

^
SAND78-1991 Unlimited Release !?SUl
gp* «
Pressure Effects on Thermal Conductivity and Expansion of Geologic Materials
James N. Sweet

! . - ; • ! t
' [ ; ] • . - p r - ' - . ' . - n i '..••• r 'f v: i :. • n r u i n c : t

Table of Contents
Page
I. Introduction 5
II. Effect of Pressure on Thermcl Expansion of Geologic Mat -lals 7
III. Effect of Pressure on Thermal Conductivity of Geologic Materials 13 A. I.-.troduc tion 13
B. Variation of Conductivity with Pressure for Homogeneous Rock 15
C. Thermal Conductivity of Inhomogeneous Rock 19
D. Discussion 30
E. Comparison with Recent Experiments 32
IV. Conclusions 36
V. References 41
2

List of Figures
Thermal conductivity versus temperature fcr rocksalt samples taken from various depths of drill holes ERDA 8 and 9 at the proposed Waste Isolation Pilot Plant near Carlsbad, NM. The 630 m ERDA No. 9 specimen was measured in both the forward (curve (3)) and reverse (curve (4)) directions.
Relative effective conductivity Xe/XT versus void volume fraction f as predicted by various theories: (1) Maxwell theory - solid phase continuous, Xer/\T> Eq. (11). (2) Maxwell theory - liquid (or gas) phase continuous, A eg/A r, Eq . (13). (3) Geometric mean empirical model, A e m / X r , Eq. (14). (4) Brailsford and Maj or effective medium model, ^e(BM)/^'r» Eq. (15). (5) Brailsford and Major modified model using Eq. (16) to calculate an effective void fraction. The value for ^g/^ r in these calculations was 0.01.
Strain versus pressure (solid line) for Casco granite (Ref. 18) showing construetion used to determine crack porosity f e. At p = 0, f c is found by extrapolating the linear strain region to p = 0 (dashed line). At an intermediate pressure, p-i , fc ̂ Pl^ -*-s t n e distance between extrapolated and actual strain curves.
Relative effective conductivity >.e/Xr versus pressure from various models and experiments. (1) Geometric mean model with fluid rock phase, Eq. (17) for f(p). (2) Data of Walsh and Decker 1 8
for Casco granite under uniaxial stress. (3) Data of Wood s ide and Messmer^° for Berea sandstone air loaded. (4) Data of Woodside and Messmer for the same sample vacuum loaded. (5) Geometric mean model with "rigid" rock and P R a s = P ro-k a n <* L from Eq. (22),

List of Tables
III TV
Rock Elastic Constants as a Function, of Pressure 10 and Temperature Absolute and Relative Decrease in Volume Thermal 12 Expansion Coefficient, aft, from Atmospheric Pressure to 100 MP a for Various Types of -:1c
Porosity of Various Roclc Types 14
Effect of Hydrostatic Pressure on Thermal Con- 16 ductivity of Various Nonmetallic Solids
Experimental Values for <Q and E. (Eq. (11)) for Several Materials.
Typical Thermal Conductivity and Porosity of Welded and Nonweldea Tuff from G Tunnel at NTS
32
Results of Comparing the Data from Table VI to the Geometric Mean Model, Eq. (14), at 500°C. *air = 0.056 W/m-K Nominal Values of Density, Porosity and Water Content for Welded and Nonwe.lded Tuff as Reported by Lappin
33
4

I. Introduction
In order to make an accurate assessment of the thermal response
properties of a nuclear waste repository, accurate values of the
thermal constants characterizing thci geologic formations in and near
the repository are required. This paper is devoted to a discussion
of the effects of depth or pressure on the thermal expansion and
thermal conductivity of geologic materials. This assessment was
motivated by a desire to define those laboratory experiments which
could most profitably be performed to define the pressure dependence
of these properties. Since conductivity and expansion are both
functions of temperature and since temperature varies directly
with depth, there will be .• temperature-induced property variation
with depth in addition to any explicit variation caused by ths
increase in pressure with depth.
A review of the literature on the pressure dependence of con
ductivity and expansion has been made, and from this review, we
have concluded that in the case of homogeneous rock with little
or no porosity, the changes in conductivity or expansion at depths
up to 3 km is not significant. Throughout this paper the term
"homogeneous rock" means rock which is free of porosity, micro-
cracks and inclusions on a scale ^ the average grain size and which
possesses properties (density, t herma 1 conductivity, etc.) whi ch do
no have a spatial variation over distances much larger than a
typical linear grain dimension. However, the situation changes
in the case of porous rock, and for porosities 5 10%, significant
property variations can occur as pressure increases with depth.
5

The variation of porosity with depth thus becomes the most signi
ficant source of property variation.
In Section II it is shown that the variation of thermal expan
sion with pressure at constant temperature may be found from the
variation of compressibility with temperature at constant pressure.
Using tabulated compressibility data, an estimate is made of the
expansion coefficient shift at a pressure of ICC MPa, corresponding
roughly to a depth of 3.7 km. This variation ranges from 5 10% for
dense rock such as granite to - 25% for 5% porous dry sandstone.
Since it is reasonable to expect that porosity will decrease as
depth increases, these predictions are felt to be "worst case"
estimates of pressure-induced shifts.
In Section III thermal conductivity data are reviewed and the
pressure-induced shifts in dense materials such as rocksalt are
found to be in the range - 3%. This change is negligible since a
temperature shift - 10 C can easily cause a change in conductivity
of this magnitude, and temperatures are rarely known to thir;
accuracy. In the case of porous rock such as shale or sandsto.ie,
large changes of conductivity can ocrur as pressure increases as a
result of porosity reductions and improved intergrannular contact.
Since conductivity always increases with pressure, the shift is in
a safe direction insofar as a higher conductivity leads to improved
heat removal capability of the medium in which a radioactive waste
canister is buried. If moisture is present in the rock formation
in the form of liquid water, then a conductivity decrease could
occur if this water is vaporized from heat given off by a waste
canister. Hence moisture content is also an important parameter
6
in any thermal response study. Theoretical corralation of con
ductivity data with measured porosity is in a primitive state.
An empirical weighted geometric mean formula is recommended based
on its success in explaining a variety of data on porous sandstone
and tuff conductivities.
As a result of this study we recommend that more effort should
be expended in acquiring porosity versus depth data. In addition,
variations of porosity over a horizontal repository plane will also
need to be determined if accurate thermal modeling is to be per
formed. Laboratory experiments under pressure may provide erroneous
or inconclusive results unless the actual variation of porosity with
pressure can be accurately replicated in the lab. The problem of
how included gas or liquid might escape as the pressure increases
needs to be addressed prior to the development of these experiments.
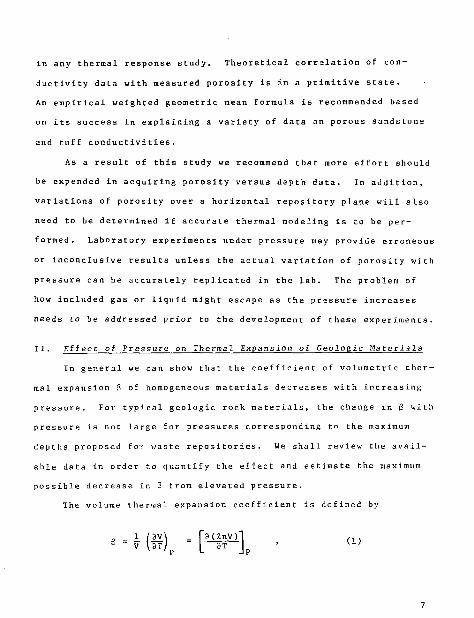
II. Effect of Pressure on Thermal Expansion of Geologic Materials
In general we can show that the coefficient of volumetric ther-
mal expansion 3 of homogeneous materials decreases with increasing
pressure. For typical geologic rock materials, the change in 6 with
pressure is not large for pressures corresponding to the maximum
depths proposed fo: waste repositories. We shall review the avail
able data in order to quantify the effect and estimate the maximum
possible decrease in 3 from elevated pressure.
The volume thermal expansion coefficient is defined by
8 - V \STJ I 3T J p (1)
7

where V = volume, T = temperature and p = pressure. The compressibility K is defined by
\3P/ T " " L 3 P h K is related to the bulk modulus B by
B = 1/K
(2)
(3)
Using rules for calculating with mixed partial derivatives, it
can be shown that,
- (ft). (A)
Using Eqs. (1-4) It can be shown that the partial derivative of
with respect to pressure at constant temperature is
/3B\ f d < \ (5)
(6)
Since (3B/9T) < 0 for rock as for metals, we predict from
Eq. (6) that the thermal expansion coefficient will decrease with
increasing pressure.
The range of pressures to be encountered can be estimated from
the standard pressure equation,
P = Pgh (7)
where o = earth density, g = gravitational acceleration and
h = depth in the ground. The density of typical types of
rock is < 2.8 g/cm3 = 2.8 x 10 3 kg/m 3 and with g = 9.8 m/s 2
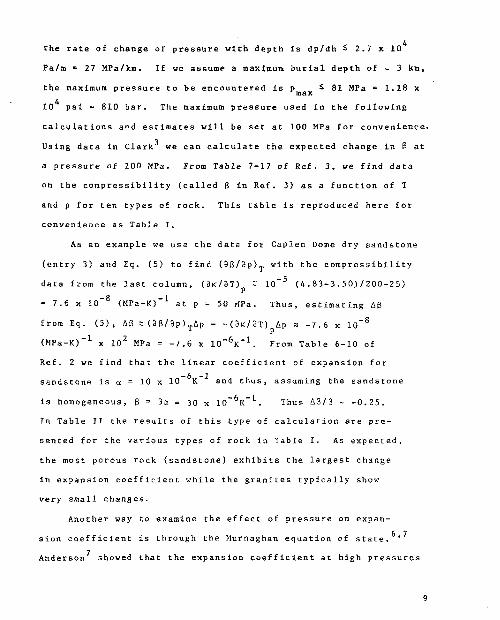
4 the rate of change of pressure with depth is dp/dh ~ 2.7 x 10
Pa/m = 27 MPa/km. If we assume a maximum burial depth of - 3 km,
the maximum pressure to be encountered is p £ 81 MPa = 1.18 x r max 4 10 psl = 810 bar. The maximum pressure used in the following
calculations and estimates will be set at 100 MPa for convenience.
Using data in Clark we can calculate the expected change in 6 at
a pressure of 100 MPa. From Table 7-17 of Ref. 3, we find data
on the compressibility (called B in Ref. 3) as a function of T
and p for ten types of rock. This table is reproduced here for
convenience as Table I.
As an example we usa the data for Caplen Dome dry sandstone
(entry 3) and Eq. (5) to find OB/3p> T with the compressibility
data from the last column, (9K/3T) ~ lo" 5 (4.83-3.50)/200-25) P — 8 — 1 * 7.6 x 10 <MPa-K)~ at p = 50 rfPa. Thus, estimating A8
from Eq. (5) , AB z <9 B/ 3p) TAp = -(3if/9T)nAp a -7.6 x 10~~ (MPa-iC)"1 x 10 2 MPa Ref. 2 we find that the linear coefficient of expansion for sandstone is a = 10 x 10 K and thus, assuming the sandstone is homogeneous, 6 = 3cc = 30 x 10 K . Thus AS/6 - -0.25. In Table TI the results of this type of calculation are presented for the various types of rock in Table I. As expected, the most porous rock (sandstone) exhibits the largest change in expansion coefficient while the granites typically show very small changes.
Another way Co examine the effect of pressure on expansion coefficient is through the Murnaghan equation of state. * Anderson showed that the expansion coefficient at high pressures

T a b i c 1 K n d !'.lasti<: Con.'U.^nts as a Func tlon of Pressure and Temperal : ure . From S. P. Clark, Jr., Ref. 3.
l)i>_ns_ rk Type-/ ltv (j^/V*) T(°C> p (MPa) E(10 5HPa) C(10 5MP,i) i • ( 1 / I c iJ:ti'.i j
L i m e s t r. n e , St, lenhnfen. 25 50 .0 .6 33 .237 . 336 1 .56 fi.ivnr in, ; = 2.565 500 .0 .635 .245 .337 I .49
200 50 .0 .605 .228 .327 1 . 72 500 .0 .623 .234 .332 1 .62
M a r b l e , Danby, VT/ 25 50 .0 . 705 .263 . 341 1 .35 n - 2 .698 500 .0 . 762 .283 . 346 1 .21
200 50 .0 .586 .221 .32 5 1 .79 500. .0 . 705 . 26J . 350 1 . 28
Snnds t oi He , 25 50. .0 .457 .185 .234 3 . 50 Cap]er Home, dry/ 500. .0 .573 .224 .278 2 . 3! r - 2 .543 200 50 .0 .404 . 172 . 175 4 .8 3 poros ley - 5 . 1 :\ 500 .0 .570 .224 .272 2 .40
Granite , blotite. 25 50. .0 .792 .315 .257 1 .84 Woodbi ary, VT/ 500. .0 .887 .357 . 242 1 .75 d = 2 .644 200 50 .0 .774 .307 .260 1 . 8 6
500 . 0 .868 .351 .237 1 .82
Granite (gray) , 25 50. .0 .804 .328 .225 2 .05 Llano County, TX/ 500, ,0 .852 .340 .253 1 .74 0 = 2. .609 200 50. 0 .751 .304 .236 2 . 11
500. .0 .836 .337 .240 1. .87
C-cc ni t e (pink), 25 50. ,0 .752 .288 .306 1 .35 Llano County, Til/ 500. .0 .795 .302 .317 1 . 38 3 = 2. .636 200 50. .0 .670 .258 .300 1 .79
500. .0 .781 .298 .312 1 .45
Bc".salt , hornblende. 25 50. .0 .675 .271 .246 2 .26 Chaffe County, CO/ 500. .0 . 708 .279 .269 1 .96 0 = 2. 586 300 50. 0 .637 .257 .240 2. .45
500. 0 .697 .273 .276 1 . ,93
j a b b r o , "San Marcos," 25 50 .0 .960 .363 . 322 1 .11 Escond ido, HA/ 500 ,0 .998 .375 . 331 1 .02 r = 2. .993 300 50 ,0 .883 .334 .322 1 .21
500 ,0 .983 . 370 . 329 1 .04
Gabbro, bvtownite, 25 50. ,0 .901 .343 . 314 1 .24 Duluth, MS/ 500. .0 .953 .362 .317 1 . 15 0 = 2. .885 300 50, ,0 .781 .303 .289 1 ,62
500. .0 .901 .344 . 309 1 ,27
Gabbro, hornblende/ 25 50. 0 .981 .378 .297 1. 24 o = 2. 913 500. 0 1.054 .407 .295 1. 17
300 50. 0 .878 .345 .272 1. 56 500. 0 1.037 .403 .287 1. 23
E = Young's modulus C = .Shear modulus c = Poisson ' s ratio k = compressibility
10
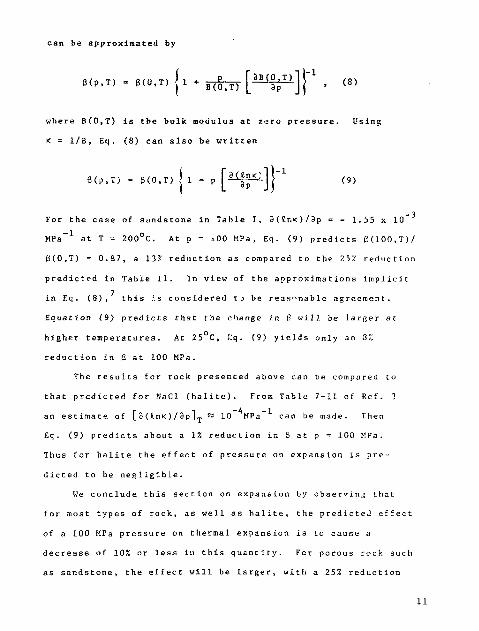
can be approximated by
B<P, T ) = B c 0 , T , { 1 + I T ^ T [ M i | ^ ) ] j - 1
> (8)
where B(0,T) is the bulk modulus at zero pressure. Using
K = 1/B, Eq. (8) can also be written
5(p,T) = g(0,T) J 1 - p H^T (9)
For the case of sandstone in Table I, 3(£r.tc)/3p = - 1.55 x 10
MPa" 1 at T = 200°C. At p = ±00 MPa, Eq . (9) predicts 6(100,T)/
8(0,T) = 0.87, a 13% reduction as compared tD the 25% reduction
predicted in Table II. In view of the approximations implicit
in Eq. (8), this :.s considered to be reasonable agreement.
Equation (9) predicts that the change in B will be larger at
higher temperatures. At 25 C, Eq. (9) yields only an 8%
reduction in 8 at 100 MPa.
The results for rock presented above can be compared to
that predicted for NaCl (halite). From Table 7-11 of Ref. 3 r l "4 -1
an estimate of L 3 (£nK) / 3p j_ "- 10 MPa can be made. Then
Eq. (9) predicts about a It reduction in 6 at p * 100 MPa.
Thus for halite the effect of pressure on expansion is pre
dicted to be negligible.
We conclude this section on. expansion by observing that
for roost types of rock, as wel1 as halite, the predicted effect
of a 100 MPa pressure on thermal expansion is to cause a
decrease of 10% or less in this quantity. For porous rock such
as sandstone, the effect will be larger, with a 25% reduction

Table II. Absolute and Relative Decrease in Volume Thermal Expansion Coefficient, A(S, from Atmospheric Pressure to 100 HPa for Various Types of Rock
- O K / 3 T )
(10" 6K" 1MPa" 1) -Ae(10" 6K _ 1) Rock Type 8(10 K X ) p = 50 MPa Ap = 100 MPa -AB/B (%)
1. Limestone, 24 9.14 x 1 0 - 3 0.01 3.8 Solenhofen, Bavaria
2. Marble, Danby, VT. 21 2.51 x 10~ 2 2.51 10.5
3. Sandstone, 30 7.60 x 10~ 2 7.60 25.3 Caplen Domn, dry (porosity = 5.1%)
4. Granite, biotite, 24 1.14 x 10" 0.11 0.4 Woodbury, VT
Granite (gray), Llano County, TX 24 3.43 x 11 0.34 1.4
6. Cranite (pink), 24 1.37 x 10~ 2 1.37 5.7 Llano County, TX
-2 7. Basalt, hornblende 16 1.09 x 10 1.09 6.8
Chaffee County, CO 8. Gabbro, "San Marcos," 16 5.71 x 10~ 3 0.57 3.5
Escondido, CA -2
9. Gabbro, bytownite, 16 2.17 x 10 2.17 13.6 Duluth, HN
10. Gabbro, hornblende 16 1.83 x 10" 2 1.83 11.4

in expansion, being calculated for the 5% porosity sandstone
referenced in Table II. It would appear that the pressure
dependence of thermal expansion is dominated by porosity
effects, and thus a measurement of porosity for rock samples
would probably be as useful as a measurement of the expansion
coefficient under pressure.
III. Effect of Pressure on Thermal Conductivity of Geologic Material
A. Introduct ion
In an insulating solid, heat is transported by lattice
vibrations (phonons). Resistance to heat transport arises
from various types of phonon scattering in the solid. The
principal phonon scattering interactions are:
1. Scattering of phonons by static tmperfectio--..,
(point defects, dislocations, etc.) and by
boundaries (grain boundaries, external
boundaries),
2. Interaction and scattering ox phonons with each
other. Phonon interaction is a fundamental
consequence of the anharmonic nature of the
atomic interaction potential in the solid.
We expect that both of these mechanisms will be important in
a geologic material. The first will be of special importance
in a highly inhomogeneous material with small grains or a
large number of inclusions, pores, or microcracks. The second
mechanism depends on basic properties of the solid and is not
influenced by the degree of homogeneity.
13

In inhomogeneous materials, the. relative concentration of
•-tie phases present and their distributions will have a marked
effect on the effective thermal conductivity of the materia?.
In particular, for rock, the major inhomog^neity present is 9 porosity with either water or a gas filling the void spaces.
Parkhomenko lists the following ranges of porosities for
various types of rocks.
Table III. Porosity of Various Rock Types. From Parkhomenko, Ref . 9.
Rock Type Porosity (%)
Shale Sand
Sandstone Limestone Dolomite Quar tz ite Granite Diabase
Blotite Granite Nepheline Syenite
Diorite Gabbro
Norite Gabbro
20-50 20-35 5-30
1. rj-\ 5 3-20
~ 0-0.8 0-1.2 0-1.0
0.4-5.2 0.7-5.0 1.3-5.1 0.3-3.5 1.3-2.0
Porosity tends to decrease for rocks under pressure, and at
a pressure - 100 MPa, all gas-filled porosity is believed to Q
disappear. Since gases tend to have low thermal conductivities, porous rock with gas-filled voids will have a conductivity which is significantly lower than its homogeneous or water-filled counterpart.
14

In the next section the effects of pressure on the con
ductivity of homogeneous, porosity-free rock will be considered.
This effect will be seen to be small for all pressures of
interest. In the following section we shall review seme data
for inhom^geneous porous rock and discuss several conductivity
models which have been developed to explain these data. The
amount of porosity and the way in which this porosity decreases
with increasing pressure will be seen to have a dominant effect
on the variation of conductivity with pressure.
B. Variation of Conductivity with Pressure for Homogeneous Rock
We would expect that the pressure dependence of the
conductivity of relatively homogeneous samples would be
small because very large pressures are required to change
the interatomic spacing sufficiently to change the form of
the atomic potential. Some data obtained by Bridgman support
this conjecture. Bridgman fit his conductivity versus
pressure data to a linear equation of the form
X(p) = A 0(l + YP) > (10)
and y ^ s the coefficient of the linear pressure term.
The data obtained by Bridgman as presented by Clark are
shown in Table IV, with the percent change in X calculated
from Eq. (10) shown in the last column.
15

Table IV. Effect of Hydrostatic Pressure on Thermal Conductivity of Various Nonmetallic Solids
£X/X Q(%) at 100 MPa X(0) (W/m-K) y(10 _ 6MPa" 1) (AX/X =yp at 100 MPa)
Pyrex Glass, 30 10.91 & 75°C Basalt, 30°C .1.4 Basalt, 75 C
Limestone, 30°C 2.19 (Solenhofen), 75°C 1.89 Rocksalt, 30° & 75°C -5-6 Pipestone, 30°C 1.8
38.8
50.0 22.4 10.2 68.4
367.3
306. 1
0.39
0 50 0 22
0 10 0 68
3 67
3 06
From the results shown in Table IV it is evident that the effect
of pressure on the homogeneous thermal conductivity is small at
pressures below 100 MPa.
Measurements of the pressure dependence of the thermal
diffusivity for teflon, halice (NaCl), quartz, and silica have 12 recently been reported by Kieffer, Getting and Kennedy. The
thermal diffusivity K is defined by the relation K = X/pc ,
where p = fass density and c = specific heat at constant
pressure. The diffusivity is frequently the required para
meter in thermal calculations, and many eKperimental deter
minations of X are found from a measurement of K. The K
versus p data can bt fit to a linear relation of the form
(11)
16

similar to Eq . (10) for ^(p). The values for t.(ci /s) and
E(MPa~ ) are shown in Table V.
Table V. Experimental Values for Kg and e (Eq. (11)) for Several Materials. From Ref. 12.
Material Kg(cm /s) e(MPa *•) K ( 1 0 0 HPa)/K 0
Teflon
Halite (NaCl)
Quartz (i to c axis)
0.0012
0.031
0.031
3.010
3.1 x 10
1.7 x 10
-h 1.03
1.03
1.02
Using published data for the specific heat and density of quartz,
the calculated fractional change in conductivity for quartz is
about 0.8%, a number comparable to those in the last column of
Table IV.
The conclusion reached from this review is that the pressure
dependence of the conductivity of nonporous rocks or minerals
is not significant at pressures < 100 M?a. The variation of
conductivity with temperature is a much more pronounced effect.
In Figure 1 experimental values of conductivity versus temperature
are shown for several rocksalt samples obtained from the site ov
the proposed Waste Isolation Pilot Plant near Carlsbad, NM. In
the range 300-400K, the rate of change of conductivity with
17

cemperature is - 0,3%/K, and thus a 10K variation in
temperature will change the conductivity about 3%. Since
temperatures can easily vary within a 10K band, we feel that
a ~ 3% variation in thermal conductivity is not significant
for waste repository analysis. In addition the scatter of
data shown in Figure 1 for samples from different elevations
and different bore holes is much greater than the probable
pressure-induced variation in conductivity. We now turn to
a review and analysis of the conductivity of inhomogeneous
porous rock which can exhibit a significant pressure
dependence in some circumstances.
Figure 1. Thermal conductivity versus tempera ture for rocksalt samples taken from various depths of drill holes ERDA 8 and 9 at the proposed Waste Isolation Pilot Plant near Carlsbad, NM. The 630 m ERDA No. 9 specimen was measured in both the forward (curve (3)) and reverse curve (4) ) directions.

C. Thermal Conductivity of Inhomogeneous Rock
The theory of heat conduct ion in inhomogeneous media
is naturally much more complicated than the homogeneous
theory and, as a result, a number of simplified models have
been advanced to explain various experimental observations.
General discussions of these models have been given in 13 14
recent reviews by Pratt and Parrott and Stuckes.
Experiments have been conducted by Woodside and Messmer
on the thermal conductivity of both unconsolidated sand
and porous consolidated sandstona. They tested the
various theories against their data and discussed effects
of static pressure and gas overpressure on conductivity.
Brailsford and Majo 1* have a 1 so compared experimental sand
stone conductivity data to a theoretical relationship-
Walsh and Decker have related the thermal conductivity of
low porosity granites to the measured porosity and inter
preted their results with a theory involving an effective
or "crack" porosity derived from strain versus pressure
data. Tn the remainder of this section we shall review
the theories which have been applied to sandstone data and
examine what pressure dependences of conductivity are predicted
by each.
One of the sin-pies t models of porosity was borrowed from 19 the work of Maxwell in electromagnetic theory. In this
analysis, Maxwell considered a dilute solution of spherical
dielectric particles imbedded in a continuous host material
19

with a different dielectric constant and derived an electro
static expression for the dielectric constant of the composite
material, Brails^ord and Major have reviewed the Maxwel1
derivation and applied it to the case of thermal conduction.
The same theory is frequently applied to the analysis of solar
selective absorbers consisting of small metallic particles
embedded in a dielectric matrix. In this case the theory ;'s
called the Maxwell Carnett theory after J. C. Maxwell Garnett,
who applies the Maxwell wave theory to composite media. The
major assumption in the Maxwell model is that the conductivity
of each spherical inclusion is uniform but that the inclusions
are widely separated so that the temperature distribution in
the vicinity of each inclusion is not affected by the presence
of other inclusions. We shall consider a system consisting of
a continuous rock host material with a conductivity )- with
inclusions containing a gas ?f conductivity * . The result
of the Maxwell theory for the effective conductivity A of 7 ; er the composite with a continuous rock phase is then given by
where f = volume fraction of gas and x - X /A . An interesting observation concerning Eq. (ID is that it contains no details about the shape and distribution of voids other than their net volume fraction. Thus, although the theory is derived for Spherical inclusions, it is usually applied to general systems
20

with arbitrarily shaped inclusions. For a typical gas -2 21
X ~ 1--3 x 10 W'm-K at standard temperature and pressure g while X i 2 W/m-K. 6 Thus A IX ~ 10" and hence Eq. (11) r g r may be approximated by treating x as a small quantity. The
result is
akm [(1-£) + T- (f + TTTTT)] ( 1 2 >
X r / X is plotted in Fig. 2 (curve (1)) as a function of porosity for 0 < f < 0.4. If it is assumed that the gas phase is continuous and the solid or rock phase is discontinuous, then
the effective conductivity X can be deduced from Eq. (11) eg
by interchanging \ and A and replacing f by 1-f . Porous
rock with gas phase continuous is imagined to be composed
o" more or less discrete pieces of solid rock, each of which
is completely surrounded by intergrannular cracks. The result
is
= Arx[3-2f(l-x)]/[3x + f(l-x)] (13)
This relation is plotted as curve (2) in Fig. 2. The assumption
of a continuous gas phase yields a much more rapid decline of
* with increasing porosity.
In their experiments on porous sandstone, Woodside and
Messmer found that the data could be fit quite well to a
weighted geometric mean formula,
21

A = A > em g r
f , (1-f)
(14)
Equation (14) is plotted in Fig. 2 for x = 10~ (curve (3)).
Mo theoretical basis was advanced for this model. Tt is evident
that the decline of A with increasing porosity in the geometric
mean model is much greater than that predicted by the rock
phase continuous Maxwel1 theory. Brailsford and Major fit 22 the sandstone data of Sugawara and Yoshi zawa to a modified
Maxwell theory formula (Fig. 2, Curves (4), (5)). In this
theory, the heterogeneous solid is imagined to be composed of
both rock phase continuous and gas phase continuous Maxwe11
solids imbedded in a medium which has the effective conductivity
of the medium. The Brailsford and Major model is defined by
the equa tions,
'e(BM) * r ( A e r A r ) ^ + t^2*9*^) / 4 < 1 5>
A /A eg er
q = 1 + (1-x) (l-3f )
Curve (4) in Fig. 2 is calculated with f = f; curve (5),
wh ich Brailsford and Major fit to the Sugawara and Yoshizawa
data, is calculated with the assumption,
22

f[a + <l-a)f] (16)
and a = 0.8. Although Eq. (16) was proposed by Brailsford
and Major as having general utility, it does not lead to a
good fit of the Woodside and Messmer data for any physically
reasonable value of a (a value of a for which f S 1 when
0 < f < 1).
Figure 2. Relative effective conductivity ^ e / A r versus void volume fraction f as predicted by various theories: (1) Maxwell theory - solid phase continuous, X e v / \ r , Eq . (11). (2) Maxwell theory - liquid (or gas) phase continuous, A e g / A r , Eq. (13). (3) Geometric mean empirical model, A e m / ^ r , Eq. (14). (4) Brailsford and Major effective medium model, X e(BM)/A r, Eq. (15). (5) Brailsford and Major modified model using Eq. (16) to calculate an effective void fraction. The value assumed for Xg/X r
in these calculations was 0.01.
23

Walsh and Decker have studied the effect: of pressure J saturating fluid on the thermal conductivity of low
rnsity rock such as granite. The main thrust of their
pungent is that there are essentially two types of voids
in low porosity rock; closed isolated voids and quasi-
continuous intergranular cracks. The cracks are proposed
to have the most effect on the thermal conductivity, and as
the volume of these cracks decreases under pressure, the con
ductivity will increase Walsh derives this effective void
fraction due to cracks from isothermal strain data. In
Fig. 3 strain versus pressure data are shown for a sample
of Casco granite. The rapid initial rise of the strain
JJV/V_ is believed to be caused by the closing down of the
intergranular cracks. At higher pressures the strain becomes
linear in an "intrinsic" region where all of the cracks are 23
closed. In the Walsh analysis, the porosity fraction due
to cracks f is derived from the strain data by extrapolating
the linear strain region back to p = 0 as shown in Fig. 3,
where f = strain intercept of this linear extrapolation.
Since Walsh and Decker assume quasicontinuous cracks,
they utilize the Maxwell fluid phase continuous relation,
Eq. (13) but replace f by f . Using the strain data they
derive the pressure-dependent porosity f c(p), as shown on
7ig. 3, and with Eq. (13) calculate * (p) which is then
compared to experiment. In the case of Casco granite with
24

overall porosity f = 7 x 10 and crack porosity f = A \ 10
they find reasonable agreement between experiment and theory
at pressures p ^ 100 MPa. A replotted curve of their experi
mental A versus p data for an air-saturated sample is shov;n e r r
on Fig. 4 (curve (2)). In the case of water-saturated rock,
they observe an overall higher conductivity with only ~ 3%
change in conductivity at 100 MPa. Although this theory seems
reasonably sound for low-porosity rock, it is not possible to
say whether it also works for more porous rock such as sand
stone. To the best '>f the author's knowledge, it has never
been applied to other materials. 1.0 I 1 1 > 1 1 r
_ L J i i 1 I . i i i I Rj 100 200
p(MPa)
Figure 3. Stain versus pressure (solid line) for Casco granite (Ref. 18) showing construction used to determi crack porosity f e. At p = 0, f c is found by extrapolai-ing the linear strain region to p = 0 (dashed line). At an intermediate pressure, p]_, f
c(Pi) is the distance between extrapolated and actual strain curves.
25

0.8
0.4
0.2
/RJ- - T • • • t - | — i — ( _ _ r- I—: '<W\
-
- Jl (5)
•
f- -
i i i i 1 i i 1 1
10 30 50 70
p<MPai
Figure 4 . Relative effective conductivity ^ e / ^ r versus pressure from various models and experiments. (1) Geometric mean model with fluid rock phase, Eq. (17) for f(p). (2) Data of Walsh and Decker 1 8 for Casco granite under uniaxial stress. (3) Data of Woodside and Messmer 1^ for Berea sandstone air loaded. (4) Data of Woodside and Messmer for the same samfle vacuum loaded. (5) Geometric mean model with "rigid" rock and p e a s = P r o rif and X g f r o m Eq. (22). S
In the general case, the variation of thermal conductivity
with pressure for porous solids will depend on the way in which
the porous regions collapse under pressure. At one extreme,
the sol id could behave as a dense liquid and transmit all external
pressure to the void spaces which would collapse until the
internal gas pressure in the voids equaled the external pressure.
In this case the ideal gas law yields the following relation for
the pressure-dependent porosity f(p),
6

f (p> - f ( p 0 ) p 0 / p (17)
where p Q = atmospheric pressure (- 0.1 MPa). With this relation
and a model giving conductivity as a function of porosity» the dependence of conductivity on pressure can be found. For the
geometric mean model, an increase in pressure to 1 MPa will
cause the conductivity of 20% porous rock to Increase from 0.4 X to 0.87 A . At p = 10 MPa the conductivity is r r J
practically saturated at A . Since the conductivity of gases
will increase with increasing pressure, the increase of A
with pressure will be even more rapid than that predicted
from Fig. 2 , curve (3), and Eq. (17). The variation „f A em
with p is shown as curve (1) in Fig. A. At the other extreme, the solid could behave as a com
pletely rigid body, with little change in void space dimensions
as pressure is applied. Since the rock is presumed fo be deep
in the ground, the gas will be assumed to be at the same pressure
as the solid. Then, all variation of A with p will be caused
by the variation of A with p since A is practically constant. g
The thermal conductivity of a gas is given approximately by
xg w T cv ' * • < 1 8>
27

where c = specific heat, v - average molecular velocity, and
SL = mean free path. For a gas In a pore with a diameter d,
the mean free path is related to its value Z* in an infinite
gas by
l/£ = 1/8.Q + 1/d (19)
Then, designating the infinite gas conductivity by A n» the
expression for X (p) becomes
VP> 0 < p ) d / < J t 0 + d ) (20)
24 i - l Zp. is given by £„ = l//2Trncr , where n = p-imb' of gas
3 molecules per cm and a - scattering cross sec i.. n. Using the ideal gas law, p = nkgT, where k„ - Boltzmann constant,
V p ) = x go<p> ? d + r (21)
where e = k I//2"TTO . When d is large X (p) -* ̂ „n'l'^ a n d
when d Is small X (p) •* X Q ( P ) pd/e. Since pd/e = d/H.,
X (p) £ X n(p) and hence use of X Q will yield an upper limit,
for the gas conductivity.
28

24 Data tabulated by McLaughlin show that the variation
of A with pressure for nitrogen is linear in the region
0 < p S 100 MPa. A fit to the tabulated data shows
(22)
where \ = 2.7 x 10~ 2 W/m-K and k = 6.81 x 10~ w/m-K-MPa.
This form for >, can be used i.i any of the models previously
described. Figure 4 (curve (5)) shows the results of a
calculation with the geometric mean model. For these
calculations, the initial porosity was taken to be 20%. The
dashed line in Fig. 4 shows an experimental A versus p rela
tion reported by Woodside and Messmer for Berea sandstone with
22% measured porosity and saturated with air (curve (3)).
In this experiment, the pressure was applied hydraulically
to a rubber-coated sample whose interior was connected to a
gas pressure source. The gas pressure was maintained at
1 nin (0.1 MPa) for this test. A similar curve for an
evacuated sample subjected to hydraulic pressure is shown
by the dash-dot line in Fig. 4 (curve (A)). The similarity
between the two experimental curves was interpreted by
Woodside and Messmer as evidence that the increase in
conductivity with pressure is caused predominantly by
imrroved intergranular contact at high pressure and not
by an increase in gas conductivity. In another experiment
29

with a hydraulic pressure of 27.6 MPa in excess of the N ? loading
pressure, little change was observed in the conductivity up *:o
an N„ pressure of 6.9 MPa. The experiment was taken as confir
mation of the prediction that the increase in gas conductivity
with pressure will cause only a small change in the net conduc
tivity.
With a liquid such as water in porous rock, the conductivity
becomes much higher since X„ „ - 25 X . and X„ „ i 0.2 X , . H 2O air H2O rock
In general, the Maxwell relations, Eq. (11) or Eq . (13), do not predict the observed conductivity when the measured porosity and
known va'ues of X . and A.. _ are used in them. Liquids may only rocs 11 o u partially saturafe porous rock such as sandstone which then must
be considered as three-cornponent systems of rock, liquid, and
air. The presence of nearly incompressible liquid in rock will
reduce the variation of conductivity with increasing pressure.
D. Discuss ion
From the above review it appears that the dominant factors
in determining the pressure dependence of thermal conductivity
are porosity and liquid content of the rock. A reliable model
of heterogeneous conductivity does not exist, but the weighted
geometric mean formula, Eq. (14), should provide an estimate
of the conductivity if tho porosity and conductivity of the
nonporous rock are known. The change of conductivity with
pressure is expected to increase as either the porosity
increases or the liquid content decreases. The effect
30

of pressure on porous rock is to reduce the size of the pores
and improve the intergranular contact. Both of these effects
produce an increase in thermal conductivity. If the pores a r
free to collapse until the trapped gas pressure equals the
external pressure, then Fig. 4 shows that the rise In con
ductivity will be extremely rapid.
In the case of pressure application, the conductivity
of rock always rises and hence the surface temperature of a
waste .anister embedded in the rock would be expected to fall
This represents more effective cooling of the canister and a
generally safer condition. A more important effect, and one
which would shift conductivity in the opposite direction,
would be the evaporation of included water in the vicinity
of the canister. For example, if a canister is buried in
war.er-saturated 20% porous shale with a rock conductivity
of 1.62 W/m-K, then the net initial conductivity predicted
by the geometric mean model, Eq. (14)» using X = 0.5 W/
m-K, is X = 1,33 W/m-K. If the water is converted to a e saturated vapor at 100K, the conduct ivity becomes XTT „
HTU * 0.025 W/m-K and the effective conductivity changes to
X - 0.7 W/m-K, a reduction of the conductivity by about a factor of two. This conductivity reduction would result in decreased heat dissipation in the rock surrounding
the canister with a consequent increase in canister surface
temperature. This effect of water boll-out has probably 'ieen observed in experiments on Eleana argillite reported in the

FY77 Eleana Project Annual Report. In these experiments,
significant drops in conductivity were observed for samples
held near 100°C for 24 hours.
E. Comparison with Recent Experiments
Recently, A, Lappin has reported measurements on the
thermal conductivity of welded and nonwelded tuff from C
Tunnel at the Nevada Test Site (NTS). In order to compare
the results of Lappin's experiment with the theory of Sec.
III-C, we have selected his 500K data which should not have
been greatly affected by the Initial water in the rock. The
measurements were per formed at NTS by the transient heat flow 12 technique. The results are summarized in Table VI.
Table VI. Typical Thermal Conductivity and Porosity of Welded and Nonuelded Tuff from G Tunnel at NTS. From A. R. Lappin
Tuff Type Porosity (•/.)
Measured Conductivity
(W/m-K)
Welded
Nonwelded
13 44
1.18 0.41
The major problem in comparing these data to theory is that
the zero porosity rock <̂ .id uc t ivi ty X Is unknown. Lappin has
suggested using a A for granite = 4 W/m-K. Touloukian et al.
32

show A data for NTS granite in the range 1.5-1.8 W/m-K in 27
the temperature range 750-800K. Clark gives values A r ~
2.3 W/m-K in the temperature range 473-573K for various
eastern locations. We have elected, somewhat arbitrarily,
to treat A as an adjustable parameter and determine it by
fitting the geometric mean model (Eq. (14)) to the welded
tuff data in Table VI. The model then predicts the nonwelded
effective conductivity which can be compared to the measured
value in Table VI. The results are shown in Table VII.
Table VII. ReBults of Comparing the Data from Table VI to the Geometric Mean Model, Eq. (14), at 500°C. *air " °* 0 5 6 W/m-K.
Tuff Type Poroslty-f
(X) X r(K/m-K)
Measur ed X (W/m-K) e
Calculated X e(W/m-K)
Welded
Nonwelded 13 44
* 1.86 *
1.86
1.18 0.41 0.40
Fit value of A Computed value of A for nonwelded tuff
The model evidently predicts a nonwelded tuff conductivity
which is extremely close to the experimental value. The
1.86 W/m-K value of A determined from the welded tuff data
is in good agreement with the data reported by Touloukian but
only about half of Lappin's ambient temperature assumed valu«.
The 25 C values of A reported by Lappin are 1.62 and
0.61 W/m-K for welded and nonwelded tuff respectively. The
extra conductivity at 25 C is probably due to the presence
33

of moisture. If we assume tnat the volume fraction of water is f and air f , then the r.atur&l extension of Eq. (14) to a w g three-component rock, water, air system is, with f - f + f
X . X ( 1 " f ) X f * X f " . (23) e r g w
If It ia assumed that all of the water is driven off at 500 C
so that f = 0 at that temperature, and that the variation of
X with T is 6mall, then Eq. (23) may be used to derive a
value for f . The ratio X £ (25°C) M e(500°C) is given by
* < « > (f-f,..> X (500) g v w l " 7 " g * V">/ X (25) X (25)/X (500) (24)
Solving for f yields
8,n[xe(25)/Xe(500)] + f «.n[xg(50C) A gC25)] ( 2 5 )
SU[X (25)/X (25)]
Using x„(25) - 0.026 W/m-K, X (500) - 0.056 W/m-K, and
X (25) • 0.605 W/m-K, Eq. (25) predicts f = 13% and 23%
for welded ar.d nonuelded tuff respectively.
34

Lappin has determined values for densities, porosities,
and water content of the two tuff types. He reports typical
values as shown In Table VIII.
Table VI11. Nominal Values of Density, Porosity and Water Content for Welded and Nonwelded Tuff as Reported by Lappin
Tuff Type 3 p(flm/cm )
Poros lty Water wtX
Water vol%*
Eq from . (25)
Welded
Nonwelded
2.2
1.9
10
35
6
18
13.2
34.2
13
23
Water volX = (water »tZ) [ P / PH 2o]
The last column Df Table VIII shows the prediction from
Eq. (25) using the previous f values of 0.13 and 0.44 for
welded and nonwelded tuff respectively. Thus, Lappin's
experimental data indicates that both types of tuff are
essentially saturated with water at 25 C while the geo
metric mean formal ism leads to a lower predicted initial
water content for the nonwelded tuff.
On the basis of this limited data, we conclude that
the three-component geometric mean formula, Eq. (23), is
in semiquantitative agreement with the tuff experimental
data. A is considered as a zero porosity rock conductivity
which mus t be determined experimentally from high temperature
35

conductivity. The prediction of X as a function of porosity
for a two-component rock-air system appears quite good. In
the case of three-component rock-air-water systems, Eq, (25)
appears to yield reasonably good results. More precise data
on conductivity as a function of water content and porosity
are needed to better define the limits of validity of Eq. (23).
IV. Coneluslons
The major conclusion of this investigation is that porosity
plays a dominant role in determining the effect of pressure on
thermal expansion and conductivity. As porosity increases, the
rate of change of both these quantities with pressure increases.
It is reasonable to expect that porosity will decrease with
increasing depth, but without detailed knowledge of this varia
tion It is not possible to quantitatively predict the depth or
pressure dependence of the rock thermal properties. The
calculated changes of thermal expansion in Table II show that
dense rocks such as granite experience a decrease in expansion
coefficient £ 5% at a pressure of 100 MPa while porous rock
types such as sandstone experience changes - 25%. An estimate
of the change of expansion under pressure can be made from
data o,. compressibility (or bulk modulus) versus temperature
through use of Eq. (5). In the case of Water-bearing rock,
any reduction In water content caused by boil-out will serve
to increase the compressibility and consequently cause a
36

large shift in thermal expansion. Thus moisture content
piays an important role in determining thermal expansion
just as it does in determining conductivity.
The depth dependence of thermal conductivity can
be estimated if the porosity, water content, and variation
of these quantities with depth is known. If the porosity
is gas filled, the weighted geometric mean formula,
Eq . (14), is recommended for calculating the conductivity.
A reasonable extention of Eq. (14) to rock with gas and
water-filled porosity is given by Eq. (23). If possible,
this formula should be verified by measuring the conductivity
of rock with varying porosity and water content and then
comparing the results to the predictions of Eq. (23), Since the various X formulas discussed in Sec. II-B have not been e extensively verified by comparing their predictions to a
wide range of experimental results, it is not possible to
use them with a high degree of confidence. The Woodside
and Messier experimental results and Lappin's tuff data
support the validity of the weighted geometric mean formula.
However, Eq. (14) and Eq. (23) have no theoretical foundation
and thus there is no way to estimate what their limits of
validity or applicability are.
The experimental problem of measuring the depth
dependence of conductivity or expansion depends on how
elastically the porosity collapses. If the collapse is
completely inelastic, then the porosity will remain closed
when F. core sample is removed from a drill hole. In this
37

case, the functional dependence of conductivity and expan
sion with depth cruld be determined quite accurately from
atmospheric pressure measurements on core samples. On the
other hand, if the porosity collapse Is partially elastic,
then accurate properties determination will necessitate
development of equipment capable of determining properties
in the presence of an applied hydrostatic pressure.
The development of equipment capable of measuring
properties under hydrostatic pressure is expected to be
difficult. Since rock samples will usually contain water,
the pressure apparatus would have to be gas-tight. For
thermal expansion, the pressure dependence can be derived
from measurements of the isothermal compressibility as a
function of temperature at several fixed pressures in the
range 0-100 MPa. For thermal conductivity measurement, the
radial heat flow method is probably the most adaptable tech
nique for use at high pressure, and it has been employed by 3
Kieffer et al. at pressures up to 4 x 10 MPa with samples 12 approximately 1.3 cm in diameter by A cm high. For inhomo-
geneous rock specimens, larger sample sizes will be required
in order to average over the inhomogeneities. The require
ment for gas-tight sealing will make the task of running
thermocouple leads into the cell a difficult one.
As a result of the projected difficulty and expense
Involved in measuring the pressure dependence of thermal
conductivity and expansion for Inhomogeneous rock samples,
38

It Is recommended chat effort be directed to developing a more
fundamental understanding of the effect of moisture content
and porosity on thermal proptrties and to understanding the
way porosity collapses as depth and pressure increase. A
specific recommended course of action for waste repository
thermal properties studies is the following.
I. From drill samples, measure the followinR
quant:'ties as a function of sample depth
1. Moisture content
2. Porosity
3. Dens ity
A. Thermal expansion versus temperature
at atmospheric pressure
5. Thermal conductivity versus temperature
at atmospheric pressure
II. From these measurements correlate expansion and conductivity with porosity and attempt to fit analytical expressions to the experimental data.
This program should prove to be useful if the porosity
remains collapsed after samples are removed from the earth
and brought up to atmospheric pressure. If the collapse of
porosity is partially elastic, then some of the collapsed
porosity will be reestablished upon sample removal and thus
39

atmospheric pressure conductivity measurements will under
estimate the true conductivity.
Another area which needs to be investigated is the
dynamic behavior of porous water-bearing rock in proximity
to a bore hole drilled in the ground with a heat source In
the hole. In this case, moisture can escape up the hole
and the porosity can then collapse further, leading to an
eventual increase in the thermal conductivity and decrease
in the expansion coefficient. In a situation such as this,
laboratory experiments on sealed samples might well produce
data which are not applicable to an actual waste disposal
scenario.
40

R. D. Cheverton, W. D. Turner, "Thermal Analysis of the
National Radioactive Waste Repository, Progress through
June 197 1," ORNL-4726, Union Carbide Corp. December 1971,
pp. 39-40.
F. W. Sears, Thermodynamics, The Kinetic Theory of Gases,
and Statistical Mechanics, 2nd Ed., Addison-Wesley,
Reading, MA, 1956, pp. 30-40.
S. P. Clark, Jr., Handook of Physical Constants, Revised
Ed., Geologic Society of America, Inc., 1966, p. 170,
Table 7-17.
P. W. Bridgman, The ?hysics of High Pressure, G. Bell
and Sons, London, 1958, p. 169.
S. P. Clark, Jr., Op. Cit. p ;*. 23-24, Table 4-4.
v. s. Touloukian et al., Thermophysical Properties of
Hatter - Thermal Conductivity of Nonmetallic Solids,
TPRC Data Series, Vol. 13. Plenum, NY, 1970, pp. 13a-14a.
0. L. Anderson, J. Geophys. Research Tl_, 3661 (1967).
N. W. Ashcroft, N. D. Mermin, Solid State Physics,
Holt, Rinehart and Winston, New York, 1976, pp. 495-505.
E. I. Parkhomenko, Electrical Properties of Rocks,
Plenum Press, New York, 1967, pp. 7-9.
P. W. Bridgman, Op. Cit., p. 322.
S. P. Clark, Jr., Op. Cit., p. 482.
12. S, W. Kleffer, I. C. Getting, G. C. Kennedy, J. Geophys
Research, 8^, 3018 (1976).
13. A. W. Pratt, "Heat Transmission In Low Conductivity
Materials," in Thermal Conductivity, Vol. 1, edited by
R. P. Tye, Academic Press, NY, 1969, pp. 301-405.
14. J. E. Parrott and A. D. Stuckes, Thermal Conductivity
in Solids, Pion, Ltd., London, 1975, pp. 129-147.
15. W. Woodside and J. H. Messmer, J. Appl. Phys. 3A> 1 6 8 8
(1961).
16. W. Woodside and J. H. Messmer, J. Appl. Phys. TZ, 1699
(1961).
17. A. D. Brailsford and K. G. Major, Brit. J. Appl. Phys.
15, 313 (1964).
18. J. B. Walsh and E. R. Decker, J. Geophys. Research 71,
3053 (1966).
19. J. C. Maxwell, A Treatise on Electricity and Magnetism,
Clarendon Press, Oxford, 1904, 3rd Edition, Vol. 1,
p. 440.
20. J. C. M. Garnett, Philos. Trans. R. Soc. Lond. 203,
385 (1904).
21. ¥. S. Toulouk:.an et al., Thermophvsical Properties of
Matter - Thermal Conductivity of Nonmetallic Liquids
and Gases, TPRC Data Series, Vol. 3, Plenum, NY, 1970.
22. A. Sugawara and Y. Yoshizawa , Austral. J. Phys. _1_4, 469
(1961).
23. J. B. Walsh, J. Geophys. Research 7J3. 381 (1965).
42

24. E. McLaughlin, "Theory of Thermal Conductivity of Fluids,"
in R. P. Type, Op. Clt., Vol. I, pp. 29-33.
25. A. R. Lappln, J. F. Cuderman, "Eleana Project Annual
Report for FY-77," Unpublished Sandia Laboratories
Report.
26. A. R. Lappin, Personal communication and to bn published.
27. Y. S. Touloukian, et al., Op. Cit., Vol. II, pp. 817-819.
28. S. P. Clark, Jr., Op. Cit., pp. 468-469, Table 21-4.
43

Distribution:
U.S. Department of Energy Office of Nuclear Waste Management Washington, DC 20545 Sheldon Meyers Raymond G. Ro;natowski Carl W. Kuhlnan Colin A. Heath Donald L. Vieth (2) R. Stein Carl R. Cooley Mark W. Frei Richard H. Campbell F.. C. Hardin
U.S. Department of Energy Richland Operations Office P.O. Box 550 Richland, WA 99352 Frank Standerfer David J. Squiren
U.S. Department of Energy Albuquerque Operations Office P.O. Box 5400 Albuquerque, KM 37185 D. T. Schueler, Jr.
U.S. Department of Energy San Francisco Operations Office 1333 Broadway, Wells Fargo Bldg. Oakland, CA 94612 John S. Muhlestein U.S. Department of Energy Nevada Operations Office P.O. Box 14100 Las Vegas, NV 89114 Mahlon E. Gates Robert W. Taft James E. Cotter Robert M. Kelson Mitchell P. Kunich Henry L. Melancon Allen J. Roberts David G. Jackson NV Technical Library (10)
U.S. Department of Energy NTS Support Office P.O. Box 435 Mercury, NV 89023 J. H. Dryden
San Francisco Office 525 Market Street, Suite 2560 San Francisco, CA 94105 Dale J. Cook
U.S. Department of Energy c/o Battelle Office of Nuclear
Waste Isolation 505 King Avt:nue Columbus, OH 43201 Jeff O. Neff
Nuclear Regulatory Commission Washington, DC 20555 William P. Bishop, M/S 55-604 James C. Malaro, M/S 99-674 Regin Boyle, M/S P-522 Rockwell International Atomics International Division Rockwell Hanford Operations Richland, WA 99352 Raul Deju Bernie Dietz Lawrence Livermore Laboratory University of California P.O. Box 808 Livermore, CA 94550 Lawrence D. Ramcpott Alfred Holzer L. Ballou R. Carlson Los Alamos Scientific Laboratory University of California P.O. Box 1663 Los Alamos, NM 87545 Kurt Wolfsberg, M/S 514 (2) Lawrence S. Germain, M/S 570 Lloyd Lanhan, M/S 755 Bruce M. Crowe, M/S 973 Joe R. Smyth, M/S 978
44

West inghouse P.O. Box 70S Mercury, NV 89023 D. C. Durrill
West inghousci - AESD P.O. Box 10864 Pittsburgh, PA 15236 J. B. Wright Nuclear Fuel Cycle Research University of Arizona Tucson, A2 85721 James C. McCray U.S. Geological Survey Na t iona1 Cen ter Reston, VA 22092 George D, DeBuchauanne, M/S 410 Peter R. Stevens, M/S 410
U.S. Geological Survey P.O. Box 25046 Denver, CO 80225 William W. Dudley, M/S 416 William S. Twenhofel, M/S 954 Geologic Society of America 3300 Penrose Place Boulder, CO 80301 John C. Frye Kansas Geological Survey University of Kansas Lawrence, KS 66044 William W. Hambleton Bat telle Office of Nuclear Waste Isolatio 505 King Avenue Columbus, OH 43201 John M. Batch Sam Bashem R. A. Robinson Wayne Carbiner
State of Nevada Capital Com, lex Carson City, NV 89710 Bruce B. Arkell State Planning Coordinator Governor's Office of Planning
Coordlnation
W^-jdward-Clyde Consultants Western Region Library No. 3 Embarcardero Center San Francisco, CA 94111 Western Region Library
Computer Sciences Corp. 6565 Arlington Blvd. Falls Church, VA 22046 J. A. Lahoud
John A. Blume Engineers Sheraton Palace Hotel 130 Jessie Street San Francisco, CA 94105 Peter Yanev
Texas A&M University College Station, TX 77840 John Handin
Department of Earth Sciences Dartmouth College Hanover, NH 03755 John Lyons CERCDC 1111 Howe Avenue Sacramento, CA 95825 Art Soiuski
Lawrence Berkeley Laboratory Energy & Environment Division University of California Berkeley, CA 94720 Paul Witherspoon
Department of Civil Engineering Princeton University Princeton, KJ Q8540 George Pinder
45

Distribution: 1417 F. McFarling 1417 G. F. Rudolfo 4413 F. Donath 4500 E. H. Beckner *510 W. D. Heart 4511 L. R. Hill 4512 T. 0. Hunter 4512 J. R. Wayland 4530 R. W. Lynch 4537 L. D. Tyler 4537 P. L. Krumhansl 4537 A. R. Lappin (5) 4538 H. P. Stephens 4538 A. E. Stephenson 4542 J. W. McKiernan 4737 B. E. Bader 4737 A. B. Donaldson 5510 D. B. Hayes 5512 H. C. Hardee 5512 C. E. Sisson 5532 B. M. Butcher 5532 W. R. Wawersik 5800 R. S. Claassen
At tn : 5810 R. G. 5820 R. E. 5830 M. J.
Kepler Whan Davis
5840 H. J . Sax ton Attn : 5844 F. P. Gerstle,
5845 R. J. 5846 E. K.
Ea tan Beauchamp
5842 J. N. Sweet (15) 5842 W. D. Drotning 5842 J. E. McCreight 5842 M. Moss 3141 T. L. Werner (5) 3151 W. L. Garner (3)
for D 0E/TIC 8266 E. A. Aas DOE/TIC (27) (R. P . C, amp bell, 3172-3)
46


![UNLIMITED ADVENTURES. UNLIMITED OPPORTUNITIES [INBOUND 2014]](https://img.pdfslide.us/doc/110x75/55d54daebb61ebd6228b4731/unlimited-adventures-unlimited-opportunities-inbound-2014.jpg)


![Ralph Delgado - Ao Sul do Cuanza [Vol. 2] - Cuanza Sul (3).pdf](https://img.pdfslide.us/doc/110x75/55cf9cc5550346d033aafbb6/ralph-delgado-ao-sul-do-cuanza-vol-2-cuanza-sul-3pdf.jpg)


![Ralph Delgado - Ao Sul do Cuanza [Vol. 2] - Cuanza Sul (2B).pdf](https://img.pdfslide.us/doc/110x75/55cf9cc5550346d033aafbb7/ralph-delgado-ao-sul-do-cuanza-vol-2-cuanza-sul-2bpdf.jpg)

