Embed Size (px)
Citation preview
SANAKHAM HYDROPOWER PROJECT
Reservoir Sedimentation and Backwater
October 2018

I
Contents
1 Overview of the Reservoir ...................................................................................................................... 1
2 Operation Mode of the Reservoir ............................................................................................................ 1
3 Analysis and Calculation of Reservoir Sedimentation ............................................................................ 4
3.1 Method and Principles of Calculation .......................................................................................... 4
3.2 Calculation Scheme ................................................................................................................ 7
3.3 Basic Data and Parameter for Calculating ............................................................................. 7
3.3.1 Longitudinal and cross section data of reservoir area ................................................ 7
3.3.2 Analysis of Water and Sediment Characteristics ........................................................ 7
3.3.3 Representative Series of Water and Sediment ............................................................ 8
3.3.4 Sediment Gradation .................................................................................................... 8
3.3.5 Sand Flushing Operation Mode of the Reservoir ....................................................... 8
3.3.6 Calculation Parameters ............................................................................................... 9
3.4 Calculation Result of Sedimentation .................................................................................... 10
4 Calculation of Reservoir Backwater ................................................................................................ 14
4.1 Basic Data ............................................................................................................................ 14
4.1.1 Calculation of Riverbed Surface .............................................................................. 14
4.1.2 Roughness Factor ..................................................................................................... 14
4.1.3 Calculation of Discharge .......................................................................................... 14
4.1.4 Calculation of Dam-front Water Level ..................................................................... 14
4.2 Calculation Result of Reservoir Backwater ......................................................................... 14
4.3 Effect of Sanakham Reservoir Backwater on the Tailwater of Pak Lay Plant ..................... 15
II
List of Tables
Name of Tables Page Table 3.1 Result of Suspended Sediment Gradation Provided by CNR 8 Table 3.2 Flow Velocity Variation at Different Reservoir Sections 11 Table 3.3 10-year Sedimentation Result of Sanakham Reservoir in Different Normal Storage Level Proposals
12
Table 4.3 Relation of Sanakham Reservoir Backwater Level and Discharge at the Tailwater Section of Pak Lay Plant
15
Table 4.1 Results of Backwater in Different Normal Pool Level Proposals of Sanakham Reservoir Q=4410m3/s (Mean Annual)
16
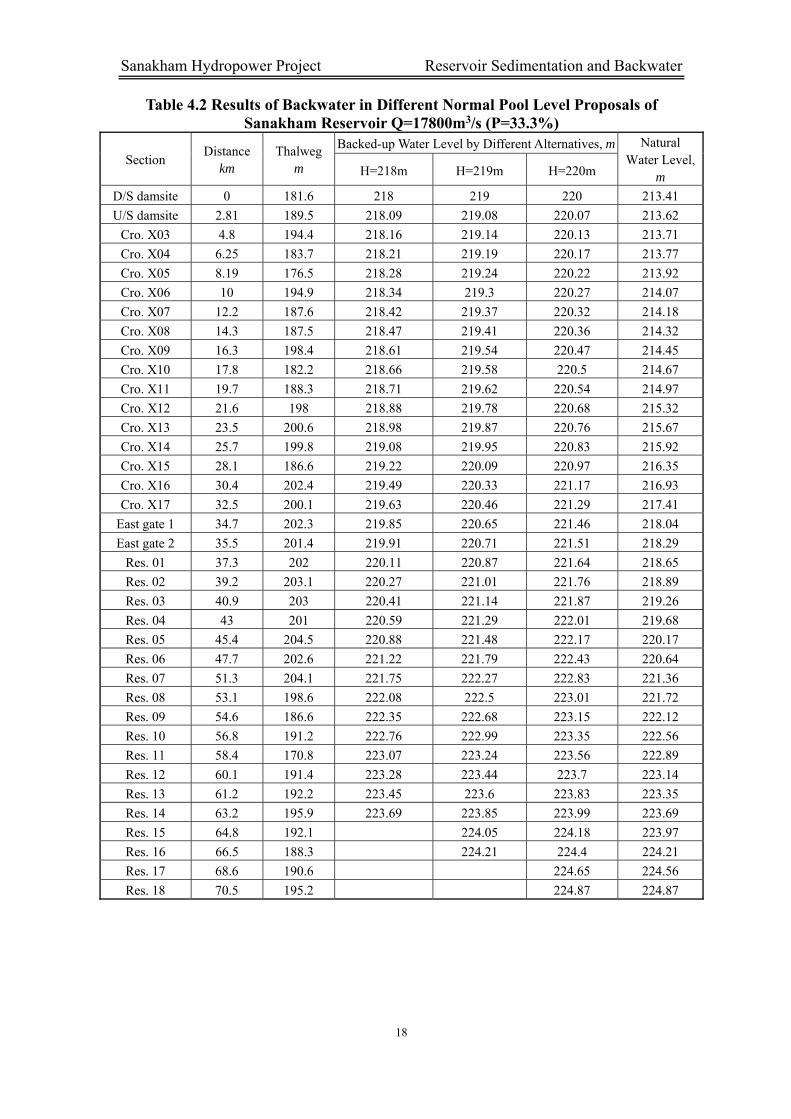
Table 4.2 Results of Backwater in Different Normal Pool Level Proposals of Sanakham Reservoir Q=17800m3/s (P=33.3%)
18
List of Figures
Name of Figures Page Figure 2-1 River Channel in Reservoir Area of Sanakham Hydropower Project 3 Figure 2-2 Cross Section of the River Channel in Reservoir Area of Sanakham Hydropower Project
4
Figure 3-1 Average Flow Velocity Variation at Different Reservoir Sections under Natural Condition
11
Figure 3-2 Average Flow Velocity Variation at Different Reservoir Sections after 10-year Operation
11
Figure 3-3 Longitudinal Section of Sanakham Reservoir Sedimentation in Different Normal Storage Level Proposals
13
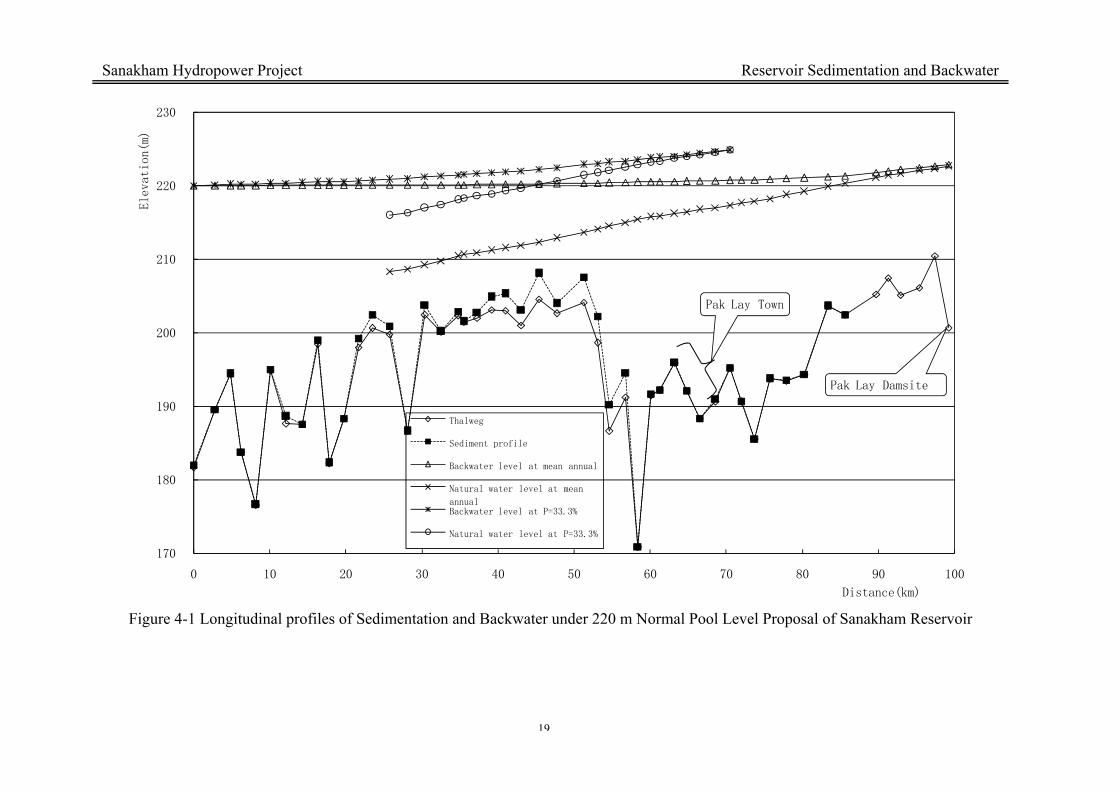
Figure 4-1 Longitudinal profiles of Sedimentation and Backwater under 220 m Normal Pool Level Proposal of Sanakham Reservoir
19
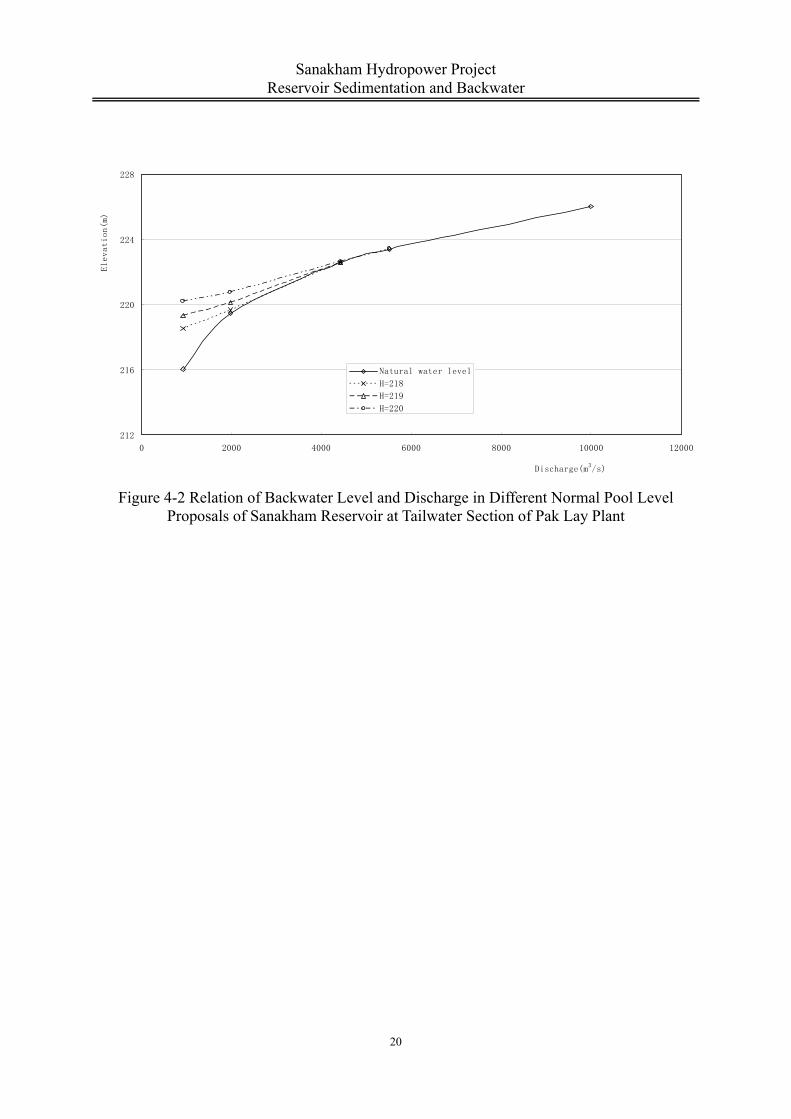
Figure 4-2 Relation of Backwater Level and Discharge in Different Normal Pool Level Proposals of Sanakham Reservoir at Tailwater Section of Pak Lay Plant
20
Sanakham Hydropower Project Reservoir Sedimentation and Backwater
1
1 Overview of the Reservoir
Sanakham Hydropower Project is located on the main stream of the Mekong River, about 1.4km
upstream of B.Pakheung Village, M.Kenthao County, P.Sayaburi in the People’s Democratic of Laos.
The reservoir area is wide and open, featuring massive mountains and dense vegetation on both banks,
and U-shaped river channel. The natural stream gradient in the reservoir area is 0.29‰ in average. The
reservoir storage at full supply level of 220m is 827 million m3, and the reservoir storage-sediment
ratio is about 15.
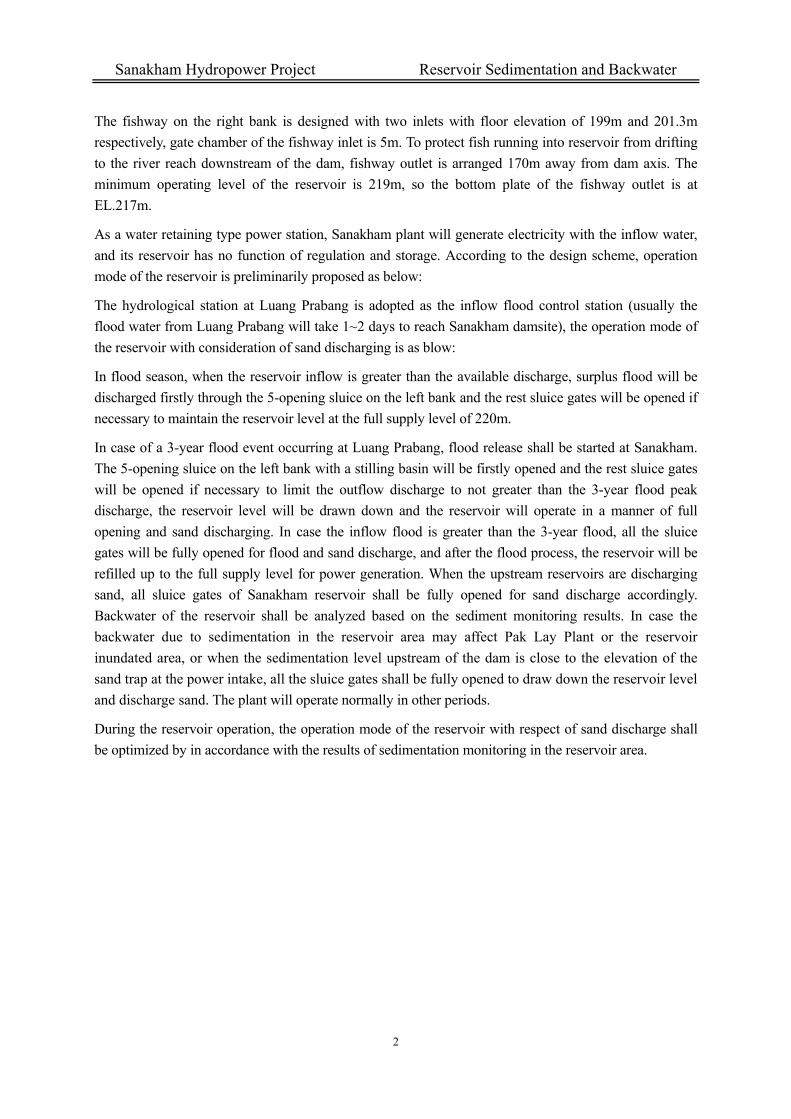
Don Men Village and Pak Lay Town are located at the reservoir area of Sanakham Hydropower
Project. Pak Lay Town is the political, cultural and economic center of Pak Lay county and Pak Lay
County Government is located there. Sanakham reservoir backwater connects with the tailwater of
upstream cascade Pak Lay hydropower station, and Sanakham reservoir dam site is about 99.2 km
away from tailwater of Pak Lay Hydropower Project.
2 Operation Mode of the Reservoir
In 2016, the structures in the feasibility study stage were adjusted according to the review comments in
the Feasibility Study Report of Sanakham Hydropower Project in Laos (Approved Version) and the
independent review comments on Sanakham Hydropower Project. The schemes for project layout after
adjustment are as follows:
The main structures, from the left bank to the right bank, comprise the concrete auxiliary dam on the
left bank, navigation lock, 13-opening sluice on the left bank for flood discharge, river retaining
powerhouse in the middle (with 12 generating units), 5-opening sluice on the right bank for flood and
sand discharge, and concrete auxiliary dam on the right bank. The dam crest length is 909.90m in total,
the dam crest elevation is 229.50m, and the maximum dam height is 56.2m.
The powerhouse section with total length of 350.20m is divided into eight blocks from left to right,
including the block with auxliary erection bay, the blocks with No.1 ~ No.12 units, and the block with
main erection bay.
The 13-opening sluice for flood discharge is arranged on the terrace and flood plain on the left bank,
with an opening size of 15m×22m (W×H) and a floor elevation of 198.0m; while the 5-opening sluice
for flood and sand discharge is arranged on the right bank, with an opening size of 12.5m×16m (W×H)
and a floor elevation of 192.0m for four openings, and an opening size of 12.5m×22m (W×H) and a
floor elevation of 198.0m for the fifth. For the 5-opening sluice on the right bank connecting the
powerhouse section and the fishway outlet, energy dissipation by hydraulic jump is applied. For the
13-opening sluice on the left bank, energy dissipation by hydraulic jump is used to the five sluice gates
near the powerhouse, and energy dissipation by surface flow is used to the rest eight sluice gates.
The navigation lock of the project is desigend as per the single-stage single-line lock of Grade IV with
capacity of 500t. The effective dimension of the lock chamber is 120m×12m×4m (L×W×D). The
whole navigation lock is composed of upstream approach channel, upper lock head, lock chamber,
lower lock head and downstream approach channel. The crest elevation is defined as 229.50m
considering the requirement of navigable headroom.
Sanakham Hydropower Project Reservoir Sedimentation and Backwater
2
The fishway on the right bank is designed with two inlets with floor elevation of 199m and 201.3m
respectively, gate chamber of the fishway inlet is 5m. To protect fish running into reservoir from drifting
to the river reach downstream of the dam, fishway outlet is arranged 170m away from dam axis. The
minimum operating level of the reservoir is 219m, so the bottom plate of the fishway outlet is at
EL.217m.
As a water retaining type power station, Sanakham plant will generate electricity with the inflow water,
and its reservoir has no function of regulation and storage. According to the design scheme, operation
mode of the reservoir is preliminarily proposed as below:
The hydrological station at Luang Prabang is adopted as the inflow flood control station (usually the
flood water from Luang Prabang will take 1~2 days to reach Sanakham damsite), the operation mode of
the reservoir with consideration of sand discharging is as blow:
In flood season, when the reservoir inflow is greater than the available discharge, surplus flood will be
discharged firstly through the 5-opening sluice on the left bank and the rest sluice gates will be opened if
necessary to maintain the reservoir level at the full supply level of 220m.
In case of a 3-year flood event occurring at Luang Prabang, flood release shall be started at Sanakham.
The 5-opening sluice on the left bank with a stilling basin will be firstly opened and the rest sluice gates
will be opened if necessary to limit the outflow discharge to not greater than the 3-year flood peak
discharge, the reservoir level will be drawn down and the reservoir will operate in a manner of full
opening and sand discharging. In case the inflow flood is greater than the 3-year flood, all the sluice
gates will be fully opened for flood and sand discharge, and after the flood process, the reservoir will be
refilled up to the full supply level for power generation. When the upstream reservoirs are discharging
sand, all sluice gates of Sanakham reservoir shall be fully opened for sand discharge accordingly.
Backwater of the reservoir shall be analyzed based on the sediment monitoring results. In case the
backwater due to sedimentation in the reservoir area may affect Pak Lay Plant or the reservoir
inundated area, or when the sedimentation level upstream of the dam is close to the elevation of the
sand trap at the power intake, all the sluice gates shall be fully opened to draw down the reservoir level
and discharge sand. The plant will operate normally in other periods.
During the reservoir operation, the operation mode of the reservoir with respect of sand discharge shall
be optimized by in accordance with the results of sedimentation monitoring in the reservoir area.
Sanakham Hydropower Project Reservoir Sedimentation and Backwater
3
Figure 2-1 River Channel in Reservoir Area of Sanakham Hydropower Project
Sanakham Hydropower Project Reservoir Sedimentation and Backwater
4
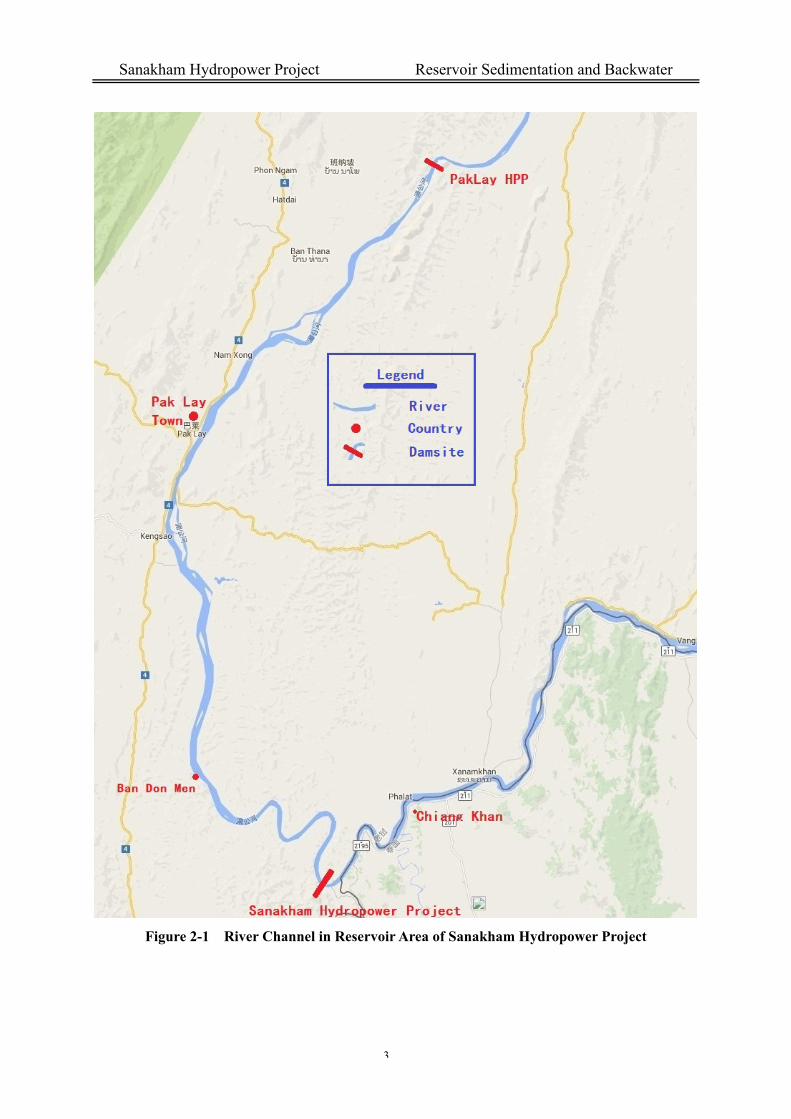
Figure 2-2 Cross Section of the River Channel in Reservoir Area of Sanakham Hydropower
Project
3 Analysis and Calculation of Reservoir Sedimentation
3.1 Method and Principles of Calculation
Susbed-2, nonequilibrium sediment transport model with constant flow, developed by Wuhan
Sanakham Hydropower Project Reservoir Sedimentation and Backwater
5
University is adopted for calculation of reservoir sedimentation. This model has been verified by
prototype test data of large reservoirs and widely used in study and design of hydropower and water
conservancy projects in China. Equations for sedimentation calculation are as below:
Continuity equation of flow:
iqx
Q
(1)
Equation of motion:
0)(2
fgJx
ZgA
A
Q
x (2)
Continuity equation of sediment:
0)(
x
G
x
QS
t
Ar s
(3)
Unbalance calculation mode of suspended load:
)()(
kkkk SSBw
x
QS
(4)
Balance calculation mode of bed load: kk GG (5)
Unbalance calculation mode of bed load:
)( kkkk GGK
x
G
(6)
Bed load composition formula:
0)1()()(
2021
t
E
t
ZPP
x
G
x
QS
t
PEr ms
kkkkkm
(7)
Resistance formula:
342
22
RA
QnJ f
(8)
Formula for sediment carrying capacity:
m
gh
UKS )(
3
*
(9)
Sanakham Hydropower Project Reservoir Sedimentation and Backwater
6
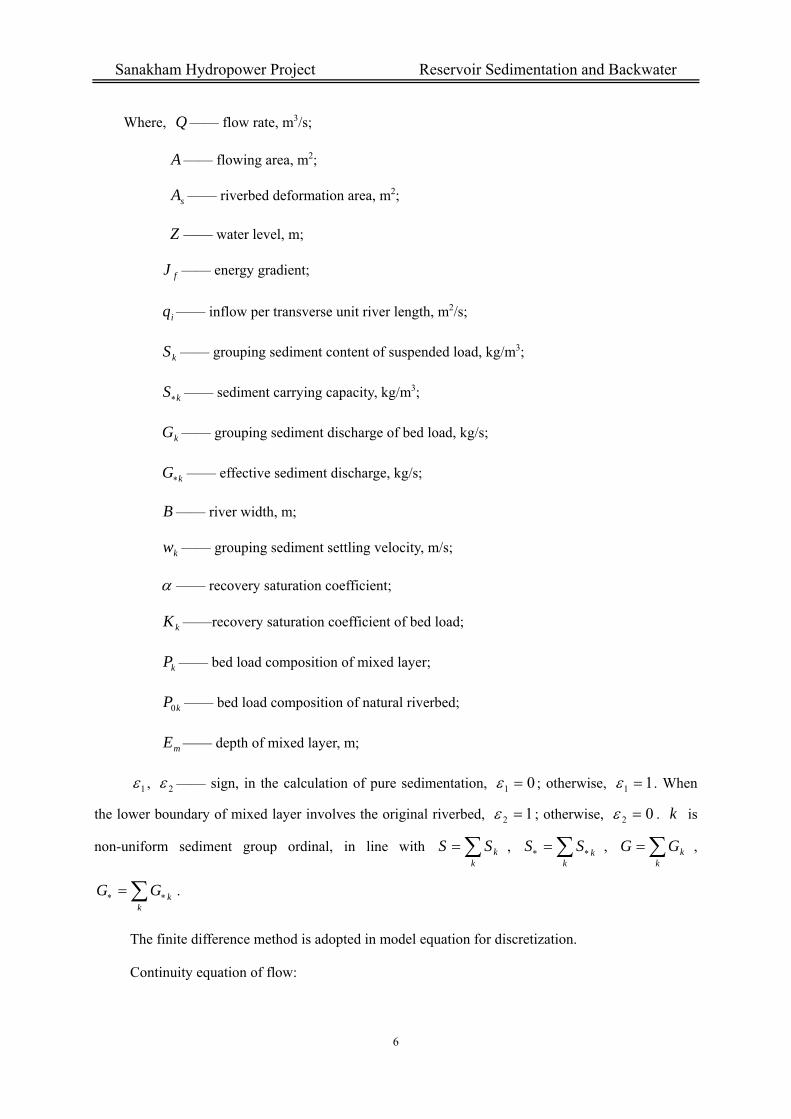
Where, Q —— flow rate, m3/s;
A —— flowing area, m2;
sA —— riverbed deformation area, m2;
Z —— water level, m;
fJ —— energy gradient;
iq —— inflow per transverse unit river length, m2/s;
kS —— grouping sediment content of suspended load, kg/m3;
kS —— sediment carrying capacity, kg/m3;
kG —— grouping sediment discharge of bed load, kg/s;
kG —— effective sediment discharge, kg/s;
B —— river width, m;
kw —— grouping sediment settling velocity, m/s;
—— recovery saturation coefficient;
kK ——recovery saturation coefficient of bed load;
kP —— bed load composition of mixed layer;
kP0 —— bed load composition of natural riverbed;
mE —— depth of mixed layer, m;
1 , 2 —— sign, in the calculation of pure sedimentation, 01 ; otherwise, 11 . When
the lower boundary of mixed layer involves the original riverbed, 12 ; otherwise, 02 . k is
non-uniform sediment group ordinal, in line with k
kSS , k
kSS , k
kGG ,
k
kGG .
The finite difference method is adopted in model equation for discretization.
Continuity equation of flow:
Sanakham Hydropower Project Reservoir Sedimentation and Backwater
7
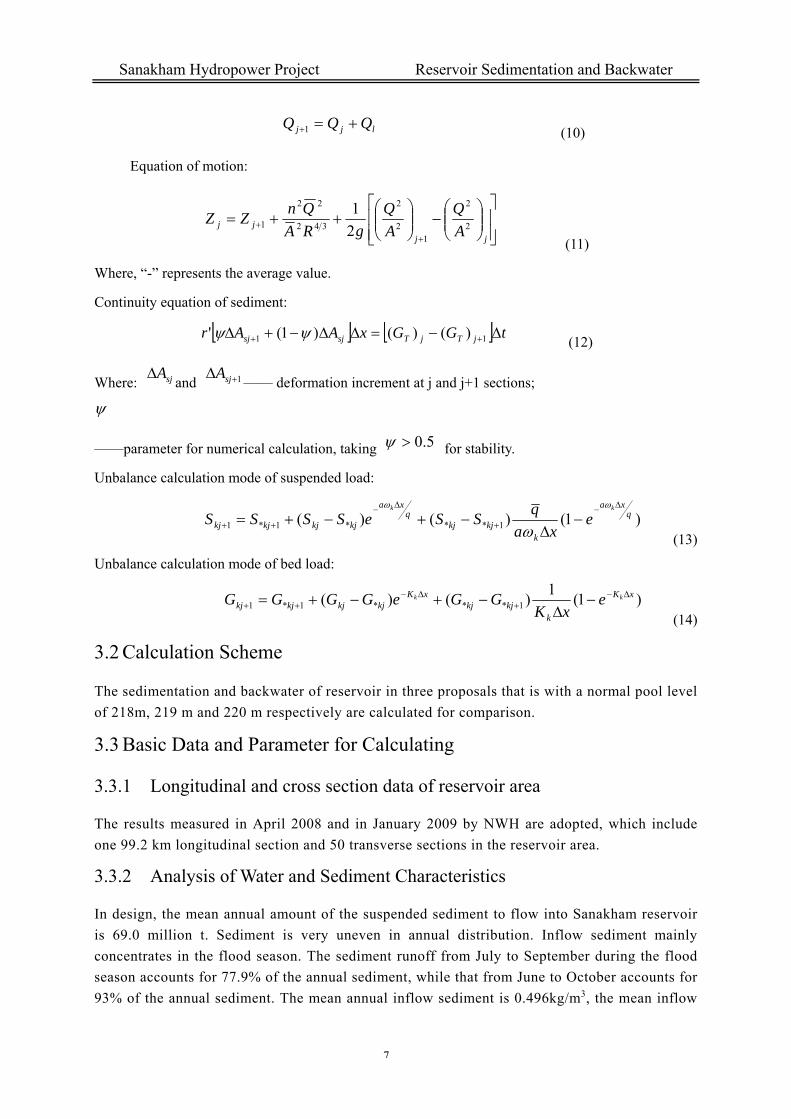
ljj QQQ 1 (10)
Equation of motion:
jj
jj A
Q
A
Q
gRA
QnZZ
2
2
12
2
342
22
1 2
1
(11)
Where, “-” represents the average value.
Continuity equation of sediment:
tGGxAAr jTjTsjsj 11 )()()1(' (12)
Where: sjAand 1 sjA
—— deformation increment at j and j+1 sections;
——parameter for numerical calculation, taking 5.0 for stability.
Unbalance calculation mode of suspended load:
)1()()( 1***1*1q
xa
kkjkj
qxa
kjkjkjkj
kk
exa
qSSeSSSS
(13)
Unbalance calculation mode of bed load:
)1(1
)()( 1***1*1xK
kkjkj
xKkjkjkjkj
kk exK
GGeGGGG
(14)
3.2 Calculation Scheme
The sedimentation and backwater of reservoir in three proposals that is with a normal pool level
of 218m, 219 m and 220 m respectively are calculated for comparison.
3.3 Basic Data and Parameter for Calculating
3.3.1 Longitudinal and cross section data of reservoir area
The results measured in April 2008 and in January 2009 by NWH are adopted, which include
one 99.2 km longitudinal section and 50 transverse sections in the reservoir area.
3.3.2 Analysis of Water and Sediment Characteristics
In design, the mean annual amount of the suspended sediment to flow into Sanakham reservoir
is 69.0 million t. Sediment is very uneven in annual distribution. Inflow sediment mainly
concentrates in the flood season. The sediment runoff from July to September during the flood
season accounts for 77.9% of the annual sediment, while that from June to October accounts for
93% of the annual sediment. The mean annual inflow sediment is 0.496kg/m3, the mean inflow
Sanakham Hydropower Project Reservoir Sedimentation and Backwater
8
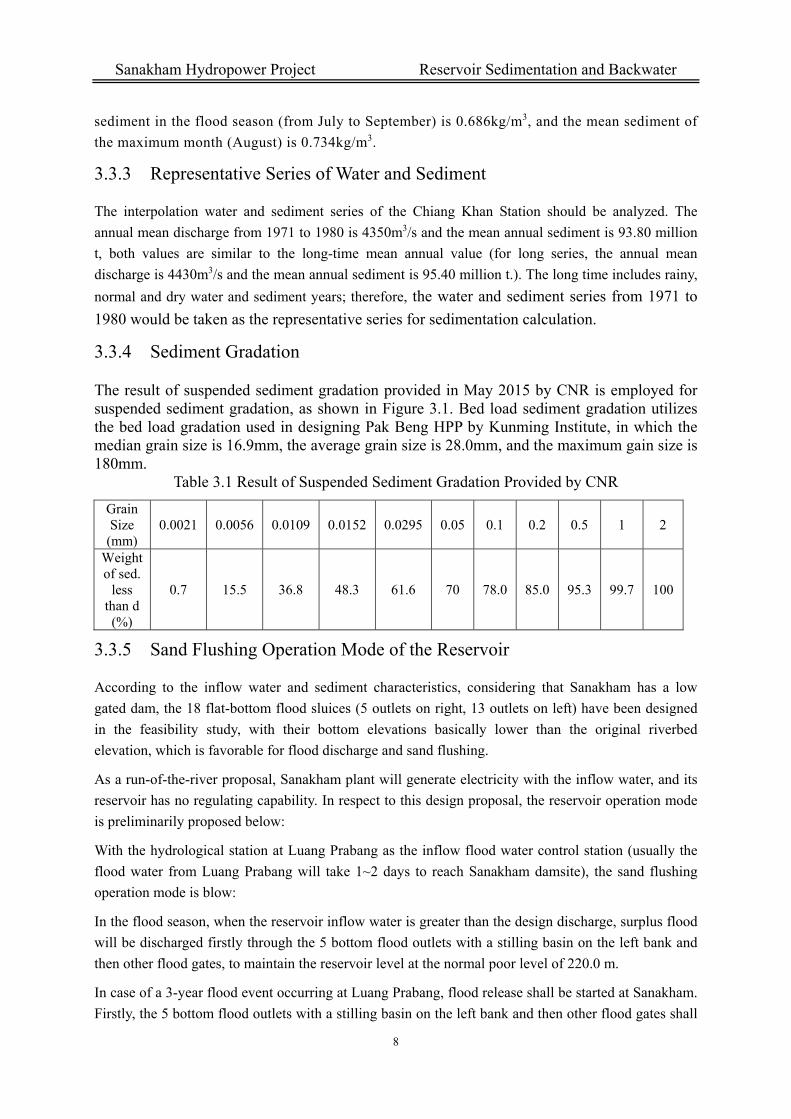
sediment in the flood season (from July to September) is 0.686kg/m3, and the mean sediment of
the maximum month (August) is 0.734kg/m3.
3.3.3 Representative Series of Water and Sediment
The interpolation water and sediment series of the Chiang Khan Station should be analyzed. The
annual mean discharge from 1971 to 1980 is 4350m3/s and the mean annual sediment is 93.80 million
t, both values are similar to the long-time mean annual value (for long series, the annual mean
discharge is 4430m3/s and the mean annual sediment is 95.40 million t.). The long time includes rainy,
normal and dry water and sediment years; therefore, the water and sediment series from 1971 to
1980 would be taken as the representative series for sedimentation calculation.
3.3.4 Sediment Gradation
The result of suspended sediment gradation provided in May 2015 by CNR is employed for suspended sediment gradation, as shown in Figure 3.1. Bed load sediment gradation utilizes the bed load gradation used in designing Pak Beng HPP by Kunming Institute, in which the median grain size is 16.9mm, the average grain size is 28.0mm, and the maximum gain size is 180mm.
Table 3.1 Result of Suspended Sediment Gradation Provided by CNR
Grain Size
(mm) 0.0021 0.0056 0.0109 0.0152 0.0295 0.05 0.1 0.2 0.5 1 2
Weight of sed.
less than d (%)
0.7 15.5 36.8 48.3 61.6 70 78.0 85.0 95.3 99.7 100
3.3.5 Sand Flushing Operation Mode of the Reservoir
According to the inflow water and sediment characteristics, considering that Sanakham has a low
gated dam, the 18 flat-bottom flood sluices (5 outlets on right, 13 outlets on left) have been designed
in the feasibility study, with their bottom elevations basically lower than the original riverbed
elevation, which is favorable for flood discharge and sand flushing.
As a run-of-the-river proposal, Sanakham plant will generate electricity with the inflow water, and its
reservoir has no regulating capability. In respect to this design proposal, the reservoir operation mode
is preliminarily proposed below:
With the hydrological station at Luang Prabang as the inflow flood water control station (usually the
flood water from Luang Prabang will take 1~2 days to reach Sanakham damsite), the sand flushing
operation mode is blow:
In the flood season, when the reservoir inflow water is greater than the design discharge, surplus flood
will be discharged firstly through the 5 bottom flood outlets with a stilling basin on the left bank and
then other flood gates, to maintain the reservoir level at the normal poor level of 220.0 m.
In case of a 3-year flood event occurring at Luang Prabang, flood release shall be started at Sanakham.
Firstly, the 5 bottom flood outlets with a stilling basin on the left bank and then other flood gates shall
Sanakham Hydropower Project Reservoir Sedimentation and Backwater
9
be opened, with the outflow less than the 3-year flood peak discharge, the pool level will be drawn
down to the gate full opening for flood and sand discharge. When the inflow flood is bigger than the
3-year flood, the remaining flood gates will be fully opened for flood and sand discharge; and after the
flood process, the reservoir will be refilled up to the normal pool level for power generation. When the
upstream reservoirs are discharging sand, all gates of Sanakham reservoir shall be fully opened for
sand discharge accordingly. Based on the sediment monitoring results, backwater at the reservoir shall
be analyzed. When the backwater due to sedimentation in the reservoir area may affect the Pak Lay
Plant or the reservoir inundated area, or when the sediment buildup approaches the sand barrier level
in front of the intake, all flood gates shall be fully opened to draw down the pool level for sand
flushing. In other periods, the plant will operate normally.
During the operation period, the sediment monitoring plan shall be well performed to accumulate
more sediment data, so that the sand flushing mode can be optimized further.
3.3.6 Calculation Parameters
a) Sediment carrying capacity coefficient, K and m
The computational model of reservoir sedimentation adopts the sediment carrying capacity formula
developed by Zhang Ruijng (a famous professor of Wuhan Water Conservancy and Electric Power
College). The values of “K=0.2 and m=1.0” were used by Kunming Institute in the engineering design
for Xiaowan Hydropower Project according to the analysis of the water/sediment data measured by
Gajiu station. The analysis of the measured data by Shigu and Panzhihua stations on the Jinsha River
indicated that K value ranges from 0.03 to 0.14; and m value ranges from 0.9 to 1.1.
Based on the above analogy analysis and the analog computation of natural river courses, 10-year
water and sediment series data and the calculation on the original riverbed, the accumulative
sedimentation of reservoir section after 10 years is only 0.59% of the inflow sediment, and the values
of “K=0.2 and m=1.0” are applied in the sedimentation calculation for Sanakham reservoir.
As the results show,the river bed thalweg of river channel transverse section well correspond, and the
erosional and depositional areas are small. In addition, the sediment discharge rate of suspended load
accumulated for 10 years reaches 99.4%.
b) Saturation recovery coefficient
Saturation recovery coefficient α is a proportionality factor. The approach is to convert the river
bottom sediment content and sand carrying capacity of river bottom flow into the average sand content
and sand carrying capacity of water flow, α taking 1. Later on, many researchers introduced α and
grant different physical meanings. Actually, α should be deemed as a comprehensive coefficient, and
its value should be figured out with actual dada. Based on available research data, as for Sanakham,
the coefficient takes 0.25 in the case of deposition, and 1.0 in the case of washout.
c) Roughness factor
The reservoir water surface profile used for roughness calculation is calibrated with the measured
isotime water profile and the surveyed flood water surface profile, which were measured in two times
Sanakham Hydropower Project Reservoir Sedimentation and Backwater
10
of survey at 50 sections in total. Based on the water surface profile simulation, the roughness of the
natural river channel 32km upstream of the dam ranges from 0.017 to 0.05, averaged in 0.03; the
roughness of the natural river channel in the reservoir upstream section (32km~99km) is 0.016~0.052,
averaged in 0.033. The simulated isotime water surface profile (discharge 2110m3/s~1690m3/s) is
0.16m higher than the measured value to the maximum, and 0.21m lower than the measured value to
the minimum, averagely 0.0226m slightly higher than the measured value; the flood water surface
profile (discharge 22200m3/s~13100m3/s) is 0.18m higher than the measured value to the maximum,
and 0.25m lower than the measured value to the minimum, averagely 0.0155m slightly higher than the
measured value. The resultant natural river channel water surface profile reflects well the water
surface profile variations under different discharges.
d) Inflow sediment
Considering the role in sediment retention of cascade reservoirs which have been built or are under
construction on the middle and lower reaches of the Lancang River, the inflow sediment of Sanakham
reservoir is 69.0 million t in design, excluding the role in sediment retention of cascade reservoirs on
the upper reach of Sanakham. The mean annual sediment runoff of 93.80 million t of representative
series from 1971 to 1980 is selected, which is 24.80 million t more than the design inflow sediment.
Therefore, the reduction of year-on-year sediment content would be achieved to make the sediment of
representative series consist with the design inflow sediment. Representative series would be repeated
to form different periods of inflow water and sediment series, so as to calculate the reservoir
sedimentation.
3.4 Calculation Result of Sedimentation
According to the proposed sand flushing operation mode of the reservoir and calculation parameters of
sedimentation, Susbed-2 model is adopted to calculate the reservoir sediment erosion and
accumulation in different proposals. After 10 years of operation, the total inflow sediment would be
703.8 million t, of which the suspended load would account for 690 million t, the sedimentation in the
reservoir area would account for 156 million t including 144 million t of suspended load, with an
average sediment discharge ratio of 77.8%, which would cause a reservoir storage capacity loss of
15.3%, and the sediment would build up averagely to EL.191.5 m in front of the dam. After 50 years
of operation, the total inflow sediment would be 3519 million t, of which the suspended load would
account for 3450 million t, the sedimentation in the reservoir area would account for 334 million t
including 287 million t of suspended load, with an average sediment discharge ratio of 90.5%, which
would cause a reservoir storage capacity loss of 31.2%, and the sediment would build up averagely to
EL.197.2 m in front of the dam. Sedimentation would mainly concentrate in the middle section (28.1
km - 58.4 km to the dam front) of the reservoir area where is relatively wide (averagely 1035 m wide
at the surface level), less at the dam approaching section (dam front - 28.1 km) of the reservoir area
where is relatively narrow (average 665 m wide at the surface level), and least at the reservoir tail
section (58.4km away from the dam). After 10 years of operation, the sedimentations at the dam
approaching section, middle section and reservoir tail section would account for 15.5%, 74.5% and
10% of the total sedimentation in the reservoir; after 50 years of operation, the sedimentations at the
dam approaching section, middle section and reservoir tail section would account for 24.8%, 70% and
5.2% of the total sedimentation in the reservoir, which suggests that the sedimentation would move
Sanakham Hydropower Project Reservoir Sedimentation and Backwater
11
downward gradually.
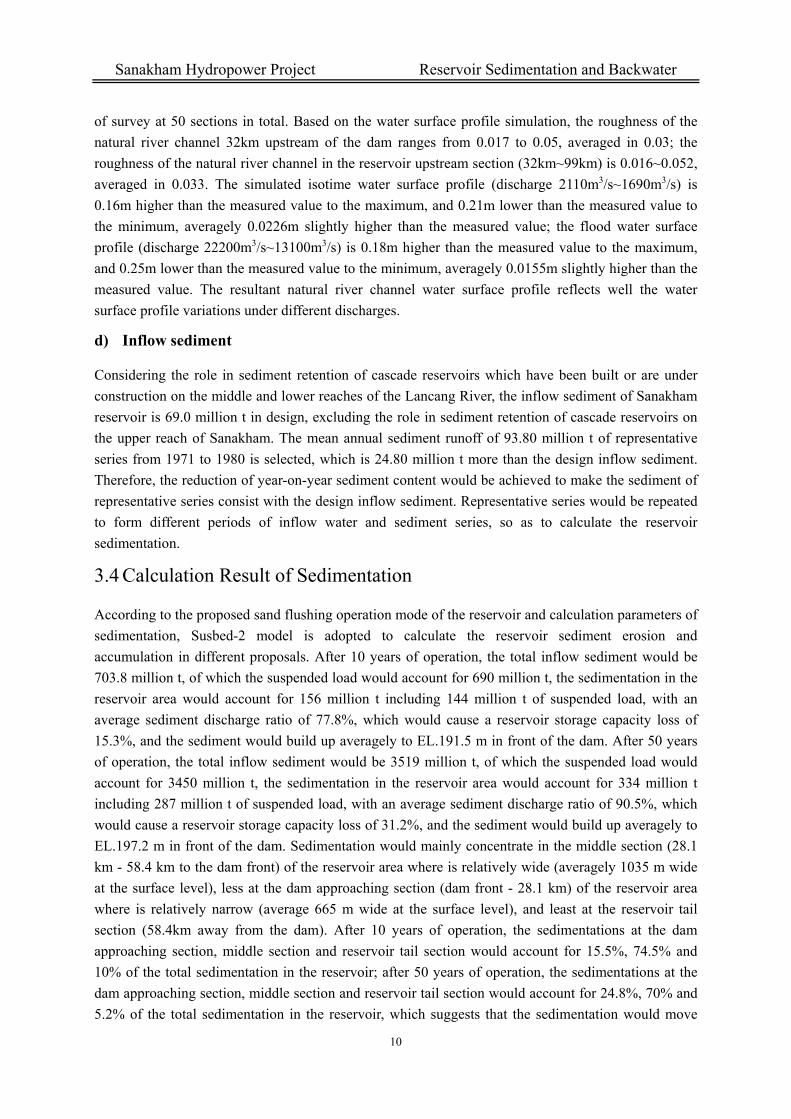
Under the natural circumstances, the average flow velocity variation at the reservoir sections is shown
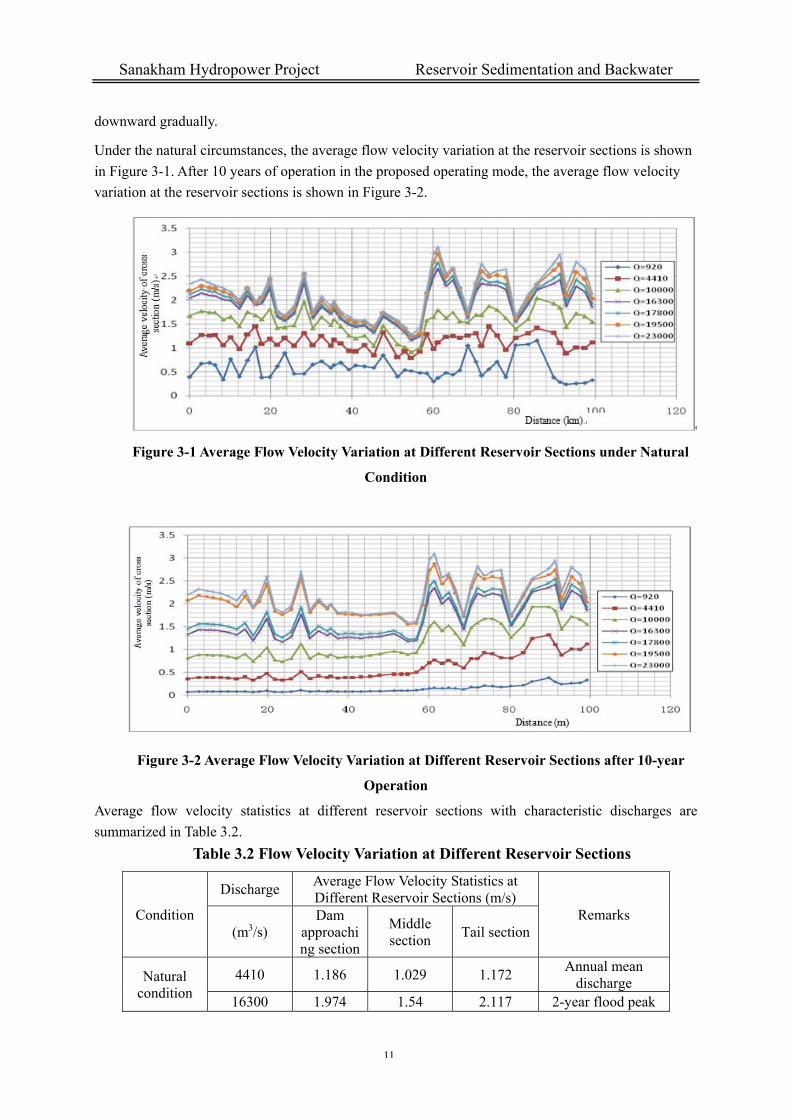
in Figure 3-1. After 10 years of operation in the proposed operating mode, the average flow velocity
variation at the reservoir sections is shown in Figure 3-2.
Figure 3-1 Average Flow Velocity Variation at Different Reservoir Sections under Natural
Condition
Figure 3-2 Average Flow Velocity Variation at Different Reservoir Sections after 10-year
Operation
Average flow velocity statistics at different reservoir sections with characteristic discharges are
summarized in Table 3.2.
Table 3.2 Flow Velocity Variation at Different Reservoir Sections
Condition
Discharge Average Flow Velocity Statistics at Different Reservoir Sections (m/s)
Remarks (m3/s)
Dam approaching section
Middle section
Tail section
Natural condition
4410 1.186 1.029 1.172 Annual mean
discharge 16300 1.974 1.54 2.117 2-year flood peak
Sanakham Hydropower Project Reservoir Sedimentation and Backwater
12
discharge
10-year sedimentati
on
4410 0.387 0.422 0.896 Annual mean
discharge
16300 1.386 1.291 2.067 2-year flood peak
discharge
As analyzed above, in the reservoir tail section, the flow velocity variation between the natural
condition and the after-operation condition would be relatively small. In the middle section and the
dam approach section, the average flow velocity in case of small flow would drop greatly compared to
that in the natural condition, because of the backwater effect when filling the reservoir in case of small
flow; when the flow is greater, the two values have no big difference because of less backwater effect
in case of big flow; the average flow velocity at the reservoir middle section would be smaller than
that at the dam front. Given small flow velocity, sedimentation would build up, and the flow velocity
variation in the reservoir area is consistent with the sedimentation varying trend.
According to the reservoir operation equation, with a simplified Buren Formula, the resultant
reservoir's sand trapping rate is 22.9%, and the sand flushing ratio is 77.1%, which is quite close the
77.8% sand discharge ratio by the mathematical model series, and the result should be rational and
credible.
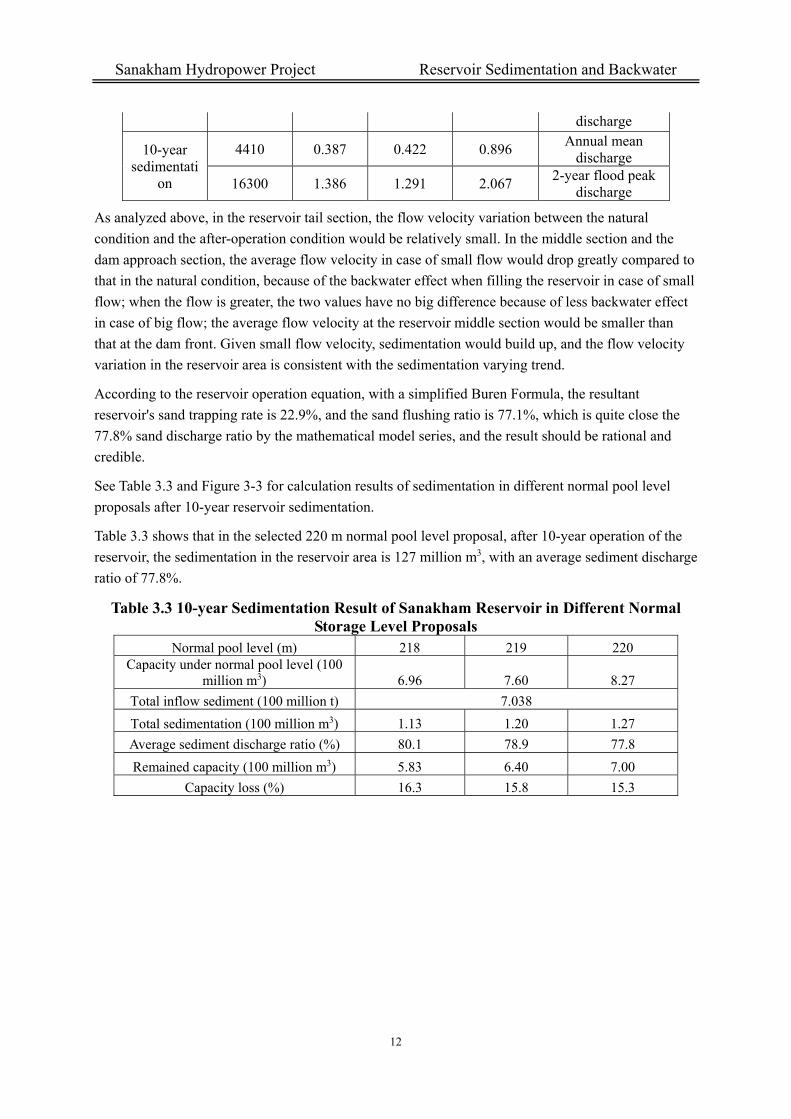
See Table 3.3 and Figure 3-3 for calculation results of sedimentation in different normal pool level
proposals after 10-year reservoir sedimentation.
Table 3.3 shows that in the selected 220 m normal pool level proposal, after 10-year operation of the
reservoir, the sedimentation in the reservoir area is 127 million m3, with an average sediment discharge
ratio of 77.8%.
Table 3.3 10-year Sedimentation Result of Sanakham Reservoir in Different Normal Storage Level Proposals
Normal pool level (m) 218 219 220 Capacity under normal pool level (100
million m3) 6.96 7.60 8.27
Total inflow sediment (100 million t) 7.038
Total sedimentation (100 million m3) 1.13 1.20 1.27
Average sediment discharge ratio (%) 80.1 78.9 77.8
Remained capacity (100 million m3) 5.83 6.40 7.00
Capacity loss (%) 16.3 15.8 15.3
Sanakham Hydropower Project Reservoir Sedimentation and Backwater
13
Figure 3-3 Longitudinal Section of Sanakham Reservoir Sedimentation in Different Normal
Storage Level Proposals
After 10-year operation of the reservoir in the proposed mode, the sedimentation in the reservoir area
would amount to 127 million m3, with an average sediment discharge ratio of 77.8%, the average
sediment content in the outflow water after sediment settling in the reservoir is 0.386kg/m3, only about
22.2% lower than the natural scenario, which suggests that the reservoir have no much effect on the
river water-sediment movement, especially in case of normal floods which play a bigger role in
reforming the downstream riverbed, when the inflow water is greater than a 3-year flood, the reservoir
will be released with all gates fully open, basically without altering the natural inflow water-sediment
condition, and it would not exert noticeable effects on the downstream riverbed formation and stability;
after 50-year operation, the average sedimentation at the dam front is about 3 m deep, averagely up to
the elevation of 197.2 m, which would be 11 m lower than the elevation (208 m) of the sand barrier in
front of the intake, and 13 m lower than the elevation (210 m) of the bottom of the upper approach
channel, the sedimentation at the dam front should not bring about threats to the power plant and ship
lock safety.
With a sediment barrier at the intake upstream, the top elevation of 208 m could prevent bed load from
approach to the power intake, and sedimentation at the intake front would be mainly composed of
suspended load. Considering that the intake bottom level is relatively lower, sand outlets are arranged
underneath, whose inlet bottom elevation would be further lower than that of the intake. Ahead of each
flood period, to prevent gates from being blocked up be sediment, sand outlet gates should be opened
in the flood period for sand flushing. In the dry season, based on sediment monitoring data, sand outlet
gates shall be opened irregularly for flushing sand. Proper operation of the sand outlets to prevent
sediment silting in front of the sand outlets could spare sediment's adverse effects on the power plant's
operation safety.
As analyzed above, after commissioning the reservoir, the sediment content in the outflow water
Sanakham Hydropower Project Reservoir Sedimentation and Backwater
14
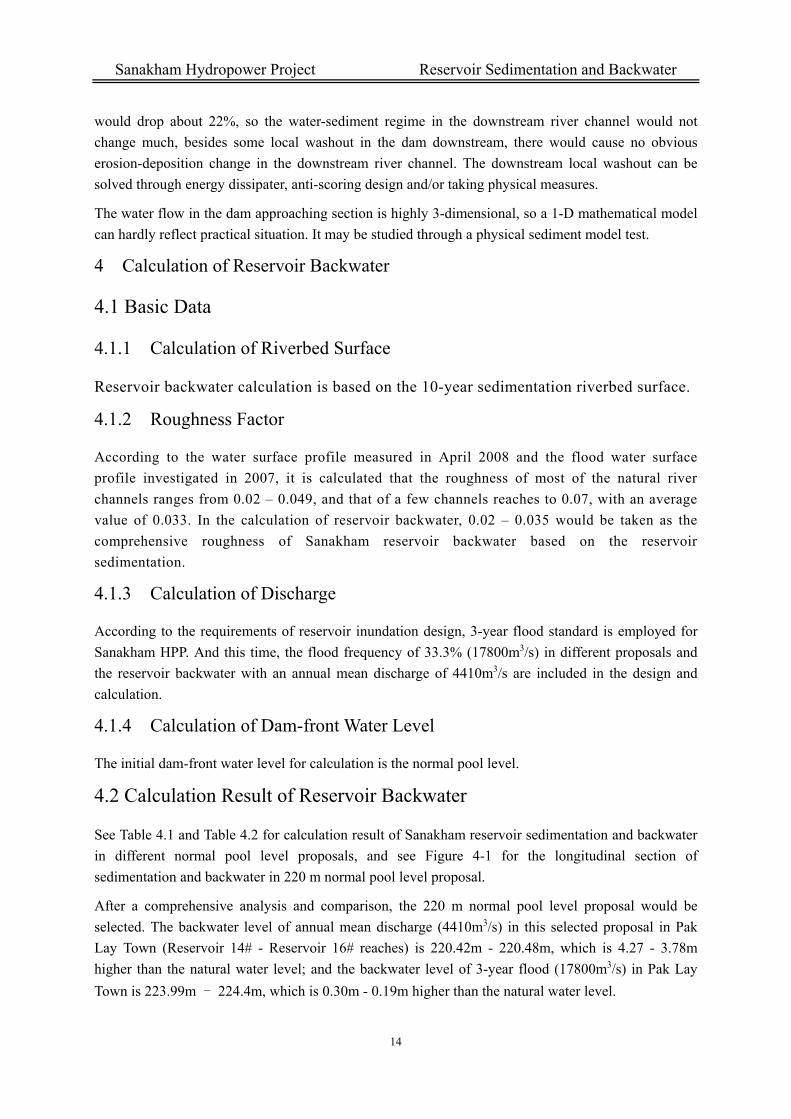
would drop about 22%, so the water-sediment regime in the downstream river channel would not
change much, besides some local washout in the dam downstream, there would cause no obvious
erosion-deposition change in the downstream river channel. The downstream local washout can be
solved through energy dissipater, anti-scoring design and/or taking physical measures.
The water flow in the dam approaching section is highly 3-dimensional, so a 1-D mathematical model
can hardly reflect practical situation. It may be studied through a physical sediment model test.
4 Calculation of Reservoir Backwater
4.1 Basic Data
4.1.1 Calculation of Riverbed Surface
Reservoir backwater calculation is based on the 10-year sedimentation riverbed surface.
4.1.2 Roughness Factor
According to the water surface profile measured in April 2008 and the flood water surface
profile investigated in 2007, it is calculated that the roughness of most of the natural river
channels ranges from 0.02 – 0.049, and that of a few channels reaches to 0.07, with an average
value of 0.033. In the calculation of reservoir backwater, 0.02 – 0.035 would be taken as the
comprehensive roughness of Sanakham reservoir backwater based on the reservoir
sedimentation.
4.1.3 Calculation of Discharge
According to the requirements of reservoir inundation design, 3-year flood standard is employed for
Sanakham HPP. And this time, the flood frequency of 33.3% (17800m3/s) in different proposals and
the reservoir backwater with an annual mean discharge of 4410m3/s are included in the design and
calculation.
4.1.4 Calculation of Dam-front Water Level
The initial dam-front water level for calculation is the normal pool level.
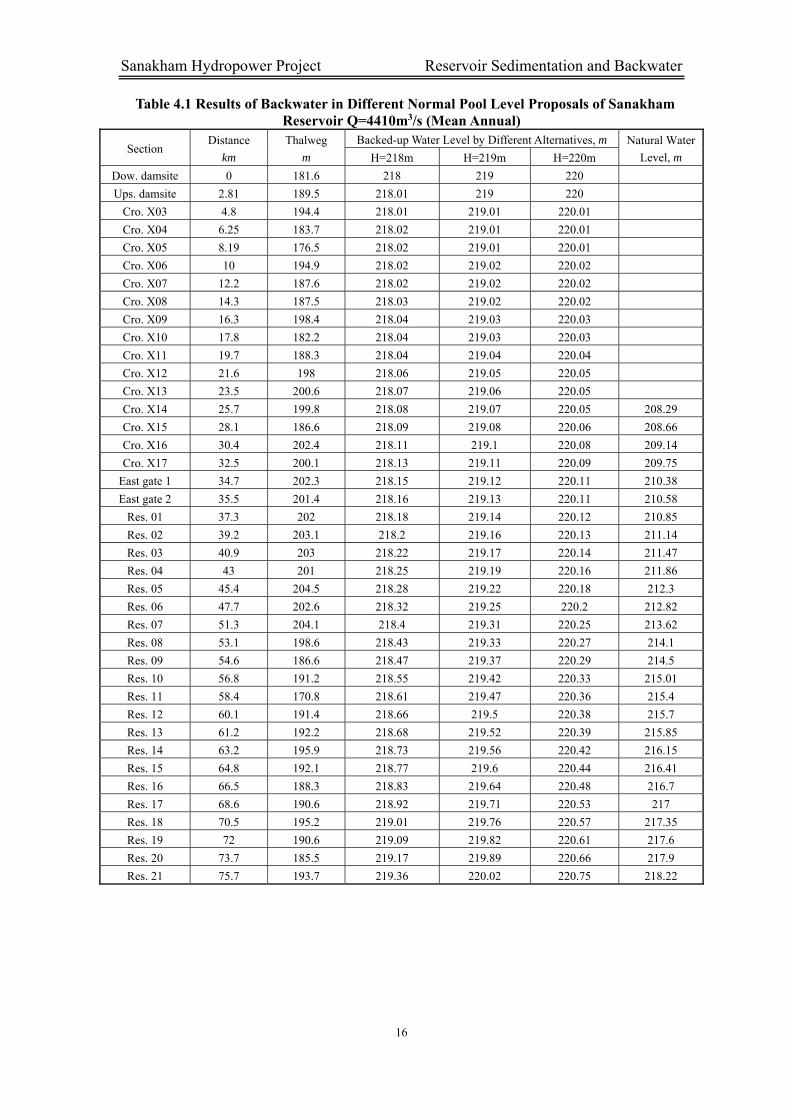
4.2 Calculation Result of Reservoir Backwater
See Table 4.1 and Table 4.2 for calculation result of Sanakham reservoir sedimentation and backwater
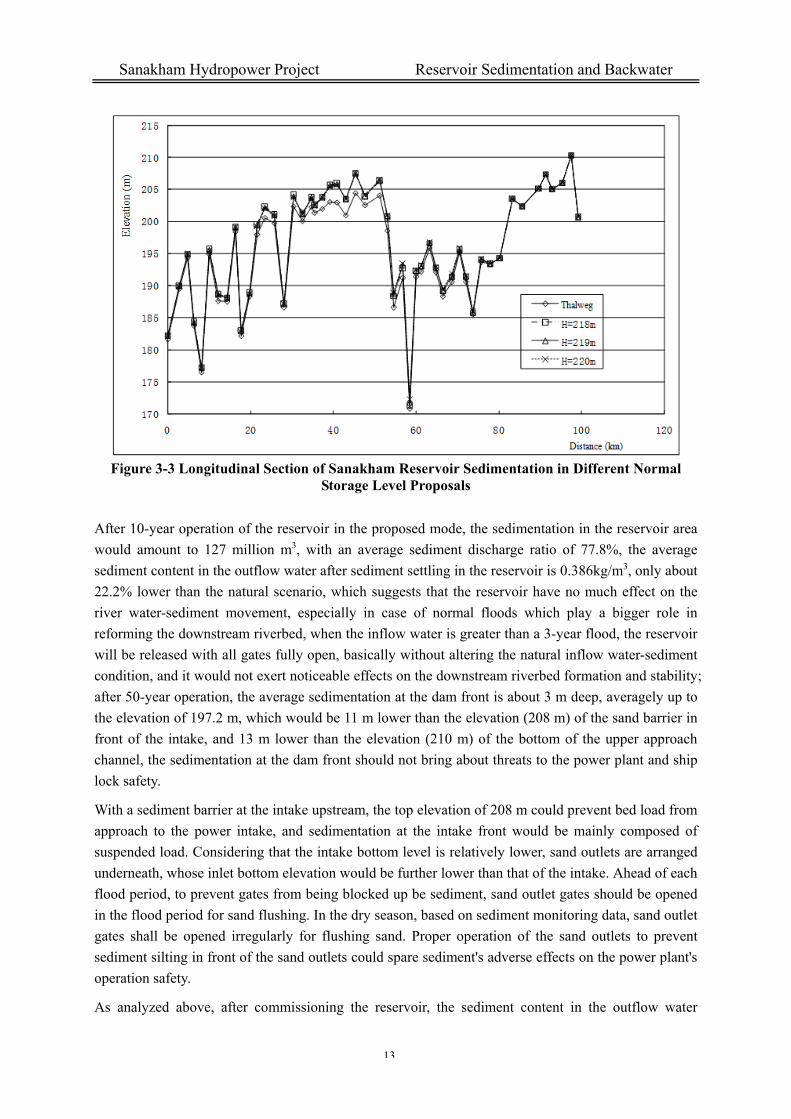
in different normal pool level proposals, and see Figure 4-1 for the longitudinal section of
sedimentation and backwater in 220 m normal pool level proposal.
After a comprehensive analysis and comparison, the 220 m normal pool level proposal would be
selected. The backwater level of annual mean discharge (4410m3/s) in this selected proposal in Pak
Lay Town (Reservoir 14# - Reservoir 16# reaches) is 220.42m - 220.48m, which is 4.27 - 3.78m
higher than the natural water level; and the backwater level of 3-year flood (17800m3/s) in Pak Lay
Town is 223.99m - 224.4m, which is 0.30m - 0.19m higher than the natural water level.
Sanakham Hydropower Project Reservoir Sedimentation and Backwater
15
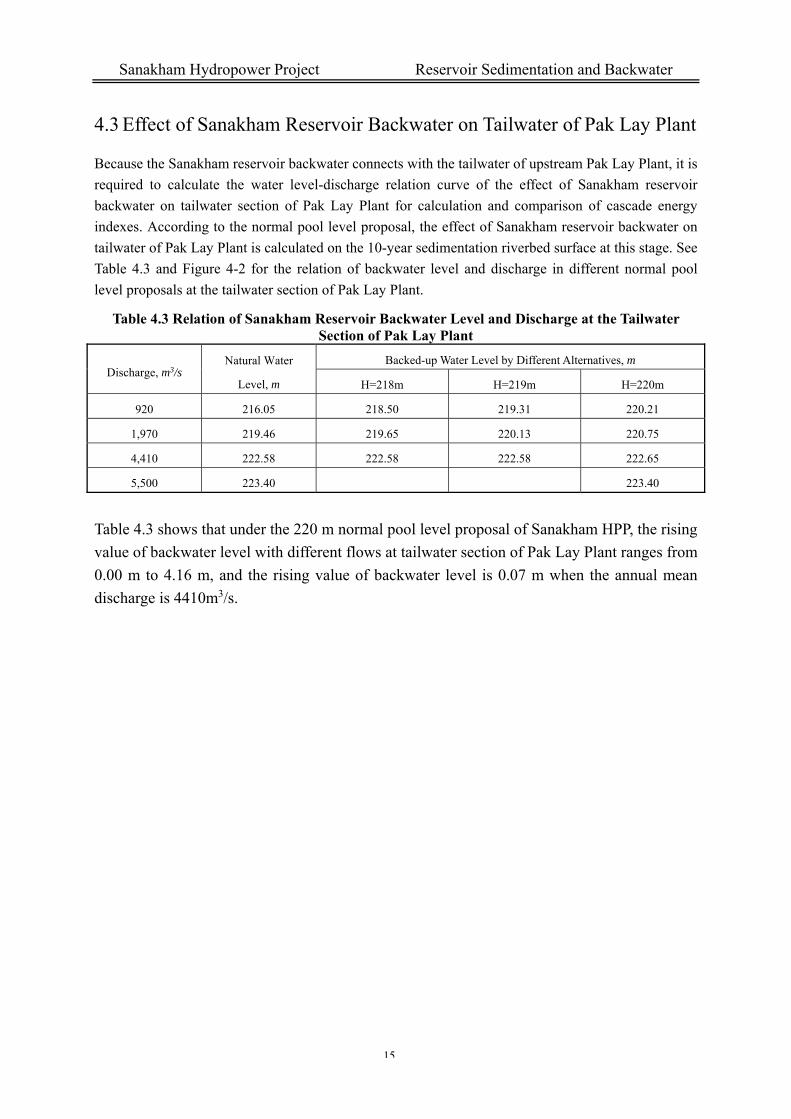
4.3 Effect of Sanakham Reservoir Backwater on Tailwater of Pak Lay Plant
Because the Sanakham reservoir backwater connects with the tailwater of upstream Pak Lay Plant, it is
required to calculate the water level-discharge relation curve of the effect of Sanakham reservoir
backwater on tailwater section of Pak Lay Plant for calculation and comparison of cascade energy
indexes. According to the normal pool level proposal, the effect of Sanakham reservoir backwater on
tailwater of Pak Lay Plant is calculated on the 10-year sedimentation riverbed surface at this stage. See
Table 4.3 and Figure 4-2 for the relation of backwater level and discharge in different normal pool
level proposals at the tailwater section of Pak Lay Plant.
Table 4.3 Relation of Sanakham Reservoir Backwater Level and Discharge at the Tailwater Section of Pak Lay Plant
Discharge, m3/s Natural Water
Level, m
Backed-up Water Level by Different Alternatives, m
H=218m H=219m H=220m
920 216.05 218.50 219.31 220.21
1,970 219.46 219.65 220.13 220.75
4,410 222.58 222.58 222.58 222.65
5,500 223.40 223.40
Table 4.3 shows that under the 220 m normal pool level proposal of Sanakham HPP, the rising
value of backwater level with different flows at tailwater section of Pak Lay Plant ranges from
0.00 m to 4.16 m, and the rising value of backwater level is 0.07 m when the annual mean
discharge is 4410m3/s.
Sanakham Hydropower Project Reservoir Sedimentation and Backwater
16
Table 4.1 Results of Backwater in Different Normal Pool Level Proposals of Sanakham Reservoir Q=4410m3/s (Mean Annual)
Section Distance
km
Thalweg
m
Backed-up Water Level by Different Alternatives, m Natural Water
Level, m H=218m H=219m H=220m
Dow. damsite 0 181.6 218 219 220
Ups. damsite 2.81 189.5 218.01 219 220
Cro. X03 4.8 194.4 218.01 219.01 220.01
Cro. X04 6.25 183.7 218.02 219.01 220.01
Cro. X05 8.19 176.5 218.02 219.01 220.01
Cro. X06 10 194.9 218.02 219.02 220.02
Cro. X07 12.2 187.6 218.02 219.02 220.02
Cro. X08 14.3 187.5 218.03 219.02 220.02
Cro. X09 16.3 198.4 218.04 219.03 220.03
Cro. X10 17.8 182.2 218.04 219.03 220.03
Cro. X11 19.7 188.3 218.04 219.04 220.04
Cro. X12 21.6 198 218.06 219.05 220.05
Cro. X13 23.5 200.6 218.07 219.06 220.05
Cro. X14 25.7 199.8 218.08 219.07 220.05 208.29
Cro. X15 28.1 186.6 218.09 219.08 220.06 208.66
Cro. X16 30.4 202.4 218.11 219.1 220.08 209.14
Cro. X17 32.5 200.1 218.13 219.11 220.09 209.75
East gate 1 34.7 202.3 218.15 219.12 220.11 210.38
East gate 2 35.5 201.4 218.16 219.13 220.11 210.58
Res. 01 37.3 202 218.18 219.14 220.12 210.85
Res. 02 39.2 203.1 218.2 219.16 220.13 211.14
Res. 03 40.9 203 218.22 219.17 220.14 211.47
Res. 04 43 201 218.25 219.19 220.16 211.86
Res. 05 45.4 204.5 218.28 219.22 220.18 212.3
Res. 06 47.7 202.6 218.32 219.25 220.2 212.82
Res. 07 51.3 204.1 218.4 219.31 220.25 213.62
Res. 08 53.1 198.6 218.43 219.33 220.27 214.1
Res. 09 54.6 186.6 218.47 219.37 220.29 214.5
Res. 10 56.8 191.2 218.55 219.42 220.33 215.01
Res. 11 58.4 170.8 218.61 219.47 220.36 215.4
Res. 12 60.1 191.4 218.66 219.5 220.38 215.7
Res. 13 61.2 192.2 218.68 219.52 220.39 215.85
Res. 14 63.2 195.9 218.73 219.56 220.42 216.15
Res. 15 64.8 192.1 218.77 219.6 220.44 216.41
Res. 16 66.5 188.3 218.83 219.64 220.48 216.7
Res. 17 68.6 190.6 218.92 219.71 220.53 217
Res. 18 70.5 195.2 219.01 219.76 220.57 217.35
Res. 19 72 190.6 219.09 219.82 220.61 217.6
Res. 20 73.7 185.5 219.17 219.89 220.66 217.9
Res. 21 75.7 193.7 219.36 220.02 220.75 218.22
Sanakham Hydropower Project Reservoir Sedimentation and Backwater
17
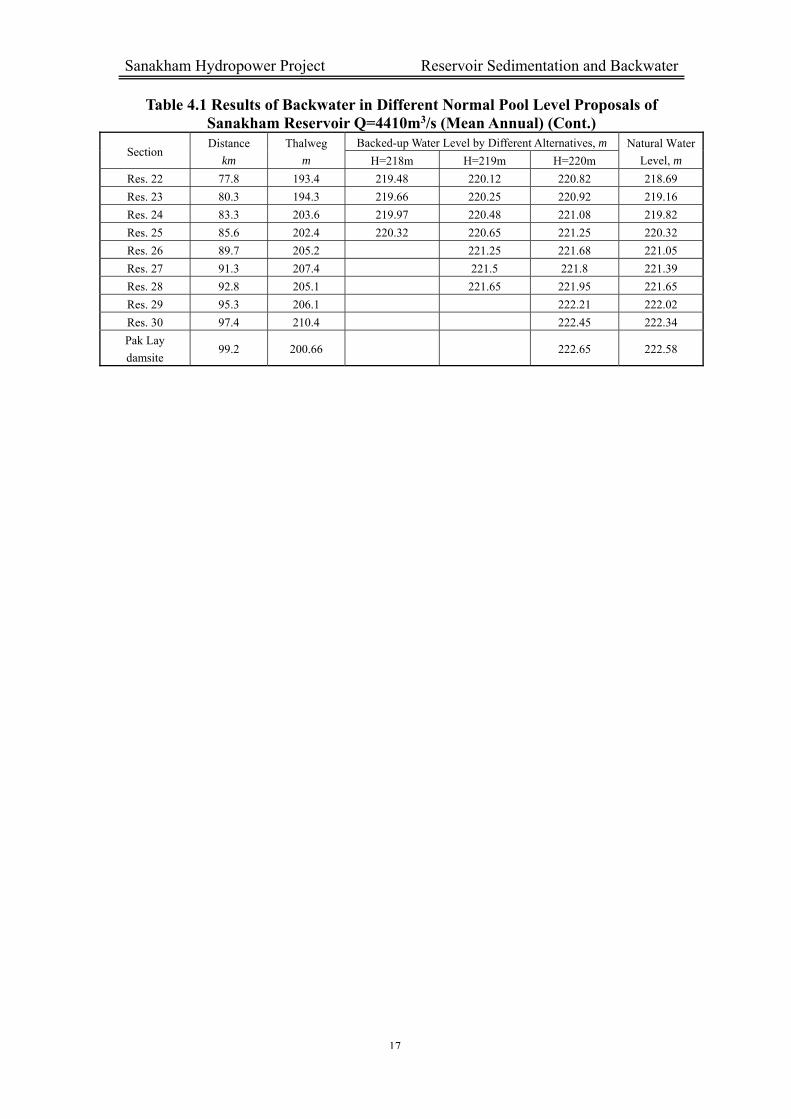
Table 4.1 Results of Backwater in Different Normal Pool Level Proposals of Sanakham Reservoir Q=4410m3/s (Mean Annual) (Cont.)
Section Distance
km
Thalweg
m
Backed-up Water Level by Different Alternatives, m Natural Water
Level, m H=218m H=219m H=220m
Res. 22 77.8 193.4 219.48 220.12 220.82 218.69
Res. 23 80.3 194.3 219.66 220.25 220.92 219.16
Res. 24 83.3 203.6 219.97 220.48 221.08 219.82
Res. 25 85.6 202.4 220.32 220.65 221.25 220.32
Res. 26 89.7 205.2 221.25 221.68 221.05
Res. 27 91.3 207.4 221.5 221.8 221.39
Res. 28 92.8 205.1 221.65 221.95 221.65
Res. 29 95.3 206.1 222.21 222.02
Res. 30 97.4 210.4 222.45 222.34
Pak Lay
damsite 99.2 200.66 222.65 222.58
Sanakham Hydropower Project Reservoir Sedimentation and Backwater
18
Table 4.2 Results of Backwater in Different Normal Pool Level Proposals of Sanakham Reservoir Q=17800m3/s (P=33.3%)
Section Distance
km Thalweg
m
Backed-up Water Level by Different Alternatives, m Natural Water Level,
m H=218m H=219m H=220m
D/S damsite 0 181.6 218 219 220 213.41
U/S damsite 2.81 189.5 218.09 219.08 220.07 213.62
Cro. X03 4.8 194.4 218.16 219.14 220.13 213.71
Cro. X04 6.25 183.7 218.21 219.19 220.17 213.77
Cro. X05 8.19 176.5 218.28 219.24 220.22 213.92
Cro. X06 10 194.9 218.34 219.3 220.27 214.07
Cro. X07 12.2 187.6 218.42 219.37 220.32 214.18
Cro. X08 14.3 187.5 218.47 219.41 220.36 214.32
Cro. X09 16.3 198.4 218.61 219.54 220.47 214.45
Cro. X10 17.8 182.2 218.66 219.58 220.5 214.67
Cro. X11 19.7 188.3 218.71 219.62 220.54 214.97
Cro. X12 21.6 198 218.88 219.78 220.68 215.32
Cro. X13 23.5 200.6 218.98 219.87 220.76 215.67
Cro. X14 25.7 199.8 219.08 219.95 220.83 215.92
Cro. X15 28.1 186.6 219.22 220.09 220.97 216.35
Cro. X16 30.4 202.4 219.49 220.33 221.17 216.93
Cro. X17 32.5 200.1 219.63 220.46 221.29 217.41
East gate 1 34.7 202.3 219.85 220.65 221.46 218.04
East gate 2 35.5 201.4 219.91 220.71 221.51 218.29
Res. 01 37.3 202 220.11 220.87 221.64 218.65
Res. 02 39.2 203.1 220.27 221.01 221.76 218.89
Res. 03 40.9 203 220.41 221.14 221.87 219.26
Res. 04 43 201 220.59 221.29 222.01 219.68
Res. 05 45.4 204.5 220.88 221.48 222.17 220.17
Res. 06 47.7 202.6 221.22 221.79 222.43 220.64
Res. 07 51.3 204.1 221.75 222.27 222.83 221.36
Res. 08 53.1 198.6 222.08 222.5 223.01 221.72
Res. 09 54.6 186.6 222.35 222.68 223.15 222.12
Res. 10 56.8 191.2 222.76 222.99 223.35 222.56
Res. 11 58.4 170.8 223.07 223.24 223.56 222.89
Res. 12 60.1 191.4 223.28 223.44 223.7 223.14
Res. 13 61.2 192.2 223.45 223.6 223.83 223.35
Res. 14 63.2 195.9 223.69 223.85 223.99 223.69
Res. 15 64.8 192.1 224.05 224.18 223.97
Res. 16 66.5 188.3 224.21 224.4 224.21
Res. 17 68.6 190.6 224.65 224.56
Res. 18 70.5 195.2 224.87 224.87
Sanakham Hydropower Project Reservoir Sedimentation and Backwater
19
170
180
190
200
210
220
230
0 10 20 30 40 50 60 70 80 90 100
Elevation(m)
Distance(km)
Thalweg
Sediment profile
Backwater level at mean annual
Natural water level at mean
annual Backwater level at P=33.3%
Natural water level at P=33.3%
Pak Lay Town
Pak Lay Damsite
Figure 4-1 Longitudinal profiles of Sedimentation and Backwater under 220 m Normal Pool Level Proposal of Sanakham Reservoir
Sanakham Hydropower Project Reservoir Sedimentation and Backwater
20
212
216
220
224
228
0 2000 4000 6000 8000 10000 12000
Discharge(m3/s)
Elevation(m)
Natural water level
H=218
H=219
H=220
Figure 4-2 Relation of Backwater Level and Discharge in Different Normal Pool Level Proposals of Sanakham Reservoir at Tailwater Section of Pak Lay Plant