Embed Size (px)
Citation preview

San José Clean Energy
Business Plan
San José Council Study Session:
February 13, 2017
Overview
1. Community Choice Aggregation (CCA) Overview
2. San José Clean Energy (SJCE) Business Plan Review
3. Next Steps
4. Council Feedback
5. Public Comments

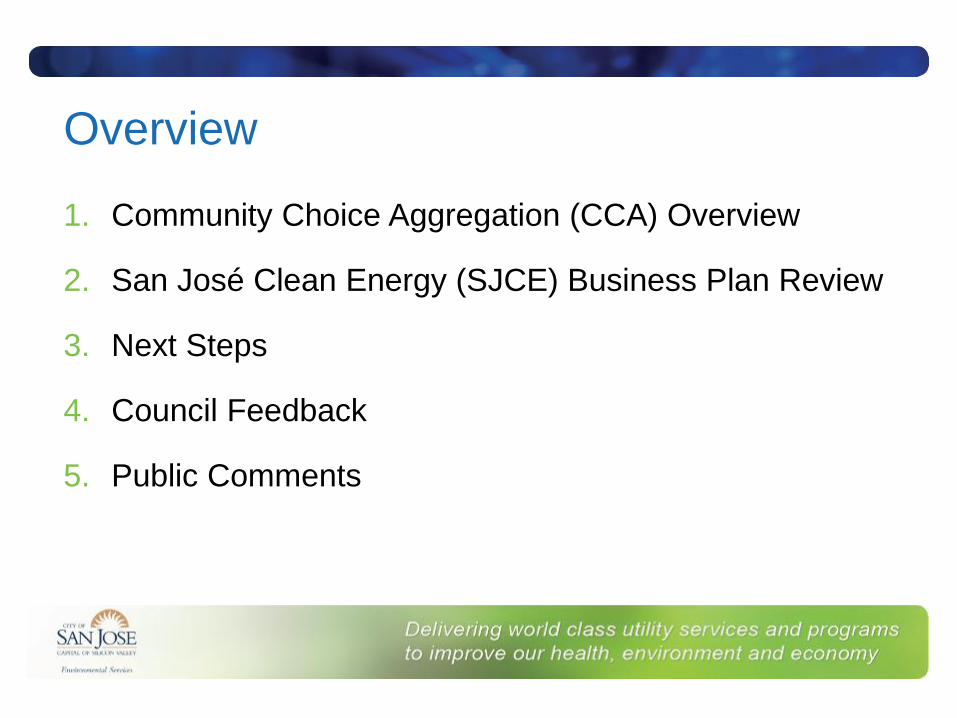
How Community Choice Aggregation Works
CCA: A Hybrid Approach to Utility Operations
IOU Purchases Power CCA Purchases Power POU Purchases Power
IOU Maintains Transmission Lines
IOU Provides Customer Service
IOU Maintains Transmission Lines
IOU Provides Customer Service
POU Provides Customer Service
POU Maintains Transmission Lines
Investor-Owned Utility
(IOU)
CCA Public Owned Utility
(POU)

Why CCA for San José?To meet local, state, and international
greenhouse gas (GHG) reduction
goals:
• Envision San José 2040 General
Plan
• San José Green Vision
(Goals 1, 2, 3)
• California Global Warming
Solutions Act (AB 32, SB 32)
• Paris Climate Change Agreement

Opportunities with a CCA
• Choice of Energy Providers
• GHG Emissions Reductions
• More Renewable Energy
• Local Jobs
• Local Control
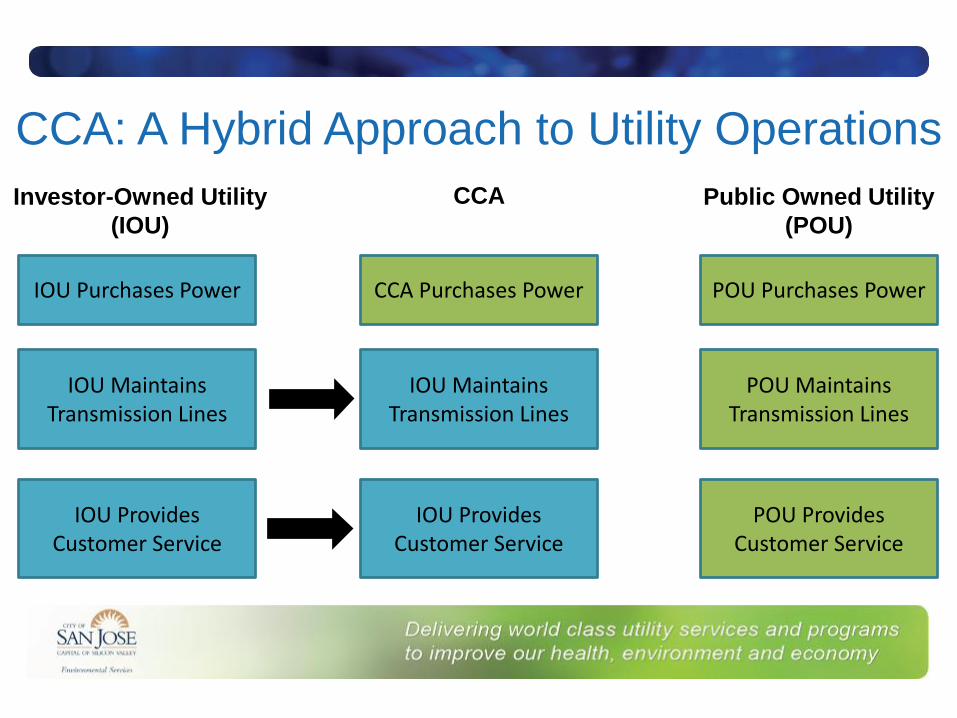
Prior Council Direction and Discussion
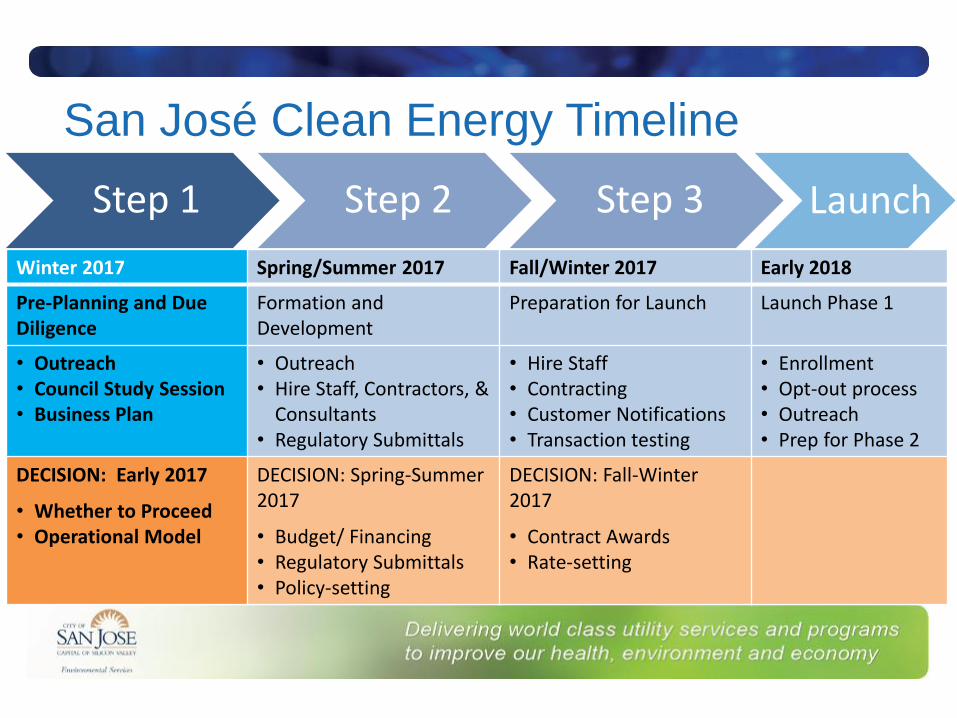
San José Clean Energy Timeline
Step 1 Step 2 Step 3 Launch
Winter 2017 Spring/Summer 2017 Fall/Winter 2017 Early 2018
Pre-Planning and Due Diligence
Formation and Development
Preparation for Launch Launch Phase 1
• Outreach• Council Study Session• Business Plan
• Outreach• Hire Staff, Contractors, &
Consultants• Regulatory Submittals
• Hire Staff• Contracting• Customer Notifications• Transaction testing
• Enrollment• Opt-out process• Outreach• Prep for Phase 2
DECISION: Early 2017
• Whether to Proceed• Operational Model
DECISION: Spring-Summer 2017
• Budget/ Financing• Regulatory Submittals• Policy-setting
DECISION: Fall-Winter 2017
• Contract Awards• Rate-setting
Business Plan Key Assumptions
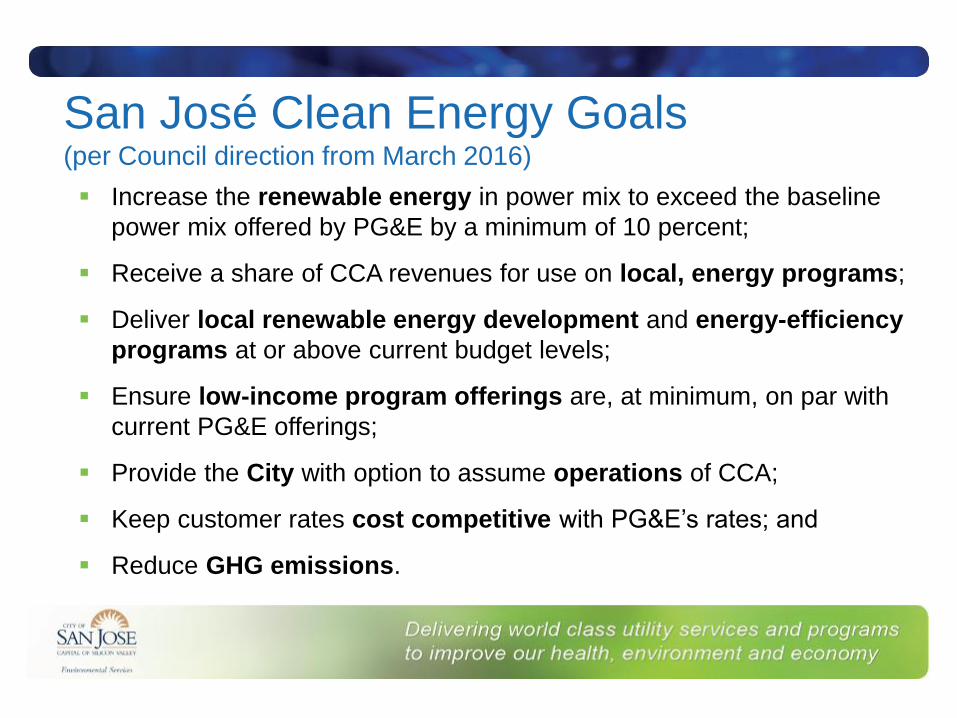
San José Clean Energy Goals(per Council direction from March 2016)
Increase the renewable energy in power mix to exceed the baseline
power mix offered by PG&E by a minimum of 10 percent;
Receive a share of CCA revenues for use on local, energy programs;
Deliver local renewable energy development and energy-efficiency
programs at or above current budget levels;
Ensure low-income program offerings are, at minimum, on par with
current PG&E offerings;
Provide the City with option to assume operations of CCA;
Keep customer rates cost competitive with PG&E’s rates; and
Reduce GHG emissions.
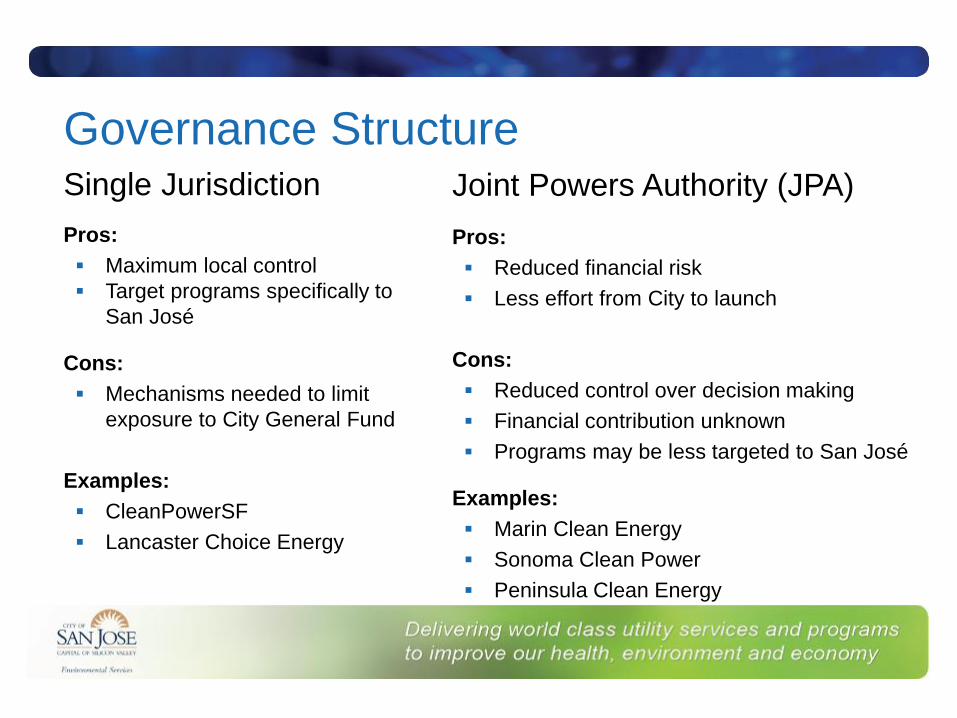
Governance StructureSingle Jurisdiction
Pros:
Maximum local control
Target programs specifically to
San José
Cons:
Mechanisms needed to limit
exposure to City General Fund
Examples:
CleanPowerSF
Lancaster Choice Energy
Pros:
Reduced financial risk
Less effort from City to launch
Cons:
Reduced control over decision making
Financial contribution unknown
Programs may be less targeted to San José
Examples:
Marin Clean Energy
Sonoma Clean Power
Peninsula Clean Energy
Joint Powers Authority (JPA)
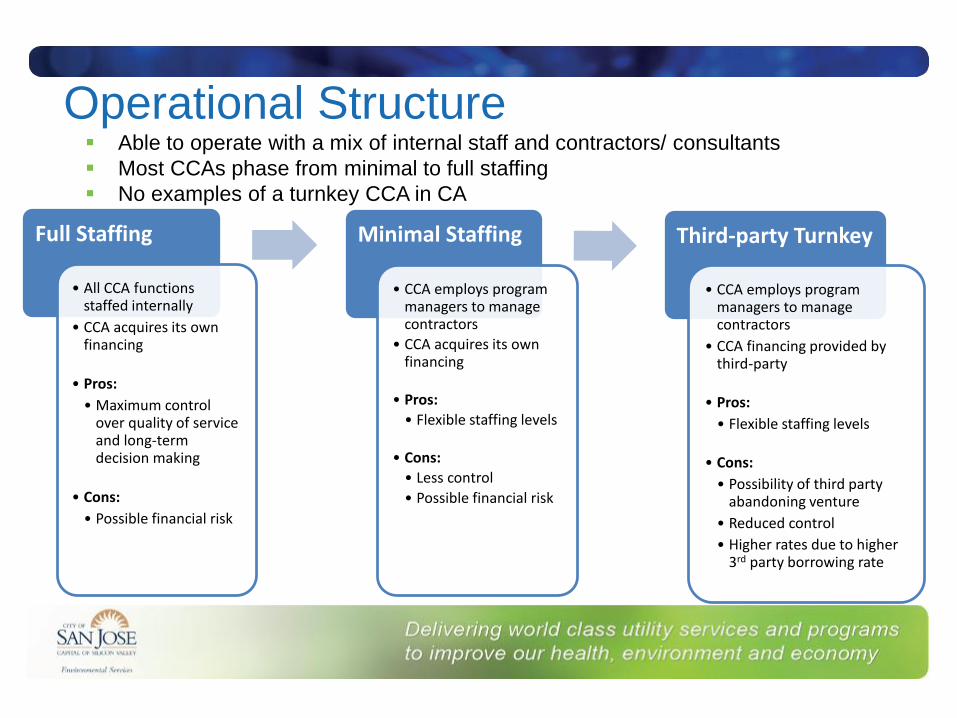
Operational Structure
Full Staffing
• All CCA functions staffed internally
• CCA acquires its own financing
• Pros:
• Maximum control over quality of service and long-term decision making
• Cons:
• Possible financial risk
Minimal Staffing
• CCA employs program managers to manage contractors
• CCA acquires its own financing
• Pros:
• Flexible staffing levels
• Cons:
• Less control
• Possible financial risk
Third-party Turnkey
• CCA employs program managers to manage contractors
• CCA financing provided by third-party
• Pros:
• Flexible staffing levels
• Cons:
• Possibility of third party abandoning venture
• Reduced control
• Higher rates due to higher 3rd party borrowing rate
Able to operate with a mix of internal staff and contractors/ consultants
Most CCAs phase from minimal to full staffing
No examples of a turnkey CCA in CA
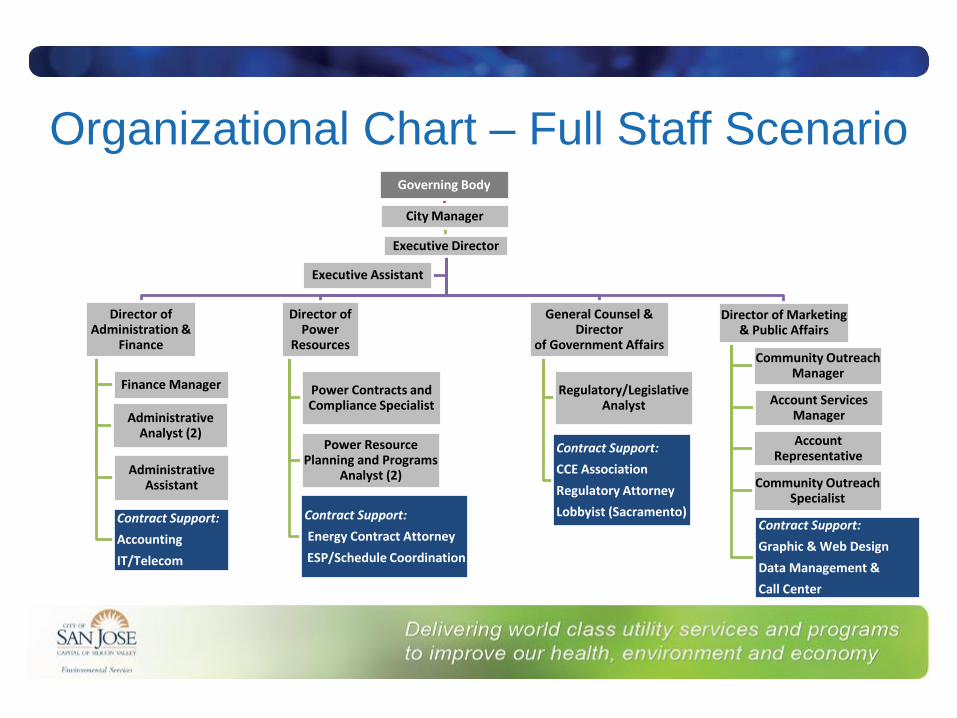
Organizational Chart – Full Staff ScenarioGoverning Body
City Manager
Executive Director
Director of Administration &
Finance
Finance Manager
Administrative Analyst (2)
Administrative Assistant
Contract Support:
Accounting
IT/Telecom
Director of Power
Resources
Power Contracts and Compliance Specialist
Power Resource Planning and Programs
Analyst (2)
Contract Support:
Energy Contract Attorney
ESP/Schedule Coordination
General Counsel & Director
of Government Affairs
Regulatory/Legislative Analyst
Contract Support:
CCE Association
Regulatory Attorney
Lobbyist (Sacramento)
Director of Marketing & Public Affairs
Community Outreach Manager
Account Services Manager
Account Representative
Community Outreach Specialist
Contract Support:
Graphic & Web Design
Data Management &
Call Center
Executive Assistant

Phase-In Schedule and Potential Size
Phase Start Eligibility
Total Accounts
Served
Percentage of Total
Load Served
1Jan. 2018
Municipal Facilities
1600 2%
2June 2018
Municipal, Residential, and
Small Commercial Customers
293,000 50%
3Nov. 2018
All Customers 300,000 100%
At full operation,
SJCE would serve:
300,000 accounts
Total load: 4,000
GWh/year
Peak demand:
1,000 MW
Annual revenues:
$350 million
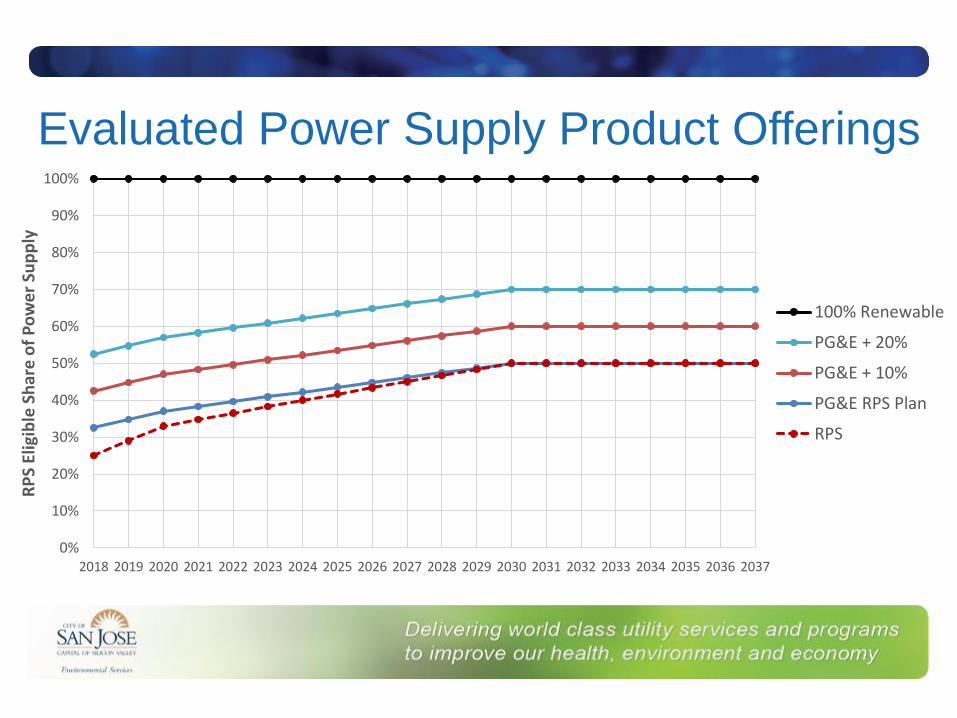
Evaluated Power Supply Product Offerings
0%
10%
20%
30%
40%
50%
60%
70%
80%
90%
100%
2018 2019 2020 2021 2022 2023 2024 2025 2026 2027 2028 2029 2030 2031 2032 2033 2034 2035 2036 2037
RP
S El
igib
le S
har
e o
f P
ow
er
Sup
ply
100% Renewable
PG&E + 20%
PG&E + 10%
PG&E RPS Plan
RPS

Business Plan Findings

Comparison of Projected Rates
Indicative Rate Comparison in $/kWh
Rate Class2017 PG&E
Bundled Rate*SJCE RPS
SJCE 10% more Renewable
SJCE 20% more Renewable
SJCE 100% Renewable
Residential 0.19971 0.1913 0.1921 0.1953 0.2063Small Commercial 0.22515 0.2157 0.2166 0.2202 0.2326Medium Commercial 0.20053 0.1921 0.1929 0.1961 0.2071Large Commercial 0.17618 0.1688 0.1695 0.1723 0.1820Street Lights 0.21785 0.2087 0.2096 0.2131 0.2250Standby 0.14608 0.1399 0.1405 0.1429 0.1509Agriculture 0.17606 0.1687 0.1694 0.1722 0.1819Industrial 0.13985 0.1340 0.1345 0.1368 0.1445Total 0.18779 0.1799 0.1807 0.1837 0.1940
Initial Rate Savings in 2019 from PG&E Bundled Rate 4.2% 3.8% 2.2% -3.4%
Rate Comparison After Fully Operational 4.8 – 9.4% 4.5 – 8.9% 2.7 – 7.2% -2.7 – 1.3%

Financing SJCE
• Pre-launch and Phase 1: $5M
• Phases 2 and 3: $50M
• Ensure General Fund protection
• Financing Options include:
• Direct loan from a City fund
• External funding
– e.g. loan from financial institution, collateral arrangement,
vendor funding

GHG Emissions Reduction
Data taken from San Jose’s 2014 Greenhouse Gas Inventory: https://www.sanjoseca.gov/DocumentCenter/View/55505
*The natural gas category refers to use for heating and cooking in buildings, not for use in electricity generation.
-
1,000,000
2,000,000
3,000,000
4,000,000
5,000,000
6,000,000
7,000,000
8,000,000
PG&E SJCE 10%<GHG SJCE 20%<GHG
San
Jo
séG
HG
Em
issi
on
s -
20
14
(MT
CO
2e
)
Water
Waste
Wastewater
Natural Gas*
Electricity
Transport
-14% -28%

Economic Development Benefits
Total Electricity Savings CCA vs. PG&E
• A 3.8% rate reduction saves customers over $20M per year
• Create 100 new jobs in the San José Metropolitan Area
• Add $31M annually to the City’s economy
SJCE Programs
• SJCE programs could create additional jobs and add value to the
economy
• Programs could include:
• Business incentive programs for manufacturing and target businesses
• Solar programs
• Construction of local solar projects
Risks and Mitigation Strategies
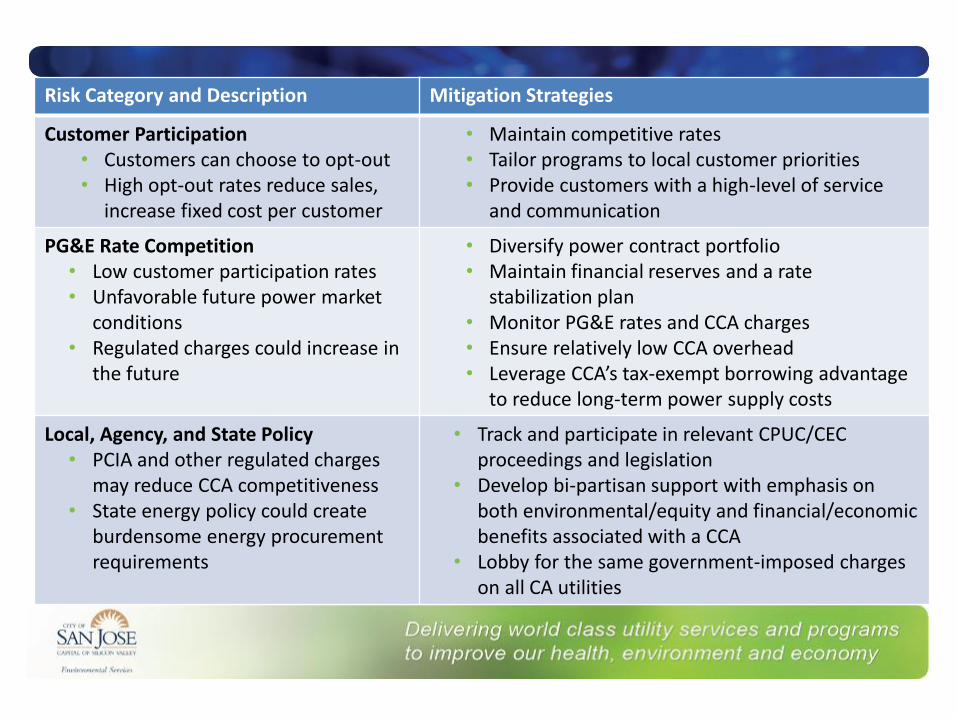
Risk Category and Description Mitigation Strategies
Customer Participation• Customers can choose to opt-out• High opt-out rates reduce sales,
increase fixed cost per customer
• Maintain competitive rates• Tailor programs to local customer priorities• Provide customers with a high-level of service
and communication
PG&E Rate Competition• Low customer participation rates• Unfavorable future power market
conditions• Regulated charges could increase in
the future
• Diversify power contract portfolio• Maintain financial reserves and a rate
stabilization plan• Monitor PG&E rates and CCA charges• Ensure relatively low CCA overhead• Leverage CCA’s tax-exempt borrowing advantage
to reduce long-term power supply costs
Local, Agency, and State Policy• PCIA and other regulated charges
may reduce CCA competitiveness• State energy policy could create
burdensome energy procurement requirements
• Track and participate in relevant CPUC/CEC proceedings and legislation
• Develop bi-partisan support with emphasis on both environmental/equity and financial/economic benefits associated with a CCA
• Lobby for the same government-imposed charges on all CA utilities

Sensitivity Analysis
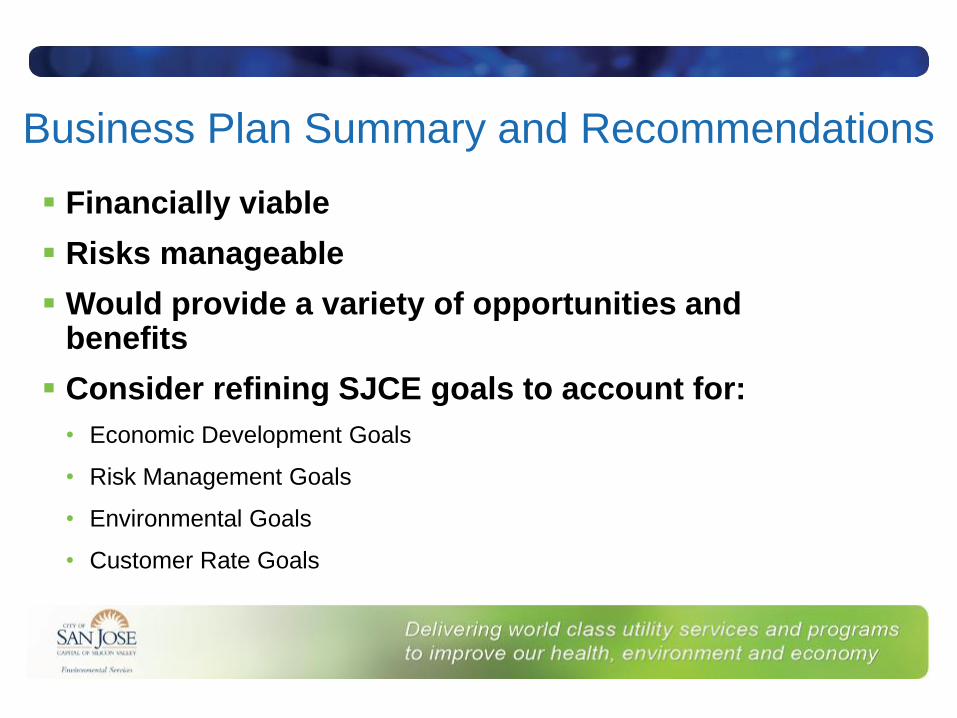
Business Plan Summary and Recommendations
Financially viable
Risks manageable
Would provide a variety of opportunities and benefits
Consider refining SJCE goals to account for:
• Economic Development Goals
• Risk Management Goals
• Environmental Goals
• Customer Rate Goals

Next Steps

Options for San Jose
Proceed with next steps for SJCE
Explore joining an existing JPA
Defer establishing SJCE
Take no action
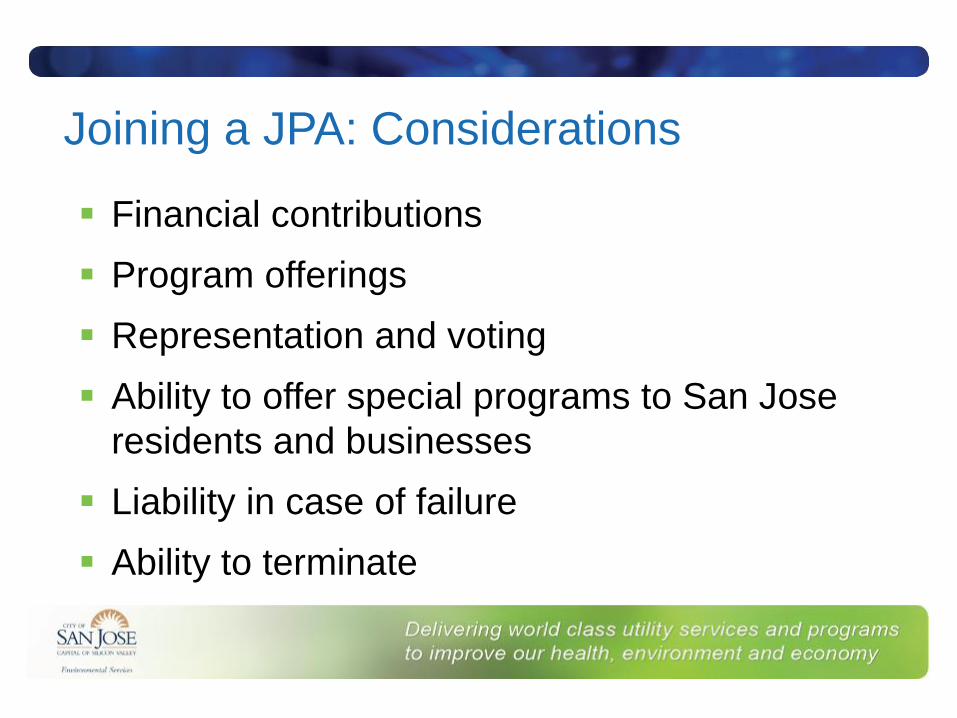
Joining a JPA: Considerations
Financial contributions
Program offerings
Representation and voting
Ability to offer special programs to San Jose
residents and businesses
Liability in case of failure
Ability to terminate

San José Clean Energy Timeline
Step 1 Step 2 Step 3 Launch
Winter 2017 Spring/Summer 2017 Fall/Winter 2017 Early 2018
Pre-Planning and Due Diligence
Formation and Development
Preparation for Launch Launch Phase 1
• Outreach• Council Study Session• Business Plan
• Outreach• Hire Staff, Contractors, &
Consultants• Regulatory Submittals
• Hire Staff• Contracting• Customer Notifications• Transaction testing
• Enrollment• Opt-out process• Outreach• Prep for Phase 2
DECISION: Early 2017
• Whether to Proceed• Operational Model
DECISION: Spring-Summer 2017
• Budget/ Financing• Regulatory Submittals• Policy-setting
DECISION: Fall-Winter 2017
• Contract Awards• Rate-setting
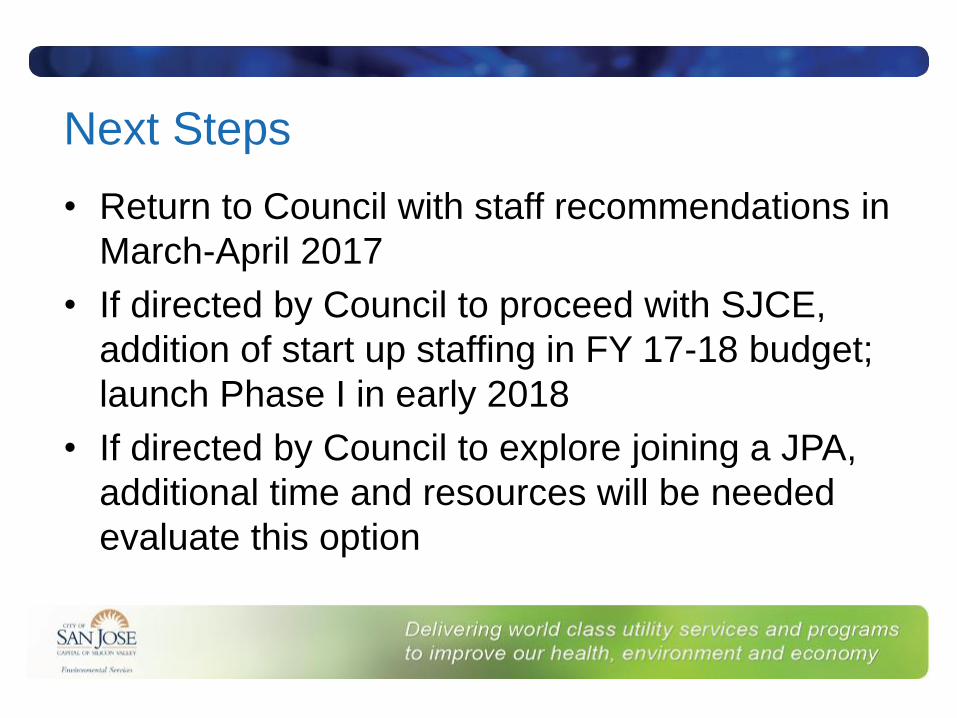
Next Steps
• Return to Council with staff recommendations in
March-April 2017
• If directed by Council to proceed with SJCE,
addition of start up staffing in FY 17-18 budget;
launch Phase I in early 2018
• If directed by Council to explore joining a JPA,
additional time and resources will be needed
evaluate this option

Council Discussion