Embed Size (px)
Citation preview
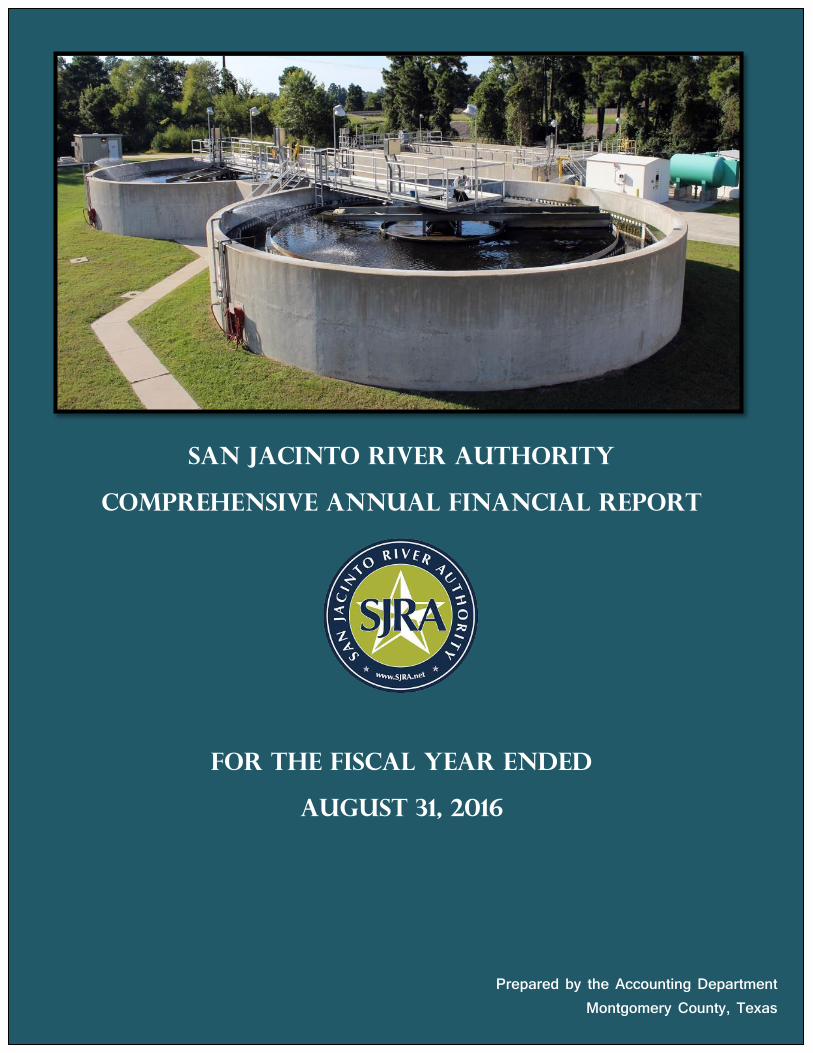
San Jacinto River Authority
Comprehensive Annual Financial Report
For the Fiscal Year Ended
August 31, 2016
Prepared by the Accounting Department Montgomery County, Texas

San Jacinto River Authority
1577 Dam Site Road Conroe, Texas 77304
TABLE OF CONTENTS San Jacinto River Authority Comprehensive Annual Financial Report for Fiscal Year Ended August 31, 2016 Page Introductory Section Letter of Transmittal i-vi Certificate of Achievement for Excellence in Financial Reporting vii Organizational Chart viii Board of Directors ix Financial Section Independent Auditors’ Report 3-4 Management Discussion and Analysis 5-12 Basic Financial Statements
Statement of Net Position 14-17 Statement of Revenues, Expenses and Changes In Net Position 18-19 Statement of Cash Flows 20-23 Notes to Financial Statements 25-58
Required Supplementary Information Governmental Accounting Standards Board Statement Nos. 67 & 68, Defined Benefit Pension Plan, Schedule of Changes in Net Pension Liability and Related Ratios
60-61 Governmental Accounting Standards Board Statement Nos. 67 & 68, Defined Benefit Pension Plan, Schedule of Employer Contributions
62 Governmental Accounting Standards Board Statement Nos. 67 & 68, Defined Benefit Pension Plan, Schedule of Investment Returns
63 Schedule of Employer Contributions and Funding Progress for the Retiree Healthcare (OPEB) Plan
64
Other Supplementary Information Schedule of Revenues and Expenses – Budget and Actual –Raw Water Enterprise
66
Schedule of Revenues and Expenses – Budget and Actual (Budgetary Basis) – Woodlands Division
67
Schedule of Revenues and Expenses – Budget and Actual –Groundwater Reduction Plan Division Schedule of Net Position–Groundwater Reduction Plan Schedule of Revenues and Expenses – Groundwater Reduction Plan Division Schedule of Cash Flows-Groundwater Reduction Plan Division
68 69
70 71
Schedule of Capital Assets-Lake Conroe Dam, Reservoir and Related Equipment
72
Insurance Coverage 73 Principal Officials 74
Statistical Section Index and Explanation 75 Net Position by Component 76-77 Changes in Net Position 78-79 Woodlands Division Water and Sewer Service Fees by Source 80 Principal Woodlands Division Water and Sewer Fee Payers 81 List of Principal Customers 82 Ratio of Outstanding Debt by Type 83 Pledge – Revenue Coverage 84-85 District Demographics 86-87 Number of Employees by Division 88-89 Operating Statistics 90-91 Schedule of Capital Asset Additions 92-93
INTRODUCTORY SECTION

(This Page Intentionally Left Blank)
ii
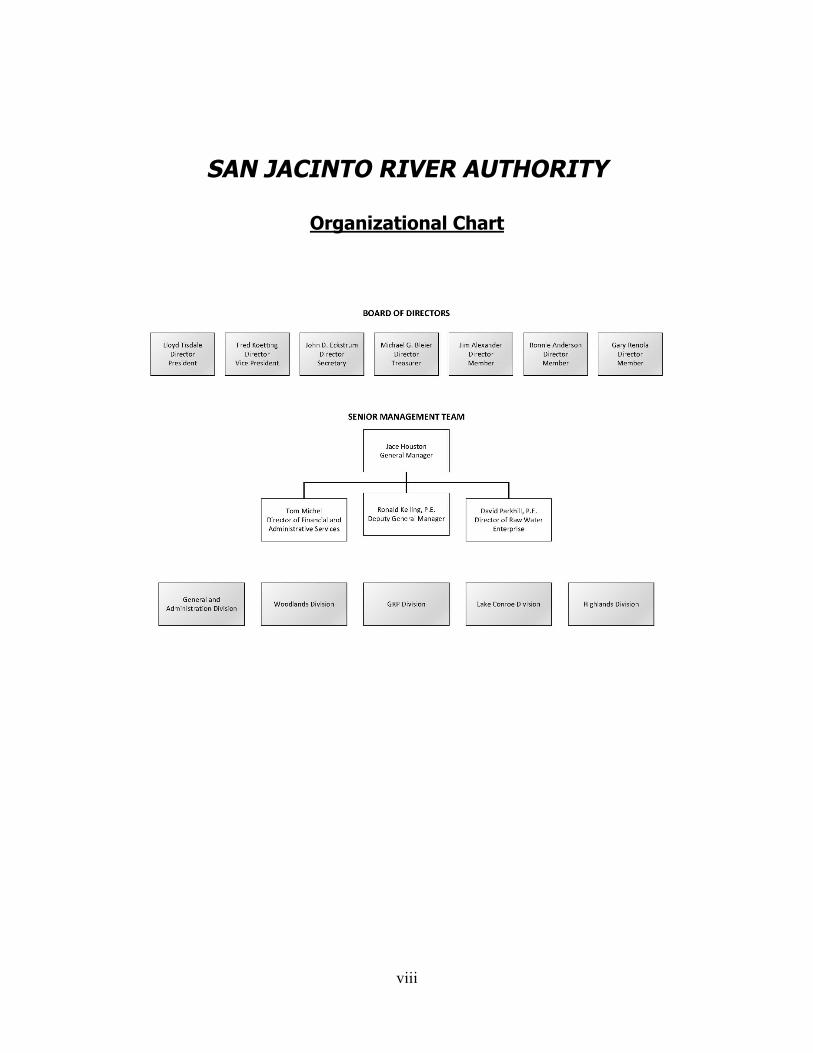
The SJRA is governed by a board of seven directors appointed to six-year staggered terms by the Governor of the State of Texas. The SJRA has statutory power and responsibility for developing, conserving, and protecting the water resources of the San Jacinto River watershed. The SJRA provides a variety of services including water and wastewater treatment; municipal, industrial and agricultural raw water supply; water quality management and reservoir operations. These operations are accounted for in the division descriptions below.
The General & Administration Division, located in the general business office at Lake Conroe, consists of professional, technical, accounting, administrative, and support staff working under the direction of the General Manager. The General & Administration Division’s primary function is to provide management and support services to the SJRA’s four operating divisions (listed below).
The Highlands Division is located in East Harris County and operates a pump station at Lake Houston: Raw water from Lake Houston is diverted into the SJRA’s extensive 27-mile system of canals and a 1,400 acre reservoir for delivery to industrial, municipal, and agricultural customers. The Highlands Division operates a pump station to transfer raw water from the Trinity River via the Coastal Water Authority to the Highland Division’s East Canal. The Highlands System also includes a pump station to transfer raw water from the Trinity River via the Coastal Water Authority (CWA) to the Highlands Division’s South Canal.
The Lake Conroe Division is situated seven miles west of Interstate 45 at the Lake Conroe dam. The SJRA supplies raw water from Lake Conroe, which was built as a water supply reservoir and completed in 1973. The lake is exclusively operated by the SJRA; however, the City of Houston owns two-thirds of the permitted water rights in the reservoir and participates in two-thirds of the Lake Conroe costs. In addition to operating and maintaining the dam, this Division handles the licensing, regulation, and enforcement functions related to onsite sewage facilities immediately around Lake Conroe, boat sanitation, piers, boat slips, boathouses, marinas, and other facilities operated or constructed around or on Lake Conroe. The Lake Conroe Division collects fees associated with these permits and licenses.
The Woodlands Division is located in southern Montgomery County andprovides wholesale water supply and wastewater treatment services to the 112,505 person community of The Woodlands (The Woodlands Development Corporation data as of January 2016). To provide these services, the SJRA operates wastewater treatment plants, lift stations, water wells, water plants, water booster pump stations, elevated and ground storage tanks, and miles of wastewater conveyance and water transmission facilities. The Woodlands Division purchases surface water from the Groundwater Reduction Plan (GRP) Division to blend with groundwater provided by the water wells.
The Groundwater Reduction Plan (GRP) Division, with its office located at the Lake Conroe dam, is responsible for implementing an alternative water supply program
iii
for its participants that meets the groundwater reduction requirements of the Lone Star Groundwater Conservation District (LSGCD) and ensure reliable, long-term water supplies for its participants in Montgomery County. The GRP Division designed, constructed, operates, maintains, and administers a surface water treatment plant and transmission lines. The GRP Division withdraws raw surface water from Lake Conroe, treats it to meet or exceed drinking water standards, and then transmit it to selected customer cities and water utilities within Montgomery County.
ECONOMIC CONDITION AND OUTLOOK
The Texas Economy. According to the Texas Comptroller of Public Accounts Key Economic Indicators as of October 2016: Unemployment Rate for Texas was 4.7% while the U.S. was 4.9%; Measures of Inflation CPI change from previous year for Texas was 1.9% while the U.S. was 1.6%; and Consumer Confidence Index for Texas was 14.9% while the U.S. was 15.7%. The Comptroller issued the “Regional Snapshot: Gulf Coast Region” showing population growth to be 26% in the Region vs. 20% for Texas and 9% for the U.S. for 2004-2014. Also in the Regional Snapshot was Per Capita Personal Income Growth to be 49% for the Region vs. 47% for Texas and 34% for the U.S. for 2004-2014.
The Local Economy. The SJRA’s boundaries include the entire watershed of the San Jacinto River and its tributaries excluding Harris County. The SJRA serves many customers in the greater Houston area and is authorized to operate in Harris County east of the San Jacinto River. The SJRA does not receive money from the state, nor does it collect any type of taxes. Continued population growth within SJRA’s service area will necessitate the demand for water. With the SJRA’s service area located between Houston and Dallas, two rapidly growing major metropolitan areas, the need for future water supplies and reliable planning is vital, and as a result, the SJRA’s Board of Directors and staff are working diligently to plan for future water supplies in order to better assure the region’s future economic vitality.
FINANCIAL INFORMATION
Management of the SJRA is responsible for establishing and maintaining an internal control structure designed to ensure that the assets of the SJRA are protected from loss, theft, or misuse and to ensure that adequate accounting data is compiled to allow the preparation of financial statements in conformity with accounting principles generally accepted in the United States of America. The internal control structure is designed to provide reasonable assurance, but not absolute assurance, that these objectives are met. The concept of reasonable assurance recognizes that: (1) the cost of a control should not exceed the benefits likely to be derived; and (2) the valuation of costs and benefits requires estimates and judgments by management.
iv
As demonstrated by the statements and schedules included in the financial section of this report as well as the Management Discussion and Analysis (MD&A) also included herein, the SJRA continues to meet its responsibility for sound financial management. The SJRA encourages readers to closely review each section of this report including the review provided by the MD&A in order to have a thorough understanding of the SJRA, its activities, financial position, and results of operations.
MAJOR INITIATIVES
For the Year. One of the SJRA’s major initiatives for Fiscal Year 2016 included planning for adequate, long-term water resources for the San Jacinto River Basin, including Montgomery County, along with the planning necessary for the development of additional future supplies of water. This initiative was evident in the work of SJRA staff with committees related to instream surface water flows, fresh water inflows for bays and estuaries, review of water quality standards, regional water planning, and watershed protections plans.
A major initiative in Fiscal Year 2016 was the continued implementation of critical facility rehabilitation to the SJRA’s raw water delivery system in the Highlands as primarily financed by low interest bonds from the Texas Water Development Board. This multi-year project includes removal and replacement of numerous siphons, construction of a new East Canal pumping station, canal improvements, rehabilitation of the existing Lake Houston Pump Station and installation of additional flow measuring equipment. This program will increase the capabilities and reliability of the delivery system. In addition to critical facility rehabilitation, the SJRA completed a comprehensive hydraulic and facilities assessment of the Highlands system to determine hydraulic capacities and identify additional repair and improvement needs.
During Fiscal Year 2016, the new Groundwater Reduction Plan (GRP) facilitiesstarted delivery of surface water through over 50 miles of transmission lines, surface water receiving facilities, and a standpipe to GRP’s selected customers. Another major initiative was the continued financing and construction activities for the GRP program. SJRA had completed the financing for the GRP Phase 1 by the end of Fiscal Year 2016.
For the Future. In November 2009, the LSGCD adopted final regulations that required certain groundwater users to prepare and submit a Groundwater Reduction Plan by April 1, 2010, outlining how large volume groundwater users intended to meet a January 2016 deadline for the reduction of groundwater use and conversion to alternative water supplies. The SJRA met this regulatory requirement with the development of a long-term approach that will provide a compliance solution for participants within the county who choose to join. The SJRA plan was designed so that any large volume groundwater user in the county could join the SJRA’s Joint Groundwater Reduction Plan (GRP) by executing a GRP Contract and paying the required GRP Pumpage Fee and GRP Surface Water Fees monthly. For fiscal year 2016, the GRP Pumpage Fee was set at $2.32 per thousand gallons of groundwater pumped by the participating entity and is
v
billed monthly. The GRP Surface Water Fee was set at $2.51 per thousand gallons of surface water received by the participating entity. It is anticipated that these fees will increase in the future if costs are incurred for planning and implementation of future phases as needed and operation, maintenance and repair of the necessary infrastructure to continue to deliver surface water and contributions to reserves. SJRA Board approved the Fiscal Year 2016 rates based on the most recent rate studies suggesting that the GRP Pumpage Fee would be $2.32 per thousand gallons for groundwater users and $2.51 per thousand gallons for surface water users for fiscal year 2016. The total cost of the entire surface water system that was constructed to meet the 2016 deadline was $490 million. As of the end of the 2016 fiscal year, 150 participants have joined the SJRA GRP represent approximately 80 percent of the water use in Montgomery County. The GRP Division was responsible for implementing the surface water program. The GRP was responsible for constructing, operating, and maintaining the necessary infrastructure that started delivering surface water in mid-September 2015, ahead of the January 1, 2016 deadline.
The Woodlands’ aging Wastewater System is in need of rehabilitation. The Municipal Utility Districts (MUD) agreed to an estimated $40 million bond sale to be sold in 2017 to address major rehabilitation needs in addition to continued annual rehabilitation of the system.
The Highlands Division initiatives will include rehabilitation and raising of canal segments and will include rehabilitation of the South Canal Pump Station along with the SCADA system.
Acknowledgements
Independent Audit. Section 49.191 of the Texas Water Code requires an annual audit of the SJRA’s accounting records by a certified public accountant or public accountant holding a permit from the Texas State Board of Public Accountancy and selected by the Board of Directors. The firm Knox Cox & Co., LLP was selected to conduct the FY2016 financial audit. We appreciate their professionalism, timeliness, and assistance in completing this report. Copies of this report will be filed with the TCEQ, State Comptroller, State Auditor, and Texas Water Development Board.
Awards. The Government Finance Officers Association of the United States and Canada (GFOA) awarded the Certificate of Achievement for Excellence in Financial Reporting to the SJRA for its Comprehensive Annual Financial Report (CAFR) for the fiscal year ended August 31, 2015. This was the seventh consecutive year that the SJRA has achieved this prestigious award. The Certificate of Achievement is the highest form of recognition in the area of governmental accounting and financial reporting, and its attainment represents a significant accomplishment by a government entity and its management.
In order to be awarded a Certificate of Achievement, a government entity must publish an easily readable and efficiently organized CAFR, whose contents conform to
vii
SAN JACINTO RIVER AUTHORITYCertificate of Achievement for Excellence in Financial
Reporting
viii
SAN JACINTO RIVER AUTHORITY
Organizational Chart
ix
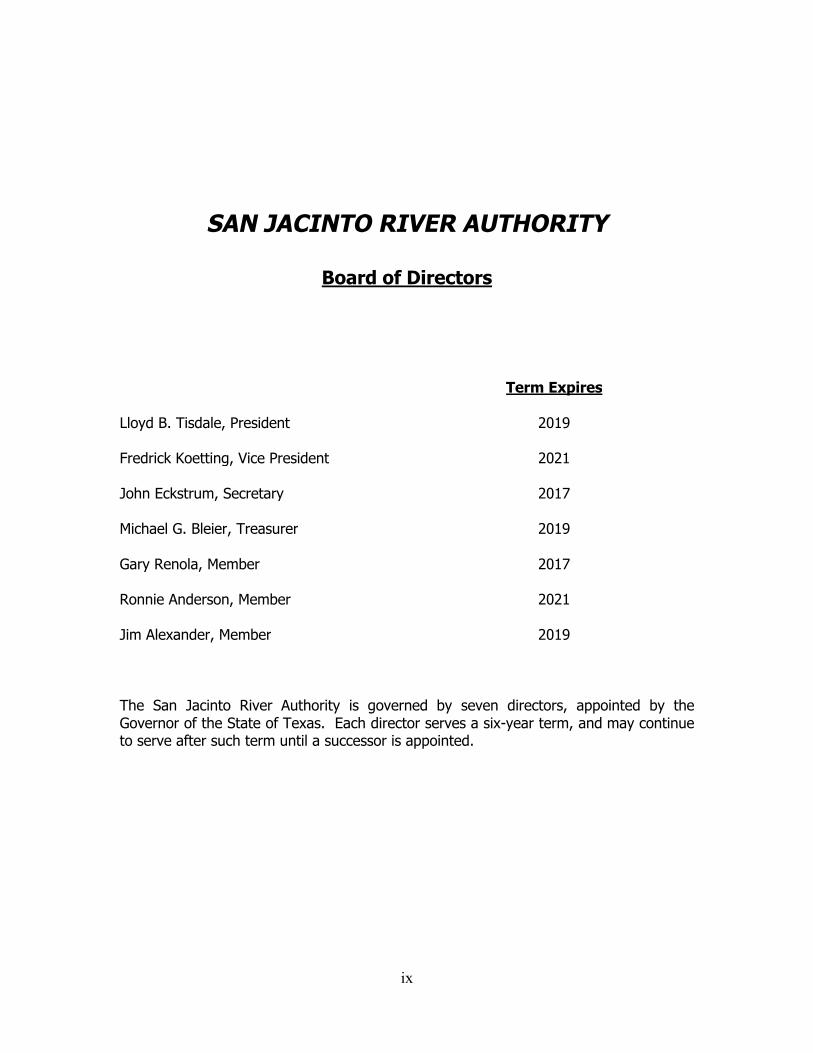
SAN JACINTO RIVER AUTHORITY
Board of Directors
Term Expires
Lloyd B. Tisdale, President 2019
Fredrick Koetting, Vice President 2021
John Eckstrum, Secretary 2017
Michael G. Bleier, Treasurer 2019
Gary Renola, Member 2017
Ronnie Anderson, Member 2021
Jim Alexander, Member 2019
The San Jacinto River Authority is governed by seven directors, appointed by the Governor of the State of Texas. Each director serves a six-year term, and may continue to serve after such term until a successor is appointed.

x
(This Page Intentionally Left Blank)

1
FINANCIAL SECTION

2
(This Page Intentionally Left Blank)
3
Independent Auditors’ Report Board of Directors San Jacinto River Authority Montgomery County, Texas We have audited the accompanying financial statements of the business-type activities and each major fund of the San Jacinto River Authority, as of and for the year ended August 31, 2016, and the related notes to the financial statements, which collectively comprise the San Jacinto River Authority’s basic financial statements as listed in the table of contents. Management’s Responsibility for the Financial Statements Management is responsible for the preparation and fair presentation of these financial statements in accordance with accounting principles generally accepted in the United States of America; this includes the design, implementation and maintenance of internal control relevant to the preparation and fair presentation of financial statements that are free from material misstatement, whether due to fraud or error. Auditors’ Responsibility Our responsibility is to express opinions on these financial statements based on our audit. We conducted our audit in accordance with auditing standards generally accepted in the United States of America. Those standards require that we plan and perform the audit to obtain reasonable assurance about whether the financial statements are free from material misstatement. An audit involves performing procedures to obtain audit evidence about the amounts and disclosures in the financial statements. The procedures selected depend on the auditors’ judgment, including the assessment of the risks of material misstatement of the financial statements, whether due to fraud or error. In making those risk assessments, the auditor considers internal control relevant to the entity’s preparation and fair presentation of the financial statements in order to design audit procedures that are appropriate in the circumstances, but not for the purpose of expressing an opinion on the effectiveness of the entity’s internal control. Accordingly, we express no such opinion. An audit also includes evaluating the appropriateness of accounting policies used and the reasonableness of significant accounting estimates made by management, as well as evaluating the overall presentation of the financial statements. We believe that the audit evidence we have obtained is sufficient and appropriate to provide a basis for our audit opinions.
4
Opinions In our opinion, the financial statements referred to above present fairly, in all material respects, the respective financial position of the business-type activities and each major fund of the San Jacinto River Authority, as of August 31, 2016, and the respective changes in financial position and cash flows thereof for the year ended in accordance with accounting principles generally accepted in the United States of America. Other Matters Required Supplementary Information Accounting principles generally accepted in the United States of America require that the management’s discussion and analysis and required supplementary information on pages 5-12 and 60-64 be presented to supplement the basic financial statements. Such information, although not a part of the basic financial statements, is required by the Governmental Accounting Standards Board, who considers it to be an essential part of the financial reporting for placing the basic financial statements in an appropriate operational, economic or historical context. We have applied certain limited procedures to the required supplementary information in accordance with auditing standards generally accepted in the United States of America, which consisted of inquiries of management about the methods of preparing the information and comparing the information for consistency with management’s responses to our inquiries, the basic financial statements and other knowledge we obtained during our audit of the basic financial statements. We do not express an opinion or provide any assurance on the information because the limited procedures do not provide us with sufficient evidence to express an opinion or provide any assurance. Other Information Our audit was conducted for the purpose of forming opinions on the financial statements that collectively comprise the San Jacinto River Authority’s basic financial statements. The introductory section, other supplementary information and statistical section are presented for purposes of additional analysis and are not a required part of the basic financial statements. The other supplementary information is the responsibility of management and were derived from and relate directly to the underlying accounting and other records used to prepare the basic financial statements. Such information has been subjected to the auditing procedures applied in the audit of the basic financial statements and certain additional procedures, including comparing and reconciling such information directly to the underlying accounting and other records used to prepare the basic financial statements themselves, and other additional procedures in accordance with auditing standards generally accepted in the United States of America. In our opinion, the other supplementary information is fairly stated, in all material respects, in relation to the basic financial statements as a whole. The introductory and statistical sections have not been subjected to the auditing procedures applied in the audit of the basic financial statements and, accordingly, we do not express an opinion or provide any assurance on them.
Sugar Land, Texas December 16, 2016
SAN JACINTO RIVER AUTHORITY
MANAGEMENT DISCUSSION AND ANALYSIS
5
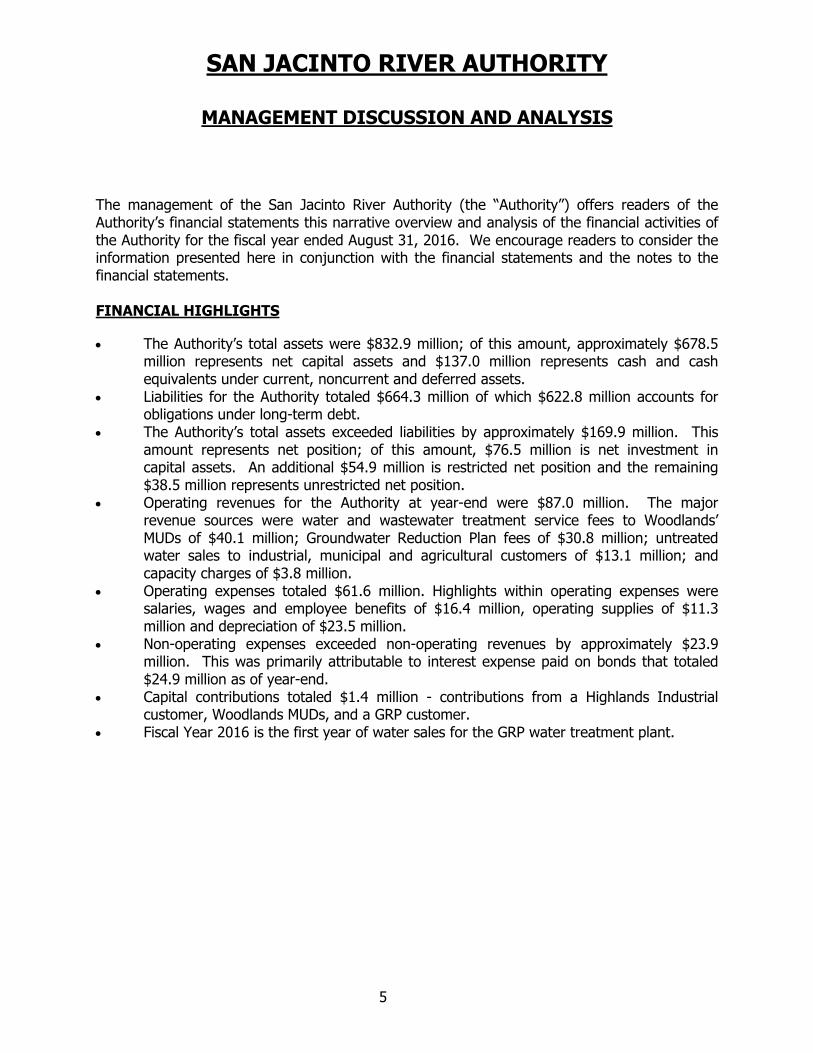
The management of the San Jacinto River Authority (the “Authority”) offers readers of the Authority’s financial statements this narrative overview and analysis of the financial activities of the Authority for the fiscal year ended August 31, 2016. We encourage readers to consider the information presented here in conjunction with the financial statements and the notes to the financial statements.
FINANCIAL HIGHLIGHTS
The Authority’s total assets were $832.9 million; of this amount, approximately $678.5million represents net capital assets and $137.0 million represents cash and cash equivalents under current, noncurrent and deferred assets.
Liabilities for the Authority totaled $664.3 million of which $622.8 million accounts for obligations under long-term debt.
The Authority’s total assets exceeded liabilities by approximately $169.9 million. This amount represents net position; of this amount, $76.5 million is net investment in capital assets. An additional $54.9 million is restricted net position and the remaining $38.5 million represents unrestricted net position.
Operating revenues for the Authority at year-end were $87.0 million. The major revenue sources were water and wastewater treatment service fees to Woodlands’ MUDs of $40.1 million; Groundwater Reduction Plan fees of $30.8 million; untreated water sales to industrial, municipal and agricultural customers of $13.1 million; and capacity charges of $3.8 million.
Operating expenses totaled $61.6 million. Highlights within operating expenses were salaries, wages and employee benefits of $16.4 million, operating supplies of $11.3million and depreciation of $23.5 million.
Non-operating expenses exceeded non-operating revenues by approximately $23.9million. This was primarily attributable to interest expense paid on bonds that totaled $24.9 million as of year-end.
Capital contributions totaled $1.4 million - contributions from a Highlands Industrial customer, Woodlands MUDs, and a GRP customer.
Fiscal Year 2016 is the first year of water sales for the GRP water treatment plant.
6
OVERVIEW OF THE FINANCIAL STATEMENTS
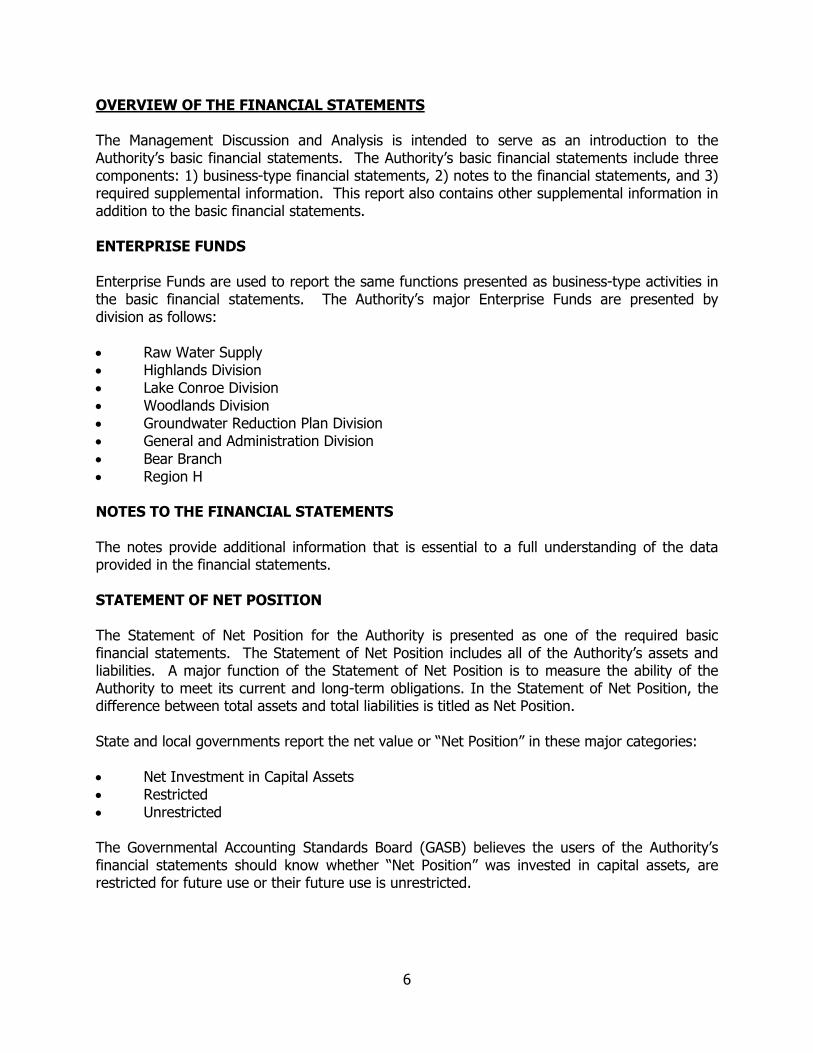
The Management Discussion and Analysis is intended to serve as an introduction to the Authority’s basic financial statements. The Authority’s basic financial statements include three components: 1) business-type financial statements, 2) notes to the financial statements, and 3) required supplemental information. This report also contains other supplemental information in addition to the basic financial statements.
ENTERPRISE FUNDS
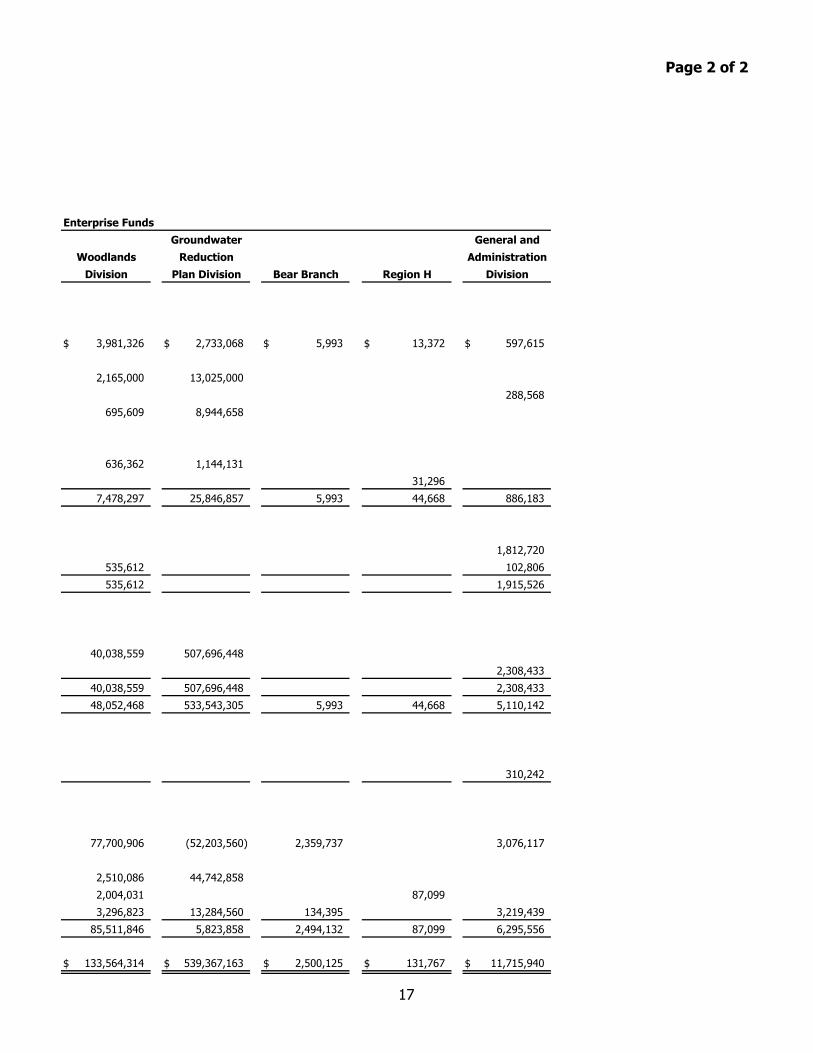
Enterprise Funds are used to report the same functions presented as business-type activities in the basic financial statements. The Authority’s major Enterprise Funds are presented by division as follows:
Raw Water Supply Highlands Division Lake Conroe Division Woodlands Division Groundwater Reduction Plan Division General and Administration Division Bear Branch Region H
NOTES TO THE FINANCIAL STATEMENTS
The notes provide additional information that is essential to a full understanding of the data provided in the financial statements.
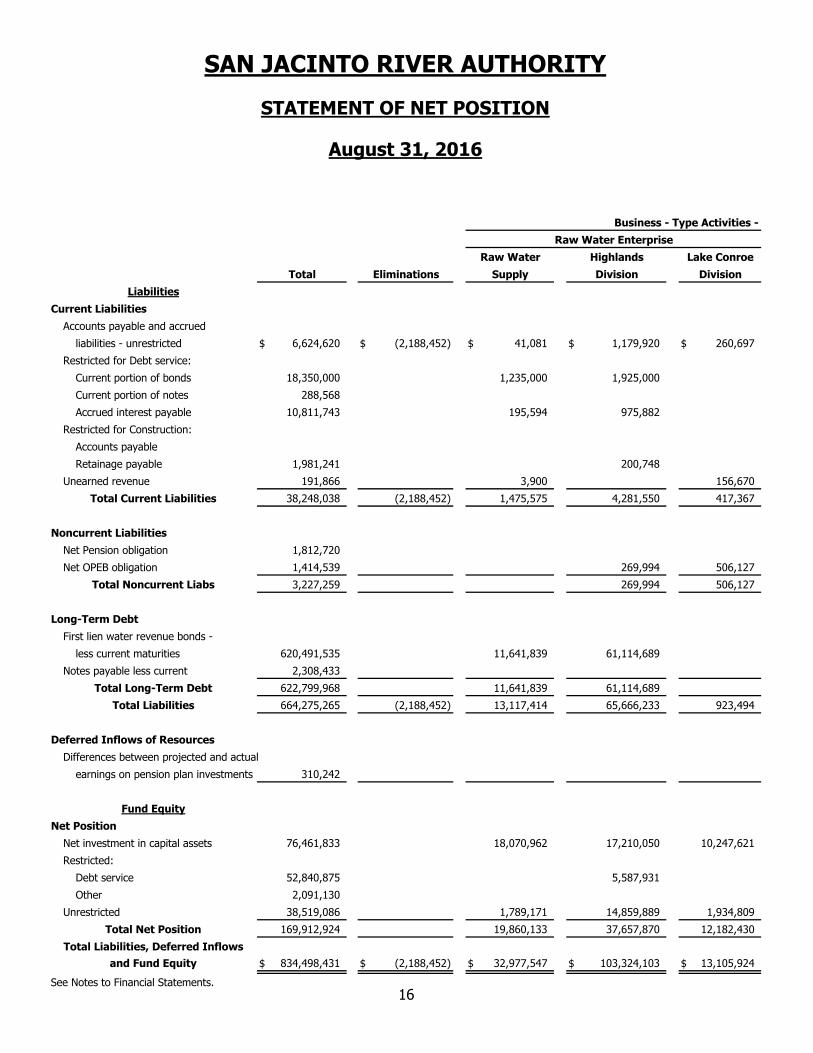
STATEMENT OF NET POSITION
The Statement of Net Position for the Authority is presented as one of the required basic financial statements. The Statement of Net Position includes all of the Authority’s assets and liabilities. A major function of the Statement of Net Position is to measure the ability of the Authority to meet its current and long-term obligations. In the Statement of Net Position, the difference between total assets and total liabilities is titled as Net Position.
State and local governments report the net value or “Net Position” in these major categories:
Net Investment in Capital Assets Restricted Unrestricted
The Governmental Accounting Standards Board (GASB) believes the users of the Authority’s financial statements should know whether “Net Position” was invested in capital assets, are restricted for future use or their future use is unrestricted.
7
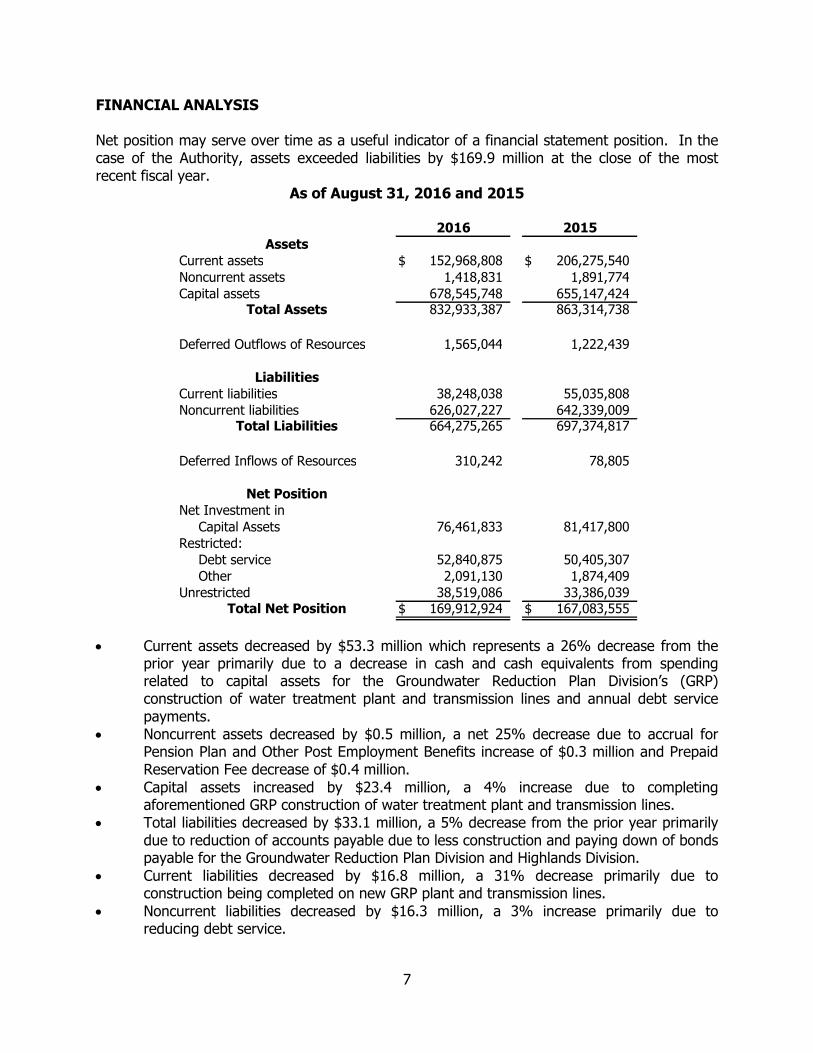
FINANCIAL ANALYSIS
Net position may serve over time as a useful indicator of a financial statement position. In the case of the Authority, assets exceeded liabilities by $169.9 million at the close of the most recent fiscal year.
As of August 31, 2016 and 2015
Current assets $ 152,968,808 $ 206,275,540
Noncurrent assets 1,418,831 1,891,774Capital assets 678,545,748 655,147,424
832,933,387 863,314,738
Deferred Outflows of Resources 1,565,044 1,222,439
Current liabilities 38,248,038 55,035,808Noncurrent liabilities 626,027,227 642,339,009
664,275,265 697,374,817
Deferred Inflows of Resources 310,242 78,805
Net Investment in
Capital Assets 76,461,833 81,417,800Restricted:
Debt service 52,840,875 50,405,307Other 2,091,130 1,874,409
Unrestricted 38,519,086 33,386,039$ 169,912,924 $ 167,083,555
Net Position
Total Net Position
Total Assets
Total Liabilities
Assets
Liabilities
2016 2015
Current assets decreased by $53.3 million which represents a 26% decrease from the prior year primarily due to a decrease in cash and cash equivalents from spending related to capital assets for the Groundwater Reduction Plan Division’s (GRP) construction of water treatment plant and transmission lines and annual debt service payments.
Noncurrent assets decreased by $0.5 million, a net 25% decrease due to accrual for Pension Plan and Other Post Employment Benefits increase of $0.3 million and Prepaid Reservation Fee decrease of $0.4 million.
Capital assets increased by $23.4 million, a 4% increase due to completing aforementioned GRP construction of water treatment plant and transmission lines.
Total liabilities decreased by $33.1 million, a 5% decrease from the prior year primarily due to reduction of accounts payable due to less construction and paying down of bonds payable for the Groundwater Reduction Plan Division and Highlands Division.
Current liabilities decreased by $16.8 million, a 31% decrease primarily due to construction being completed on new GRP plant and transmission lines.
Noncurrent liabilities decreased by $16.3 million, a 3% increase primarily due to reducing debt service.
8
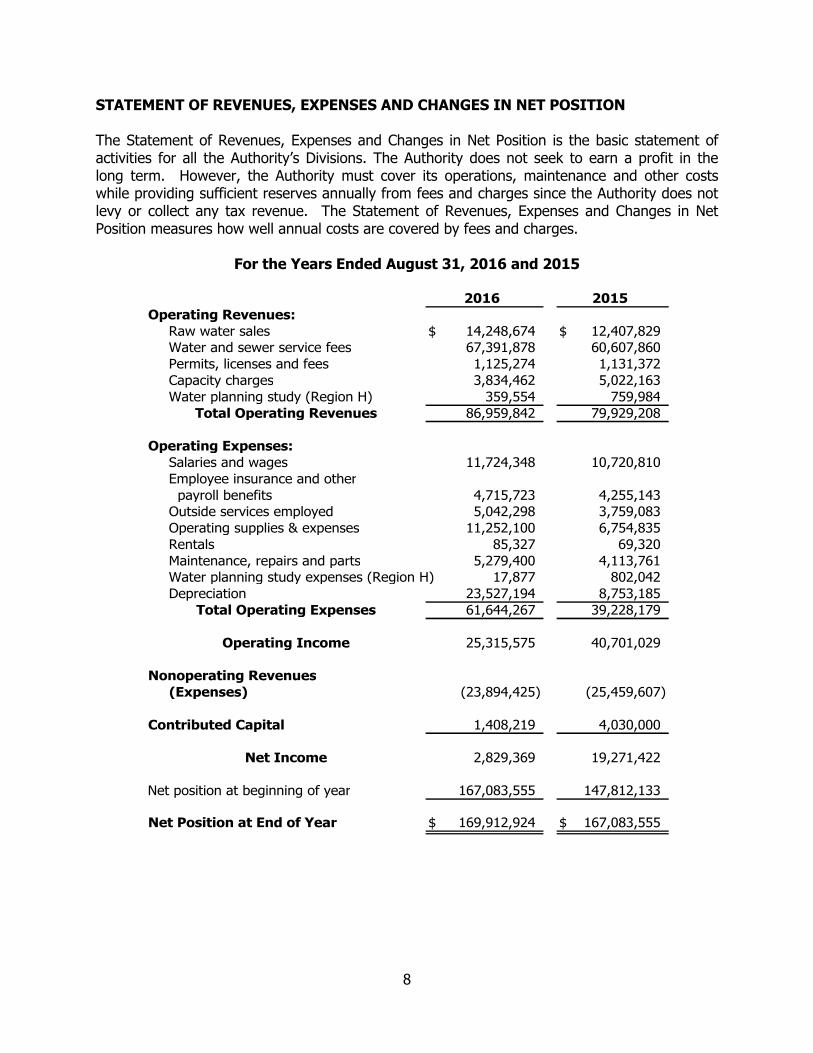
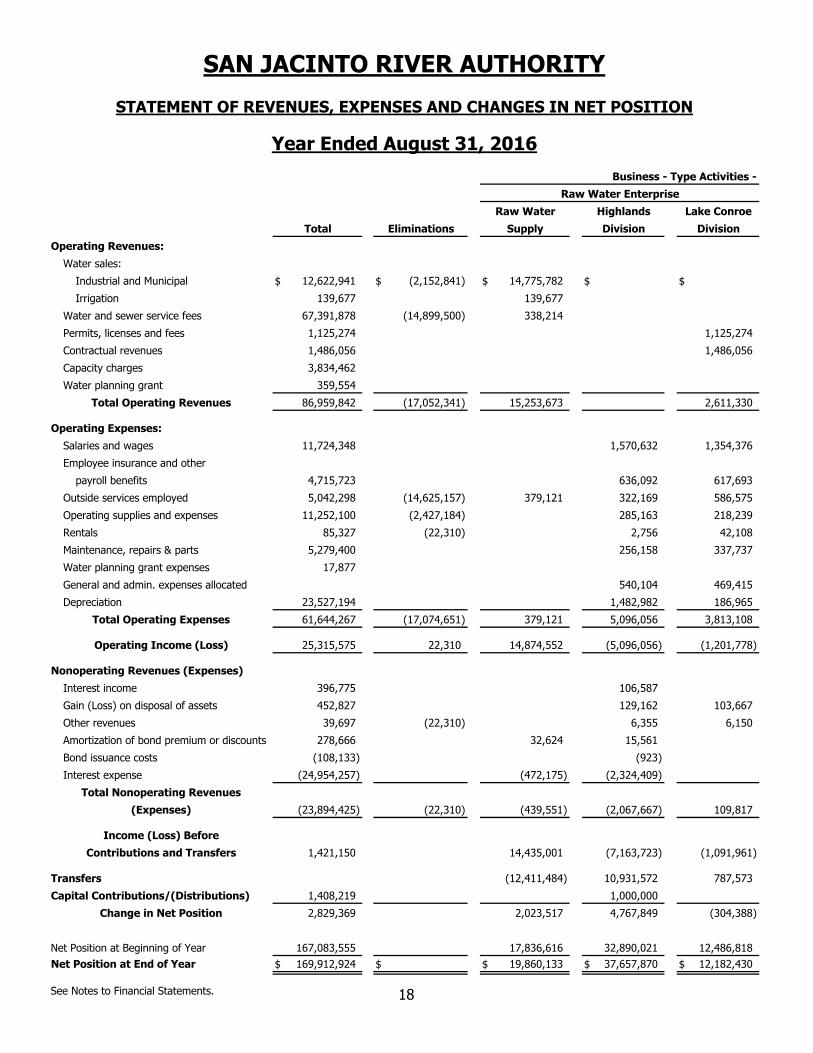
STATEMENT OF REVENUES, EXPENSES AND CHANGES IN NET POSITION
The Statement of Revenues, Expenses and Changes in Net Position is the basic statement of activities for all the Authority’s Divisions. The Authority does not seek to earn a profit in the long term. However, the Authority must cover its operations, maintenance and other costswhile providing sufficient reserves annually from fees and charges since the Authority does not levy or collect any tax revenue. The Statement of Revenues, Expenses and Changes in Net Position measures how well annual costs are covered by fees and charges.
For the Years Ended August 31, 2016 and 2015
Operating Revenues:Raw water sales $ 14,248,674 $ 12,407,829Water and sewer service fees 67,391,878 60,607,860Permits, licenses and fees 1,125,274 1,131,372Capacity charges 3,834,462 5,022,163Water planning study (Region H) 359,554 759,984
86,959,842 79,929,208
Operating Expenses:Salaries and wages 11,724,348 10,720,810Employee insurance and other payroll benefits 4,715,723 4,255,143Outside services employed 5,042,298 3,759,083Operating supplies & expenses 11,252,100 6,754,835Rentals 85,327 69,320Maintenance, repairs and parts 5,279,400 4,113,761Water planning study expenses (Region H) 17,877 802,042Depreciation 23,527,194 8,753,185
61,644,267 39,228,179
25,315,575 40,701,029
Nonoperating Revenues(Expenses) (23,894,425) (25,459,607)
Contributed Capital 1,408,219 4,030,000
2,829,369 19,271,422
Net position at beginning of year 167,083,555 147,812,133
Net Position at End of Year $ 169,912,924 $ 167,083,555
Operating Income
Net Income
2015
Total Operating Revenues
Total Operating Expenses
2016
9
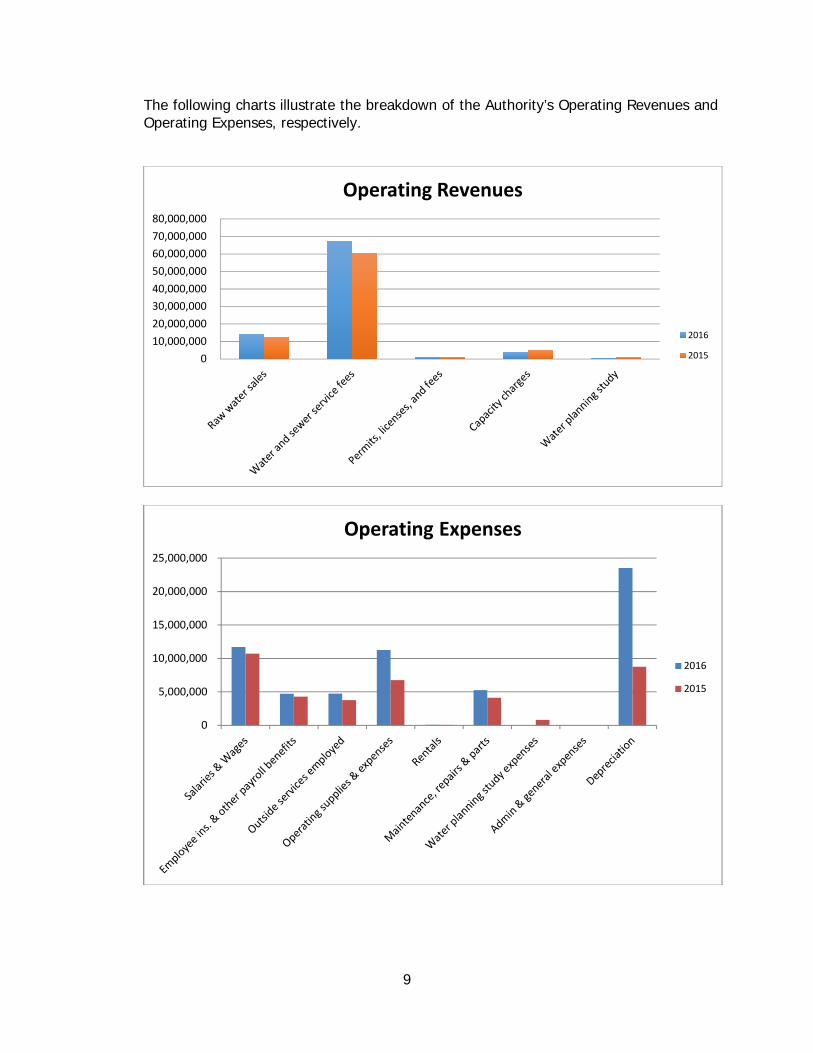
The following charts illustrate the breakdown of the Authority’s Operating Revenues and Operating Expenses, respectively.
010,000,00020,000,00030,000,00040,000,00050,000,00060,000,00070,000,00080,000,000
Operating Revenues
2016
2015
0
5,000,000
10,000,000
15,000,000
20,000,000
25,000,000
Operating Expenses
2016
2015
10
Salaries and wages increased by $1.0 million, a 9% increase from the prior year which was due to less vacancies of budgeted positions within the Divisions.
Operating supplies and expenses increased by $4.5 million, an increase of 67% due to the start-up of the GRP water treatment plant.
Depreciation expense increased by $14.8 million, an increase of 169% from the previous year. The increase was due to the addition of capital assets by purchase/construction of capital assets mostly due to GRP.
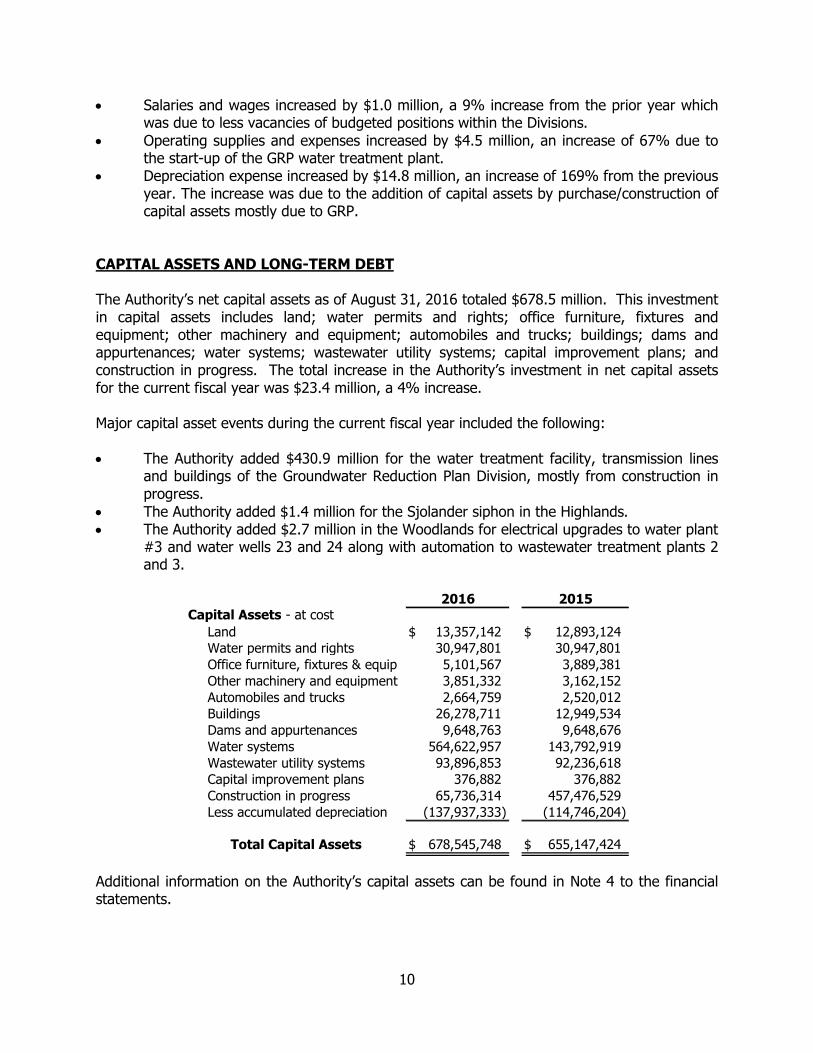
CAPITAL ASSETS AND LONG-TERM DEBT
The Authority’s net capital assets as of August 31, 2016 totaled $678.5 million. This investment in capital assets includes land; water permits and rights; office furniture, fixtures and equipment; other machinery and equipment; automobiles and trucks; buildings; dams and appurtenances; water systems; wastewater utility systems; capital improvement plans; and construction in progress. The total increase in the Authority’s investment in net capital assets for the current fiscal year was $23.4 million, a 4% increase.
Major capital asset events during the current fiscal year included the following:
The Authority added $430.9 million for the water treatment facility, transmission lines and buildings of the Groundwater Reduction Plan Division, mostly from construction in progress.
The Authority added $1.4 million for the Sjolander siphon in the Highlands. The Authority added $2.7 million in the Woodlands for electrical upgrades to water plant
#3 and water wells 23 and 24 along with automation to wastewater treatment plants 2 and 3.
Capital Assets - at cost
Land $ 13,357,142 $ 12,893,124Water permits and rights 30,947,801 30,947,801Office furniture, fixtures & equip 5,101,567 3,889,381Other machinery and equipment 3,851,332 3,162,152Automobiles and trucks 2,664,759 2,520,012Buildings 26,278,711 12,949,534Dams and appurtenances 9,648,763 9,648,676Water systems 564,622,957 143,792,919Wastewater utility systems 93,896,853 92,236,618Capital improvement plans 376,882 376,882Construction in progress 65,736,314 457,476,529Less accumulated depreciation (137,937,333) (114,746,204)
$ 678,545,748 $ 655,147,424Total Capital Assets
2016 2015
Additional information on the Authority’s capital assets can be found in Note 4 to the financial statements.
11
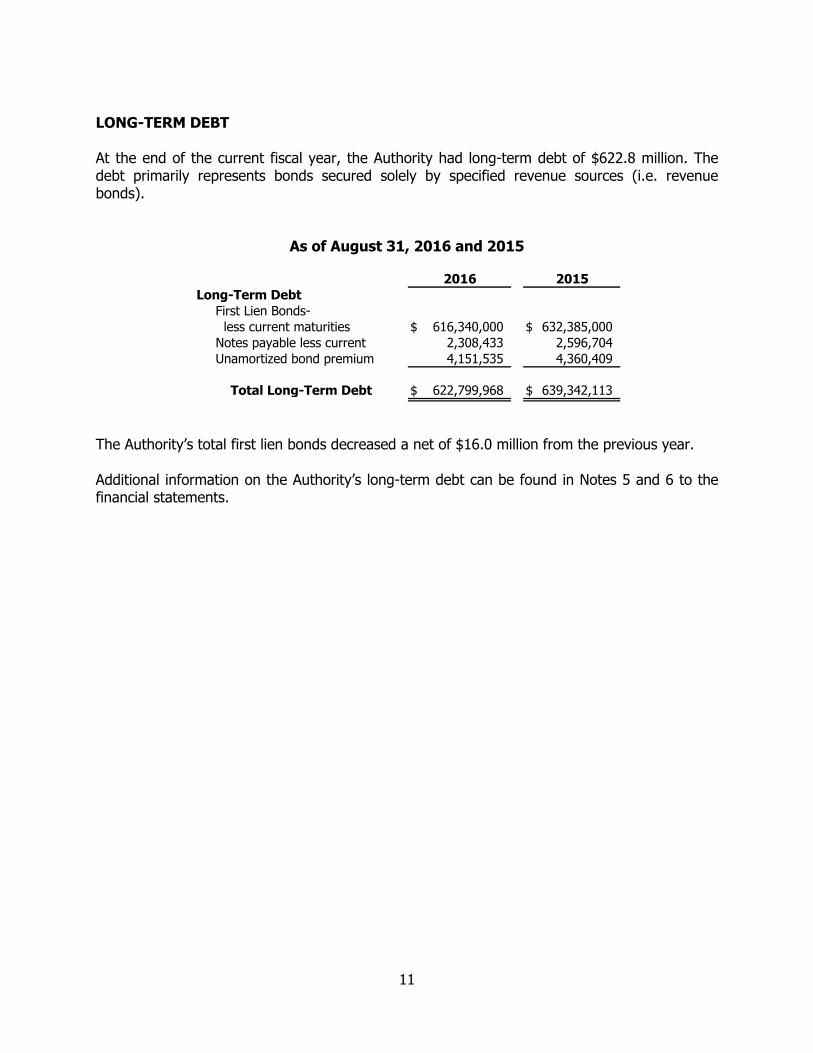
LONG-TERM DEBT
At the end of the current fiscal year, the Authority had long-term debt of $622.8 million. The debt primarily represents bonds secured solely by specified revenue sources (i.e. revenue bonds).
As of August 31, 2016 and 2015
Long-Term DebtFirst Lien Bonds- less current maturities $ 616,340,000 $ 632,385,000Notes payable less current 2,308,433 2,596,704Unamortized bond premium 4,151,535 4,360,409
$ 622,799,968 $ 639,342,113Total Long-Term Debt
2016 2015
The Authority’s total first lien bonds decreased a net of $16.0 million from the previous year.
Additional information on the Authority’s long-term debt can be found in Notes 5 and 6 to the financial statements.

12
REQUEST FOR INFORMATION
This financial report is designed to provide a general overview of the Authority’s finances. Questions concerning any of the information provided in this report or requests for additional financial information should be addressed to the Controller of the San Jacinto River Authority; P.O. Box 329; Conroe, Texas 77305.
BASIC FINANCIAL STATEMENTS
13
Business Type Activities -
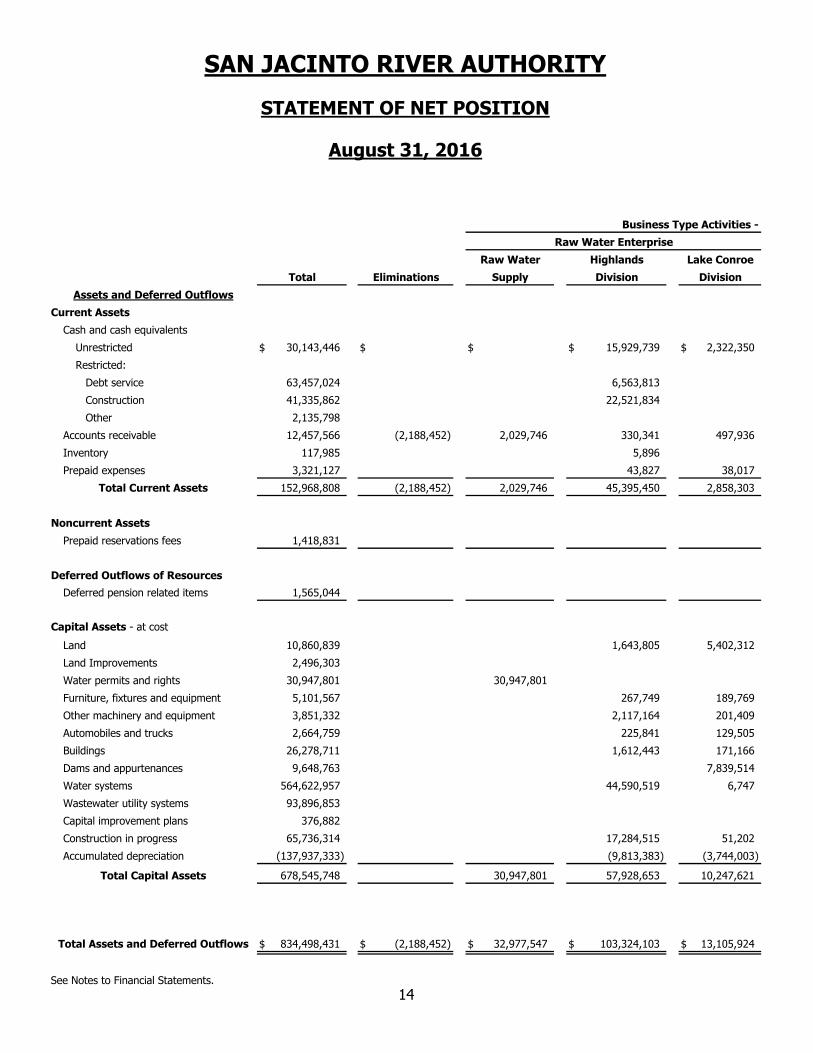
Current Assets
Cash and cash equivalents
Unrestricted $ 30,143,446 $ $ $ 15,929,739 $ 2,322,350
Restricted:
Debt service 63,457,024 6,563,813
Construction 41,335,862 22,521,834
Other 2,135,798
Accounts receivable 12,457,566 (2,188,452) 2,029,746 330,341 497,936
Inventory 117,985 5,896
Prepaid expenses 3,321,127 43,827 38,017
152,968,808 (2,188,452) 2,029,746 45,395,450 2,858,303
Noncurrent Assets
Prepaid reservations fees 1,418,831
Deferred Outflows of Resources
Deferred pension related items 1,565,044
Capital Assets - at cost
Land 10,860,839 1,643,805 5,402,312
Land Improvements 2,496,303
Water permits and rights 30,947,801 30,947,801
Furniture, fixtures and equipment 5,101,567 267,749 189,769
Other machinery and equipment 3,851,332 2,117,164 201,409
Automobiles and trucks 2,664,759 225,841 129,505
Buildings 26,278,711 1,612,443 171,166
Dams and appurtenances 9,648,763 7,839,514
Water systems 564,622,957 44,590,519 6,747
Wastewater utility systems 93,896,853
Capital improvement plans 376,882
Construction in progress 65,736,314 17,284,515 51,202
Accumulated depreciation (137,937,333) (9,813,383) (3,744,003)
678,545,748 30,947,801 57,928,653 10,247,621
$ 834,498,431 $ (2,188,452) $ 32,977,547 $ 103,324,103 $ 13,105,924
See Notes to Financial Statements.
SAN JACINTO RIVER AUTHORITY
STATEMENT OF NET POSITION
August 31, 2016
Total Eliminations DivisionDivision
Assets and Deferred Outflows
Total Current Assets
Total Capital Assets
Total Assets and Deferred Outflows
Raw Water Enterprise
Lake ConroeRaw Water
Supply
Highlands
14
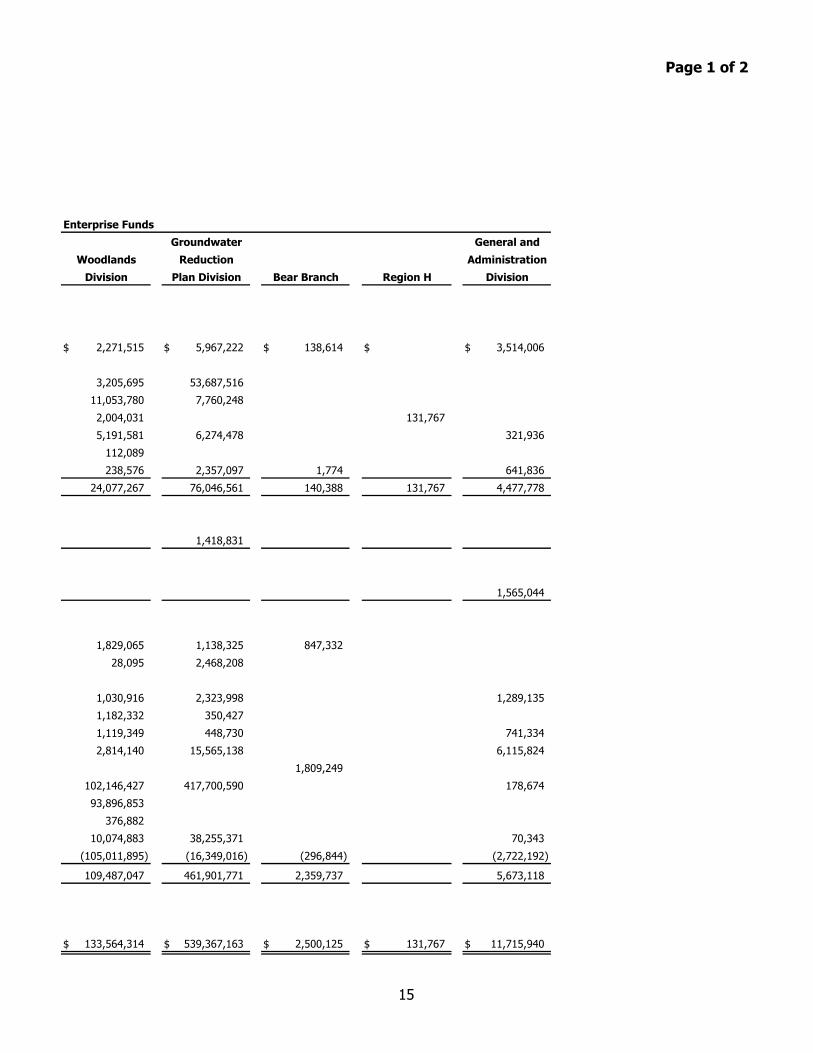
Page 1 of 2
Enterprise Funds
$ 2,271,515 $ 5,967,222 $ 138,614 $ $ 3,514,006
3,205,695 53,687,516
11,053,780 7,760,248
2,004,031 131,767
5,191,581 6,274,478 321,936
112,089
238,576 2,357,097 1,774 641,836
24,077,267 76,046,561 140,388 131,767 4,477,778
1,418,831
1,565,044
1,829,065 1,138,325 847,332
28,095 2,468,208
1,030,916 2,323,998 1,289,135
1,182,332 350,427
1,119,349 448,730 741,334
2,814,140 15,565,138 6,115,824
1,809,249
102,146,427 417,700,590 178,674
93,896,853
376,882
10,074,883 38,255,371 70,343
(105,011,895) (16,349,016) (296,844) (2,722,192)
109,487,047 461,901,771 2,359,737 5,673,118
$ 133,564,314 $ 539,367,163 $ 2,500,125 $ 131,767 $ 11,715,940
General and
DivisionRegion H
Woodlands
Division
Groundwater
Reduction
Plan Division Bear Branch
Administration
15
Business - Type Activities -
Current Liabilities
Accounts payable and accrued
liabilities - unrestricted $ 6,624,620 $ (2,188,452) $ 41,081 $ 1,179,920 $ 260,697
Restricted for Debt service:
Current portion of bonds 18,350,000 1,235,000 1,925,000
Current portion of notes 288,568
Accrued interest payable 10,811,743 195,594 975,882
Restricted for Construction:
Accounts payable
Retainage payable 1,981,241 200,748
Unearned revenue 191,866 3,900 156,670
38,248,038 (2,188,452) 1,475,575 4,281,550 417,367
Noncurrent Liabilities
Net Pension obligation 1,812,720
Net OPEB obligation 1,414,539 269,994 506,127
3,227,259 269,994 506,127
Long-Term Debt
First lien water revenue bonds -
less current maturities 620,491,535 11,641,839 61,114,689
Notes payable less current 2,308,433
622,799,968 11,641,839 61,114,689
664,275,265 (2,188,452) 13,117,414 65,666,233 923,494
Deferred Inflows of Resources
Differences between projected and actual
earnings on pension plan investments 310,242
Net Position
Net investment in capital assets 76,461,833 18,070,962 17,210,050 10,247,621
Restricted:
Debt service 52,840,875 5,587,931
Other 2,091,130
Unrestricted 38,519,086 1,789,171 14,859,889 1,934,809
169,912,924 19,860,133 37,657,870 12,182,430
$ 834,498,431 $ (2,188,452) $ 32,977,547 $ 103,324,103 $ 13,105,924
See Notes to Financial Statements.
STATEMENT OF NET POSITION
August 31, 2016
SAN JACINTO RIVER AUTHORITY
Total Net Position
and Fund Equity
Total Long-Term Debt
Total Liabilities
Fund Equity
Total Liabilities, Deferred Inflows
Total Noncurrent Liabs
Total
Liabilities
Total Current Liabilities
Lake Conroe
DivisionEliminations
Raw Water
Supply
Highlands
Division
Raw Water Enterprise
16
Page 2 of 2
Enterprise Funds
$ 3,981,326 $ 2,733,068 $ 5,993 $ 13,372 $ 597,615
2,165,000 13,025,000
288,568
695,609 8,944,658
636,362 1,144,131
31,296
7,478,297 25,846,857 5,993 44,668 886,183
1,812,720
535,612 102,806
535,612 1,915,526
40,038,559 507,696,448
2,308,433
40,038,559 507,696,448 2,308,433
48,052,468 533,543,305 5,993 44,668 5,110,142
310,242
77,700,906 (52,203,560) 2,359,737 3,076,117
2,510,086 44,742,858
2,004,031 87,099
3,296,823 13,284,560 134,395 3,219,439
85,511,846 5,823,858 2,494,132 87,099 6,295,556
$ 133,564,314 $ 539,367,163 $ 2,500,125 $ 131,767 $ 11,715,940
General andGroundwater
Reduction
Plan Division Bear BranchDivision
Woodlands
DivisionRegion H
Administration
17
Business - Type Activities -
Operating Revenues:
Water sales:
Industrial and Municipal $ 12,622,941 $ (2,152,841) $ 14,775,782 $ $
Irrigation 139,677 139,677
Water and sewer service fees 67,391,878 (14,899,500) 338,214
Permits, licenses and fees 1,125,274 1,125,274
Contractual revenues 1,486,056 1,486,056
Capacity charges 3,834,462
Water planning grant 359,554
86,959,842 (17,052,341) 15,253,673 2,611,330
Operating Expenses:
Salaries and wages 11,724,348 1,570,632 1,354,376
Employee insurance and other
payroll benefits 4,715,723 636,092 617,693
Outside services employed 5,042,298 (14,625,157) 379,121 322,169 586,575
Operating supplies and expenses 11,252,100 (2,427,184) 285,163 218,239
Rentals 85,327 (22,310) 2,756 42,108
Maintenance, repairs & parts 5,279,400 256,158 337,737
Water planning grant expenses 17,877
General and admin. expenses allocated 540,104 469,415
Depreciation 23,527,194 1,482,982 186,965
61,644,267 (17,074,651) 379,121 5,096,056 3,813,108
25,315,575 22,310 14,874,552 (5,096,056) (1,201,778)
Nonoperating Revenues (Expenses)
Interest income 396,775 106,587
Gain (Loss) on disposal of assets 452,827 129,162 103,667
Other revenues 39,697 (22,310) 6,355 6,150
Amortization of bond premium or discounts 278,666 32,624 15,561
Bond issuance costs (108,133) (923)
Interest expense (24,954,257) (472,175) (2,324,409)
(23,894,425) (22,310) (439,551) (2,067,667) 109,817
1,421,150 14,435,001 (7,163,723) (1,091,961)
Transfers (12,411,484) 10,931,572 787,573
Capital Contributions/(Distributions) 1,408,219 1,000,000
2,829,369 2,023,517 4,767,849 (304,388)
Net Position at Beginning of Year 167,083,555 17,836,616 32,890,021 12,486,818
Net Position at End of Year $ 169,912,924 $ $ 19,860,133 $ 37,657,870 $ 12,182,430
See Notes to Financial Statements.
SAN JACINTO RIVER AUTHORITY
STATEMENT OF REVENUES, EXPENSES AND CHANGES IN NET POSITION
Year Ended August 31, 2016
EliminationsTotal
Raw Water Highlands
Change in Net Position
Total Operating Revenues
Total Operating Expenses
Operating Income (Loss)
Total Nonoperating Revenues
Contributions and Transfers
(Expenses)
Income (Loss) Before
Division
Lake Conroe
Raw Water Enterprise
Supply Division
18
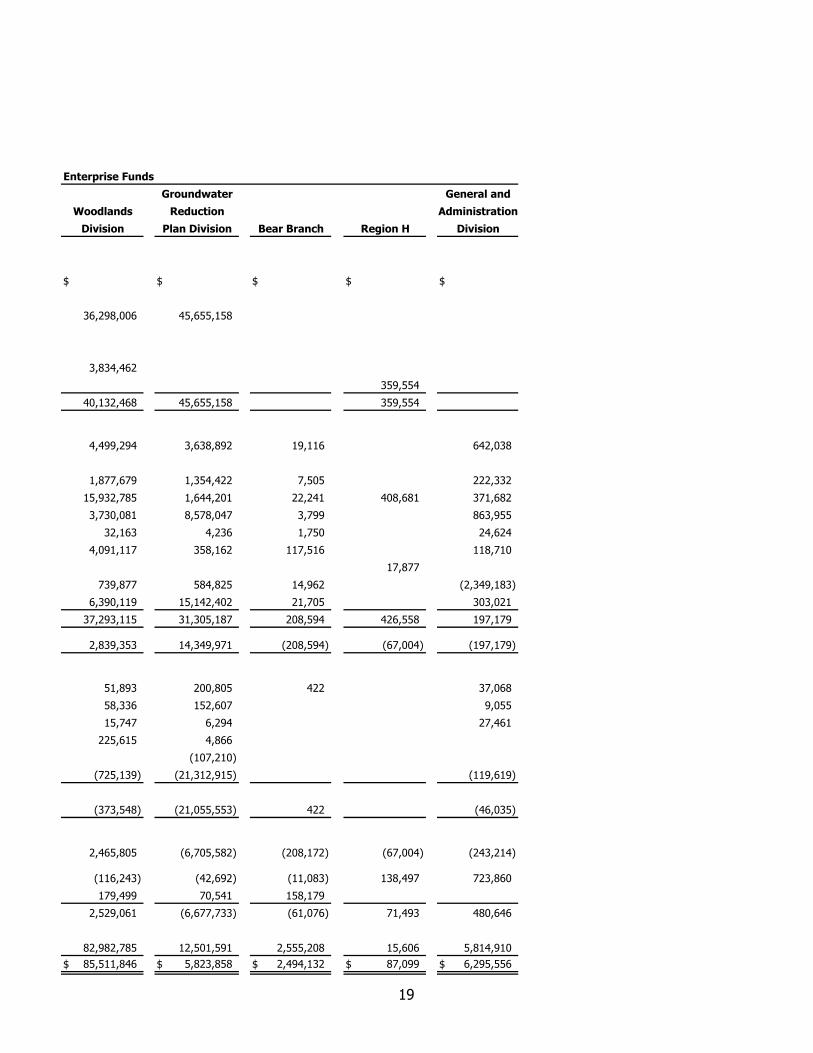
Enterprise Funds
$ $ $ $ $
36,298,006 45,655,158
3,834,462
359,554
40,132,468 45,655,158 359,554
4,499,294 3,638,892 19,116 642,038
1,877,679 1,354,422 7,505 222,332
15,932,785 1,644,201 22,241 408,681 371,682
3,730,081 8,578,047 3,799 863,955
32,163 4,236 1,750 24,624
4,091,117 358,162 117,516 118,710
17,877
739,877 584,825 14,962 (2,349,183)
6,390,119 15,142,402 21,705 303,021
37,293,115 31,305,187 208,594 426,558 197,179
2,839,353 14,349,971 (208,594) (67,004) (197,179)
51,893 200,805 422 37,068
58,336 152,607 9,055
15,747 6,294 27,461
225,615 4,866
(107,210)
(725,139) (21,312,915) (119,619)
(373,548) (21,055,553) 422 (46,035)
2,465,805 (6,705,582) (208,172) (67,004) (243,214)
(116,243) (42,692) (11,083) 138,497 723,860
179,499 70,541 158,179
2,529,061 (6,677,733) (61,076) 71,493 480,646
82,982,785 12,501,591 2,555,208 15,606 5,814,910
$ 85,511,846 $ 5,823,858 $ 2,494,132 $ 87,099 $ 6,295,556
Plan Division
Woodlands
Division
General and
Region HBear Branch Division
Administration
Groundwater
Reduction
19
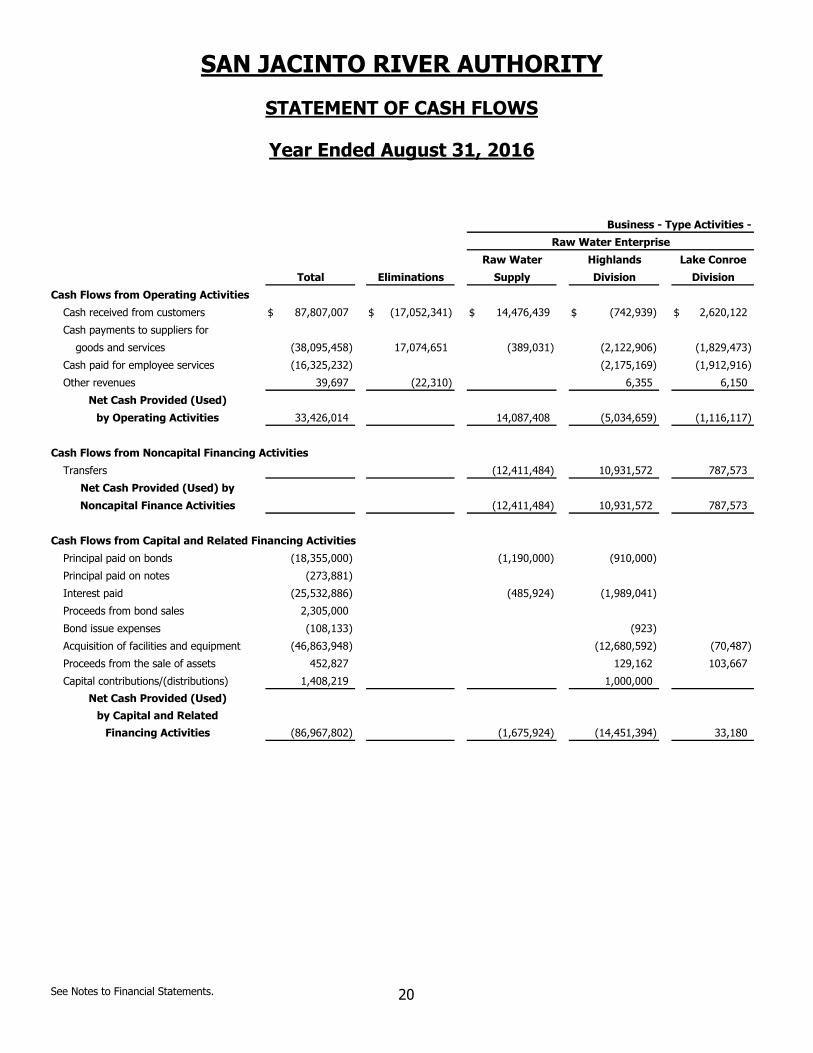
Business - Type Activities -
Cash Flows from Operating Activities
Cash received from customers $ 87,807,007 $ (17,052,341) $ 14,476,439 $ (742,939) $ 2,620,122
Cash payments to suppliers for
goods and services (38,095,458) 17,074,651 (389,031) (2,122,906) (1,829,473)
Cash paid for employee services (16,325,232) (2,175,169) (1,912,916)
Other revenues 39,697 (22,310) 6,355 6,150
33,426,014 14,087,408 (5,034,659) (1,116,117)
Cash Flows from Noncapital Financing Activities
Transfers (12,411,484) 10,931,572 787,573
(12,411,484) 10,931,572 787,573
Cash Flows from Capital and Related Financing Activities
Principal paid on bonds (18,355,000) (1,190,000) (910,000)
Principal paid on notes (273,881)
Interest paid (25,532,886) (485,924) (1,989,041)
Proceeds from bond sales 2,305,000
Bond issue expenses (108,133) (923)
Acquisition of facilities and equipment (46,863,948) (12,680,592) (70,487)
Proceeds from the sale of assets 452,827 129,162 103,667
Capital contributions/(distributions) 1,408,219 1,000,000
(86,967,802) (1,675,924) (14,451,394) 33,180
See Notes to Financial Statements.
SAN JACINTO RIVER AUTHORITY
STATEMENT OF CASH FLOWS
Year Ended August 31, 2016
Raw Water Enterprise
Net Cash Provided (Used)
by Operating Activities
Raw Water
Supply
Highlands
Division
Financing Activities
Net Cash Provided (Used) by
by Capital and Related
Net Cash Provided (Used)
Noncapital Finance Activities
Lake Conroe
DivisionTotal Eliminations
20
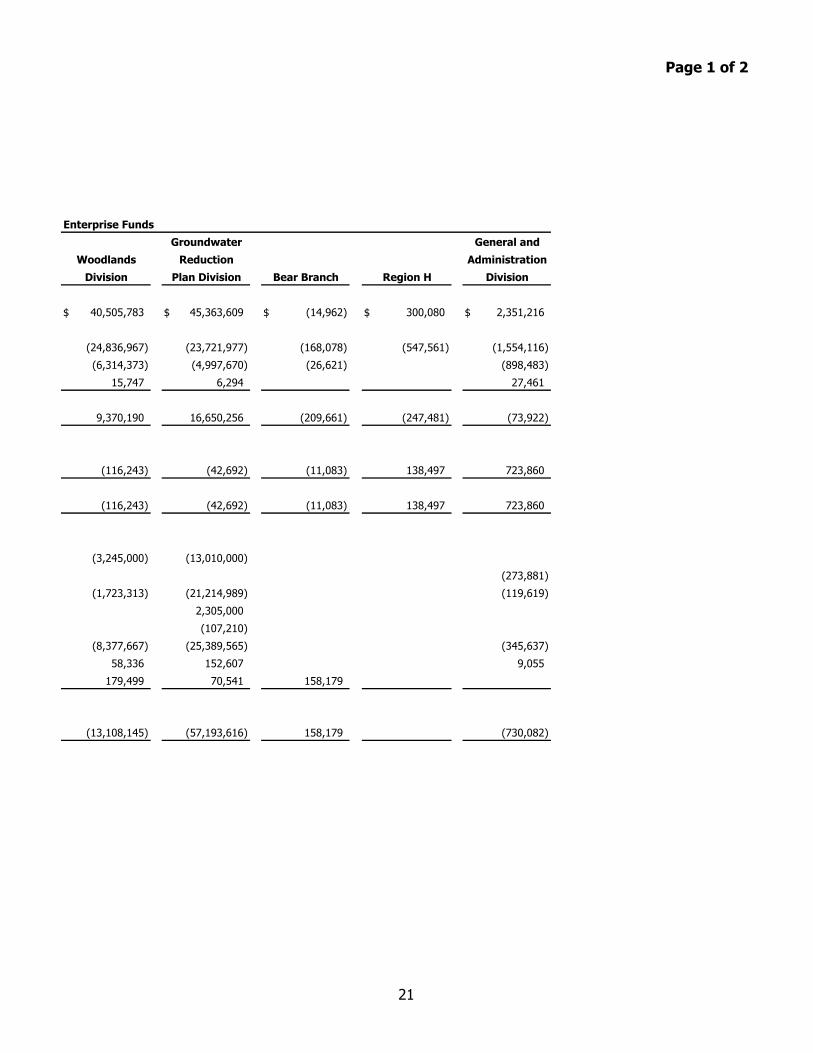
Page 1 of 2
Enterprise Funds
$ 40,505,783 $ 45,363,609 $ (14,962) $ 300,080 $ 2,351,216
(24,836,967) (23,721,977) (168,078) (547,561) (1,554,116)
(6,314,373) (4,997,670) (26,621) (898,483)
15,747 6,294 27,461
9,370,190 16,650,256 (209,661) (247,481) (73,922)
(116,243) (42,692) (11,083) 138,497 723,860
(116,243) (42,692) (11,083) 138,497 723,860
(3,245,000) (13,010,000)
(273,881)
(1,723,313) (21,214,989) (119,619)
2,305,000
(107,210)
(8,377,667) (25,389,565) (345,637)
58,336 152,607 9,055
179,499 70,541 158,179
(13,108,145) (57,193,616) 158,179 (730,082)
Administration
General and
Division
Groundwater
Reduction
Plan Division
Woodlands
Division Bear Branch Region H
21
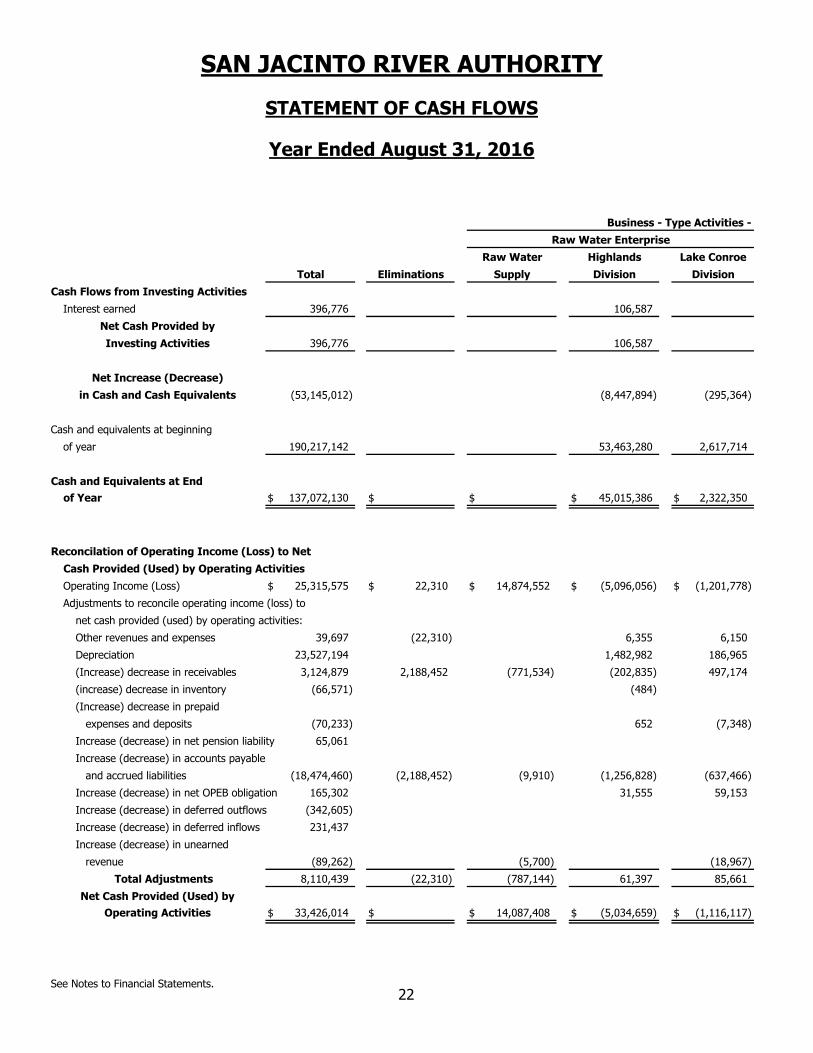
Business - Type Activities -
Cash Flows from Investing Activities
Interest earned 396,776 106,587
396,776 106,587
(53,145,012) (8,447,894) (295,364)
Cash and equivalents at beginning
of year 190,217,142 53,463,280 2,617,714
Cash and Equivalents at End
of Year $ 137,072,130 $ $ $ 45,015,386 $ 2,322,350
Reconcilation of Operating Income (Loss) to Net
Cash Provided (Used) by Operating Activities
Operating Income (Loss) $ 25,315,575 $ 22,310 $ 14,874,552 $ (5,096,056) $ (1,201,778)
Adjustments to reconcile operating income (loss) to
net cash provided (used) by operating activities:
Other revenues and expenses 39,697 (22,310) 6,355 6,150
Depreciation 23,527,194 1,482,982 186,965
(Increase) decrease in receivables 3,124,879 2,188,452 (771,534) (202,835) 497,174
(increase) decrease in inventory (66,571) (484)
(Increase) decrease in prepaid
expenses and deposits (70,233) 652 (7,348)
Increase (decrease) in net pension liability 65,061
Increase (decrease) in accounts payable
and accrued liabilities (18,474,460) (2,188,452) (9,910) (1,256,828) (637,466)
Increase (decrease) in net OPEB obligation 165,302 31,555 59,153
Increase (decrease) in deferred outflows (342,605)
Increase (decrease) in deferred inflows 231,437
Increase (decrease) in unearned
revenue (89,262) (5,700) (18,967)
8,110,439 (22,310) (787,144) 61,397 85,661
$ 33,426,014 $ $ 14,087,408 $ (5,034,659) $ (1,116,117)
See Notes to Financial Statements.
SAN JACINTO RIVER AUTHORITY
STATEMENT OF CASH FLOWS
Operating Activities
Net Increase (Decrease)
in Cash and Cash Equivalents
Total Adjustments
Net Cash Provided (Used) by
Net Cash Provided by
Investing Activities
Year Ended August 31, 2016
Division Division
Raw Water
Supply
Lake ConroeHighlands
Total Eliminations
Raw Water Enterprise
22
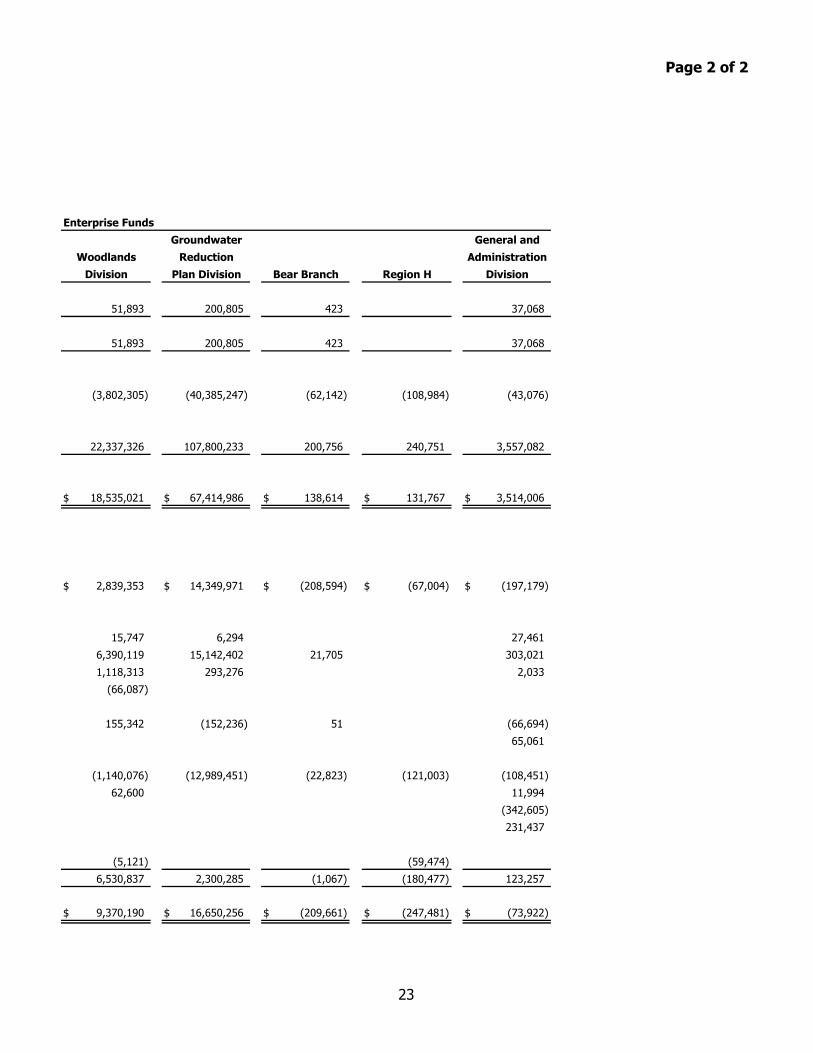
Page 2 of 2
Enterprise Funds
51,893 200,805 423 37,068
51,893 200,805 423 37,068
(3,802,305) (40,385,247) (62,142) (108,984) (43,076)
22,337,326 107,800,233 200,756 240,751 3,557,082
$ 18,535,021 $ 67,414,986 $ 138,614 $ 131,767 $ 3,514,006
$ 2,839,353 $ 14,349,971 $ (208,594) $ (67,004) $ (197,179)
15,747 6,294 27,461
6,390,119 15,142,402 21,705 303,021
1,118,313 293,276 2,033
(66,087)
155,342 (152,236) 51 (66,694)
65,061
(1,140,076) (12,989,451) (22,823) (121,003) (108,451)
62,600 11,994
(342,605)
231,437
(5,121) (59,474)
6,530,837 2,300,285 (1,067) (180,477) 123,257
$ 9,370,190 $ 16,650,256 $ (209,661) $ (247,481) $ (73,922)
General and
AdministrationWoodlands
DivisionDivision Region H
Groundwater
Reduction
Plan Division Bear Branch
23

(This Page Intentionally Left Blank)
24
SAN JACINTO RIVER AUTHORITY
NOTES TO FINANCIAL STATEMENTS
25
NOTE 1 - SUMMARY OF SIGNIFICANT ACCOUNTING POLICIES
The accounting and reporting policies of the San Jacinto River Authority (the “Authority”), a governmental agency and political subdivision of the State of Texas, conform to accounting principles generally accepted in the United States of America as prescribed by the Governmental Accounting Standards Board (“GASB”). The following is a summary of the more significant policies consistently applied in the preparation of the accompanying financial statements:
A. Reporting Entity
The reporting entity refers to the scope of activities, organizations and functions included in the financial statements. The Authority is a separate, self-supporting governmental unit and is administered by a Board of seven members who are appointed by the Governor of the State of Texas. There are no dependent functions or agencies that meet any of the criteria for inclusion in the reporting entity in accordance with the requirements of the GASB.
B. Business-Type Activities The business-type activities and the related accounts of the Authority are organized on the basis of Enterprise Funds, each of which is considered a separate accounting entity. The operations of each Enterprise Fund are accounted for with a separate set of self-balancing accounts that comprise its assets, liabilities, fund equity, revenues and expenses, as appropriate. These Enterprise Funds are used to account for operations (1) that are financed and operated in a manner similar to private business enterprises – where the intent of the governing body is that the cost of providing services to customers on a continuing basis (expenses, including depreciation) be financed or recovered primarily through user charges; or (2) where the governing body has decided that periodic determination of revenues earned, expenses incurred, and/or net income is appropriate for capital maintenance, public policy, management control, accountability, debt service or other purposes. The Enterprise Funds maintained by the Authority are described below: General and Administration Fund (“General and Administration Division”) The General and Administration Division, located in the general business office at Lake Conroe, consists of professional, technical, accounting, administrative and support staff working under the direction of the General Manager. The General and Administration Division provides management and support services to the SJRA’s four operating divisions, Region H and Bear Branch and their time and salary costs are allocated to each division based on time worked. The majority of the growth occurring during and after 2007 (see Number of Employees by Division, pages 88-89) had been directly related to the planning and implementation of a groundwater reduction program in response to regulations adopted by the Lone Star Groundwater Conservation District.
SAN JACINTO RIVER AUTHORITY
NOTES TO FINANCIAL STATEMENTS
26
Raw Water Fund (“Raw Water Enterprise”) This Enterprise consists of the Highlands and Lake Conroe Divisions plus revenue and expenses associated with the Authority’s overall raw water supply system that are not otherwise divisible between the Highlands Division and the Lake Conroe Division (Raw Water Supply). The Enterprise accounts for the long-term water sale contracts to industrial, agricultural and municipal customers from its raw water supplies. Most of the sales contracts contain provisions for the quantities of water, take or pay whether or not the water is used by the customers. Some of the sales contracts contain options and reservations for the additional purchases of near-term future water supplies by customers. In all such contracts, the Authority has reserved the right from time to time to adjust its rates for the sale and for reservation of raw water. Highlands Fund (“Highlands Division”) This fund accounts for the long-term water sale commitments to several industrial, agricultural and municipal customers from its water resources in the Reservoir and Canal System located in Highlands, Texas. Lake Conroe Dam and Reservoir Fund (“Lake Conroe Division”) The Authority contracted with the City of Houston for the joint construction of Lake Conroe. Under the terms of the contract, the City of Houston advanced two-thirds of the financing of such construction and owns two-thirds of permitted water rights of Lake Conroe. The Authority, in whom the legal title to the physical properties is vested, owns the remaining one-third of the permitted water rights. The Authority operates Lake Conroe for the benefit of customers it serves and the City of Houston and customers they serve. The operating costs of Lake Conroe are generally borne one-third by the Authority and two-thirds by the City of Houston. The accompanying financial statements include only the costs of the Authority’s ownership interest in Lake Conroe; therefore, the costs of the City of Houston’s ownership interest of $23,648,799 in Lake Conroe are excluded from the capital asset totals presented. During the useful life of Lake Conroe, the Authority has been contracted to operate Lake Conroe for the benefit of the Authority and for the benefit of the City of Houston and its undivided two-thirds ownership interest. For operating Lake Conroe, the Authority is reimbursed for two-thirds of the net annual costs and expenses (after credits for revenues received from recreational facilities and other Lake Conroe sources except the sale of water) incurred by the Authority for maintenance, operation and capital outlays of Lake Conroe. Due to the joint ownership interests in capital assets, the accompanying financial statements present only the Authority’s share in capital assets of Lake Conroe.
SAN JACINTO RIVER AUTHORITY
NOTES TO FINANCIAL STATEMENTS
27
Woodlands Division Fund (“Woodlands Division”) This fund accounts for the water and wastewater treatment plants (Central Plants) and major water production, storage and distribution facilities and wastewater collection and conveyance equipment (Central Lines) located in The Woodlands, Texas. As described below, the Central Plants and Central Lines (collectively, the Central Facilities) are provided to this fund through purchases at actual costs of reserve capacity rights in such Central Facilities by the eleven municipal utility districts located in The Woodlands, Texas. Some of the costs of reserve capacity were reduced by federal grants received by the Authority for the initial cost of construction and expansion of wastewater treatment facilities comprising a part of the Central Facilities. The Woodlands Division participates in the groundwater reduction program administered by the Authority’s GRP Division. The pumpage fee and surface water fee income and related payments are reflected in the eliminations column of the financial statements. All activities necessary to provide water and sewer services from such assets are accounted for in this fund, including operations, maintenance, financing and related debt service, and billings to and collections from the participating municipal utility districts. The basic agreement with the municipal utility districts provides for water and wastewater service billings based upon the recovery of the actual expenses incurred for the operations, maintenance and contingency reserves for the Central Facilities, exclusive of depreciation of such assets, as well as capacity charges for the purchase of reserved capacity rights. As of August 31, 2016, the following municipal utility districts have purchased reserve capacity in such Central Facilities: Montgomery County Municipal Utility District Nos. 6, 7, 36, 39, 46, 47, 60 and 67, The Woodlands Municipal Utility District No. 1, The Woodlands Metro Center Municipal Utility District and Harris- Montgomery Counties Municipal Utility District No. 386. In the initial 1975 agreement and supplemental agreements thereto between the Authority and The Woodlands Development Company (Company) including its successors, the Company agreed to advance monies to the Woodlands Division, to the extent that funds were not otherwise available to finance the costs of the expansions to the Central Facilities. Such agreements also stipulate that sums advanced to the Woodlands Division by the Company shall be reimbursed to the Company from capacity charges received from the participating municipal utility districts. Since 1989, the Company has not been called upon to make any advances for such purposes, and substantially all prior advances by the Company have been fully reimbursed. The participating municipal utility districts make payment of capacity charges for purchased reserved capacity rights by contributing their respective pro rata shares of costs, in cash by contributing additional facilities in kind, or by payment of their pro rata shares of the debt services costs on contract revenue bonds issued by the Authority to finance the costs of Central Facilities.
SAN JACINTO RIVER AUTHORITY
NOTES TO FINANCIAL STATEMENTS
28
Groundwater Reduction Plan Fund (“Groundwater Reduction Plan Division”) As authorized by the Board of Directors, the Authority is developing a Groundwater Reduction Plan (GRP) on behalf of all large volume groundwater users (LVGU’s) within Montgomery County who choose to join. Individual LVGU’s in Montgomery County will be able to comply with the Lone Star Groundwater Conservation District (LSGCD) regulatory requirements to submit a GRP by participating in the Authority’s GRP. The projected water demand of all participating LVGU’s is included in the planning for the Authority’s regionalized surface water treatment and transmission system. The specific requirements for this planning are set forth in the LSGCD’s District Regulatory Plan. In order to join the Authority’s GRP, individual LVGU’s had to execute a GRP contract with the Authority obligating them to pay groundwater pumpage fees and/or surface water fees. The revenues from participant fees cover all costs associated with implementing the GRP program. On October 16, 2009, a Water Supply Contract with City of Houston was signed by the Mayor of the City of Houston. The agreement allows the Authority to purchase surface water from the City’s two-thirds share in Lake Conroe. The Authority will pay a reservation fee for water that is reserved from the City but not actually used in a given year. The reservation fee will be a prorated amount based on one-half of the City’s share of the annual O&M and capital expenses for Lake Conroe. The term of the agreement is for 80 years, with a continuation of service upon expiration under similar terms. Bear Branch Fund (“Bear Branch”) The Authority also owns and maintains the Bear Branch Reservoir System (Bear Branch) which provides elements of a storm water management system within a portion of The Woodlands, Texas service area. The Authority purchased the assets of Bear Branch from the Woodlands Land Development Company, LP in April 2000. All activities necessary to maintain and improve Bear Branch assets are accounted for in this fund. As of August 31, 2016, contracts have been signed with Montgomery County Municipal Utility Districts Nos. 7, 46, 47, 60 and 67 to purchase their agreed to proportionate share of reserve capacity rights for storm water detention resulting from the construction and maintenance of Bear Branch System. Region H Fund (“Region H”) Under an agreement with the Texas Water Development Board, the Authority is the designated contracting agency and group-appointed administrator of the Region H Water Planning Group.
C. Measurement Focus and Basis of Accounting
The Enterprise Funds have a net income or economic resources measurement focus and are accounted for using the accrual basis of accounting, under which revenues are recognized when they are earned including unbilled water and sewer services which are accrued. Expenses are recognized at the time the liability is incurred. With this measurement focus, all assets and liabilities associated with the operation of these funds are included in the Statement of Net Position.
SAN JACINTO RIVER AUTHORITY
NOTES TO FINANCIAL STATEMENTS
29
The Authority distinguishes operating revenues and expenses from nonoperating items. Operating revenues and expenses generally result from providing services and producing and delivering goods in connection with the Authority’s principal ongoing operations. The principal operating revenues of the Authority are charges to customers for sales and services. Operating expenses include the cost of sales and services, administrative expenses and depreciation on capital assets. All revenues and expenses not meeting this definition are reported as nonoperating revenues and expenses. The Authority applies all GASB pronouncements as well as Financial Accounting Standards Board pronouncements issued on or before November 30, 1989, unless those pronouncements conflict with or contradict GASB pronouncements.
D. Cash and Cash Equivalents Cash and cash equivalents include amounts in checking, savings, money market accounts and Public Funds Investment Pools and securities per the Authority’s Investment Policy.
E. Accounts Receivable
The allowance for doubtful accounts is established to provide an estimate of bad debts charged to revenues. Losses are charged against the allowance when Management believes the collectibility of a receivable is unlikely. Subsequent recoveries, if any, are credited to the allowance. The allowance for doubtful accounts is evaluated on a regular basis by Management and is based on historical experience and specifically identified questionable receivables. The evaluation is inherently subjective as it requires estimates that are susceptible to significant revision as more information becomes available. As of August 31, 2016, no allowance for bad debts is recorded.
F. Depreciation Depreciation is provided for in amounts sufficient to relate the cost of the depreciable property to operations on a straight-line basis over their estimated useful lives in the Enterprise Funds. The depreciation for the Lake Conroe Division is based only on the one-third ownership interest of the Authority in such assets. The Authority’s policy is to capitalize assets with an initial installed cost exceeding $5,000 and useful life of five years or greater. The useful lives by the type of assets are as follows: Asset Class Useful Life Office furniture, fixtures and equipment 5 years Other machinery and equipment 5-10 years Automobiles and trucks 5-10 years Buildings 50 years Dams and appurtenances 100 years Water systems 30 years Wastewater utility systems Capital improvement plans
30 years 20 years
The Authority’s Management considers its water permits and rights permanent in nature and since these intangible assets have no evident limited life, no amortization is being recognized.
SAN JACINTO RIVER AUTHORITY
NOTES TO FINANCIAL STATEMENTS
30
G. Unamortized Bond Premium or Discount Included within long-term debt is unamortized bond premium or discount. The bond premiums or discounts are being amortized over the life of the related obligation on the straight-line method.
H. Date of Management’s Review Subsequent events have been evaluated through December 16, 2016, which is the date the financial statements were available to be issued.
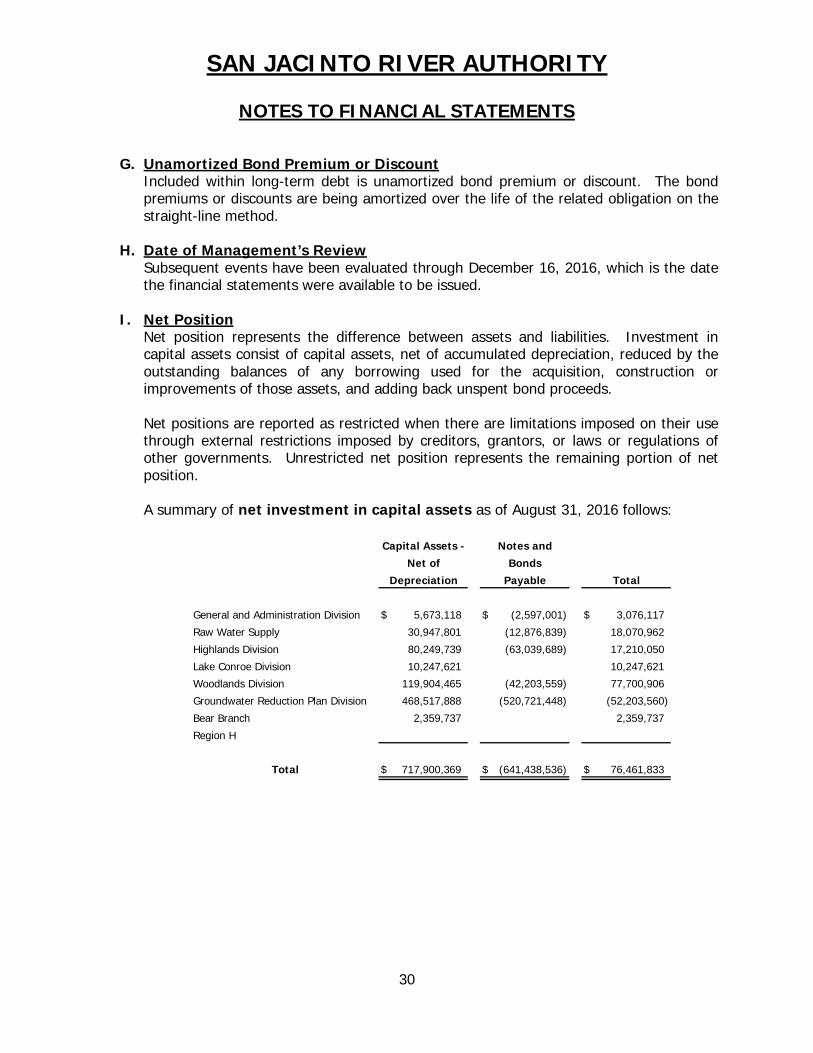
I. Net Position
Net position represents the difference between assets and liabilities. Investment in capital assets consist of capital assets, net of accumulated depreciation, reduced by the outstanding balances of any borrowing used for the acquisition, construction or improvements of those assets, and adding back unspent bond proceeds. Net positions are reported as restricted when there are limitations imposed on their use through external restrictions imposed by creditors, grantors, or laws or regulations of other governments. Unrestricted net position represents the remaining portion of net position. A summary of net investment in capital assets as of August 31, 2016 follows:
General and Administration Division $ 5,673,118 $ (2,597,001) $ 3,076,117
Raw Water Supply 30,947,801 (12,876,839) 18,070,962
Highlands Division 80,249,739 (63,039,689) 17,210,050
Lake Conroe Division 10,247,621 10,247,621
Woodlands Division 119,904,465 (42,203,559) 77,700,906
Groundwater Reduction Plan Division 468,517,888 (520,721,448) (52,203,560)
Bear Branch 2,359,737 2,359,737
Region H
$ 717,900,369 $ (641,438,536) $ 76,461,833Total
Depreciation Payable Total
Capital Assets - Notes and
Net of Bonds
SAN JACINTO RIVER AUTHORITY
NOTES TO FINANCIAL STATEMENTS
31
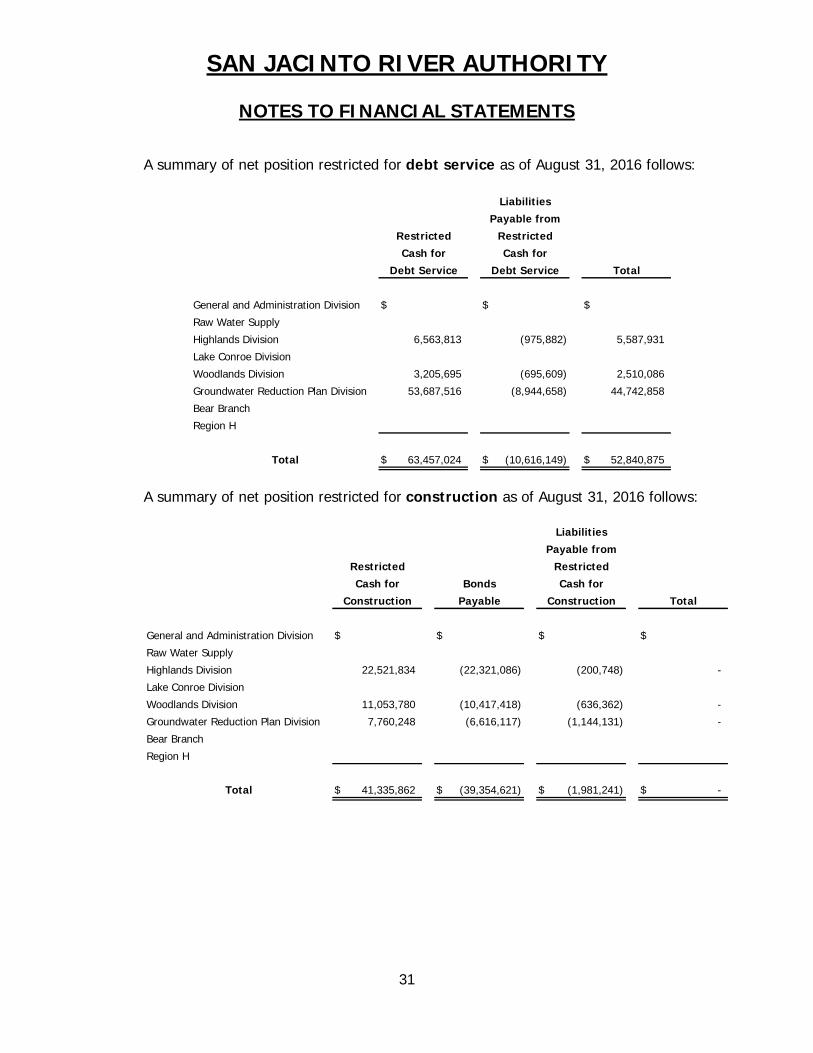
A summary of net position restricted for debt service as of August 31, 2016 follows:
General and Administration Division $ $ $
Raw Water Supply
Highlands Division 6,563,813 (975,882) 5,587,931
Lake Conroe Division
Woodlands Division 3,205,695 (695,609) 2,510,086
Groundwater Reduction Plan Division 53,687,516 (8,944,658) 44,742,858
Bear Branch
Region H
$ 63,457,024 $ (10,616,149) $ 52,840,875
Liabilities
Payable from
Total
Debt Service Debt Service Total
Restricted Restricted
Cash for Cash for
A summary of net position restricted for construction as of August 31, 2016 follows:
General and Administration Division $ $ $ $
Raw Water Supply
Highlands Division 22,521,834 (22,321,086) (200,748) -
Lake Conroe Division
Woodlands Division 11,053,780 (10,417,418) (636,362) -
Groundwater Reduction Plan Division 7,760,248 (6,616,117) (1,144,131) -
Bear Branch
Region H
$ 41,335,862 $ (39,354,621) $ (1,981,241) $ -
Bonds
Payable
Liabilities
Payable from
Total
Construction Construction Total
Restricted Restricted
Cash for Cash for
SAN JACINTO RIVER AUTHORITY
NOTES TO FINANCIAL STATEMENTS
32
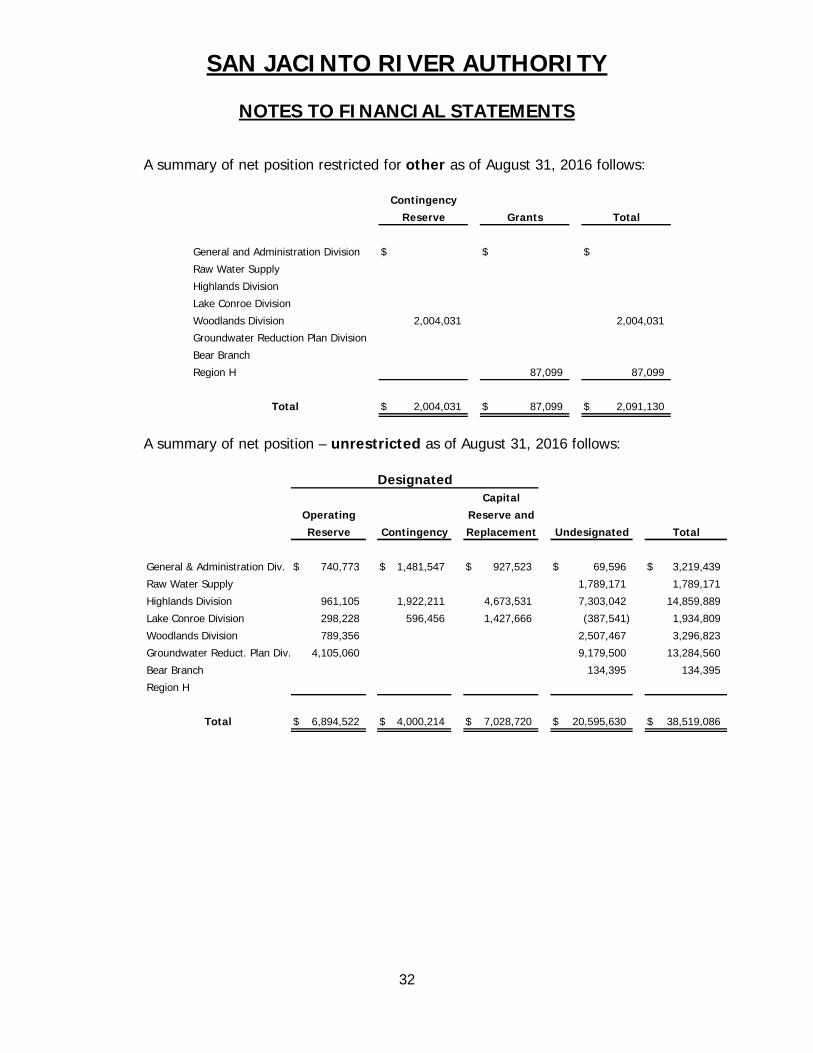
A summary of net position restricted for other as of August 31, 2016 follows:
General and Administration Division $ $ $
Raw Water Supply
Highlands Division
Lake Conroe Division
Woodlands Division 2,004,031 2,004,031
Groundwater Reduction Plan Division
Bear Branch
Region H 87,099 87,099
$ 2,004,031 $ 87,099 $ 2,091,130
Total
Contingency
Grants
Total
Reserve
A summary of net position – unrestricted as of August 31, 2016 follows:
General & Administration Div. $ 740,773 $ 1,481,547 $ 927,523 $ 69,596 $ 3,219,439
Raw Water Supply 1,789,171 1,789,171
Highlands Division 961,105 1,922,211 4,673,531 7,303,042 14,859,889
Lake Conroe Division 298,228 596,456 1,427,666 (387,541) 1,934,809
Woodlands Division 789,356 2,507,467 3,296,823
Groundwater Reduct. Plan Div. 4,105,060 9,179,500 13,284,560
Bear Branch 134,395 134,395
Region H
$ 6,894,522 $ 4,000,214 $ 7,028,720 $ 20,595,630 $ 38,519,086
Designated
Total
Undesignated Total
Operating
Reserve
Reserve and
ReplacementContingency
Capital
SAN JACINTO RIVER AUTHORITY
NOTES TO FINANCIAL STATEMENTS
33
NOTE 2 – CASH AND CASH EQUIVALENTS AND INVESTMENTS
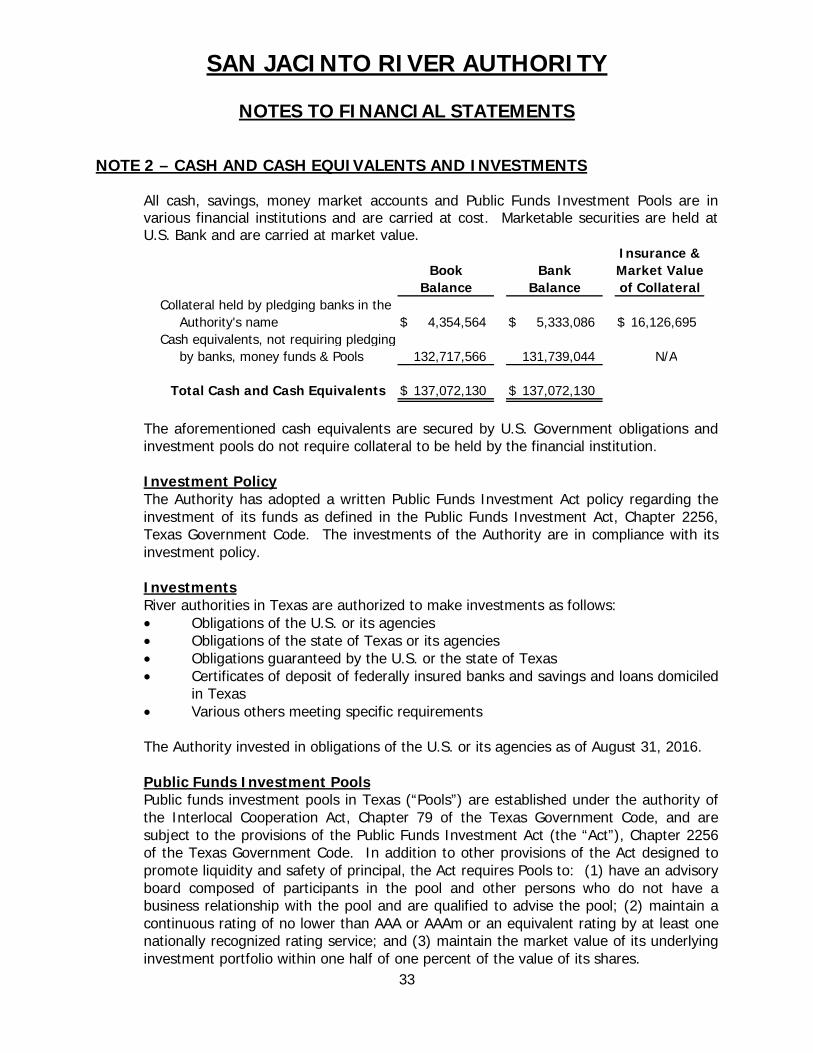
All cash, savings, money market accounts and Public Funds Investment Pools are in various financial institutions and are carried at cost. Marketable securities are held at U.S. Bank and are carried at market value.
Collateral held by pledging banks in theAuthority's name $ 4,354,564 $ 5,333,086 $ 16,126,695
Cash equivalents, not requiring pledgingby banks, money funds & Pools 132,717,566 131,739,044 N/A
$ 137,072,130 $ 137,072,130
Market Valueof Collateral
Insurance &
Total Cash and Cash Equivalents
BookBalance
BankBalance
The aforementioned cash equivalents are secured by U.S. Government obligations and investment pools do not require collateral to be held by the financial institution. Investment Policy The Authority has adopted a written Public Funds Investment Act policy regarding the investment of its funds as defined in the Public Funds Investment Act, Chapter 2256, Texas Government Code. The investments of the Authority are in compliance with its investment policy. Investments River authorities in Texas are authorized to make investments as follows: Obligations of the U.S. or its agencies Obligations of the state of Texas or its agencies Obligations guaranteed by the U.S. or the state of Texas Certificates of deposit of federally insured banks and savings and loans domiciled
in Texas Various others meeting specific requirements
The Authority invested in obligations of the U.S. or its agencies as of August 31, 2016. Public Funds Investment Pools Public funds investment pools in Texas (“Pools”) are established under the authority of the Interlocal Cooperation Act, Chapter 79 of the Texas Government Code, and are subject to the provisions of the Public Funds Investment Act (the “Act”), Chapter 2256 of the Texas Government Code. In addition to other provisions of the Act designed to promote liquidity and safety of principal, the Act requires Pools to: (1) have an advisory board composed of participants in the pool and other persons who do not have a business relationship with the pool and are qualified to advise the pool; (2) maintain a continuous rating of no lower than AAA or AAAm or an equivalent rating by at least one nationally recognized rating service; and (3) maintain the market value of its underlying investment portfolio within one half of one percent of the value of its shares.
SAN JACINTO RIVER AUTHORITY
NOTES TO FINANCIAL STATEMENTS
34
The Authority has been authorized by the Board of Directors to invest in the Pools. In accordance with Governmental Accounting Standards Board (“GASB”) Statement No. 79, investment pools use amortized cost (which excludes unrealized gains and losses) to compute share price. An external investment pool qualifies for amortized cost reporting if it transacts with its participants at a stable net asset value per share and meets various portfolio maturity, quality, diversification liquidity and pricing requirements. Investments in pools are deemed to have a weighted average maturity of one day. At August 31, 2016, the Authority participated in TexPool ($98,082,304) and TexStar ($4,418,873). Interest Rate Risk In accordance with its investment policy, the Authority manages its exposure to declines in fair market values by limiting the weighted average maturity of its investment portfolio to less than two years, in order to meet cash requirements for ongoing operation. The Authority’s investments in the state investment pools via TexPool and TexStar were rated AAAm by Standard and Poor’s. Credit Risk – Investments In accordance with its investment policy, the Authority minimized credit risk losses due to default of a security issuer or backer, by limiting investments to the safest types of securities.
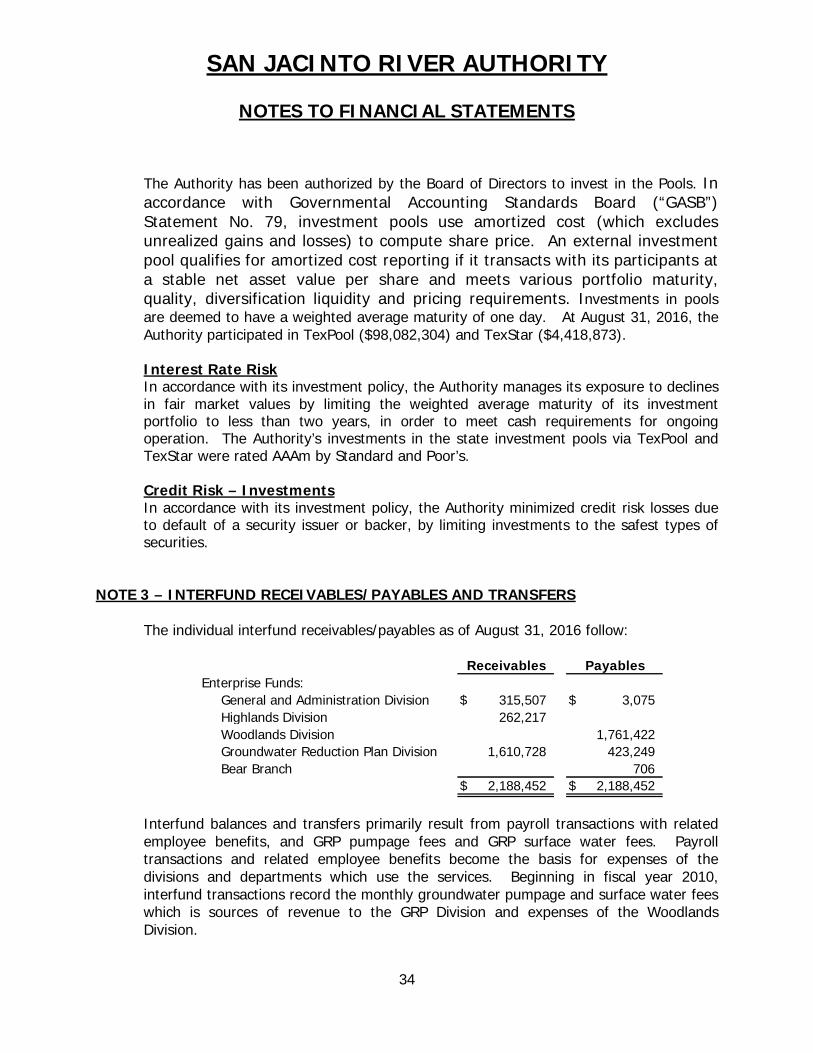
NOTE 3 – INTERFUND RECEIVABLES/PAYABLES AND TRANSFERS
The individual interfund receivables/payables as of August 31, 2016 follow:
Enterprise Funds:General and Administration Division $ 315,507 $ 3,075Highlands Division 262,217Woodlands Division 1,761,422Groundwater Reduction Plan Division 1,610,728 423,249Bear Branch 706
$ 2,188,452 $ 2,188,452
Receivables Payables
Interfund balances and transfers primarily result from payroll transactions with related employee benefits, and GRP pumpage fees and GRP surface water fees. Payroll transactions and related employee benefits become the basis for expenses of the divisions and departments which use the services. Beginning in fiscal year 2010, interfund transactions record the monthly groundwater pumpage and surface water fees which is sources of revenue to the GRP Division and expenses of the Woodlands Division.
SAN JACINTO RIVER AUTHORITY
NOTES TO FINANCIAL STATEMENTS
35
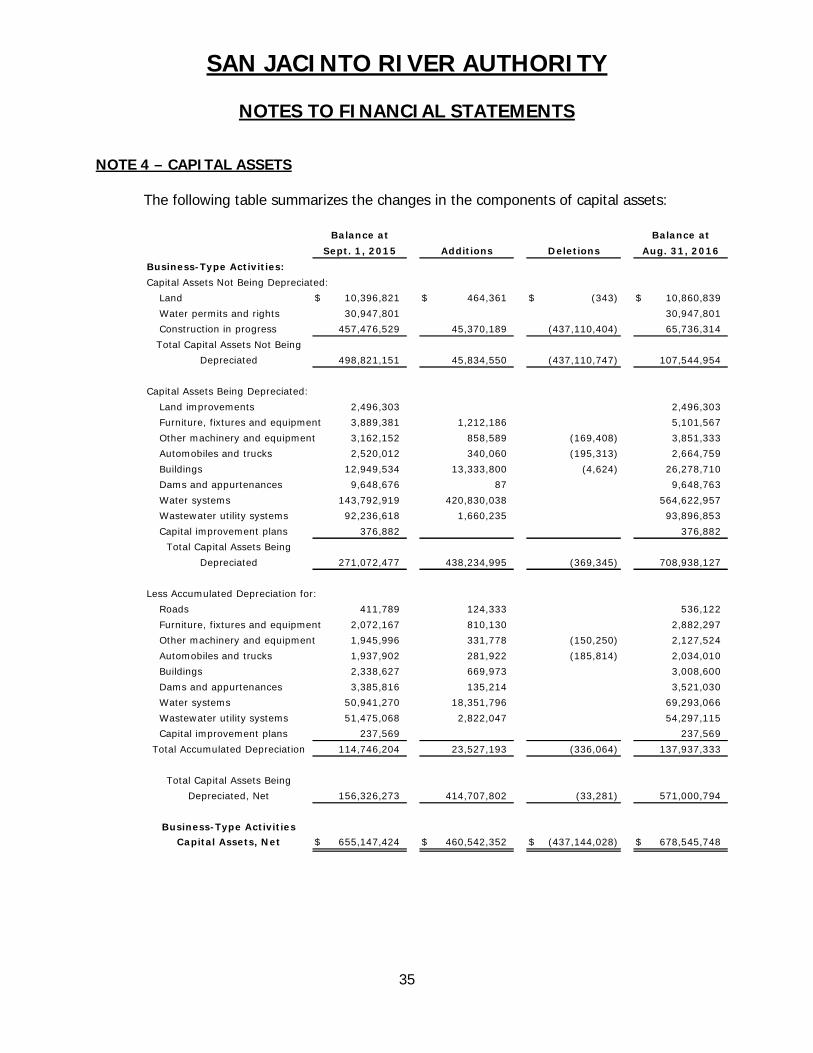
NOTE 4 – CAPITAL ASSETS
The following table summarizes the changes in the components of capital assets:
Business-Type Activities:
Capital Assets Not Being Depreciated:
Land $ 10,396,821 $ 464,361 $ (343) $ 10,860,839
Water permits and rights 30,947,801 30,947,801
Construction in progress 457,476,529 45,370,189 (437,110,404) 65,736,314
498,821,151 45,834,550 (437,110,747) 107,544,954
Capital Assets Being Depreciated:
Land improvements 2,496,303 2,496,303
Furniture, fixtures and equipment 3,889,381 1,212,186 5,101,567
Other machinery and equipment 3,162,152 858,589 (169,408) 3,851,333
Automobiles and trucks 2,520,012 340,060 (195,313) 2,664,759
Buildings 12,949,534 13,333,800 (4,624) 26,278,710
Dams and appurtenances 9,648,676 87 9,648,763
Water systems 143,792,919 420,830,038 564,622,957
Wastewater utility systems 92,236,618 1,660,235 93,896,853
Capital improvement plans 376,882 376,882
271,072,477 438,234,995 (369,345) 708,938,127
Less Accumulated Depreciation for:
Roads 411,789 124,333 536,122
Furniture, fixtures and equipment 2,072,167 810,130 2,882,297
Other machinery and equipment 1,945,996 331,778 (150,250) 2,127,524
Automobiles and trucks 1,937,902 281,922 (185,814) 2,034,010
Buildings 2,338,627 669,973 3,008,600
Dams and appurtenances 3,385,816 135,214 3,521,030
Water systems 50,941,270 18,351,796 69,293,066
Wastewater utility systems 51,475,068 2,822,047 54,297,115
Capital improvement plans 237,569 237,569
114,746,204 23,527,193 (336,064) 137,937,333
156,326,273 414,707,802 (33,281) 571,000,794
$ 655,147,424 $ 460,542,352 $ (437,144,028) $ 678,545,748
Balance at
Aug. 31, 2016
Balance at
Additions
Total Capital Assets Not Being
Depreciated
Business-Type ActivitiesCapital Assets, Net
Sept. 1, 2015
Total Capital Assets Being
Depreciated
Deletions
Total Accumulated Depreciation
Total Capital Assets Being
Depreciated, Net
SAN JACINTO RIVER AUTHORITY
NOTES TO FINANCIAL STATEMENTS
36
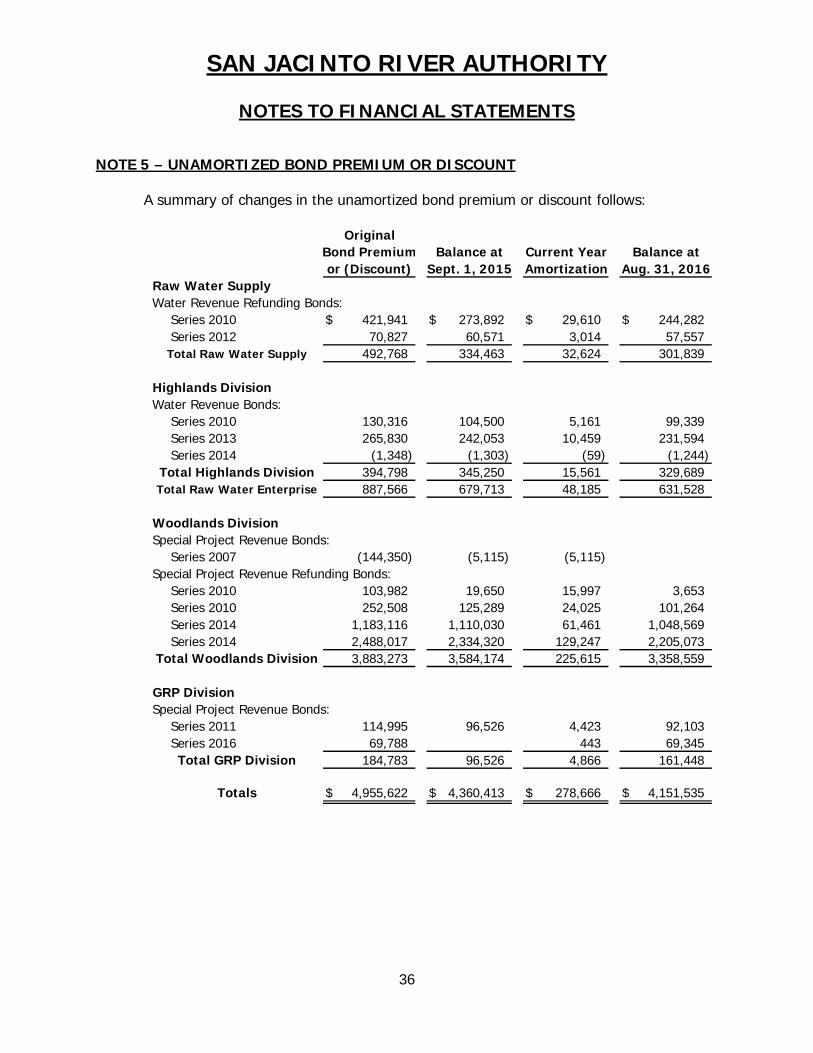
NOTE 5 – UNAMORTIZED BOND PREMIUM OR DISCOUNT
A summary of changes in the unamortized bond premium or discount follows:
Raw Water SupplyWater Revenue Refunding Bonds:
Series 2010 $ 421,941 $ 273,892 $ 29,610 $ 244,282Series 2012 70,827 60,571 3,014 57,557
492,768 334,463 32,624 301,839
Highlands DivisionWater Revenue Bonds:
Series 2010 130,316 104,500 5,161 99,339Series 2013 265,830 242,053 10,459 231,594Series 2014 (1,348) (1,303) (59) (1,244)
394,798 345,250 15,561 329,689887,566 679,713 48,185 631,528
Woodlands DivisionSpecial Project Revenue Bonds:
Series 2007 (144,350) (5,115) (5,115)Special Project Revenue Refunding Bonds:
Series 2010 103,982 19,650 15,997 3,653Series 2010 252,508 125,289 24,025 101,264Series 2014 1,183,116 1,110,030 61,461 1,048,569Series 2014 2,488,017 2,334,320 129,247 2,205,073
3,883,273 3,584,174 225,615 3,358,559
GRP DivisionSpecial Project Revenue Bonds:
Series 2011 114,995 96,526 4,423 92,103Series 2016 69,788 443 69,345
184,783 96,526 4,866 161,448
$ 4,955,622 $ 4,360,413 $ 278,666 $ 4,151,535
Original
or (Discount) Sept. 1, 2015
Totals
Total GRP Division
Total Woodlands Division
Total Highlands DivisionTotal Raw Water Enterprise
Balance atAug. 31, 2016
Total Raw Water Supply
AmortizationBond Premium Balance at Current Year
SAN JACINTO RIVER AUTHORITY
NOTES TO FINANCIAL STATEMENTS
37
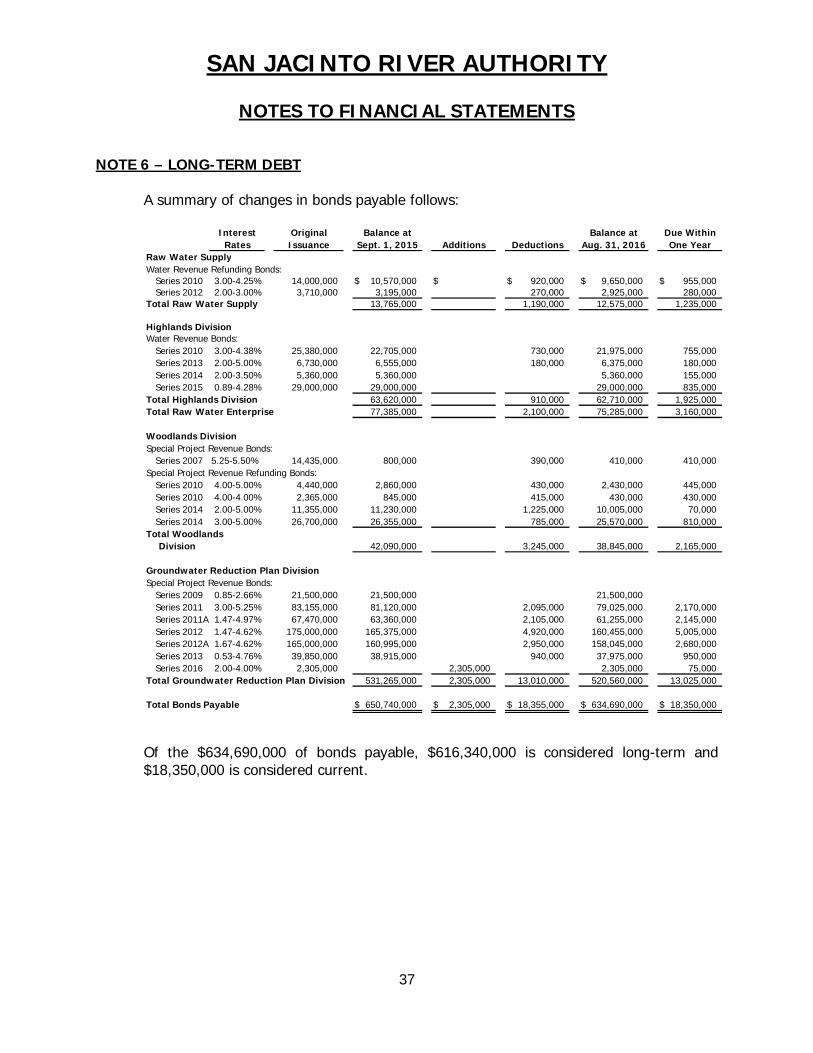
NOTE 6 – LONG-TERM DEBT
A summary of changes in bonds payable follows:
InterestRates
Raw Water SupplyWater Revenue Refunding Bonds:
Series 2010 3.00-4.25% 14,000,000 $ 10,570,000 $ $ 920,000 $ 9,650,000 $ 955,000Series 2012 2.00-3.00% 3,710,000 3,195,000 270,000 2,925,000 280,000
Total Raw Water Supply 13,765,000 1,190,000 12,575,000 1,235,000
Highlands DivisionWater Revenue Bonds:
Series 2010 3.00-4.38% 25,380,000 22,705,000 730,000 21,975,000 755,000Series 2013 2.00-5.00% 6,730,000 6,555,000 180,000 6,375,000 180,000Series 2014 2.00-3.50% 5,360,000 5,360,000 5,360,000 155,000Series 2015 0.89-4.28% 29,000,000 29,000,000 29,000,000 835,000
Total Highlands Division 63,620,000 910,000 62,710,000 1,925,000Total Raw Water Enterprise 77,385,000 2,100,000 75,285,000 3,160,000
Woodlands DivisionSpecial Project Revenue Bonds:
Series 2007 5.25-5.50% 14,435,000 800,000 390,000 410,000 410,000Special Project Revenue Refunding Bonds:
Series 2010 4.00-5.00% 4,440,000 2,860,000 430,000 2,430,000 445,000Series 2010 4.00-4.00% 2,365,000 845,000 415,000 430,000 430,000Series 2014 2.00-5.00% 11,355,000 11,230,000 1,225,000 10,005,000 70,000Series 2014 3.00-5.00% 26,700,000 26,355,000 785,000 25,570,000 810,000
Total Woodlands42,090,000 3,245,000 38,845,000 2,165,000
Groundwater Reduction Plan DivisionSpecial Project Revenue Bonds:
Series 2009 0.85-2.66% 21,500,000 21,500,000 21,500,000Series 2011 3.00-5.25% 83,155,000 81,120,000 2,095,000 79,025,000 2,170,000Series 2011A 1.47-4.97% 67,470,000 63,360,000 2,105,000 61,255,000 2,145,000Series 2012 1.47-4.62% 175,000,000 165,375,000 4,920,000 160,455,000 5,005,000Series 2012A 1.67-4.62% 165,000,000 160,995,000 2,950,000 158,045,000 2,680,000Series 2013 0.53-4.76% 39,850,000 38,915,000 940,000 37,975,000 950,000Series 2016 2.00-4.00% 2,305,000 2,305,000 2,305,000 75,000
Total Groundwater Reduction Plan Division 531,265,000 2,305,000 13,010,000 520,560,000 13,025,000
Total Bonds Payable $ 650,740,000 $ 2,305,000 $ 18,355,000 $ 634,690,000 $ 18,350,000
Division
Additions DeductionsBalance at
Aug. 31, 2016OriginalIssuance
Balance at Due WithinOne YearSept. 1, 2015
Of the $634,690,000 of bonds payable, $616,340,000 is considered long-term and $18,350,000 is considered current.
SAN JACINTO RIVER AUTHORITY
NOTES TO FINANCIAL STATEMENTS
38
The Water Revenue Bonds within Raw Water Enterprise resolution requires that the gross revenues of the Authority, after deducting maintenance and operating expenses, shall be transferred in the following order: Debt Service Fund – No later than the fifth day preceding each maturity date, an
amount sufficient to pay principal and interest on the outstanding Water Revenue Bonds.
Debt Service Reserve Fund – On or before the fifth day of each month, such amounts in equal monthly installments, not less than one-sixtieth of the average annual sum payable in respect of the principal and interest scheduled to become due on the outstanding Water Revenue Bonds at the time of such computation.
The GRP Division Special Project Revenue Bond resolutions require that the gross revenues of the GRP, after deducting maintenance and operating expenses, shall be transferred in the following order: Debt Service Fund – No later than the fifth day preceding each maturity date, an
amount sufficient to pay principal and interest on the outstanding Special Project Revenue Bonds in such fiscal year.
Debt Service Reserve Fund – On a monthly basis, in equal monthly installments, an amount not less than one-sixtieth of the average annual sum payable in respect of the principal and interest scheduled to become due on the outstanding Special Project Revenue Bonds at the time of such computation.
The Woodlands Division Special Project Revenue Bond resolutions require that capacity charges be assessed, levied and made to and collected from the customers pursuant to the agreement on a monthly basis in an amount not less than one-twelfth of the scheduled amount of principal and interest to become due on the outstanding Special Project Revenue Bonds in such fiscal year. Management believes the Authority is in compliance with the covenants of all bond issues.
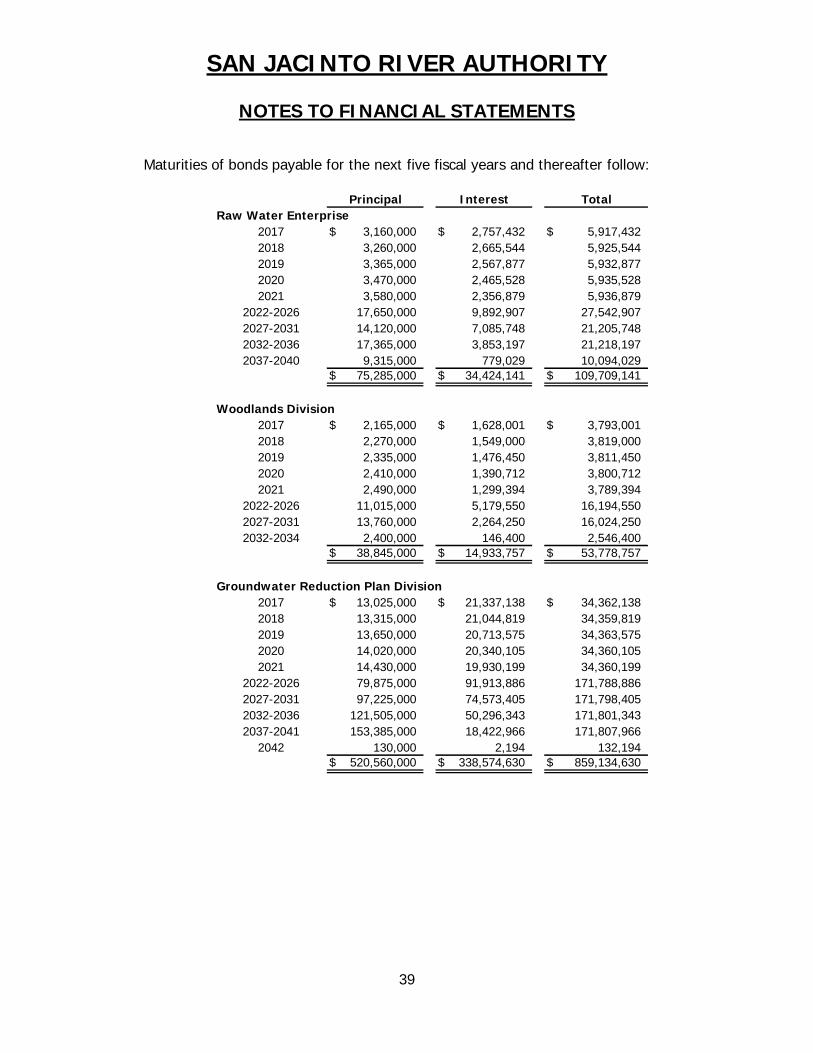
SAN JACINTO RIVER AUTHORITY
NOTES TO FINANCIAL STATEMENTS
39
Maturities of bonds payable for the next five fiscal years and thereafter follow:
Raw Water Enterprise2017 $ 3,160,000 $ 2,757,432 $ 5,917,4322018 3,260,000 2,665,544 5,925,5442019 3,365,000 2,567,877 5,932,8772020 3,470,000 2,465,528 5,935,5282021 3,580,000 2,356,879 5,936,879
2022-2026 17,650,000 9,892,907 27,542,9072027-2031 14,120,000 7,085,748 21,205,7482032-2036 17,365,000 3,853,197 21,218,1972037-2040 9,315,000 779,029 10,094,029
$ 75,285,000 $ 34,424,141 $ 109,709,141
Woodlands Division2017 $ 2,165,000 $ 1,628,001 $ 3,793,0012018 2,270,000 1,549,000 3,819,0002019 2,335,000 1,476,450 3,811,4502020 2,410,000 1,390,712 3,800,7122021 2,490,000 1,299,394 3,789,394
2022-2026 11,015,000 5,179,550 16,194,5502027-2031 13,760,000 2,264,250 16,024,2502032-2034 2,400,000 146,400 2,546,400
$ 38,845,000 $ 14,933,757 $ 53,778,757
Groundwater Reduction Plan Division2017 $ 13,025,000 $ 21,337,138 $ 34,362,1382018 13,315,000 21,044,819 34,359,8192019 13,650,000 20,713,575 34,363,5752020 14,020,000 20,340,105 34,360,1052021 14,430,000 19,930,199 34,360,199
2022-2026 79,875,000 91,913,886 171,788,8862027-2031 97,225,000 74,573,405 171,798,4052032-2036 121,505,000 50,296,343 171,801,3432037-2041 153,385,000 18,422,966 171,807,966
2042 130,000 2,194 132,194$ 520,560,000 $ 338,574,630 $ 859,134,630
Principal Interest Total
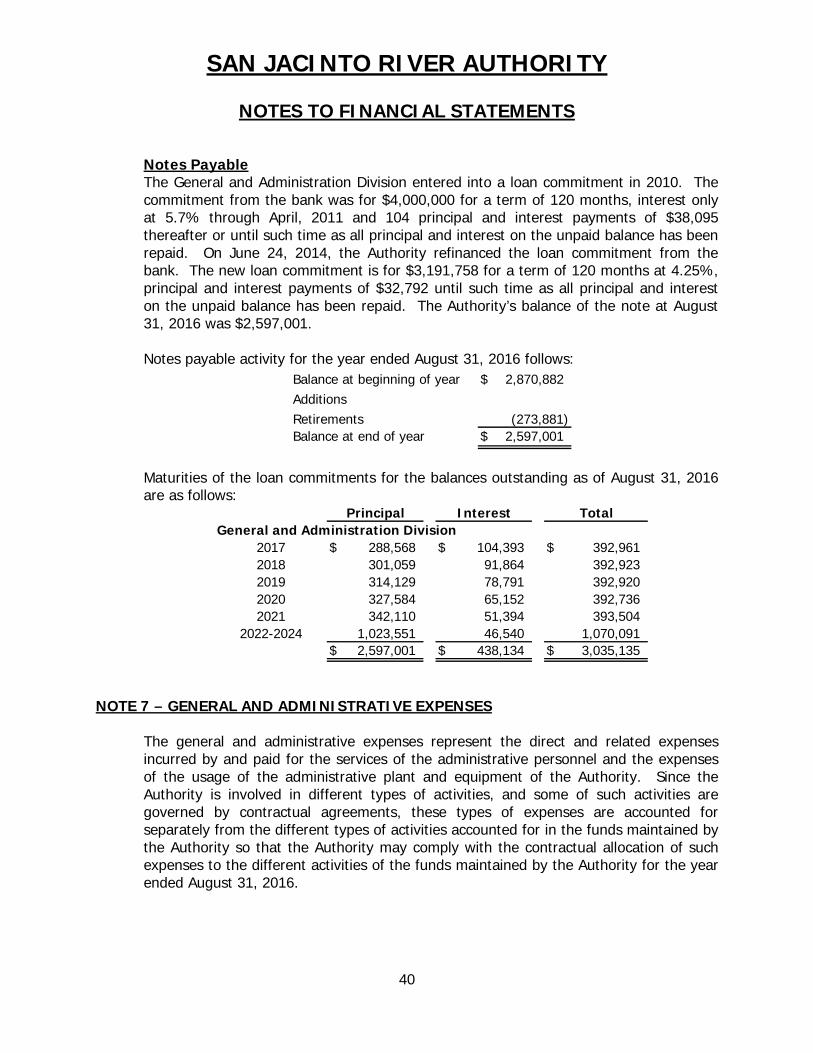
SAN JACINTO RIVER AUTHORITY
NOTES TO FINANCIAL STATEMENTS
40
Notes Payable The General and Administration Division entered into a loan commitment in 2010. The commitment from the bank was for $4,000,000 for a term of 120 months, interest only at 5.7% through April, 2011 and 104 principal and interest payments of $38,095 thereafter or until such time as all principal and interest on the unpaid balance has been repaid. On June 24, 2014, the Authority refinanced the loan commitment from the bank. The new loan commitment is for $3,191,758 for a term of 120 months at 4.25%, principal and interest payments of $32,792 until such time as all principal and interest on the unpaid balance has been repaid. The Authority’s balance of the note at August 31, 2016 was $2,597,001.
Notes payable activity for the year ended August 31, 2016 follows: Balance at beginning of year $ 2,870,882AdditionsRetirements (273,881)Balance at end of year $ 2,597,001
Maturities of the loan commitments for the balances outstanding as of August 31, 2016 are as follows:
General and Administration Division2017 $ 288,568 $ 104,393 $ 392,9612018 301,059 91,864 392,9232019 314,129 78,791 392,9202020 327,584 65,152 392,7362021 342,110 51,394 393,504
2022-2024 1,023,551 46,540 1,070,091$ 2,597,001 $ 438,134 $ 3,035,135
Principal Interest Total
NOTE 7 – GENERAL AND ADMINISTRATIVE EXPENSES
The general and administrative expenses represent the direct and related expenses incurred by and paid for the services of the administrative personnel and the expenses of the usage of the administrative plant and equipment of the Authority. Since the Authority is involved in different types of activities, and some of such activities are governed by contractual agreements, these types of expenses are accounted for separately from the different types of activities accounted for in the funds maintained by the Authority so that the Authority may comply with the contractual allocation of such expenses to the different activities of the funds maintained by the Authority for the year ended August 31, 2016.
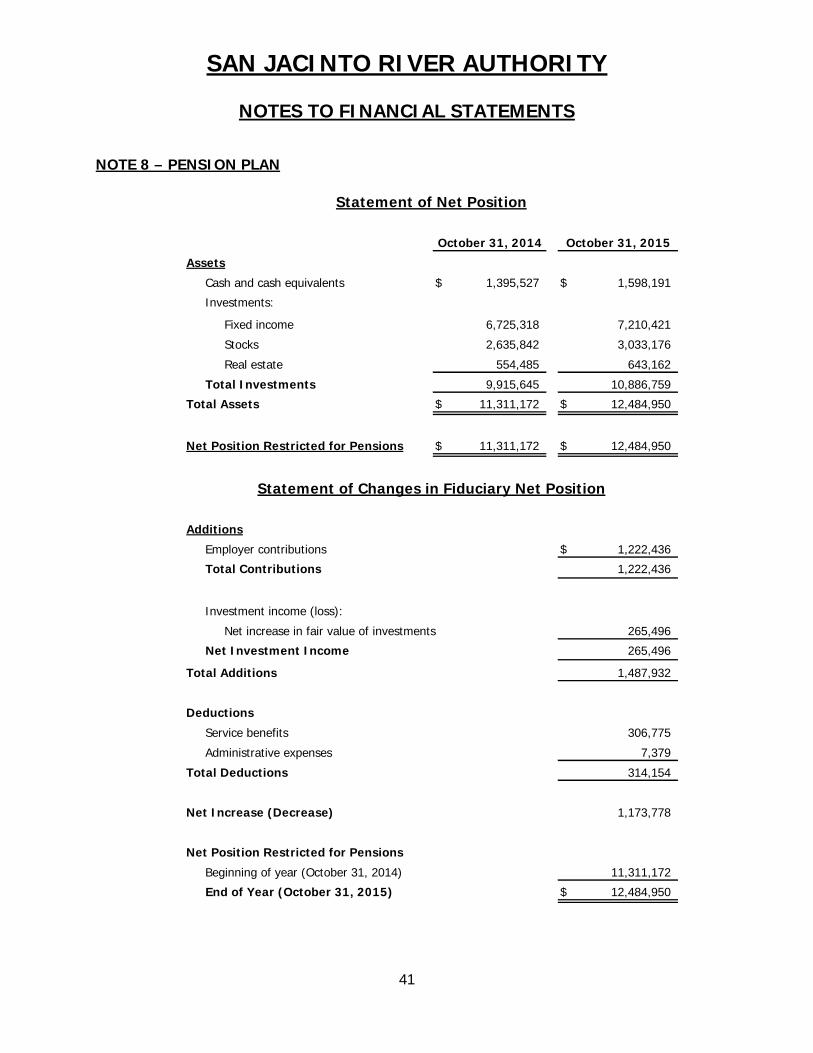
SAN JACINTO RIVER AUTHORITY
NOTES TO FINANCIAL STATEMENTS
41
NOTE 8 – PENSION PLAN
Assets
Cash and cash equivalents $ 1,395,527 $ 1,598,191
Investments:
Fixed income 6,725,318 7,210,421
Stocks 2,635,842 3,033,176
Real estate 554,485 643,162
Total Investments 9,915,645 10,886,759
Total Assets $ 11,311,172 $ 12,484,950
Net Position Restricted for Pensions $ 11,311,172 $ 12,484,950
Statement of Net Position
October 31, 2014 October 31, 2015
Additions
Employer contributions $ 1,222,436
Total Contributions 1,222,436
Investment income (loss):
Net increase in fair value of investments 265,496
Net Investment Income 265,496
Total Additions 1,487,932
Deductions
Service benefits 306,775
Administrative expenses 7,379
Total Deductions 314,154
Net Increase (Decrease) 1,173,778
Net Position Restricted for Pensions
Beginning of year (October 31, 2014) 11,311,172
End of Year (October 31, 2015) $ 12,484,950
Statement of Changes in Fiduciary Net Position
SAN JACINTO RIVER AUTHORITY
NOTES TO FINANCIAL STATEMENTS
42
Summary of Significant Accounting Policies Method used to value investments. Investments are reported at fair value.
Pensions. For purposes of measuring the net pension liability, deferred outflows of resources and deferred inflows of resources related to pensions, and pension expense, information about the fiduciary net position of the San Jacinto River Authority Pension Plan and additions to/deductions from the San Jacinto River Authority Pension Plan’s fiduciary net position have been determined on the same basis as they are reported by the San Jacinto River Authority. For this purpose, benefit payments are recognized when due and payable in accordance with the benefit terms. Investments are reported at fair value.
Plan Description Plan Administration. The Authority’s defined benefit pension plan, the San Jacinto River Authority Pension Plan (the “Plan”), provides retirement benefits to plan members and beneficiaries. The Plan is a single employer, noncontributory defined benefit plan. The Plan’s benefit provisions were established and may be amended by the Authority’s Board. The Plan is administered by a trustee for the benefit of the Authority’s employees. The Authority does not have access to, nor can it utilize the assets of the Plan. The Trustee is responsible for making payments to the Authority’s retired employees.
Lincoln National Life and Standard Insurance Co. are the trustees of the Plan. There is no stand alone pension plan report available, but a copy of the actuarial report, prepared by Milliman, is available upon request from the Authority. The Authority has contracted with Alliant Services to evaluate the Authority’s pension plan and make recommendations regarding modernization, cost-control measures, and long-term strategies for retirement offerings.
Benefits Provided. The Plan is available to all active employees hired before August 1, 2016, who have completed one year of service and attained age 21. Normal retirement age is 65. The Plan also provides benefits for early and late retirement. The retirement benefit at normal retirement is equal to 1.00% of average monthly compensation up to a participant’s covered compensation level plus 0.55% of average monthly compensation in excess of the covered compensation level multiplied by the number of years of credited service not to exceed 40 years. The retirement benefit is payable monthly during the life of the retired participant. The Plan also provides death and disability benefits. A member is 100% vested in the accrued benefit upon completion of 5 years of service.
Plan Membership. At November 1, 2014, there were 164 plan members including 121 active members, 22 terminated vested members, and 21 retirees and beneficiaries.
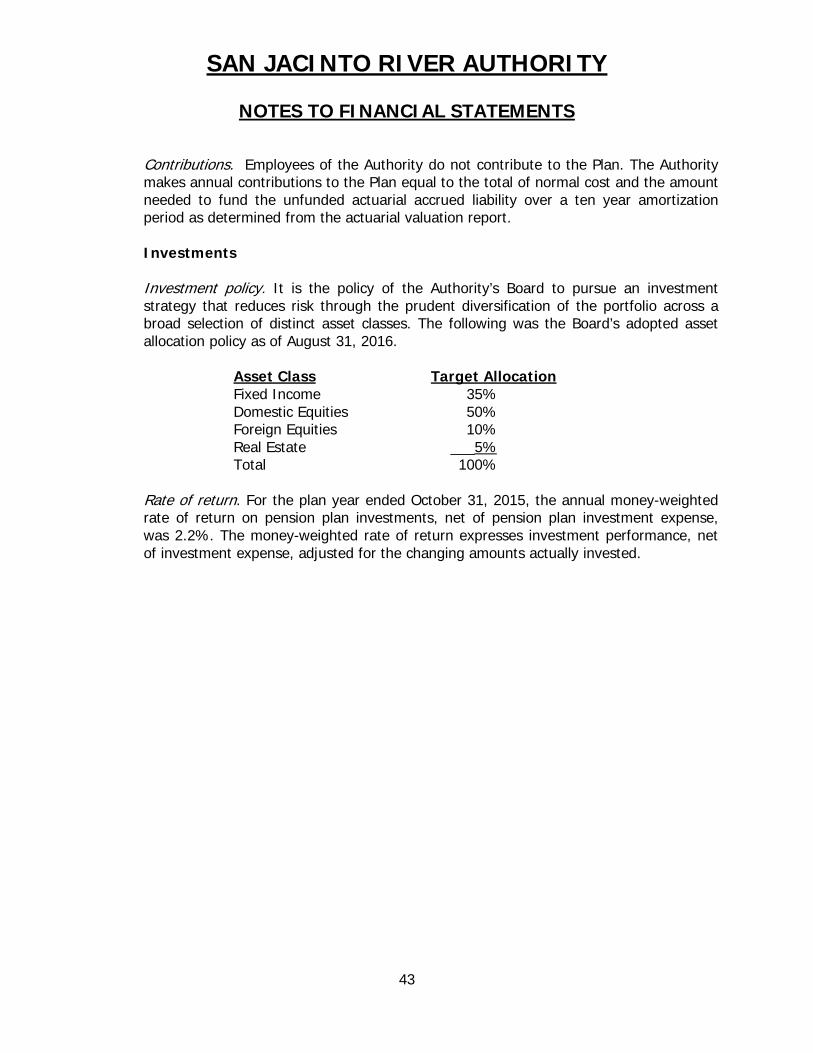
SAN JACINTO RIVER AUTHORITY
NOTES TO FINANCIAL STATEMENTS
43
Contributions. Employees of the Authority do not contribute to the Plan. The Authority makes annual contributions to the Plan equal to the total of normal cost and the amount needed to fund the unfunded actuarial accrued liability over a ten year amortization period as determined from the actuarial valuation report.
Investments
Investment policy. It is the policy of the Authority’s Board to pursue an investment strategy that reduces risk through the prudent diversification of the portfolio across a broad selection of distinct asset classes. The following was the Board’s adopted asset allocation policy as of August 31, 2016.
Asset Class Target Allocation Fixed Income 35% Domestic Equities 50% Foreign Equities 10% Real Estate ___5% Total 100%
Rate of return. For the plan year ended October 31, 2015, the annual money-weighted rate of return on pension plan investments, net of pension plan investment expense, was 2.2%. The money-weighted rate of return expresses investment performance, net of investment expense, adjusted for the changing amounts actually invested.
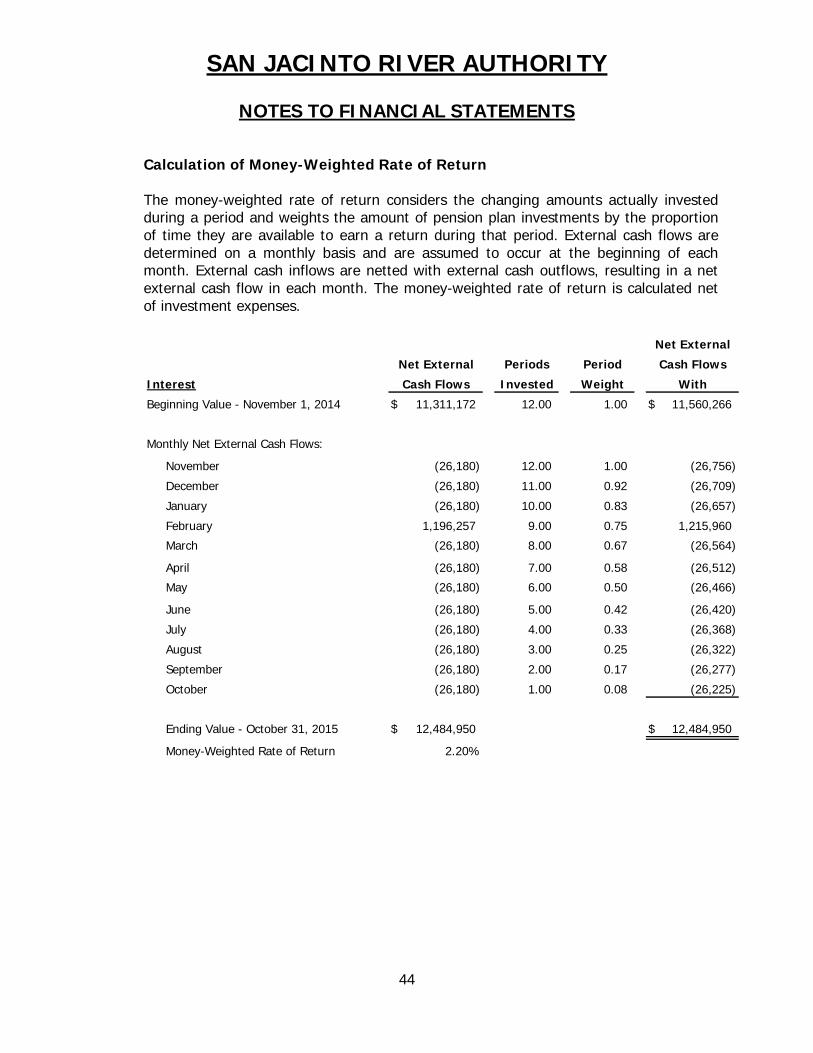
SAN JACINTO RIVER AUTHORITY
NOTES TO FINANCIAL STATEMENTS
44
Calculation of Money-Weighted Rate of Return
The money-weighted rate of return considers the changing amounts actually invested during a period and weights the amount of pension plan investments by the proportion of time they are available to earn a return during that period. External cash flows are determined on a monthly basis and are assumed to occur at the beginning of each month. External cash inflows are netted with external cash outflows, resulting in a net external cash flow in each month. The money-weighted rate of return is calculated net of investment expenses.
Periods Period
Interest Invested Weight
Beginning Value - November 1, 2014 $ 11,311,172 12.00 1.00 $ 11,560,266
Monthly Net External Cash Flows:
November (26,180) 12.00 1.00 (26,756)
December (26,180) 11.00 0.92 (26,709)
January (26,180) 10.00 0.83 (26,657)
February 1,196,257 9.00 0.75 1,215,960
March (26,180) 8.00 0.67 (26,564)
April (26,180) 7.00 0.58 (26,512)
May (26,180) 6.00 0.50 (26,466)
June (26,180) 5.00 0.42 (26,420)
July (26,180) 4.00 0.33 (26,368)
August (26,180) 3.00 0.25 (26,322)
September (26,180) 2.00 0.17 (26,277)
October (26,180) 1.00 0.08 (26,225)
Ending Value - October 31, 2015 $ 12,484,950 $ 12,484,950
Money-Weighted Rate of Return 2.20%
Net External
Cash Flows
With
Net External
Cash Flows
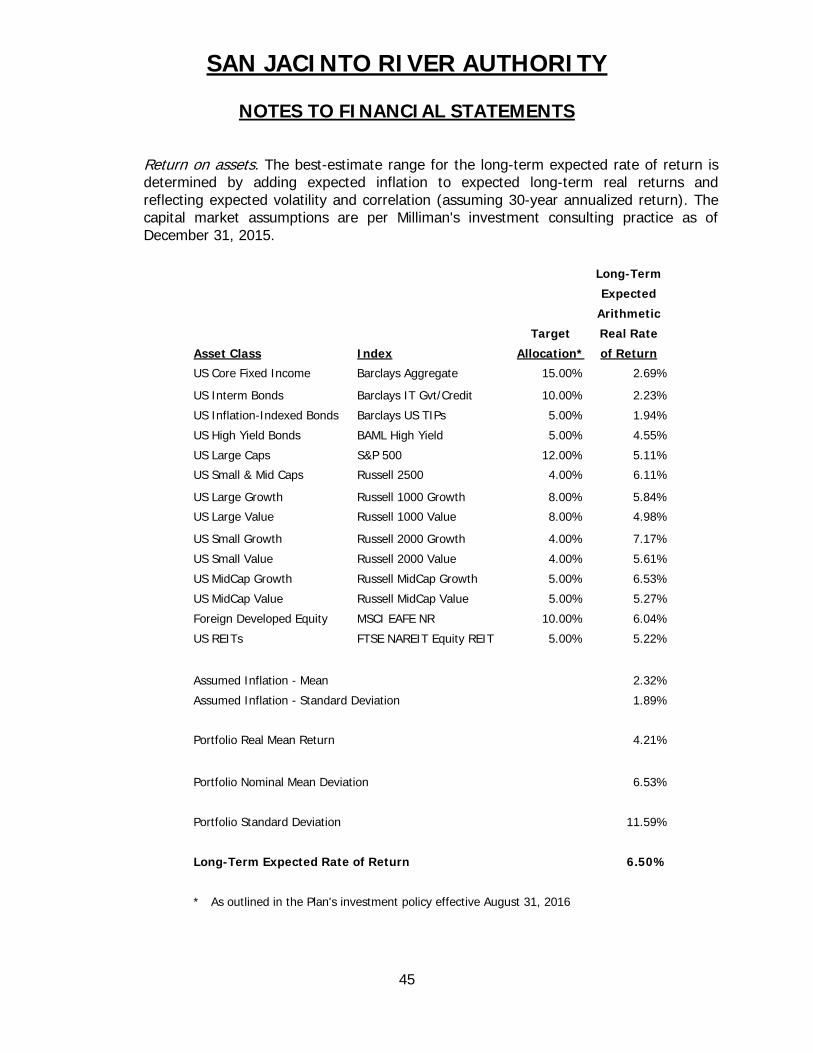
SAN JACINTO RIVER AUTHORITY
NOTES TO FINANCIAL STATEMENTS
45
Return on assets. The best-estimate range for the long-term expected rate of return is determined by adding expected inflation to expected long-term real returns and reflecting expected volatility and correlation (assuming 30-year annualized return). The capital market assumptions are per Milliman's investment consulting practice as of December 31, 2015.
Long-Term
Expected
Arithmetic
Target Real Rate
Asset Class Index Allocation* of Return
US Core Fixed Income Barclays Aggregate 15.00% 2.69%
US Interm Bonds Barclays IT Gvt/Credit 10.00% 2.23%
US Inflation-Indexed Bonds Barclays US TIPs 5.00% 1.94%
US High Yield Bonds BAML High Yield 5.00% 4.55%
US Large Caps S&P 500 12.00% 5.11%
US Small & Mid Caps Russell 2500 4.00% 6.11%
US Large Growth Russell 1000 Growth 8.00% 5.84%
US Large Value Russell 1000 Value 8.00% 4.98%
US Small Growth Russell 2000 Growth 4.00% 7.17%
US Small Value Russell 2000 Value 4.00% 5.61%
US MidCap Growth Russell MidCap Growth 5.00% 6.53%
US MidCap Value Russell MidCap Value 5.00% 5.27%
Foreign Developed Equity MSCI EAFE NR 10.00% 6.04%
US REITs FTSE NAREIT Equity REIT 5.00% 5.22%
Assumed Inflation - Mean 2.32%
Assumed Inflation - Standard Deviation 1.89%
Portfolio Real Mean Return 4.21%
Portfolio Nominal Mean Deviation 6.53%
Portfolio Standard Deviation 11.59%
Long-Term Expected Rate of Return 6.50%
* As outlined in the Plan's investment policy effective August 31, 2016
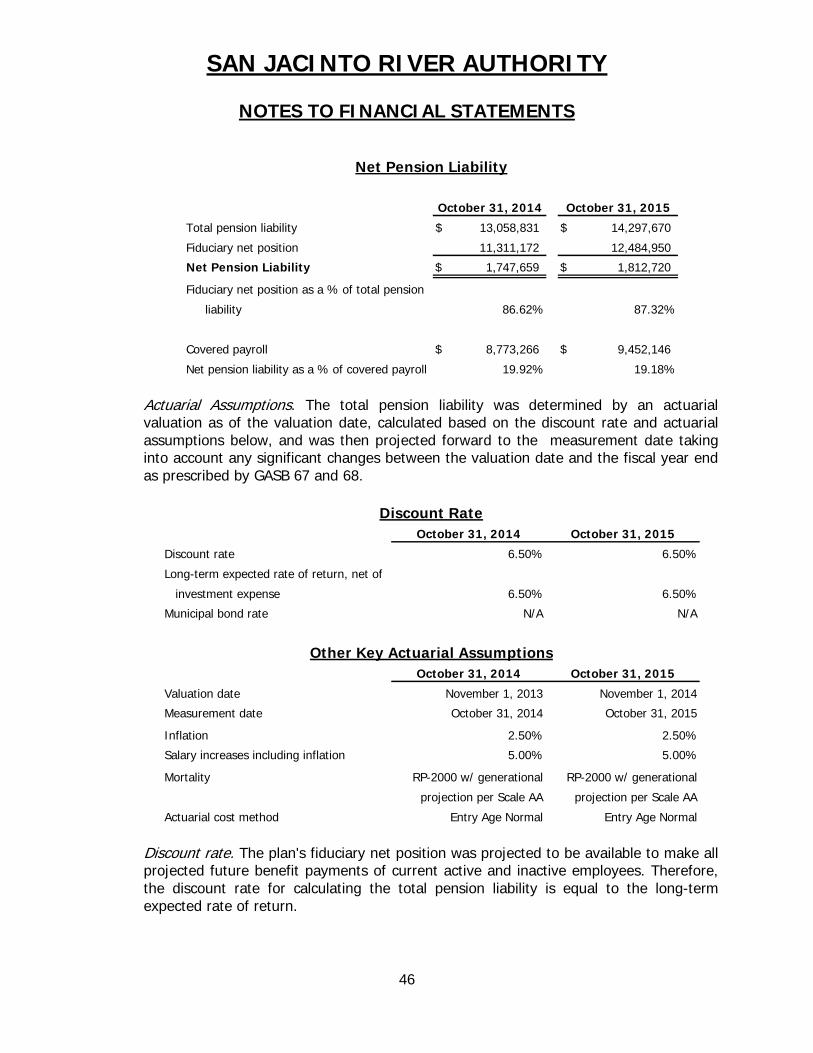
SAN JACINTO RIVER AUTHORITY
NOTES TO FINANCIAL STATEMENTS
46
Total pension liability $ 13,058,831 $ 14,297,670
Fiduciary net position 11,311,172 12,484,950
Net Pension Liability $ 1,747,659 $ 1,812,720
Fiduciary net position as a % of total pension
liability 86.62% 87.32%
Covered payroll $ 8,773,266 $ 9,452,146
Net pension liability as a % of covered payroll 19.92% 19.18%
Net Pension Liability
October 31, 2014 October 31, 2015
Actuarial Assumptions. The total pension liability was determined by an actuarial valuation as of the valuation date, calculated based on the discount rate and actuarial assumptions below, and was then projected forward to the measurement date taking into account any significant changes between the valuation date and the fiscal year end as prescribed by GASB 67 and 68.
October 31, 2014 October 31, 2015
Discount rate 6.50% 6.50%
Long-term expected rate of return, net of
investment expense 6.50% 6.50%
Municipal bond rate N/A N/A
Discount Rate
October 31, 2014 October 31, 2015
Valuation date November 1, 2013 November 1, 2014
Measurement date October 31, 2014 October 31, 2015
Inflation 2.50% 2.50%
Salary increases including inflation 5.00% 5.00%
Mortality RP-2000 w/ generational RP-2000 w/ generational
projection per Scale AA projection per Scale AA
Actuarial cost method Entry Age Normal Entry Age Normal
Other Key Actuarial Assumptions
Discount rate. The plan's fiduciary net position was projected to be available to make all projected future benefit payments of current active and inactive employees. Therefore, the discount rate for calculating the total pension liability is equal to the long-term expected rate of return.
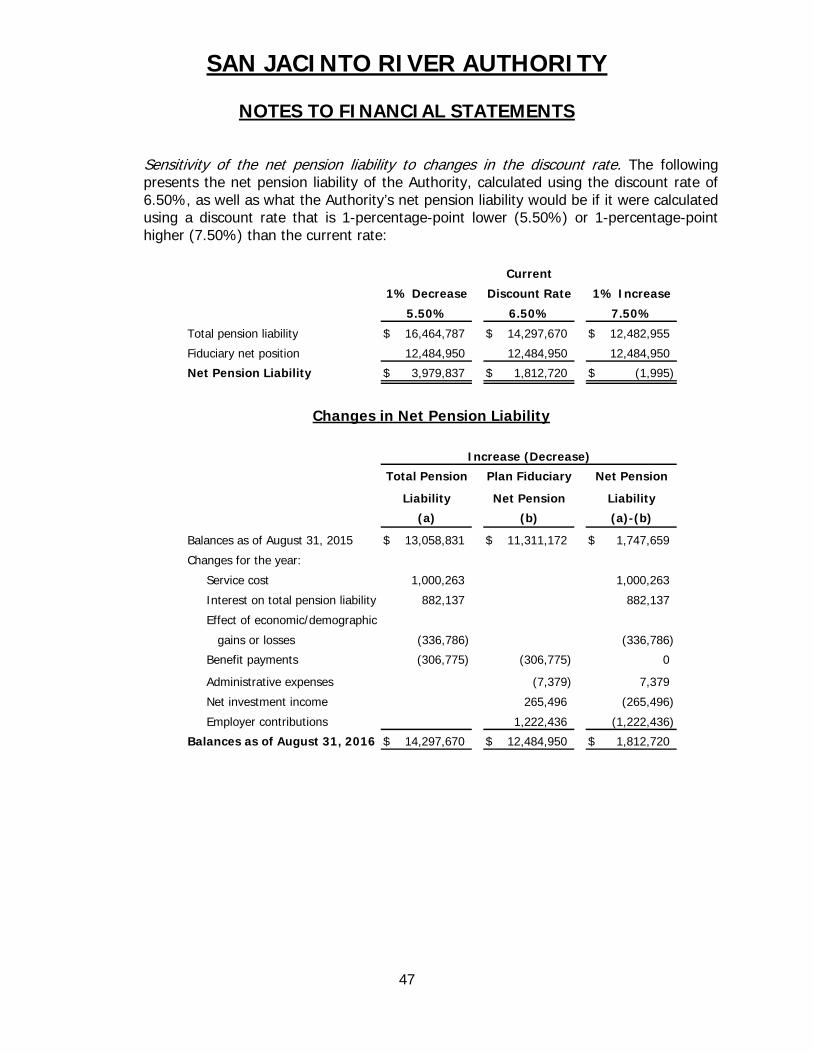
SAN JACINTO RIVER AUTHORITY
NOTES TO FINANCIAL STATEMENTS
47
Sensitivity of the net pension liability to changes in the discount rate. The following presents the net pension liability of the Authority, calculated using the discount rate of 6.50%, as well as what the Authority’s net pension liability would be if it were calculated using a discount rate that is 1-percentage-point lower (5.50%) or 1-percentage-point higher (7.50%) than the current rate:
Total pension liability $ 16,464,787 $ 14,297,670 $ 12,482,955
Fiduciary net position 12,484,950 12,484,950 12,484,950
Net Pension Liability $ 3,979,837 $ 1,812,720 $ (1,995)
1% Decrease
5.50%
Discount Rate
6.50%
1% Increase
7.50%
Current
Balances as of August 31, 2015 $ 13,058,831 $ 11,311,172 $ 1,747,659
Changes for the year:
Service cost 1,000,263 1,000,263
Interest on total pension liability 882,137 882,137
Effect of economic/demographic
gains or losses (336,786) (336,786)
Benefit payments (306,775) (306,775) 0
Administrative expenses (7,379) 7,379
Net investment income 265,496 (265,496)
Employer contributions 1,222,436 (1,222,436)
Balances as of August 31, 2016 $ 14,297,670 $ 12,484,950 $ 1,812,720
Changes in Net Pension Liability
Increase (Decrease)
Total Pension
Liability
(a)
Plan Fiduciary
Net Pension
(b)
Net Pension
Liability
(a)-(b)
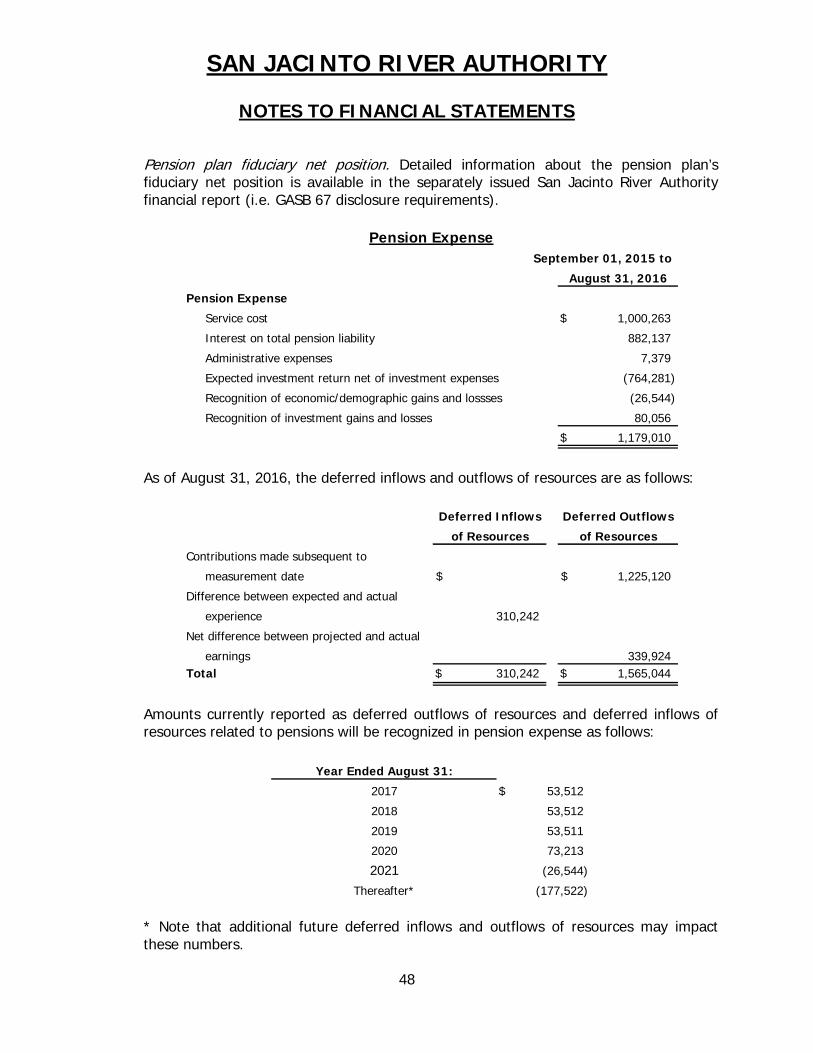
SAN JACINTO RIVER AUTHORITY
NOTES TO FINANCIAL STATEMENTS
48
Pension plan fiduciary net position. Detailed information about the pension plan’s fiduciary net position is available in the separately issued San Jacinto River Authority financial report (i.e. GASB 67 disclosure requirements).
September 01, 2015 to
Pension Expense
Service cost $ 1,000,263
Interest on total pension liability 882,137
Administrative expenses 7,379
Expected investment return net of investment expenses (764,281)
Recognition of economic/demographic gains and lossses (26,544)
Recognition of investment gains and losses 80,056
$ 1,179,010
August 31, 2016
Pension Expense
As of August 31, 2016, the deferred inflows and outflows of resources are as follows:
Contributions made subsequent to
measurement date $ $ 1,225,120
Difference between expected and actual
experience 310,242
Net difference between projected and actual
earnings 339,924Total $ 310,242 $ 1,565,044
Deferred Inflows
of Resources
Deferred Outflows
of Resources
Amounts currently reported as deferred outflows of resources and deferred inflows of resources related to pensions will be recognized in pension expense as follows:
Year Ended August 31:
2017 $ 53,512
2018 53,512
2019 53,511
2020 73,213
2021 (26,544)
Thereafter* (177,522)
* Note that additional future deferred inflows and outflows of resources may impact these numbers.
SAN JACINTO RIVER AUTHORITY
NOTES TO FINANCIAL STATEMENTS
49
Calculation of the Discount Rate
Depletion Date Projection
In order to determine if the plan's fiduciary net position is projected to be sufficient to make projected benefit payments, we have prepared a depletion date projection using the following techniques and assumptions:
- Current active members contribute the required employee contribution amounts. - The employer contributes the actuarially determined contribution (ADC) amounts (ADC = $1,091,804 for plan year beginning November 1, 2014). - Benefit payments are projected based on the actuarial assumptions and the current plan provisions. - Members are assumed to receive pay increases, terminate, retire, become disabled, die, and so forth according to the actuarial assumptions used for the November 1, 2014 valuation. - Terminating and retiring members will not be replaced with new employees. - Current administrative expenses are assumed to increase by 3.00% per year. - All cash flows are assumed to occur, on average, halfway through the year. - The long-term expected rate of return on pension plan investments is 6.50%. - The tax-exempt, high-quality general obligation municipal bond index rate is N/A. - The funding policy used to determine actuarially determined contributions does not change. - The actuarial assumptions do not change. - The plan provisions do not change except if any material future changes have been agreed upon as of the measurement date.
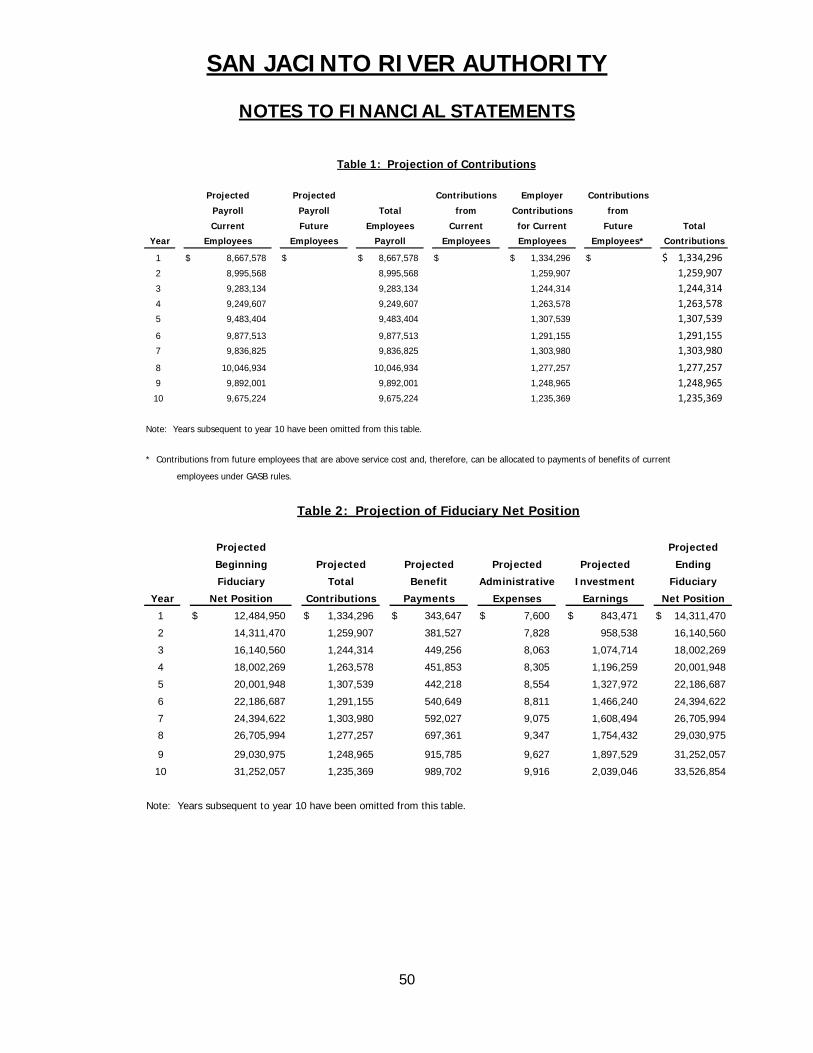
SAN JACINTO RIVER AUTHORITY
NOTES TO FINANCIAL STATEMENTS
50
Year
1 $ 8,667,578 $ $ 8,667,578 $ $ 1,334,296 $ $ 1,334,2962 8,995,568 8,995,568 1,259,907 1,259,9073 9,283,134 9,283,134 1,244,314 1,244,3144 9,249,607 9,249,607 1,263,578 1,263,5785 9,483,404 9,483,404 1,307,539 1,307,5396 9,877,513 9,877,513 1,291,155 1,291,1557 9,836,825 9,836,825 1,303,980 1,303,9808 10,046,934 10,046,934 1,277,257 1,277,2579 9,892,001 9,892,001 1,248,965 1,248,96510 9,675,224 9,675,224 1,235,369 1,235,369
Note: Years subsequent to year 10 have been omitted from this table.
* Contributions from future employees that are above service cost and, therefore, can be allocated to payments of benefits of current
employees under GASB rules.
fromTotal
Contributions
from
Projected
Payroll
Projected
Payroll
Table 1: Projection of Contributions
Current
Employees
Future
Employees
Employees
Payroll
Current
Employees
for Current
Employees
Future
Employees*
Total
Contributions
Employer
Contributions
Contributions
Year
1 $ 12,484,950 $ 1,334,296 $ 343,647 $ 7,600 $ 843,471 $ 14,311,470
2 14,311,470 1,259,907 381,527 7,828 958,538 16,140,560
3 16,140,560 1,244,314 449,256 8,063 1,074,714 18,002,269
4 18,002,269 1,263,578 451,853 8,305 1,196,259 20,001,948
5 20,001,948 1,307,539 442,218 8,554 1,327,972 22,186,687
6 22,186,687 1,291,155 540,649 8,811 1,466,240 24,394,622
7 24,394,622 1,303,980 592,027 9,075 1,608,494 26,705,994
8 26,705,994 1,277,257 697,361 9,347 1,754,432 29,030,975
9 29,030,975 1,248,965 915,785 9,627 1,897,529 31,252,057
10 31,252,057 1,235,369 989,702 9,916 2,039,046 33,526,854
Note: Years subsequent to year 10 have been omitted from this table.
Ending
Fiduciary Total Benefit Administrative
Projected Projected
Table 2: Projection of Fiduciary Net Position
Investment Fiduciary
Beginning Projected Projected Projected Projected
Net Position Contributions Payments Expenses Earnings Net Position
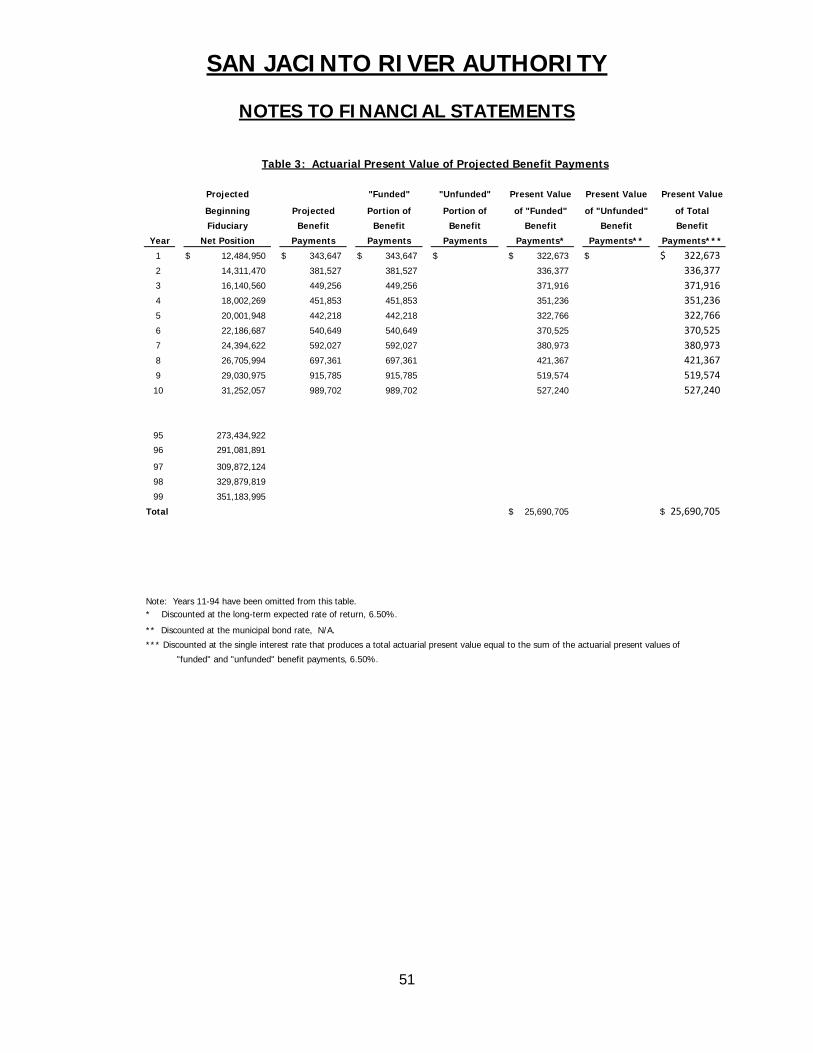
SAN JACINTO RIVER AUTHORITY
NOTES TO FINANCIAL STATEMENTS
51
Year
1 $ 12,484,950 $ 343,647 $ 343,647 $ $ 322,673 $ $ 322,6732 14,311,470 381,527 381,527 336,377 336,3773 16,140,560 449,256 449,256 371,916 371,9164 18,002,269 451,853 451,853 351,236 351,2365 20,001,948 442,218 442,218 322,766 322,7666 22,186,687 540,649 540,649 370,525 370,5257 24,394,622 592,027 592,027 380,973 380,9738 26,705,994 697,361 697,361 421,367 421,3679 29,030,975 915,785 915,785 519,574 519,57410 31,252,057 989,702 989,702 527,240 527,240
95 273,434,922
96 291,081,891
97 309,872,124
98 329,879,819
99 351,183,995
Total $ 25,690,705 $ 25,690,705
Note: Years 11-94 have been omitted from this table.* Discounted at the long-term expected rate of return, 6.50%.
** Discounted at the municipal bond rate, N/A.
*** Discounted at the single interest rate that produces a total actuarial present value equal to the sum of the actuarial present values of
"funded" and "unfunded" benefit payments, 6.50%.
Table 3: Actuarial Present Value of Projected Benefit Payments
Projected "Unfunded" Present Value Present Value"Funded" Present Value
of Total
Benefit
Net Position Payments Payments Payments Payments* Payments** Payments***
of "Unfunded"
Fiduciary Benefit Benefit Benefit Benefit Benefit
Beginning Projected Portion of Portion of of "Funded"
SAN JACINTO RIVER AUTHORITY
NOTES TO FINANCIAL STATEMENTS
52
NOTE 9 – OTHER POST-EMPLOYMENT BENEFITS (OPEB)
Plan Description The Authority provides other post-employment benefits (OPEB) for supplemental medical insurance coverage for certain retired employees and their dependents and grandfathered active employees. The OPEB plan is a single-employer defined benefit supplemental healthcare plan administered by the Authority. Section 49.069 of the Texas Water Code assigns the responsibility to establish and amend OPEB plan provisions to the Authority’s Board of Directors. The Authority’s Board of Directors also has the option to adopt the provisions of Subtitle F, Title 10, of the Texas Government Code, Chapter 2264 which allows modified reporting of the OPEB plan liability for the Authority’s unfunded actuarial accrued liability. The OPEB plan was adopted by the Board of Directors on October 28, 1986. The policy was amended on October 25, 1989 to exclude employees hired after November 1, 1989.
As of August 31, 2016, ten former employees, dependents, and surviving spouses are receiving OPEB healthcare benefits. Five active employees and their dependents will receive this benefit if the employees continue working for the Authority until reaching the normal retirement age of 65.
The Authority issues this publicly available financial report that includes financial statements and required supplementary information for the OPEB plan.
Funding Policy The contribution required from OPEB plan members may be amended by the Authority’s Board of Directors. As of the date of this report, The OPEB healthcare plan is 100% funded by the Authority on a pay-as-you-go-basis. The Authority paid an estimated $52,301 for OPEB medical insurance coverage for retired employees covered under the OPEB plan during the fiscal year ending August 31, 2016. After review, the Authority deems no reserve necessary for OPEB healthcare plan.
Annual OPEB Cost and Net OPEB Obligation The Authority’s annual other post-employment benefit (OPEB) cost (expense) is calculated based on the annual required contribution (ARC) of the employer. The ARC represents a level of funding that, if paid on an ongoing basis, is projected to cover normal cost each year and amortize any unfunded actuarial liabilities (or funding excess) over a period not to exceed thirty years.
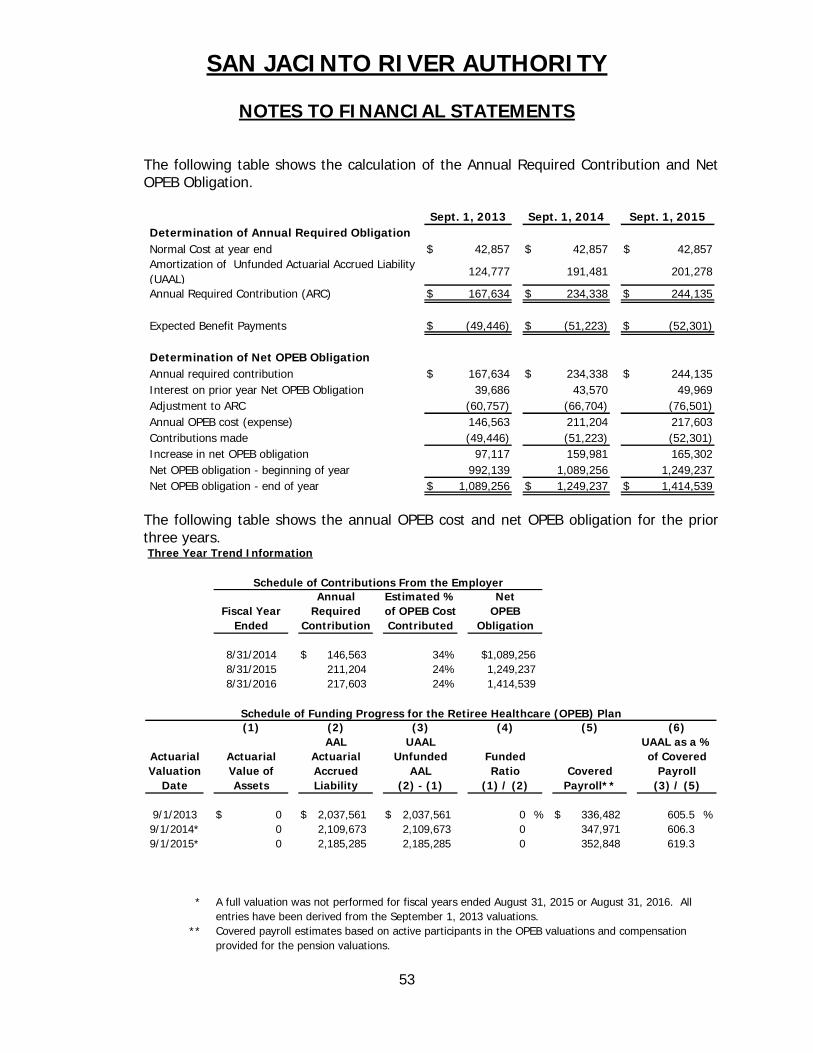
SAN JACINTO RIVER AUTHORITY
NOTES TO FINANCIAL STATEMENTS
53
The following table shows the calculation of the Annual Required Contribution and Net OPEB Obligation.
Normal Cost at year end $ 42,857 $ 42,857 $ 42,857 Amortization of Unfunded Actuarial Accrued Liability (UAAL)
124,777 191,481 201,278
Annual Required Contribution (ARC) $ 167,634 $ 234,338 $ 244,135
Expected Benefit Payments $ (49,446) $ (51,223) $ (52,301)
Annual required contribution $ 167,634 $ 234,338 $ 244,135 Interest on prior year Net OPEB Obligation 39,686 43,570 49,969 Adjustment to ARC (60,757) (66,704) (76,501)Annual OPEB cost (expense) 146,563 211,204 217,603 Contributions made (49,446) (51,223) (52,301)Increase in net OPEB obligation 97,117 159,981 165,302 Net OPEB obligation - beginning of year 992,139 1,089,256 1,249,237 Net OPEB obligation - end of year $ 1,089,256 $ 1,249,237 $ 1,414,539
Determination of Annual Required Obligation
Determination of Net OPEB Obligation
Sept. 1, 2013 Sept. 1, 2014 Sept. 1, 2015
The following table shows the annual OPEB cost and net OPEB obligation for the prior three years. Three Year Trend Information
$ 146,563 34%211,204 24%217,603 24%
ActuarialValuation
Date
9/1/2013 $ 0 $ 2,037,561 $ 2,037,561 0 % $ 336,482 605.5 %9/1/2014* 0 2,109,673 2,109,673 0 347,971 606.39/1/2015* 0 2,185,285 2,185,285 0 352,848 619.3
* A full valuation was not performed for fiscal years ended August 31, 2015 or August 31, 2016. Allentries have been derived from the September 1, 2013 valuations.
** Covered payroll estimates based on active participants in the OPEB valuations and compensationprovided for the pension valuations.
Net
$1,089,2561,249,237
Schedule of Contributions From the Employer
8/31/2014
AnnualFiscal Year Required of OPEB Cost OPEB
Ended Contribution Contributed Obligation
Estimated %
Schedule of Funding Progress for the Retiree Healthcare (OPEB) Plan
8/31/2015
(1) (2) (3) (4) (5) (6)
8/31/2016 1,414,539
UAAL UAAL as a %Actuarial Actuarial Unfunded Funded of Covered
AAL
Value of Accrued AAL Ratio Covered PayrollAssets Liability (2) - (1) (1) / (2) Payroll** (3) / (5)
SAN JACINTO RIVER AUTHORITY
NOTES TO FINANCIAL STATEMENTS
54
Funded Status and Funding Progress As of September 1, 2015, the OPEB plan was 0% funded. The estimated actuarial accrued liability for benefits was $2,185,285. This value is based on a roll forward of the full valuation performed as of September 1, 2013. The covered payroll (annual payroll of active employees covered by the plan) was $352,848 and the ratio of the UAAL to the covered payroll was 619.3%. Actuarial valuations of an ongoing plan involve estimates of the value of reported amounts and assumptions about the probability of occurrence of events far into the future. Examples include assumptions about future employment, mortality, and the healthcare cost trend. Amounts determined regarding the funded status of the plan and the annual required contributions of the employer are subject to continual revision as actual results are compared with past expectations and new estimates are made about the future. The schedule of funding progress, presented as required supplementary information following the notes to the financial statements, presents information about the actuarial value of plan assets relative to the actuarial accrued liabilities for benefits.
Actuarial Methods and Assumptions Projections of benefits for financial reporting purposes are based on the substantive plan (the plan as understood by the employer and the plan members) and include the types of benefits provided at the time of each valuation and the historical pattern of sharing of benefit costs between the employer and plan members to that point. The actuarial methods and assumptions used include techniques that are designed to reduce the effects of short-term volatility in actuarial accrued liabilities and the actuarial value of assets, consistent with the long-term perspective of the calculations. The valuation assumptions include a future inflation rate of 2.50%.
In the September 1, 2013 actuarial valuation, the projected unit credit method was used. The retirement age for an active employee was assumed to be 65, which is the first year an eligible employee would qualify for OPEB plan benefits. The probability for employees eligible for the OPEB plan separating from service before normal retirement is based on Table T-1 of the Actuary’s Pension Handbook, modified for females. The marital status of eligible active employees was assumed to continue throughout retirement. Life expectancies were based on the RP2000 Mortality Table with Projection Scale AA. The actuarial assumptions also included an assumed investment rate of return of 4.0% for fiscal years 2014 and later.
The annual healthcare cost trend rate was 7.4% for fiscal 2014, 6.0% for fiscal 2015, 6.1% for fiscal 2016, 5.8% for fiscal 2017 and ultimately grade down to 4.5% per year after 2093.
The unfunded actuarial accrued liability is being amortized as a level dollar amount on a 27 year closed basis beginning September 1, 2013.
SAN JACINTO RIVER AUTHORITY
NOTES TO FINANCIAL STATEMENTS
55
NOTE 10 – MAJOR CUSTOMERS
Industrial and municipal water sales totaling $13,478,919 were invoiced to the Authority’s three largest customers of the Raw Water Supply Division. This accounts for 91% of the Raw Water Supply Division water sales revenues for the year ended August 31, 2016. Revenues totaling $1,486,056 accrued from the Authority’s primary contractual partner (City of Houston) in the Lake Conroe reservoir project. This accounts for 57% of the Lake Conroe Division’s operating revenues for the year ended August 31, 2016. Water pumpage and surface water fees totaling $23,283,467 were invoiced to the Authority’s two largest customers of the Groundwater Reduction Plan Division. This accounts for 51% of Groundwater Reduction Plan Division’s operating revenues for the year ended August 31, 2016. Water and sewer service fees and capacity charges totaling $19,365,425 were invoiced to the Authority’s five largest customers of the Woodlands Division. This accounts for 48% of The Woodlands Division’s operating revenues for the year ended August 31, 2016.
NOTE 11 – CONTINGENCIES
On June 20, 2016, the Authority adopted a Rate Order setting revised rates applicable to its GRP Participants. The rate revisions were to take effect on September 1, 2016. On August 16, 2016, the City of Conroe, Texas, the second-largest rate payer in the Authority's GRP, adopted an ordinance that, among other things, directed City staff not to pay the revised rates adopted by the Authority. On August 31, 2016, the San Jacinto River Authority filed suit in the District Court of Travis County, Texas, pursuant to Chapter 1205 of the Texas Government Code, seeking a declaratory judgment that (i) the Authority is authorized to set rates for its GRP Participants pursuant to the procedures set forth in the contracts between the Authority and its GRP Participants (the "GRP Contracts), (ii) the Authority adopted its fiscal year 2017 Rate Order, including the setting of its fiscal year 2017 rates, in accordance with the procedures set forth in the GRP Contracts, (iii) the Authority's fiscal year 2017 rates, the Rate Order, and the GRP Contract are legal and valid, and (iv) the City of Conroe's refusal to pay the fiscal year 2017 rate is illegal and invalid, and its failure to pay is a breach of its GRP Contract. The Cities of Conroe, Magnolia, and Splendora, Texas, along with two privately-owned water utilities, Quadvest, L.P. and Woodlands Oaks Utility, L.P., have intervened in opposition to the Authority's suit.
SAN JACINTO RIVER AUTHORITY
NOTES TO FINANCIAL STATEMENTS
56
The suit is currently pending and the Authority cannot predict the outcome of same. As such, the Authority cannot make a statement at this time regarding the impact the resolution of the suit may have upon the Authority's financial condition. The Authority has expended approximately $621,500 in legal fees and costs related to the suit and additional expenditures are anticipated to be incurred by the Authority in the future.
The City of Conroe and City of Magnolia are paying the fiscal year 2016 rates (not fiscal year 2017 rates) and are incurring late fees and finance fees on the unpaid balances. All other participants are paying the fiscal year 2017 rates.
NOTE 12 – RISK MANAGEMENT
The Authority is exposed to various risks of loss related to torts; theft of, damage to and destruction of assets; errors and omissions; and natural disasters for which the Authority carries commercial insurance. Commercial insurance coverage exceeded settlement amounts in each of the past three years.
NOTE 13 – FUNDING FOR REGION H WATER PLANNING GRANT
Under an agreement with the Texas Water Development Board (“TWDB”), the Authority is the contracting agency and designated representative of the Region H Water Planning Group. Under the contract, the TWDB provides financial assistance to develop a regional water plan for Region H, a 15 county area, which includes most of the San Jacinto River watershed. The TWDB, fulfilling the requirements set forth in Senate Bills 1, 2 and 3, defines the scope of work to be included in the plan and the time frame for completion of the various tasks in the plan. Senate Bill 1 was enacted by the 75th Texas Legislature in 1997, Senate Bill 2 was enacted by the 77th Texas Legislature in 2001 and Senate Bill 3 was enacted by the 80th Texas Legislature in 2007. The TWDB rules provide that State funds will be used to pay 100% of the direct regional water plan costs. The Authority has received contributions from governments and other parties interested in the development of the plan that partially fund miscellaneous other Region H costs.
NOTE 14 – COMPENSATED ABSENCES
Vacation As of August 31, 2016, employees of the Authority accrue vacation quarterly based on their hire date. Vacation is accrued as follows:
0-4.99 years of employment 20 hours per quarter 5-5.99 years of employment 22 hours per quarter 6-6.99 years of employment 24 hours per quarter 7-7.99 years of employment 26 hours per quarter 8-8.99 years of employment 28 hours per quarter 9-19.99 years of employment 30 hours per quarter 20 plus years of employment 40 hours per quarter
SAN JACINTO RIVER AUTHORITY
NOTES TO FINANCIAL STATEMENTS
57
Employees will be allowed to accrue up to six (6) quarters of vacation time. Balances exceeding 6 quarters at the employee’s current accrual rate will be cancelled, and employees will not be paid for unused vacation time unless otherwise authorized by the General Manager due to a declared Minor or Major Emergency Closing that prevents a previously scheduled vacation. Employees must use the accrued vacation in at least half (1/2) hour increments. Upon termination of employment, employees who have given proper notice will normally be paid for unused vacation time that has been accrued through the date of termination. If the Authority terminates employment for any reason other than a lay-off or reduction in force, no payment will be made for accrued vacation. The liability and annual expense for accrued vacation was calculated based on the employee’s pay rate times the accrued vacation hours plus applicable employee benefits as of the end of the fiscal year. Sick Leave The Authority provides paid sick leave benefits to all eligible employees for periods of temporary absence due to illness, injuries, or scheduled medical appointments. Accrual: Sick leave will accrue at the rate of one day (8 hours) per month. No more than 36 days of accrued sick leave may be carried forward from one fiscal year to the next. Balances in excess of 36 days will be canceled on September 1 of each year. Retirement/Termination: There is no payment for unused sick leave when an employee terminates employment for any reason other than normal retirement. When an employee is retiring and meets all the eligibility requirements under the SJRA’s Pension Plan to retire at their normal retirement date, that employee will be eligible for payment of their unused sick leave balance up to a maximum of thirty-six (36) days. Compensatory Time Non-exempt employees may accrue compensatory time (comp time) in lieu of being paid overtime compensation upon approval by the Manager. Compensatory time is overtime and requires the same management approvals. Non-exempt employees may be eligible to bank overtime for later use as compensatory time off at a rate of 1½ times hours worked. Compensatory time is limited based on the operational needs of the division. The actual overtime worked must be banked in a minimum of ½ hour increments. The maximum accrual per division is listed below: Maximum Accruals: General and Administration Employees – 40 actual hours = 60 compensatory time hours Woodlands Employees – 20 actual hours = 30 compensatory time hours Lake Conroe Employees – 40 actual hours = 60 compensatory time hours Highlands Employees – 120 actual hours = 180 compensatory time hours
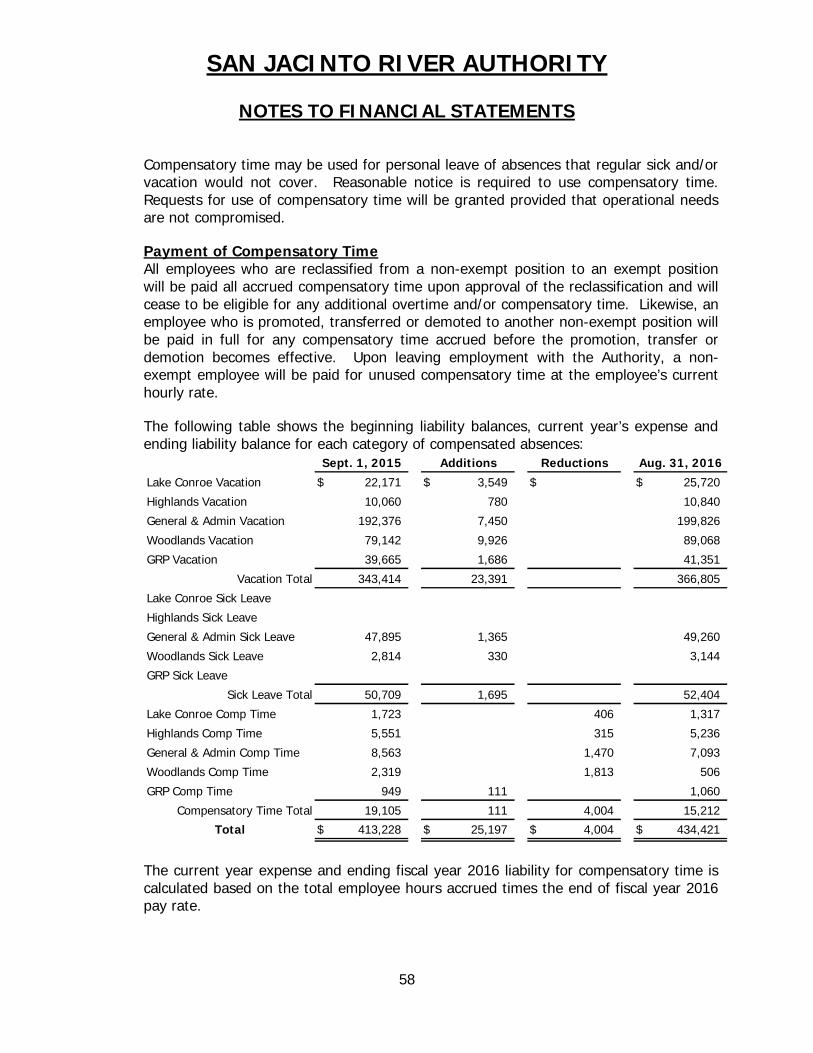
SAN JACINTO RIVER AUTHORITY
NOTES TO FINANCIAL STATEMENTS
58
Compensatory time may be used for personal leave of absences that regular sick and/or vacation would not cover. Reasonable notice is required to use compensatory time. Requests for use of compensatory time will be granted provided that operational needs are not compromised. Payment of Compensatory Time All employees who are reclassified from a non-exempt position to an exempt position will be paid all accrued compensatory time upon approval of the reclassification and will cease to be eligible for any additional overtime and/or compensatory time. Likewise, an employee who is promoted, transferred or demoted to another non-exempt position will be paid in full for any compensatory time accrued before the promotion, transfer or demotion becomes effective. Upon leaving employment with the Authority, a non-exempt employee will be paid for unused compensatory time at the employee’s current hourly rate. The following table shows the beginning liability balances, current year’s expense and ending liability balance for each category of compensated absences:
Lake Conroe Vacation $ 22,171 $ 3,549 $ $ 25,720
Highlands Vacation 10,060 780 10,840
General & Admin Vacation 192,376 7,450 199,826
Woodlands Vacation 79,142 9,926 89,068
GRP Vacation 39,665 1,686 41,351
Vacation Total 343,414 23,391 366,805
Lake Conroe Sick Leave
Highlands Sick Leave
General & Admin Sick Leave 47,895 1,365 49,260
Woodlands Sick Leave 2,814 330 3,144
GRP Sick Leave
Sick Leave Total 50,709 1,695 52,404
Lake Conroe Comp Time 1,723 406 1,317
Highlands Comp Time 5,551 315 5,236
General & Admin Comp Time 8,563 1,470 7,093
Woodlands Comp Time 2,319 1,813 506
GRP Comp Time 949 111 1,060
Compensatory Time Total 19,105 111 4,004 15,212
Total $ 413,228 $ 25,197 $ 4,004 $ 434,421
Sept. 1, 2015 Reductions Aug. 31, 2016Additions
The current year expense and ending fiscal year 2016 liability for compensatory time is calculated based on the total employee hours accrued times the end of fiscal year 2016 pay rate.
REQUIRED SUPPLEMENTARY INFORMATION
59
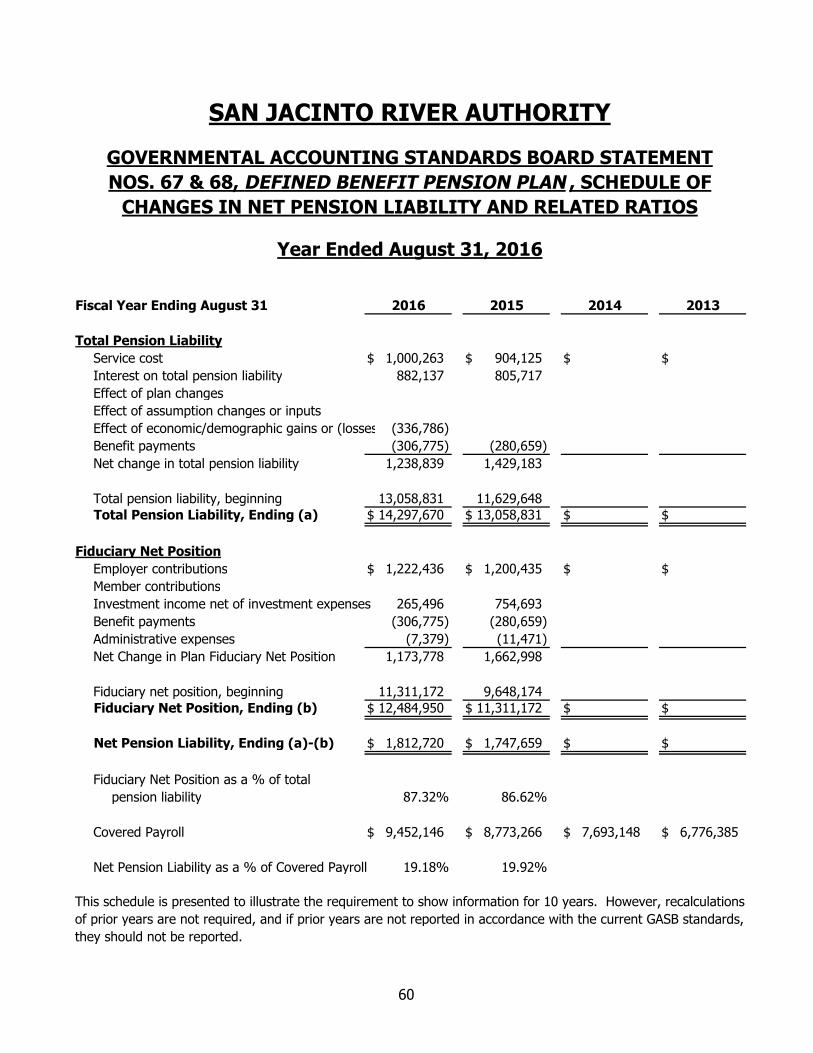
Fiscal Year Ending August 31
Total Pension Liability
Service cost $ 1,000,263 $ 904,125 $ $
Interest on total pension liability 882,137 805,717
Effect of plan changes
Effect of assumption changes or inputs
Effect of economic/demographic gains or (losses) (336,786)
Benefit payments (306,775) (280,659)
Net change in total pension liability 1,238,839 1,429,183
Total pension liability, beginning 13,058,831 11,629,648Total Pension Liability, Ending (a) $ 14,297,670 $ 13,058,831 $ $
Fiduciary Net Position
Employer contributions $ 1,222,436 $ 1,200,435 $ $
Member contributions
Investment income net of investment expenses 265,496 754,693
Benefit payments (306,775) (280,659)
Administrative expenses (7,379) (11,471)
Net Change in Plan Fiduciary Net Position 1,173,778 1,662,998
Fiduciary net position, beginning 11,311,172 9,648,174Fiduciary Net Position, Ending (b) $ 12,484,950 $ 11,311,172 $ $
Net Pension Liability, Ending (a)-(b) $ 1,812,720 $ 1,747,659 $ $
Fiduciary Net Position as a % of total
pension liability 87.32% 86.62%
Covered Payroll $ 9,452,146 $ 8,773,266 $ 7,693,148 $ 6,776,385
Net Pension Liability as a % of Covered Payroll 19.18% 19.92%
This schedule is presented to illustrate the requirement to show information for 10 years. However, recalculations
of prior years are not required, and if prior years are not reported in accordance with the current GASB standards,
they should not be reported.
SAN JACINTO RIVER AUTHORITY
GOVERNMENTAL ACCOUNTING STANDARDS BOARD STATEMENT
NOS. 67 & 68, DEFINED BENEFIT PENSION PLAN , SCHEDULE OF
CHANGES IN NET PENSION LIABILITY AND RELATED RATIOS
Year Ended August 31, 2016
2016 2015 2014 2013
60
$ $ $ $ $ $
$ $ $ $ $ $
$ $ $ $ $ $
$ $ $ $ $ $
$ $ $ $ $ $
$ 5,939,787 $ 4,728,214 $ 4,129,705 $ 4,013,370 $ 3,254,963 $ 2,890,174
2012 2011 2010 2009 2008 2007
61
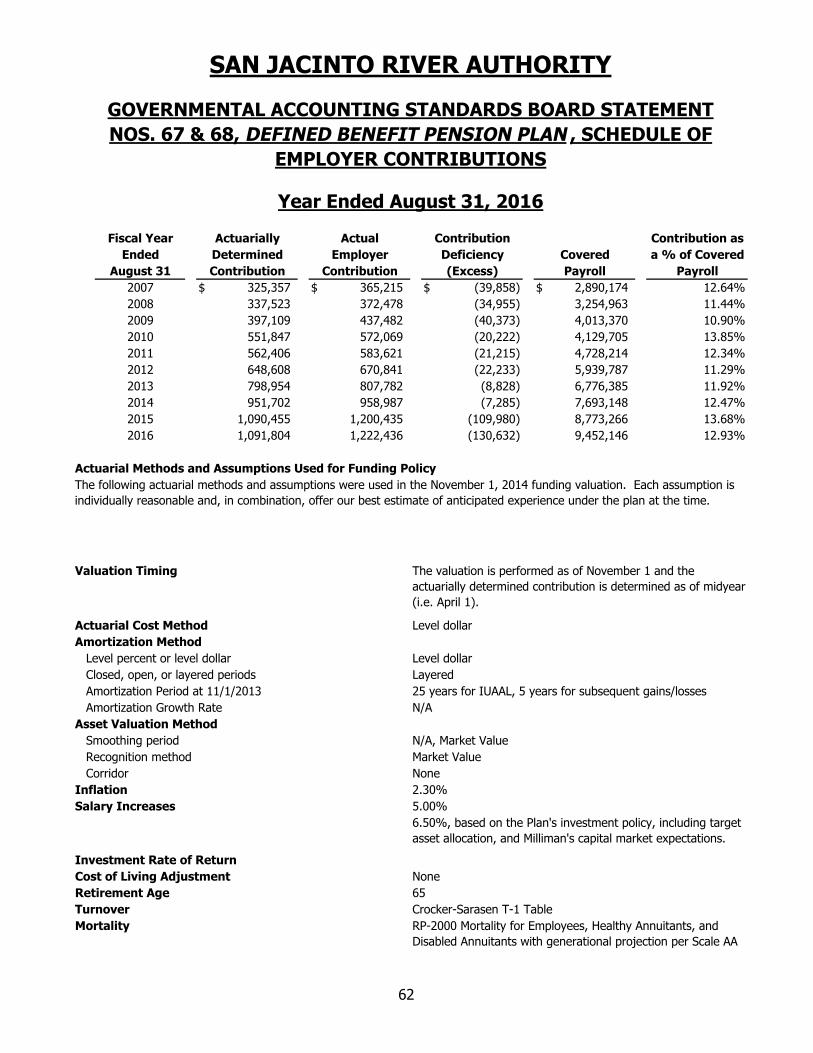
Fiscal Year
Ended
August 31
2007 $ 325,357 $ 365,215 $ (39,858) $ 2,890,174 12.64%
2008 337,523 372,478 (34,955) 3,254,963 11.44%
2009 397,109 437,482 (40,373) 4,013,370 10.90%
2010 551,847 572,069 (20,222) 4,129,705 13.85%
2011 562,406 583,621 (21,215) 4,728,214 12.34%
2012 648,608 670,841 (22,233) 5,939,787 11.29%
2013 798,954 807,782 (8,828) 6,776,385 11.92%
2014 951,702 958,987 (7,285) 7,693,148 12.47%
2015 1,090,455 1,200,435 (109,980) 8,773,266 13.68%
2016 1,091,804 1,222,436 (130,632) 9,452,146 12.93%
Actuarial Methods and Assumptions Used for Funding Policy
Valuation Timing
Actuarial Cost Method Level dollar
Amortization Method
Level percent or level dollar Level dollar
Closed, open, or layered periods Layered
Amortization Period at 11/1/2013 25 years for IUAAL, 5 years for subsequent gains/losses
Amortization Growth Rate N/A
Asset Valuation Method
Smoothing period N/A, Market Value
Recognition method Market Value
Corridor None
Inflation 2.30%
Salary Increases 5.00%
Investment Rate of Return
Cost of Living Adjustment None
Retirement Age 65
Turnover Crocker-Sarasen T-1 Table
Mortality
SAN JACINTO RIVER AUTHORITY
Contribution
Contribution
Deficiency
(Excess)
GOVERNMENTAL ACCOUNTING STANDARDS BOARD STATEMENT
NOS. 67 & 68, DEFINED BENEFIT PENSION PLAN , SCHEDULE OF
Contribution as
a % of Covered
Payroll
The valuation is performed as of November 1 and the
actuarially determined contribution is determined as of midyear
(i.e. April 1).
6.50%, based on the Plan's investment policy, including target
asset allocation, and Milliman's capital market expectations.
RP-2000 Mortality for Employees, Healthy Annuitants, and
Disabled Annuitants with generational projection per Scale AA
The following actuarial methods and assumptions were used in the November 1, 2014 funding valuation. Each assumption is
individually reasonable and, in combination, offer our best estimate of anticipated experience under the plan at the time.
Determined
Contribution Payroll
Actual
Employer
EMPLOYER CONTRIBUTIONS
Year Ended August 31, 2016
Actuarially
Covered
62
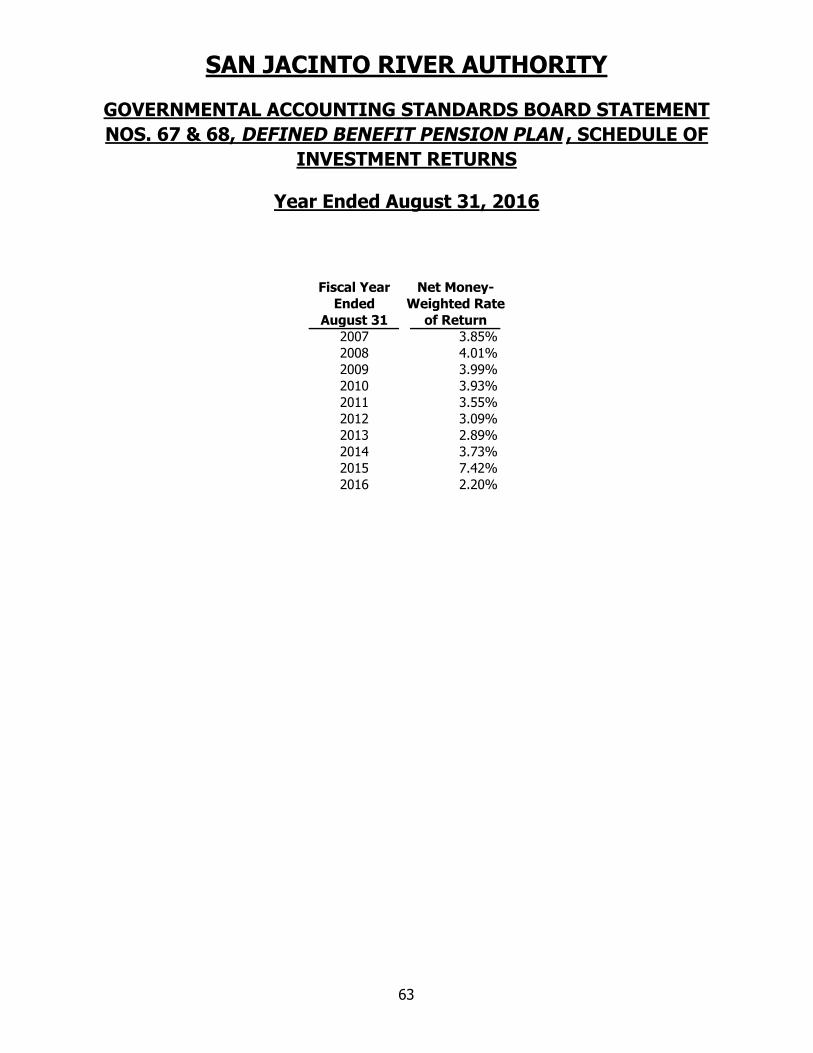
Fiscal Year Net Money-Ended Weighted Rate
August 31 of Return2007 3.85%2008 4.01%2009 3.99%2010 3.93%2011 3.55%2012 3.09%2013 2.89%2014 3.73%2015 7.42%2016 2.20%
SAN JACINTO RIVER AUTHORITY
GOVERNMENTAL ACCOUNTING STANDARDS BOARD STATEMENT
NOS. 67 & 68, DEFINED BENEFIT PENSION PLAN , SCHEDULE OF
INVESTMENT RETURNS
Year Ended August 31, 2016
63
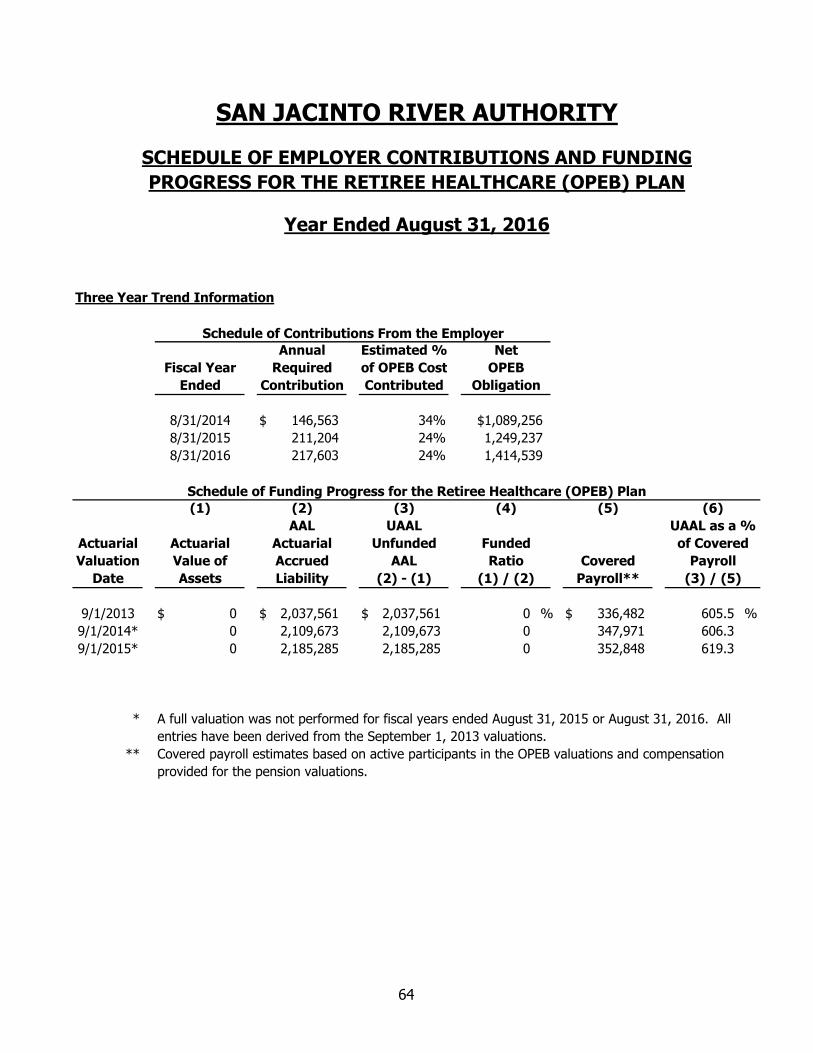
Three Year Trend Information
$ 146,563 34%
211,204 24%
217,603 24%
Actuarial
Valuation
Date
9/1/2013 $ 0 $ 2,037,561 $ 2,037,561 0 % $ 336,482 605.5 %
9/1/2014* 0 2,109,673 2,109,673 0 347,971 606.3
9/1/2015* 0 2,185,285 2,185,285 0 352,848 619.3
* A full valuation was not performed for fiscal years ended August 31, 2015 or August 31, 2016. All
entries have been derived from the September 1, 2013 valuations.
** Covered payroll estimates based on active participants in the OPEB valuations and compensation
provided for the pension valuations.
Net
$1,089,256
1,249,237
SAN JACINTO RIVER AUTHORITY
SCHEDULE OF EMPLOYER CONTRIBUTIONS AND FUNDING
PROGRESS FOR THE RETIREE HEALTHCARE (OPEB) PLAN
Year Ended August 31, 2016
Schedule of Contributions From the Employer
8/31/2014
Annual
Fiscal Year Required of OPEB Cost OPEB
Ended Contribution Contributed Obligation
Estimated %
Schedule of Funding Progress for the Retiree Healthcare (OPEB) Plan
8/31/2015
(1) (2) (3) (4) (5) (6)
8/31/2016 1,414,539
UAAL UAAL as a %
Actuarial Actuarial Unfunded Funded of Covered
AAL
Value of Accrued AAL Ratio Covered Payroll
Assets Liability (2) - (1) (1) / (2) Payroll** (3) / (5)
64
OTHER SUPPLEMENTARY INFORMATION
65
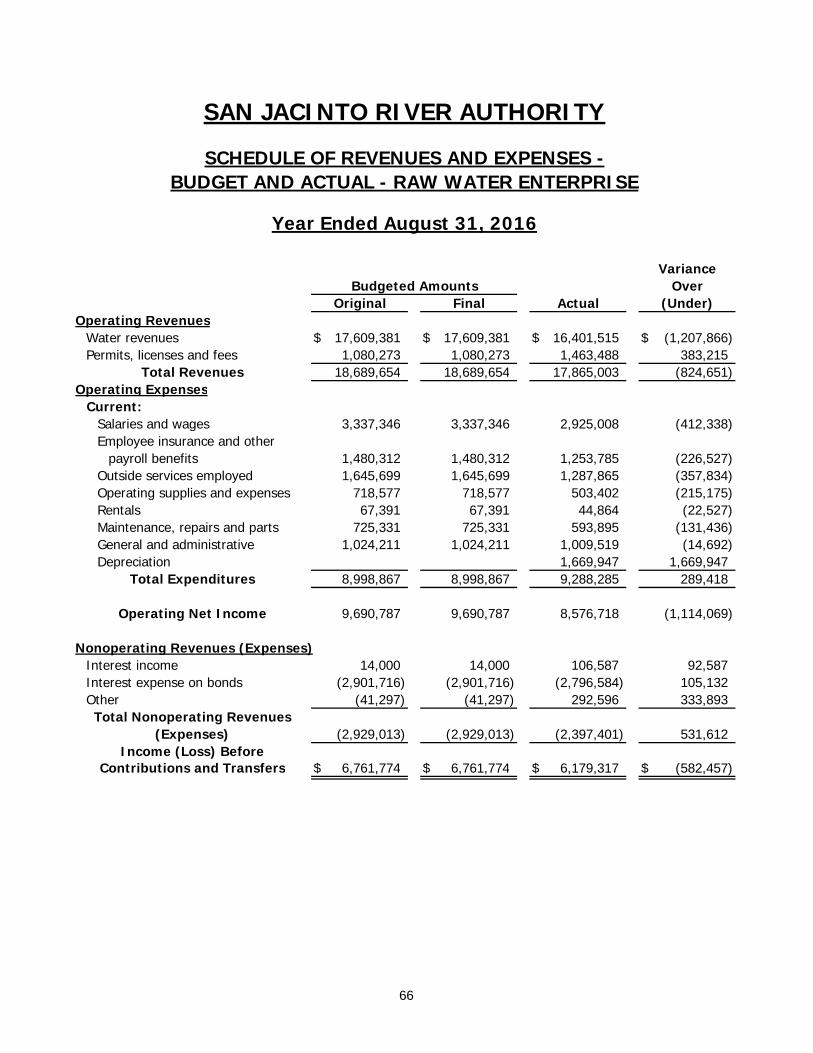
Operating RevenuesWater revenues $ 17,609,381 $ 17,609,381 $ 16,401,515 $ (1,207,866)Permits, licenses and fees 1,080,273 1,080,273 1,463,488 383,215
18,689,654 18,689,654 17,865,003 (824,651)Operating Expenses
Current:Salaries and wages 3,337,346 3,337,346 2,925,008 (412,338)Employee insurance and other
payroll benefits 1,480,312 1,480,312 1,253,785 (226,527)Outside services employed 1,645,699 1,645,699 1,287,865 (357,834)Operating supplies and expenses 718,577 718,577 503,402 (215,175)Rentals 67,391 67,391 44,864 (22,527)Maintenance, repairs and parts 725,331 725,331 593,895 (131,436)General and administrative 1,024,211 1,024,211 1,009,519 (14,692)Depreciation 1,669,947 1,669,947
8,998,867 8,998,867 9,288,285 289,418
9,690,787 9,690,787 8,576,718 (1,114,069)
Nonoperating Revenues (Expenses)Interest income 14,000 14,000 106,587 92,587Interest expense on bonds (2,901,716) (2,901,716) (2,796,584) 105,132Other (41,297) (41,297) 292,596 333,893
(2,929,013) (2,929,013) (2,397,401) 531,612
$ 6,761,774 $ 6,761,774 $ 6,179,317 $ (582,457)Contributions and Transfers
Total Revenues
Total Expenditures
Operating Net Income
Income (Loss) Before
Final Actual (Under)
Total Nonoperating Revenues(Expenses)
Original
SAN JACINTO RIVER AUTHORITY
SCHEDULE OF REVENUES AND EXPENSES -BUDGET AND ACTUAL - RAW WATER ENTERPRISE
Budgeted Amounts Over
Year Ended August 31, 2016
Variance
66
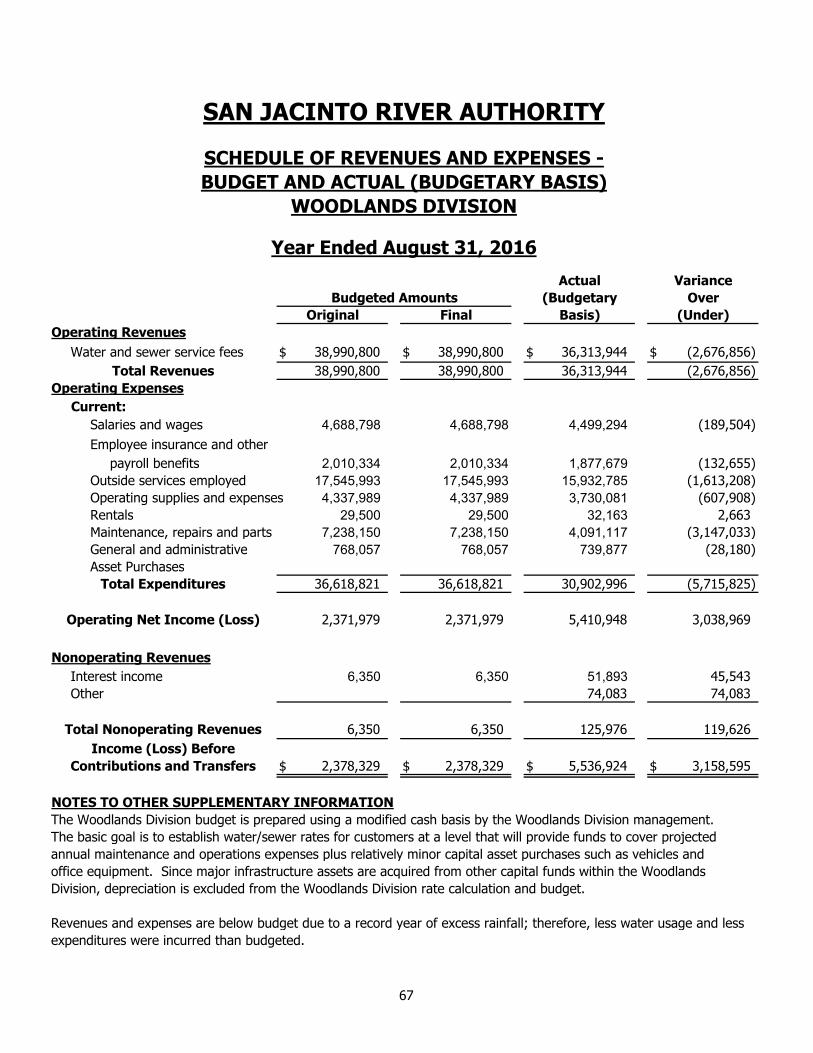
Operating Revenues
Water and sewer service fees $ 38,990,800 $ 38,990,800 $ 36,313,944 $ (2,676,856)
38,990,800 38,990,800 36,313,944 (2,676,856)
Operating Expenses
Current:
Salaries and wages 4,688,798 4,688,798 4,499,294 (189,504)
Employee insurance and other
payroll benefits 2,010,334 2,010,334 1,877,679 (132,655)
Outside services employed 17,545,993 17,545,993 15,932,785 (1,613,208)
Operating supplies and expenses 4,337,989 4,337,989 3,730,081 (607,908)
Rentals 29,500 29,500 32,163 2,663
Maintenance, repairs and parts 7,238,150 7,238,150 4,091,117 (3,147,033)
General and administrative 768,057 768,057 739,877 (28,180)
Asset Purchases
36,618,821 36,618,821 30,902,996 (5,715,825)
2,371,979 2,371,979 5,410,948 3,038,969
Nonoperating Revenues
Interest income 6,350 6,350 51,893 45,543
Other 74,083 74,083
6,350 6,350 125,976 119,626
$ 2,378,329 $ 2,378,329 $ 5,536,924 $ 3,158,595
NOTES TO OTHER SUPPLEMENTARY INFORMATION
The Woodlands Division budget is prepared using a modified cash basis by the Woodlands Division management.
The basic goal is to establish water/sewer rates for customers at a level that will provide funds to cover projected
annual maintenance and operations expenses plus relatively minor capital asset purchases such as vehicles and
office equipment. Since major infrastructure assets are acquired from other capital funds within the Woodlands
Division, depreciation is excluded from the Woodlands Division rate calculation and budget.
Revenues and expenses are below budget due to a record year of excess rainfall; therefore, less water usage and less
expenditures were incurred than budgeted.
SAN JACINTO RIVER AUTHORITY
SCHEDULE OF REVENUES AND EXPENSES -
BUDGET AND ACTUAL (BUDGETARY BASIS)
WOODLANDS DIVISION
Year Ended August 31, 2016
Variance
Final (Under)Original
OverBudgeted Amounts
Actual
(Budgetary
Total Nonoperating Revenues
Basis)
Income (Loss) Before
Contributions and Transfers
Total Revenues
Total Expenditures
Operating Net Income (Loss)
67
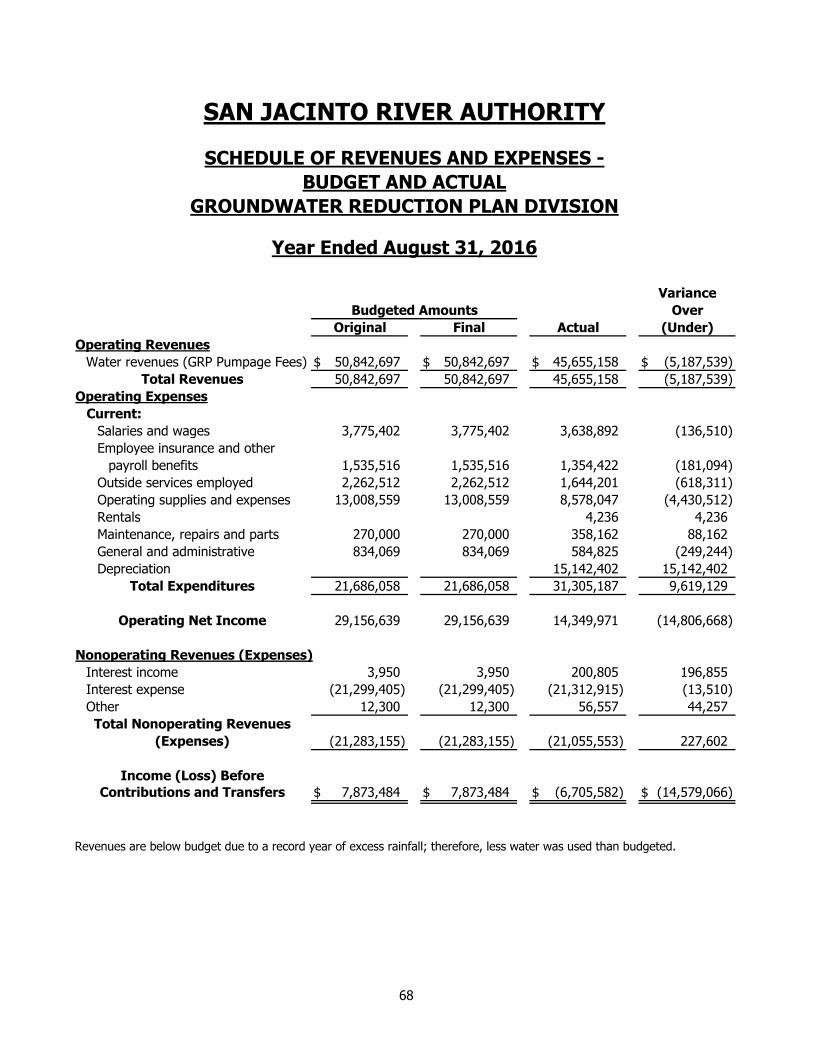
Operating Revenues
Water revenues (GRP Pumpage Fees) $ 50,842,697 $ 50,842,697 $ 45,655,158 $ (5,187,539)
50,842,697 50,842,697 45,655,158 (5,187,539)
Operating Expenses
Current:
Salaries and wages 3,775,402 3,775,402 3,638,892 (136,510)
Employee insurance and other
payroll benefits 1,535,516 1,535,516 1,354,422 (181,094)
Outside services employed 2,262,512 2,262,512 1,644,201 (618,311)
Operating supplies and expenses 13,008,559 13,008,559 8,578,047 (4,430,512)
Rentals 4,236 4,236
Maintenance, repairs and parts 270,000 270,000 358,162 88,162
General and administrative 834,069 834,069 584,825 (249,244)
Depreciation 15,142,402 15,142,402
21,686,058 21,686,058 31,305,187 9,619,129
29,156,639 29,156,639 14,349,971 (14,806,668)
Nonoperating Revenues (Expenses)
Interest income 3,950 3,950 200,805 196,855
Interest expense (21,299,405) (21,299,405) (21,312,915) (13,510)
Other 12,300 12,300 56,557 44,257
(21,283,155) (21,283,155) (21,055,553) 227,602
$ 7,873,484 $ 7,873,484 $ (6,705,582) $ (14,579,066)
Revenues are below budget due to a record year of excess rainfall; therefore, less water was used than budgeted.
Contributions and Transfers
Income (Loss) Before
Total Revenues
Total Expenditures
Operating Net Income
Total Nonoperating Revenues
(Expenses)
Variance
Budgeted Amounts Over
Original Final Actual (Under)
SAN JACINTO RIVER AUTHORITY
SCHEDULE OF REVENUES AND EXPENSES -
BUDGET AND ACTUAL
GROUNDWATER REDUCTION PLAN DIVISION
Year Ended August 31, 2016
68
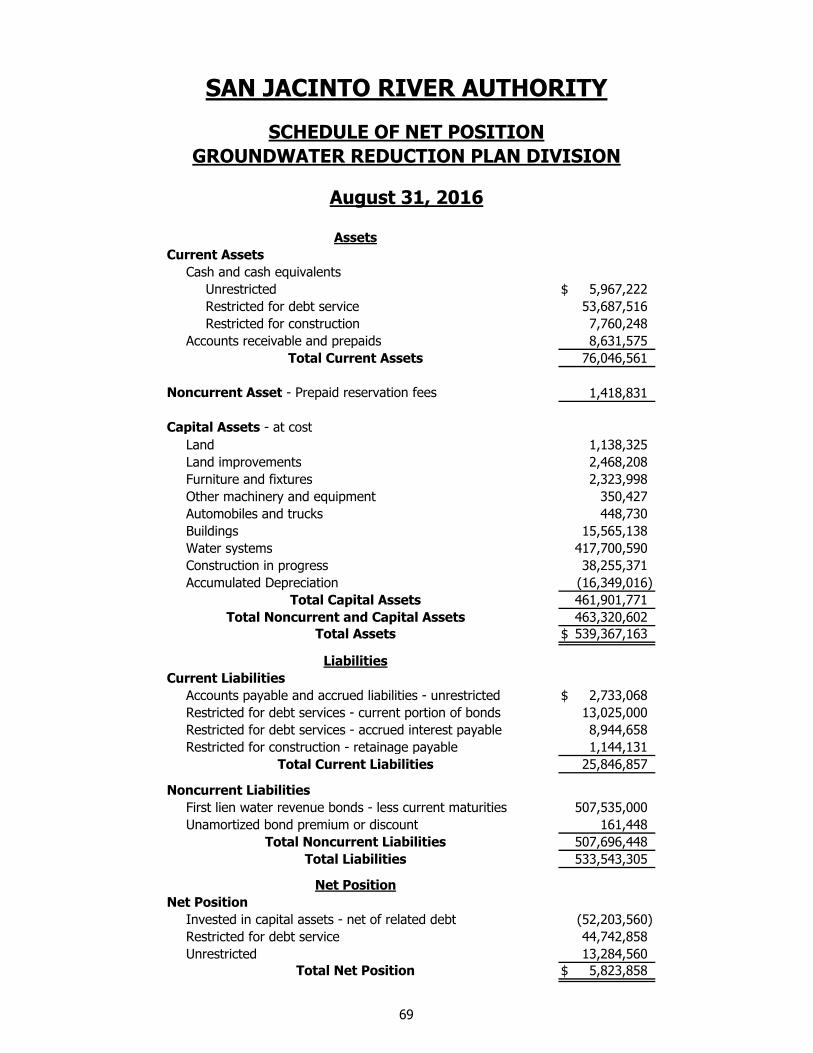
Current Assets
Cash and cash equivalents
Unrestricted $ 5,967,222
Restricted for debt service 53,687,516
Restricted for construction 7,760,248
Accounts receivable and prepaids 8,631,575
76,046,561
Noncurrent Asset - Prepaid reservation fees 1,418,831
Capital Assets - at cost
Land 1,138,325
Land improvements 2,468,208
Furniture and fixtures 2,323,998
Other machinery and equipment 350,427
Automobiles and trucks 448,730
Buildings 15,565,138
Water systems 417,700,590
Construction in progress 38,255,371
Accumulated Depreciation (16,349,016)
461,901,771
463,320,602
$ 539,367,163
Current Liabilities
Accounts payable and accrued liabilities - unrestricted $ 2,733,068
Restricted for debt services - current portion of bonds 13,025,000
Restricted for debt services - accrued interest payable 8,944,658
Restricted for construction - retainage payable 1,144,131
25,846,857
Noncurrent Liabilities
First lien water revenue bonds - less current maturities 507,535,000
Unamortized bond premium or discount 161,448
507,696,448
533,543,305
Net Position
Invested in capital assets - net of related debt (52,203,560)
Restricted for debt service 44,742,858
Unrestricted 13,284,560
$ 5,823,858
SAN JACINTO RIVER AUTHORITY
SCHEDULE OF NET POSITION
GROUNDWATER REDUCTION PLAN DIVISION
August 31, 2016
Total Liabilities
Total Noncurrent Liabilities
Net Position
Total Net Position
Assets
Total Current Assets
Total Capital Assets
Total Assets
Liabilities
Total Current Liabilities
Total Noncurrent and Capital Assets
69
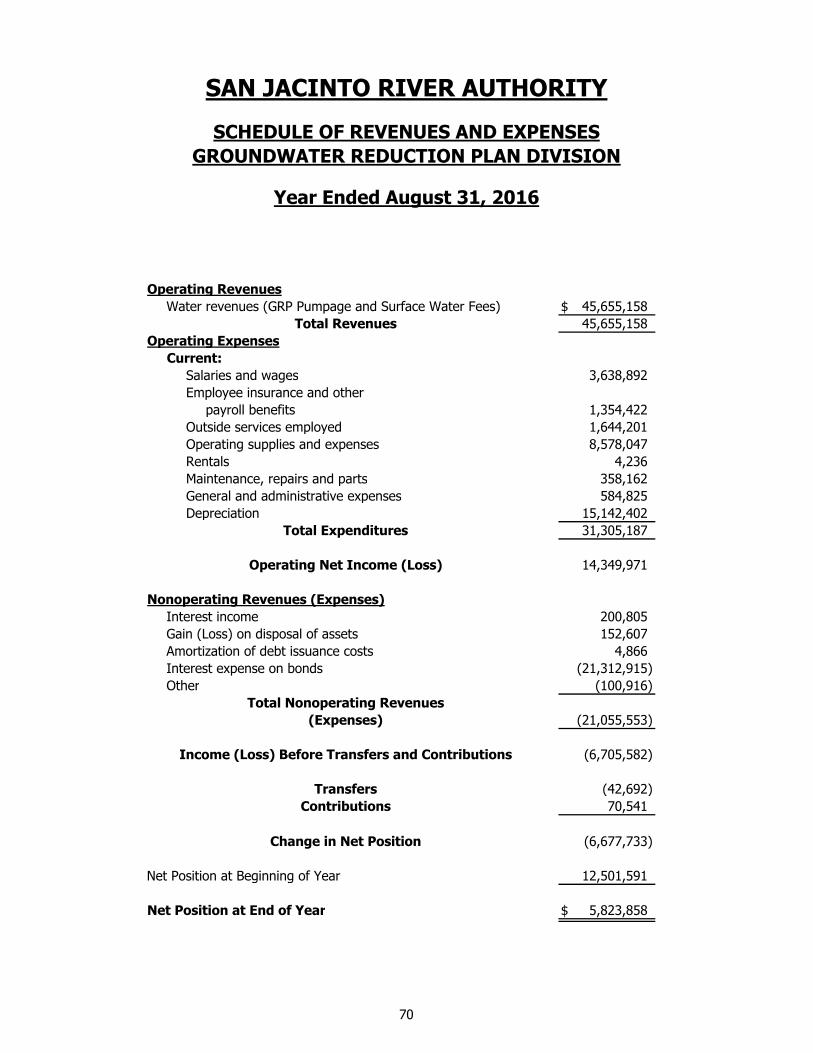
Operating Revenues
Water revenues (GRP Pumpage and Surface Water Fees) $ 45,655,158
45,655,158
Operating Expenses
Current:
Salaries and wages 3,638,892
Employee insurance and other
payroll benefits 1,354,422
Outside services employed 1,644,201
Operating supplies and expenses 8,578,047
Rentals 4,236
Maintenance, repairs and parts 358,162
General and administrative expenses 584,825
Depreciation 15,142,402
31,305,187
14,349,971
Nonoperating Revenues (Expenses)
Interest income 200,805
Gain (Loss) on disposal of assets 152,607
Amortization of debt issuance costs 4,866
Interest expense on bonds (21,312,915)
Other (100,916)
(21,055,553)
(6,705,582)
(42,692)
70,541
(6,677,733)
Net Position at Beginning of Year 12,501,591
Net Position at End of Year $ 5,823,858
Total Revenues
SAN JACINTO RIVER AUTHORITY
SCHEDULE OF REVENUES AND EXPENSES
GROUNDWATER REDUCTION PLAN DIVISION
Year Ended August 31, 2016
Transfers
Change in Net Position
Total Expenditures
Operating Net Income (Loss)
Total Nonoperating Revenues
(Expenses)
Income (Loss) Before Transfers and Contributions
Contributions
70
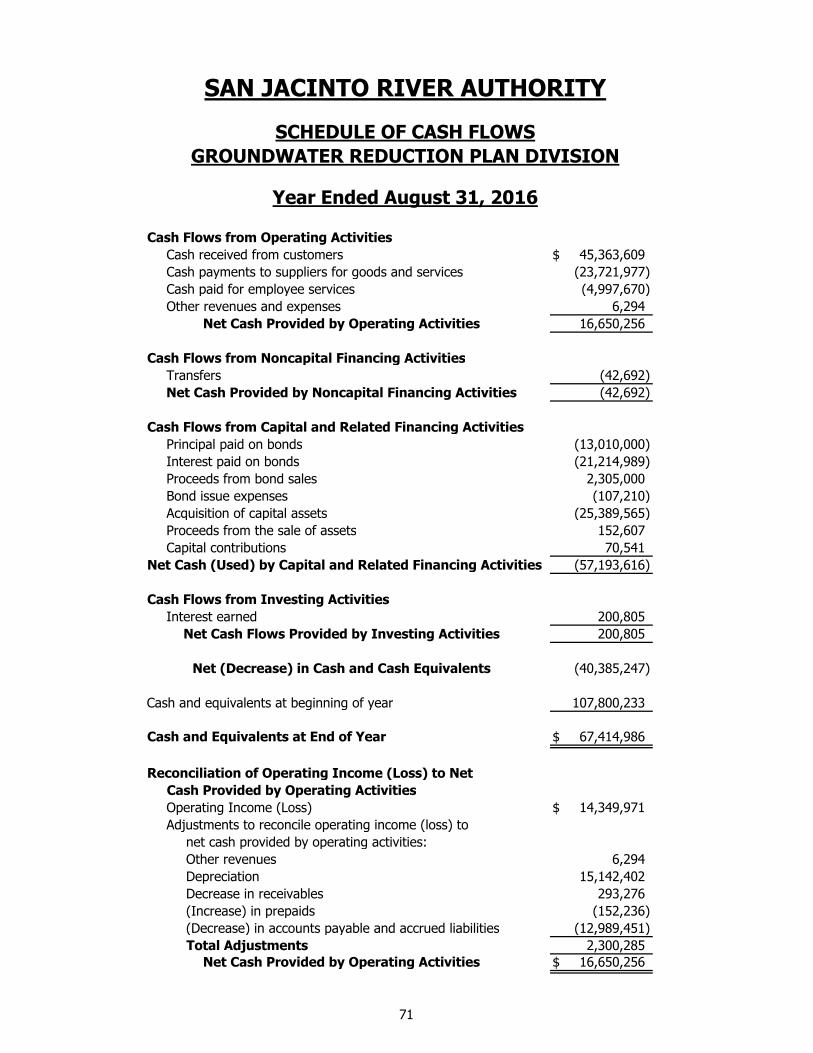
Cash Flows from Operating Activities
Cash received from customers $ 45,363,609
Cash payments to suppliers for goods and services (23,721,977)
Cash paid for employee services (4,997,670)
Other revenues and expenses 6,294
16,650,256
Cash Flows from Noncapital Financing Activities
Transfers (42,692)
(42,692)
Cash Flows from Capital and Related Financing Activities
Principal paid on bonds (13,010,000)
Interest paid on bonds (21,214,989)
Proceeds from bond sales 2,305,000
Bond issue expenses (107,210)
Acquisition of capital assets (25,389,565)
Proceeds from the sale of assets 152,607
Capital contributions 70,541
Net Cash (Used) by Capital and Related Financing Activities (57,193,616)
Cash Flows from Investing Activities
Interest earned 200,805
200,805
(40,385,247)
Cash and equivalents at beginning of year 107,800,233
Cash and Equivalents at End of Year $ 67,414,986
Reconciliation of Operating Income (Loss) to Net
Cash Provided by Operating Activities
Operating Income (Loss) $ 14,349,971
Adjustments to reconcile operating income (loss) to
net cash provided by operating activities:
Other revenues 6,294
Depreciation 15,142,402
Decrease in receivables 293,276
(Increase) in prepaids (152,236)
(Decrease) in accounts payable and accrued liabilities (12,989,451)
Total Adjustments 2,300,285
$ 16,650,256
Net Cash Provided by Operating Activities
Net Cash Flows Provided by Investing Activities
Net (Decrease) in Cash and Cash Equivalents
Net Cash Provided by Operating Activities
SAN JACINTO RIVER AUTHORITY
SCHEDULE OF CASH FLOWS
GROUNDWATER REDUCTION PLAN DIVISION
Year Ended August 31, 2016
Net Cash Provided by Noncapital Financing Activities
71
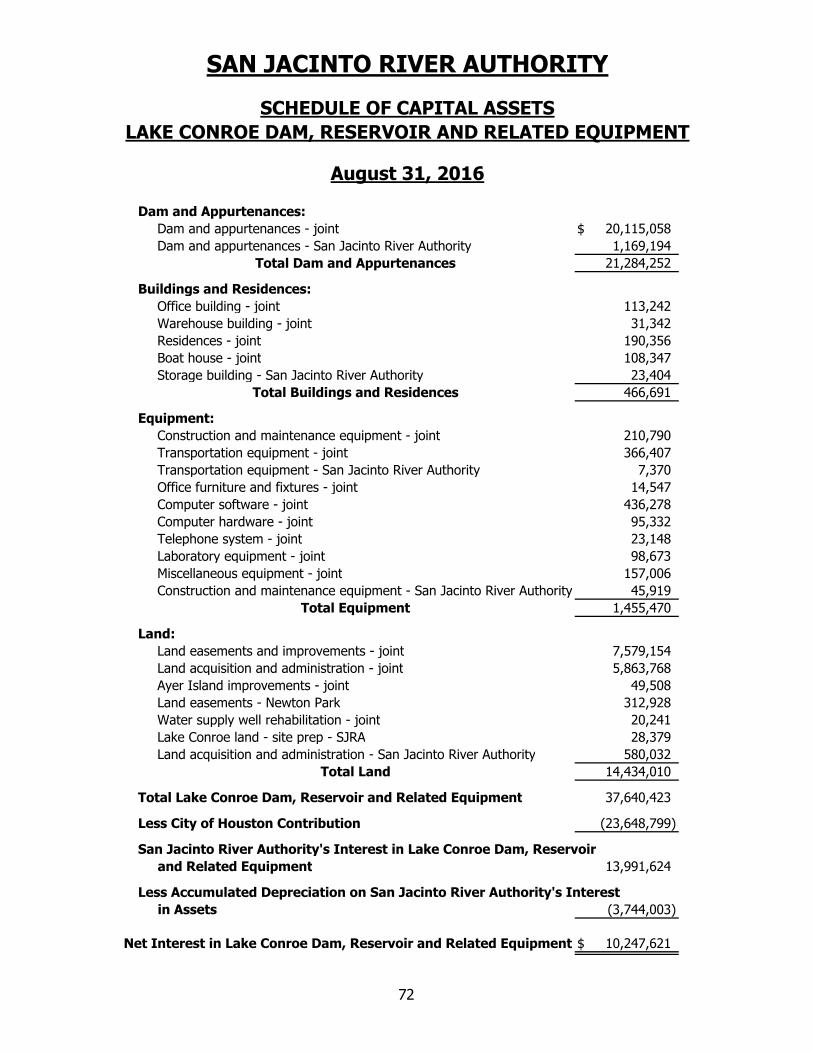
Dam and Appurtenances:
Dam and appurtenances - joint $ 20,115,058
Dam and appurtenances - San Jacinto River Authority 1,169,194
21,284,252
Buildings and Residences:
Office building - joint 113,242
Warehouse building - joint 31,342
Residences - joint 190,356
Boat house - joint 108,347
Storage building - San Jacinto River Authority 23,404
466,691
Equipment:
Construction and maintenance equipment - joint 210,790
Transportation equipment - joint 366,407
Transportation equipment - San Jacinto River Authority 7,370
Office furniture and fixtures - joint 14,547
Computer software - joint 436,278
Computer hardware - joint 95,332
Telephone system - joint 23,148
Laboratory equipment - joint 98,673
Miscellaneous equipment - joint 157,006
Construction and maintenance equipment - San Jacinto River Authority 45,919
1,455,470
Land:
Land easements and improvements - joint 7,579,154
Land acquisition and administration - joint 5,863,768
Ayer Island improvements - joint 49,508
Land easements - Newton Park 312,928
Water supply well rehabilitation - joint 20,241
Lake Conroe land - site prep - SJRA 28,379
Land acquisition and administration - San Jacinto River Authority 580,032
14,434,010
Total Lake Conroe Dam, Reservoir and Related Equipment 37,640,423
Less City of Houston Contribution (23,648,799)
San Jacinto River Authority's Interest in Lake Conroe Dam, Reservoir
and Related Equipment 13,991,624
Less Accumulated Depreciation on San Jacinto River Authority's Interest
in Assets (3,744,003)
$ 10,247,621Net Interest in Lake Conroe Dam, Reservoir and Related Equipment
SAN JACINTO RIVER AUTHORITY
LAKE CONROE DAM, RESERVOIR AND RELATED EQUIPMENT
August 31, 2016
Total Dam and Appurtenances
Total Buildings and Residences
Total Equipment
Total Land
SCHEDULE OF CAPITAL ASSETS
72
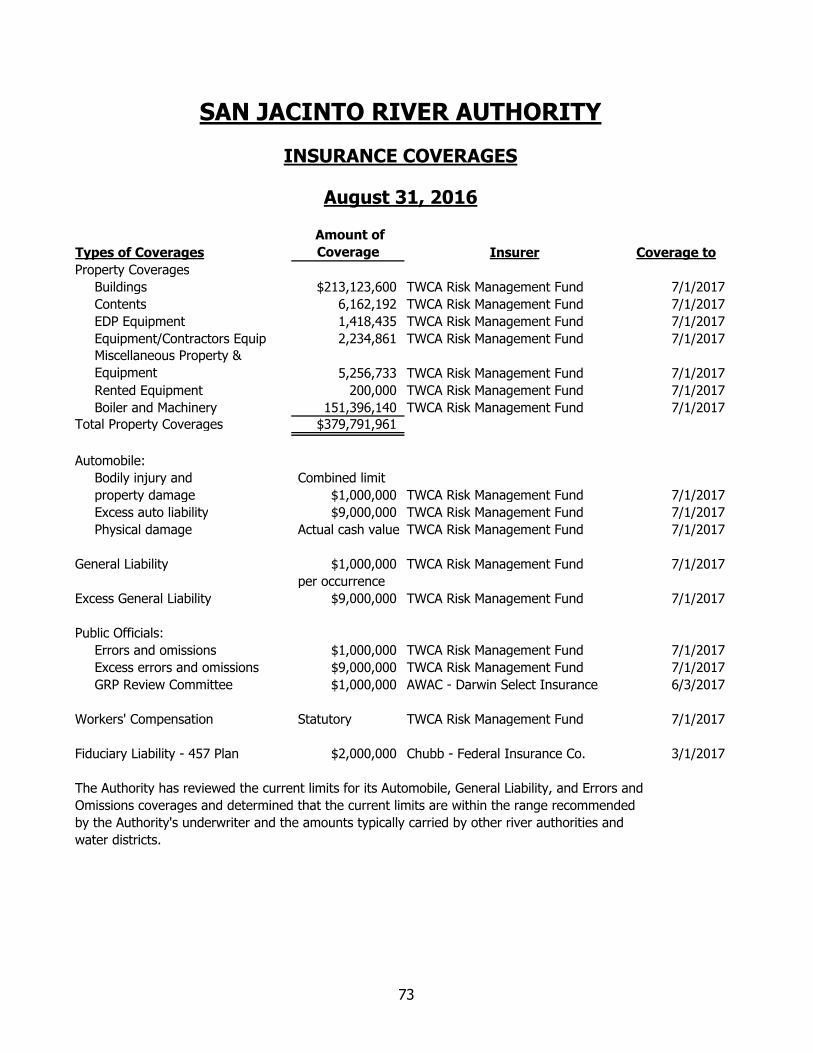
Types of Coverages
Amount of
Coverage Insurer Coverage to
Property Coverages
Buildings $213,123,600 TWCA Risk Management Fund 7/1/2017
Contents 6,162,192 TWCA Risk Management Fund 7/1/2017
EDP Equipment 1,418,435 TWCA Risk Management Fund 7/1/2017
Equipment/Contractors Equip 2,234,861 TWCA Risk Management Fund 7/1/2017
Miscellaneous Property &
Equipment 5,256,733 TWCA Risk Management Fund 7/1/2017
Rented Equipment 200,000 TWCA Risk Management Fund 7/1/2017
Boiler and Machinery 151,396,140 TWCA Risk Management Fund 7/1/2017
Total Property Coverages $379,791,961
Automobile:
Bodily injury and Combined limit
property damage $1,000,000 TWCA Risk Management Fund 7/1/2017
Excess auto liability $9,000,000 TWCA Risk Management Fund 7/1/2017
Physical damage Actual cash value TWCA Risk Management Fund 7/1/2017
General Liability $1,000,000 TWCA Risk Management Fund 7/1/2017
per occurrence
Excess General Liability $9,000,000 TWCA Risk Management Fund 7/1/2017
Public Officials:
Errors and omissions $1,000,000 TWCA Risk Management Fund 7/1/2017
Excess errors and omissions $9,000,000 TWCA Risk Management Fund 7/1/2017
GRP Review Committee $1,000,000 AWAC - Darwin Select Insurance 6/3/2017
Workers' Compensation Statutory TWCA Risk Management Fund 7/1/2017
Fiduciary Liability - 457 Plan $2,000,000 Chubb - Federal Insurance Co. 3/1/2017
The Authority has reviewed the current limits for its Automobile, General Liability, and Errors and
Omissions coverages and determined that the current limits are within the range recommended
by the Authority's underwriter and the amounts typically carried by other river authorities and
water districts.
SAN JACINTO RIVER AUTHORITY
INSURANCE COVERAGES
August 31, 2016
73
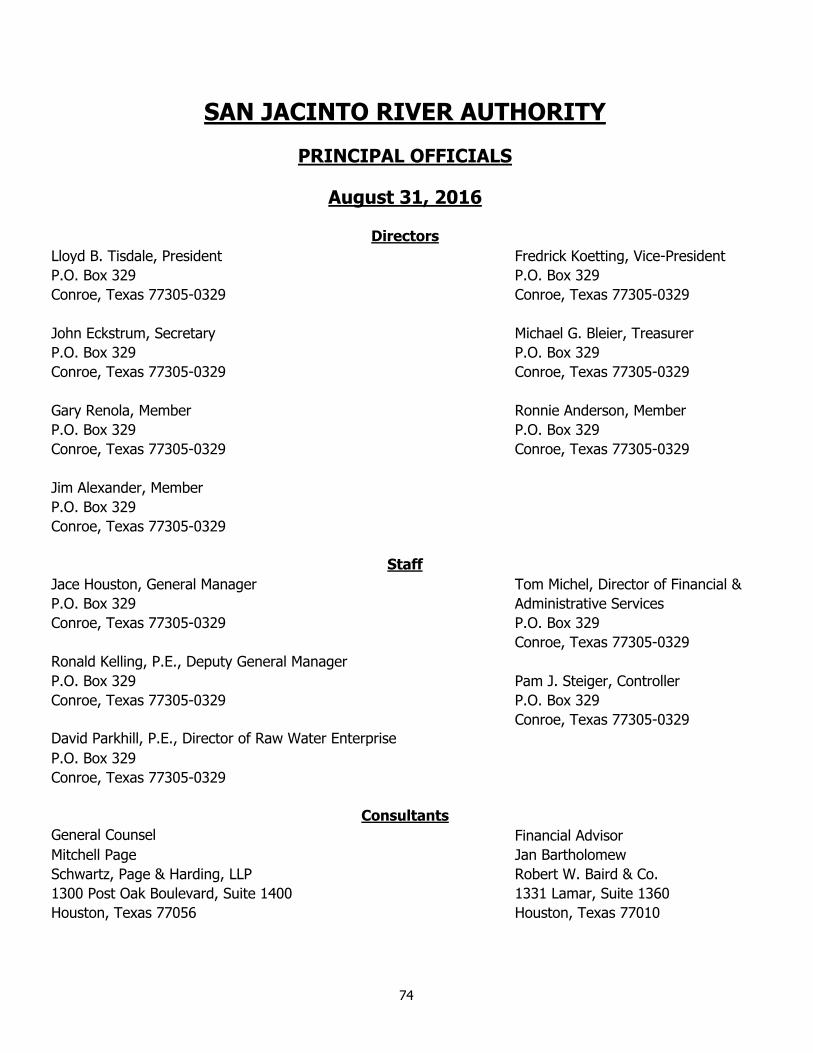
Lloyd B. Tisdale, President Fredrick Koetting, Vice-President
P.O. Box 329 P.O. Box 329
Conroe, Texas 77305-0329 Conroe, Texas 77305-0329
John Eckstrum, Secretary Michael G. Bleier, Treasurer
P.O. Box 329 P.O. Box 329
Conroe, Texas 77305-0329 Conroe, Texas 77305-0329
Gary Renola, Member Ronnie Anderson, Member
P.O. Box 329 P.O. Box 329
Conroe, Texas 77305-0329 Conroe, Texas 77305-0329
Jim Alexander, Member
P.O. Box 329
Conroe, Texas 77305-0329
Jace Houston, General Manager Tom Michel, Director of Financial &
P.O. Box 329 Administrative Services
Conroe, Texas 77305-0329 P.O. Box 329
Conroe, Texas 77305-0329
Ronald Kelling, P.E., Deputy General Manager
P.O. Box 329 Pam J. Steiger, Controller
Conroe, Texas 77305-0329 P.O. Box 329
Conroe, Texas 77305-0329
David Parkhill, P.E., Director of Raw Water Enterprise
P.O. Box 329
Conroe, Texas 77305-0329
General Counsel Financial Advisor
Mitchell Page Jan Bartholomew
Schwartz, Page & Harding, LLP Robert W. Baird & Co.
1300 Post Oak Boulevard, Suite 1400 1331 Lamar, Suite 1360
Houston, Texas 77056 Houston, Texas 77010
Consultants
SAN JACINTO RIVER AUTHORITY
PRINCIPAL OFFICIALS
August 31, 2016
Directors
Staff
74
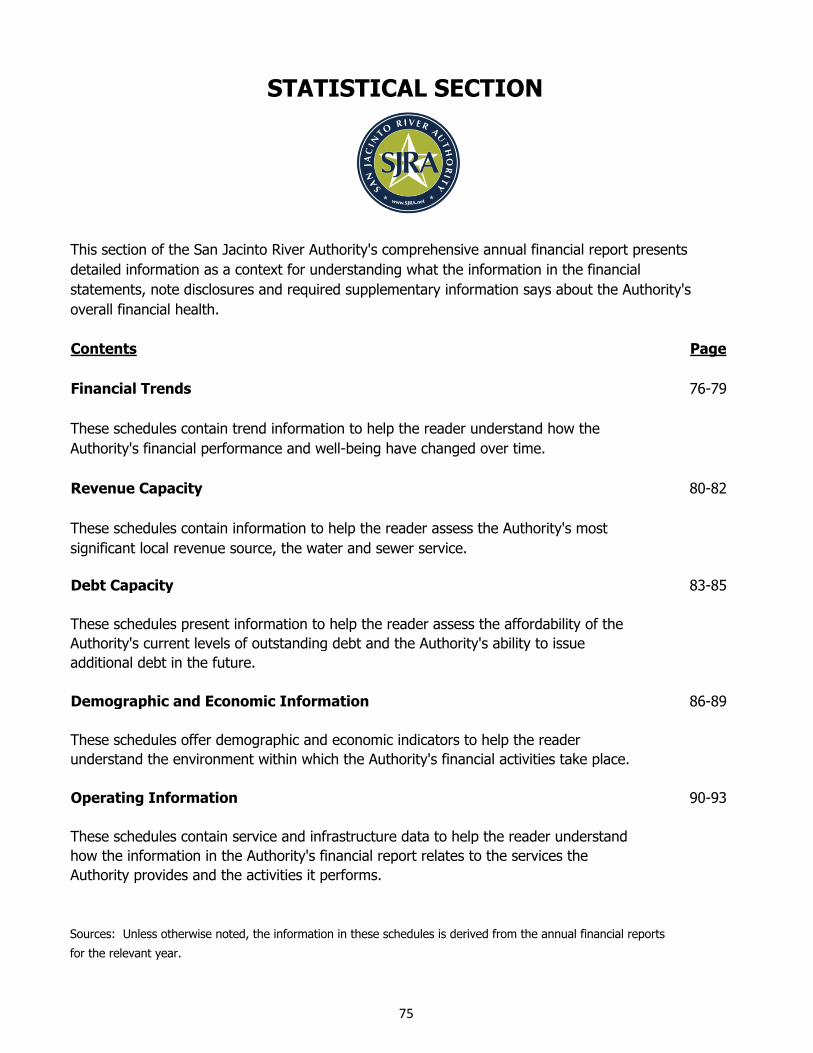
overall financial health.
Contents Page
Financial Trends 76-79
These schedules contain trend information to help the reader understand how the
Authority's financial performance and well-being have changed over time.
Revenue Capacity 80-82
These schedules contain information to help the reader assess the Authority's most
significant local revenue source, the water and sewer service.
Debt Capacity 83-85
These schedules present information to help the reader assess the affordability of the
Authority's current levels of outstanding debt and the Authority's ability to issue
additional debt in the future.
Demographic and Economic Information 86-89
These schedules offer demographic and economic indicators to help the reader
understand the environment within which the Authority's financial activities take place.
Operating Information 90-93
These schedules contain service and infrastructure data to help the reader understand
how the information in the Authority's financial report relates to the services the
Authority provides and the activities it performs.
for the relevant year.
STATISTICAL SECTION
This section of the San Jacinto River Authority's comprehensive annual financial report presents
detailed information as a context for understanding what the information in the financial
statements, note disclosures and required supplementary information says about the Authority's
Sources: Unless otherwise noted, the information in these schedules is derived from the annual financial reports
75
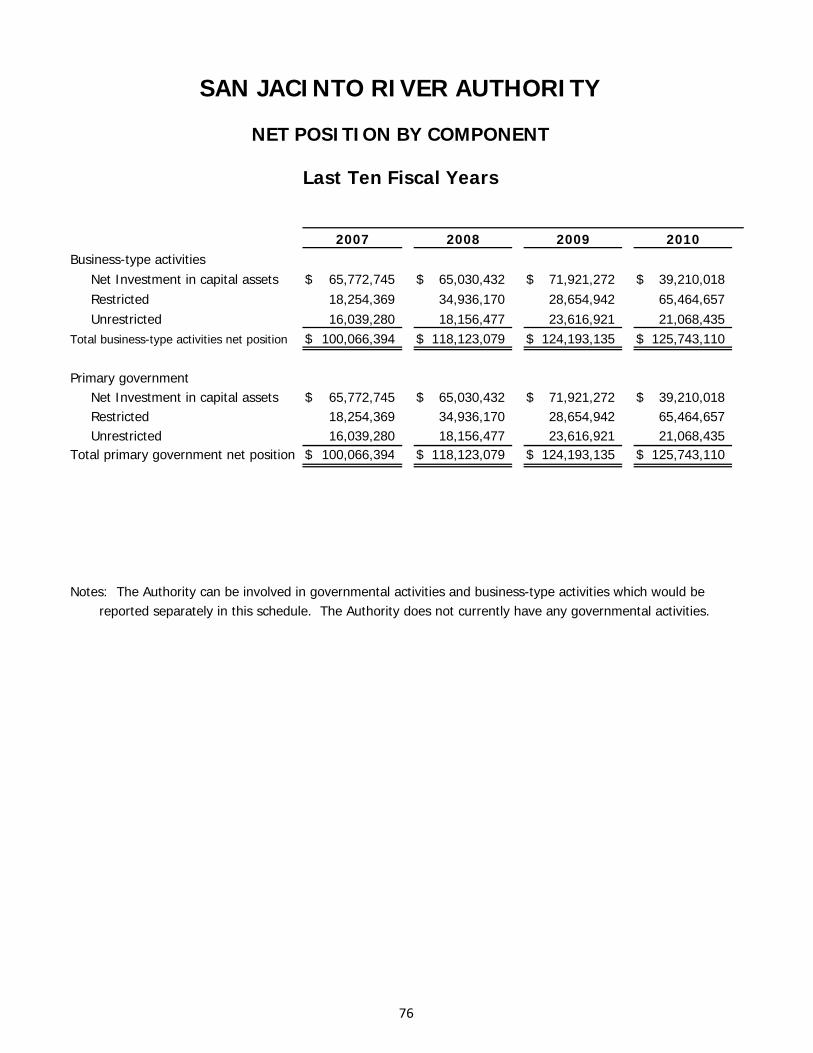
Business-type activities Net Investment in capital assets $ 65,772,745 $ 65,030,432 $ 71,921,272 $ 39,210,018 Restricted 18,254,369 34,936,170 28,654,942 65,464,657 Unrestricted 16,039,280 18,156,477 23,616,921 21,068,435Total business-type activities net position $ 100,066,394 $ 118,123,079 $ 124,193,135 $ 125,743,110
Primary government Net Investment in capital assets $ 65,772,745 $ 65,030,432 $ 71,921,272 $ 39,210,018 Restricted 18,254,369 34,936,170 28,654,942 65,464,657 Unrestricted 16,039,280 18,156,477 23,616,921 21,068,435Total primary government net position $ 100,066,394 $ 118,123,079 $ 124,193,135 $ 125,743,110
Notes: The Authority can be involved in governmental activities and business-type activities which would be reported separately in this schedule. The Authority does not currently have any governmental activities.
SAN JACINTO RIVER AUTHORITY
NET POSITION BY COMPONENT
Last Ten Fiscal Years
20102007 2008 2009
76
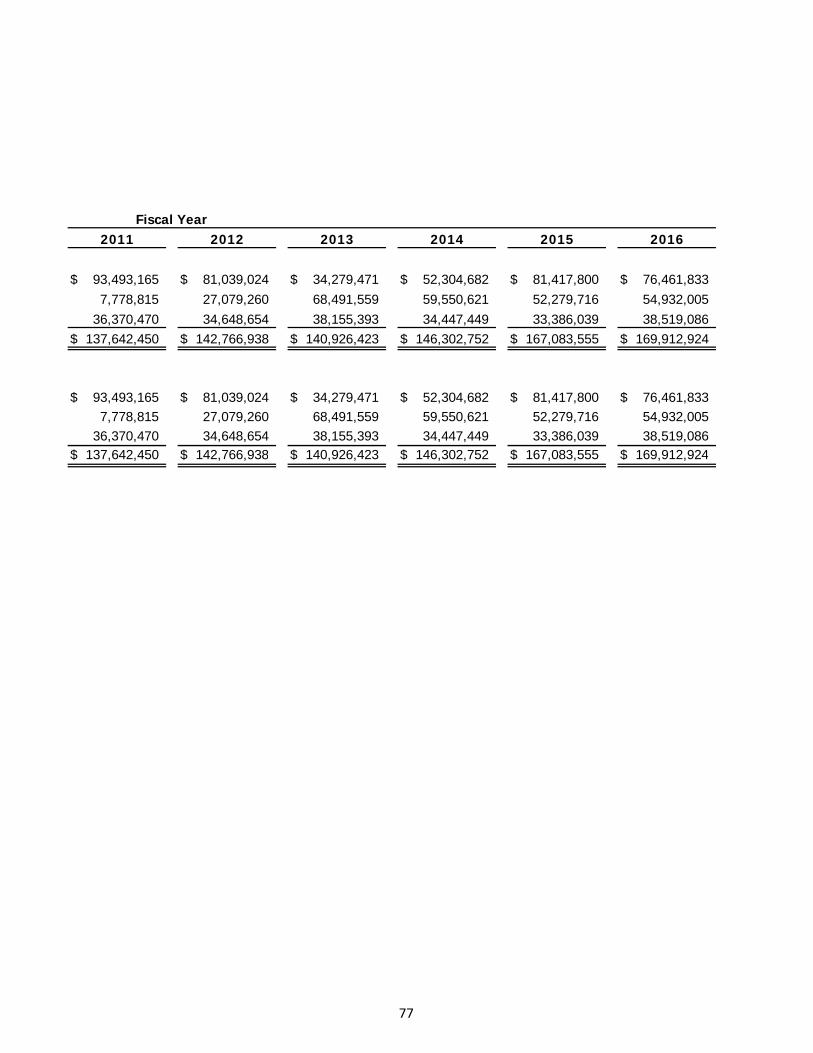
$ 93,493,165 $ 81,039,024 $ 34,279,471 $ 52,304,682 $ 81,417,800 $ 76,461,8337,778,815 27,079,260 68,491,559 59,550,621 52,279,716 54,932,005
36,370,470 34,648,654 38,155,393 34,447,449 33,386,039 38,519,086$ 137,642,450 $ 142,766,938 $ 140,926,423 $ 146,302,752 $ 167,083,555 $ 169,912,924
$ 93,493,165 $ 81,039,024 $ 34,279,471 $ 52,304,682 $ 81,417,800 $ 76,461,8337,778,815 27,079,260 68,491,559 59,550,621 52,279,716 54,932,005
36,370,470 34,648,654 38,155,393 34,447,449 33,386,039 38,519,086$ 137,642,450 $ 142,766,938 $ 140,926,423 $ 146,302,752 $ 167,083,555 $ 169,912,924
Fiscal Year20162011 2012 20152013 2014
77
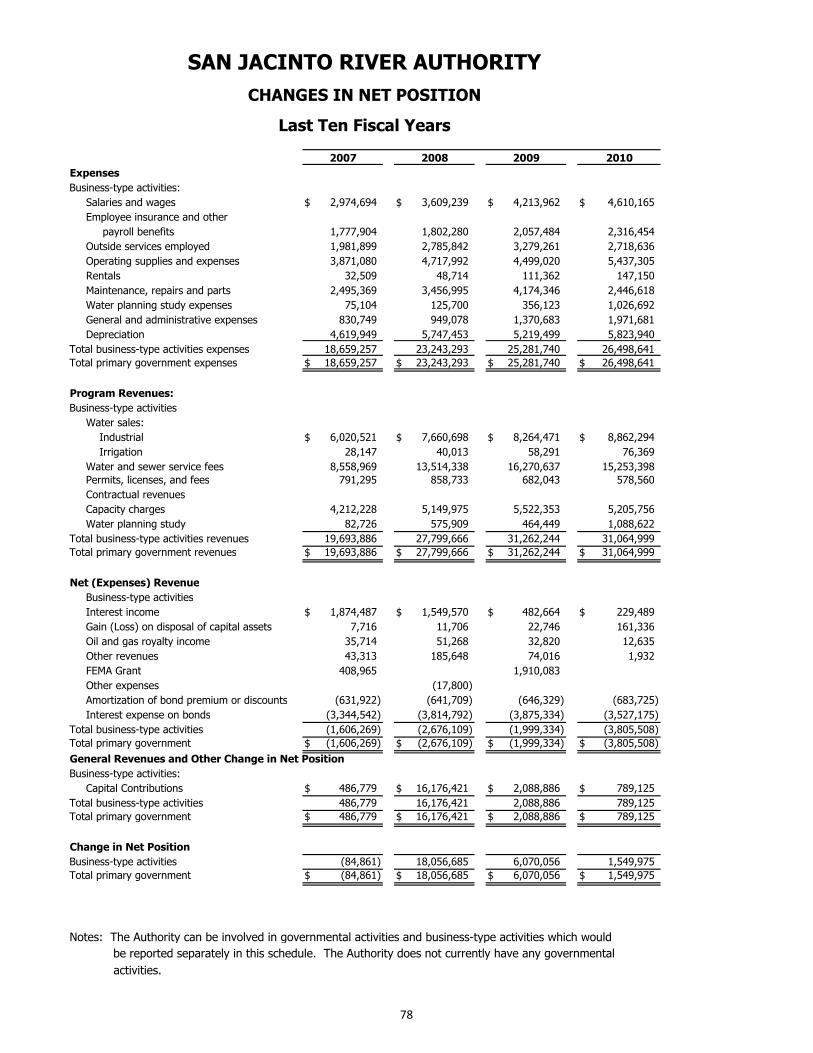
Expenses
Business-type activities:
Salaries and wages $ 2,974,694 $ 3,609,239 $ 4,213,962 $ 4,610,165
Employee insurance and other
payroll benefits 1,777,904 1,802,280 2,057,484 2,316,454
Outside services employed 1,981,899 2,785,842 3,279,261 2,718,636
Operating supplies and expenses 3,871,080 4,717,992 4,499,020 5,437,305
Rentals 32,509 48,714 111,362 147,150
Maintenance, repairs and parts 2,495,369 3,456,995 4,174,346 2,446,618
Water planning study expenses 75,104 125,700 356,123 1,026,692
General and administrative expenses 830,749 949,078 1,370,683 1,971,681
Depreciation 4,619,949 5,747,453 5,219,499 5,823,940
Total business-type activities expenses 18,659,257 23,243,293 25,281,740 26,498,641
Total primary government expenses $ 18,659,257 $ 23,243,293 $ 25,281,740 $ 26,498,641
Program Revenues:
Business-type activities
Water sales:
Industrial $ 6,020,521 $ 7,660,698 $ 8,264,471 $ 8,862,294
Irrigation 28,147 40,013 58,291 76,369
Water and sewer service fees 8,558,969 13,514,338 16,270,637 15,253,398
Permits, licenses, and fees 791,295 858,733 682,043 578,560
Contractual revenues
Capacity charges 4,212,228 5,149,975 5,522,353 5,205,756
Water planning study 82,726 575,909 464,449 1,088,622
Total business-type activities revenues 19,693,886 27,799,666 31,262,244 31,064,999
Total primary government revenues $ 19,693,886 $ 27,799,666 $ 31,262,244 $ 31,064,999
Net (Expenses) Revenue
Business-type activities
Interest income $ 1,874,487 $ 1,549,570 $ 482,664 $ 229,489
Gain (Loss) on disposal of capital assets 7,716 11,706 22,746 161,336
Oil and gas royalty income 35,714 51,268 32,820 12,635
Other revenues 43,313 185,648 74,016 1,932
FEMA Grant 408,965 1,910,083
Other expenses (17,800)
Amortization of bond premium or discounts (631,922) (641,709) (646,329) (683,725)
Interest expense on bonds (3,344,542) (3,814,792) (3,875,334) (3,527,175)
Total business-type activities (1,606,269) (2,676,109) (1,999,334) (3,805,508)
Total primary government $ (1,606,269) $ (2,676,109) $ (1,999,334) $ (3,805,508)
General Revenues and Other Change in Net Position
Business-type activities:
Capital Contributions $ 486,779 $ 16,176,421 $ 2,088,886 $ 789,125
Total business-type activities 486,779 16,176,421 2,088,886 789,125
Total primary government $ 486,779 $ 16,176,421 $ 2,088,886 $ 789,125
Change in Net Position
Business-type activities (84,861) 18,056,685 6,070,056 1,549,975
Total primary government $ (84,861) $ 18,056,685 $ 6,070,056 $ 1,549,975
Notes: The Authority can be involved in governmental activities and business-type activities which would
be reported separately in this schedule. The Authority does not currently have any governmental
activities.
SAN JACINTO RIVER AUTHORITY
CHANGES IN NET POSITION
Last Ten Fiscal Years
20102007 2008 2009
78
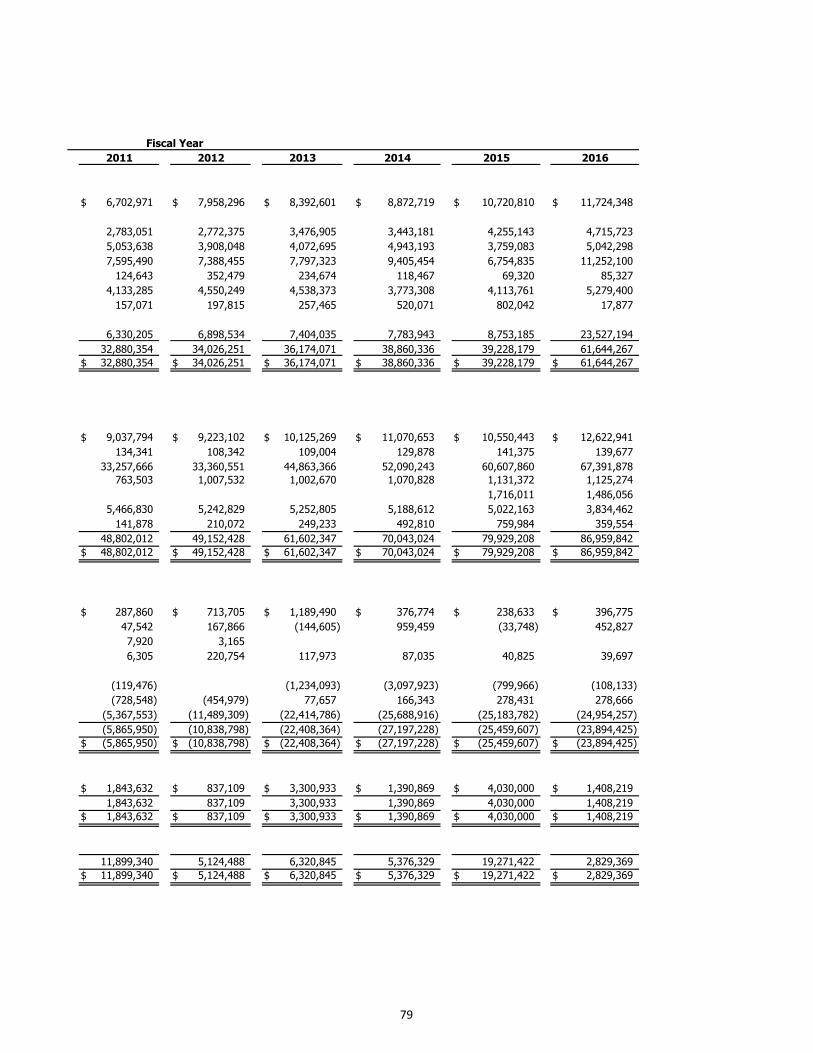
$ 6,702,971 $ 7,958,296 $ 8,392,601 $ 8,872,719 $ 10,720,810 $ 11,724,348
2,783,051 2,772,375 3,476,905 3,443,181 4,255,143 4,715,723
5,053,638 3,908,048 4,072,695 4,943,193 3,759,083 5,042,298
7,595,490 7,388,455 7,797,323 9,405,454 6,754,835 11,252,100
124,643 352,479 234,674 118,467 69,320 85,327
4,133,285 4,550,249 4,538,373 3,773,308 4,113,761 5,279,400
157,071 197,815 257,465 520,071 802,042 17,877
6,330,205 6,898,534 7,404,035 7,783,943 8,753,185 23,527,194
32,880,354 34,026,251 36,174,071 38,860,336 39,228,179 61,644,267
$ 32,880,354 $ 34,026,251 $ 36,174,071 $ 38,860,336 $ 39,228,179 $ 61,644,267
$ 9,037,794 $ 9,223,102 $ 10,125,269 $ 11,070,653 $ 10,550,443 $ 12,622,941
134,341 108,342 109,004 129,878 141,375 139,677
33,257,666 33,360,551 44,863,366 52,090,243 60,607,860 67,391,878
763,503 1,007,532 1,002,670 1,070,828 1,131,372 1,125,274
1,716,011 1,486,056
5,466,830 5,242,829 5,252,805 5,188,612 5,022,163 3,834,462
141,878 210,072 249,233 492,810 759,984 359,554
48,802,012 49,152,428 61,602,347 70,043,024 79,929,208 86,959,842
$ 48,802,012 $ 49,152,428 $ 61,602,347 $ 70,043,024 $ 79,929,208 $ 86,959,842
$ 287,860 $ 713,705 $ 1,189,490 $ 376,774 $ 238,633 $ 396,775
47,542 167,866 (144,605) 959,459 (33,748) 452,827
7,920 3,165
6,305 220,754 117,973 87,035 40,825 39,697
(119,476) (1,234,093) (3,097,923) (799,966) (108,133)
(728,548) (454,979) 77,657 166,343 278,431 278,666
(5,367,553) (11,489,309) (22,414,786) (25,688,916) (25,183,782) (24,954,257)
(5,865,950) (10,838,798) (22,408,364) (27,197,228) (25,459,607) (23,894,425)
$ (5,865,950) $ (10,838,798) $ (22,408,364) $ (27,197,228) $ (25,459,607) $ (23,894,425)
$ 1,843,632 $ 837,109 $ 3,300,933 $ 1,390,869 $ 4,030,000 $ 1,408,219
1,843,632 837,109 3,300,933 1,390,869 4,030,000 1,408,219
$ 1,843,632 $ 837,109 $ 3,300,933 $ 1,390,869 $ 4,030,000 $ 1,408,219
11,899,340 5,124,488 6,320,845 5,376,329 19,271,422 2,829,369
$ 11,899,340 $ 5,124,488 $ 6,320,845 $ 5,376,329 $ 19,271,422 $ 2,829,369
2011 2012 2014 2016
Fiscal Year
20152013
79
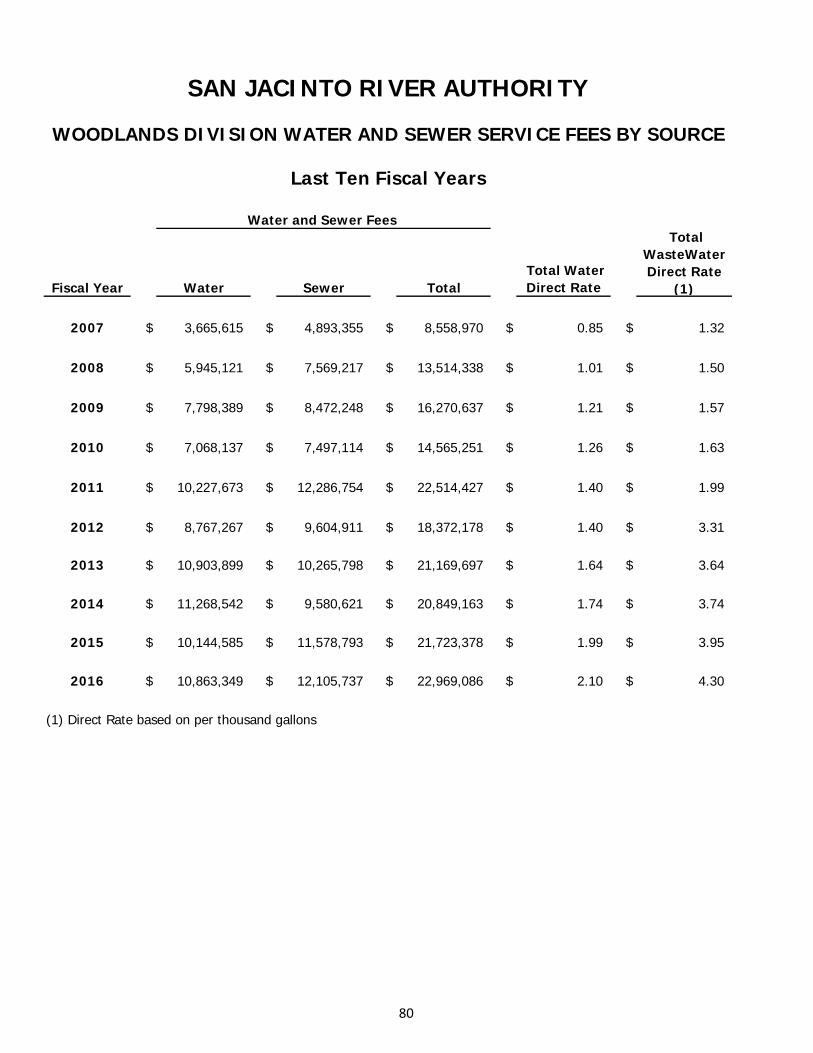
Fiscal Year Water Sewer Total Total Water Direct Rate
Total WasteWater Direct Rate
(1)
2007 $ 3,665,615 $ 4,893,355 $ 8,558,970 $ 0.85 $ 1.32
2008 $ 5,945,121 $ 7,569,217 $ 13,514,338 $ 1.01 $ 1.50
2009 $ 7,798,389 $ 8,472,248 $ 16,270,637 $ 1.21 $ 1.57
2010 $ 7,068,137 $ 7,497,114 $ 14,565,251 $ 1.26 $ 1.63
2011 $ 10,227,673 $ 12,286,754 $ 22,514,427 $ 1.40 $ 1.99
2012 $ 8,767,267 $ 9,604,911 $ 18,372,178 $ 1.40 $ 3.31
2013 $ 10,903,899 $ 10,265,798 $ 21,169,697 $ 1.64 $ 3.64
2014 $ 11,268,542 $ 9,580,621 $ 20,849,163 $ 1.74 $ 3.74
2015 $ 10,144,585 $ 11,578,793 $ 21,723,378 $ 1.99 $ 3.95
2016 $ 10,863,349 $ 12,105,737 $ 22,969,086 $ 2.10 $ 4.30
(1) Direct Rate based on per thousand gallons
SAN JACINTO RIVER AUTHORITY
WOODLANDS DIVISION WATER AND SEWER SERVICE FEES BY SOURCE
Last Ten Fiscal Years
Water and Sewer Fees
80
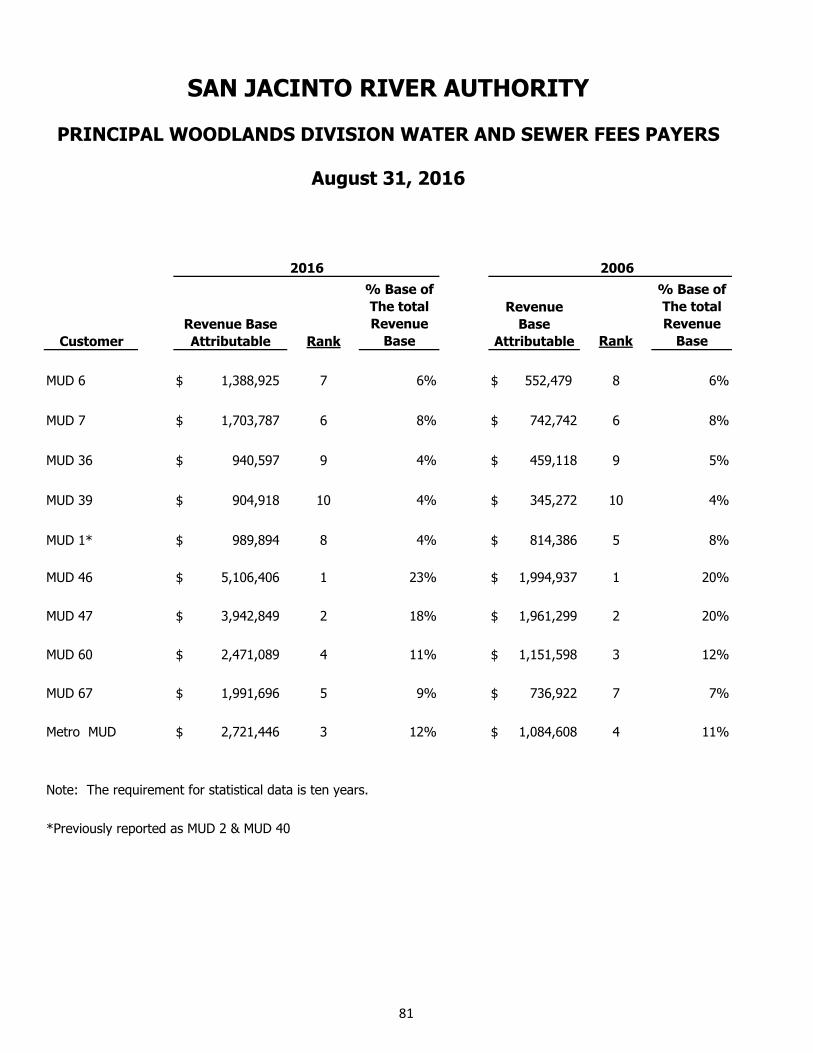
Customer Rank
% Base of
The total
Revenue
Base Rank
% Base of
The total
Revenue
Base
MUD 6 $ 1,388,925 7 6% $ 552,479 8 6%
MUD 7 $ 1,703,787 6 8% $ 742,742 6 8%
MUD 36 $ 940,597 9 4% $ 459,118 9 5%
MUD 39 $ 904,918 10 4% $ 345,272 10 4%
MUD 1* $ 989,894 8 4% $ 814,386 5 8%
MUD 46 $ 5,106,406 1 23% $ 1,994,937 1 20%
MUD 47 $ 3,942,849 2 18% $ 1,961,299 2 20%
MUD 60 $ 2,471,089 4 11% $ 1,151,598 3 12%
MUD 67 $ 1,991,696 5 9% $ 736,922 7 7%
Metro MUD $ 2,721,446 3 12% $ 1,084,608 4 11%
Note: The requirement for statistical data is ten years.
*Previously reported as MUD 2 & MUD 40
SAN JACINTO RIVER AUTHORITY
PRINCIPAL WOODLANDS DIVISION WATER AND SEWER FEES PAYERS
2006
Revenue Base
Attributable
Revenue
Base
Attributable
August 31, 2016
2016
81
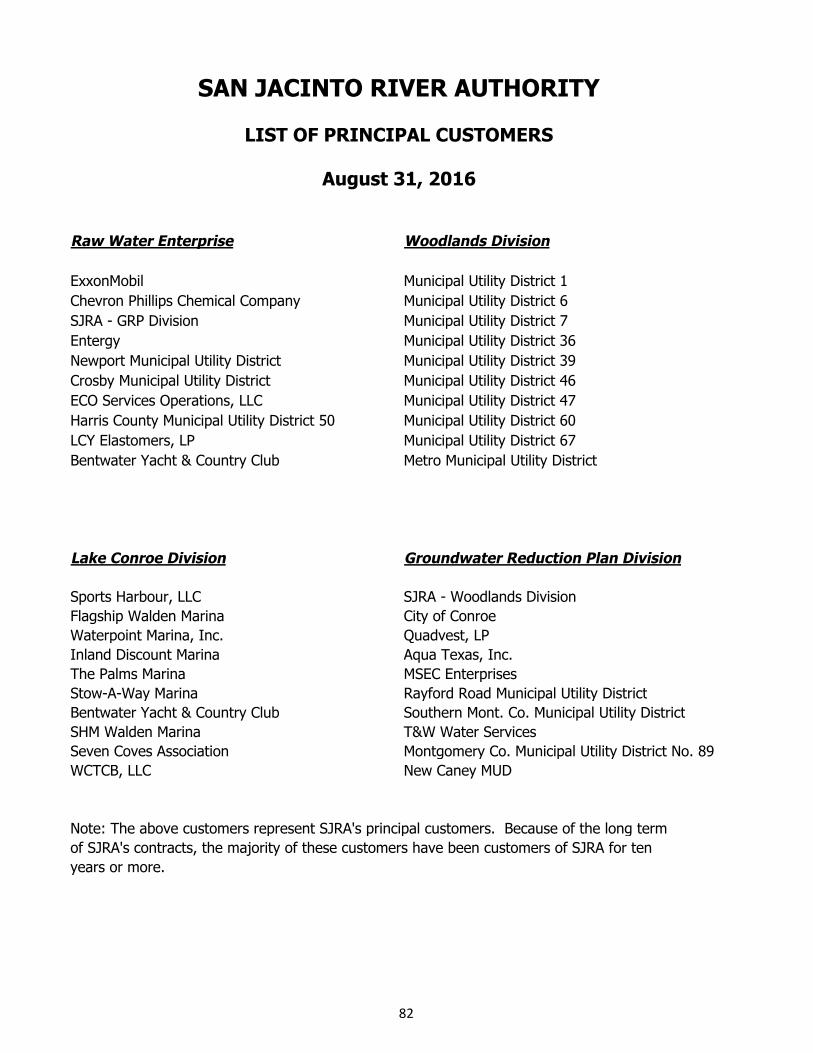
Raw Water Enterprise Woodlands Division
ExxonMobil Municipal Utility District 1
Chevron Phillips Chemical Company Municipal Utility District 6
SJRA - GRP Division Municipal Utility District 7
Entergy Municipal Utility District 36
Newport Municipal Utility District Municipal Utility District 39
Crosby Municipal Utility District Municipal Utility District 46
ECO Services Operations, LLC Municipal Utility District 47
Harris County Municipal Utility District 50 Municipal Utility District 60
LCY Elastomers, LP Municipal Utility District 67
Bentwater Yacht & Country Club Metro Municipal Utility District
Lake Conroe Division Groundwater Reduction Plan Division
Sports Harbour, LLC SJRA - Woodlands Division
Flagship Walden Marina City of Conroe
Waterpoint Marina, Inc. Quadvest, LP
Inland Discount Marina Aqua Texas, Inc.
The Palms Marina MSEC Enterprises
Stow-A-Way Marina Rayford Road Municipal Utility District
Bentwater Yacht & Country Club Southern Mont. Co. Municipal Utility District
SHM Walden Marina T&W Water Services
Seven Coves Association Montgomery Co. Municipal Utility District No. 89
WCTCB, LLC New Caney MUD
Note: The above customers represent SJRA's principal customers. Because of the long term
of SJRA's contracts, the majority of these customers have been customers of SJRA for ten
years or more.
SAN JACINTO RIVER AUTHORITY
LIST OF PRINCIPAL CUSTOMERS
August 31, 2016
82
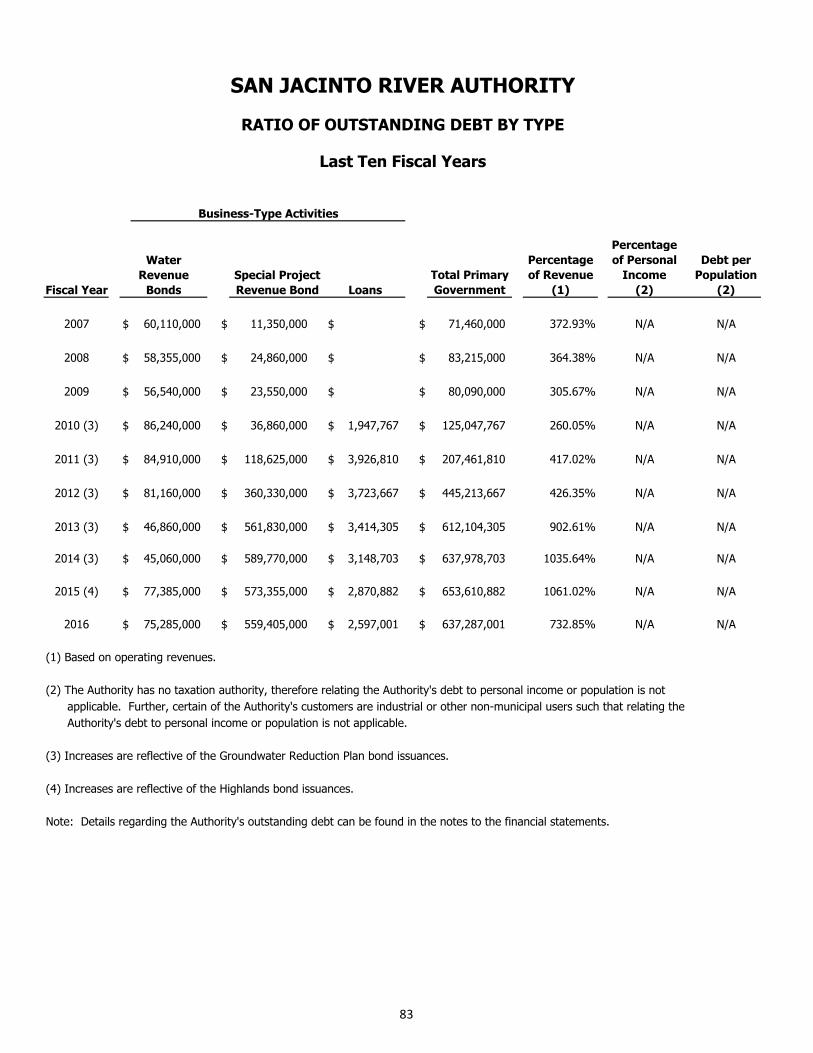
Fiscal Year
Total Primary
Government
Percentage
of Revenue
(1)
Percentage
of Personal
Income
(2)
Debt per
Population
(2)
2007 $ 60,110,000 $ 11,350,000 $ $ 71,460,000 372.93% N/A N/A
2008 $ 58,355,000 $ 24,860,000 $ $ 83,215,000 364.38% N/A N/A
2009 $ 56,540,000 $ 23,550,000 $ $ 80,090,000 305.67% N/A N/A
2010 (3) $ 86,240,000 $ 36,860,000 $ 1,947,767 $ 125,047,767 260.05% N/A N/A
2011 (3) $ 84,910,000 $ 118,625,000 $ 3,926,810 $ 207,461,810 417.02% N/A N/A
2012 (3) $ 81,160,000 $ 360,330,000 $ 3,723,667 $ 445,213,667 426.35% N/A N/A
2013 (3) $ 46,860,000 $ 561,830,000 $ 3,414,305 $ 612,104,305 902.61% N/A N/A
2014 (3) $ 45,060,000 $ 589,770,000 $ 3,148,703 $ 637,978,703 1035.64% N/A N/A
2015 (4) $ 77,385,000 $ 573,355,000 $ 2,870,882 $ 653,610,882 1061.02% N/A N/A
2016 $ 75,285,000 $ 559,405,000 $ 2,597,001 $ 637,287,001 732.85% N/A N/A
(1) Based on operating revenues.
(2) The Authority has no taxation authority, therefore relating the Authority's debt to personal income or population is not
applicable. Further, certain of the Authority's customers are industrial or other non-municipal users such that relating the
Authority's debt to personal income or population is not applicable.
(3) Increases are reflective of the Groundwater Reduction Plan bond issuances.
(4) Increases are reflective of the Highlands bond issuances.
Note: Details regarding the Authority's outstanding debt can be found in the notes to the financial statements.
SAN JACINTO RIVER AUTHORITY
Business-Type Activities
Water
Revenue
Bonds Loans
RATIO OF OUTSTANDING DEBT BY TYPE
Last Ten Fiscal Years
Special Project
Revenue Bond
83
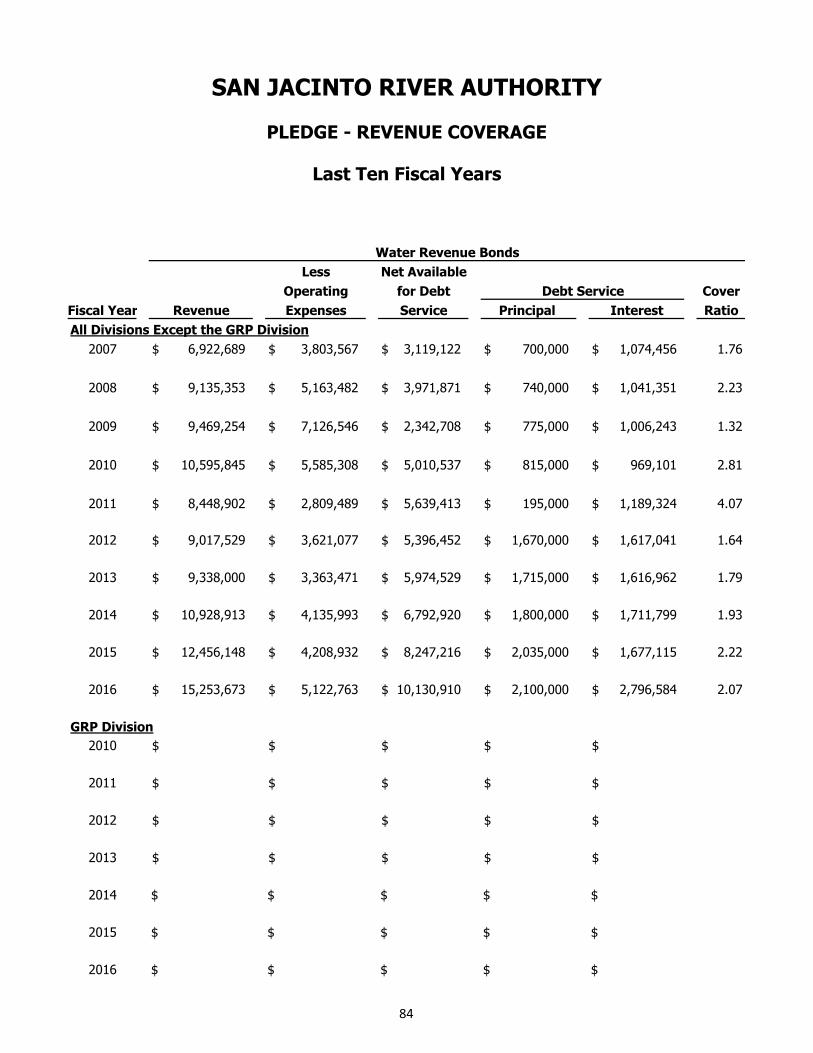
Cover
Fiscal Year Ratio
All Divisions Except the GRP Division
2007 $ 6,922,689 $ 3,803,567 $ 3,119,122 $ 700,000 $ 1,074,456 1.76
2008 $ 9,135,353 $ 5,163,482 $ 3,971,871 $ 740,000 $ 1,041,351 2.23
2009 $ 9,469,254 $ 7,126,546 $ 2,342,708 $ 775,000 $ 1,006,243 1.32
2010 $ 10,595,845 $ 5,585,308 $ 5,010,537 $ 815,000 $ 969,101 2.81
2011 $ 8,448,902 $ 2,809,489 $ 5,639,413 $ 195,000 $ 1,189,324 4.07
2012 $ 9,017,529 $ 3,621,077 $ 5,396,452 $ 1,670,000 $ 1,617,041 1.64
2013 $ 9,338,000 $ 3,363,471 $ 5,974,529 $ 1,715,000 $ 1,616,962 1.79
2014 $ 10,928,913 $ 4,135,993 $ 6,792,920 $ 1,800,000 $ 1,711,799 1.93
2015 $ 12,456,148 $ 4,208,932 $ 8,247,216 $ 2,035,000 $ 1,677,115 2.22
2016 $ 15,253,673 $ 5,122,763 $ 10,130,910 $ 2,100,000 $ 2,796,584 2.07
GRP Division
2010 $ $ $ $ $
2011 $ $ $ $ $
2012 $ $ $ $ $
2013 $ $ $ $ $
2014 $ $ $ $ $
2015 $ $ $ $ $
2016 $ $ $ $ $
Principal Interest
SAN JACINTO RIVER AUTHORITY
PLEDGE - REVENUE COVERAGE
Last Ten Fiscal Years
Revenue
Less
Operating
Expenses
Net Available
for Debt
Service
Water Revenue Bonds
Debt Service
84
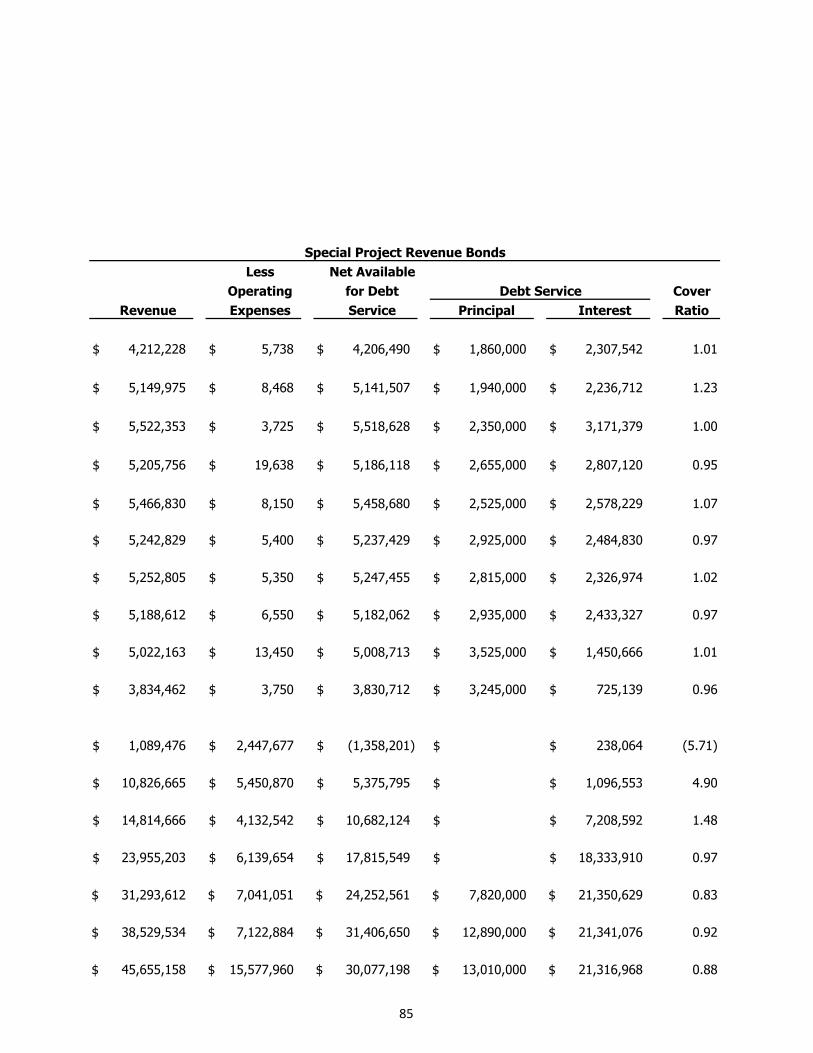
Less Net Available
Operating for Debt Cover
Revenue Expenses Service Principal Interest Ratio
$ 4,212,228 $ 5,738 $ 4,206,490 $ 1,860,000 $ 2,307,542 1.01
$ 5,149,975 $ 8,468 $ 5,141,507 $ 1,940,000 $ 2,236,712 1.23
$ 5,522,353 $ 3,725 $ 5,518,628 $ 2,350,000 $ 3,171,379 1.00
$ 5,205,756 $ 19,638 $ 5,186,118 $ 2,655,000 $ 2,807,120 0.95
$ 5,466,830 $ 8,150 $ 5,458,680 $ 2,525,000 $ 2,578,229 1.07
$ 5,242,829 $ 5,400 $ 5,237,429 $ 2,925,000 $ 2,484,830 0.97
$ 5,252,805 $ 5,350 $ 5,247,455 $ 2,815,000 $ 2,326,974 1.02
$ 5,188,612 $ 6,550 $ 5,182,062 $ 2,935,000 $ 2,433,327 0.97
$ 5,022,163 $ 13,450 $ 5,008,713 $ 3,525,000 $ 1,450,666 1.01
$ 3,834,462 $ 3,750 $ 3,830,712 $ 3,245,000 $ 725,139 0.96
$ 1,089,476 $ 2,447,677 $ (1,358,201) $ $ 238,064 (5.71)
$ 10,826,665 $ 5,450,870 $ 5,375,795 $ $ 1,096,553 4.90
$ 14,814,666 $ 4,132,542 $ 10,682,124 $ $ 7,208,592 1.48
$ 23,955,203 $ 6,139,654 $ 17,815,549 $ $ 18,333,910 0.97
$ 31,293,612 $ 7,041,051 $ 24,252,561 $ 7,820,000 $ 21,350,629 0.83
$ 38,529,534 $ 7,122,884 $ 31,406,650 $ 12,890,000 $ 21,341,076 0.92
$ 45,655,158 $ 15,577,960 $ 30,077,198 $ 13,010,000 $ 21,316,968 0.88
Special Project Revenue Bonds
Debt Service
85
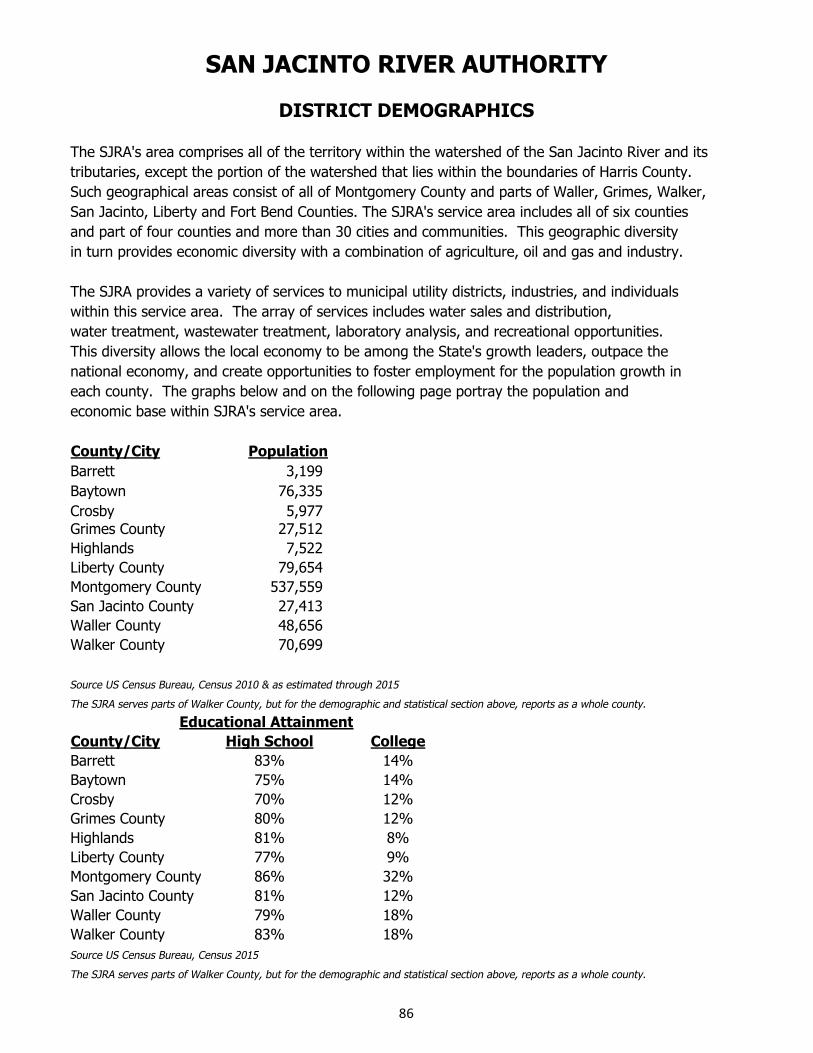
The SJRA's area comprises all of the territory within the watershed of the San Jacinto River and its tributaries, except the portion of the watershed that lies within the boundaries of Harris County. Such geographical areas consist of all of Montgomery County and parts of Waller, Grimes, Walker, San Jacinto, Liberty and Fort Bend Counties. The SJRA's service area includes all of six counties
and part of four counties and more than 30 cities and communities. This geographic diversity
in turn provides economic diversity with a combination of agriculture, oil and gas and industry.
The SJRA provides a variety of services to municipal utility districts, industries, and individuals within this service area. The array of services includes water sales and distribution,
water treatment, wastewater treatment, laboratory analysis, and recreational opportunities.
This diversity allows the local economy to be among the State's growth leaders, outpace the
national economy, and create opportunities to foster employment for the population growth in each county. The graphs below and on the following page portray the population and
economic base within SJRA's service area.
County/City Population
Barrett 3,199
Baytown 76,335
Crosby 5,977Grimes County 27,512
Highlands 7,522
Liberty County 79,654
Montgomery County 537,559
San Jacinto County 27,413
Waller County 48,656
Walker County 70,699
Source US Census Bureau, Census 2010 & as estimated through 2015
The SJRA serves parts of Walker County, but for the demographic and statistical section above, reports as a whole county.
County/City High School College
Barrett 83% 14%
Baytown 75% 14%
Crosby 70% 12%
Grimes County 80% 12%
Highlands 81% 8%
Liberty County 77% 9%
Montgomery County 86% 32%
San Jacinto County 81% 12%
Waller County 79% 18%
Walker County 83% 18%
Source US Census Bureau, Census 2015
The SJRA serves parts of Walker County, but for the demographic and statistical section above, reports as a whole county.
SAN JACINTO RIVER AUTHORITY
DISTRICT DEMOGRAPHICS
Educational Attainment
86
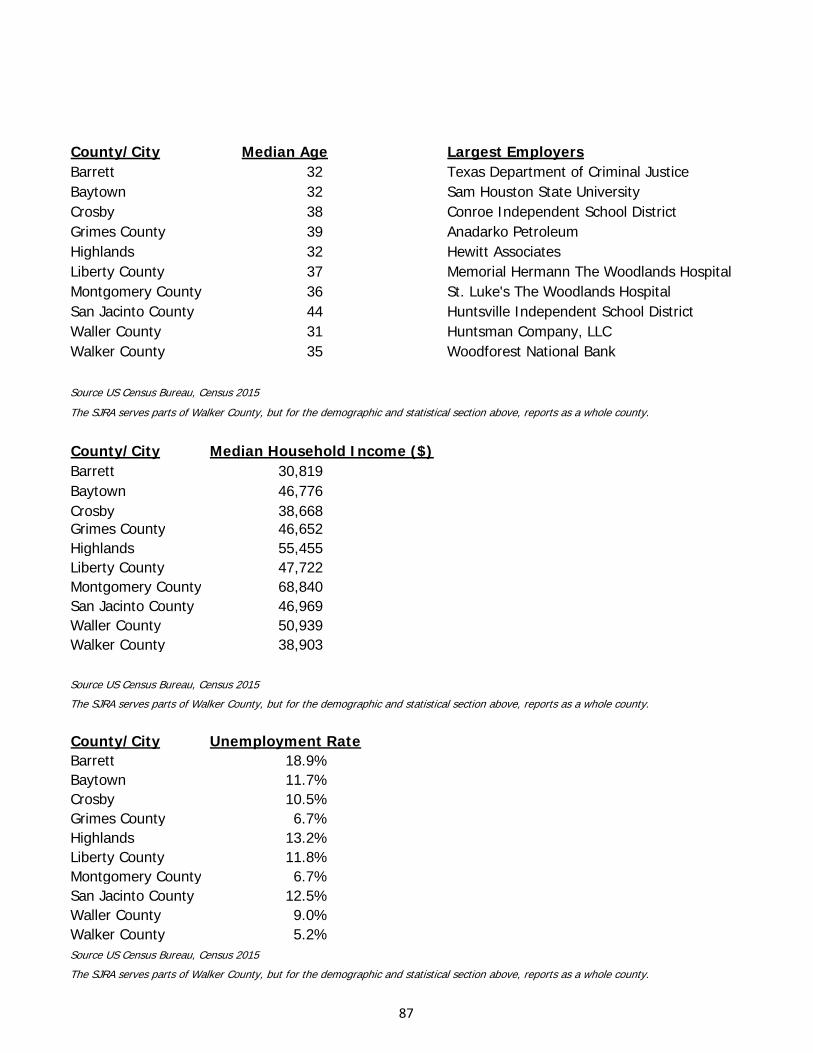
County/City Median Age Largest EmployersBarrett 32 Texas Department of Criminal JusticeBaytown 32 Sam Houston State UniversityCrosby 38 Conroe Independent School DistrictGrimes County 39 Anadarko PetroleumHighlands 32 Hewitt AssociatesLiberty County 37 Memorial Hermann The Woodlands HospitalMontgomery County 36 St. Luke's The Woodlands HospitalSan Jacinto County 44 Huntsville Independent School DistrictWaller County 31 Huntsman Company, LLCWalker County 35 Woodforest National Bank
Source US Census Bureau, Census 2015
The SJRA serves parts of Walker County, but for the demographic and statistical section above, reports as a whole county.
County/City Median Household Income ($)Barrett 30,819Baytown 46,776Crosby 38,668Grimes County 46,652Highlands 55,455Liberty County 47,722Montgomery County 68,840San Jacinto County 46,969Waller County 50,939Walker County 38,903
Source US Census Bureau, Census 2015
The SJRA serves parts of Walker County, but for the demographic and statistical section above, reports as a whole county.
County/City Unemployment RateBarrett 18.9%Baytown 11.7%Crosby 10.5%Grimes County 6.7%Highlands 13.2%Liberty County 11.8%Montgomery County 6.7%San Jacinto County 12.5%Waller County 9.0%Walker County 5.2%Source US Census Bureau, Census 2015
The SJRA serves parts of Walker County, but for the demographic and statistical section above, reports as a whole county.
87
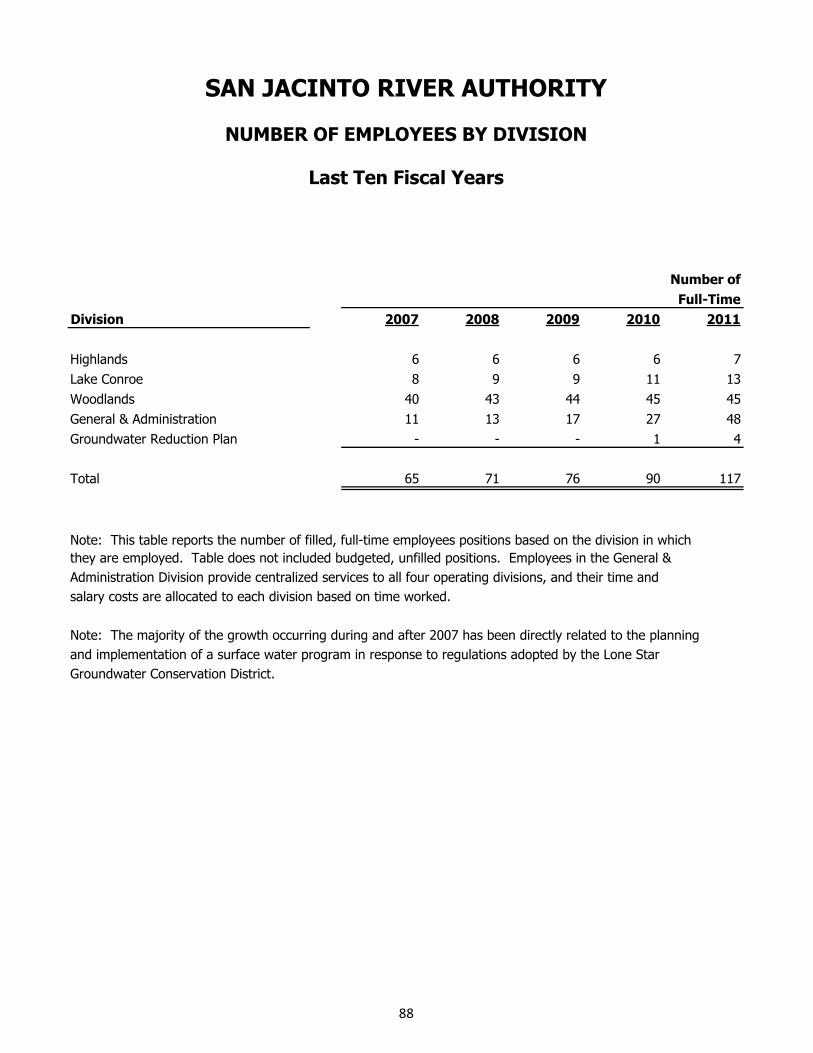
Division 2007 2008 2009 2010 2011
Highlands 6 6 6 6 7
Lake Conroe 8 9 9 11 13
Woodlands 40 43 44 45 45
General & Administration 11 13 17 27 48
Groundwater Reduction Plan - - - 1 4
Total 65 71 76 90 117
Note: This table reports the number of filled, full-time employees positions based on the division in which
they are employed. Table does not included budgeted, unfilled positions. Employees in the General &
Administration Division provide centralized services to all four operating divisions, and their time and
salary costs are allocated to each division based on time worked.
Note: The majority of the growth occurring during and after 2007 has been directly related to the planning
and implementation of a surface water program in response to regulations adopted by the Lone Star
Groundwater Conservation District.
SAN JACINTO RIVER AUTHORITY
NUMBER OF EMPLOYEES BY DIVISION
Full-Time
Number of
Last Ten Fiscal Years
88
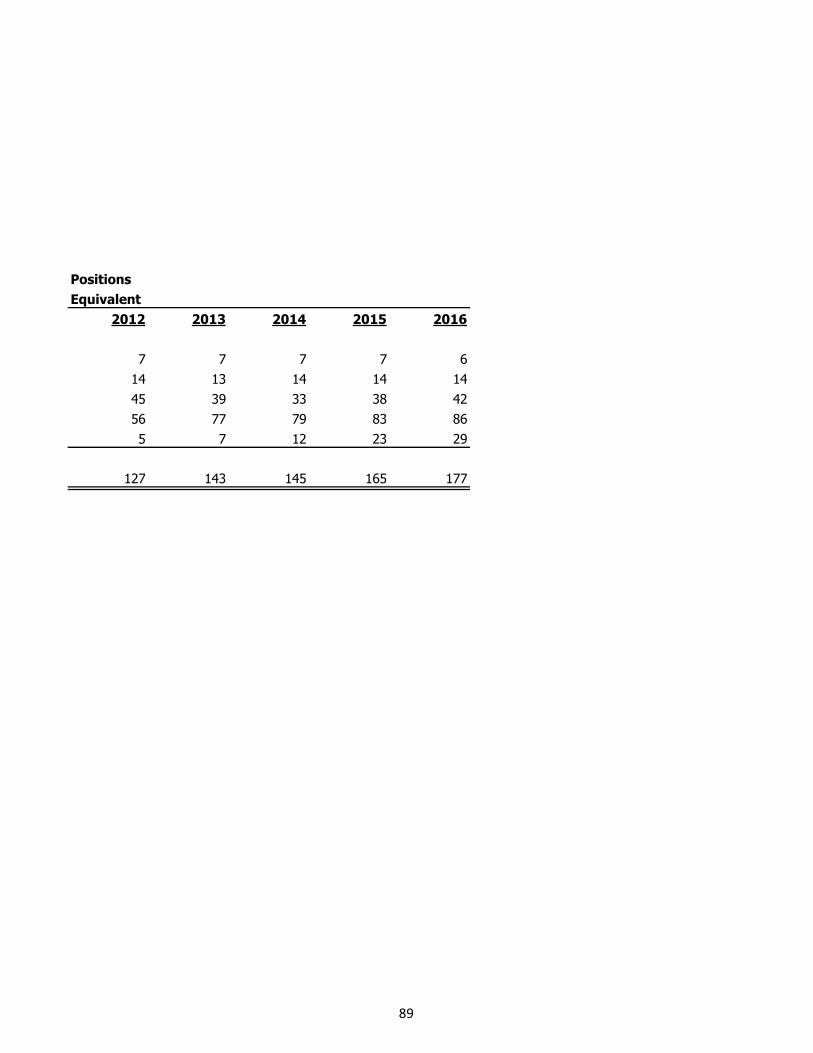
2012 2013 2014 2015 2016
7 7 7 7 6
14 13 14 14 14
45 39 33 38 42
56 77 79 83 86
5 7 12 23 29
127 143 145 165 177
Positions
Equivalent
89
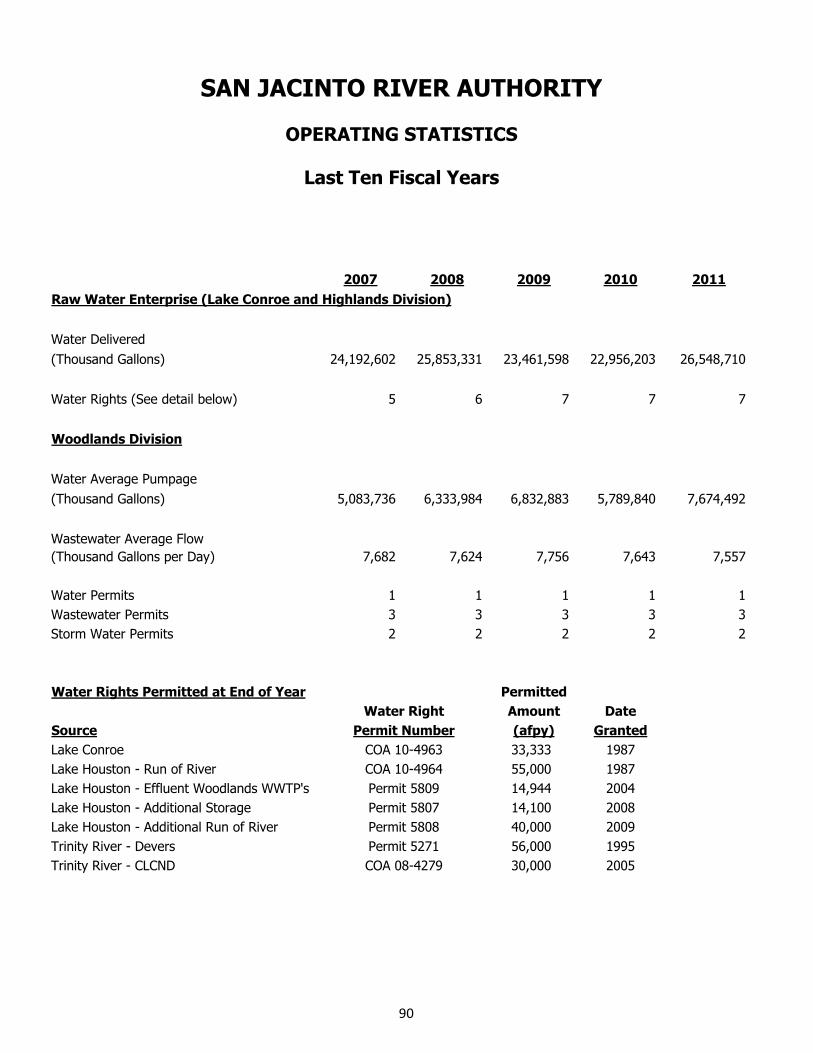
2007 2008 2009 2010 2011
Raw Water Enterprise (Lake Conroe and Highlands Division)
Water Delivered
(Thousand Gallons) 24,192,602 25,853,331 23,461,598 22,956,203 26,548,710
Water Rights (See detail below) 5 6 7 7 7
Woodlands Division
Water Average Pumpage
(Thousand Gallons) 5,083,736 6,333,984 6,832,883 5,789,840 7,674,492
Wastewater Average Flow
(Thousand Gallons per Day) 7,682 7,624 7,756 7,643 7,557
Water Permits 1 1 1 1 1
Wastewater Permits 3 3 3 3 3
Storm Water Permits 2 2 2 2 2
Water Rights Permitted at End of Year Permitted
Amount Date
Source (afpy) Granted
Lake Conroe 33,333 1987
Lake Houston - Run of River 55,000 1987
Lake Houston - Effluent Woodlands WWTP's 14,944 2004
Lake Houston - Additional Storage 14,100 2008
Lake Houston - Additional Run of River 40,000 2009
Trinity River - Devers 56,000 1995
Trinity River - CLCND 30,000 2005COA 08-4279
SAN JACINTO RIVER AUTHORITY
OPERATING STATISTICS
Last Ten Fiscal Years
Water Right
Permit Number
COA 10-4963
COA 10-4964
Permit 5809
Permit 5807
Permit 5808
Permit 5271
90
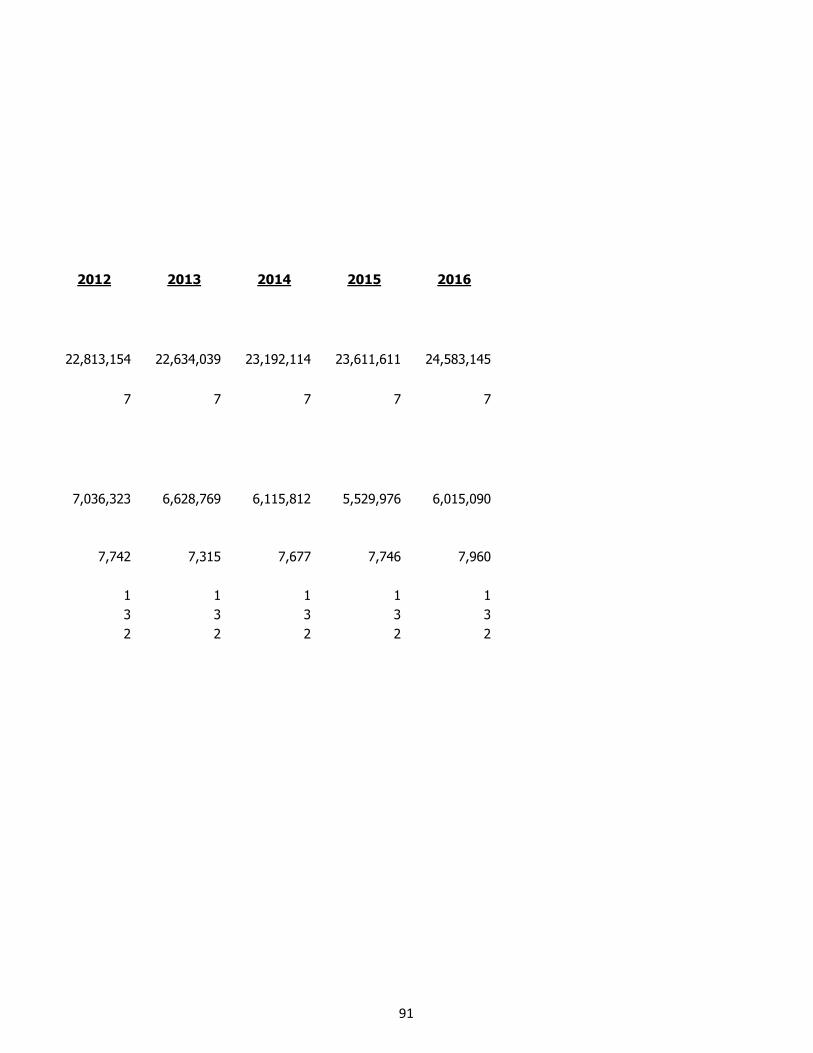
2012 2013 2014 2015 2016
22,813,154 22,634,039 23,192,114 23,611,611 24,583,145
7 7 7 7 7
7,036,323 6,628,769 6,115,812 5,529,976 6,015,090
7,742 7,315 7,677 7,746 7,960
1 1 1 1 1
3 3 3 3 3
2 2 2 2 2
91
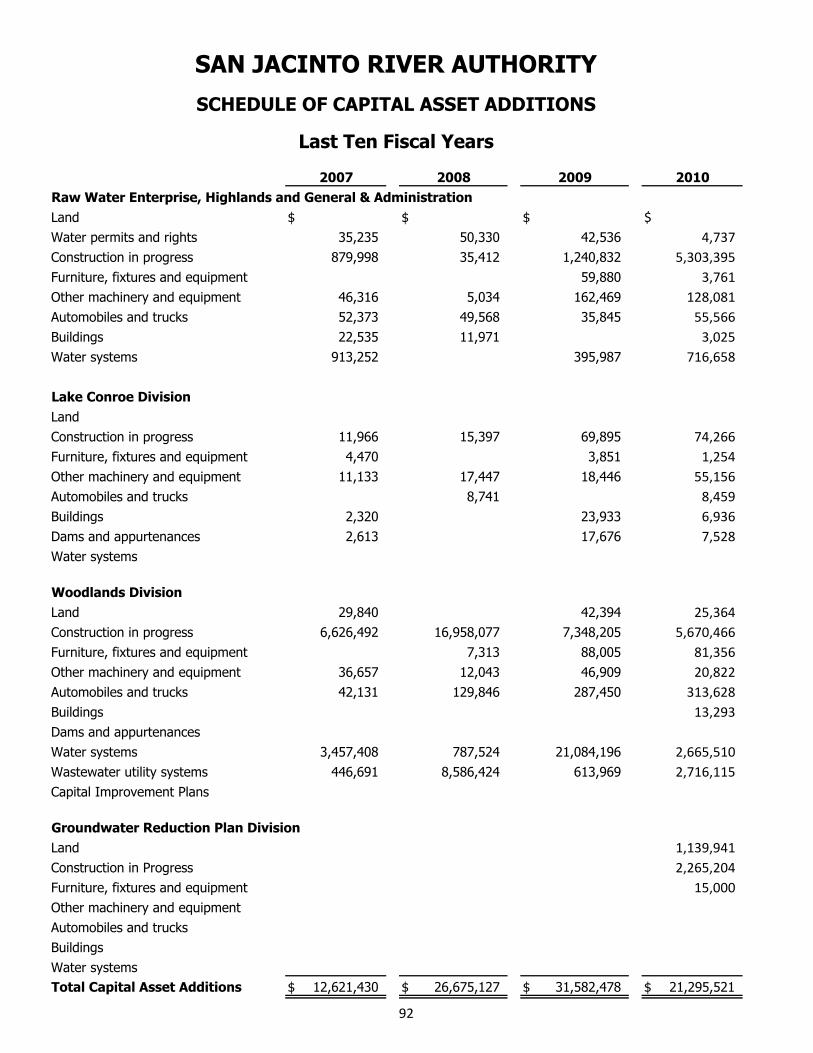
Raw Water Enterprise, Highlands and General & Administration
Land $ $ $ $
Water permits and rights 35,235 50,330 42,536 4,737
Construction in progress 879,998 35,412 1,240,832 5,303,395
Furniture, fixtures and equipment 59,880 3,761
Other machinery and equipment 46,316 5,034 162,469 128,081
Automobiles and trucks 52,373 49,568 35,845 55,566
Buildings 22,535 11,971 3,025
Water systems 913,252 395,987 716,658
Lake Conroe Division
Land
Construction in progress 11,966 15,397 69,895 74,266
Furniture, fixtures and equipment 4,470 3,851 1,254
Other machinery and equipment 11,133 17,447 18,446 55,156
Automobiles and trucks 8,741 8,459
Buildings 2,320 23,933 6,936
Dams and appurtenances 2,613 17,676 7,528
Water systems
Woodlands Division
Land 29,840 42,394 25,364
Construction in progress 6,626,492 16,958,077 7,348,205 5,670,466
Furniture, fixtures and equipment 7,313 88,005 81,356
Other machinery and equipment 36,657 12,043 46,909 20,822
Automobiles and trucks 42,131 129,846 287,450 313,628
Buildings 13,293
Dams and appurtenances
Water systems 3,457,408 787,524 21,084,196 2,665,510
Wastewater utility systems 446,691 8,586,424 613,969 2,716,115
Capital Improvement Plans
Groundwater Reduction Plan Division
Land 1,139,941
Construction in Progress 2,265,204
Furniture, fixtures and equipment 15,000
Other machinery and equipment
Automobiles and trucks
Buildings
Water systems
Total Capital Asset Additions $ 12,621,430 $ 26,675,127 $ 31,582,478 $ 21,295,521
SAN JACINTO RIVER AUTHORITY
SCHEDULE OF CAPITAL ASSET ADDITIONS
Last Ten Fiscal Years
2007 2008 2009 2010
92
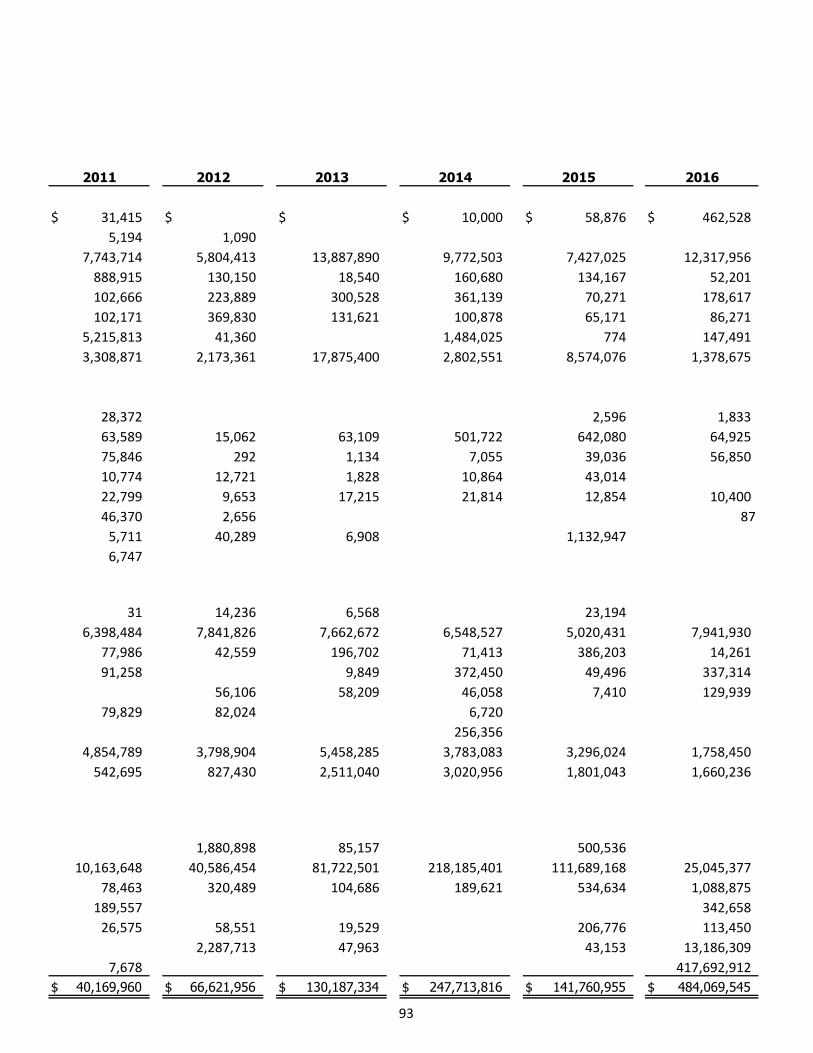
$ 31,415 $ $ $ 10,000 $ 58,876 $ 462,528
5,194 1,090
7,743,714 5,804,413 13,887,890 9,772,503 7,427,025 12,317,956
888,915 130,150 18,540 160,680 134,167 52,201
102,666 223,889 300,528 361,139 70,271 178,617
102,171 369,830 131,621 100,878 65,171 86,271
5,215,813 41,360 1,484,025 774 147,491
3,308,871 2,173,361 17,875,400 2,802,551 8,574,076 1,378,675
28,372 2,596 1,833
63,589 15,062 63,109 501,722 642,080 64,925
75,846 292 1,134 7,055 39,036 56,850
10,774 12,721 1,828 10,864 43,014
22,799 9,653 17,215 21,814 12,854 10,400
46,370 2,656 87
5,711 40,289 6,908 1,132,947
6,747
31 14,236 6,568 23,194
6,398,484 7,841,826 7,662,672 6,548,527 5,020,431 7,941,930
77,986 42,559 196,702 71,413 386,203 14,261
91,258 9,849 372,450 49,496 337,314
56,106 58,209 46,058 7,410 129,939
79,829 82,024 6,720
256,356
4,854,789 3,798,904 5,458,285 3,783,083 3,296,024 1,758,450
542,695 827,430 2,511,040 3,020,956 1,801,043 1,660,236
1,880,898 85,157 500,536
10,163,648 40,586,454 81,722,501 218,185,401 111,689,168 25,045,377
78,463 320,489 104,686 189,621 534,634 1,088,875
189,557 342,658
26,575 58,551 19,529 206,776 113,450
2,287,713 47,963 43,153 13,186,309
7,678 417,692,912
$ 40,169,960 $ 66,621,956 $ 130,187,334 $ 247,713,816 $ 141,760,955 $ 484,069,545
2014 201620152011 2012 2013
93