Embed Size (px)
Citation preview
City
and
Cou
nty
of S
an F
ranc
isco
San FranciscoTransportation Task Force 2045
September 25, 2017 Meeting
City
and
Cou
nty
of S
an F
ranc
isco Today’s Meeting Objectives & Agenda
2
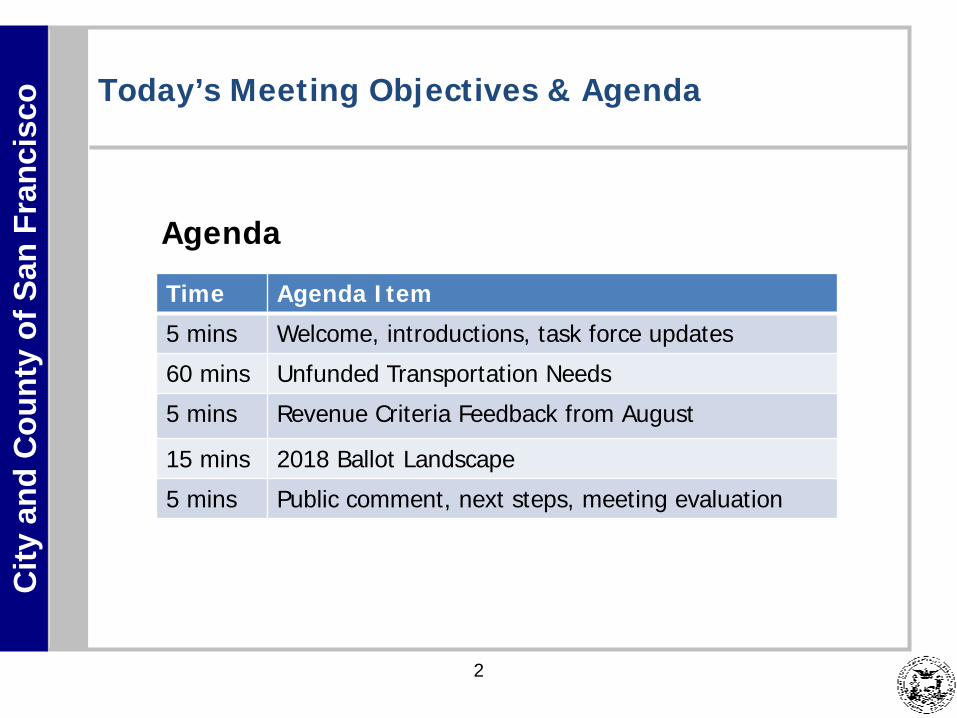
Agenda
Time Agenda Item
5 mins Welcome, introductions, task force updates
60 mins Unfunded Transportation Needs
5 mins Revenue Criteria Feedback from August
15 mins 2018 Ballot Landscape
5 mins Public comment, next steps, meeting evaluation
City
and
Cou
nty
of S
an F
ranc
isco Welcome from the Chairs + Introductions
3
• The focus of today’s agenda is coming to a common understanding of unfunded needs. You will have the opportunity to look at the analysis of unfunded needs, ask questions, and give feedback.
• This will support our goal of developing identifying a package of revenue measures, including one in 2018, with an expenditure plan and allocations to programmatic categories.
City
and
Cou
nty
of S
an F
ranc
isco
4
Analysis of Unfunded Transportation Needs
City
and
Cou
nty
of S
an F
ranc
isco
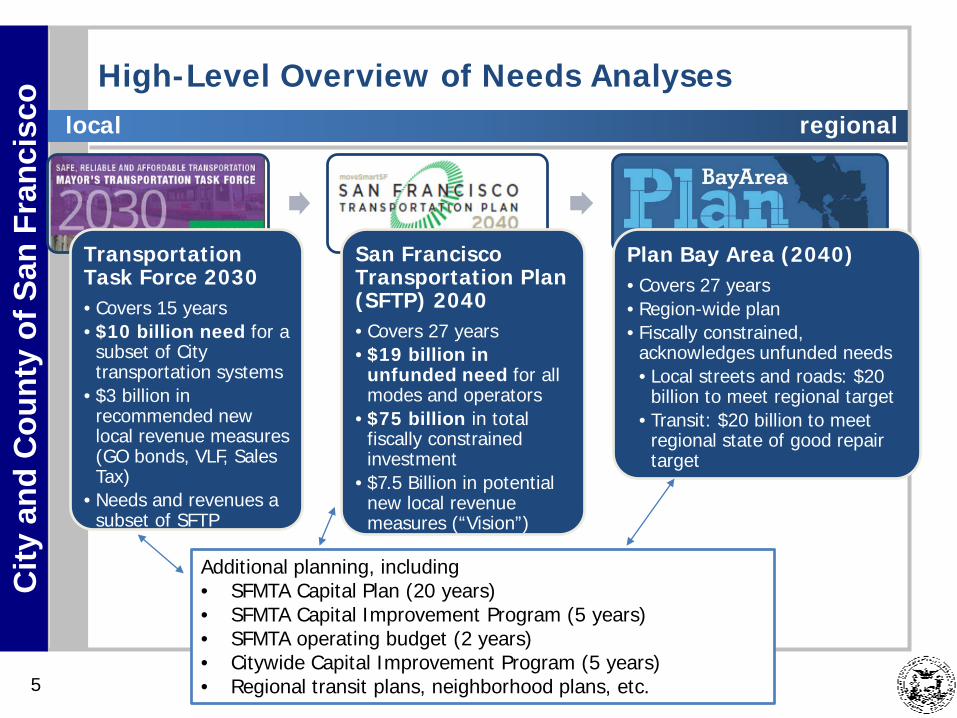
Transportation Task Force 2030• Covers 15 years• $10 billion need for a
subset of City transportation systems
• $3 billion in recommended new local revenue measures (GO bonds, VLF, Sales Tax)
• Needs and revenues a subset of SFTP
San Francisco Transportation Plan (SFTP) 2040• Covers 27 years• $19 billion in
unfunded need for all modes and operators
• $75 billion in total fiscally constrained investment
• $7.5 Billion in potential new local revenue measures (“Vision”)
Plan Bay Area (2040)• Covers 27 years• Region-wide plan• Fiscally constrained,
acknowledges unfunded needs• Local streets and roads: $20
billion to meet regional target• Transit: $20 billion to meet
regional state of good repair target
Additional planning, including• SFMTA Capital Plan (20 years)• SFMTA Capital Improvement Program (5 years)• SFMTA operating budget (2 years)• Citywide Capital Improvement Program (5 years)• Regional transit plans, neighborhood plans, etc.
High-Level Overview of Needs Analyses
5
local regional

City
and
Cou
nty
of S
an F
ranc
isco Unfunded Needs Analysis
6
• This unfunded needs analysis is based on:– Your feedback on the categories of needs– The transportation needs and revenues detailed in the
plans on the previous slide, for FY2019-FY2045
CategoryUnfunded Needs (billions 2017$)
1. Transit Service & Affordability $1.54
2. Muni Fleet, Facilities, & Infrastructure $8.76
3. Transit Optimization & Expansion $5.85
4. Regional Transit & Smart System Management
$0.98
5. Vision Zero Safer & Complete Streets $4.02
6. Street Resurfacing $0.78

City
and
Cou
nty
of S
an F
ranc
isco Unfunded Needs Analysis: Key Assumptions
7
Needs• Generally, we start with total needs from agency
plans and studies, in 2017$• We’ve adjusted some needs down to account for
what can be delivered by 2045• For large, regional projects, we typically show only
San Francisco’s anticipated contribution• We’ve left some needs off the table (e.g., BART state
of good repair needs/capital maintenance is largely off the table since the Measure RR $3.5 billion GO bond was recently passed)
City
and
Cou
nty
of S
an F
ranc
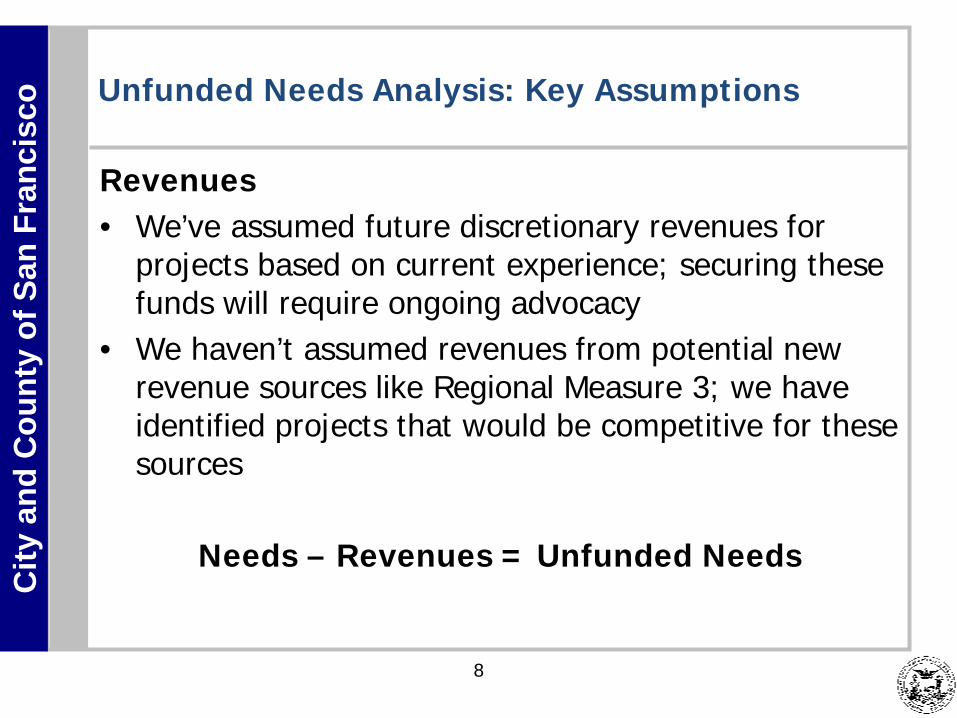
isco Unfunded Needs Analysis: Key Assumptions
8
Revenues• We’ve assumed future discretionary revenues for
projects based on current experience; securing these funds will require ongoing advocacy
• We haven’t assumed revenues from potential new revenue sources like Regional Measure 3; we have identified projects that would be competitive for these sources
Needs – Revenues = Unfunded Needs
City
and
Cou
nty
of S
an F
ranc
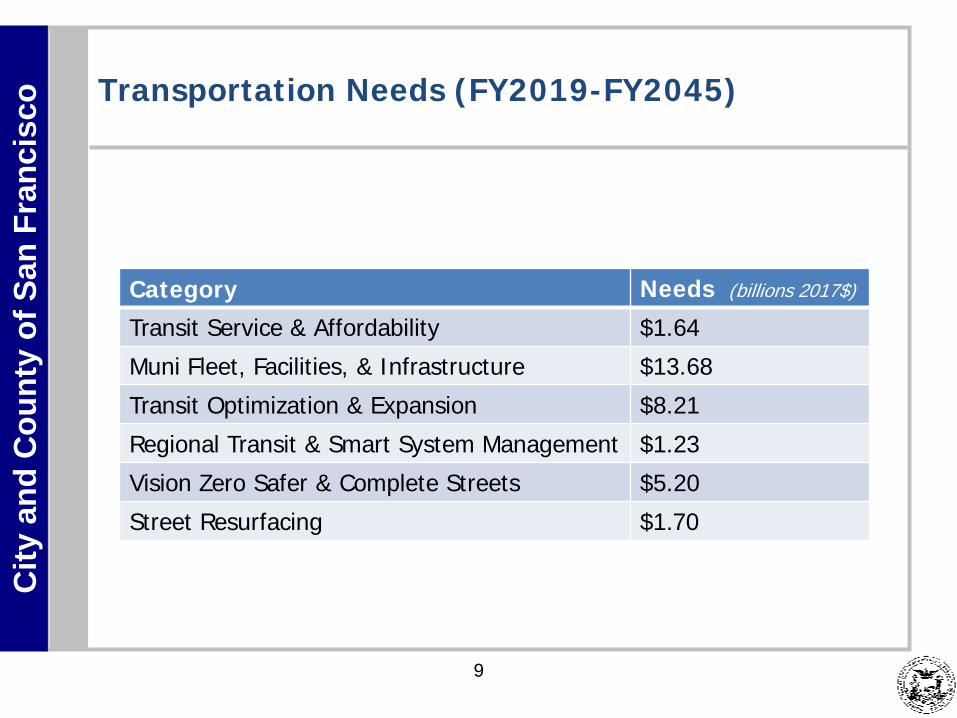
isco Transportation Needs (FY2019-FY2045)
9
Category Needs (billions 2017$)
Transit Service & Affordability $1.64
Muni Fleet, Facilities, & Infrastructure $13.68
Transit Optimization & Expansion $8.21
Regional Transit & Smart System Management $1.23
Vision Zero Safer & Complete Streets $5.20
Street Resurfacing $1.70

City
and
Cou
nty
of S
an F
ranc
isco
Expected Transportation Revenues (FY2019-FY2045)
10
Category Revenues (billions 2017$)
Transit Service & Affordability $0.10
Muni Fleet, Facilities, & Infrastructure $4.92
Transit Optimization & Expansion $2.36
Regional Transit & Smart System Management $0.24
Vision Zero Safer & Complete Streets $1.18
Street Resurfacing $0.92

City
and
Cou
nty
of S
an F
ranc
isco
Unfunded Transportation Needs (FY2019-FY2045)
11
CategoryUnfunded Needs (billions 2017$)
Transit Service & Affordability $1.54
Muni Fleet, Facilities, & Infrastructure $8.76
Transit Optimization & Expansion $5.85
Regional Transit & Smart System Management $0.98
Vision Zero Safer & Complete Streets $4.02
Street Resurfacing $0.78
City
and
Cou
nty
of S
an F
ranc
isco
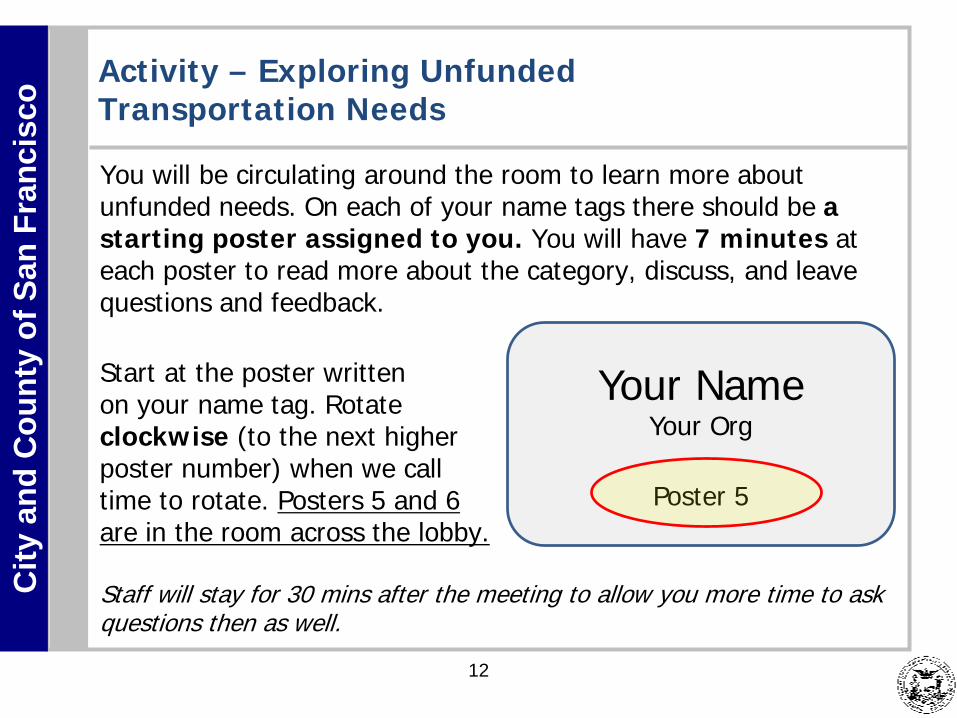
Activity – Exploring Unfunded Transportation Needs
12
You will be circulating around the room to learn more about unfunded needs. On each of your name tags there should be a starting poster assigned to you. You will have 7 minutes at each poster to read more about the category, discuss, and leave questions and feedback.
Start at the poster writtenon your name tag. Rotate clockwise (to the next higherposter number) when we calltime to rotate. Posters 5 and 6are in the room across the lobby.
Staff will stay for 30 mins after the meeting to allow you more time to ask questions then as well.
Your NameYour Org
Poster 5
City
and
Cou
nty
of S
an F
ranc
isco
13
Task Force Feedback on Evaluation Criteria for
Revenue Measures
City
and
Cou
nty
of S
an F
ranc
isco
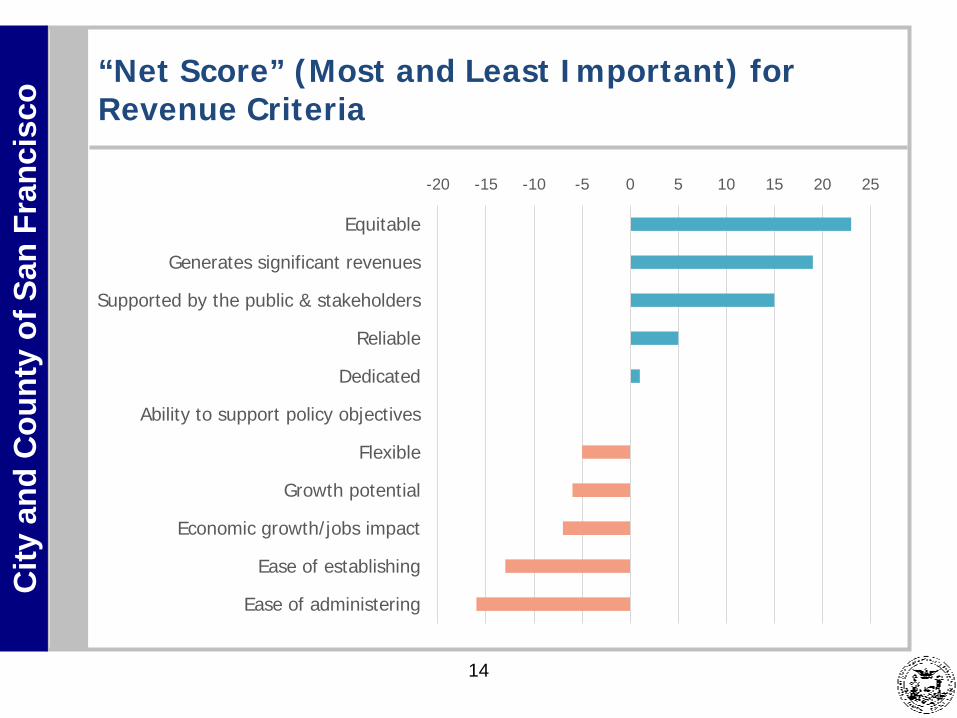
“Net Score” (Most and Least Important) for Revenue Criteria
14
-20 -15 -10 -5 0 5 10 15 20 25
Equitable
Generates significant revenues
Supported by the public & stakeholders
Reliable
Dedicated
Ability to support policy objectives
Flexible
Growth potential
Economic growth/jobs impact
Ease of establishing
Ease of administering
City
and
Cou
nty
of S
an F
ranc
isco
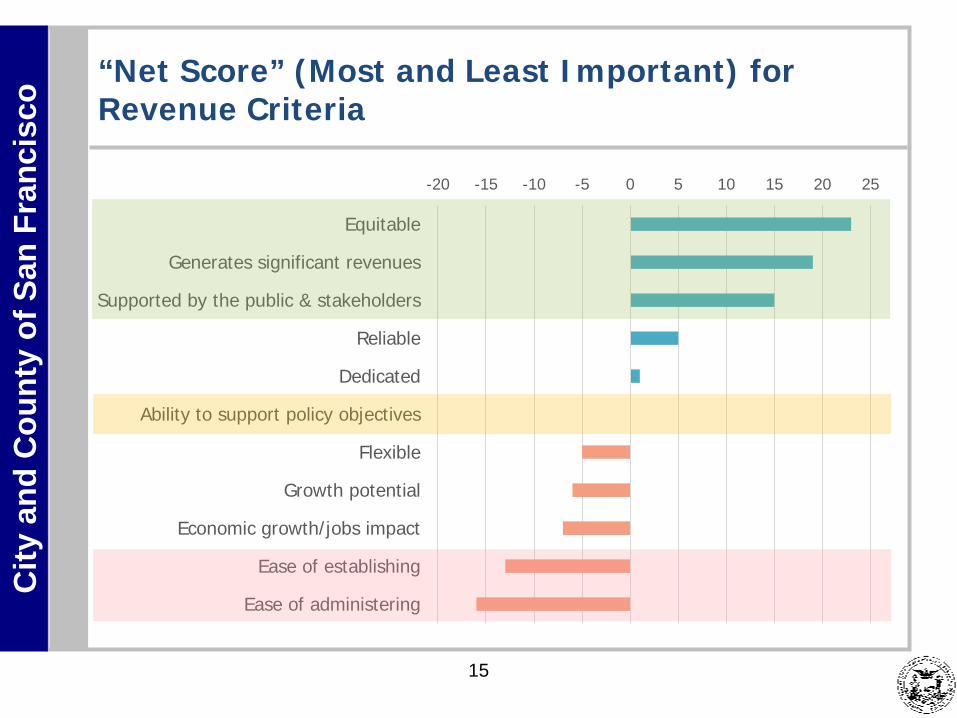
“Net Score” (Most and Least Important) for Revenue Criteria
15
-20 -15 -10 -5 0 5 10 15 20 25
Equitable
Generates significant revenues
Supported by the public & stakeholders
Reliable
Dedicated
Ability to support policy objectives
Flexible
Growth potential
Economic growth/jobs impact
Ease of establishing
Ease of administering
City
and
Cou
nty
of S
an F
ranc
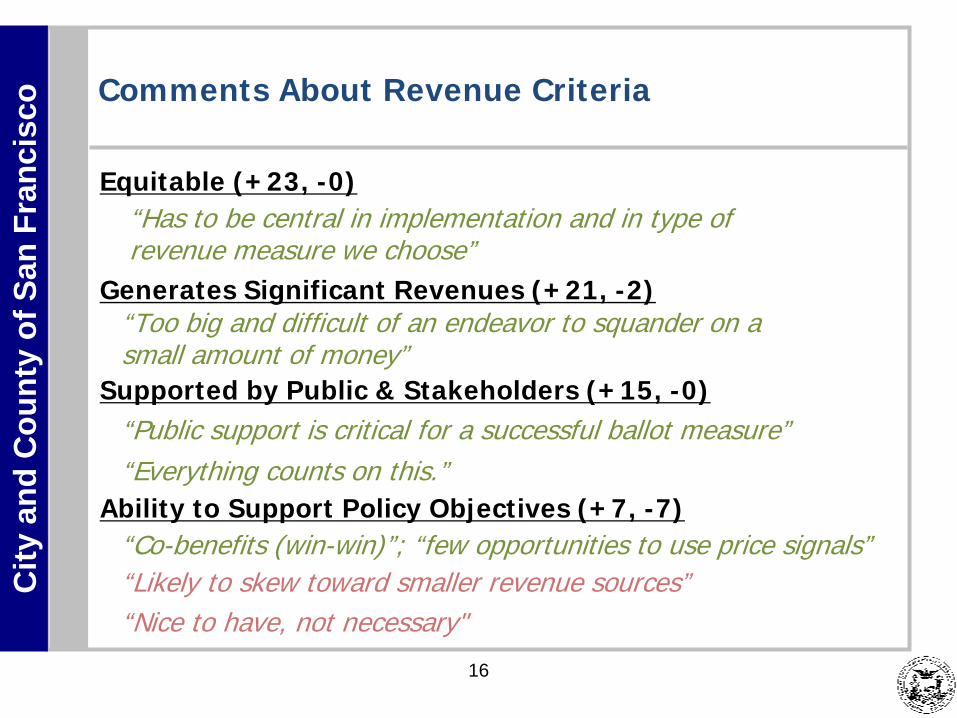
isco Comments About Revenue Criteria
Equitable (+23, -0)
Generates Significant Revenues (+21, -2)
Supported by Public & Stakeholders (+15, -0)
Ability to Support Policy Objectives (+7, -7)
16
“Has to be central in implementation and in type of revenue measure we choose”
“Too big and difficult of an endeavor to squander on a small amount of money”
“Public support is critical for a successful ballot measure”“Everything counts on this.”
“Co-benefits (win-win)”; “few opportunities to use price signals”“Likely to skew toward smaller revenue sources”“Nice to have, not necessary"
City
and
Cou
nty
of S
an F
ranc
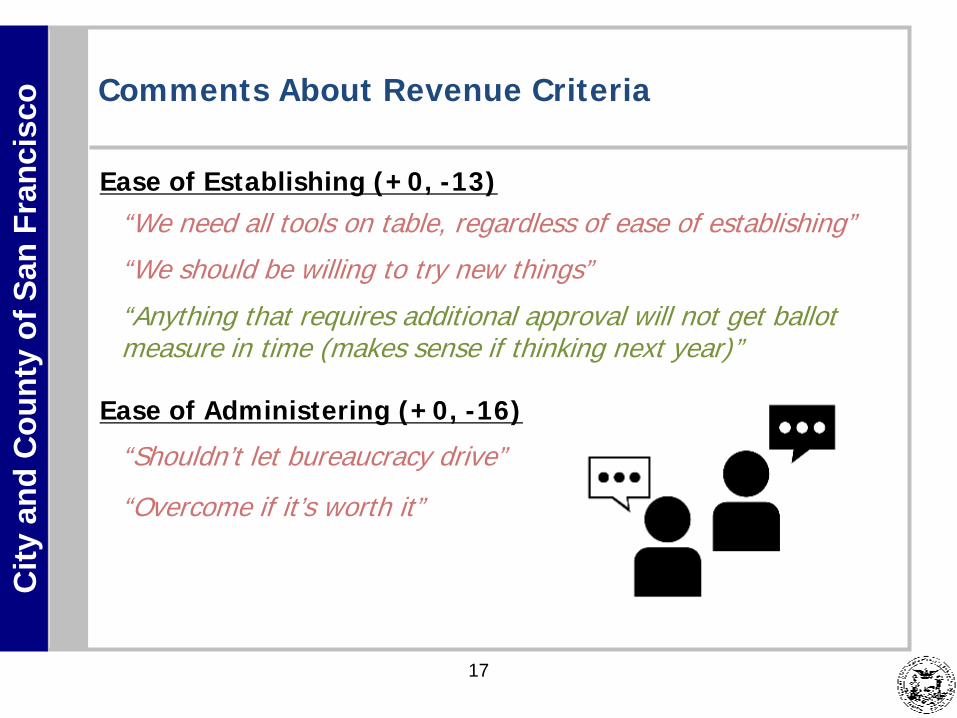
isco Comments About Revenue Criteria
Ease of Establishing (+0, -13)
Ease of Administering (+0, -16)
17
“Anything that requires additional approval will not get ballot measure in time (makes sense if thinking next year)”
“We need all tools on table, regardless of ease of establishing”
“We should be willing to try new things”
“Shouldn’t let bureaucracy drive”
“Overcome if it’s worth it”

City
and
Cou
nty
of S
an F
ranc
isco
18
2018 Ballot Landscape
City
and
Cou
nty
of S
an F
ranc
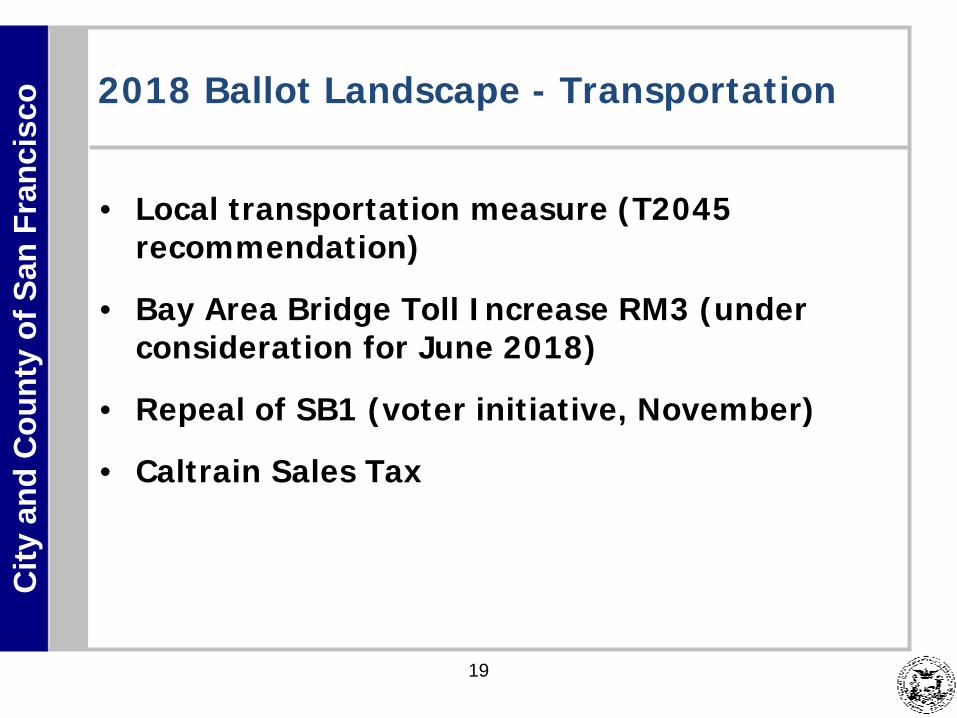
isco 2018 Ballot Landscape - Transportation
19
• Local transportation measure (T2045 recommendation)
• Bay Area Bridge Toll Increase RM3 (under consideration for June 2018)
• Repeal of SB1 (voter initiative, November)
• Caltrain Sales Tax
City
and
Cou
nty
of S
an F
ranc
isco
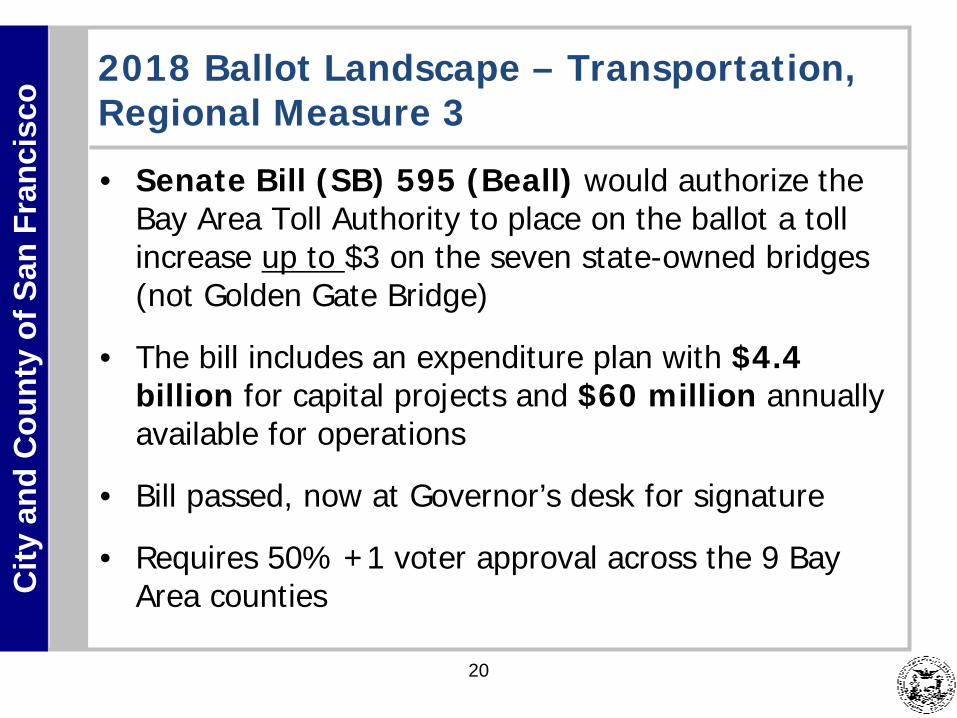
2018 Ballot Landscape – Transportation,Regional Measure 3
20
• Senate Bill (SB) 595 (Beall) would authorize the Bay Area Toll Authority to place on the ballot a toll increase up to $3 on the seven state-owned bridges (not Golden Gate Bridge)
• The bill includes an expenditure plan with $4.4 billion for capital projects and $60 million annually available for operations
• Bill passed, now at Governor’s desk for signature
• Requires 50% +1 voter approval across the 9 Bay Area counties

City
and
Cou
nty
of S
an F
ranc
isco
2018 Ballot Landscape – Transportation,Regional Measure 3
21
Funded projects and programs would include:RM3 Project/Program $3 Toll Project
AmountBART Expansion Cars $500 million
Caltrain Downtown Extension $325 million
Bay Area Corridor Express Lanes $300 million
Ferry Enhancement Program (operations, capital) $300 million
San Francisco Bay Trail / Safe Routes to Transit $150 million
Muni Fleet Expansion and Facilities $140 million
Core Capacity Transit Improvements $140 million
Clipper 2.0 $50 million
Transbay Rail Crossing $50 million
City
and
Cou
nty
of S
an F
ranc
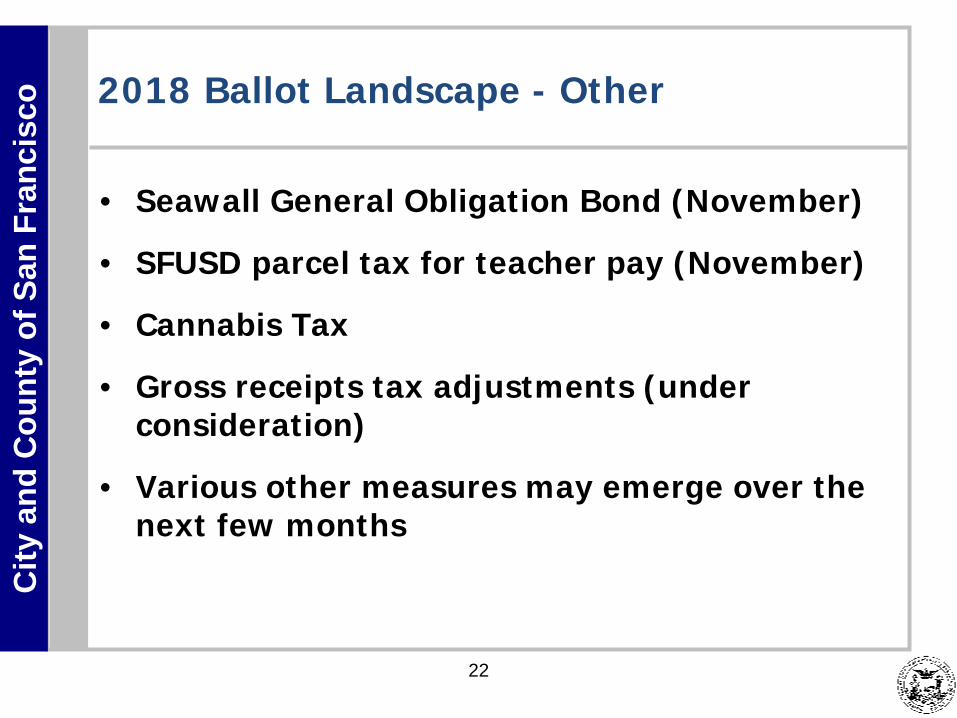
isco 2018 Ballot Landscape - Other
22
• Seawall General Obligation Bond (November)
• SFUSD parcel tax for teacher pay (November)
• Cannabis Tax
• Gross receipts tax adjustments (under consideration)
• Various other measures may emerge over the next few months

City
and
Cou
nty
of S
an F
ranc
isco
23
Public Comment

City
and
Cou
nty
of S
an F
ranc
isco Next Steps
Meeting Schedule (3rd Monday of each month @ 4 pm)
• October 16th – formulating revenue measures and expenditure plans
• November 20th – refinements to revenue measures and expenditure plans
• December 18th – proposals for revenue measures and expenditure plans
24

City
and
Cou
nty
of S
an F
ranc
isco
25
Thank you!
Please send comments and feedback to [email protected]
http://SFtransportation2045.com