Embed Size (px)
Citation preview
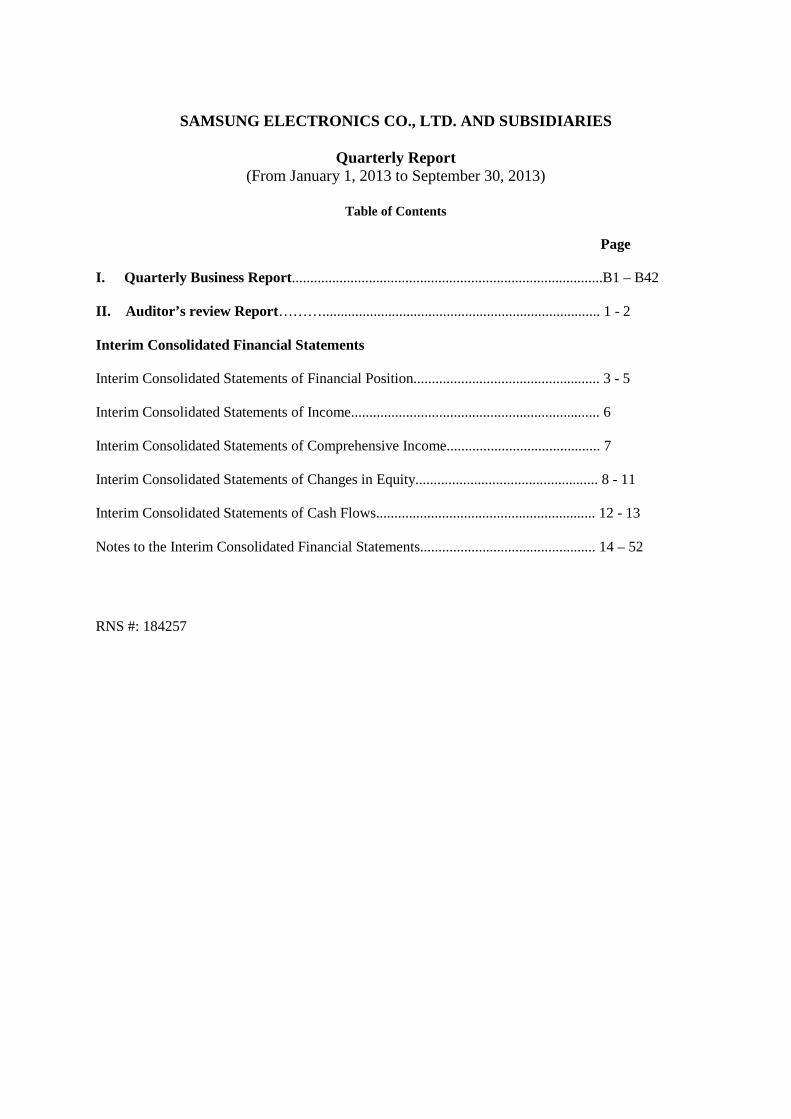
SAMSUNG ELECTRONICS CO., LTD. AND SUBSIDIARIES
Quarterly Report (From January 1, 2013 to September 30, 2013)
Table of Contents
Page
I. Quarterly Business Report.....................................................................................B1 – B42
II. Auditor’s review Report………............................................................................ 1 - 2
Interim Consolidated Financial Statements
Interim Consolidated Statements of Financial Position................................................... 3 - 5
Interim Consolidated Statements of Income.................................................................... 6
Interim Consolidated Statements of Comprehensive Income.......................................... 7
Interim Consolidated Statements of Changes in Equity.................................................. 8 - 11
Interim Consolidated Statements of Cash Flows............................................................ 12 - 13
Notes to the Interim Consolidated Financial Statements................................................ 14 – 52
RNS #: 184257
B-1
I. 3Q13 Business Report
1. Corporate Overview
□ Affiliates
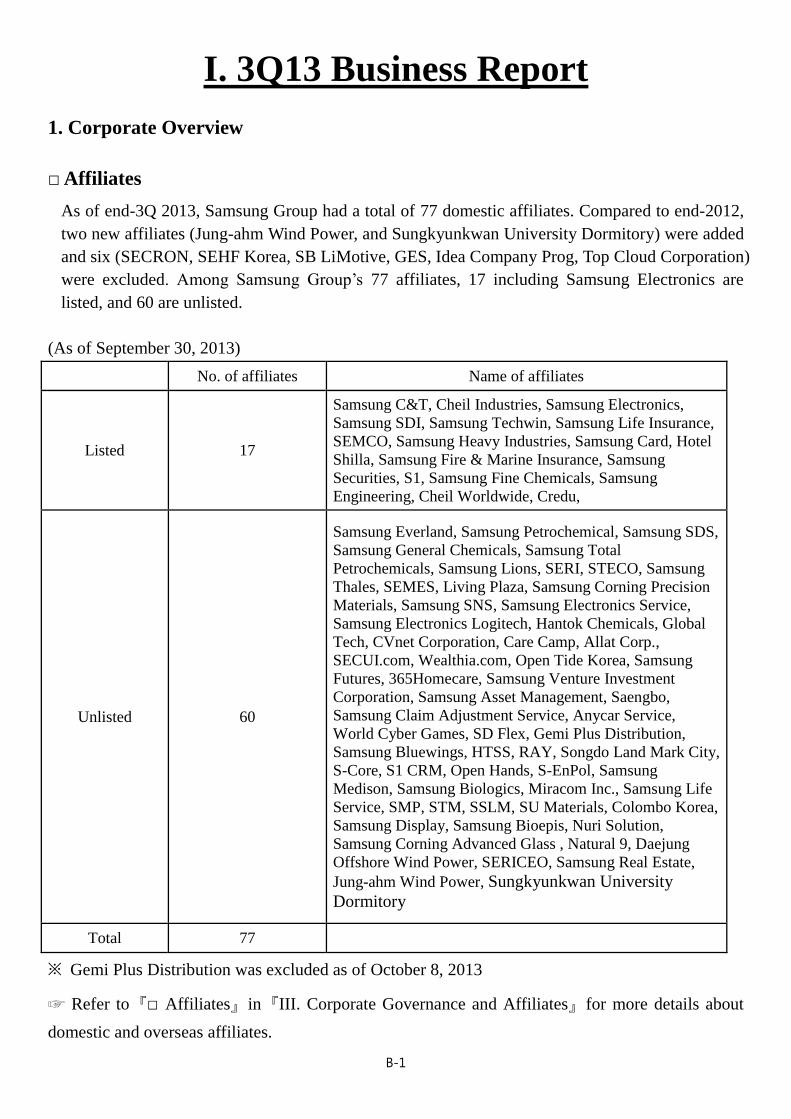
As of end-3Q 2013, Samsung Group had a total of 77 domestic affiliates. Compared to end-2012,
two new affiliates (Jung-ahm Wind Power, and Sungkyunkwan University Dormitory) were added
and six (SECRON, SEHF Korea, SB LiMotive, GES, Idea Company Prog, Top Cloud Corporation)
were excluded. Among Samsung Group’s 77 affiliates, 17 including Samsung Electronics are
listed, and 60 are unlisted.
(As of September 30, 2013)
No. of affiliates Name of affiliates
Listed 17
Samsung C&T, Cheil Industries, Samsung Electronics,
Samsung SDI, Samsung Techwin, Samsung Life Insurance,
SEMCO, Samsung Heavy Industries, Samsung Card, Hotel
Shilla, Samsung Fire & Marine Insurance, Samsung
Securities, S1, Samsung Fine Chemicals, Samsung
Engineering, Cheil Worldwide, Credu,
Unlisted 60
Samsung Everland, Samsung Petrochemical, Samsung SDS,
Samsung General Chemicals, Samsung Total
Petrochemicals, Samsung Lions, SERI, STECO, Samsung
Thales, SEMES, Living Plaza, Samsung Corning Precision
Materials, Samsung SNS, Samsung Electronics Service,
Samsung Electronics Logitech, Hantok Chemicals, Global
Tech, CVnet Corporation, Care Camp, Allat Corp.,
SECUI.com, Wealthia.com, Open Tide Korea, Samsung
Futures, 365Homecare, Samsung Venture Investment
Corporation, Samsung Asset Management, Saengbo,
Samsung Claim Adjustment Service, Anycar Service,
World Cyber Games, SD Flex, Gemi Plus Distribution,
Samsung Bluewings, HTSS, RAY, Songdo Land Mark City,
S-Core, S1 CRM, Open Hands, S-EnPol, Samsung
Medison, Samsung Biologics, Miracom Inc., Samsung Life
Service, SMP, STM, SSLM, SU Materials, Colombo Korea,
Samsung Display, Samsung Bioepis, Nuri Solution,
Samsung Corning Advanced Glass , Natural 9, Daejung
Offshore Wind Power, SERICEO, Samsung Real Estate,
Jung-ahm Wind Power, Sungkyunkwan University
Dormitory
Total 77
※ Gemi Plus Distribution was excluded as of October 8, 2013
☞ Refer to 『□ Affiliates』 in 『III. Corporate Governance and Affiliates』 for more details about
domestic and overseas affiliates.
B-2
□ Subsidiaries Subject to Consolidated Financial Statements
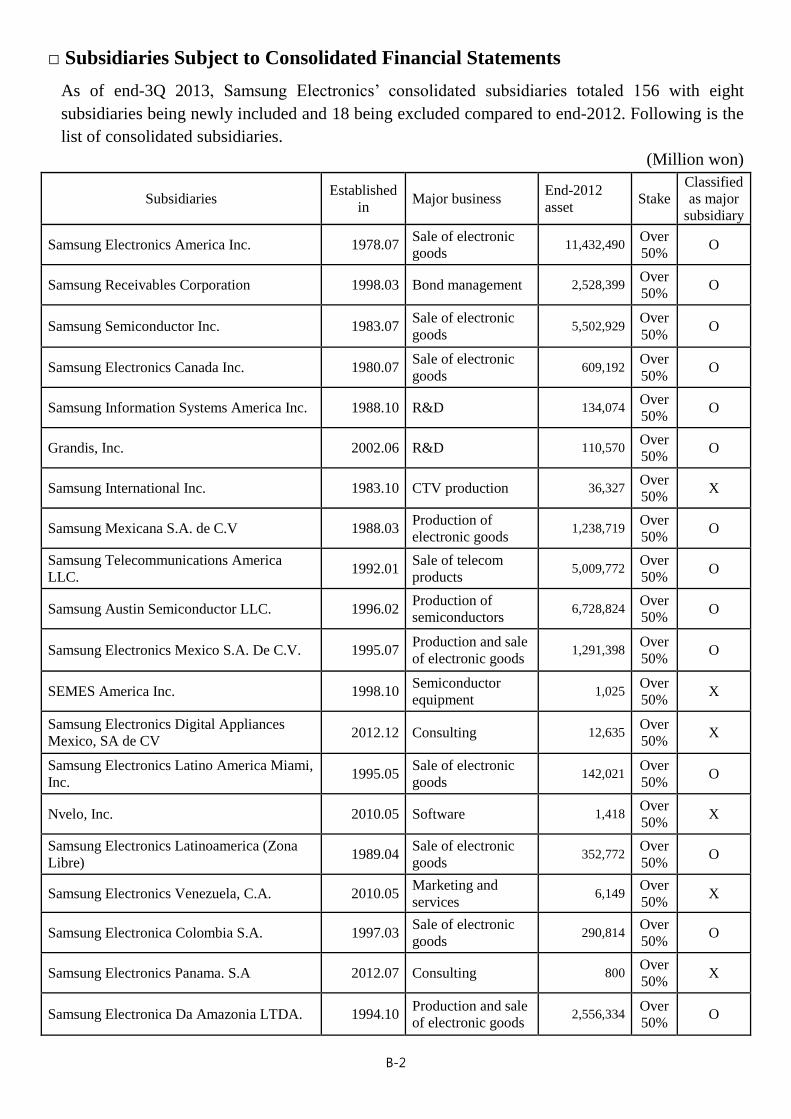
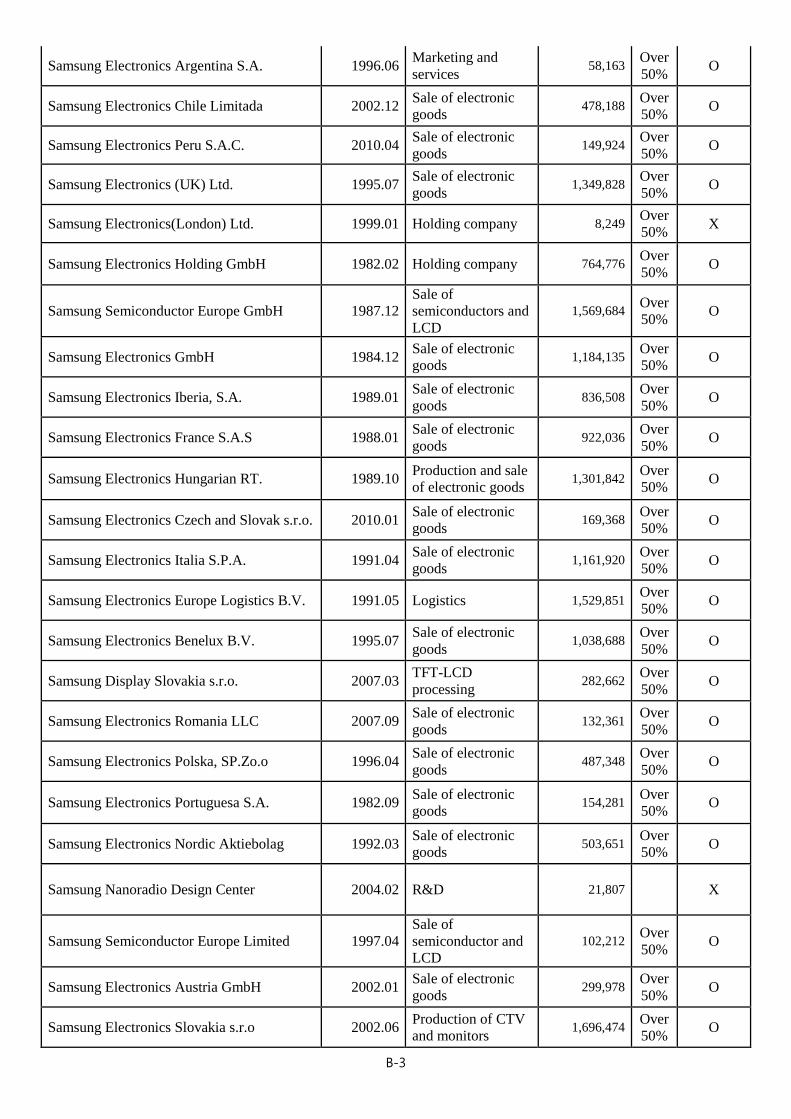
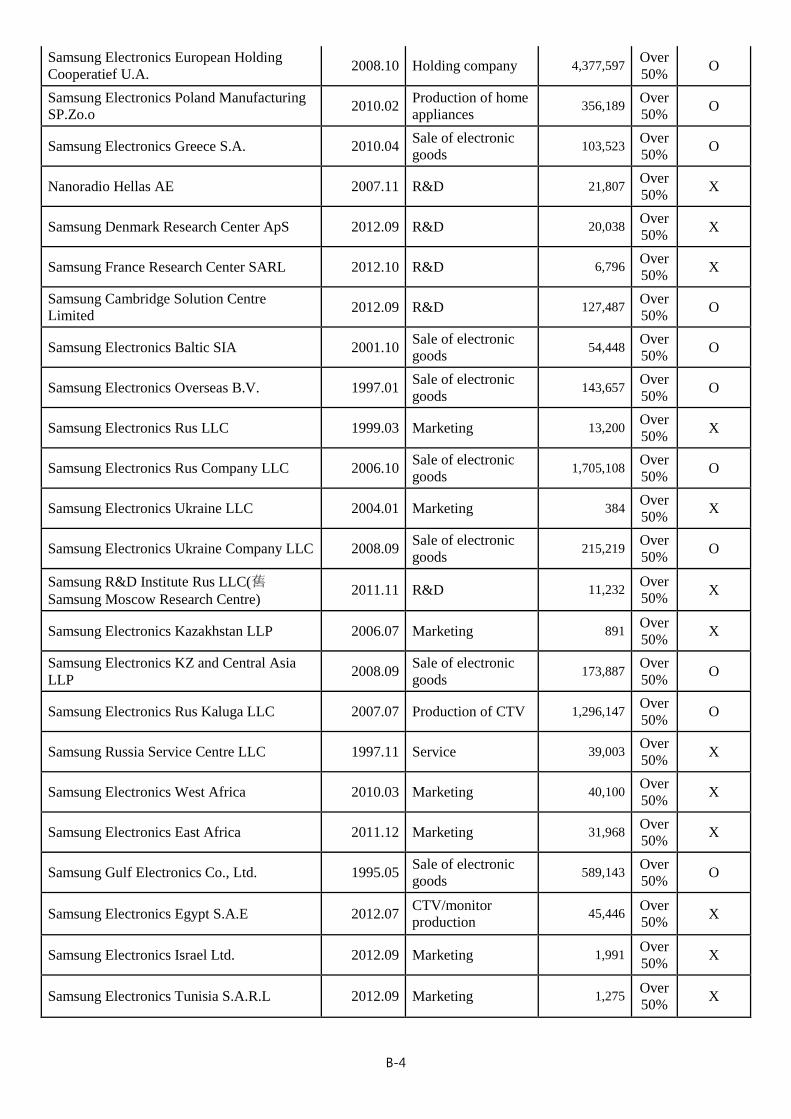
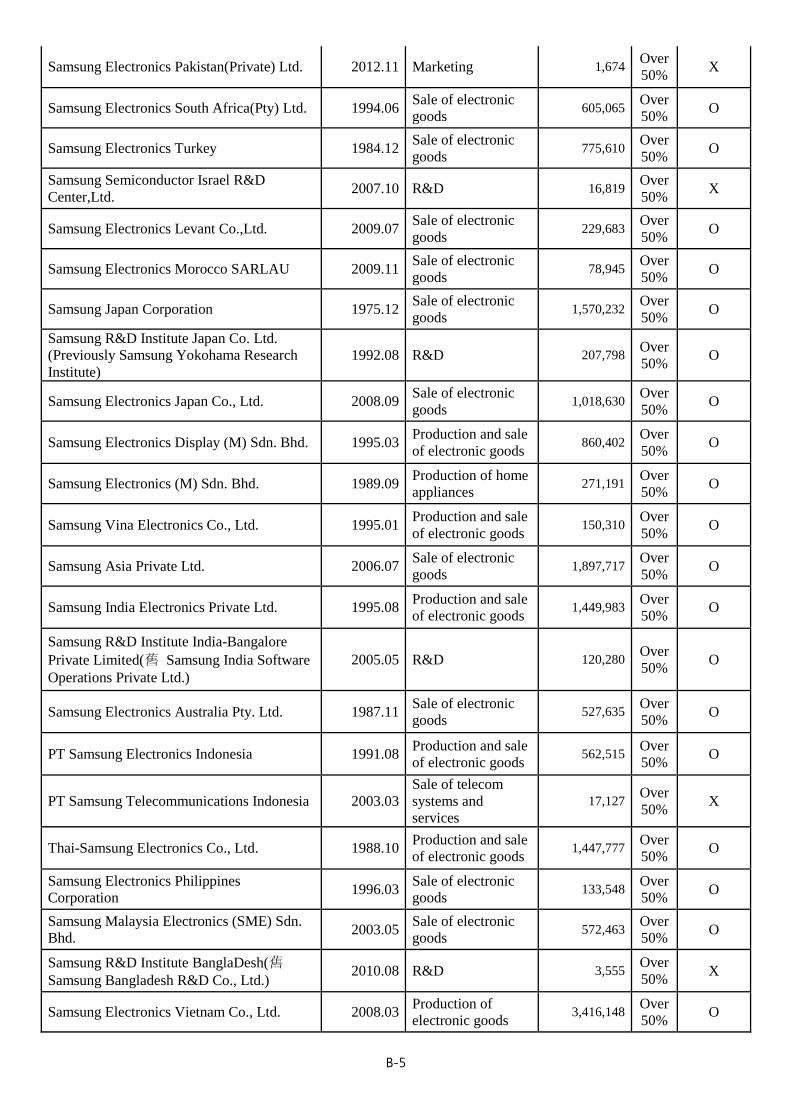
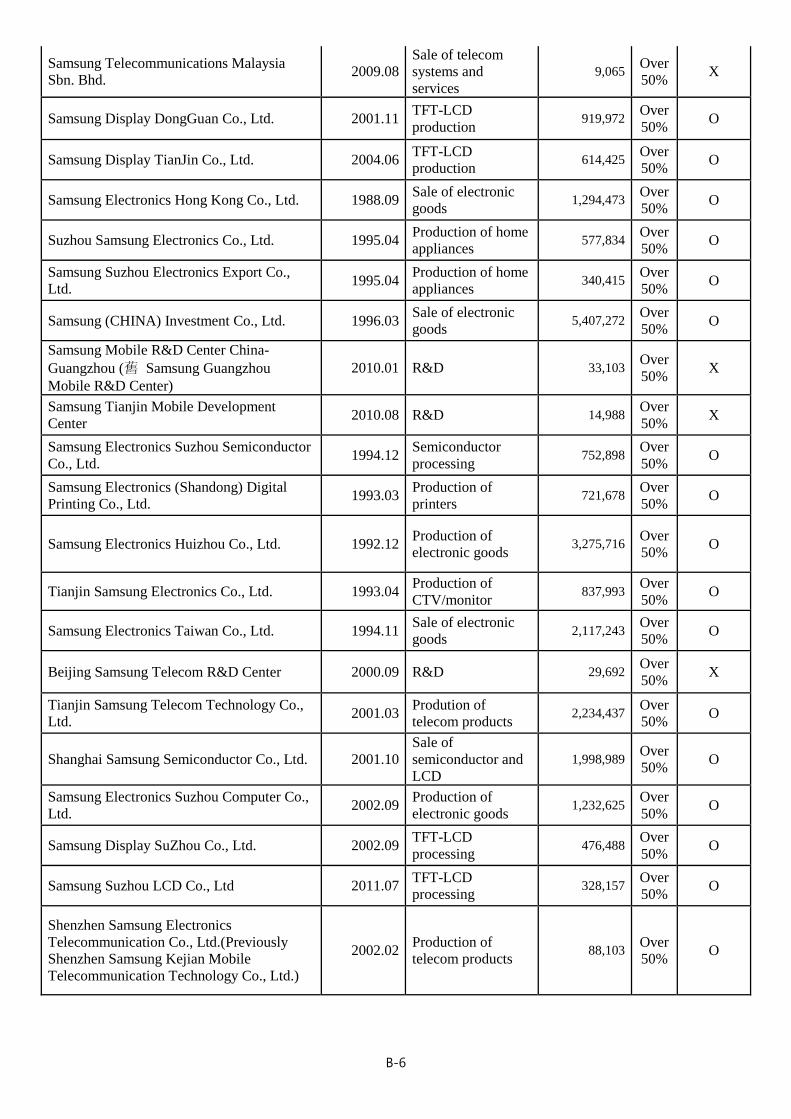
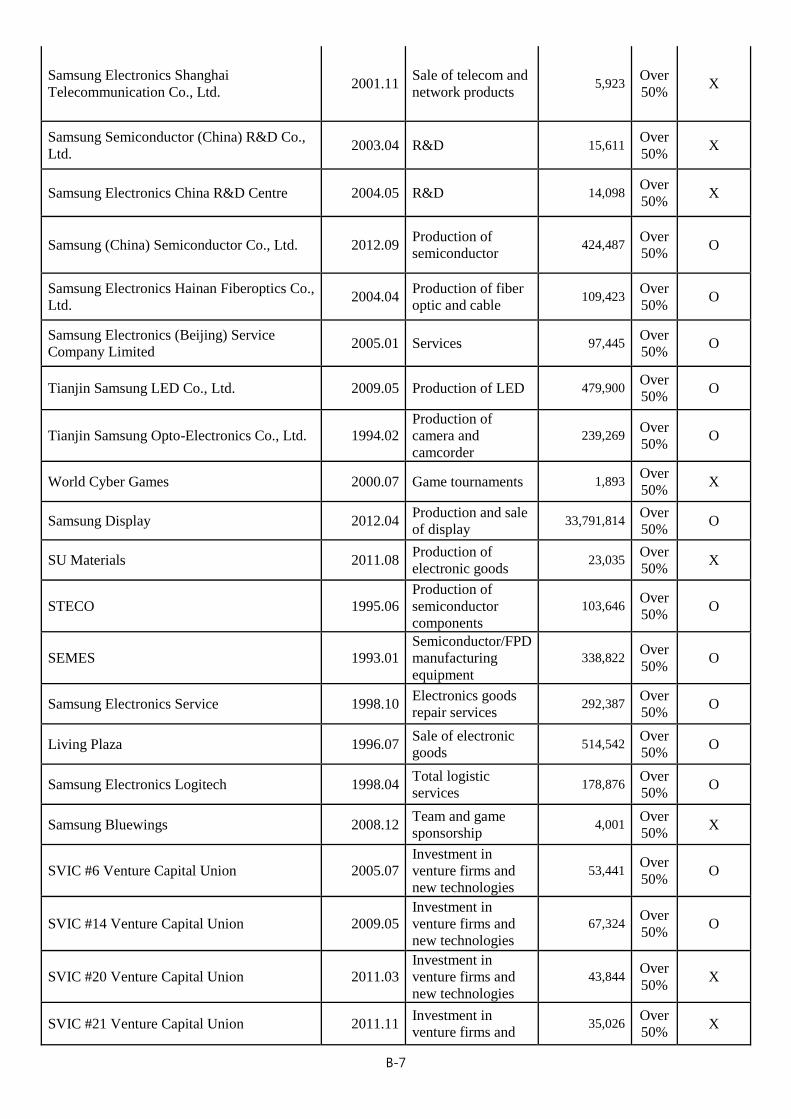
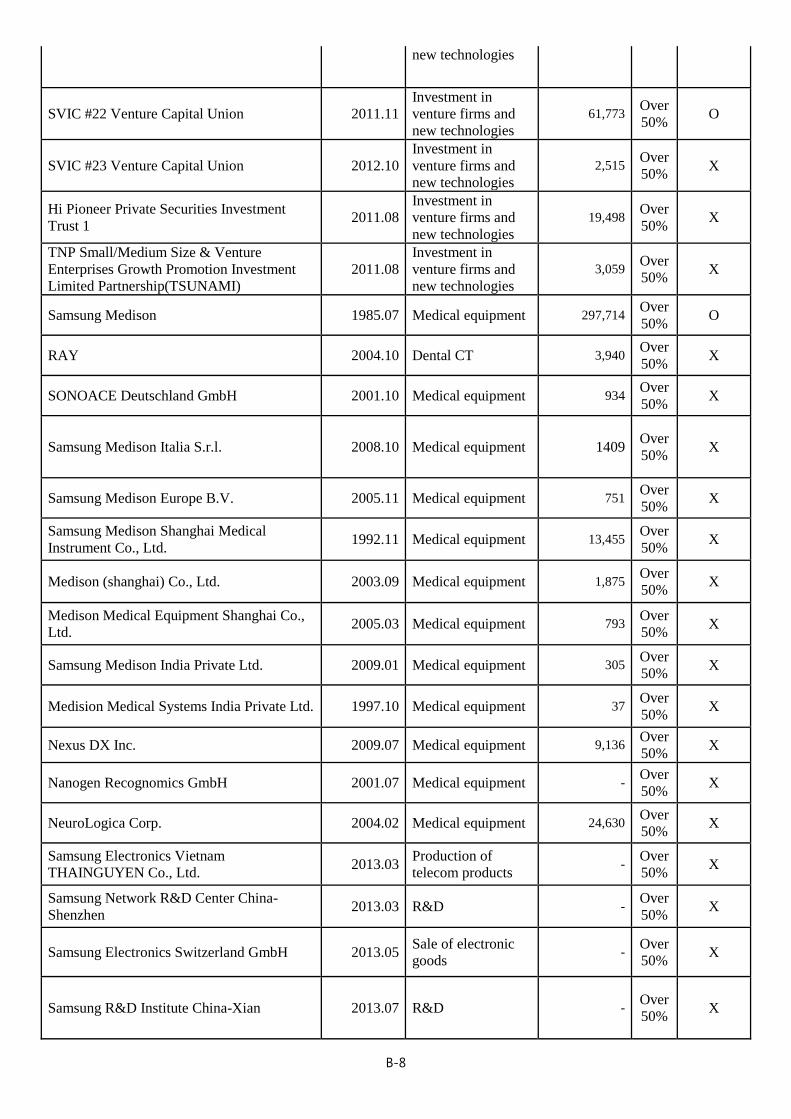
As of end-3Q 2013, Samsung Electronics’ consolidated subsidiaries totaled 156 with eight
subsidiaries being newly included and 18 being excluded compared to end-2012. Following is the
list of consolidated subsidiaries.
(Million won)
Subsidiaries Established
in Major business
End-2012
asset Stake
Classified
as major
subsidiary
Samsung Electronics America Inc. 1978.07 Sale of electronic
goods 11,432,490
Over
50% O
Samsung Receivables Corporation 1998.03 Bond management 2,528,399 Over
50% O
Samsung Semiconductor Inc. 1983.07 Sale of electronic
goods 5,502,929
Over
50% O
Samsung Electronics Canada Inc. 1980.07 Sale of electronic
goods 609,192
Over
50% O
Samsung Information Systems America Inc. 1988.10 R&D 134,074 Over
50% O
Grandis, Inc. 2002.06 R&D 110,570 Over
50% O
Samsung International Inc. 1983.10 CTV production 36,327 Over
50% X
Samsung Mexicana S.A. de C.V 1988.03 Production of
electronic goods 1,238,719
Over
50% O
Samsung Telecommunications America
LLC. 1992.01
Sale of telecom
products 5,009,772
Over
50% O
Samsung Austin Semiconductor LLC. 1996.02 Production of
semiconductors 6,728,824
Over
50% O
Samsung Electronics Mexico S.A. De C.V. 1995.07 Production and sale
of electronic goods 1,291,398
Over
50% O
SEMES America Inc. 1998.10 Semiconductor
equipment 1,025
Over
50% X
Samsung Electronics Digital Appliances
Mexico, SA de CV 2012.12 Consulting 12,635
Over
50% X
Samsung Electronics Latino America Miami,
Inc. 1995.05
Sale of electronic
goods 142,021
Over
50% O
Nvelo, Inc. 2010.05 Software 1,418 Over
50% X
Samsung Electronics Latinoamerica (Zona
Libre) 1989.04
Sale of electronic
goods 352,772
Over
50% O
Samsung Electronics Venezuela, C.A. 2010.05 Marketing and
services 6,149
Over
50% X
Samsung Electronica Colombia S.A. 1997.03 Sale of electronic
goods 290,814
Over
50% O
Samsung Electronics Panama. S.A 2012.07 Consulting 800 Over
50% X
Samsung Electronica Da Amazonia LTDA. 1994.10 Production and sale
of electronic goods 2,556,334
Over
50% O
B-3
Samsung Electronics Argentina S.A. 1996.06 Marketing and
services 58,163
Over
50% O
Samsung Electronics Chile Limitada 2002.12 Sale of electronic
goods 478,188
Over
50% O
Samsung Electronics Peru S.A.C. 2010.04 Sale of electronic
goods 149,924
Over
50% O
Samsung Electronics (UK) Ltd. 1995.07 Sale of electronic
goods 1,349,828
Over
50% O
Samsung Electronics(London) Ltd. 1999.01 Holding company 8,249 Over
50% X
Samsung Electronics Holding GmbH 1982.02 Holding company 764,776 Over
50% O
Samsung Semiconductor Europe GmbH 1987.12
Sale of
semiconductors and
LCD
1,569,684 Over
50% O
Samsung Electronics GmbH 1984.12 Sale of electronic
goods 1,184,135
Over
50% O
Samsung Electronics Iberia, S.A. 1989.01 Sale of electronic
goods 836,508
Over
50% O
Samsung Electronics France S.A.S 1988.01 Sale of electronic
goods 922,036
Over
50% O
Samsung Electronics Hungarian RT. 1989.10 Production and sale
of electronic goods 1,301,842
Over
50% O
Samsung Electronics Czech and Slovak s.r.o. 2010.01 Sale of electronic
goods 169,368
Over
50% O
Samsung Electronics Italia S.P.A. 1991.04 Sale of electronic
goods 1,161,920
Over
50% O
Samsung Electronics Europe Logistics B.V. 1991.05 Logistics 1,529,851 Over
50% O
Samsung Electronics Benelux B.V. 1995.07 Sale of electronic
goods 1,038,688
Over
50% O
Samsung Display Slovakia s.r.o. 2007.03 TFT-LCD
processing 282,662
Over
50% O
Samsung Electronics Romania LLC 2007.09 Sale of electronic
goods 132,361
Over
50% O
Samsung Electronics Polska, SP.Zo.o 1996.04 Sale of electronic
goods 487,348
Over
50% O
Samsung Electronics Portuguesa S.A. 1982.09 Sale of electronic
goods 154,281
Over
50% O
Samsung Electronics Nordic Aktiebolag 1992.03 Sale of electronic
goods 503,651
Over
50% O
Samsung Nanoradio Design Center 2004.02 R&D 21,807 X
Samsung Semiconductor Europe Limited 1997.04
Sale of
semiconductor and
LCD
102,212 Over
50% O
Samsung Electronics Austria GmbH 2002.01 Sale of electronic
goods 299,978
Over
50% O
Samsung Electronics Slovakia s.r.o 2002.06 Production of CTV
and monitors 1,696,474
Over
50% O
B-4
Samsung Electronics European Holding
Cooperatief U.A. 2008.10 Holding company 4,377,597
Over
50% O
Samsung Electronics Poland Manufacturing
SP.Zo.o 2010.02
Production of home
appliances 356,189
Over
50% O
Samsung Electronics Greece S.A. 2010.04 Sale of electronic
goods 103,523
Over
50% O
Nanoradio Hellas AE 2007.11 R&D 21,807 Over
50% X
Samsung Denmark Research Center ApS 2012.09 R&D 20,038 Over
50% X
Samsung France Research Center SARL 2012.10 R&D 6,796 Over
50% X
Samsung Cambridge Solution Centre
Limited 2012.09 R&D 127,487
Over
50% O
Samsung Electronics Baltic SIA 2001.10 Sale of electronic
goods 54,448
Over
50% O
Samsung Electronics Overseas B.V. 1997.01 Sale of electronic
goods 143,657
Over
50% O
Samsung Electronics Rus LLC 1999.03 Marketing 13,200 Over
50% X
Samsung Electronics Rus Company LLC 2006.10 Sale of electronic
goods 1,705,108
Over
50% O
Samsung Electronics Ukraine LLC 2004.01 Marketing 384 Over
50% X
Samsung Electronics Ukraine Company LLC 2008.09 Sale of electronic
goods 215,219
Over
50% O
Samsung R&D Institute Rus LLC(舊
Samsung Moscow Research Centre) 2011.11 R&D 11,232
Over
50% X
Samsung Electronics Kazakhstan LLP 2006.07 Marketing 891 Over
50% X
Samsung Electronics KZ and Central Asia
LLP 2008.09
Sale of electronic
goods 173,887
Over
50% O
Samsung Electronics Rus Kaluga LLC 2007.07 Production of CTV 1,296,147 Over
50% O
Samsung Russia Service Centre LLC 1997.11 Service 39,003 Over
50% X
Samsung Electronics West Africa 2010.03 Marketing 40,100 Over
50% X
Samsung Electronics East Africa 2011.12 Marketing 31,968 Over
50% X
Samsung Gulf Electronics Co., Ltd. 1995.05 Sale of electronic
goods 589,143
Over
50% O
Samsung Electronics Egypt S.A.E 2012.07 CTV/monitor
production 45,446
Over
50% X
Samsung Electronics Israel Ltd. 2012.09 Marketing 1,991 Over
50% X
Samsung Electronics Tunisia S.A.R.L 2012.09 Marketing 1,275 Over
50% X
B-5
Samsung Electronics Pakistan(Private) Ltd. 2012.11 Marketing 1,674 Over
50% X
Samsung Electronics South Africa(Pty) Ltd. 1994.06 Sale of electronic
goods 605,065
Over
50% O
Samsung Electronics Turkey 1984.12 Sale of electronic
goods 775,610
Over
50% O
Samsung Semiconductor Israel R&D
Center,Ltd. 2007.10 R&D 16,819
Over
50% X
Samsung Electronics Levant Co.,Ltd. 2009.07 Sale of electronic
goods 229,683
Over
50% O
Samsung Electronics Morocco SARLAU 2009.11 Sale of electronic
goods 78,945
Over
50% O
Samsung Japan Corporation 1975.12 Sale of electronic
goods 1,570,232
Over
50% O
Samsung R&D Institute Japan Co. Ltd.
(Previously Samsung Yokohama Research
Institute)
1992.08 R&D 207,798 Over
50% O
Samsung Electronics Japan Co., Ltd. 2008.09 Sale of electronic
goods 1,018,630
Over
50% O
Samsung Electronics Display (M) Sdn. Bhd. 1995.03 Production and sale
of electronic goods 860,402
Over
50% O
Samsung Electronics (M) Sdn. Bhd. 1989.09 Production of home
appliances 271,191
Over
50% O
Samsung Vina Electronics Co., Ltd. 1995.01 Production and sale
of electronic goods 150,310
Over
50% O
Samsung Asia Private Ltd. 2006.07 Sale of electronic
goods 1,897,717
Over
50% O
Samsung India Electronics Private Ltd. 1995.08 Production and sale
of electronic goods 1,449,983
Over
50% O
Samsung R&D Institute India-Bangalore
Private Limited(舊 Samsung India Software
Operations Private Ltd.)
2005.05 R&D 120,280 Over
50% O
Samsung Electronics Australia Pty. Ltd. 1987.11 Sale of electronic
goods 527,635
Over
50% O
PT Samsung Electronics Indonesia 1991.08 Production and sale
of electronic goods 562,515
Over
50% O
PT Samsung Telecommunications Indonesia 2003.03
Sale of telecom
systems and
services
17,127 Over
50% X
Thai-Samsung Electronics Co., Ltd. 1988.10 Production and sale
of electronic goods 1,447,777
Over
50% O
Samsung Electronics Philippines
Corporation 1996.03
Sale of electronic
goods 133,548
Over
50% O
Samsung Malaysia Electronics (SME) Sdn.
Bhd. 2003.05
Sale of electronic
goods 572,463
Over
50% O
Samsung R&D Institute BanglaDesh(舊
Samsung Bangladesh R&D Co., Ltd.) 2010.08 R&D 3,555
Over
50% X
Samsung Electronics Vietnam Co., Ltd. 2008.03 Production of
electronic goods 3,416,148
Over
50% O
B-6
Samsung Telecommunications Malaysia
Sbn. Bhd. 2009.08
Sale of telecom
systems and
services
9,065 Over
50% X
Samsung Display DongGuan Co., Ltd. 2001.11 TFT-LCD
production 919,972
Over
50% O
Samsung Display TianJin Co., Ltd. 2004.06 TFT-LCD
production 614,425
Over
50% O
Samsung Electronics Hong Kong Co., Ltd. 1988.09 Sale of electronic
goods 1,294,473
Over
50% O
Suzhou Samsung Electronics Co., Ltd. 1995.04 Production of home
appliances 577,834
Over
50% O
Samsung Suzhou Electronics Export Co.,
Ltd. 1995.04
Production of home
appliances 340,415
Over
50% O
Samsung (CHINA) Investment Co., Ltd. 1996.03 Sale of electronic
goods 5,407,272
Over
50% O
Samsung Mobile R&D Center China-
Guangzhou (舊 Samsung Guangzhou
Mobile R&D Center)
2010.01 R&D 33,103 Over
50% X
Samsung Tianjin Mobile Development
Center 2010.08 R&D 14,988
Over
50% X
Samsung Electronics Suzhou Semiconductor
Co., Ltd. 1994.12
Semiconductor
processing 752,898
Over
50% O
Samsung Electronics (Shandong) Digital
Printing Co., Ltd. 1993.03
Production of
printers 721,678
Over
50% O
Samsung Electronics Huizhou Co., Ltd. 1992.12 Production of
electronic goods 3,275,716
Over
50% O
Tianjin Samsung Electronics Co., Ltd. 1993.04 Production of
CTV/monitor 837,993
Over
50% O
Samsung Electronics Taiwan Co., Ltd. 1994.11 Sale of electronic
goods 2,117,243
Over
50% O
Beijing Samsung Telecom R&D Center 2000.09 R&D 29,692 Over
50% X
Tianjin Samsung Telecom Technology Co.,
Ltd. 2001.03
Prodution of
telecom products 2,234,437
Over
50% O
Shanghai Samsung Semiconductor Co., Ltd. 2001.10
Sale of
semiconductor and
LCD
1,998,989 Over
50% O
Samsung Electronics Suzhou Computer Co.,
Ltd. 2002.09
Production of
electronic goods 1,232,625
Over
50% O
Samsung Display SuZhou Co., Ltd. 2002.09 TFT-LCD
processing 476,488
Over
50% O
Samsung Suzhou LCD Co., Ltd 2011.07 TFT-LCD
processing 328,157
Over
50% O
Shenzhen Samsung Electronics
Telecommunication Co., Ltd.(Previously
Shenzhen Samsung Kejian Mobile
Telecommunication Technology Co., Ltd.)
2002.02 Production of
telecom products 88,103
Over
50% O
B-7
Samsung Electronics Shanghai
Telecommunication Co., Ltd. 2001.11
Sale of telecom and
network products 5,923
Over
50% X
Samsung Semiconductor (China) R&D Co.,
Ltd. 2003.04 R&D 15,611
Over
50% X
Samsung Electronics China R&D Centre 2004.05 R&D 14,098 Over
50% X
Samsung (China) Semiconductor Co., Ltd. 2012.09 Production of
semiconductor 424,487
Over
50% O
Samsung Electronics Hainan Fiberoptics Co.,
Ltd. 2004.04
Production of fiber
optic and cable 109,423
Over
50% O
Samsung Electronics (Beijing) Service
Company Limited 2005.01 Services 97,445
Over
50% O
Tianjin Samsung LED Co., Ltd. 2009.05 Production of LED 479,900 Over
50% O
Tianjin Samsung Opto-Electronics Co., Ltd. 1994.02
Production of
camera and
camcorder
239,269 Over
50% O
World Cyber Games 2000.07 Game tournaments 1,893 Over
50% X
Samsung Display 2012.04 Production and sale
of display 33,791,814
Over
50% O
SU Materials 2011.08 Production of
electronic goods 23,035
Over
50% X
STECO 1995.06
Production of
semiconductor
components
103,646 Over
50% O
SEMES 1993.01
Semiconductor/FPD
manufacturing
equipment
338,822 Over
50% O
Samsung Electronics Service 1998.10 Electronics goods
repair services 292,387
Over
50% O
Living Plaza 1996.07 Sale of electronic
goods 514,542
Over
50% O
Samsung Electronics Logitech 1998.04 Total logistic
services 178,876
Over
50% O
Samsung Bluewings 2008.12 Team and game
sponsorship 4,001
Over
50% X
SVIC #6 Venture Capital Union 2005.07
Investment in
venture firms and
new technologies
53,441 Over
50% O
SVIC #14 Venture Capital Union 2009.05
Investment in
venture firms and
new technologies
67,324 Over
50% O
SVIC #20 Venture Capital Union 2011.03
Investment in
venture firms and
new technologies
43,844 Over
50% X
SVIC #21 Venture Capital Union 2011.11 Investment in
venture firms and 35,026
Over
50% X
B-8
new technologies
SVIC #22 Venture Capital Union 2011.11
Investment in
venture firms and
new technologies
61,773 Over
50% O
SVIC #23 Venture Capital Union 2012.10
Investment in
venture firms and
new technologies
2,515 Over
50% X
Hi Pioneer Private Securities Investment
Trust 1 2011.08
Investment in
venture firms and
new technologies
19,498 Over
50% X
TNP Small/Medium Size & Venture
Enterprises Growth Promotion Investment
Limited Partnership(TSUNAMI)
2011.08
Investment in
venture firms and
new technologies
3,059 Over
50% X
Samsung Medison 1985.07 Medical equipment 297,714 Over
50% O
RAY 2004.10 Dental CT 3,940 Over
50% X
SONOACE Deutschland GmbH 2001.10 Medical equipment 934 Over
50% X
Samsung Medison Italia S.r.l. 2008.10 Medical equipment 1409 Over
50% X
Samsung Medison Europe B.V. 2005.11 Medical equipment 751 Over
50% X
Samsung Medison Shanghai Medical
Instrument Co., Ltd. 1992.11 Medical equipment 13,455
Over
50% X
Medison (shanghai) Co., Ltd. 2003.09 Medical equipment 1,875 Over
50% X
Medison Medical Equipment Shanghai Co.,
Ltd. 2005.03 Medical equipment 793
Over
50% X
Samsung Medison India Private Ltd. 2009.01 Medical equipment 305 Over
50% X
Medision Medical Systems India Private Ltd. 1997.10 Medical equipment 37 Over
50% X
Nexus DX Inc. 2009.07 Medical equipment 9,136 Over
50% X
Nanogen Recognomics GmbH 2001.07 Medical equipment - Over
50% X
NeuroLogica Corp. 2004.02 Medical equipment 24,630 Over
50% X
Samsung Electronics Vietnam
THAINGUYEN Co., Ltd. 2013.03
Production of
telecom products -
Over
50% X
Samsung Network R&D Center China-
Shenzhen 2013.03 R&D -
Over
50% X
Samsung Electronics Switzerland GmbH 2013.05 Sale of electronic
goods -
Over
50% X
Samsung R&D Institute China-Xian 2013.07 R&D - Over
50% X
B-9
SEMES (XIAN) Co., Ltd. 2013.07 Semiconductor
equipment -
Over
50% X
Samsung Electronics New Zealand Limited 2013.09 Sale of electronic
goods -
Over
50% X
※ Companies whose total assets were KRW50 billion or more at end-2012 are classified as major subsidiaries.
□ Total Number of Shares, etc.
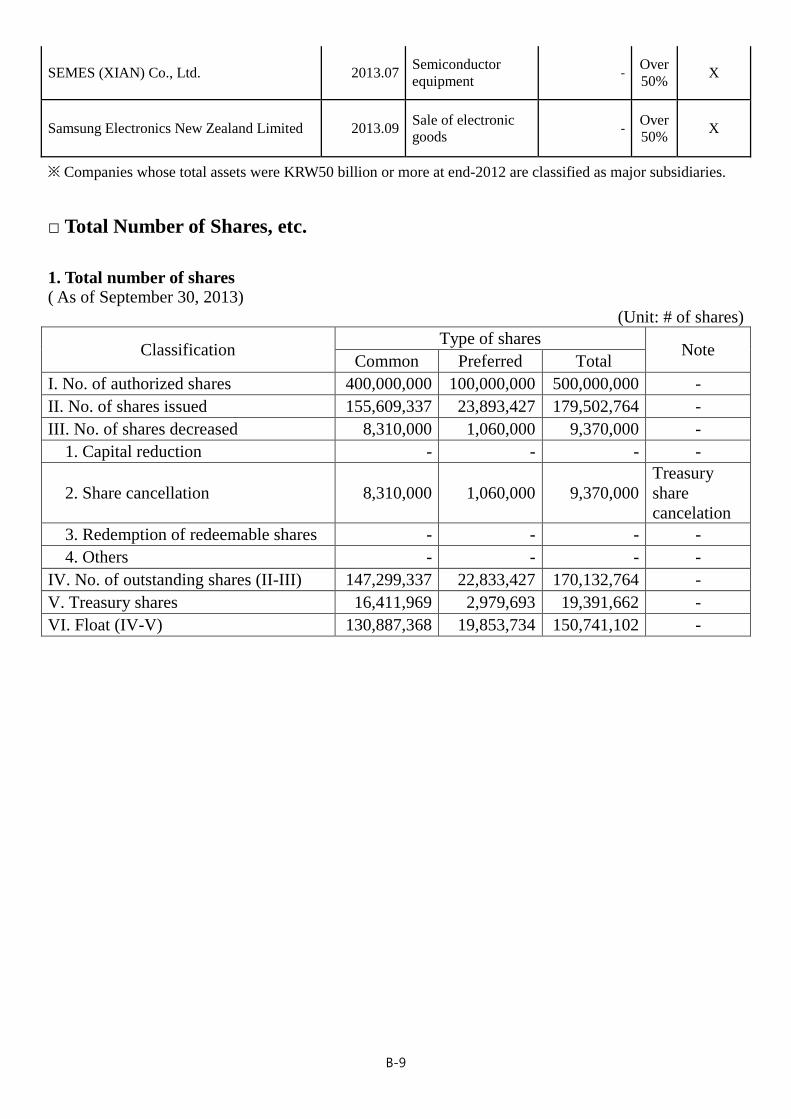
1. Total number of shares
( As of September 30, 2013)
(Unit: # of shares)
Classification Type of shares
Note Common Preferred Total
I. No. of authorized shares 400,000,000 100,000,000 500,000,000 -
II. No. of shares issued 155,609,337 23,893,427 179,502,764 -
III. No. of shares decreased 8,310,000 1,060,000 9,370,000 -
1. Capital reduction - - - -
2. Share cancellation 8,310,000 1,060,000 9,370,000
Treasury
share
cancelation
3. Redemption of redeemable shares - - - -
4. Others - - - -
IV. No. of outstanding shares (II-III) 147,299,337 22,833,427 170,132,764 -
V. Treasury shares 16,411,969 2,979,693 19,391,662 -
VI. Float (IV-V) 130,887,368 19,853,734 150,741,102 -
B-10
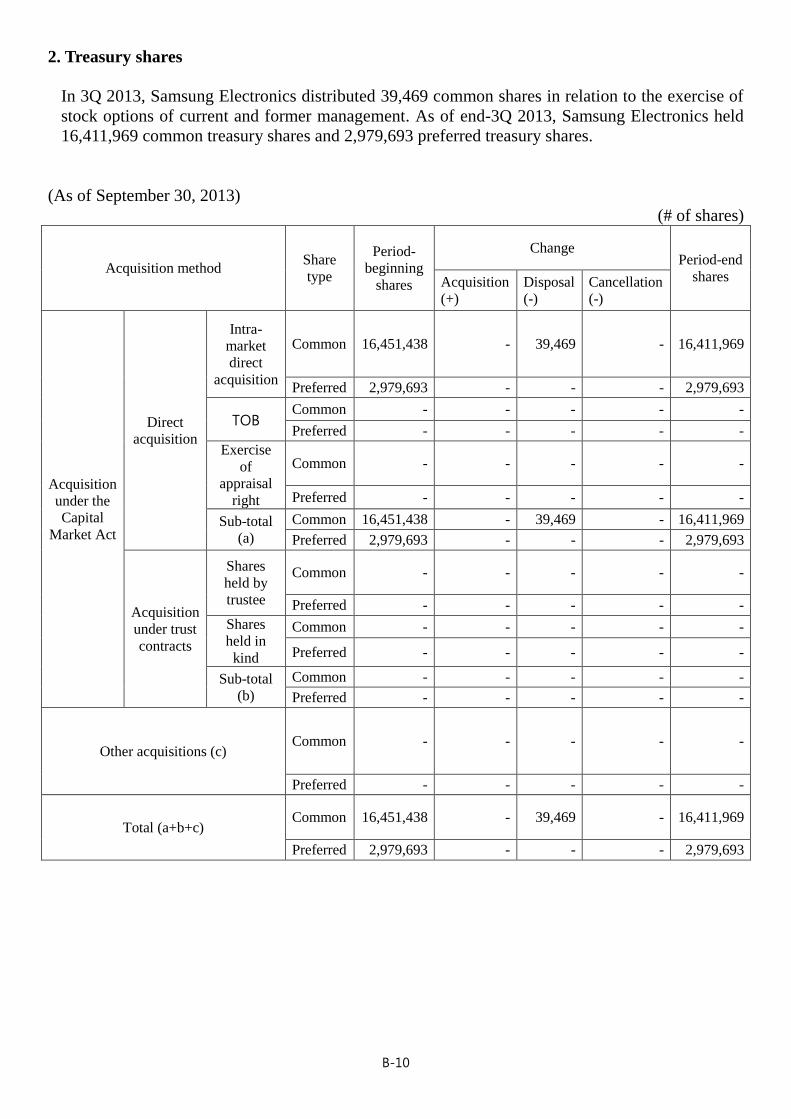
2. Treasury shares
In 3Q 2013, Samsung Electronics distributed 39,469 common shares in relation to the exercise of
stock options of current and former management. As of end-3Q 2013, Samsung Electronics held
16,411,969 common treasury shares and 2,979,693 preferred treasury shares.
(As of September 30, 2013)
(# of shares)
Acquisition method Share
type
Period-
beginning
shares
Change Period-end
shares Acquisition
(+)
Disposal
(-)
Cancellation
(-)
Acquisition
under the
Capital
Market Act
Direct
acquisition
Intra-
market
direct
acquisition
Common 16,451,438 - 39,469 - 16,411,969
Preferred 2,979,693 - - - 2,979,693
TOB Common - - - - -
Preferred - - - - -
Exercise
of
appraisal
right
Common - - - - -
Preferred - - - - -
Sub-total
(a)
Common 16,451,438 - 39,469 - 16,411,969
Preferred 2,979,693 - - - 2,979,693
Acquisition
under trust
contracts
Shares
held by
trustee
Common - - - - -
Preferred - - - - -
Shares
held in
kind
Common - - - - -
Preferred - - - - -
Sub-total
(b)
Common - - - - -
Preferred - - - - -
Other acquisitions (c) Common - - - - -
Preferred - - - - -
Total (a+b+c) Common 16,451,438 - 39,469 - 16,411,969
Preferred 2,979,693 - - - 2,979,693
B-11
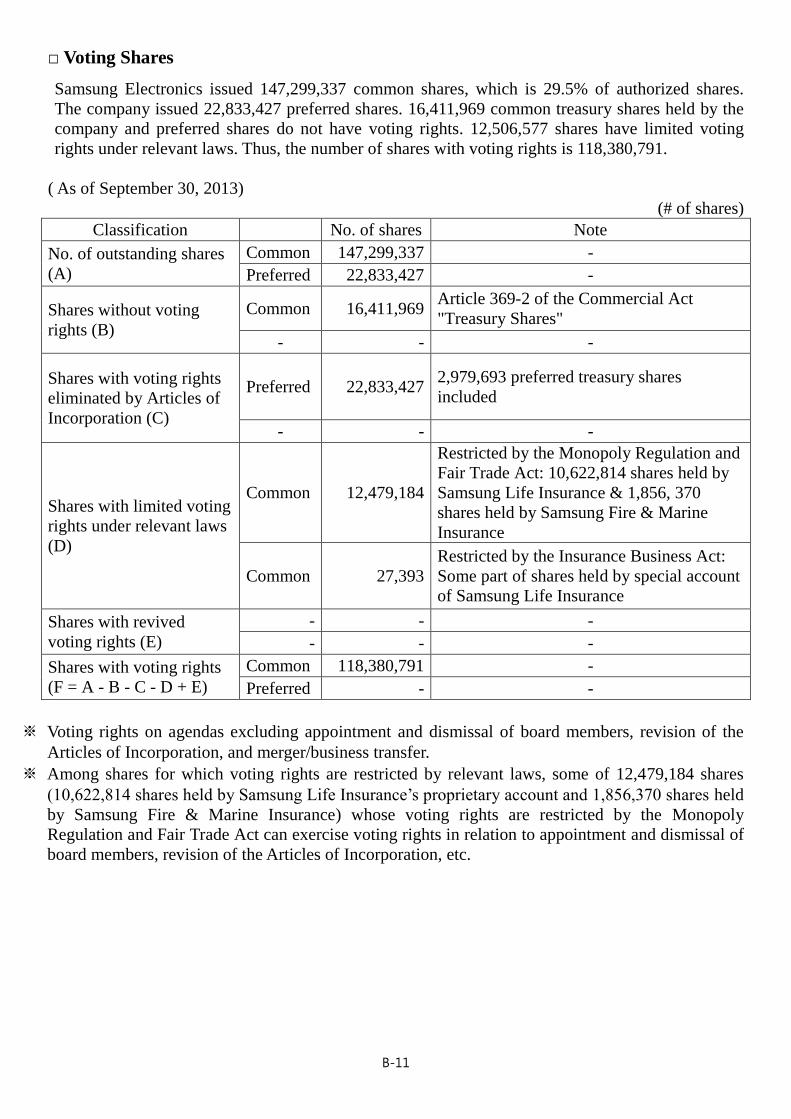
□ Voting Shares
Samsung Electronics issued 147,299,337 common shares, which is 29.5% of authorized shares.
The company issued 22,833,427 preferred shares. 16,411,969 common treasury shares held by the
company and preferred shares do not have voting rights. 12,506,577 shares have limited voting
rights under relevant laws. Thus, the number of shares with voting rights is 118,380,791.
( As of September 30, 2013)
(# of shares)
Classification No. of shares Note
No. of outstanding shares
(A)
Common 147,299,337 -
Preferred 22,833,427 -
Shares without voting
rights (B)
Common 16,411,969 Article 369-2 of the Commercial Act
"Treasury Shares"
- - -
Shares with voting rights
eliminated by Articles of
Incorporation (C)
Preferred 22,833,427 2,979,693 preferred treasury shares
included
- - -
Shares with limited voting
rights under relevant laws
(D)
Common 12,479,184
Restricted by the Monopoly Regulation and
Fair Trade Act: 10,622,814 shares held by
Samsung Life Insurance & 1,856, 370
shares held by Samsung Fire & Marine
Insurance
Common 27,393
Restricted by the Insurance Business Act:
Some part of shares held by special account
of Samsung Life Insurance
Shares with revived
voting rights (E)
- - -
- - -
Shares with voting rights
(F = A - B - C - D + E)
Common 118,380,791 -
Preferred - -
※ Voting rights on agendas excluding appointment and dismissal of board members, revision of the
Articles of Incorporation, and merger/business transfer.
※ Among shares for which voting rights are restricted by relevant laws, some of 12,479,184 shares
(10,622,814 shares held by Samsung Life Insurance’s proprietary account and 1,856,370 shares held
by Samsung Fire & Marine Insurance) whose voting rights are restricted by the Monopoly
Regulation and Fair Trade Act can exercise voting rights in relation to appointment and dismissal of
board members, revision of the Articles of Incorporation, etc.
B-12
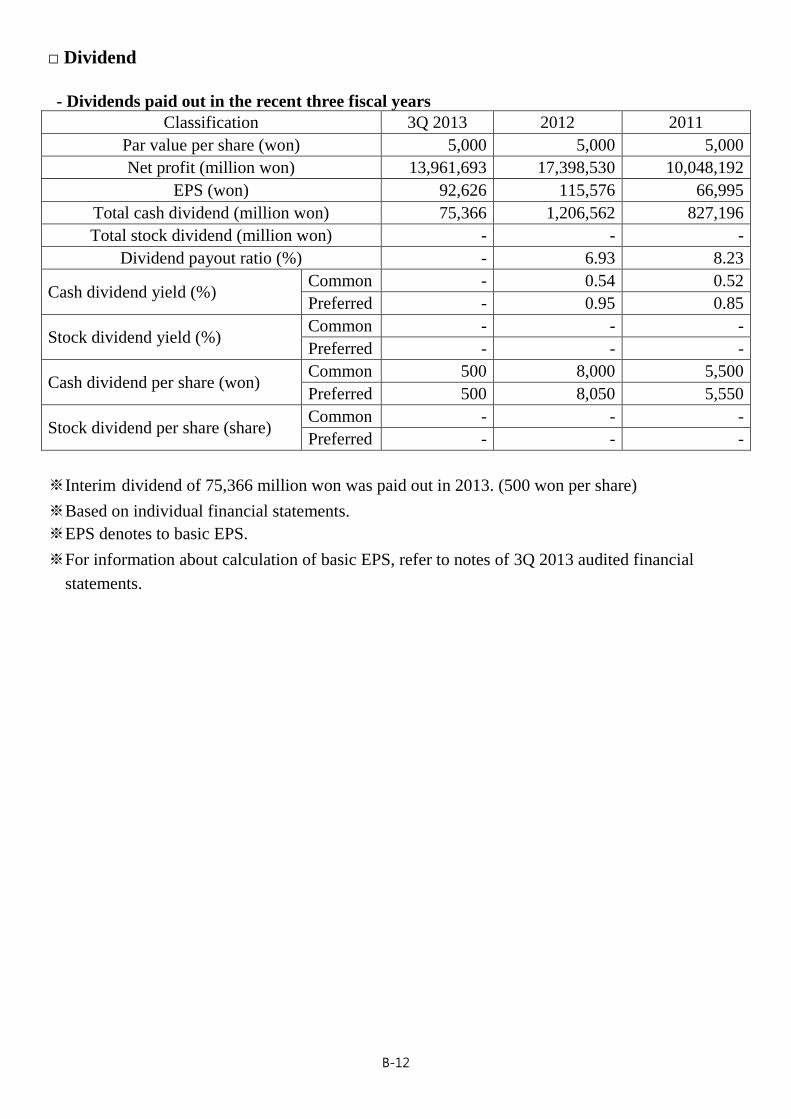
□ Dividend
- Dividends paid out in the recent three fiscal years
Classification 3Q 2013 2012 2011
Par value per share (won) 5,000 5,000 5,000
Net profit (million won) 13,961,693 17,398,530 10,048,192
EPS (won) 92,626 115,576 66,995
Total cash dividend (million won) 75,366 1,206,562 827,196
Total stock dividend (million won) - - -
Dividend payout ratio (%) - 6.93 8.23
Cash dividend yield (%) Common - 0.54 0.52
Preferred - 0.95 0.85
Stock dividend yield (%) Common - - -
Preferred - - -
Cash dividend per share (won) Common 500 8,000 5,500
Preferred 500 8,050 5,550
Stock dividend per share (share) Common - - -
Preferred - - -
※Interim dividend of 75,366 million won was paid out in 2013. (500 won per share)
※Based on individual financial statements.
※EPS denotes to basic EPS.
※For information about calculation of basic EPS, refer to notes of 3Q 2013 audited financial
statements.
B-13
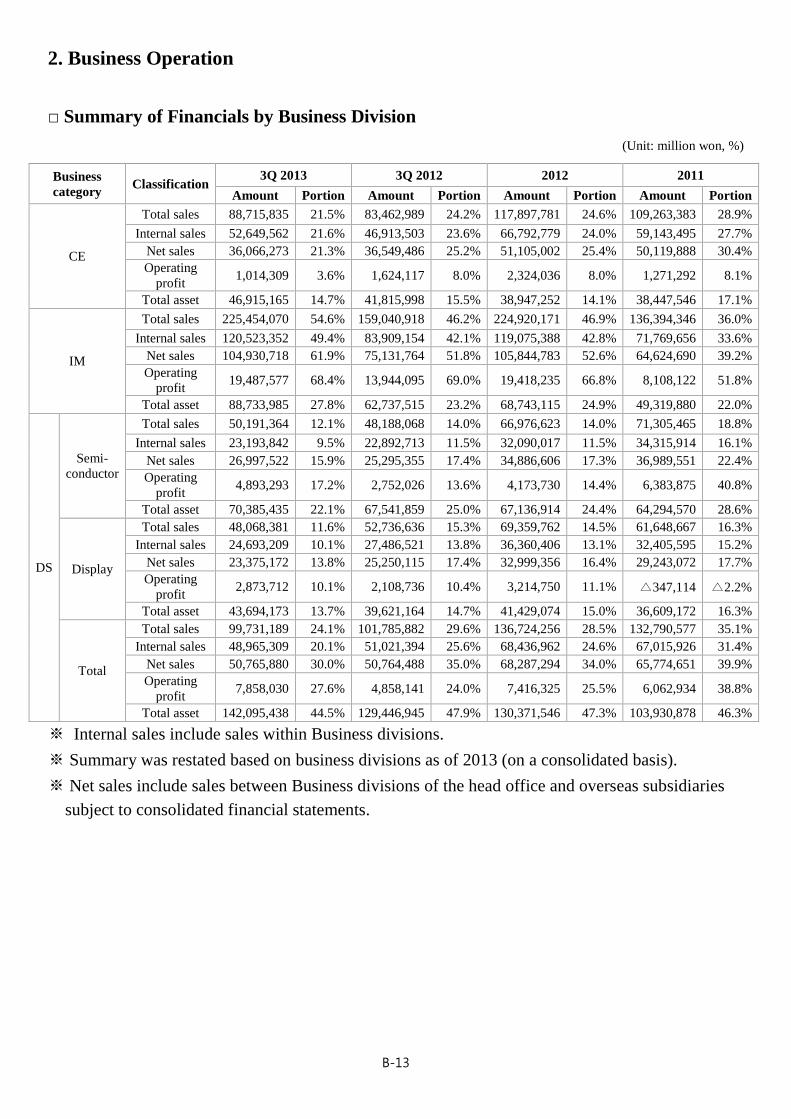
2. Business Operation
□ Summary of Financials by Business Division
(Unit: million won, %)
Business
category Classification
3Q 2013 3Q 2012 2012 2011
Amount Portion Amount Portion Amount Portion Amount Portion
CE
Total sales 88,715,835 21.5% 83,462,989 24.2% 117,897,781 24.6% 109,263,383 28.9%
Internal sales 52,649,562 21.6% 46,913,503 23.6% 66,792,779 24.0% 59,143,495 27.7%
Net sales 36,066,273 21.3% 36,549,486 25.2% 51,105,002 25.4% 50,119,888 30.4%
Operating
profit 1,014,309 3.6% 1,624,117 8.0% 2,324,036 8.0% 1,271,292 8.1%
Total asset 46,915,165 14.7% 41,815,998 15.5% 38,947,252 14.1% 38,447,546 17.1%
IM
Total sales 225,454,070 54.6% 159,040,918 46.2% 224,920,171 46.9% 136,394,346 36.0%
Internal sales 120,523,352 49.4% 83,909,154 42.1% 119,075,388 42.8% 71,769,656 33.6%
Net sales 104,930,718 61.9% 75,131,764 51.8% 105,844,783 52.6% 64,624,690 39.2%
Operating
profit 19,487,577 68.4% 13,944,095 69.0% 19,418,235 66.8% 8,108,122 51.8%
Total asset 88,733,985 27.8% 62,737,515 23.2% 68,743,115 24.9% 49,319,880 22.0%
DS
Semi-
conductor
Total sales 50,191,364 12.1% 48,188,068 14.0% 66,976,623 14.0% 71,305,465 18.8%
Internal sales 23,193,842 9.5% 22,892,713 11.5% 32,090,017 11.5% 34,315,914 16.1%
Net sales 26,997,522 15.9% 25,295,355 17.4% 34,886,606 17.3% 36,989,551 22.4%
Operating
profit 4,893,293 17.2% 2,752,026 13.6% 4,173,730 14.4% 6,383,875 40.8%
Total asset 70,385,435 22.1% 67,541,859 25.0% 67,136,914 24.4% 64,294,570 28.6%
Display
Total sales 48,068,381 11.6% 52,736,636 15.3% 69,359,762 14.5% 61,648,667 16.3%
Internal sales 24,693,209 10.1% 27,486,521 13.8% 36,360,406 13.1% 32,405,595 15.2%
Net sales 23,375,172 13.8% 25,250,115 17.4% 32,999,356 16.4% 29,243,072 17.7%
Operating
profit 2,873,712 10.1% 2,108,736 10.4% 3,214,750 11.1% △347,114 △2.2%
Total asset 43,694,173 13.7% 39,621,164 14.7% 41,429,074 15.0% 36,609,172 16.3%
Total
Total sales 99,731,189 24.1% 101,785,882 29.6% 136,724,256 28.5% 132,790,577 35.1%
Internal sales 48,965,309 20.1% 51,021,394 25.6% 68,436,962 24.6% 67,015,926 31.4%
Net sales 50,765,880 30.0% 50,764,488 35.0% 68,287,294 34.0% 65,774,651 39.9%
Operating
profit 7,858,030 27.6% 4,858,141 24.0% 7,416,325 25.5% 6,062,934 38.8%
Total asset 142,095,438 44.5% 129,446,945 47.9% 130,371,546 47.3% 103,930,878 46.3%
※ Internal sales include sales within Business divisions.
※ Summary was restated based on business divisions as of 2013 (on a consolidated basis).
※ Net sales include sales between Business divisions of the head office and overseas subsidiaries
subject to consolidated financial statements.
B-14
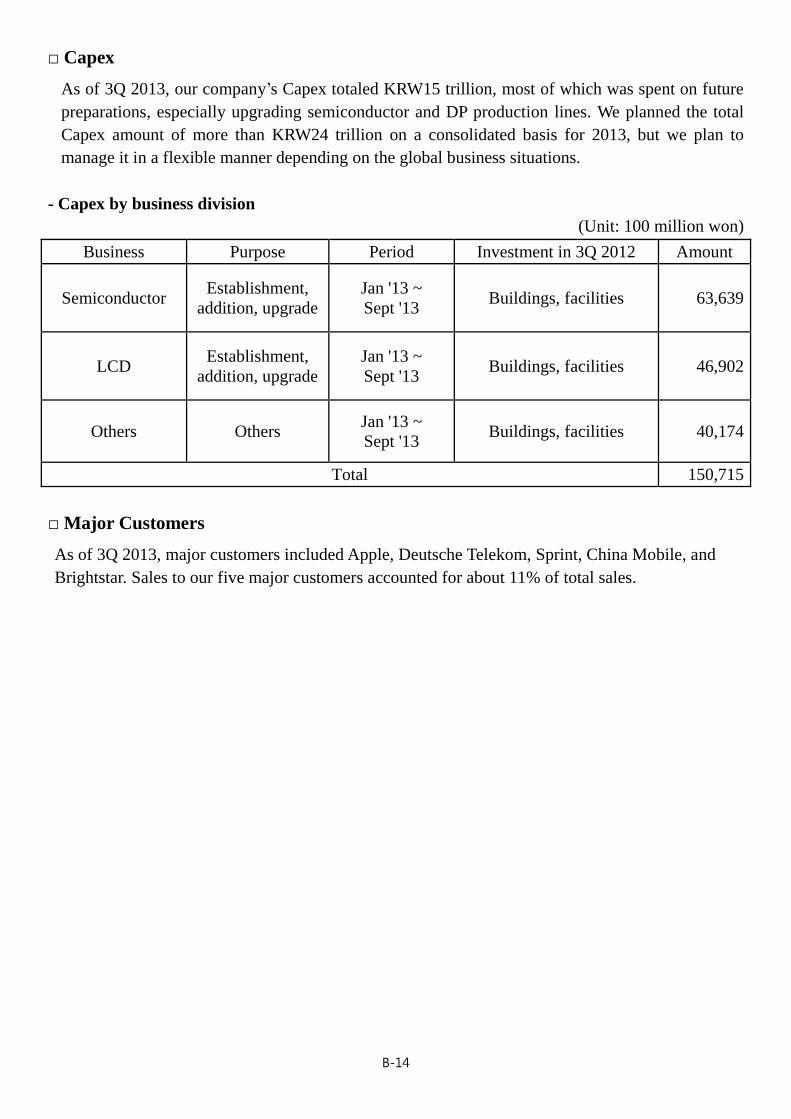
□ Capex
As of 3Q 2013, our company’s Capex totaled KRW15 trillion, most of which was spent on future
preparations, especially upgrading semiconductor and DP production lines. We planned the total
Capex amount of more than KRW24 trillion on a consolidated basis for 2013, but we plan to
manage it in a flexible manner depending on the global business situations.
- Capex by business division
(Unit: 100 million won)
Business Purpose Period Investment in 3Q 2012 Amount
Semiconductor Establishment,
addition, upgrade
Jan '13 ~
Sept '13 Buildings, facilities 63,639
LCD Establishment,
addition, upgrade
Jan '13 ~
Sept '13 Buildings, facilities 46,902
Others Others Jan '13 ~
Sept '13 Buildings, facilities 40,174
Total 150,715
□ Major Customers
As of 3Q 2013, major customers included Apple, Deutsche Telekom, Sprint, China Mobile, and
Brightstar. Sales to our five major customers accounted for about 11% of total sales.
B-15
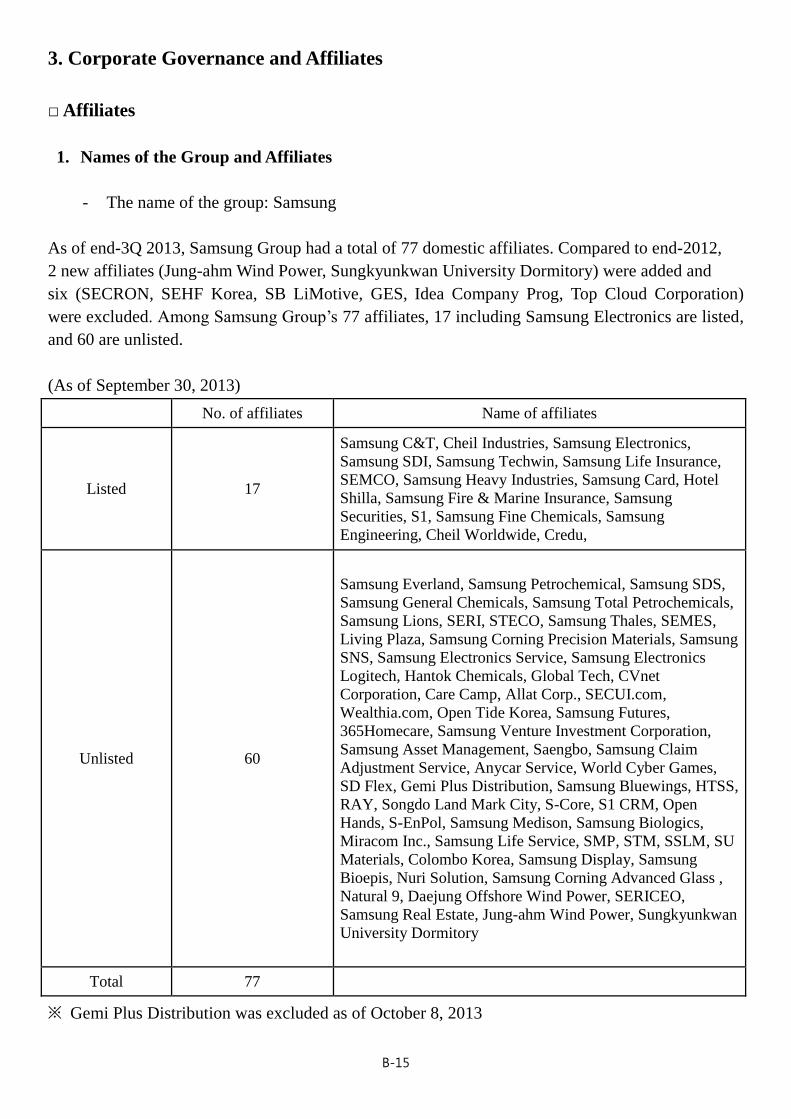
3. Corporate Governance and Affiliates
□ Affiliates
1. Names of the Group and Affiliates
- The name of the group: Samsung
As of end-3Q 2013, Samsung Group had a total of 77 domestic affiliates. Compared to end-2012,
2 new affiliates (Jung-ahm Wind Power, Sungkyunkwan University Dormitory) were added and
six (SECRON, SEHF Korea, SB LiMotive, GES, Idea Company Prog, Top Cloud Corporation)
were excluded. Among Samsung Group’s 77 affiliates, 17 including Samsung Electronics are listed,
and 60 are unlisted.
(As of September 30, 2013)
No. of affiliates Name of affiliates
Listed 17
Samsung C&T, Cheil Industries, Samsung Electronics,
Samsung SDI, Samsung Techwin, Samsung Life Insurance,
SEMCO, Samsung Heavy Industries, Samsung Card, Hotel
Shilla, Samsung Fire & Marine Insurance, Samsung
Securities, S1, Samsung Fine Chemicals, Samsung
Engineering, Cheil Worldwide, Credu,
Unlisted 60
Samsung Everland, Samsung Petrochemical, Samsung SDS,
Samsung General Chemicals, Samsung Total Petrochemicals,
Samsung Lions, SERI, STECO, Samsung Thales, SEMES,
Living Plaza, Samsung Corning Precision Materials, Samsung
SNS, Samsung Electronics Service, Samsung Electronics
Logitech, Hantok Chemicals, Global Tech, CVnet
Corporation, Care Camp, Allat Corp., SECUI.com,
Wealthia.com, Open Tide Korea, Samsung Futures,
365Homecare, Samsung Venture Investment Corporation,
Samsung Asset Management, Saengbo, Samsung Claim
Adjustment Service, Anycar Service, World Cyber Games,
SD Flex, Gemi Plus Distribution, Samsung Bluewings, HTSS,
RAY, Songdo Land Mark City, S-Core, S1 CRM, Open
Hands, S-EnPol, Samsung Medison, Samsung Biologics,
Miracom Inc., Samsung Life Service, SMP, STM, SSLM, SU
Materials, Colombo Korea, Samsung Display, Samsung
Bioepis, Nuri Solution, Samsung Corning Advanced Glass ,
Natural 9, Daejung Offshore Wind Power, SERICEO,
Samsung Real Estate, Jung-ahm Wind Power, Sungkyunkwan
University Dormitory
Total 77
※ Gemi Plus Distribution was excluded as of October 8, 2013
B-16
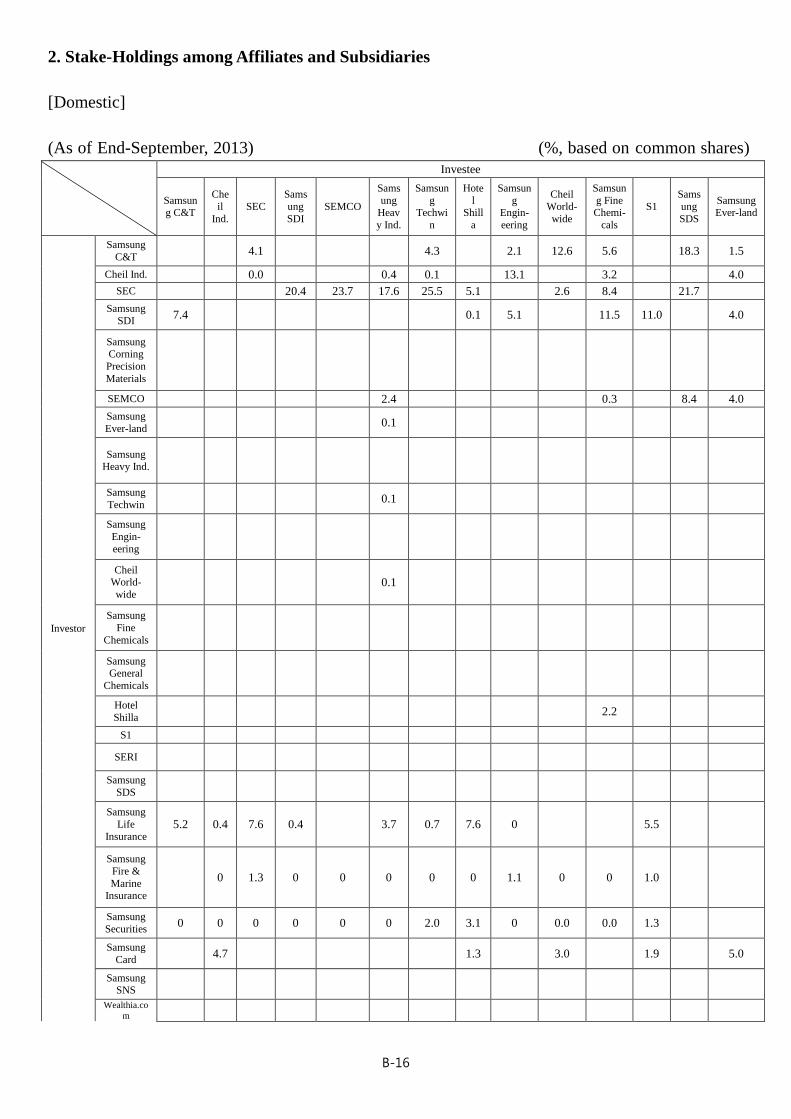
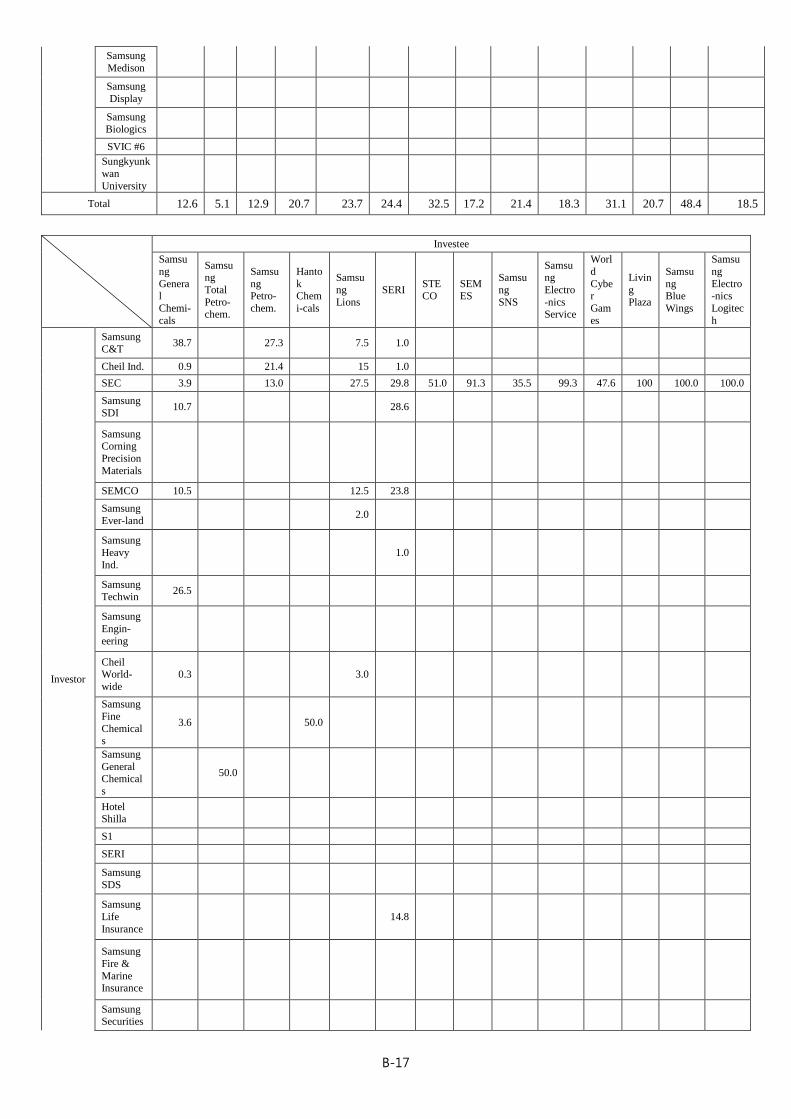
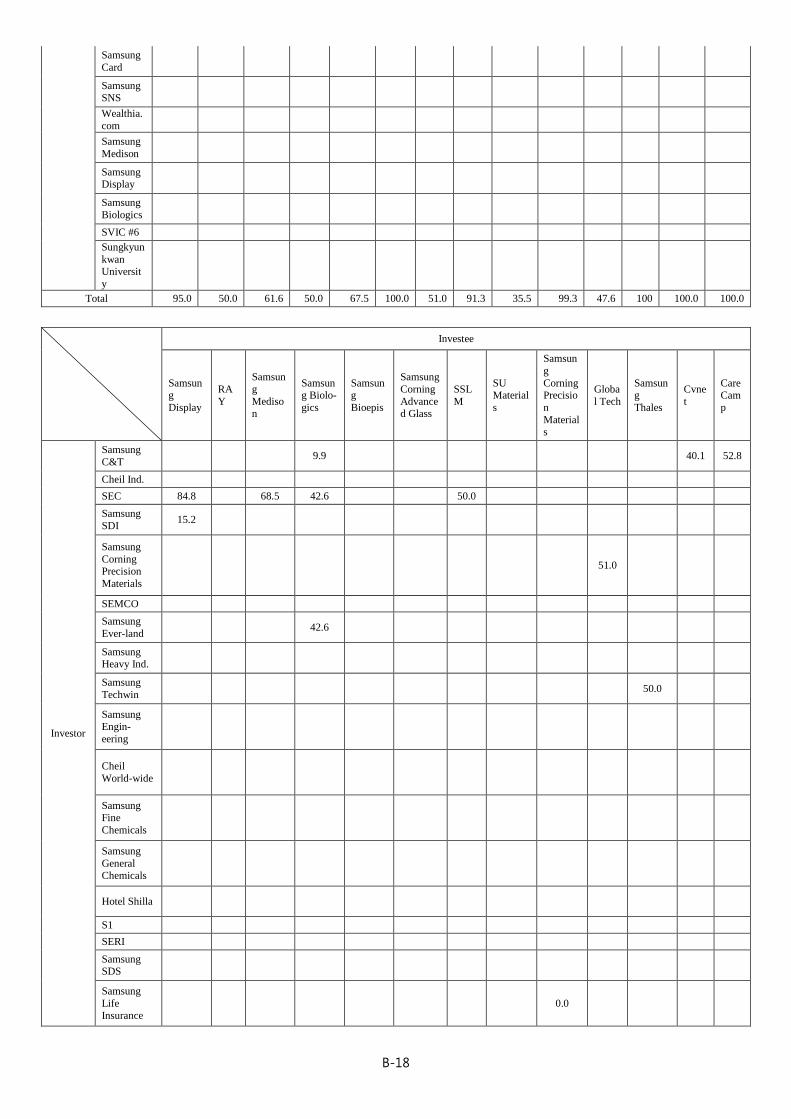
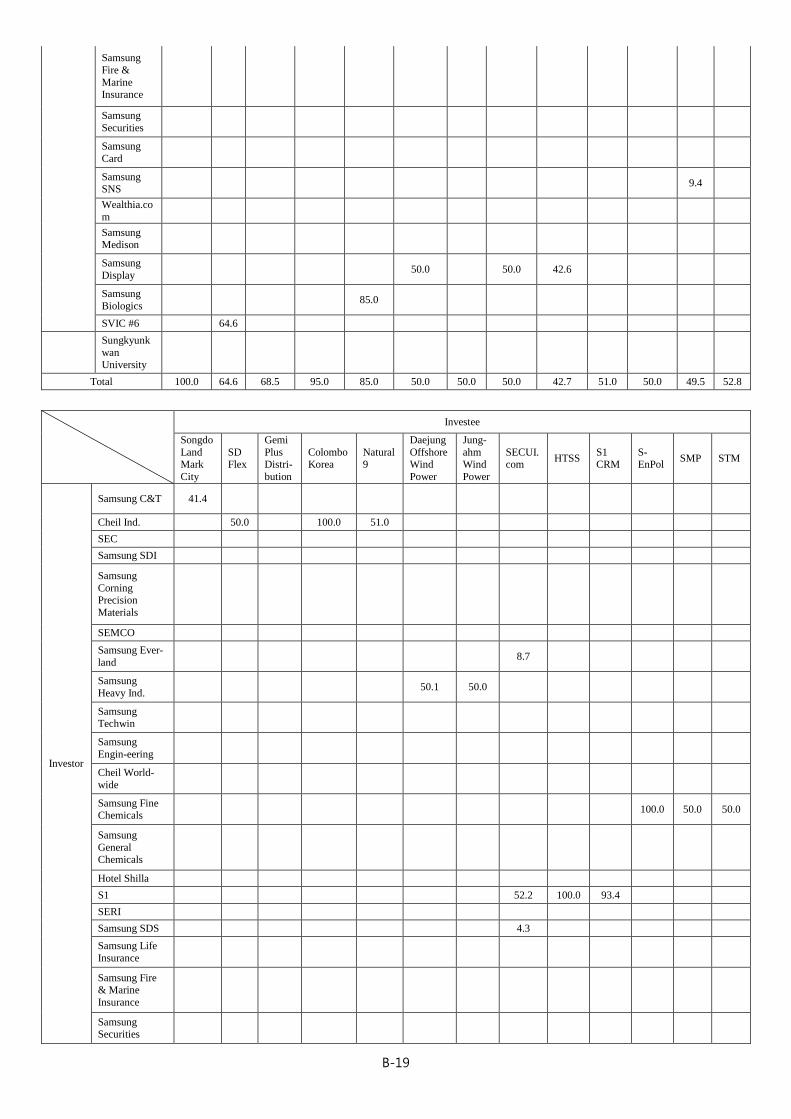
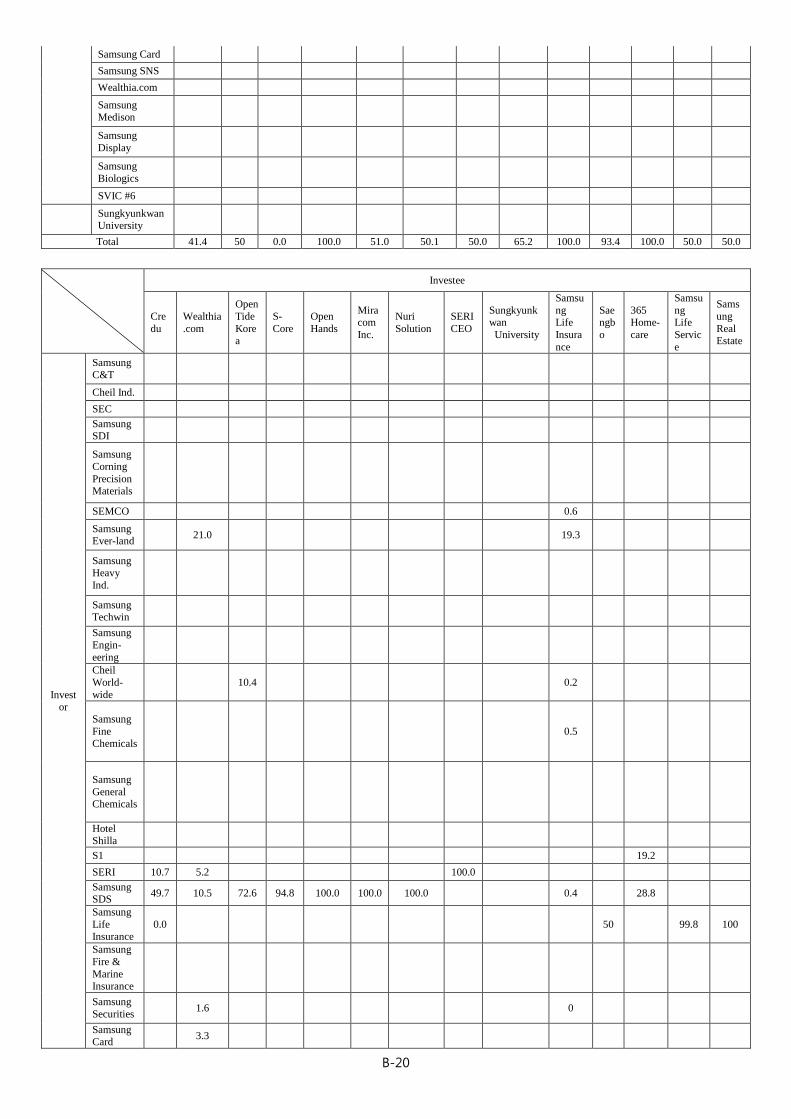
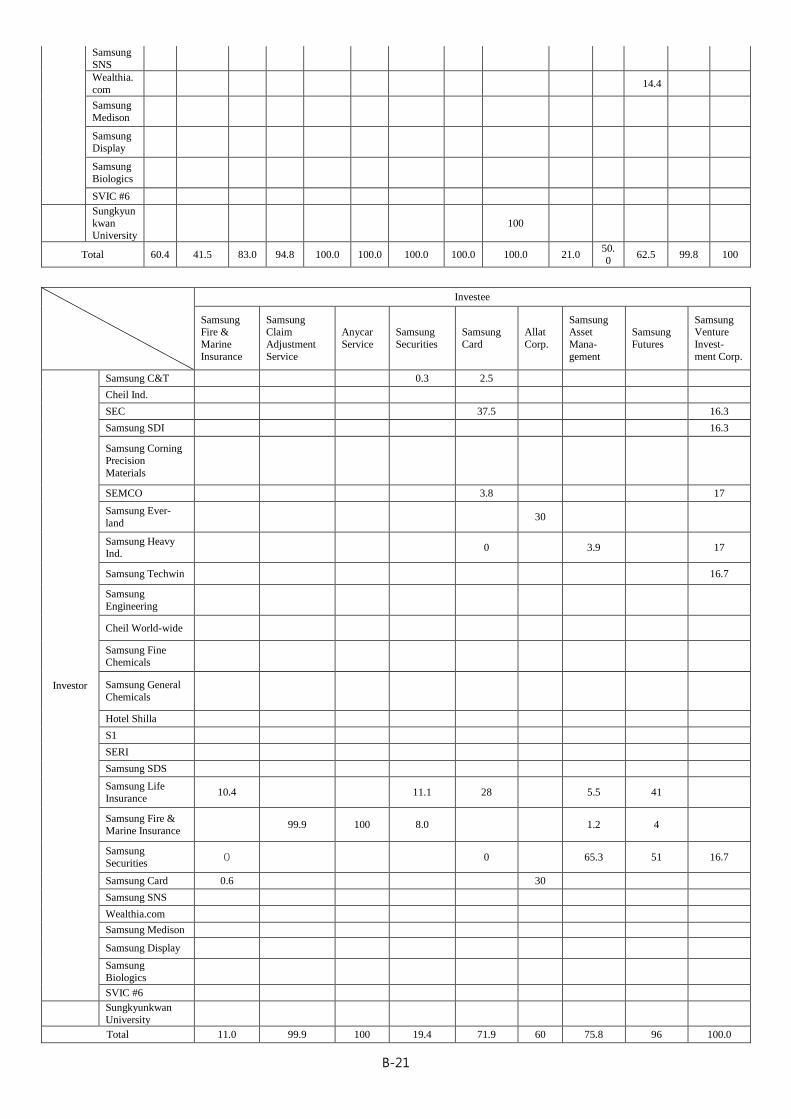
2. Stake-Holdings among Affiliates and Subsidiaries
[Domestic]
(As of End-September, 2013) (%, based on common shares)
Investee
Samsung C&T
Che
il
Ind.
SEC
Sams
ung
SDI
SEMCO
Sams
ung Heav
y Ind.
Samsun
g Techwi
n
Hote
l Shill
a
Samsun
g Engin-
eering
Cheil
World-
wide
Samsun
g Fine Chemi-
cals
S1
Sams
ung
SDS
Samsung Ever-land
Investor
Samsung
C&T 4.1 4.3 2.1 12.6 5.6 18.3 1.5
Cheil Ind. 0.0 0.4 0.1 13.1 3.2 4.0
SEC 20.4 23.7 17.6 25.5 5.1 2.6 8.4 21.7
Samsung
SDI 7.4 0.1 5.1 11.5 11.0 4.0
Samsung Corning
Precision
Materials
SEMCO 2.4 0.3 8.4 4.0
Samsung
Ever-land 0.1
Samsung Heavy Ind.
Samsung
Techwin 0.1
Samsung
Engin-
eering
Cheil World-
wide 0.1
Samsung
Fine
Chemicals
Samsung General
Chemicals
Hotel
Shilla 2.2
S1
SERI
Samsung
SDS
Samsung
Life
Insurance 5.2 0.4 7.6 0.4 3.7 0.7 7.6 0 5.5
Samsung
Fire &
Marine Insurance
0 1.3 0 0 0 0 0 1.1 0 0 1.0
Samsung
Securities 0 0 0 0 0 0 2.0 3.1 0 0.0 0.0 1.3
Samsung
Card 4.7 1.3 3.0 1.9 5.0
Samsung SNS
Wealthia.co
m
B-17
Samsung
Medison
Samsung
Display
Samsung
Biologics
SVIC #6
Sungkyunk
wan
University
Total 12.6 5.1 12.9 20.7 23.7 24.4 32.5 17.2 21.4 18.3 31.1 20.7 48.4 18.5
Investee
Samsu
ng
General
Chemi-
cals
Samsung
Total
Petro-chem.
Samsu
ng Petro-
chem.
Hanto
k Chem
i-cals
Samsu
ng
Lions
SERI STECO
SEMES
Samsu
ng
SNS
Samsung
Electro
-nics Service
Worl
d
Cyber
Gam
es
Livin
g
Plaza
Samsu
ng Blue
Wings
Samsu
ng
Electro-nics
Logitec
h
Investor
Samsung
C&T 38.7 27.3 7.5 1.0
Cheil Ind. 0.9 21.4 15 1.0
SEC 3.9 13.0 27.5 29.8 51.0 91.3 35.5 99.3 47.6 100 100.0 100.0
Samsung
SDI 10.7 28.6
Samsung Corning
Precision
Materials
SEMCO 10.5 12.5 23.8
Samsung
Ever-land 2.0
Samsung
Heavy
Ind.
1.0
Samsung
Techwin 26.5
Samsung
Engin-
eering
Cheil World-
wide
0.3 3.0
Samsung
Fine
Chemicals
3.6 50.0
Samsung
General Chemical
s
50.0
Hotel Shilla
S1
SERI
Samsung
SDS
Samsung
Life
Insurance
14.8
Samsung
Fire &
Marine Insurance
Samsung Securities
B-18
Samsung
Card
Samsung SNS
Wealthia.
com
Samsung
Medison
Samsung Display
Samsung
Biologics
SVIC #6
Sungkyun
kwan Universit
y
Total 95.0 50.0 61.6 50.0 67.5 100.0 51.0 91.3 35.5 99.3 47.6 100 100.0 100.0
Investee
Samsung
Display
RA
Y
Samsun
g
Medison
Samsung Biolo-
gics
Samsung
Bioepis
Samsung
Corning
Advanced Glass
SSL
M
SU Material
s
Samsun
g
Corning Precisio
n
Materials
Globa
l Tech
Samsung
Thales
Cvne
t
Care Cam
p
Investor
Samsung
C&T 9.9 40.1 52.8
Cheil Ind.
SEC 84.8 68.5 42.6 50.0
Samsung
SDI 15.2
Samsung
Corning Precision
Materials
51.0
SEMCO
Samsung
Ever-land 42.6
Samsung Heavy Ind.
Samsung
Techwin 50.0
Samsung Engin-
eering
Cheil
World-wide
Samsung Fine
Chemicals
Samsung
General
Chemicals
Hotel Shilla
S1
SERI
Samsung SDS
Samsung
Life Insurance
0.0
B-19
Samsung
Fire &
Marine Insurance
Samsung
Securities
Samsung
Card
Samsung SNS
9.4
Wealthia.co
m
Samsung Medison
Samsung
Display 50.0 50.0 42.6
Samsung
Biologics 85.0
SVIC #6 64.6
Sungkyunk
wan University
Total 100.0 64.6 68.5 95.0 85.0 50.0 50.0 50.0 42.7 51.0 50.0 49.5 52.8
Investee
Songdo
Land Mark
City
SD Flex
Gemi
Plus Distri-
bution
Colombo Korea
Natural 9
Daejung
Offshore Wind
Power
Jung-
ahm Wind
Power
SECUI. com
HTSS S1 CRM
S-EnPol
SMP STM
Investor
Samsung C&T 41.4
Cheil Ind. 50.0 100.0 51.0
SEC
Samsung SDI
Samsung
Corning Precision
Materials
SEMCO
Samsung Ever-
land 8.7
Samsung
Heavy Ind. 50.1 50.0
Samsung Techwin
Samsung
Engin-eering
Cheil World-
wide
Samsung Fine Chemicals
100.0 50.0 50.0
Samsung
General Chemicals
Hotel Shilla
S1 52.2 100.0 93.4
SERI
Samsung SDS 4.3
Samsung Life
Insurance
Samsung Fire & Marine
Insurance
Samsung Securities
B-20
Samsung Card
Samsung SNS
Wealthia.com
Samsung Medison
Samsung
Display
Samsung
Biologics
SVIC #6
Sungkyunkwan University
Total 41.4 50 0.0 100.0 51.0 50.1 50.0 65.2 100.0 93.4 100.0 50.0 50.0
Investee
Cre
du
Wealthia
.com
Open
Tide
Korea
S-
Core
Open
Hands
Miracom
Inc.
Nuri
Solution
SERI
CEO
Sungkyunkwan
University
Samsu
ng Life
Insura
nce
Saengb
o
365 Home-
care
Samsu
ng Life
Servic
e
Sams
ung
Real Estate
Investor
Samsung
C&T
Cheil Ind.
SEC
Samsung SDI
Samsung
Corning
Precision Materials
SEMCO 0.6
Samsung Ever-land
21.0 19.3
Samsung Heavy
Ind.
Samsung Techwin
Samsung
Engin-
eering
Cheil
World-
wide 10.4 0.2
Samsung
Fine Chemicals
0.5
Samsung
General Chemicals
Hotel Shilla
S1 19.2
SERI 10.7 5.2 100.0
Samsung SDS
49.7 10.5 72.6 94.8 100.0 100.0 100.0 0.4 28.8
Samsung
Life Insurance
0.0 50 99.8 100
Samsung
Fire &
Marine Insurance
Samsung
Securities 1.6 0
Samsung Card
3.3
B-21
Samsung
SNS
Wealthia.
com 14.4
Samsung
Medison
Samsung Display
Samsung
Biologics
SVIC #6
Sungkyun
kwan University
100
Total 60.4 41.5 83.0 94.8 100.0 100.0 100.0 100.0 100.0 21.0 50.
0 62.5 99.8 100
Investee
Samsung Fire &
Marine
Insurance
Samsung Claim
Adjustment
Service
Anycar
Service
Samsung
Securities
Samsung
Card
Allat
Corp.
Samsung Asset
Mana-
gement
Samsung
Futures
Samsung Venture
Invest-
ment Corp.
Investor
Samsung C&T 0.3 2.5
Cheil Ind.
SEC 37.5 16.3
Samsung SDI 16.3
Samsung Corning
Precision
Materials
SEMCO 3.8 17
Samsung Ever-
land 30
Samsung Heavy Ind.
0 3.9 17
Samsung Techwin 16.7
Samsung
Engineering
Cheil World-wide
Samsung Fine Chemicals
Samsung General
Chemicals
Hotel Shilla
S1
SERI
Samsung SDS
Samsung Life
Insurance 10.4 11.1 28 5.5 41
Samsung Fire &
Marine Insurance 99.9 100 8.0 1.2 4
Samsung
Securities 0 0 65.3 51 16.7
Samsung Card 0.6 30
Samsung SNS
Wealthia.com
Samsung Medison
Samsung Display
Samsung
Biologics
SVIC #6
Sungkyunkwan
University
Total 11.0 99.9 100 19.4 71.9 60 75.8 96 100.0
B-22
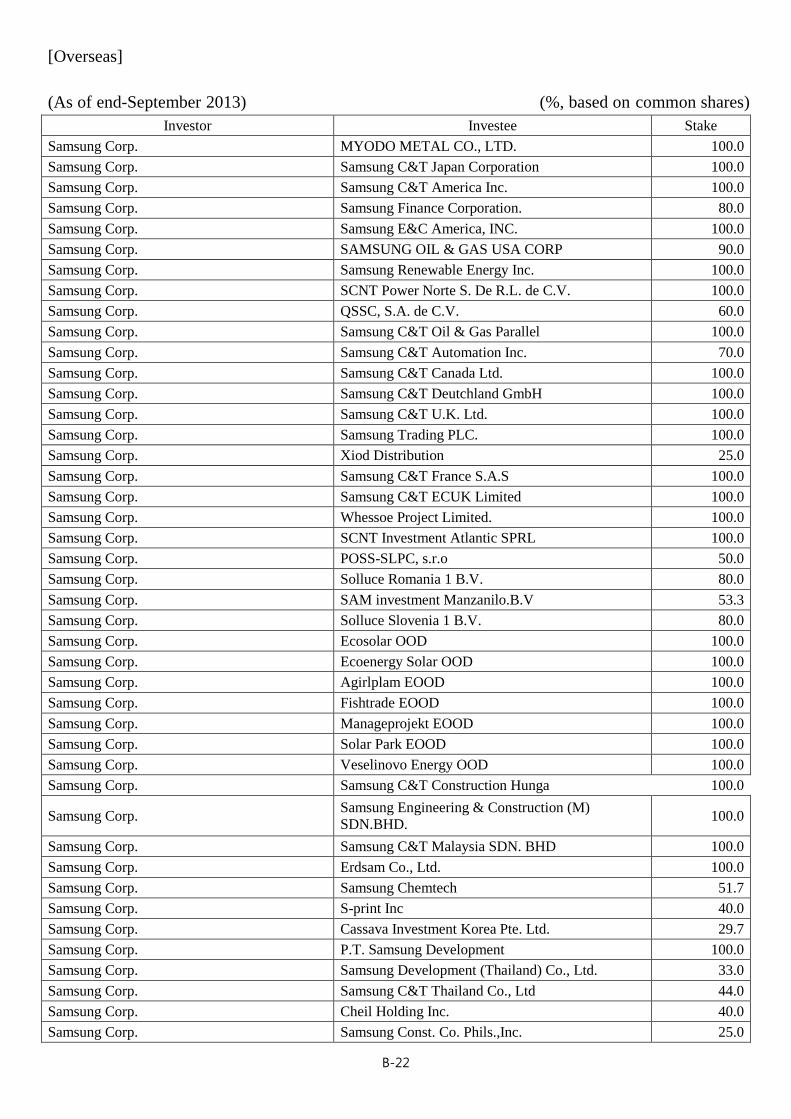
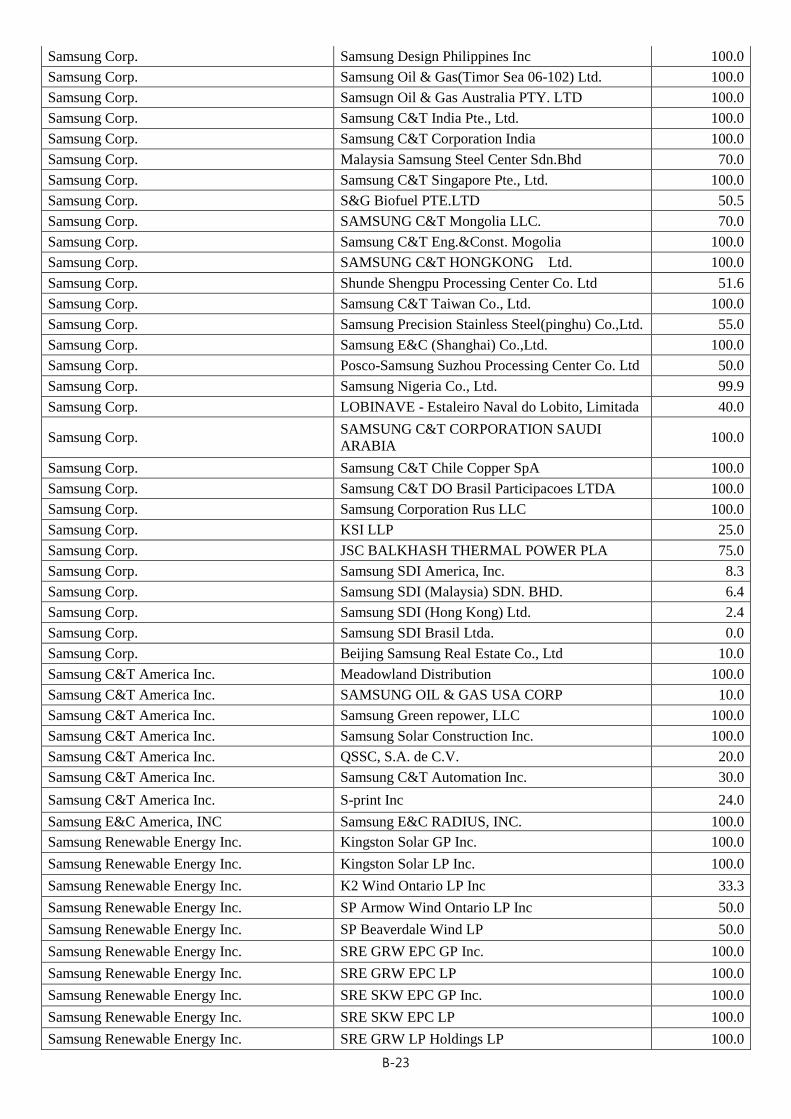
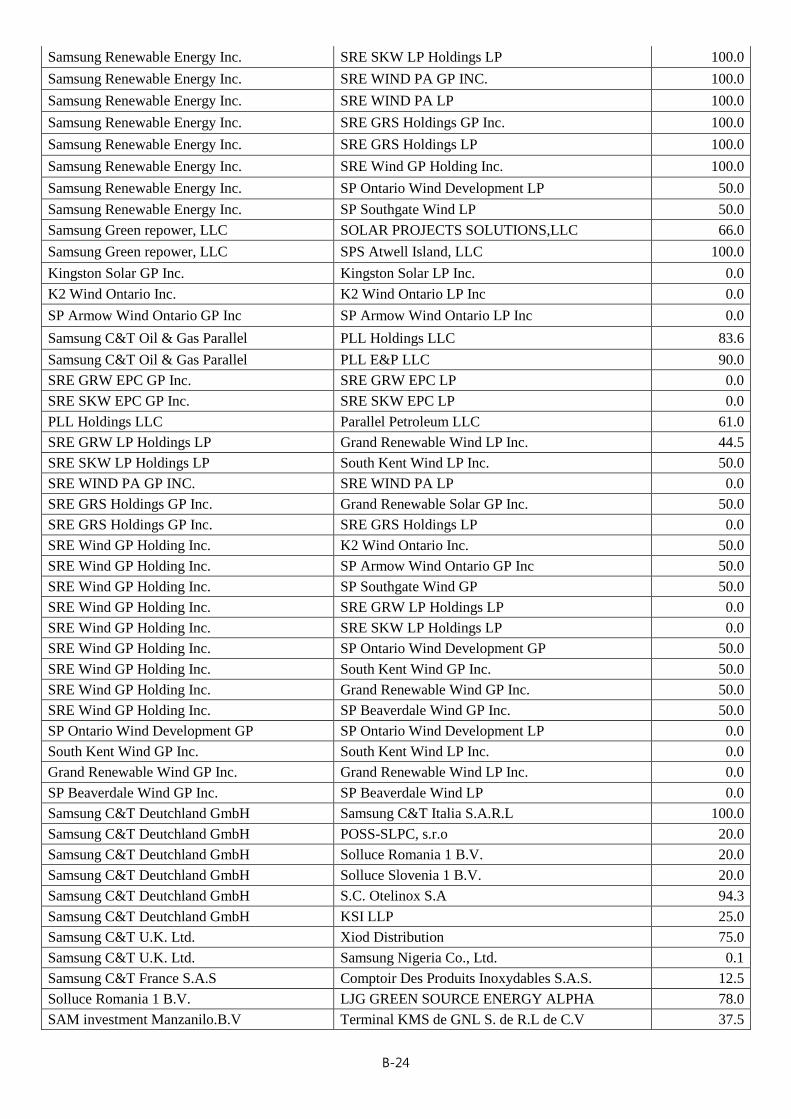
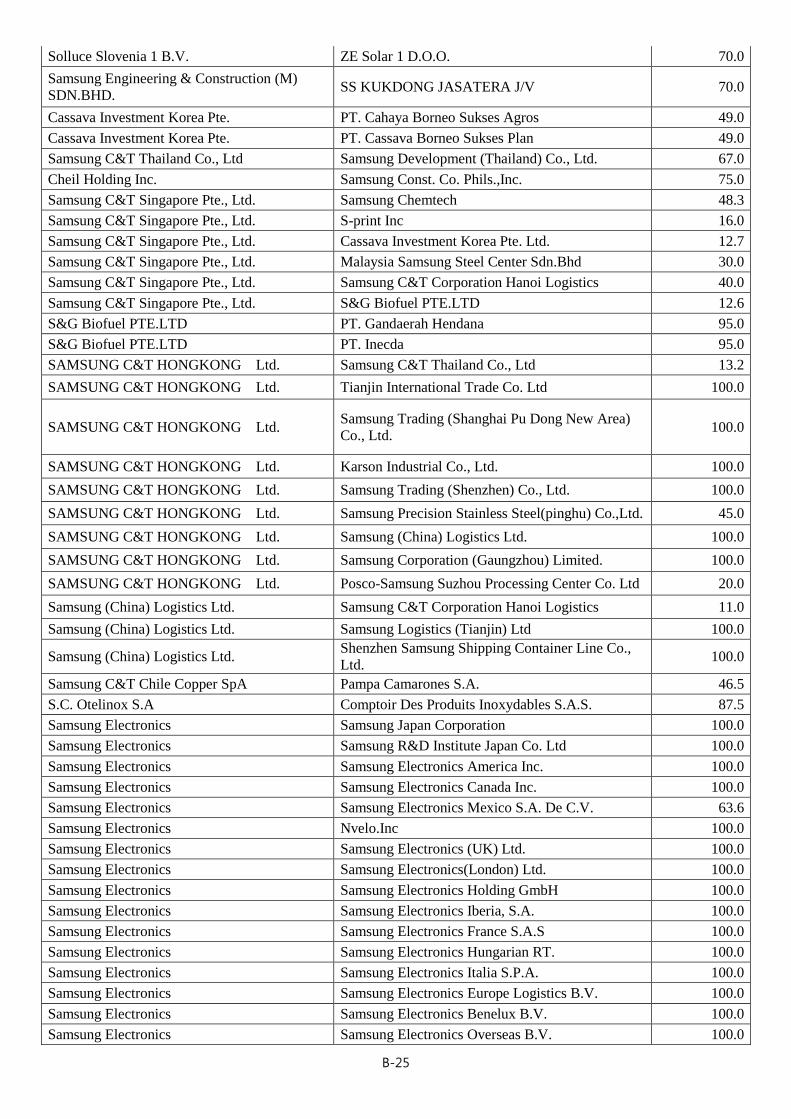
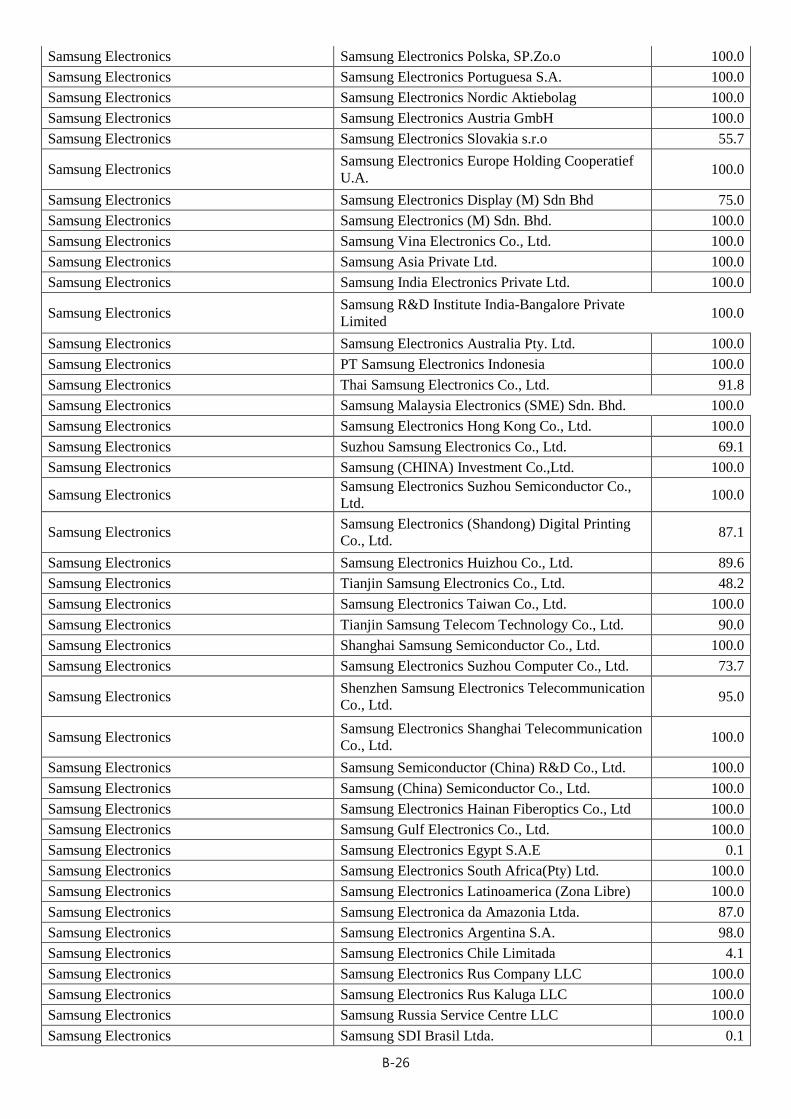
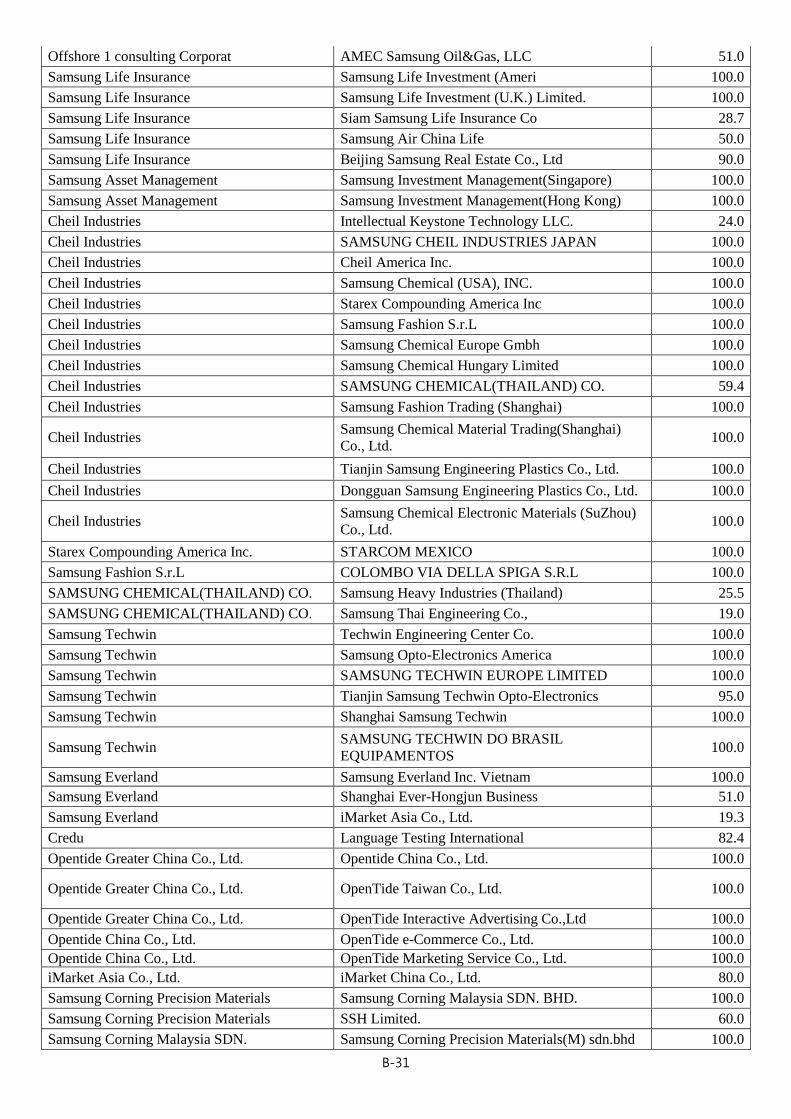
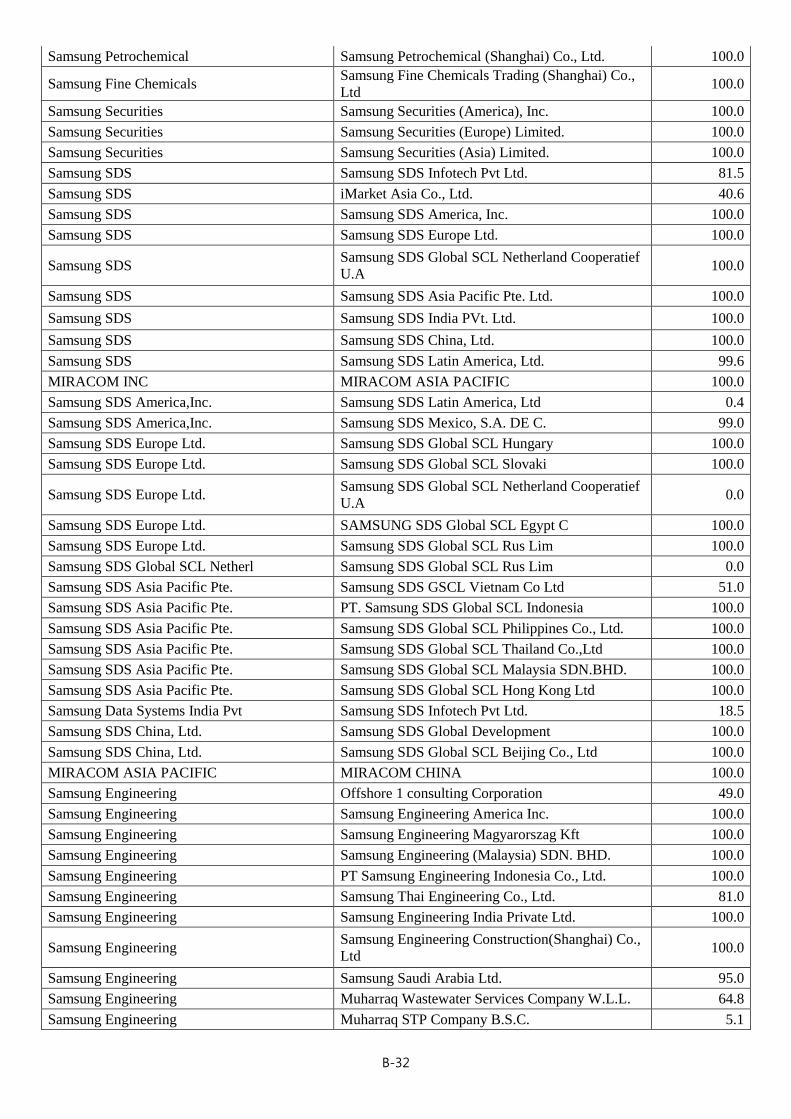
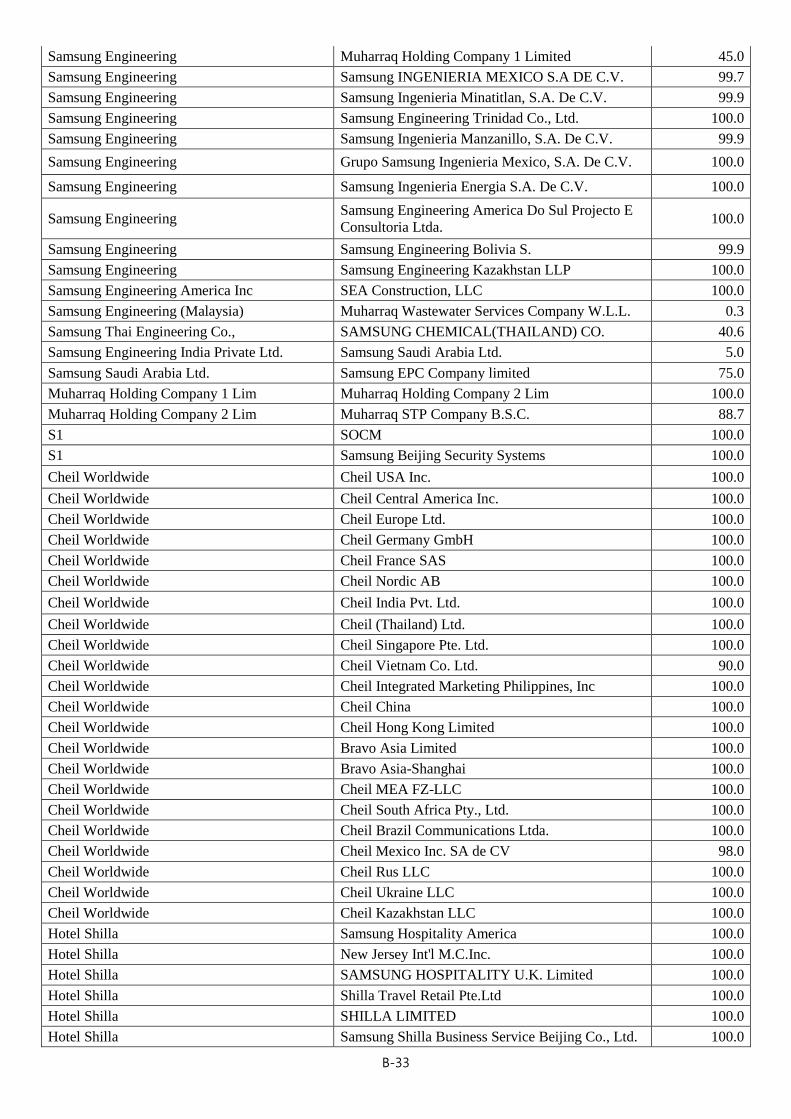
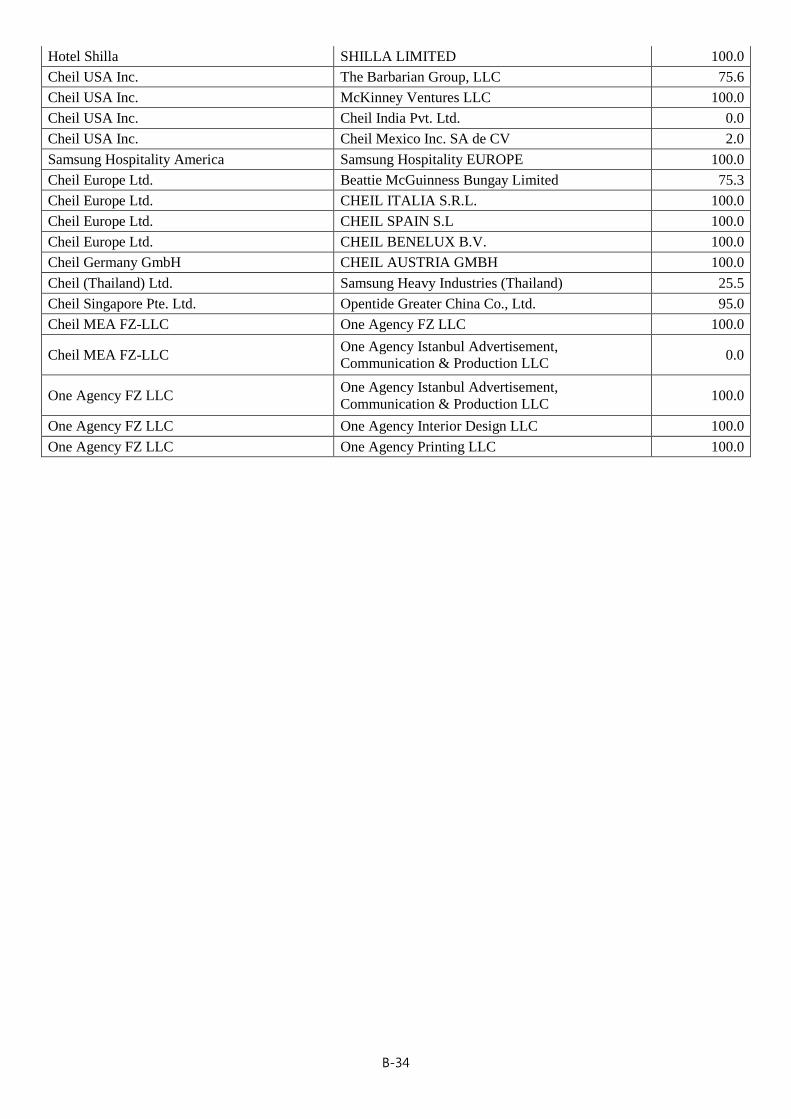
[Overseas]
(As of end-September 2013) (%, based on common shares)
Investor Investee Stake
Samsung Corp. MYODO METAL CO., LTD. 100.0
Samsung Corp. Samsung C&T Japan Corporation 100.0
Samsung Corp. Samsung C&T America Inc. 100.0
Samsung Corp. Samsung Finance Corporation. 80.0
Samsung Corp. Samsung E&C America, INC. 100.0
Samsung Corp. SAMSUNG OIL & GAS USA CORP 90.0
Samsung Corp. Samsung Renewable Energy Inc. 100.0
Samsung Corp. SCNT Power Norte S. De R.L. de C.V. 100.0
Samsung Corp. QSSC, S.A. de C.V. 60.0
Samsung Corp. Samsung C&T Oil & Gas Parallel 100.0
Samsung Corp. Samsung C&T Automation Inc. 70.0
Samsung Corp. Samsung C&T Canada Ltd. 100.0
Samsung Corp. Samsung C&T Deutchland GmbH 100.0
Samsung Corp. Samsung C&T U.K. Ltd. 100.0
Samsung Corp. Samsung Trading PLC. 100.0
Samsung Corp. Xiod Distribution 25.0
Samsung Corp. Samsung C&T France S.A.S 100.0
Samsung Corp. Samsung C&T ECUK Limited 100.0
Samsung Corp. Whessoe Project Limited. 100.0
Samsung Corp. SCNT Investment Atlantic SPRL 100.0
Samsung Corp. POSS-SLPC, s.r.o 50.0
Samsung Corp. Solluce Romania 1 B.V. 80.0
Samsung Corp. SAM investment Manzanilo.B.V 53.3
Samsung Corp. Solluce Slovenia 1 B.V. 80.0
Samsung Corp. Ecosolar OOD 100.0
Samsung Corp. Ecoenergy Solar OOD 100.0
Samsung Corp. Agirlplam EOOD 100.0
Samsung Corp. Fishtrade EOOD 100.0
Samsung Corp. Manageprojekt EOOD 100.0
Samsung Corp. Solar Park EOOD 100.0
Samsung Corp. Veselinovo Energy OOD 100.0
Samsung Corp. Samsung C&T Construction Hunga 100.0
Samsung Corp. Samsung Engineering & Construction (M)
SDN.BHD. 100.0
Samsung Corp. Samsung C&T Malaysia SDN. BHD 100.0
Samsung Corp. Erdsam Co., Ltd. 100.0
Samsung Corp. Samsung Chemtech 51.7
Samsung Corp. S-print Inc 40.0
Samsung Corp. Cassava Investment Korea Pte. Ltd. 29.7
Samsung Corp. P.T. Samsung Development 100.0
Samsung Corp. Samsung Development (Thailand) Co., Ltd. 33.0
Samsung Corp. Samsung C&T Thailand Co., Ltd 44.0
Samsung Corp. Cheil Holding Inc. 40.0
Samsung Corp. Samsung Const. Co. Phils.,Inc. 25.0
B-23
Samsung Corp. Samsung Design Philippines Inc 100.0
Samsung Corp. Samsung Oil & Gas(Timor Sea 06-102) Ltd. 100.0
Samsung Corp. Samsugn Oil & Gas Australia PTY. LTD 100.0
Samsung Corp. Samsung C&T India Pte., Ltd. 100.0
Samsung Corp. Samsung C&T Corporation India 100.0
Samsung Corp. Malaysia Samsung Steel Center Sdn.Bhd 70.0
Samsung Corp. Samsung C&T Singapore Pte., Ltd. 100.0
Samsung Corp. S&G Biofuel PTE.LTD 50.5
Samsung Corp. SAMSUNG C&T Mongolia LLC. 70.0
Samsung Corp. Samsung C&T Eng.&Const. Mogolia 100.0
Samsung Corp. SAMSUNG C&T HONGKONG Ltd. 100.0
Samsung Corp. Shunde Shengpu Processing Center Co. Ltd 51.6
Samsung Corp. Samsung C&T Taiwan Co., Ltd. 100.0
Samsung Corp. Samsung Precision Stainless Steel(pinghu) Co.,Ltd. 55.0
Samsung Corp. Samsung E&C (Shanghai) Co.,Ltd. 100.0
Samsung Corp. Posco-Samsung Suzhou Processing Center Co. Ltd 50.0
Samsung Corp. Samsung Nigeria Co., Ltd. 99.9
Samsung Corp. LOBINAVE - Estaleiro Naval do Lobito, Limitada 40.0
Samsung Corp. SAMSUNG C&T CORPORATION SAUDI
ARABIA 100.0
Samsung Corp. Samsung C&T Chile Copper SpA 100.0
Samsung Corp. Samsung C&T DO Brasil Participacoes LTDA 100.0
Samsung Corp. Samsung Corporation Rus LLC 100.0
Samsung Corp. KSI LLP 25.0
Samsung Corp. JSC BALKHASH THERMAL POWER PLA 75.0
Samsung Corp. Samsung SDI America, Inc. 8.3
Samsung Corp. Samsung SDI (Malaysia) SDN. BHD. 6.4
Samsung Corp. Samsung SDI (Hong Kong) Ltd. 2.4
Samsung Corp. Samsung SDI Brasil Ltda. 0.0
Samsung Corp. Beijing Samsung Real Estate Co., Ltd 10.0
Samsung C&T America Inc. Meadowland Distribution 100.0
Samsung C&T America Inc. SAMSUNG OIL & GAS USA CORP 10.0
Samsung C&T America Inc. Samsung Green repower, LLC 100.0
Samsung C&T America Inc. Samsung Solar Construction Inc. 100.0
Samsung C&T America Inc. QSSC, S.A. de C.V. 20.0
Samsung C&T America Inc. Samsung C&T Automation Inc. 30.0
Samsung C&T America Inc. S-print Inc 24.0
Samsung E&C America, INC Samsung E&C RADIUS, INC. 100.0
Samsung Renewable Energy Inc. Kingston Solar GP Inc. 100.0
Samsung Renewable Energy Inc. Kingston Solar LP Inc. 100.0
Samsung Renewable Energy Inc. K2 Wind Ontario LP Inc 33.3
Samsung Renewable Energy Inc. SP Armow Wind Ontario LP Inc 50.0
Samsung Renewable Energy Inc. SP Beaverdale Wind LP 50.0
Samsung Renewable Energy Inc. SRE GRW EPC GP Inc. 100.0
Samsung Renewable Energy Inc. SRE GRW EPC LP 100.0
Samsung Renewable Energy Inc. SRE SKW EPC GP Inc. 100.0
Samsung Renewable Energy Inc. SRE SKW EPC LP 100.0
Samsung Renewable Energy Inc. SRE GRW LP Holdings LP 100.0
B-24
Samsung Renewable Energy Inc. SRE SKW LP Holdings LP 100.0
Samsung Renewable Energy Inc. SRE WIND PA GP INC. 100.0
Samsung Renewable Energy Inc. SRE WIND PA LP 100.0
Samsung Renewable Energy Inc. SRE GRS Holdings GP Inc. 100.0
Samsung Renewable Energy Inc. SRE GRS Holdings LP 100.0
Samsung Renewable Energy Inc. SRE Wind GP Holding Inc. 100.0
Samsung Renewable Energy Inc. SP Ontario Wind Development LP 50.0
Samsung Renewable Energy Inc. SP Southgate Wind LP 50.0
Samsung Green repower, LLC SOLAR PROJECTS SOLUTIONS,LLC 66.0
Samsung Green repower, LLC SPS Atwell Island, LLC 100.0
Kingston Solar GP Inc. Kingston Solar LP Inc. 0.0
K2 Wind Ontario Inc. K2 Wind Ontario LP Inc 0.0
SP Armow Wind Ontario GP Inc SP Armow Wind Ontario LP Inc 0.0
Samsung C&T Oil & Gas Parallel PLL Holdings LLC 83.6
Samsung C&T Oil & Gas Parallel PLL E&P LLC 90.0
SRE GRW EPC GP Inc. SRE GRW EPC LP 0.0
SRE SKW EPC GP Inc. SRE SKW EPC LP 0.0
PLL Holdings LLC Parallel Petroleum LLC 61.0
SRE GRW LP Holdings LP Grand Renewable Wind LP Inc. 44.5
SRE SKW LP Holdings LP South Kent Wind LP Inc. 50.0
SRE WIND PA GP INC. SRE WIND PA LP 0.0
SRE GRS Holdings GP Inc. Grand Renewable Solar GP Inc. 50.0
SRE GRS Holdings GP Inc. SRE GRS Holdings LP 0.0
SRE Wind GP Holding Inc. K2 Wind Ontario Inc. 50.0
SRE Wind GP Holding Inc. SP Armow Wind Ontario GP Inc 50.0
SRE Wind GP Holding Inc. SP Southgate Wind GP 50.0
SRE Wind GP Holding Inc. SRE GRW LP Holdings LP 0.0
SRE Wind GP Holding Inc. SRE SKW LP Holdings LP 0.0
SRE Wind GP Holding Inc. SP Ontario Wind Development GP 50.0
SRE Wind GP Holding Inc. South Kent Wind GP Inc. 50.0
SRE Wind GP Holding Inc. Grand Renewable Wind GP Inc. 50.0
SRE Wind GP Holding Inc. SP Beaverdale Wind GP Inc. 50.0
SP Ontario Wind Development GP SP Ontario Wind Development LP 0.0
South Kent Wind GP Inc. South Kent Wind LP Inc. 0.0
Grand Renewable Wind GP Inc. Grand Renewable Wind LP Inc. 0.0
SP Beaverdale Wind GP Inc. SP Beaverdale Wind LP 0.0
Samsung C&T Deutchland GmbH Samsung C&T Italia S.A.R.L 100.0
Samsung C&T Deutchland GmbH POSS-SLPC, s.r.o 20.0
Samsung C&T Deutchland GmbH Solluce Romania 1 B.V. 20.0
Samsung C&T Deutchland GmbH Solluce Slovenia 1 B.V. 20.0
Samsung C&T Deutchland GmbH S.C. Otelinox S.A 94.3
Samsung C&T Deutchland GmbH KSI LLP 25.0
Samsung C&T U.K. Ltd. Xiod Distribution 75.0
Samsung C&T U.K. Ltd. Samsung Nigeria Co., Ltd. 0.1
Samsung C&T France S.A.S Comptoir Des Produits Inoxydables S.A.S. 12.5
Solluce Romania 1 B.V. LJG GREEN SOURCE ENERGY ALPHA 78.0
SAM investment Manzanilo.B.V Terminal KMS de GNL S. de R.L de C.V 37.5
B-25
Solluce Slovenia 1 B.V. ZE Solar 1 D.O.O. 70.0
Samsung Engineering & Construction (M)
SDN.BHD. SS KUKDONG JASATERA J/V 70.0
Cassava Investment Korea Pte. PT. Cahaya Borneo Sukses Agros 49.0
Cassava Investment Korea Pte. PT. Cassava Borneo Sukses Plan 49.0
Samsung C&T Thailand Co., Ltd Samsung Development (Thailand) Co., Ltd. 67.0
Cheil Holding Inc. Samsung Const. Co. Phils.,Inc. 75.0
Samsung C&T Singapore Pte., Ltd. Samsung Chemtech 48.3
Samsung C&T Singapore Pte., Ltd. S-print Inc 16.0
Samsung C&T Singapore Pte., Ltd. Cassava Investment Korea Pte. Ltd. 12.7
Samsung C&T Singapore Pte., Ltd. Malaysia Samsung Steel Center Sdn.Bhd 30.0
Samsung C&T Singapore Pte., Ltd. Samsung C&T Corporation Hanoi Logistics 40.0
Samsung C&T Singapore Pte., Ltd. S&G Biofuel PTE.LTD 12.6
S&G Biofuel PTE.LTD PT. Gandaerah Hendana 95.0
S&G Biofuel PTE.LTD PT. Inecda 95.0
SAMSUNG C&T HONGKONG Ltd. Samsung C&T Thailand Co., Ltd 13.2
SAMSUNG C&T HONGKONG Ltd. Tianjin International Trade Co. Ltd 100.0
SAMSUNG C&T HONGKONG Ltd. Samsung Trading (Shanghai Pu Dong New Area)
Co., Ltd. 100.0
SAMSUNG C&T HONGKONG Ltd. Karson Industrial Co., Ltd. 100.0
SAMSUNG C&T HONGKONG Ltd. Samsung Trading (Shenzhen) Co., Ltd. 100.0
SAMSUNG C&T HONGKONG Ltd. Samsung Precision Stainless Steel(pinghu) Co.,Ltd. 45.0
SAMSUNG C&T HONGKONG Ltd. Samsung (China) Logistics Ltd. 100.0
SAMSUNG C&T HONGKONG Ltd. Samsung Corporation (Gaungzhou) Limited. 100.0
SAMSUNG C&T HONGKONG Ltd. Posco-Samsung Suzhou Processing Center Co. Ltd 20.0
Samsung (China) Logistics Ltd. Samsung C&T Corporation Hanoi Logistics 11.0
Samsung (China) Logistics Ltd. Samsung Logistics (Tianjin) Ltd 100.0
Samsung (China) Logistics Ltd. Shenzhen Samsung Shipping Container Line Co.,
Ltd. 100.0
Samsung C&T Chile Copper SpA Pampa Camarones S.A. 46.5
S.C. Otelinox S.A Comptoir Des Produits Inoxydables S.A.S. 87.5
Samsung Electronics Samsung Japan Corporation 100.0
Samsung Electronics Samsung R&D Institute Japan Co. Ltd 100.0
Samsung Electronics Samsung Electronics America Inc. 100.0
Samsung Electronics Samsung Electronics Canada Inc. 100.0
Samsung Electronics Samsung Electronics Mexico S.A. De C.V. 63.6
Samsung Electronics Nvelo.Inc 100.0
Samsung Electronics Samsung Electronics (UK) Ltd. 100.0
Samsung Electronics Samsung Electronics(London) Ltd. 100.0
Samsung Electronics Samsung Electronics Holding GmbH 100.0
Samsung Electronics Samsung Electronics Iberia, S.A. 100.0
Samsung Electronics Samsung Electronics France S.A.S 100.0
Samsung Electronics Samsung Electronics Hungarian RT. 100.0
Samsung Electronics Samsung Electronics Italia S.P.A. 100.0
Samsung Electronics Samsung Electronics Europe Logistics B.V. 100.0
Samsung Electronics Samsung Electronics Benelux B.V. 100.0
Samsung Electronics Samsung Electronics Overseas B.V. 100.0
B-26
Samsung Electronics Samsung Electronics Polska, SP.Zo.o 100.0
Samsung Electronics Samsung Electronics Portuguesa S.A. 100.0
Samsung Electronics Samsung Electronics Nordic Aktiebolag 100.0
Samsung Electronics Samsung Electronics Austria GmbH 100.0
Samsung Electronics Samsung Electronics Slovakia s.r.o 55.7
Samsung Electronics Samsung Electronics Europe Holding Cooperatief
U.A. 100.0
Samsung Electronics Samsung Electronics Display (M) Sdn Bhd 75.0
Samsung Electronics Samsung Electronics (M) Sdn. Bhd. 100.0
Samsung Electronics Samsung Vina Electronics Co., Ltd. 100.0
Samsung Electronics Samsung Asia Private Ltd. 100.0
Samsung Electronics Samsung India Electronics Private Ltd. 100.0
Samsung Electronics Samsung R&D Institute India-Bangalore Private
Limited 100.0
Samsung Electronics Samsung Electronics Australia Pty. Ltd. 100.0
Samsung Electronics PT Samsung Electronics Indonesia 100.0
Samsung Electronics Thai Samsung Electronics Co., Ltd. 91.8
Samsung Electronics Samsung Malaysia Electronics (SME) Sdn. Bhd. 100.0
Samsung Electronics Samsung Electronics Hong Kong Co., Ltd. 100.0
Samsung Electronics Suzhou Samsung Electronics Co., Ltd. 69.1
Samsung Electronics Samsung (CHINA) Investment Co.,Ltd. 100.0
Samsung Electronics Samsung Electronics Suzhou Semiconductor Co.,
Ltd. 100.0
Samsung Electronics Samsung Electronics (Shandong) Digital Printing
Co., Ltd. 87.1
Samsung Electronics Samsung Electronics Huizhou Co., Ltd. 89.6
Samsung Electronics Tianjin Samsung Electronics Co., Ltd. 48.2
Samsung Electronics Samsung Electronics Taiwan Co., Ltd. 100.0
Samsung Electronics Tianjin Samsung Telecom Technology Co., Ltd. 90.0
Samsung Electronics Shanghai Samsung Semiconductor Co., Ltd. 100.0
Samsung Electronics Samsung Electronics Suzhou Computer Co., Ltd. 73.7
Samsung Electronics Shenzhen Samsung Electronics Telecommunication
Co., Ltd. 95.0
Samsung Electronics Samsung Electronics Shanghai Telecommunication
Co., Ltd. 100.0
Samsung Electronics Samsung Semiconductor (China) R&D Co., Ltd. 100.0
Samsung Electronics Samsung (China) Semiconductor Co., Ltd. 100.0
Samsung Electronics Samsung Electronics Hainan Fiberoptics Co., Ltd 100.0
Samsung Electronics Samsung Gulf Electronics Co., Ltd. 100.0
Samsung Electronics Samsung Electronics Egypt S.A.E 0.1
Samsung Electronics Samsung Electronics South Africa(Pty) Ltd. 100.0
Samsung Electronics Samsung Electronics Latinoamerica (Zona Libre) 100.0
Samsung Electronics Samsung Electronica da Amazonia Ltda. 87.0
Samsung Electronics Samsung Electronics Argentina S.A. 98.0
Samsung Electronics Samsung Electronics Chile Limitada 4.1
Samsung Electronics Samsung Electronics Rus Company LLC 100.0
Samsung Electronics Samsung Electronics Rus Kaluga LLC 100.0
Samsung Electronics Samsung Russia Service Centre LLC 100.0
Samsung Electronics Samsung SDI Brasil Ltda. 0.1
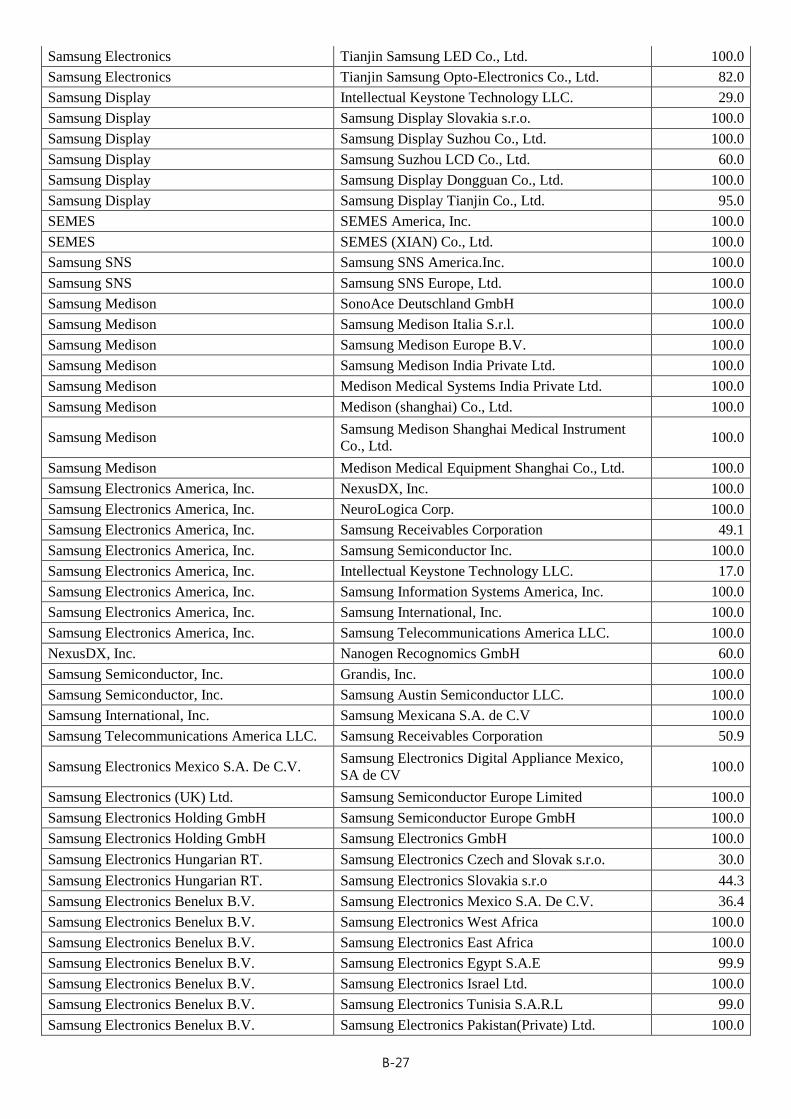
B-27
Samsung Electronics Tianjin Samsung LED Co., Ltd. 100.0
Samsung Electronics Tianjin Samsung Opto-Electronics Co., Ltd. 82.0
Samsung Display Intellectual Keystone Technology LLC. 29.0
Samsung Display Samsung Display Slovakia s.r.o. 100.0
Samsung Display Samsung Display Suzhou Co., Ltd. 100.0
Samsung Display Samsung Suzhou LCD Co., Ltd. 60.0
Samsung Display Samsung Display Dongguan Co., Ltd. 100.0
Samsung Display Samsung Display Tianjin Co., Ltd. 95.0
SEMES SEMES America, Inc. 100.0
SEMES SEMES (XIAN) Co., Ltd. 100.0
Samsung SNS Samsung SNS America.Inc. 100.0
Samsung SNS Samsung SNS Europe, Ltd. 100.0
Samsung Medison SonoAce Deutschland GmbH 100.0
Samsung Medison Samsung Medison Italia S.r.l. 100.0
Samsung Medison Samsung Medison Europe B.V. 100.0
Samsung Medison Samsung Medison India Private Ltd. 100.0
Samsung Medison Medison Medical Systems India Private Ltd. 100.0
Samsung Medison Medison (shanghai) Co., Ltd. 100.0
Samsung Medison Samsung Medison Shanghai Medical Instrument
Co., Ltd. 100.0
Samsung Medison Medison Medical Equipment Shanghai Co., Ltd. 100.0
Samsung Electronics America, Inc. NexusDX, Inc. 100.0
Samsung Electronics America, Inc. NeuroLogica Corp. 100.0
Samsung Electronics America, Inc. Samsung Receivables Corporation 49.1
Samsung Electronics America, Inc. Samsung Semiconductor Inc. 100.0
Samsung Electronics America, Inc. Intellectual Keystone Technology LLC. 17.0
Samsung Electronics America, Inc. Samsung Information Systems America, Inc. 100.0
Samsung Electronics America, Inc. Samsung International, Inc. 100.0
Samsung Electronics America, Inc. Samsung Telecommunications America LLC. 100.0
NexusDX, Inc. Nanogen Recognomics GmbH 60.0
Samsung Semiconductor, Inc. Grandis, Inc. 100.0
Samsung Semiconductor, Inc. Samsung Austin Semiconductor LLC. 100.0
Samsung International, Inc. Samsung Mexicana S.A. de C.V 100.0
Samsung Telecommunications America LLC. Samsung Receivables Corporation 50.9
Samsung Electronics Mexico S.A. De C.V. Samsung Electronics Digital Appliance Mexico,
SA de CV 100.0
Samsung Electronics (UK) Ltd. Samsung Semiconductor Europe Limited 100.0
Samsung Electronics Holding GmbH Samsung Semiconductor Europe GmbH 100.0
Samsung Electronics Holding GmbH Samsung Electronics GmbH 100.0
Samsung Electronics Hungarian RT. Samsung Electronics Czech and Slovak s.r.o. 30.0
Samsung Electronics Hungarian RT. Samsung Electronics Slovakia s.r.o 44.3
Samsung Electronics Benelux B.V. Samsung Electronics Mexico S.A. De C.V. 36.4
Samsung Electronics Benelux B.V. Samsung Electronics West Africa 100.0
Samsung Electronics Benelux B.V. Samsung Electronics East Africa 100.0
Samsung Electronics Benelux B.V. Samsung Electronics Egypt S.A.E 99.9
Samsung Electronics Benelux B.V. Samsung Electronics Israel Ltd. 100.0
Samsung Electronics Benelux B.V. Samsung Electronics Tunisia S.A.R.L 99.0
Samsung Electronics Benelux B.V. Samsung Electronics Pakistan(Private) Ltd. 100.0
B-28
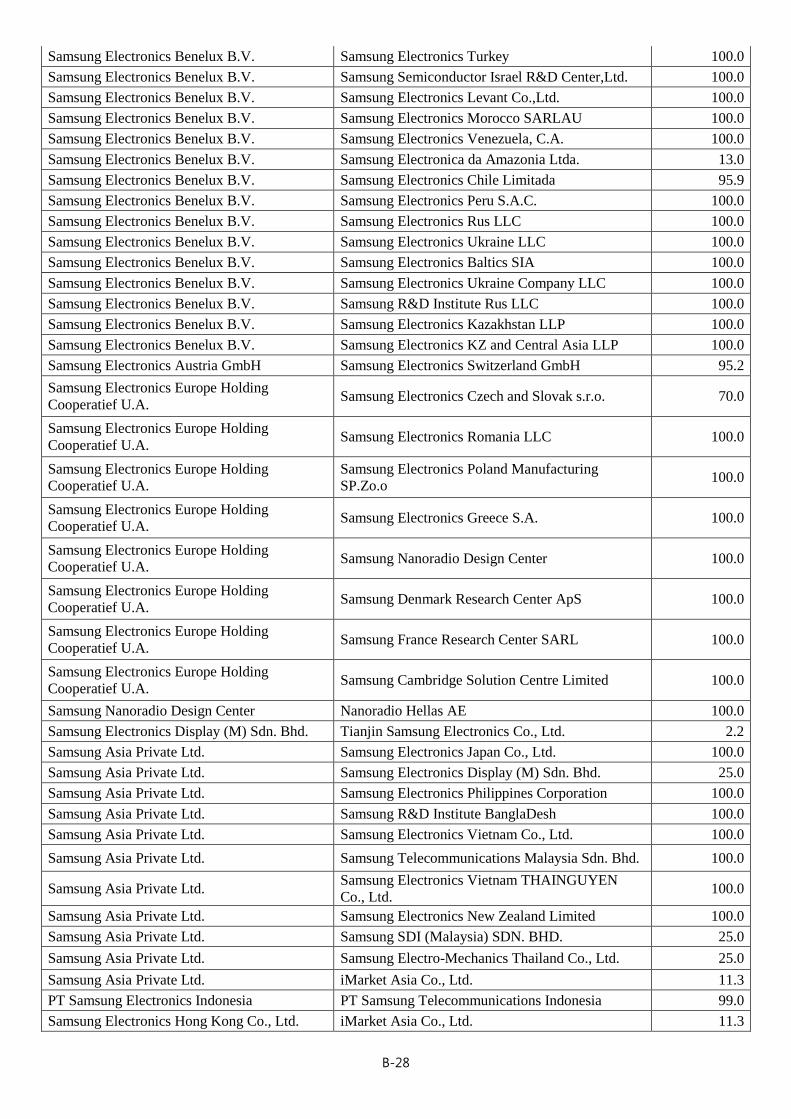
Samsung Electronics Benelux B.V. Samsung Electronics Turkey 100.0
Samsung Electronics Benelux B.V. Samsung Semiconductor Israel R&D Center,Ltd. 100.0
Samsung Electronics Benelux B.V. Samsung Electronics Levant Co.,Ltd. 100.0
Samsung Electronics Benelux B.V. Samsung Electronics Morocco SARLAU 100.0
Samsung Electronics Benelux B.V. Samsung Electronics Venezuela, C.A. 100.0
Samsung Electronics Benelux B.V. Samsung Electronica da Amazonia Ltda. 13.0
Samsung Electronics Benelux B.V. Samsung Electronics Chile Limitada 95.9
Samsung Electronics Benelux B.V. Samsung Electronics Peru S.A.C. 100.0
Samsung Electronics Benelux B.V. Samsung Electronics Rus LLC 100.0
Samsung Electronics Benelux B.V. Samsung Electronics Ukraine LLC 100.0
Samsung Electronics Benelux B.V. Samsung Electronics Baltics SIA 100.0
Samsung Electronics Benelux B.V. Samsung Electronics Ukraine Company LLC 100.0
Samsung Electronics Benelux B.V. Samsung R&D Institute Rus LLC 100.0
Samsung Electronics Benelux B.V. Samsung Electronics Kazakhstan LLP 100.0
Samsung Electronics Benelux B.V. Samsung Electronics KZ and Central Asia LLP 100.0
Samsung Electronics Austria GmbH Samsung Electronics Switzerland GmbH 95.2
Samsung Electronics Europe Holding
Cooperatief U.A. Samsung Electronics Czech and Slovak s.r.o. 70.0
Samsung Electronics Europe Holding
Cooperatief U.A. Samsung Electronics Romania LLC 100.0
Samsung Electronics Europe Holding
Cooperatief U.A.
Samsung Electronics Poland Manufacturing
SP.Zo.o 100.0
Samsung Electronics Europe Holding
Cooperatief U.A. Samsung Electronics Greece S.A. 100.0
Samsung Electronics Europe Holding
Cooperatief U.A. Samsung Nanoradio Design Center 100.0
Samsung Electronics Europe Holding
Cooperatief U.A. Samsung Denmark Research Center ApS 100.0
Samsung Electronics Europe Holding
Cooperatief U.A. Samsung France Research Center SARL 100.0
Samsung Electronics Europe Holding
Cooperatief U.A. Samsung Cambridge Solution Centre Limited 100.0
Samsung Nanoradio Design Center Nanoradio Hellas AE 100.0
Samsung Electronics Display (M) Sdn. Bhd. Tianjin Samsung Electronics Co., Ltd. 2.2
Samsung Asia Private Ltd. Samsung Electronics Japan Co., Ltd. 100.0
Samsung Asia Private Ltd. Samsung Electronics Display (M) Sdn. Bhd. 25.0
Samsung Asia Private Ltd. Samsung Electronics Philippines Corporation 100.0
Samsung Asia Private Ltd. Samsung R&D Institute BanglaDesh 100.0
Samsung Asia Private Ltd. Samsung Electronics Vietnam Co., Ltd. 100.0
Samsung Asia Private Ltd. Samsung Telecommunications Malaysia Sdn. Bhd. 100.0
Samsung Asia Private Ltd. Samsung Electronics Vietnam THAINGUYEN
Co., Ltd. 100.0
Samsung Asia Private Ltd. Samsung Electronics New Zealand Limited 100.0
Samsung Asia Private Ltd. Samsung SDI (Malaysia) SDN. BHD. 25.0
Samsung Asia Private Ltd. Samsung Electro-Mechanics Thailand Co., Ltd. 25.0
Samsung Asia Private Ltd. iMarket Asia Co., Ltd. 11.3
PT Samsung Electronics Indonesia PT Samsung Telecommunications Indonesia 99.0
Samsung Electronics Hong Kong Co., Ltd. iMarket Asia Co., Ltd. 11.3
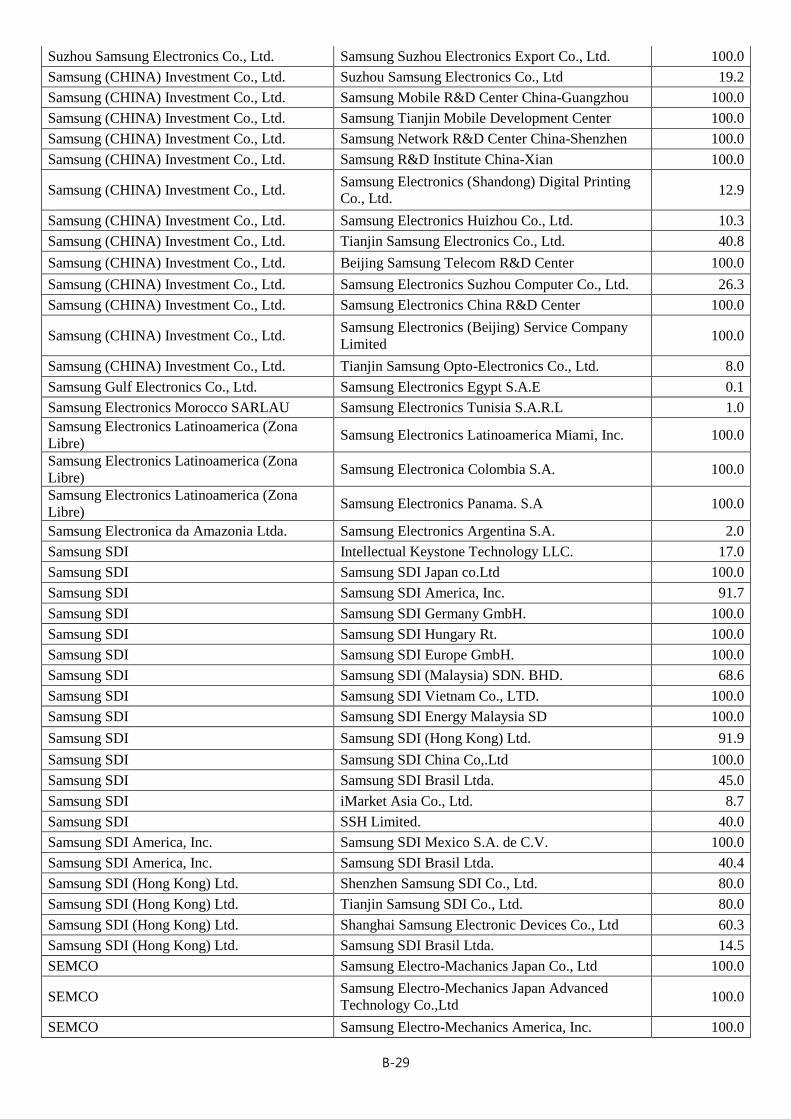
B-29
Suzhou Samsung Electronics Co., Ltd. Samsung Suzhou Electronics Export Co., Ltd. 100.0
Samsung (CHINA) Investment Co., Ltd. Suzhou Samsung Electronics Co., Ltd 19.2
Samsung (CHINA) Investment Co., Ltd. Samsung Mobile R&D Center China-Guangzhou 100.0
Samsung (CHINA) Investment Co., Ltd. Samsung Tianjin Mobile Development Center 100.0
Samsung (CHINA) Investment Co., Ltd. Samsung Network R&D Center China-Shenzhen 100.0
Samsung (CHINA) Investment Co., Ltd. Samsung R&D Institute China-Xian 100.0
Samsung (CHINA) Investment Co., Ltd. Samsung Electronics (Shandong) Digital Printing
Co., Ltd. 12.9
Samsung (CHINA) Investment Co., Ltd. Samsung Electronics Huizhou Co., Ltd. 10.3
Samsung (CHINA) Investment Co., Ltd. Tianjin Samsung Electronics Co., Ltd. 40.8
Samsung (CHINA) Investment Co., Ltd. Beijing Samsung Telecom R&D Center 100.0
Samsung (CHINA) Investment Co., Ltd. Samsung Electronics Suzhou Computer Co., Ltd. 26.3
Samsung (CHINA) Investment Co., Ltd. Samsung Electronics China R&D Center 100.0
Samsung (CHINA) Investment Co., Ltd. Samsung Electronics (Beijing) Service Company
Limited 100.0
Samsung (CHINA) Investment Co., Ltd. Tianjin Samsung Opto-Electronics Co., Ltd. 8.0
Samsung Gulf Electronics Co., Ltd. Samsung Electronics Egypt S.A.E 0.1
Samsung Electronics Morocco SARLAU Samsung Electronics Tunisia S.A.R.L 1.0
Samsung Electronics Latinoamerica (Zona
Libre) Samsung Electronics Latinoamerica Miami, Inc. 100.0
Samsung Electronics Latinoamerica (Zona
Libre) Samsung Electronica Colombia S.A. 100.0
Samsung Electronics Latinoamerica (Zona
Libre) Samsung Electronics Panama. S.A 100.0
Samsung Electronica da Amazonia Ltda. Samsung Electronics Argentina S.A. 2.0
Samsung SDI Intellectual Keystone Technology LLC. 17.0
Samsung SDI Samsung SDI Japan co.Ltd 100.0
Samsung SDI Samsung SDI America, Inc. 91.7
Samsung SDI Samsung SDI Germany GmbH. 100.0
Samsung SDI Samsung SDI Hungary Rt. 100.0
Samsung SDI Samsung SDI Europe GmbH. 100.0
Samsung SDI Samsung SDI (Malaysia) SDN. BHD. 68.6
Samsung SDI Samsung SDI Vietnam Co., LTD. 100.0
Samsung SDI Samsung SDI Energy Malaysia SD 100.0
Samsung SDI Samsung SDI (Hong Kong) Ltd. 91.9
Samsung SDI Samsung SDI China Co,.Ltd 100.0
Samsung SDI Samsung SDI Brasil Ltda. 45.0
Samsung SDI iMarket Asia Co., Ltd. 8.7
Samsung SDI SSH Limited. 40.0
Samsung SDI America, Inc. Samsung SDI Mexico S.A. de C.V. 100.0
Samsung SDI America, Inc. Samsung SDI Brasil Ltda. 40.4
Samsung SDI (Hong Kong) Ltd. Shenzhen Samsung SDI Co., Ltd. 80.0
Samsung SDI (Hong Kong) Ltd. Tianjin Samsung SDI Co., Ltd. 80.0
Samsung SDI (Hong Kong) Ltd. Shanghai Samsung Electronic Devices Co., Ltd 60.3
Samsung SDI (Hong Kong) Ltd. Samsung SDI Brasil Ltda. 14.5
SEMCO Samsung Electro-Machanics Japan Co., Ltd 100.0
SEMCO Samsung Electro-Mechanics Japan Advanced
Technology Co.,Ltd 100.0
SEMCO Samsung Electro-Mechanics America, Inc. 100.0
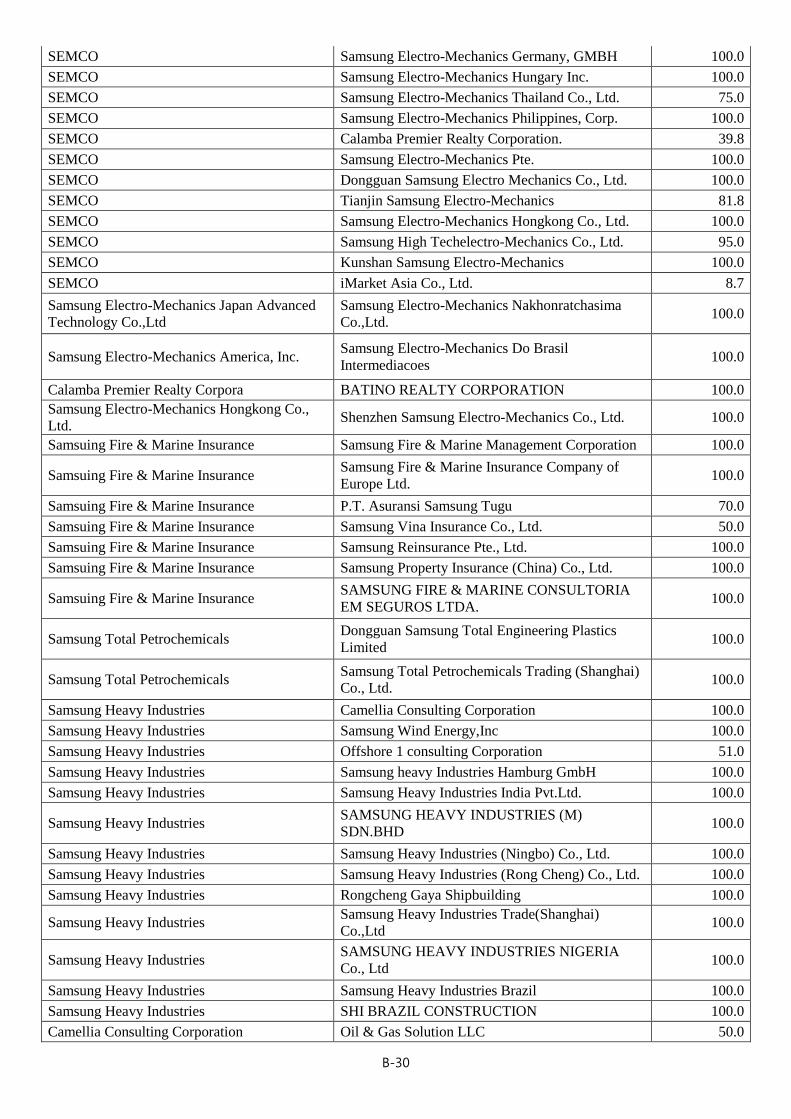
B-30
SEMCO Samsung Electro-Mechanics Germany, GMBH 100.0
SEMCO Samsung Electro-Mechanics Hungary Inc. 100.0
SEMCO Samsung Electro-Mechanics Thailand Co., Ltd. 75.0
SEMCO Samsung Electro-Mechanics Philippines, Corp. 100.0
SEMCO Calamba Premier Realty Corporation. 39.8
SEMCO Samsung Electro-Mechanics Pte. 100.0
SEMCO Dongguan Samsung Electro Mechanics Co., Ltd. 100.0
SEMCO Tianjin Samsung Electro-Mechanics 81.8
SEMCO Samsung Electro-Mechanics Hongkong Co., Ltd. 100.0
SEMCO Samsung High Techelectro-Mechanics Co., Ltd. 95.0
SEMCO Kunshan Samsung Electro-Mechanics 100.0
SEMCO iMarket Asia Co., Ltd. 8.7
Samsung Electro-Mechanics Japan Advanced
Technology Co.,Ltd
Samsung Electro-Mechanics Nakhonratchasima
Co.,Ltd. 100.0
Samsung Electro-Mechanics America, Inc. Samsung Electro-Mechanics Do Brasil
Intermediacoes 100.0
Calamba Premier Realty Corpora BATINO REALTY CORPORATION 100.0
Samsung Electro-Mechanics Hongkong Co.,
Ltd. Shenzhen Samsung Electro-Mechanics Co., Ltd. 100.0
Samsuing Fire & Marine Insurance Samsung Fire & Marine Management Corporation 100.0
Samsuing Fire & Marine Insurance Samsung Fire & Marine Insurance Company of
Europe Ltd. 100.0
Samsuing Fire & Marine Insurance P.T. Asuransi Samsung Tugu 70.0
Samsuing Fire & Marine Insurance Samsung Vina Insurance Co., Ltd. 50.0
Samsuing Fire & Marine Insurance Samsung Reinsurance Pte., Ltd. 100.0
Samsuing Fire & Marine Insurance Samsung Property Insurance (China) Co., Ltd. 100.0
Samsuing Fire & Marine Insurance SAMSUNG FIRE & MARINE CONSULTORIA
EM SEGUROS LTDA. 100.0
Samsung Total Petrochemicals Dongguan Samsung Total Engineering Plastics
Limited 100.0
Samsung Total Petrochemicals Samsung Total Petrochemicals Trading (Shanghai)
Co., Ltd. 100.0
Samsung Heavy Industries Camellia Consulting Corporation 100.0
Samsung Heavy Industries Samsung Wind Energy,Inc 100.0
Samsung Heavy Industries Offshore 1 consulting Corporation 51.0
Samsung Heavy Industries Samsung heavy Industries Hamburg GmbH 100.0
Samsung Heavy Industries Samsung Heavy Industries India Pvt.Ltd. 100.0
Samsung Heavy Industries SAMSUNG HEAVY INDUSTRIES (M)
SDN.BHD 100.0
Samsung Heavy Industries Samsung Heavy Industries (Ningbo) Co., Ltd. 100.0
Samsung Heavy Industries Samsung Heavy Industries (Rong Cheng) Co., Ltd. 100.0
Samsung Heavy Industries Rongcheng Gaya Shipbuilding 100.0
Samsung Heavy Industries Samsung Heavy Industries Trade(Shanghai)
Co.,Ltd 100.0
Samsung Heavy Industries SAMSUNG HEAVY INDUSTRIES NIGERIA
Co., Ltd 100.0
Samsung Heavy Industries Samsung Heavy Industries Brazil 100.0
Samsung Heavy Industries SHI BRAZIL CONSTRUCTION 100.0
Camellia Consulting Corporation Oil & Gas Solution LLC 50.0
B-31
Offshore 1 consulting Corporat AMEC Samsung Oil&Gas, LLC 51.0
Samsung Life Insurance Samsung Life Investment (Ameri 100.0
Samsung Life Insurance Samsung Life Investment (U.K.) Limited. 100.0
Samsung Life Insurance Siam Samsung Life Insurance Co 28.7
Samsung Life Insurance Samsung Air China Life 50.0
Samsung Life Insurance Beijing Samsung Real Estate Co., Ltd 90.0
Samsung Asset Management Samsung Investment Management(Singapore) 100.0
Samsung Asset Management Samsung Investment Management(Hong Kong) 100.0
Cheil Industries Intellectual Keystone Technology LLC. 24.0
Cheil Industries SAMSUNG CHEIL INDUSTRIES JAPAN 100.0
Cheil Industries Cheil America Inc. 100.0
Cheil Industries Samsung Chemical (USA), INC. 100.0
Cheil Industries Starex Compounding America Inc 100.0
Cheil Industries Samsung Fashion S.r.L 100.0
Cheil Industries Samsung Chemical Europe Gmbh 100.0
Cheil Industries Samsung Chemical Hungary Limited 100.0
Cheil Industries SAMSUNG CHEMICAL(THAILAND) CO. 59.4
Cheil Industries Samsung Fashion Trading (Shanghai) 100.0
Cheil Industries Samsung Chemical Material Trading(Shanghai)
Co., Ltd. 100.0
Cheil Industries Tianjin Samsung Engineering Plastics Co., Ltd. 100.0
Cheil Industries Dongguan Samsung Engineering Plastics Co., Ltd. 100.0
Cheil Industries Samsung Chemical Electronic Materials (SuZhou)
Co., Ltd. 100.0
Starex Compounding America Inc. STARCOM MEXICO 100.0
Samsung Fashion S.r.L COLOMBO VIA DELLA SPIGA S.R.L 100.0
SAMSUNG CHEMICAL(THAILAND) CO. Samsung Heavy Industries (Thailand) 25.5
SAMSUNG CHEMICAL(THAILAND) CO. Samsung Thai Engineering Co., 19.0
Samsung Techwin Techwin Engineering Center Co. 100.0
Samsung Techwin Samsung Opto-Electronics America 100.0
Samsung Techwin SAMSUNG TECHWIN EUROPE LIMITED 100.0
Samsung Techwin Tianjin Samsung Techwin Opto-Electronics 95.0
Samsung Techwin Shanghai Samsung Techwin 100.0
Samsung Techwin SAMSUNG TECHWIN DO BRASIL
EQUIPAMENTOS 100.0
Samsung Everland Samsung Everland Inc. Vietnam 100.0
Samsung Everland Shanghai Ever-Hongjun Business 51.0
Samsung Everland iMarket Asia Co., Ltd. 19.3
Credu Language Testing International 82.4
Opentide Greater China Co., Ltd. Opentide China Co., Ltd. 100.0
Opentide Greater China Co., Ltd. OpenTide Taiwan Co., Ltd. 100.0
Opentide Greater China Co., Ltd. OpenTide Interactive Advertising Co.,Ltd 100.0
Opentide China Co., Ltd. OpenTide e-Commerce Co., Ltd. 100.0
Opentide China Co., Ltd. OpenTide Marketing Service Co., Ltd. 100.0
iMarket Asia Co., Ltd. iMarket China Co., Ltd. 80.0
Samsung Corning Precision Materials Samsung Corning Malaysia SDN. BHD. 100.0
Samsung Corning Precision Materials SSH Limited. 60.0
Samsung Corning Malaysia SDN. Samsung Corning Precision Materials(M) sdn.bhd 100.0
B-32
Samsung Petrochemical Samsung Petrochemical (Shanghai) Co., Ltd. 100.0
Samsung Fine Chemicals Samsung Fine Chemicals Trading (Shanghai) Co.,
Ltd 100.0
Samsung Securities Samsung Securities (America), Inc. 100.0
Samsung Securities Samsung Securities (Europe) Limited. 100.0
Samsung Securities Samsung Securities (Asia) Limited. 100.0
Samsung SDS Samsung SDS Infotech Pvt Ltd. 81.5
Samsung SDS iMarket Asia Co., Ltd. 40.6
Samsung SDS Samsung SDS America, Inc. 100.0
Samsung SDS Samsung SDS Europe Ltd. 100.0
Samsung SDS Samsung SDS Global SCL Netherland Cooperatief
U.A 100.0
Samsung SDS Samsung SDS Asia Pacific Pte. Ltd. 100.0
Samsung SDS Samsung SDS India PVt. Ltd. 100.0
Samsung SDS Samsung SDS China, Ltd. 100.0
Samsung SDS Samsung SDS Latin America, Ltd. 99.6
MIRACOM INC MIRACOM ASIA PACIFIC 100.0
Samsung SDS America,Inc. Samsung SDS Latin America, Ltd 0.4
Samsung SDS America,Inc. Samsung SDS Mexico, S.A. DE C. 99.0
Samsung SDS Europe Ltd. Samsung SDS Global SCL Hungary 100.0
Samsung SDS Europe Ltd. Samsung SDS Global SCL Slovaki 100.0
Samsung SDS Europe Ltd. Samsung SDS Global SCL Netherland Cooperatief
U.A 0.0
Samsung SDS Europe Ltd. SAMSUNG SDS Global SCL Egypt C 100.0
Samsung SDS Europe Ltd. Samsung SDS Global SCL Rus Lim 100.0
Samsung SDS Global SCL Netherl Samsung SDS Global SCL Rus Lim 0.0
Samsung SDS Asia Pacific Pte. Samsung SDS GSCL Vietnam Co Ltd 51.0
Samsung SDS Asia Pacific Pte. PT. Samsung SDS Global SCL Indonesia 100.0
Samsung SDS Asia Pacific Pte. Samsung SDS Global SCL Philippines Co., Ltd. 100.0
Samsung SDS Asia Pacific Pte. Samsung SDS Global SCL Thailand Co.,Ltd 100.0
Samsung SDS Asia Pacific Pte. Samsung SDS Global SCL Malaysia SDN.BHD. 100.0
Samsung SDS Asia Pacific Pte. Samsung SDS Global SCL Hong Kong Ltd 100.0
Samsung Data Systems India Pvt Samsung SDS Infotech Pvt Ltd. 18.5
Samsung SDS China, Ltd. Samsung SDS Global Development 100.0
Samsung SDS China, Ltd. Samsung SDS Global SCL Beijing Co., Ltd 100.0
MIRACOM ASIA PACIFIC MIRACOM CHINA 100.0
Samsung Engineering Offshore 1 consulting Corporation 49.0
Samsung Engineering Samsung Engineering America Inc. 100.0
Samsung Engineering Samsung Engineering Magyarorszag Kft 100.0
Samsung Engineering Samsung Engineering (Malaysia) SDN. BHD. 100.0
Samsung Engineering PT Samsung Engineering Indonesia Co., Ltd. 100.0
Samsung Engineering Samsung Thai Engineering Co., Ltd. 81.0
Samsung Engineering Samsung Engineering India Private Ltd. 100.0
Samsung Engineering Samsung Engineering Construction(Shanghai) Co.,
Ltd 100.0
Samsung Engineering Samsung Saudi Arabia Ltd. 95.0
Samsung Engineering Muharraq Wastewater Services Company W.L.L. 64.8
Samsung Engineering Muharraq STP Company B.S.C. 5.1
B-33
Samsung Engineering Muharraq Holding Company 1 Limited 45.0
Samsung Engineering Samsung INGENIERIA MEXICO S.A DE C.V. 99.7
Samsung Engineering Samsung Ingenieria Minatitlan, S.A. De C.V. 99.9
Samsung Engineering Samsung Engineering Trinidad Co., Ltd. 100.0
Samsung Engineering Samsung Ingenieria Manzanillo, S.A. De C.V. 99.9
Samsung Engineering Grupo Samsung Ingenieria Mexico, S.A. De C.V. 100.0
Samsung Engineering Samsung Ingenieria Energia S.A. De C.V. 100.0
Samsung Engineering Samsung Engineering America Do Sul Projecto E
Consultoria Ltda. 100.0
Samsung Engineering Samsung Engineering Bolivia S. 99.9
Samsung Engineering Samsung Engineering Kazakhstan LLP 100.0
Samsung Engineering America Inc SEA Construction, LLC 100.0
Samsung Engineering (Malaysia) Muharraq Wastewater Services Company W.L.L. 0.3
Samsung Thai Engineering Co., SAMSUNG CHEMICAL(THAILAND) CO. 40.6
Samsung Engineering India Private Ltd. Samsung Saudi Arabia Ltd. 5.0
Samsung Saudi Arabia Ltd. Samsung EPC Company limited 75.0
Muharraq Holding Company 1 Lim Muharraq Holding Company 2 Lim 100.0
Muharraq Holding Company 2 Lim Muharraq STP Company B.S.C. 88.7
S1 SOCM 100.0
S1 Samsung Beijing Security Systems 100.0
Cheil Worldwide Cheil USA Inc. 100.0
Cheil Worldwide Cheil Central America Inc. 100.0
Cheil Worldwide Cheil Europe Ltd. 100.0
Cheil Worldwide Cheil Germany GmbH 100.0
Cheil Worldwide Cheil France SAS 100.0
Cheil Worldwide Cheil Nordic AB 100.0
Cheil Worldwide Cheil India Pvt. Ltd. 100.0
Cheil Worldwide Cheil (Thailand) Ltd. 100.0
Cheil Worldwide Cheil Singapore Pte. Ltd. 100.0
Cheil Worldwide Cheil Vietnam Co. Ltd. 90.0
Cheil Worldwide Cheil Integrated Marketing Philippines, Inc 100.0
Cheil Worldwide Cheil China 100.0
Cheil Worldwide Cheil Hong Kong Limited 100.0
Cheil Worldwide Bravo Asia Limited 100.0
Cheil Worldwide Bravo Asia-Shanghai 100.0
Cheil Worldwide Cheil MEA FZ-LLC 100.0
Cheil Worldwide Cheil South Africa Pty., Ltd. 100.0
Cheil Worldwide Cheil Brazil Communications Ltda. 100.0
Cheil Worldwide Cheil Mexico Inc. SA de CV 98.0
Cheil Worldwide Cheil Rus LLC 100.0
Cheil Worldwide Cheil Ukraine LLC 100.0
Cheil Worldwide Cheil Kazakhstan LLC 100.0
Hotel Shilla Samsung Hospitality America 100.0
Hotel Shilla New Jersey Int'l M.C.Inc. 100.0
Hotel Shilla SAMSUNG HOSPITALITY U.K. Limited 100.0
Hotel Shilla Shilla Travel Retail Pte.Ltd 100.0
Hotel Shilla SHILLA LIMITED 100.0
Hotel Shilla Samsung Shilla Business Service Beijing Co., Ltd. 100.0
B-34
Hotel Shilla SHILLA LIMITED 100.0
Cheil USA Inc. The Barbarian Group, LLC 75.6
Cheil USA Inc. McKinney Ventures LLC 100.0
Cheil USA Inc. Cheil India Pvt. Ltd. 0.0
Cheil USA Inc. Cheil Mexico Inc. SA de CV 2.0
Samsung Hospitality America Samsung Hospitality EUROPE 100.0
Cheil Europe Ltd. Beattie McGuinness Bungay Limited 75.3
Cheil Europe Ltd. CHEIL ITALIA S.R.L. 100.0
Cheil Europe Ltd. CHEIL SPAIN S.L 100.0
Cheil Europe Ltd. CHEIL BENELUX B.V. 100.0
Cheil Germany GmbH CHEIL AUSTRIA GMBH 100.0
Cheil (Thailand) Ltd. Samsung Heavy Industries (Thailand) 25.5
Cheil Singapore Pte. Ltd. Opentide Greater China Co., Ltd. 95.0
Cheil MEA FZ-LLC One Agency FZ LLC 100.0
Cheil MEA FZ-LLC One Agency Istanbul Advertisement,
Communication & Production LLC 0.0
One Agency FZ LLC One Agency Istanbul Advertisement,
Communication & Production LLC 100.0
One Agency FZ LLC One Agency Interior Design LLC 100.0
One Agency FZ LLC One Agency Printing LLC 100.0
B-35
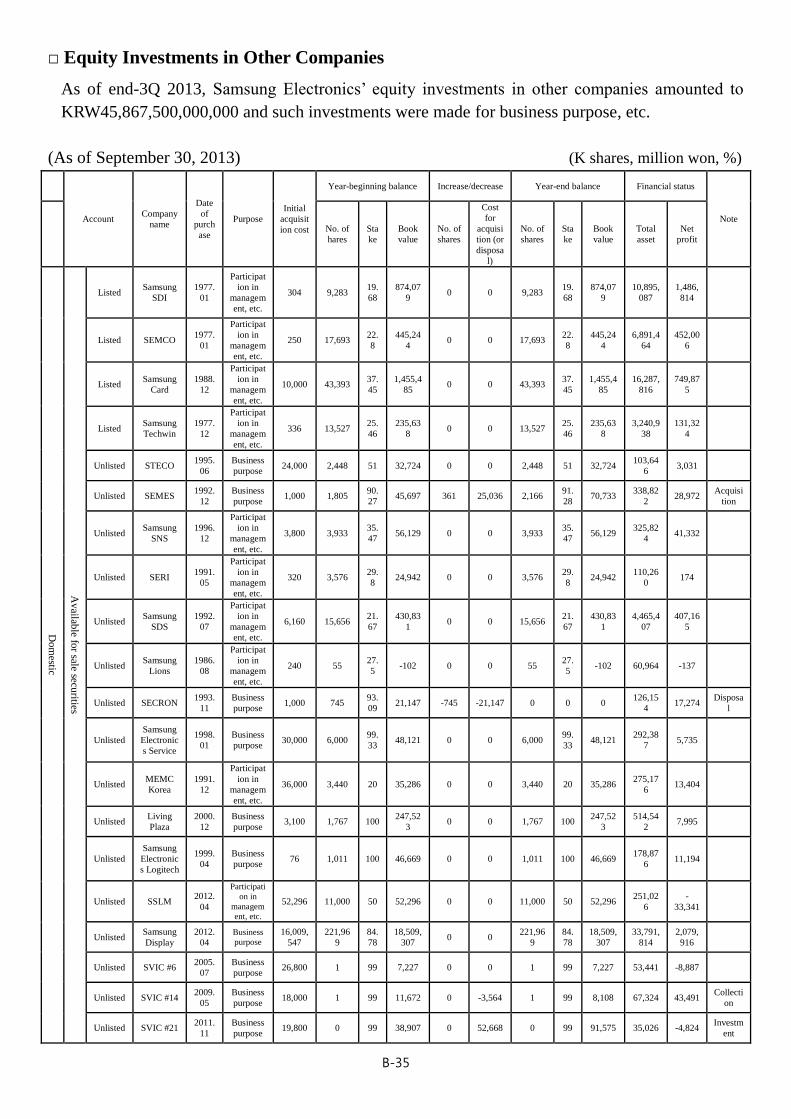
□ Equity Investments in Other Companies
As of end-3Q 2013, Samsung Electronics’ equity investments in other companies amounted to
KRW45,867,500,000,000 and such investments were made for business purpose, etc.
(As of September 30, 2013) (K shares, million won, %)
Account Company
name
Date
of
purch
ase
Purpose
Initial
acquisit
ion cost
Year-beginning balance Increase/decrease Year-end balance Financial status
Note
No. of
hares
Sta
ke
Book
value
No. of
shares
Cost
for
acquisi
tion (or
disposa
l)
No. of
shares
Sta
ke
Book
value
Total
asset
Net
profit
Do
mestic
Av
ailable fo
r sale securities
Listed Samsung
SDI
1977.
01
Participat
ion in
managem
ent, etc.
304 9,283 19.
68
874,07
9 0 0 9,283
19.
68
874,07
9
10,895,
087
1,486,
814
Listed SEMCO 1977.
01
Participat
ion in
managem
ent, etc.
250 17,693 22.
8
445,24
4 0 0 17,693
22.
8
445,24
4
6,891,4
64
452,00
6
Listed Samsung
Card
1988.
12
Participat
ion in
managem
ent, etc.
10,000 43,393 37.
45
1,455,4
85 0 0 43,393
37.
45
1,455,4
85
16,287,
816
749,87
5
Listed Samsung
Techwin
1977.
12
Participat
ion in
managem
ent, etc.
336 13,527 25.
46
235,63
8 0 0 13,527
25.
46
235,63
8
3,240,9
38
131,32
4
Unlisted STECO 1995.
06
Business
purpose 24,000 2,448 51 32,724 0 0 2,448 51 32,724
103,64
6 3,031
Unlisted SEMES 1992.
12
Business
purpose 1,000 1,805
90.
27 45,697 361 25,036 2,166
91.
28 70,733
338,82
2 28,972
Acquisi
tion
Unlisted Samsung
SNS
1996.
12
Participat
ion in
managem
ent, etc.
3,800 3,933 35.
47 56,129 0 0 3,933
35.
47 56,129
325,82
4 41,332
Unlisted SERI 1991.
05
Participat
ion in
managem
ent, etc.
320 3,576 29.
8 24,942 0 0 3,576
29.
8 24,942
110,26
0 174
Unlisted Samsung
SDS
1992.
07
Participat
ion in
managem
ent, etc.
6,160 15,656 21.
67
430,83
1 0 0 15,656
21.
67
430,83
1
4,465,4
07
407,16
5
Unlisted Samsung
Lions
1986.
08
Participat
ion in
managem
ent, etc.
240 55 27.
5 -102 0 0 55
27.
5 -102 60,964 -137
Unlisted SECRON 1993.
11
Business
purpose 1,000 745
93.
09 21,147 -745 -21,147 0 0 0
126,15
4 17,274
Disposa
l
Unlisted
Samsung
Electronic
s Service
1998.
01
Business
purpose 30,000 6,000
99.
33 48,121 0 0 6,000
99.
33 48,121
292,38
7 5,735
Unlisted MEMC
Korea
1991.
12
Participat
ion in
managem
ent, etc.
36,000 3,440 20 35,286 0 0 3,440 20 35,286 275,17
6 13,404
Unlisted Living
Plaza
2000.
12
Business
purpose 3,100 1,767 100
247,52
3 0 0 1,767 100
247,52
3
514,54
2 7,995
Unlisted
Samsung
Electronic
s Logitech
1999.
04
Business
purpose 76 1,011 100 46,669 0 0 1,011 100 46,669
178,87
6 11,194
Unlisted SSLM 2012.
04
Participati
on in
managem
ent, etc.
52,296 11,000 50 52,296 0 0 11,000 50 52,296 251,02
6
-
33,341
Unlisted Samsung
Display
2012.
04
Business
purpose
16,009,
547
221,96
9
84.
78
18,509,
307 0 0
221,96
9
84.
78
18,509,
307
33,791,
814
2,079,
916
Unlisted SVIC #6 2005.
07
Business
purpose 26,800 1 99 7,227 0 0 1 99 7,227 53,441 -8,887
Unlisted SVIC #14 2009.
05
Business
purpose 18,000 1 99 11,672 0 -3,564 1 99 8,108 67,324 43,491
Collecti
on
Unlisted SVIC #21 2011.
11
Business
purpose 19,800 0 99 38,907 0 52,668 0 99 91,575 35,026 -4,824
Investm
ent
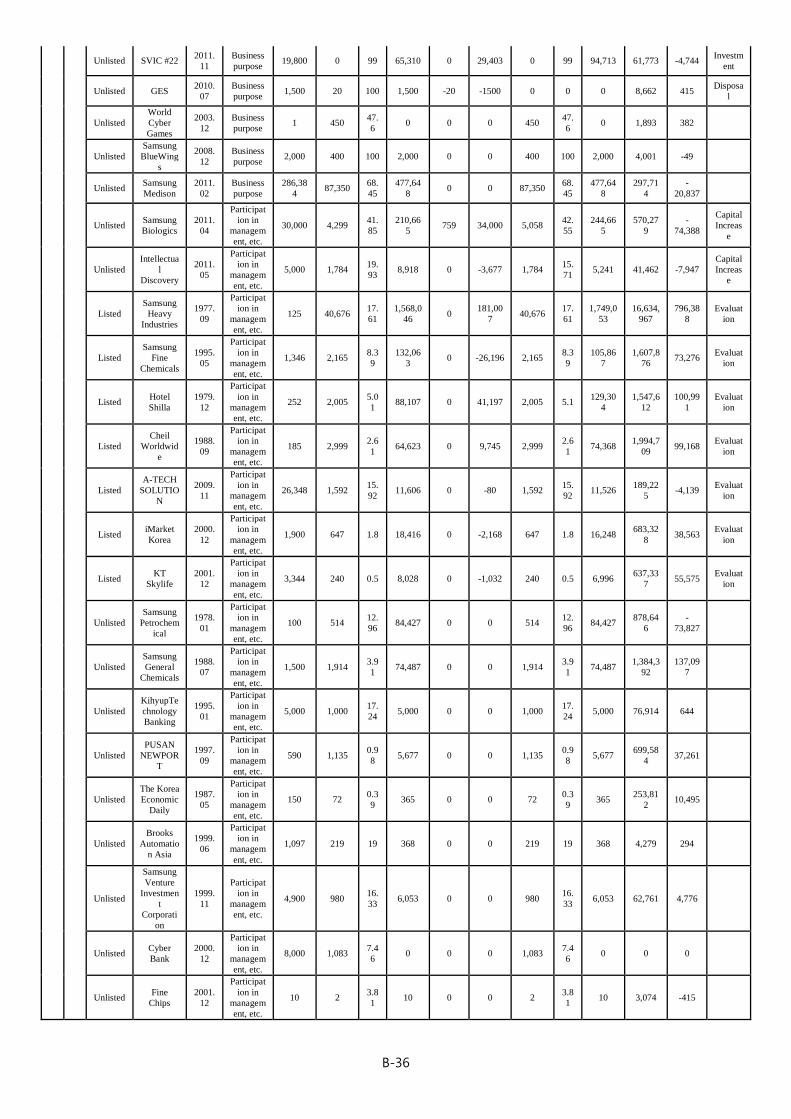
B-36
Unlisted SVIC #22 2011.
11
Business
purpose 19,800 0 99 65,310 0 29,403 0 99 94,713 61,773 -4,744
Investm
ent
Unlisted GES 2010.
07
Business
purpose 1,500 20 100 1,500 -20 -1500 0 0 0 8,662 415
Disposa
l
Unlisted
World
Cyber
Games
2003.
12
Business
purpose 1 450
47.
6 0 0 0 450
47.
6 0 1,893 382
Unlisted
Samsung
BlueWing
s
2008.
12
Business
purpose 2,000 400 100 2,000 0 0 400 100 2,000 4,001 -49
Unlisted Samsung
Medison
2011.
02
Business
purpose
286,38
4 87,350
68.
45
477,64
8 0 0 87,350
68.
45
477,64
8
297,71
4
-
20,837
Unlisted Samsung
Biologics
2011.
04
Participat
ion in
managem
ent, etc.
30,000 4,299 41.
85
210,66
5 759 34,000 5,058
42.
55
244,66
5
570,27
9
-
74,388
Capital
Increas
e
Unlisted
Intellectua
l
Discovery
2011.
05
Participat
ion in
managem
ent, etc.
5,000 1,784 19.
93 8,918 0 -3,677 1,784
15.
71 5,241 41,462 -7,947
Capital
Increas
e
Listed
Samsung
Heavy
Industries
1977.
09
Participat
ion in
managem
ent, etc.
125 40,676 17.
61
1,568,0
46 0
181,00
7 40,676
17.
61
1,749,0
53
16,634,
967
796,38
8
Evaluat
ion
Listed
Samsung
Fine
Chemicals
1995.
05
Participat
ion in
managem
ent, etc.
1,346 2,165 8.3
9
132,06
3 0 -26,196 2,165
8.3
9
105,86
7
1,607,8
76 73,276
Evaluat
ion
Listed Hotel
Shilla
1979.
12
Participat
ion in
managem
ent, etc.
252 2,005 5.0
1 88,107 0 41,197 2,005 5.1
129,30
4
1,547,6
12
100,99
1
Evaluat
ion
Listed
Cheil
Worldwid
e
1988.
09
Participat
ion in
managem
ent, etc.
185 2,999 2.6
1 64,623 0 9,745 2,999
2.6
1 74,368
1,994,7
09 99,168
Evaluat
ion
Listed
A-TECH
SOLUTIO
N
2009.
11
Participat
ion in
managem
ent, etc.
26,348 1,592 15.
92 11,606 0 -80 1,592
15.
92 11,526
189,22
5 -4,139
Evaluat
ion
Listed iMarket
Korea
2000.
12
Participat
ion in
managem
ent, etc.
1,900 647 1.8 18,416 0 -2,168 647 1.8 16,248 683,32
8 38,563
Evaluat
ion
Listed KT
Skylife
2001.
12
Participat
ion in
managem
ent, etc.
3,344 240 0.5 8,028 0 -1,032 240 0.5 6,996 637,33
7 55,575
Evaluat
ion
Unlisted
Samsung
Petrochem
ical
1978.
01
Participat
ion in
managem
ent, etc.
100 514 12.
96 84,427 0 0 514
12.
96 84,427
878,64
6
-
73,827
Unlisted
Samsung
General
Chemicals
1988.
07
Participat
ion in
managem
ent, etc.
1,500 1,914 3.9
1 74,487 0 0 1,914
3.9
1 74,487
1,384,3
92
137,09
7
Unlisted
KihyupTe
chnology
Banking
1995.
01
Participat
ion in
managem
ent, etc.
5,000 1,000 17.
24 5,000 0 0 1,000
17.
24 5,000 76,914 644
Unlisted
PUSAN
NEWPOR
T
1997.
09
Participat
ion in
managem
ent, etc.
590 1,135 0.9
8 5,677 0 0 1,135
0.9
8 5,677
699,58
4 37,261
Unlisted
The Korea
Economic
Daily
1987.
05
Participat
ion in
managem
ent, etc.
150 72 0.3
9 365 0 0 72
0.3
9 365
253,81
2 10,495
Unlisted
Brooks
Automatio
n Asia
1999.
06
Participat
ion in
managem
ent, etc.
1,097 219 19 368 0 0 219 19 368 4,279 294
Unlisted
Samsung
Venture
Investmen
t
Corporati
on
1999.
11
Participat
ion in
managem
ent, etc.
4,900 980 16.
33 6,053 0 0 980
16.
33 6,053 62,761 4,776
Unlisted Cyber
Bank
2000.
12
Participat
ion in
managem
ent, etc.
8,000 1,083 7.4
6 0 0 0 1,083
7.4
6 0 0 0
Unlisted Fine
Chips
2001.
12
Participat
ion in
managem
ent, etc.
10 2 3.8
1 10 0 0 2
3.8
1 10 3,074 -415
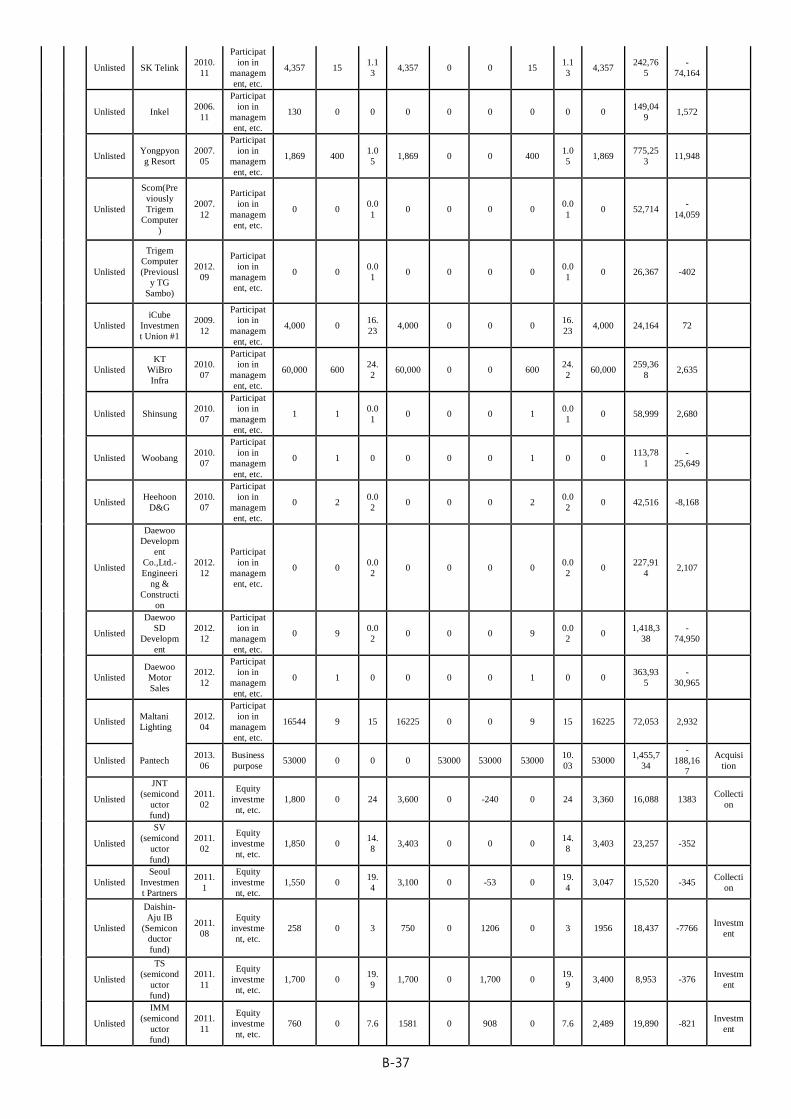
B-37
Unlisted SK Telink 2010.
11
Participat
ion in
managem
ent, etc.
4,357 15 1.1
3 4,357 0 0 15
1.1
3 4,357
242,76
5
-
74,164
Unlisted Inkel 2006.
11
Participat
ion in
managem
ent, etc.
130 0 0 0 0 0 0 0 0 149,04
9 1,572
Unlisted Yongpyon
g Resort
2007.
05
Participat
ion in
managem
ent, etc.
1,869 400 1.0
5 1,869 0 0 400
1.0
5 1,869
775,25
3 11,948
Unlisted
Scom(Pre
viously
Trigem
Computer
)
2007.
12
Participat
ion in
managem
ent, etc.
0 0 0.0
1 0 0 0 0
0.0
1 0 52,714
-
14,059
Unlisted
Trigem
Computer
(Previousl
y TG
Sambo)
2012.
09
Participat
ion in
managem
ent, etc.
0 0 0.0
1 0 0 0 0
0.0
1 0 26,367 -402
Unlisted
iCube
Investmen
t Union #1
2009.
12
Participat
ion in
managem
ent, etc.
4,000 0 16.
23 4,000 0 0 0
16.
23 4,000 24,164 72
Unlisted
KT
WiBro
Infra
2010.
07
Participat
ion in
managem
ent, etc.
60,000 600 24.
2 60,000 0 0 600
24.
2 60,000
259,36
8 2,635
Unlisted Shinsung 2010.
07
Participat
ion in
managem
ent, etc.
1 1 0.0
1 0 0 0 1
0.0
1 0 58,999 2,680
Unlisted Woobang 2010.
07
Participat
ion in
managem
ent, etc.
0 1 0 0 0 0 1 0 0 113,78
1
-
25,649
Unlisted Heehoon
D&G
2010.
07
Participat
ion in
managem
ent, etc.
0 2 0.0
2 0 0 0 2
0.0
2 0 42,516 -8,168
Unlisted
Daewoo
Developm
ent
Co.,Ltd.-
Engineeri
ng &
Constructi
on
2012.
12
Participat
ion in
managem
ent, etc.
0 0 0.0
2 0 0 0 0
0.0
2 0
227,91
4 2,107
Unlisted
Daewoo
SD
Developm
ent
2012.
12
Participat
ion in
managem
ent, etc.
0 9 0.0
2 0 0 0 9
0.0
2 0
1,418,3
38
-
74,950
Unlisted
Daewoo
Motor
Sales
2012.
12
Participat
ion in
managem
ent, etc.
0 1 0 0 0 0 1 0 0 363,93
5
-
30,965
Unlisted Maltani
Lighting
2012.
04
Participat
ion in
managem
ent, etc.
16544 9 15 16225 0 0 9 15 16225 72,053 2,932
Unlisted Pantech 2013.
06
Business
purpose 53000 0 0 0 53000 53000 53000
10.
03 53000
1,455,7
34
-
188,16
7
Acquisi
tion
Unlisted
JNT
(semicond
uctor
fund)
2011.
02
Equity
investme
nt, etc.
1,800 0 24 3,600 0 -240 0 24 3,360 16,088 1383 Collecti
on
Unlisted
SV
(semicond
uctor
fund)
2011.
02
Equity
investme
nt, etc.
1,850 0 14.
8 3,403 0 0 0
14.
8 3,403 23,257 -352
Unlisted
Seoul
Investmen
t Partners
2011.
1
Equity
investme
nt, etc.
1,550 0 19.
4 3,100 0 -53 0
19.
4 3,047 15,520 -345
Collecti
on
Unlisted
Daishin-
Aju IB
(Semicon
ductor
fund)
2011.
08
Equity
investme
nt, etc.
258 0 3 750 0 1206 0 3 1956 18,437 -7766 Investm
ent
Unlisted
TS
(semicond
uctor
fund)
2011.
11
Equity
investme
nt, etc.
1,700 0 19.
9 1,700 0 1,700 0
19.
9 3,400 8,953 -376
Investm
ent
Unlisted
IMM
(semicond
uctor
fund)
2011.
11
Equity
investme
nt, etc.
760 0 7.6 1581 0 908 0 7.6 2,489 19,890 -821 Investm
ent
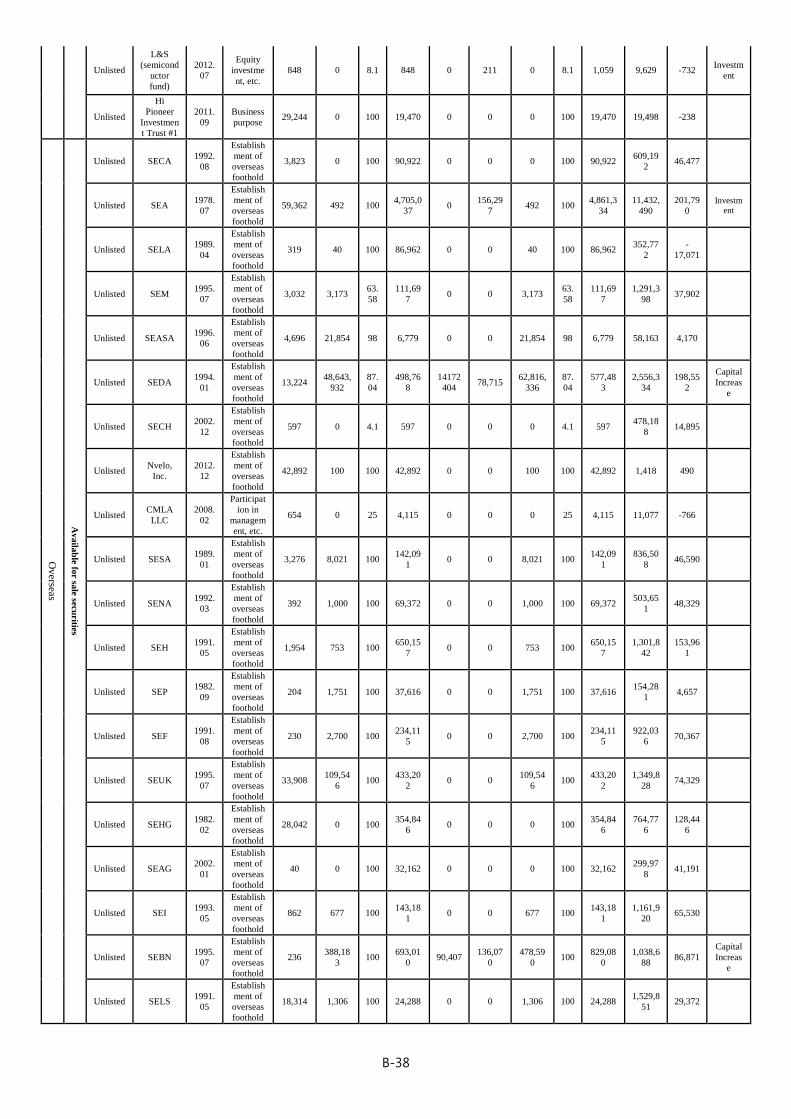
B-38
Unlisted
L&S
(semicond
uctor
fund)
2012.
07
Equity
investme
nt, etc.
848 0 8.1 848 0 211 0 8.1 1,059 9,629 -732 Investm
ent
Unlisted
Hi
Pioneer
Investmen
t Trust #1
2011.
09
Business
purpose 29,244 0 100 19,470 0 0 0 100 19,470 19,498 -238
Ov
erseas
Av
aila
ble fo
r sa
le secu
rities
Unlisted SECA 1992.
08
Establish
ment of
overseas
foothold
3,823 0 100 90,922 0 0 0 100 90,922 609,19
2 46,477
Unlisted SEA 1978.
07
Establish
ment of
overseas
foothold
59,362 492 100 4,705,0
37 0
156,29
7 492 100
4,861,3
34
11,432,
490
201,79
0
Investm
ent
Unlisted SELA 1989.
04
Establish
ment of
overseas
foothold
319 40 100 86,962 0 0 40 100 86,962 352,77
2
-
17,071
Unlisted SEM 1995.
07
Establish
ment of
overseas
foothold
3,032 3,173 63.
58
111,69
7 0 0 3,173
63.
58
111,69
7
1,291,3
98 37,902
Unlisted SEASA 1996.
06
Establish
ment of
overseas
foothold
4,696 21,854 98 6,779 0 0 21,854 98 6,779 58,163 4,170
Unlisted SEDA 1994.
01
Establish
ment of
overseas
foothold
13,224 48,643,
932
87.
04
498,76
8
14172
404 78,715
62,816,
336
87.
04
577,48
3
2,556,3
34
198,55
2
Capital
Increas
e
Unlisted SECH 2002.
12
Establish
ment of
overseas
foothold
597 0 4.1 597 0 0 0 4.1 597 478,18
8 14,895
Unlisted Nvelo,
Inc.
2012.
12
Establish
ment of
overseas
foothold
42,892 100 100 42,892 0 0 100 100 42,892 1,418 490
Unlisted CMLA
LLC
2008.
02
Participat
ion in
managem
ent, etc.
654 0 25 4,115 0 0 0 25 4,115 11,077 -766
Unlisted SESA 1989.
01
Establish
ment of
overseas
foothold
3,276 8,021 100 142,09
1 0 0 8,021 100
142,09
1
836,50
8 46,590
Unlisted SENA 1992.
03
Establish
ment of
overseas
foothold
392 1,000 100 69,372 0 0 1,000 100 69,372 503,65
1 48,329
Unlisted SEH 1991.
05
Establish
ment of
overseas
foothold
1,954 753 100 650,15
7 0 0 753 100
650,15
7
1,301,8
42
153,96
1
Unlisted SEP 1982.
09
Establish
ment of
overseas
foothold
204 1,751 100 37,616 0 0 1,751 100 37,616 154,28
1 4,657
Unlisted SEF 1991.
08
Establish
ment of
overseas
foothold
230 2,700 100 234,11
5 0 0 2,700 100
234,11
5
922,03
6 70,367
Unlisted SEUK 1995.
07
Establish
ment of
overseas
foothold
33,908 109,54
6 100
433,20
2 0 0
109,54
6 100
433,20
2
1,349,8
28 74,329
Unlisted SEHG 1982.
02
Establish
ment of
overseas
foothold
28,042 0 100 354,84
6 0 0 0 100
354,84
6
764,77
6
128,44
6
Unlisted SEAG 2002.
01
Establish
ment of
overseas
foothold
40 0 100 32,162 0 0 0 100 32,162 299,97
8 41,191
Unlisted SEI 1993.
05
Establish
ment of
overseas
foothold
862 677 100 143,18
1 0 0 677 100
143,18
1
1,161,9
20 65,530
Unlisted SEBN 1995.
07
Establish
ment of
overseas
foothold
236 388,18
3 100
693,01
0 90,407
136,07
0
478,59
0 100
829,08
0
1,038,6
88 86,871
Capital
Increas
e
Unlisted SELS 1991.
05
Establish
ment of
overseas
foothold
18,314 1,306 100 24,288 0 0 1,306 100 24,288 1,529,8
51 29,372
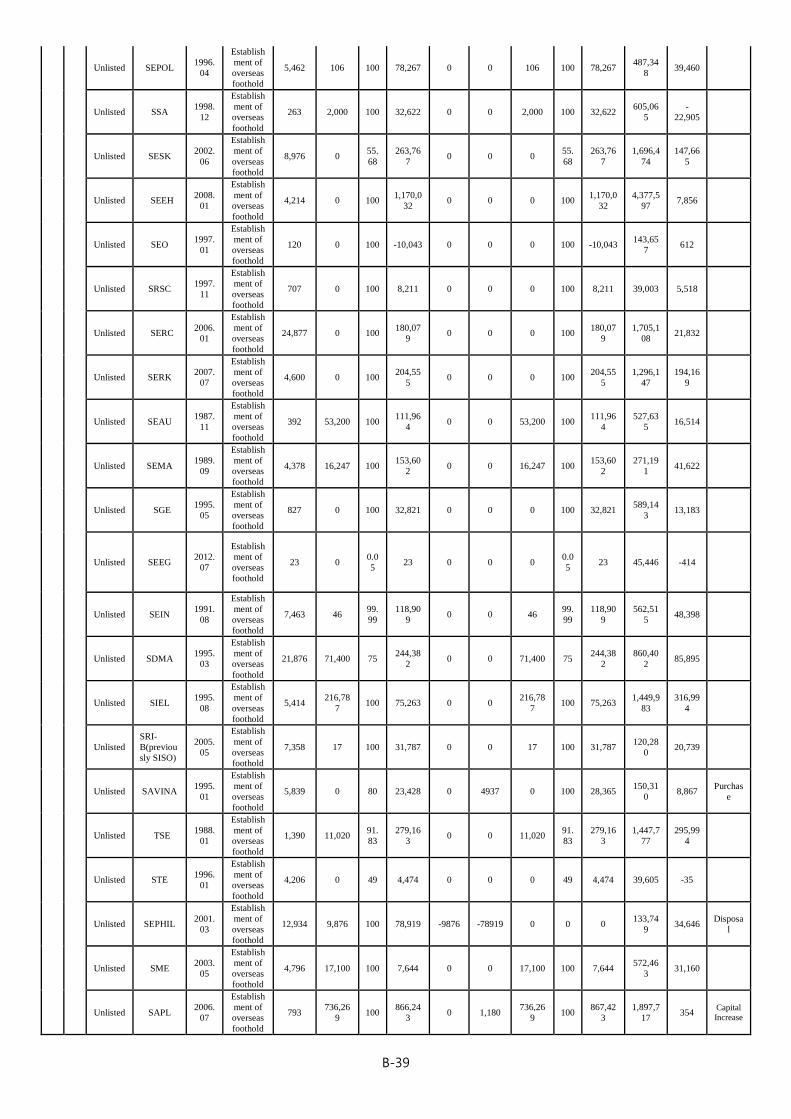
B-39
Unlisted SEPOL 1996.
04
Establish
ment of
overseas
foothold
5,462 106 100 78,267 0 0 106 100 78,267 487,34
8 39,460
Unlisted SSA 1998.
12
Establish
ment of
overseas
foothold
263 2,000 100 32,622 0 0 2,000 100 32,622 605,06
5
-
22,905
Unlisted SESK 2002.
06
Establish
ment of
overseas
foothold
8,976 0 55.
68
263,76
7 0 0 0
55.
68
263,76
7
1,696,4
74
147,66
5
Unlisted SEEH 2008.
01
Establish
ment of
overseas
foothold
4,214 0 100 1,170,0
32 0 0 0 100
1,170,0
32
4,377,5
97 7,856
Unlisted SEO 1997.
01
Establish
ment of
overseas
foothold
120 0 100 -10,043 0 0 0 100 -10,043 143,65
7 612
Unlisted SRSC 1997.
11
Establish
ment of
overseas
foothold
707 0 100 8,211 0 0 0 100 8,211 39,003 5,518
Unlisted SERC 2006.
01
Establish
ment of
overseas
foothold
24,877 0 100 180,07
9 0 0 0 100
180,07
9
1,705,1
08 21,832
Unlisted SERK 2007.
07
Establish
ment of
overseas
foothold
4,600 0 100 204,55
5 0 0 0 100
204,55
5
1,296,1
47
194,16
9
Unlisted SEAU 1987.
11
Establish
ment of
overseas
foothold
392 53,200 100 111,96
4 0 0 53,200 100
111,96
4
527,63
5 16,514
Unlisted SEMA 1989.
09
Establish
ment of
overseas
foothold
4,378 16,247 100 153,60
2 0 0 16,247 100
153,60
2
271,19
1 41,622
Unlisted SGE 1995.
05
Establish
ment of
overseas
foothold
827 0 100 32,821 0 0 0 100 32,821 589,14
3 13,183
Unlisted SEEG 2012.
07
Establish
ment of
overseas
foothold
23 0 0.0
5 23 0 0 0
0.0
5 23 45,446 -414
Unlisted SEIN 1991.
08
Establish
ment of
overseas
foothold
7,463 46 99.
99
118,90
9 0 0 46
99.
99
118,90
9
562,51
5 48,398
Unlisted SDMA 1995.
03
Establish
ment of
overseas
foothold
21,876 71,400 75 244,38
2 0 0 71,400 75
244,38
2
860,40
2 85,895
Unlisted SIEL 1995.
08
Establish
ment of
overseas
foothold
5,414 216,78
7 100 75,263 0 0
216,78
7 100 75,263
1,449,9
83
316,99
4
Unlisted
SRI-
B(previou
sly SISO)
2005.
05
Establish
ment of
overseas
foothold
7,358 17 100 31,787 0 0 17 100 31,787 120,28
0 20,739
Unlisted SAVINA 1995.
01
Establish
ment of
overseas
foothold
5,839 0 80 23,428 0 4937 0 100 28,365 150,31
0 8,867
Purchas
e
Unlisted TSE 1988.
01
Establish
ment of
overseas
foothold
1,390 11,020 91.
83
279,16
3 0 0 11,020
91.
83
279,16
3
1,447,7
77
295,99
4
Unlisted STE 1996.
01
Establish
ment of
overseas
foothold
4,206 0 49 4,474 0 0 0 49 4,474 39,605 -35
Unlisted SEPHIL 2001.
03
Establish
ment of
overseas
foothold
12,934 9,876 100 78,919 -9876 -78919 0 0 0 133,74
9 34,646
Disposa
l
Unlisted SME 2003.
05
Establish
ment of
overseas
foothold
4,796 17,100 100 7,644 0 0 17,100 100 7,644 572,46
3 31,160
Unlisted SAPL 2006.
07
Establish
ment of
overseas
foothold
793 736,26
9 100
866,24
3 0 1,180
736,26
9 100
867,42
3
1,897,7
17 354
Capital
Increase
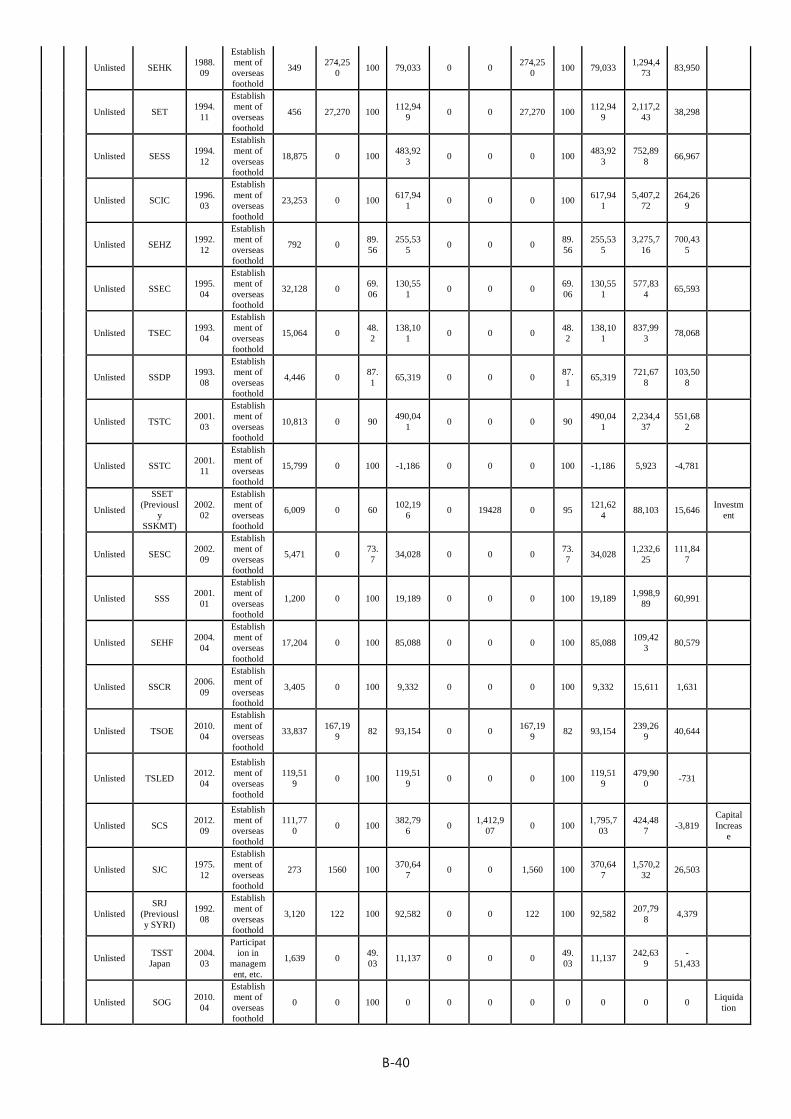
B-40
Unlisted SEHK 1988.
09
Establish
ment of
overseas
foothold
349 274,25
0 100 79,033 0 0
274,25
0 100 79,033
1,294,4
73 83,950
Unlisted SET 1994.
11
Establish
ment of
overseas
foothold
456 27,270 100 112,94
9 0 0 27,270 100
112,94
9
2,117,2
43 38,298
Unlisted SESS 1994.
12
Establish
ment of
overseas
foothold
18,875 0 100 483,92
3 0 0 0 100
483,92
3
752,89
8 66,967
Unlisted SCIC 1996.
03
Establish
ment of
overseas
foothold
23,253 0 100 617,94
1 0 0 0 100
617,94
1
5,407,2
72
264,26
9
Unlisted SEHZ 1992.
12
Establish
ment of
overseas
foothold
792 0 89.
56
255,53
5 0 0 0
89.
56
255,53
5
3,275,7
16
700,43
5
Unlisted SSEC 1995.
04
Establish
ment of
overseas
foothold
32,128 0 69.
06
130,55
1 0 0 0
69.
06
130,55
1
577,83
4 65,593
Unlisted TSEC 1993.
04
Establish
ment of
overseas
foothold
15,064 0 48.
2
138,10
1 0 0 0
48.
2
138,10
1
837,99
3 78,068
Unlisted SSDP 1993.
08
Establish
ment of
overseas
foothold
4,446 0 87.
1 65,319 0 0 0
87.
1 65,319
721,67
8
103,50
8
Unlisted TSTC 2001.
03
Establish
ment of
overseas
foothold
10,813 0 90 490,04
1 0 0 0 90
490,04
1
2,234,4
37
551,68
2
Unlisted SSTC 2001.
11
Establish
ment of
overseas
foothold
15,799 0 100 -1,186 0 0 0 100 -1,186 5,923 -4,781
Unlisted
SSET
(Previousl
y
SSKMT)
2002.
02
Establish
ment of
overseas
foothold
6,009 0 60 102,19
6 0 19428 0 95
121,62
4 88,103 15,646
Investm
ent
Unlisted SESC 2002.
09
Establish
ment of
overseas
foothold
5,471 0 73.
7 34,028 0 0 0
73.
7 34,028
1,232,6
25
111,84
7
Unlisted SSS 2001.
01
Establish
ment of
overseas
foothold
1,200 0 100 19,189 0 0 0 100 19,189 1,998,9
89 60,991
Unlisted SEHF 2004.
04
Establish
ment of
overseas
foothold
17,204 0 100 85,088 0 0 0 100 85,088 109,42
3 80,579
Unlisted SSCR 2006.
09
Establish
ment of
overseas
foothold
3,405 0 100 9,332 0 0 0 100 9,332 15,611 1,631
Unlisted TSOE 2010.
04
Establish
ment of
overseas
foothold
33,837 167,19
9 82 93,154 0 0
167,19
9 82 93,154
239,26
9 40,644
Unlisted TSLED 2012.
04
Establish
ment of
overseas
foothold
119,51
9 0 100
119,51
9 0 0 0 100
119,51
9
479,90
0 -731
Unlisted SCS 2012.
09
Establish
ment of
overseas
foothold
111,77
0 0 100
382,79
6 0
1,412,9
07 0 100
1,795,7
03
424,48
7 -3,819
Capital
Increas
e
Unlisted SJC 1975.
12
Establish
ment of
overseas
foothold
273 1560 100 370,64
7 0 0 1,560 100
370,64
7
1,570,2
32 26,503
Unlisted
SRJ
(Previousl
y SYRI)
1992.
08
Establish
ment of
overseas
foothold
3,120 122 100 92,582 0 0 122 100 92,582 207,79
8 4,379
Unlisted TSST
Japan
2004.
03
Participat
ion in
managem
ent, etc.
1,639 0 49.
03 11,137 0 0 0
49.
03 11,137
242,63
9
-
51,433
Unlisted SOG 2010.
04
Establish
ment of
overseas
foothold
0 0 100 0 0 0 0 0 0 0 0 Liquida
tion
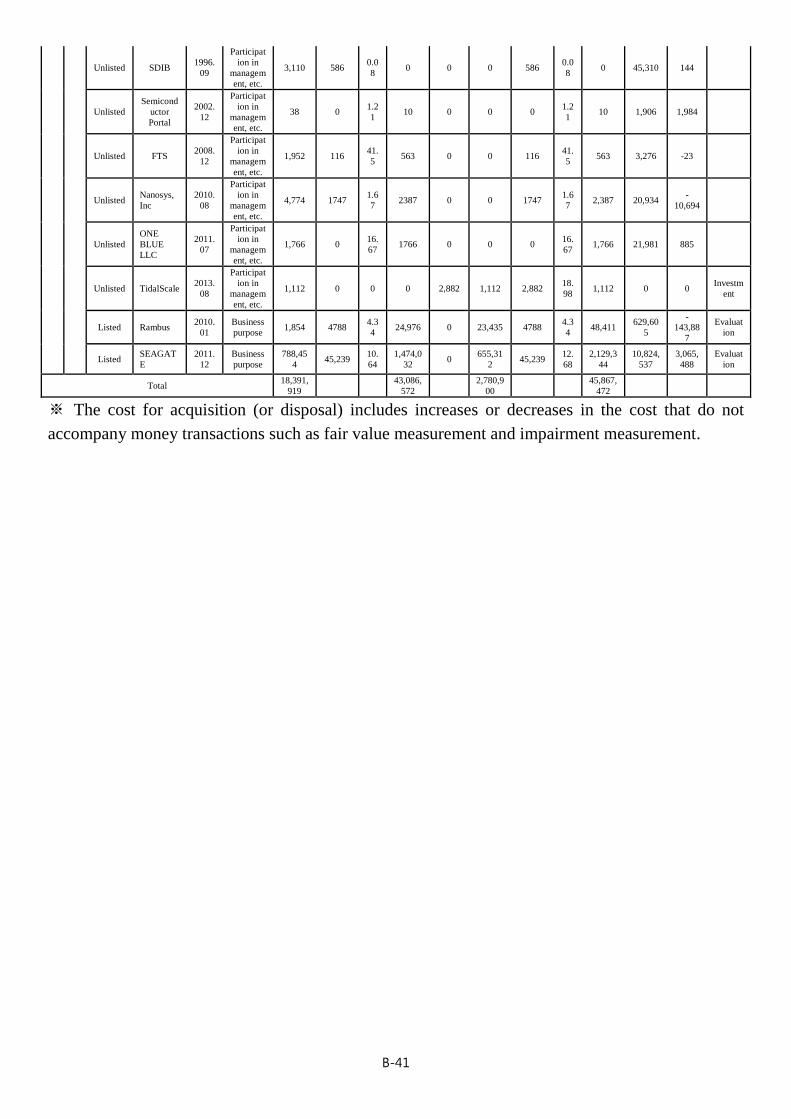
B-41
Unlisted SDIB 1996.
09
Participat
ion in
managem
ent, etc.
3,110 586 0.0
8 0 0 0 586
0.0
8 0 45,310 144
Unlisted
Semicond
uctor
Portal
2002.
12
Participat
ion in
managem
ent, etc.
38 0 1.2
1 10 0 0 0
1.2
1 10 1,906 1,984
Unlisted FTS 2008.
12
Participat
ion in
managem
ent, etc.
1,952 116 41.
5 563 0 0 116
41.
5 563 3,276 -23
Unlisted Nanosys,
Inc
2010.
08
Participat
ion in
managem
ent, etc.
4,774 1747 1.6
7 2387 0 0 1747
1.6
7 2,387 20,934
-
10,694
Unlisted
ONE
BLUE
LLC
2011.
07
Participat
ion in
managem
ent, etc.
1,766 0 16.
67 1766 0 0 0
16.
67 1,766 21,981 885
Unlisted TidalScale 2013.
08
Participat
ion in
managem
ent, etc.
1,112 0 0 0 2,882 1,112 2,882 18.
98 1,112 0 0
Investm
ent
Listed Rambus 2010.
01
Business
purpose 1,854 4788
4.3
4 24,976 0 23,435 4788
4.3
4 48,411
629,60
5
-
143,88
7
Evaluat
ion
Listed SEAGAT
E
2011.
12
Business
purpose
788,45
4 45,239
10.
64
1,474,0
32 0
655,31
2 45,239
12.
68
2,129,3
44
10,824,
537
3,065,
488
Evaluat
ion
Total 18,391,
919 43,086,
572 2,780,9
00 45,867,
472
※ The cost for acquisition (or disposal) includes increases or decreases in the cost that do not
accompany money transactions such as fair value measurement and impairment measurement.
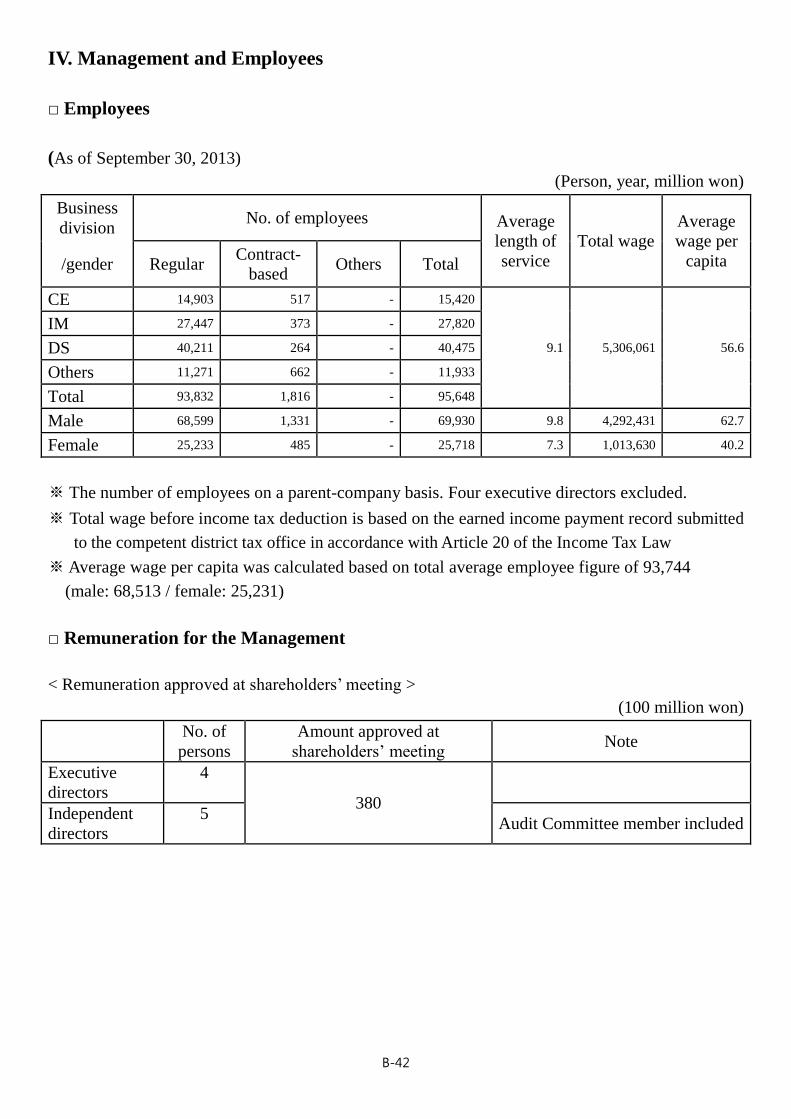
B-42
IV. Management and Employees
□ Employees
(As of September 30, 2013)
(Person, year, million won)
Business
division No. of employees Average
length of
service
Total wage
Average
wage per
capita /gender Regular Contract-
based Others Total
CE 14,903 517 - 15,420
9.1 5,306,061 56.6
IM 27,447 373 - 27,820
DS 40,211 264 - 40,475
Others 11,271 662 - 11,933
Total 93,832 1,816 - 95,648
Male 68,599 1,331 - 69,930 9.8 4,292,431 62.7
Female 25,233 485 - 25,718 7.3 1,013,630 40.2
※ The number of employees on a parent-company basis. Four executive directors excluded.
※ Total wage before income tax deduction is based on the earned income payment record submitted
to the competent district tax office in accordance with Article 20 of the Income Tax Law
※ Average wage per capita was calculated based on total average employee figure of 93,744
(male: 68,513 / female: 25,231)
□ Remuneration for the Management
< Remuneration approved at shareholders’ meeting >
(100 million won)
No. of
persons
Amount approved at
shareholders’ meeting Note
Executive
directors
4
380
Independent
directors
5 Audit Committee member included
1
Auditor’s Review Report
To the Board of Directors and Shareholders of
Samsung Electronics Co., Ltd.
Reviewed Financial Statements
We have reviewed the accompanying interim consolidated financial statements of Samsung
Electronics Co., Ltd. and its subsidiaries (collectively referred to as the “Company”). These interim
consolidated financial statements consist of interim consolidated statements of financial position of
the Company as of September 30, 2013, and the related interim consolidated statements of income,
comprehensive income for the three and nine months ended September 30, 2013 and 2012, changes in
equity and cash flows for the nine-months then ended September 30, 2013 and 2012, and a summary
of significant accounting policies and other explanatory notes.
Management's Responsibility for the Financial Statements
Management is responsible for the preparation and fair presentation of these interim consolidated
financial statements in accordance with the International Financial Reporting Standards as adopted by
the Republic of Korea (“K-IFRS”) 1034, Interim Financial Reporting and for such internal control as
management determines is necessary to enable the preparation of interim consolidated financial
statements that are free from material misstatement, whether due to fraud or error.
Auditor's Responsibility
Our responsibility is to issue a report on these interim consolidated financial statements based on our
reviews. We did not review the financial statements of consolidated subsidiaries whose financial
statements represent 7.4% and 7.2% of the Company's consolidated total assets as of September 30,
2013 and December 31, 2012, respectively; and 25.9% and 21.4% of the Company's consolidated total
sales for each of the nine month periods ended September 30, 2013 and 2012, respectively. These
statements were reviewed by other auditors whose reports have been furnished, and our review report
as presented herein, insofar as it relates to the amounts included for the consolidated subsidiaries, is
based solely on the reports of the other auditors.
We conducted our reviews in accordance with the quarterly review standards established by the
Securities and Futures Commission of the Republic of Korea. A review of interim financial
information consists of making inquiries, primarily of persons responsible for financial and accounting
matters, and applying analytical and other review procedures. A review is substantially less in scope
than an audit conducted in accordance with auditing standards generally accepted in the Republic of
Korea and consequently does not enable us to obtain assurance that we would become aware of all
significant matters that might be identified in an audit. Accordingly, we do not express an audit
opinion.
2
Conclusion
Based on our reviews and reports of other auditors, nothing has come to our attention that causes us to
believe the accompanying interim consolidated financial statements are not presented fairly, in all
material respects, in accordance with the K-IFRS 1034, Interim Financial Reporting.
Other Matters
We have audited the statement of financial position of the Company as of December 31, 2012, and the
related statements of income, comprehensive income, changes in equity, and cash flows for the year
then ended, in accordance with auditing standards generally accepted in the Republic of Korea. We
expressed an unqualified opinion on those financial statements in our audit report dated February 1,
2013. The statement of financial position as of December 31, 2012, presented herein for comparative
purposes, is consistent, in all material respects, with the above mentioned audited statement of
financial position as of December 31, 2012.
Seoul, Korea
November 7, 2013
This report is effective as of November 7, 2013, the review report date. Certain subsequent events orcircumstances, which may occur between the review report date and the time of reading this report, could have amaterial impact on the accompanying interim financial statements and notes thereto. Accordingly, the readers ofthe review report should understand that there is a possibility that the above review report may have to berevised to reflect the impact of such subsequent events or circumstances, if any.
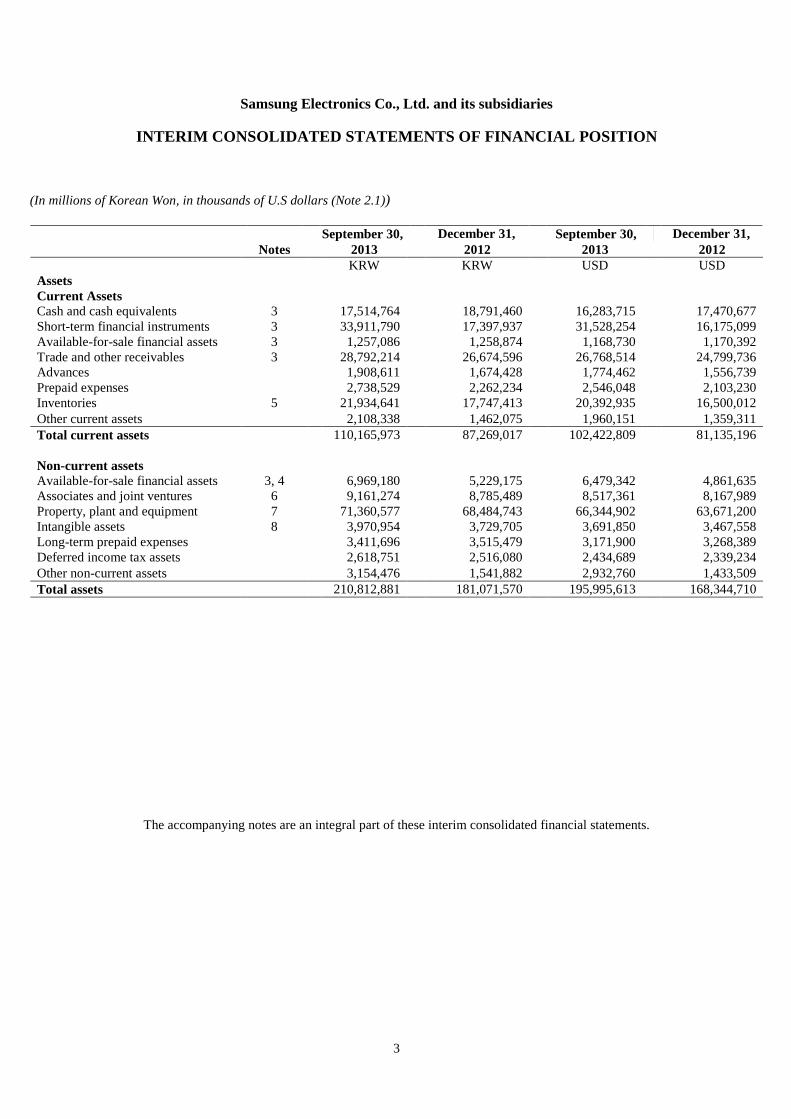
3
Samsung Electronics Co., Ltd. and its subsidiaries
INTERIM CONSOLIDATED STATEMENTS OF FINANCIAL POSITION
(In millions of Korean Won, in thousands of U.S dollars (Note 2.1))
September 30, December 31, September 30, December 31,Notes 2013 2012 2013 2012
KRW KRW USD USDAssetsCurrent AssetsCash and cash equivalents 3 17,514,764 18,791,460 16,283,715 17,470,677Short-term financial instruments 3 33,911,790 17,397,937 31,528,254 16,175,099Available-for-sale financial assets 3 1,257,086 1,258,874 1,168,730 1,170,392Trade and other receivables 3 28,792,214 26,674,596 26,768,514 24,799,736Advances 1,908,611 1,674,428 1,774,462 1,556,739Prepaid expenses 2,738,529 2,262,234 2,546,048 2,103,230Inventories 5 21,934,641 17,747,413 20,392,935 16,500,012Other current assets 2,108,338 1,462,075 1,960,151 1,359,311Total current assets 110,165,973 87,269,017 102,422,809 81,135,196
Non-current assetsAvailable-for-sale financial assets 3, 4 6,969,180 5,229,175 6,479,342 4,861,635Associates and joint ventures 6 9,161,274 8,785,489 8,517,361 8,167,989Property, plant and equipment 7 71,360,577 68,484,743 66,344,902 63,671,200Intangible assets 8 3,970,954 3,729,705 3,691,850 3,467,558Long-term prepaid expenses 3,411,696 3,515,479 3,171,900 3,268,389Deferred income tax assets 2,618,751 2,516,080 2,434,689 2,339,234Other non-current assets 3,154,476 1,541,882 2,932,760 1,433,509Total assets 210,812,881 181,071,570 195,995,613 168,344,710
The accompanying notes are an integral part of these interim consolidated financial statements.
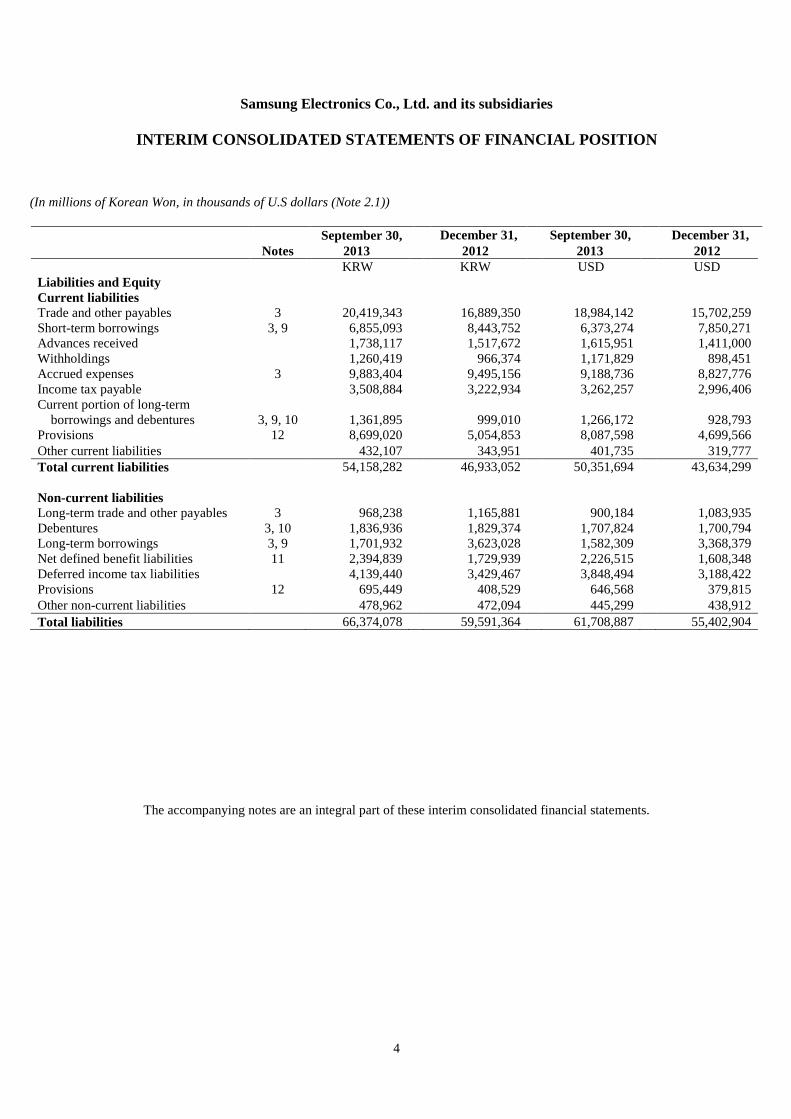
4
Samsung Electronics Co., Ltd. and its subsidiaries
INTERIM CONSOLIDATED STATEMENTS OF FINANCIAL POSITION
(In millions of Korean Won, in thousands of U.S dollars (Note 2.1))
September 30, December 31, September 30, December 31,Notes 2013 2012 2013 2012
KRW KRW USD USDLiabilities and EquityCurrent liabilitiesTrade and other payables 3 20,419,343 16,889,350 18,984,142 15,702,259Short-term borrowings 3, 9 6,855,093 8,443,752 6,373,274 7,850,271Advances received 1,738,117 1,517,672 1,615,951 1,411,000Withholdings 1,260,419 966,374 1,171,829 898,451Accrued expenses 3 9,883,404 9,495,156 9,188,736 8,827,776Income tax payable 3,508,884 3,222,934 3,262,257 2,996,406Current portion of long-term
borrowings and debentures 3, 9, 10 1,361,895 999,010 1,266,172 928,793Provisions 12 8,699,020 5,054,853 8,087,598 4,699,566Other current liabilities 432,107 343,951 401,735 319,777Total current liabilities 54,158,282 46,933,052 50,351,694 43,634,299
Non-current liabilitiesLong-term trade and other payables 3 968,238 1,165,881 900,184 1,083,935Debentures 3, 10 1,836,936 1,829,374 1,707,824 1,700,794Long-term borrowings 3, 9 1,701,932 3,623,028 1,582,309 3,368,379Net defined benefit liabilities 11 2,394,839 1,729,939 2,226,515 1,608,348Deferred income tax liabilities 4,139,440 3,429,467 3,848,494 3,188,422Provisions 12 695,449 408,529 646,568 379,815Other non-current liabilities 478,962 472,094 445,299 438,912
Total liabilities 66,374,078 59,591,364 61,708,887 55,402,904
The accompanying notes are an integral part of these interim consolidated financial statements.
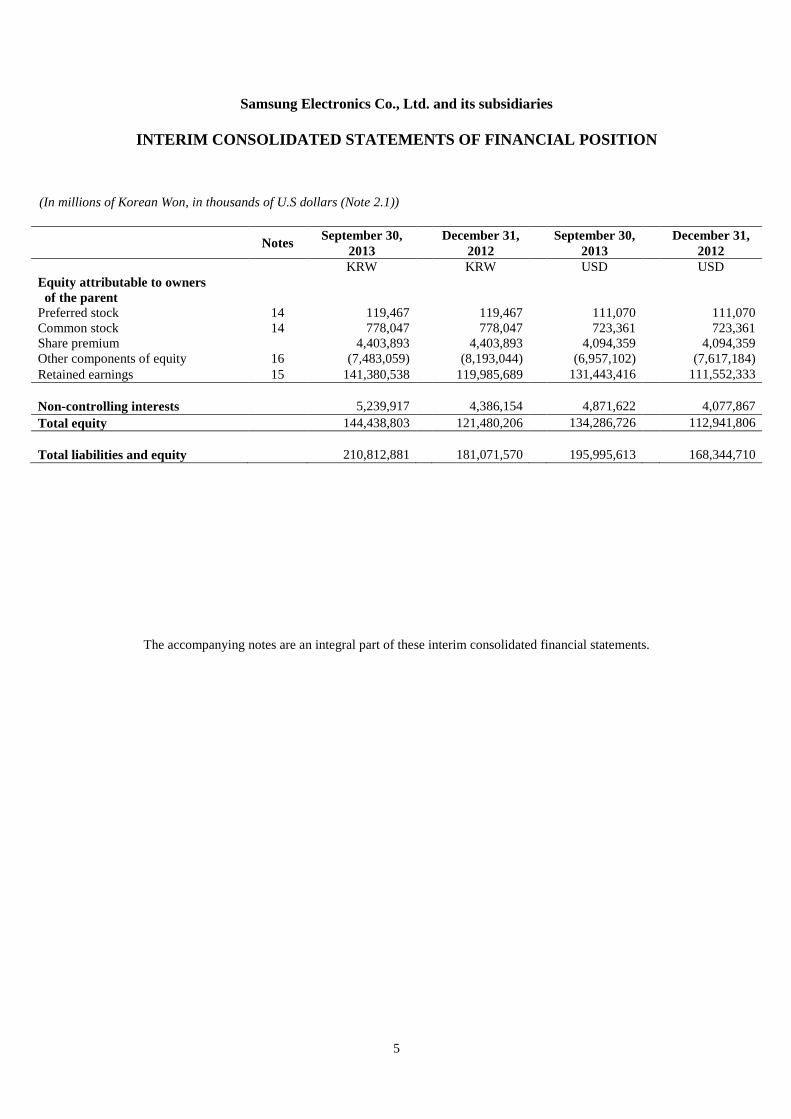
5
Samsung Electronics Co., Ltd. and its subsidiaries
INTERIM CONSOLIDATED STATEMENTS OF FINANCIAL POSITION
(In millions of Korean Won, in thousands of U.S dollars (Note 2.1))
Notes September 30, December 31, September 30, December 31,2013 2012 2013 2012KRW KRW USD USD
Equity attributable to ownersof the parent
Preferred stock 14 119,467 119,467 111,070 111,070Common stock 14 778,047 778,047 723,361 723,361Share premium 4,403,893 4,403,893 4,094,359 4,094,359Other components of equity 16 (7,483,059) (8,193,044) (6,957,102) (7,617,184)Retained earnings 15 141,380,538 119,985,689 131,443,416 111,552,333
Non-controlling interests 5,239,917 4,386,154 4,871,622 4,077,867
Total equity 144,438,803 121,480,206 134,286,726 112,941,806
Total liabilities and equity 210,812,881 181,071,570 195,995,613 168,344,710
The accompanying notes are an integral part of these interim consolidated financial statements.
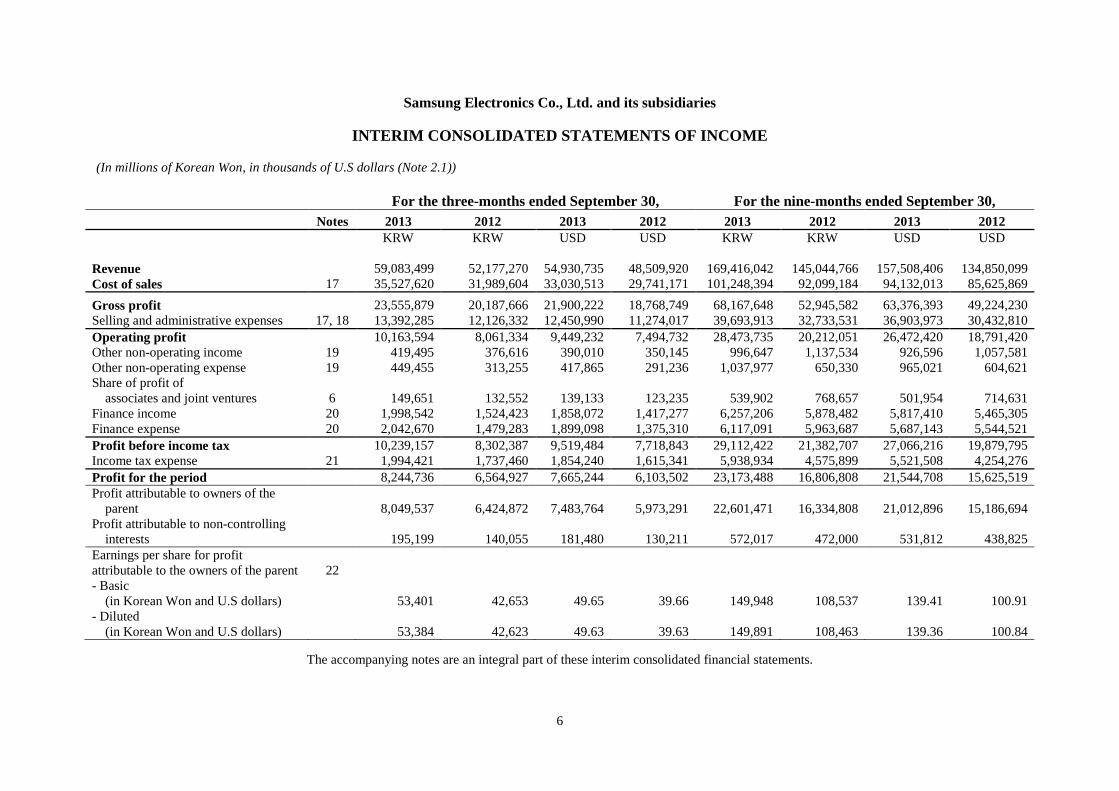
6
Samsung Electronics Co., Ltd. and its subsidiaries
INTERIM CONSOLIDATED STATEMENTS OF INCOME
(In millions of Korean Won, in thousands of U.S dollars (Note 2.1))
For the three-months ended September 30, For the nine-months ended September 30,Notes 2013 2012 2013 2012 2013 2012 2013 2012
KRW KRW USD USD KRW KRW USD USD
Revenue 59,083,499 52,177,270 54,930,735 48,509,920 169,416,042 145,044,766 157,508,406 134,850,099Cost of sales 17 35,527,620 31,989,604 33,030,513 29,741,171 101,248,394 92,099,184 94,132,013 85,625,869
Gross profit 23,555,879 20,187,666 21,900,222 18,768,749 68,167,648 52,945,582 63,376,393 49,224,230Selling and administrative expenses 17, 18 13,392,285 12,126,332 12,450,990 11,274,017 39,693,913 32,733,531 36,903,973 30,432,810
Operating profit 10,163,594 8,061,334 9,449,232 7,494,732 28,473,735 20,212,051 26,472,420 18,791,420Other non-operating income 19 419,495 376,616 390,010 350,145 996,647 1,137,534 926,596 1,057,581Other non-operating expense 19 449,455 313,255 417,865 291,236 1,037,977 650,330 965,021 604,621Share of profit of
associates and joint ventures 6 149,651 132,552 139,133 123,235 539,902 768,657 501,954 714,631Finance income 20 1,998,542 1,524,423 1,858,072 1,417,277 6,257,206 5,878,482 5,817,410 5,465,305Finance expense 20 2,042,670 1,479,283 1,899,098 1,375,310 6,117,091 5,963,687 5,687,143 5,544,521
Profit before income tax 10,239,157 8,302,387 9,519,484 7,718,843 29,112,422 21,382,707 27,066,216 19,879,795Income tax expense 21 1,994,421 1,737,460 1,854,240 1,615,341 5,938,934 4,575,899 5,521,508 4,254,276
Profit for the period 8,244,736 6,564,927 7,665,244 6,103,502 23,173,488 16,806,808 21,544,708 15,625,519Profit attributable to owners of the
parent 8,049,537 6,424,872 7,483,764 5,973,291 22,601,471 16,334,808 21,012,896 15,186,694Profit attributable to non-controlling
interests 195,199 140,055 181,480 130,211 572,017 472,000 531,812 438,825Earnings per share for profitattributable to the owners of the parent 22- Basic
(in Korean Won and U.S dollars) 53,401 42,653 49.65 39.66 149,948 108,537 139.41 100.91- Diluted
(in Korean Won and U.S dollars) 53,384 42,623 49.63 39.63 149,891 108,463 139.36 100.84
The accompanying notes are an integral part of these interim consolidated financial statements.
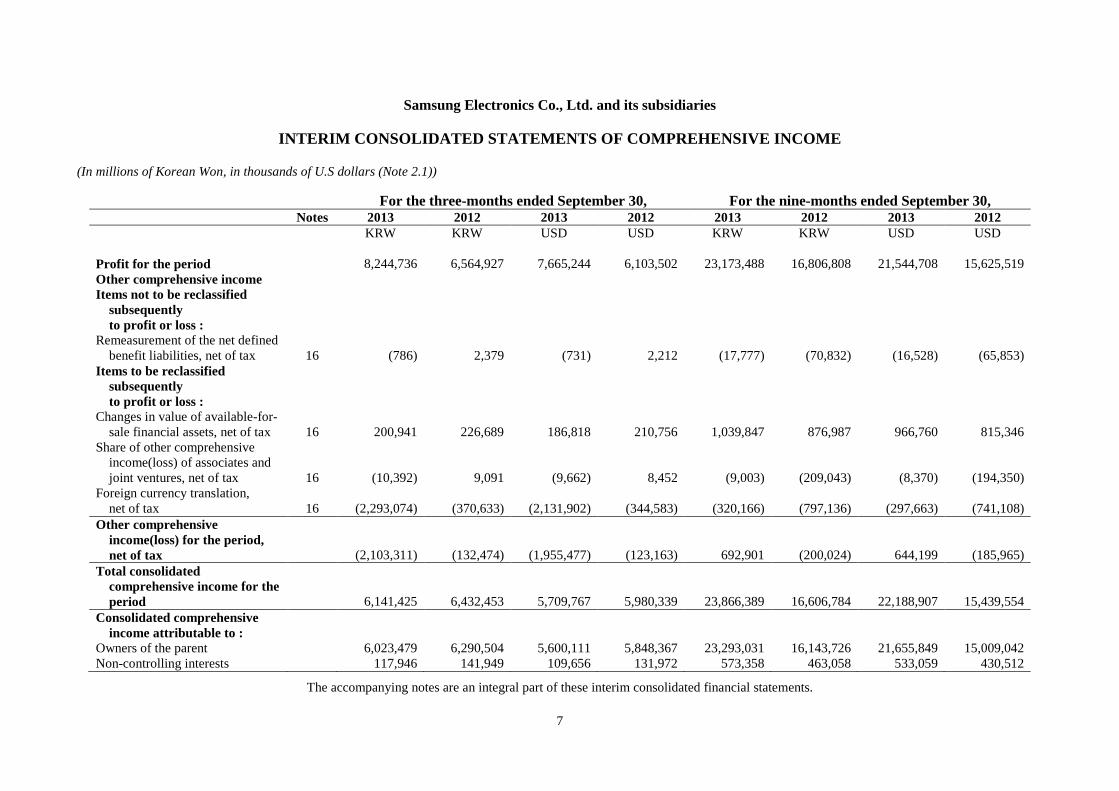
7
Samsung Electronics Co., Ltd. and its subsidiaries
INTERIM CONSOLIDATED STATEMENTS OF COMPREHENSIVE INCOME
(In millions of Korean Won, in thousands of U.S dollars (Note 2.1))
For the three-months ended September 30, For the nine-months ended September 30,Notes 2013 2012 2013 2012 2013 2012 2013 2012
KRW KRW USD USD KRW KRW USD USD
Profit for the period 8,244,736 6,564,927 7,665,244 6,103,502 23,173,488 16,806,808 21,544,708 15,625,519Other comprehensive incomeItems not to be reclassified
subsequentlyto profit or loss :
Remeasurement of the net definedbenefit liabilities, net of tax 16 (786) 2,379 (731) 2,212 (17,777) (70,832) (16,528) (65,853)
Items to be reclassifiedsubsequentlyto profit or loss :
Changes in value of available-for-sale financial assets, net of tax 16 200,941 226,689 186,818 210,756 1,039,847 876,987 966,760 815,346
Share of other comprehensiveincome(loss) of associates andjoint ventures, net of tax 16 (10,392) 9,091 (9,662) 8,452 (9,003) (209,043) (8,370) (194,350)
Foreign currency translation,net of tax 16 (2,293,074) (370,633) (2,131,902) (344,583) (320,166) (797,136) (297,663) (741,108)
Other comprehensiveincome(loss) for the period,net of tax (2,103,311) (132,474) (1,955,477) (123,163) 692,901 (200,024) 644,199 (185,965)
Total consolidatedcomprehensive income for theperiod 6,141,425 6,432,453 5,709,767 5,980,339 23,866,389 16,606,784 22,188,907 15,439,554
Consolidated comprehensiveincome attributable to :
Owners of the parent 6,023,479 6,290,504 5,600,111 5,848,367 23,293,031 16,143,726 21,655,849 15,009,042Non-controlling interests 117,946 141,949 109,656 131,972 573,358 463,058 533,059 430,512
The accompanying notes are an integral part of these interim consolidated financial statements.
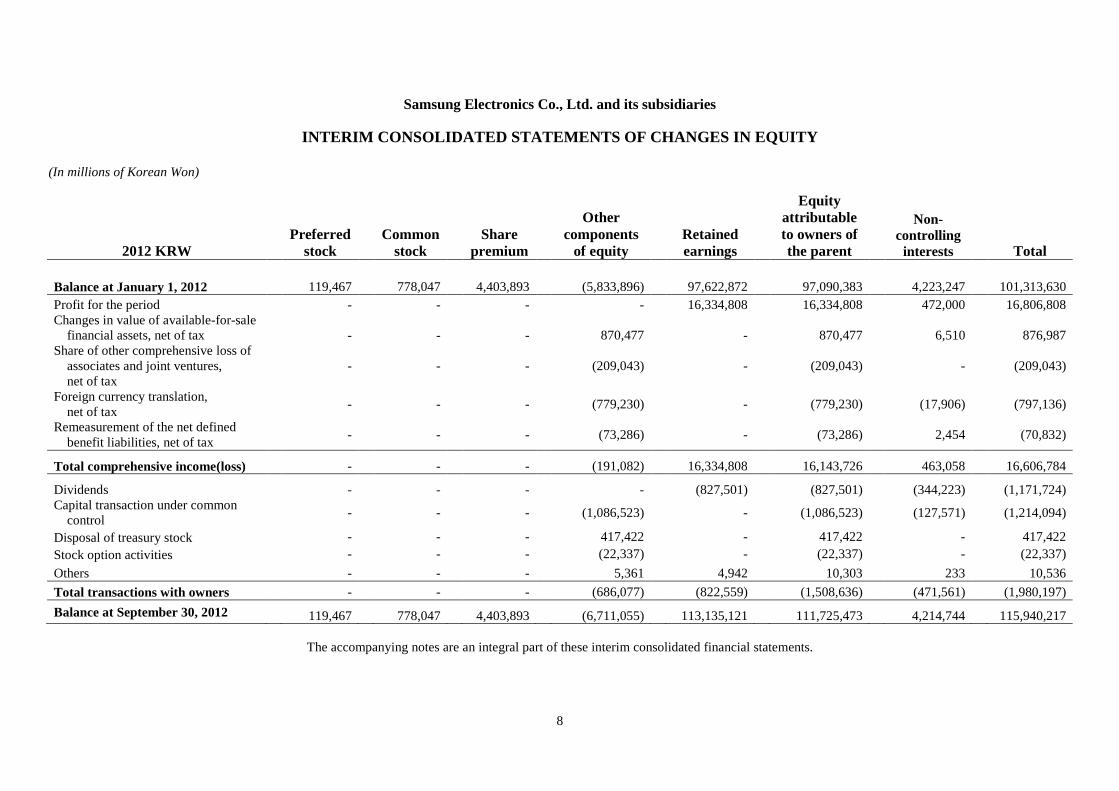
8
Samsung Electronics Co., Ltd. and its subsidiaries
INTERIM CONSOLIDATED STATEMENTS OF CHANGES IN EQUITY
(In millions of Korean Won)
2012 KRWPreferred
stockCommon
stockShare
premium
Othercomponents
of equityRetainedearnings
Equityattributableto owners ofthe parent
Non-controlling
interests Total
Balance at January 1, 2012 119,467 778,047 4,403,893 (5,833,896) 97,622,872 97,090,383 4,223,247 101,313,630
Profit for the period - - - - 16,334,808 16,334,808 472,000 16,806,808Changes in value of available-for-sale
financial assets, net of tax - - - 870,477 - 870,477 6,510 876,987Share of other comprehensive loss of
associates and joint ventures,net of tax
- - - (209,043) - (209,043) - (209,043)
Foreign currency translation,net of tax
- - - (779,230) - (779,230) (17,906) (797,136)
Remeasurement of the net definedbenefit liabilities, net of tax
- - - (73,286) - (73,286) 2,454 (70,832)
Total comprehensive income(loss) - - - (191,082) 16,334,808 16,143,726 463,058 16,606,784
Dividends - - - - (827,501) (827,501) (344,223) (1,171,724)Capital transaction under common
control- - - (1,086,523) - (1,086,523) (127,571) (1,214,094)
Disposal of treasury stock - - - 417,422 - 417,422 - 417,422
Stock option activities - - - (22,337) - (22,337) - (22,337)
Others - - - 5,361 4,942 10,303 233 10,536
Total transactions with owners - - - (686,077) (822,559) (1,508,636) (471,561) (1,980,197)
Balance at September 30, 2012 119,467 778,047 4,403,893 (6,711,055) 113,135,121 111,725,473 4,214,744 115,940,217
The accompanying notes are an integral part of these interim consolidated financial statements.
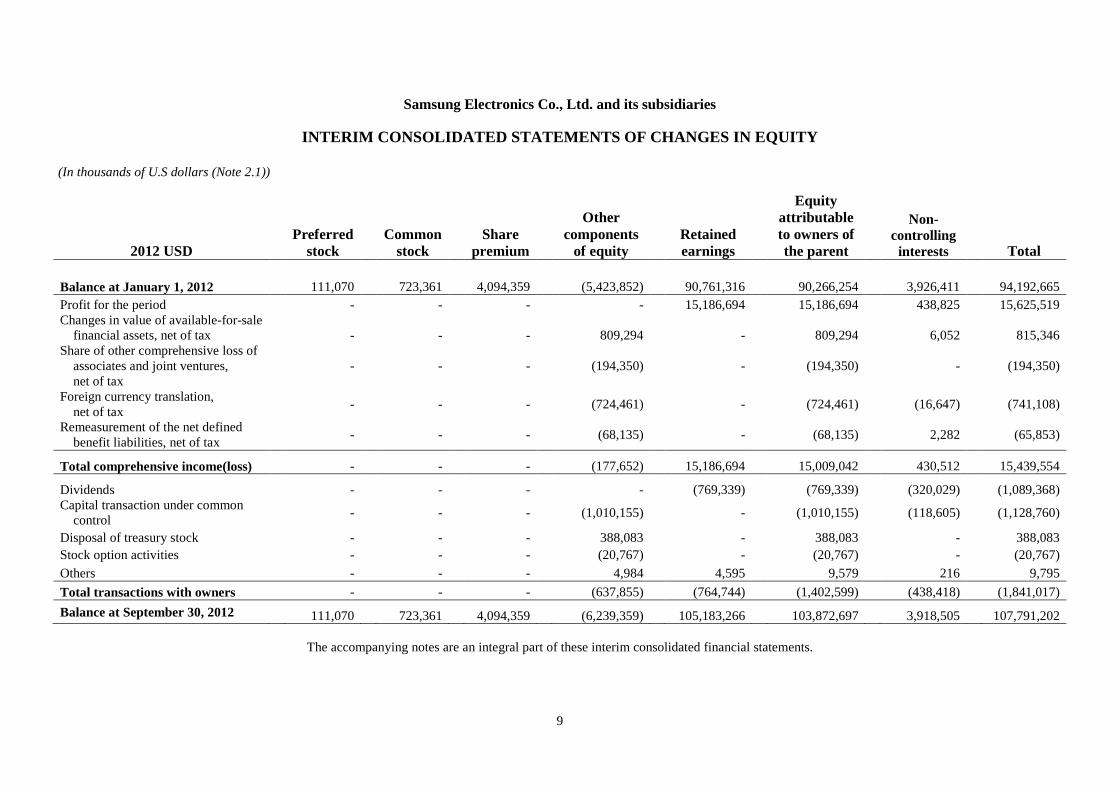
9
Samsung Electronics Co., Ltd. and its subsidiaries
INTERIM CONSOLIDATED STATEMENTS OF CHANGES IN EQUITY
(In thousands of U.S dollars (Note 2.1))
2012 USDPreferred
stockCommon
stockShare
premium
Othercomponents
of equityRetainedearnings
Equityattributableto owners ofthe parent
Non-controlling
interests Total
Balance at January 1, 2012 111,070 723,361 4,094,359 (5,423,852) 90,761,316 90,266,254 3,926,411 94,192,665
Profit for the period - - - - 15,186,694 15,186,694 438,825 15,625,519Changes in value of available-for-sale
financial assets, net of tax - - - 809,294 - 809,294 6,052 815,346Share of other comprehensive loss of
associates and joint ventures,net of tax
- - - (194,350) - (194,350) - (194,350)
Foreign currency translation,net of tax
- - - (724,461) - (724,461) (16,647) (741,108)
Remeasurement of the net definedbenefit liabilities, net of tax
- - - (68,135) - (68,135) 2,282 (65,853)
Total comprehensive income(loss) - - - (177,652) 15,186,694 15,009,042 430,512 15,439,554
Dividends - - - - (769,339) (769,339) (320,029) (1,089,368)Capital transaction under common
control- - - (1,010,155) - (1,010,155) (118,605) (1,128,760)
Disposal of treasury stock - - - 388,083 - 388,083 - 388,083
Stock option activities - - - (20,767) - (20,767) - (20,767)
Others - - - 4,984 4,595 9,579 216 9,795
Total transactions with owners - - - (637,855) (764,744) (1,402,599) (438,418) (1,841,017)
Balance at September 30, 2012 111,070 723,361 4,094,359 (6,239,359) 105,183,266 103,872,697 3,918,505 107,791,202
The accompanying notes are an integral part of these interim consolidated financial statements.
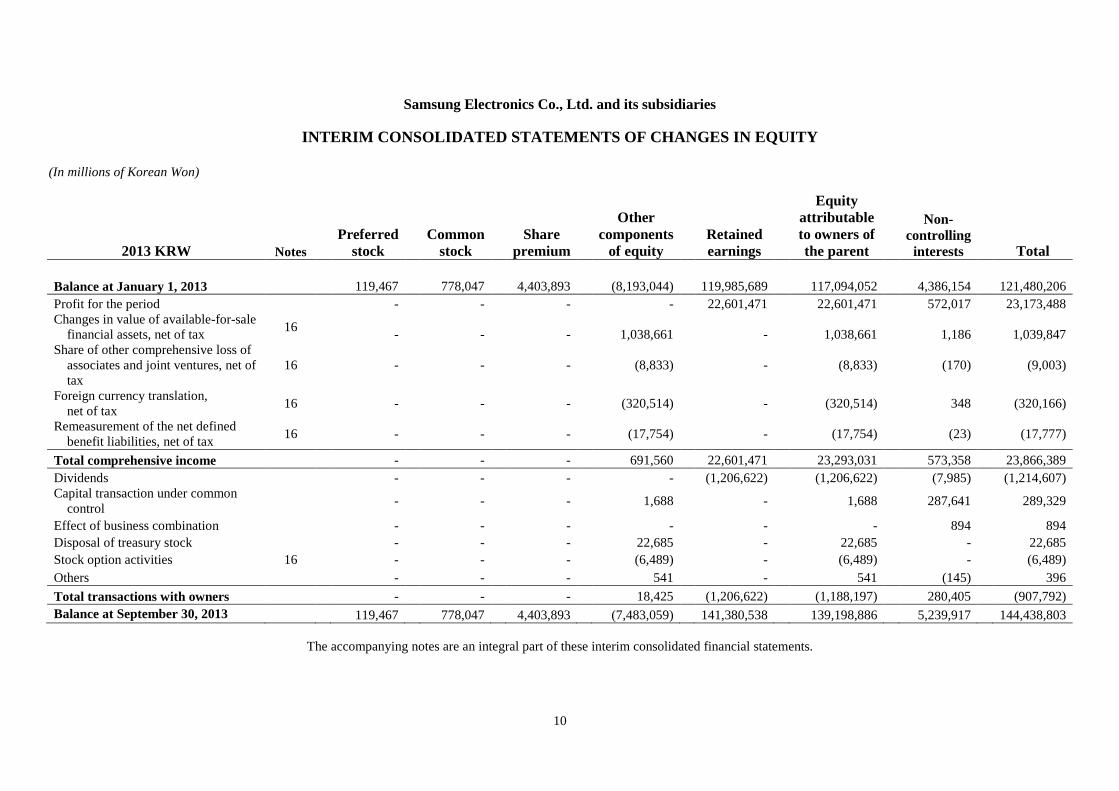
10
Samsung Electronics Co., Ltd. and its subsidiaries
INTERIM CONSOLIDATED STATEMENTS OF CHANGES IN EQUITY
(In millions of Korean Won)
2013 KRW NotesPreferred
stockCommon
stockShare
premium
Othercomponents
of equityRetainedearnings
Equityattributableto owners ofthe parent
Non-controlling
interests Total
Balance at January 1, 2013 119,467 778,047 4,403,893 (8,193,044) 119,985,689 117,094,052 4,386,154 121,480,206
Profit for the period - - - - 22,601,471 22,601,471 572,017 23,173,488Changes in value of available-for-sale
financial assets, net of tax16
- - - 1,038,661 - 1,038,661 1,186 1,039,847Share of other comprehensive loss of
associates and joint ventures, net oftax
16 - - - (8,833) - (8,833) (170) (9,003)
Foreign currency translation,net of tax
16 - - - (320,514) - (320,514) 348 (320,166)
Remeasurement of the net definedbenefit liabilities, net of tax
16 - - - (17,754) - (17,754) (23) (17,777)
Total comprehensive income - - - 691,560 22,601,471 23,293,031 573,358 23,866,389
Dividends - - - - (1,206,622) (1,206,622) (7,985) (1,214,607)Capital transaction under common
control- - - 1,688 - 1,688 287,641 289,329
Effect of business combination - - - - - - 894 894
Disposal of treasury stock - - - 22,685 - 22,685 - 22,685
Stock option activities 16 - - - (6,489) - (6,489) - (6,489)
Others - - - 541 - 541 (145) 396
Total transactions with owners - - - 18,425 (1,206,622) (1,188,197) 280,405 (907,792)
Balance at September 30, 2013 119,467 778,047 4,403,893 (7,483,059) 141,380,538 139,198,886 5,239,917 144,438,803
The accompanying notes are an integral part of these interim consolidated financial statements.
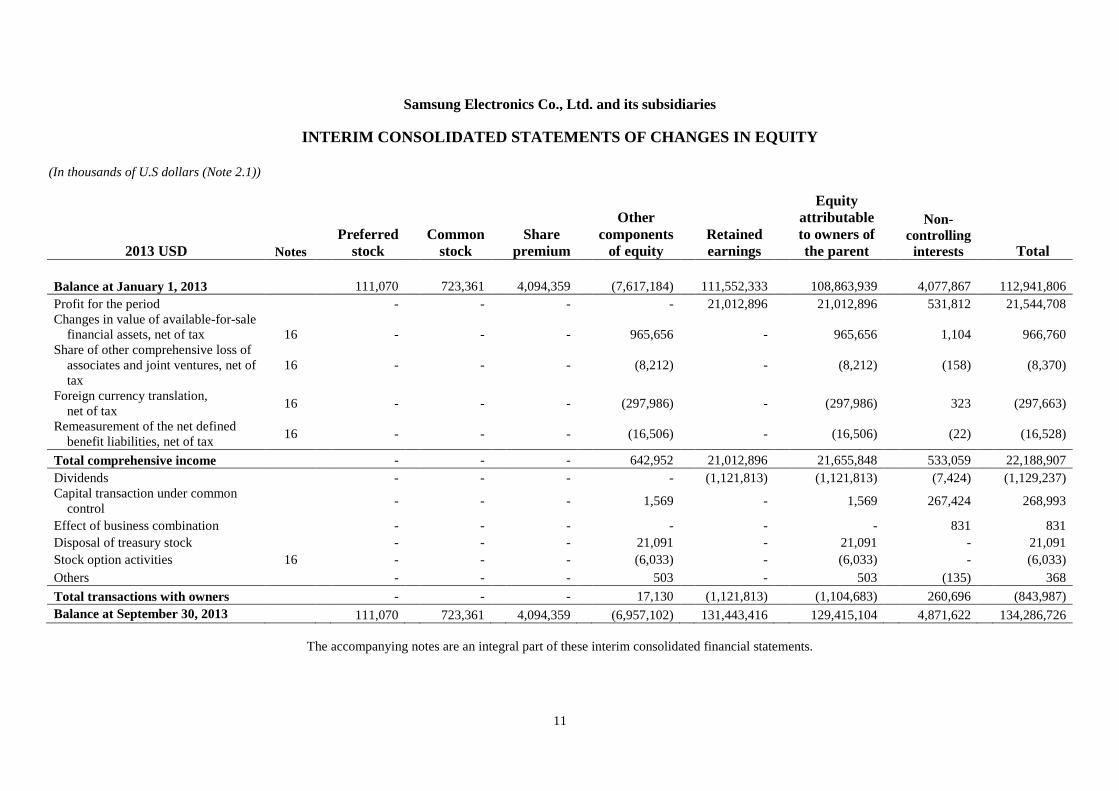
11
Samsung Electronics Co., Ltd. and its subsidiaries
INTERIM CONSOLIDATED STATEMENTS OF CHANGES IN EQUITY
(In thousands of U.S dollars (Note 2.1))
2013 USD NotesPreferred
stockCommon
stockShare
premium
Othercomponents
of equityRetainedearnings
Equityattributableto owners ofthe parent
Non-controlling
interests Total
Balance at January 1, 2013 111,070 723,361 4,094,359 (7,617,184) 111,552,333 108,863,939 4,077,867 112,941,806
Profit for the period - - - - 21,012,896 21,012,896 531,812 21,544,708Changes in value of available-for-sale
financial assets, net of tax 16 - - - 965,656 - 965,656 1,104 966,760Share of other comprehensive loss of
associates and joint ventures, net oftax
16 - - - (8,212) - (8,212) (158) (8,370)
Foreign currency translation,net of tax
16 - - - (297,986) - (297,986) 323 (297,663)
Remeasurement of the net definedbenefit liabilities, net of tax
16 - - - (16,506) - (16,506) (22) (16,528)
Total comprehensive income - - - 642,952 21,012,896 21,655,848 533,059 22,188,907
Dividends - - - - (1,121,813) (1,121,813) (7,424) (1,129,237)Capital transaction under common
control- - - 1,569 - 1,569 267,424 268,993
Effect of business combination - - - - - - 831 831
Disposal of treasury stock - - - 21,091 - 21,091 - 21,091
Stock option activities 16 - - - (6,033) - (6,033) - (6,033)
Others - - - 503 - 503 (135) 368
Total transactions with owners - - - 17,130 (1,121,813) (1,104,683) 260,696 (843,987)
Balance at September 30, 2013 111,070 723,361 4,094,359 (6,957,102) 131,443,416 129,415,104 4,871,622 134,286,726
The accompanying notes are an integral part of these interim consolidated financial statements.
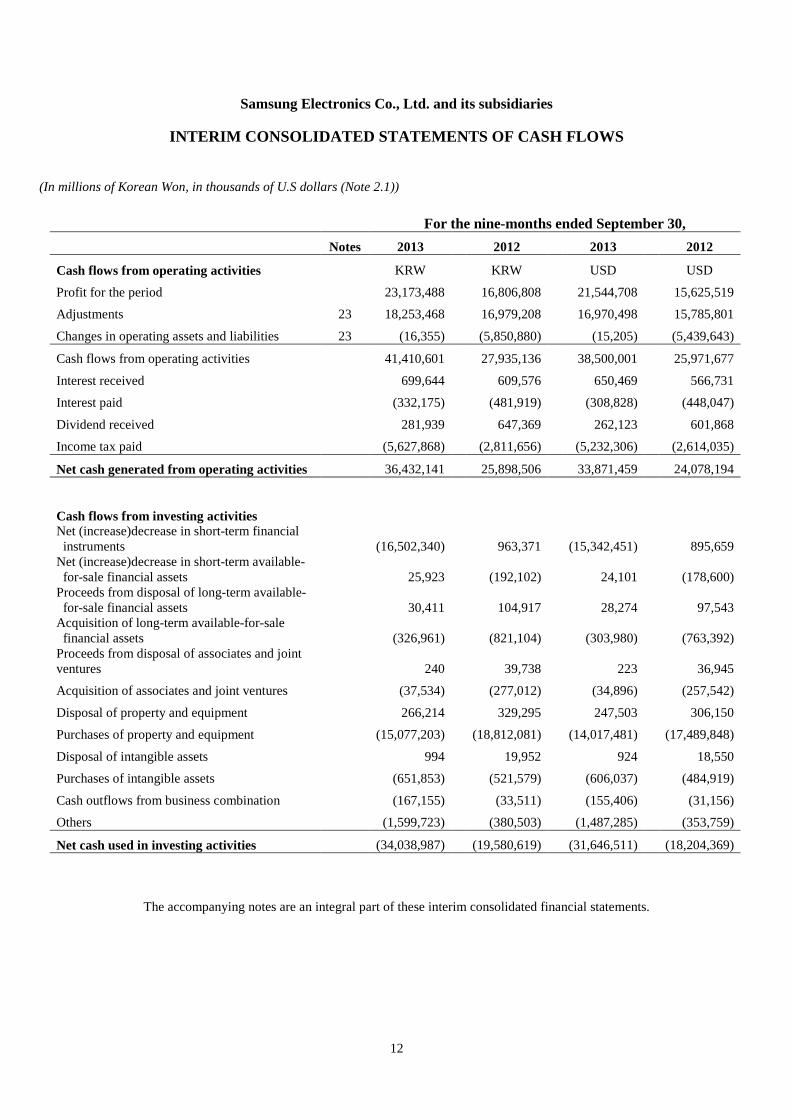
12
Samsung Electronics Co., Ltd. and its subsidiaries
INTERIM CONSOLIDATED STATEMENTS OF CASH FLOWS
(In millions of Korean Won, in thousands of U.S dollars (Note 2.1))
For the nine-months ended September 30,Notes 2013 2012 2013 2012
Cash flows from operating activities KRW KRW USD USD
Profit for the period 23,173,488 16,806,808 21,544,708 15,625,519
Adjustments 23 18,253,468 16,979,208 16,970,498 15,785,801
Changes in operating assets and liabilities 23 (16,355) (5,850,880) (15,205) (5,439,643)
Cash flows from operating activities 41,410,601 27,935,136 38,500,001 25,971,677
Interest received 699,644 609,576 650,469 566,731
Interest paid (332,175) (481,919) (308,828) (448,047)
Dividend received 281,939 647,369 262,123 601,868
Income tax paid (5,627,868) (2,811,656) (5,232,306) (2,614,035)
Net cash generated from operating activities 36,432,141 25,898,506 33,871,459 24,078,194
Cash flows from investing activitiesNet (increase)decrease in short-term financial
instruments (16,502,340) 963,371 (15,342,451) 895,659Net (increase)decrease in short-term available-
for-sale financial assets 25,923 (192,102) 24,101 (178,600)Proceeds from disposal of long-term available-
for-sale financial assets 30,411 104,917 28,274 97,543Acquisition of long-term available-for-sale
financial assets (326,961) (821,104) (303,980) (763,392)Proceeds from disposal of associates and jointventures 240 39,738 223 36,945
Acquisition of associates and joint ventures (37,534) (277,012) (34,896) (257,542)
Disposal of property and equipment 266,214 329,295 247,503 306,150
Purchases of property and equipment (15,077,203) (18,812,081) (14,017,481) (17,489,848)
Disposal of intangible assets 994 19,952 924 18,550
Purchases of intangible assets (651,853) (521,579) (606,037) (484,919)
Cash outflows from business combination (167,155) (33,511) (155,406) (31,156)
Others (1,599,723) (380,503) (1,487,285) (353,759)
Net cash used in investing activities (34,038,987) (19,580,619) (31,646,511) (18,204,369)
The accompanying notes are an integral part of these interim consolidated financial statements.
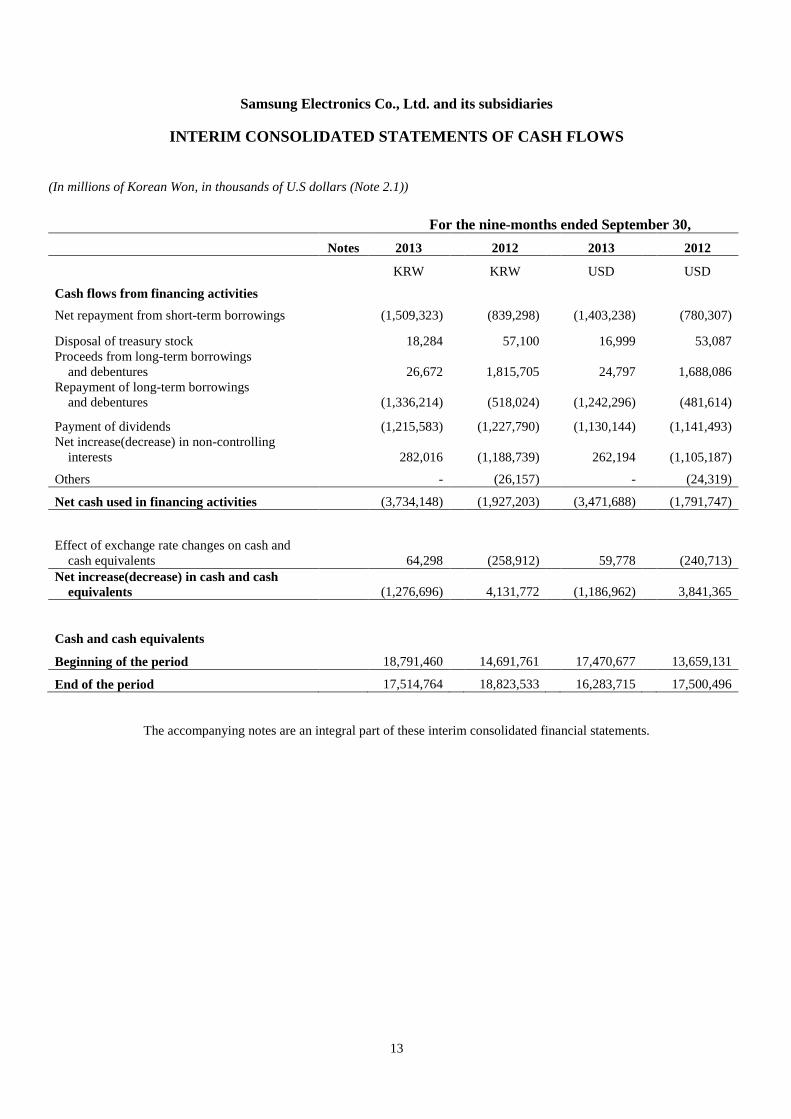
13
Samsung Electronics Co., Ltd. and its subsidiaries
INTERIM CONSOLIDATED STATEMENTS OF CASH FLOWS
(In millions of Korean Won, in thousands of U.S dollars (Note 2.1))
For the nine-months ended September 30,Notes 2013 2012 2013 2012
KRW KRW USD USD
Cash flows from financing activitiesNet repayment from short-term borrowings (1,509,323) (839,298) (1,403,238) (780,307)
Disposal of treasury stock 18,284 57,100 16,999 53,087Proceeds from long-term borrowings
and debentures 26,672 1,815,705 24,797 1,688,086Repayment of long-term borrowings
and debentures (1,336,214) (518,024) (1,242,296) (481,614)
Payment of dividends (1,215,583) (1,227,790) (1,130,144) (1,141,493)Net increase(decrease) in non-controlling
interests 282,016 (1,188,739) 262,194 (1,105,187)
Others - (26,157) - (24,319)
Net cash used in financing activities (3,734,148) (1,927,203) (3,471,688) (1,791,747)
Effect of exchange rate changes on cash andcash equivalents 64,298 (258,912) 59,778 (240,713)
Net increase(decrease) in cash and cashequivalents (1,276,696) 4,131,772 (1,186,962) 3,841,365
Cash and cash equivalents
Beginning of the period 18,791,460 14,691,761 17,470,677 13,659,131
End of the period 17,514,764 18,823,533 16,283,715 17,500,496
The accompanying notes are an integral part of these interim consolidated financial statements.
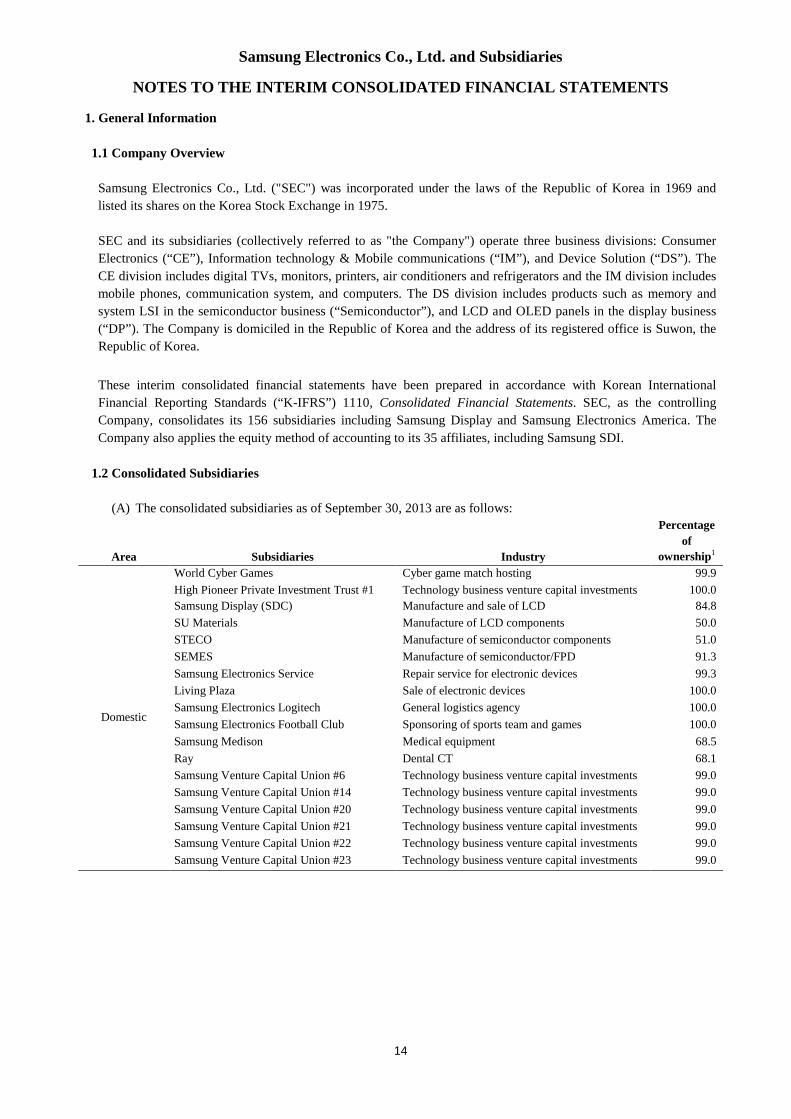
Samsung Electronics Co., Ltd. and Subsidiaries
NOTES TO THE INTERIM CONSOLIDATED FINANCIAL STATEMENTS
14
1. General Information
1.1 Company Overview
Samsung Electronics Co., Ltd. ("SEC") was incorporated under the laws of the Republic of Korea in 1969 and
listed its shares on the Korea Stock Exchange in 1975.
SEC and its subsidiaries (collectively referred to as "the Company") operate three business divisions: Consumer
Electronics (“CE”), Information technology & Mobile communications (“IM”), and Device Solution (“DS”). The
CE division includes digital TVs, monitors, printers, air conditioners and refrigerators and the IM division includes
mobile phones, communication system, and computers. The DS division includes products such as memory and
system LSI in the semiconductor business (“Semiconductor”), and LCD and OLED panels in the display business
(“DP”). The Company is domiciled in the Republic of Korea and the address of its registered office is Suwon, the
Republic of Korea.
These interim consolidated financial statements have been prepared in accordance with Korean International
Financial Reporting Standards (“K-IFRS”) 1110, Consolidated Financial Statements. SEC, as the controlling
Company, consolidates its 156 subsidiaries including Samsung Display and Samsung Electronics America. The
Company also applies the equity method of accounting to its 35 affiliates, including Samsung SDI.
1.2 Consolidated Subsidiaries
(A) The consolidated subsidiaries as of September 30, 2013 are as follows:
Area Subsidiaries Industry
Percentageof
ownership1
Domestic
World Cyber Games Cyber game match hosting 99.9
High Pioneer Private Investment Trust #1 Technology business venture capital investments 100.0
Samsung Display (SDC) Manufacture and sale of LCD 84.8
SU Materials Manufacture of LCD components 50.0
STECO Manufacture of semiconductor components 51.0
SEMES Manufacture of semiconductor/FPD 91.3
Samsung Electronics Service Repair service for electronic devices 99.3
Living Plaza Sale of electronic devices 100.0
Samsung Electronics Logitech General logistics agency 100.0
Samsung Electronics Football Club Sponsoring of sports team and games 100.0
Samsung Medison Medical equipment 68.5
Ray Dental CT 68.1
Samsung Venture Capital Union #6 Technology business venture capital investments 99.0
Samsung Venture Capital Union #14 Technology business venture capital investments 99.0
Samsung Venture Capital Union #20 Technology business venture capital investments 99.0
Samsung Venture Capital Union #21 Technology business venture capital investments 99.0
Samsung Venture Capital Union #22 Technology business venture capital investments 99.0
Samsung Venture Capital Union #23 Technology business venture capital investments 99.0
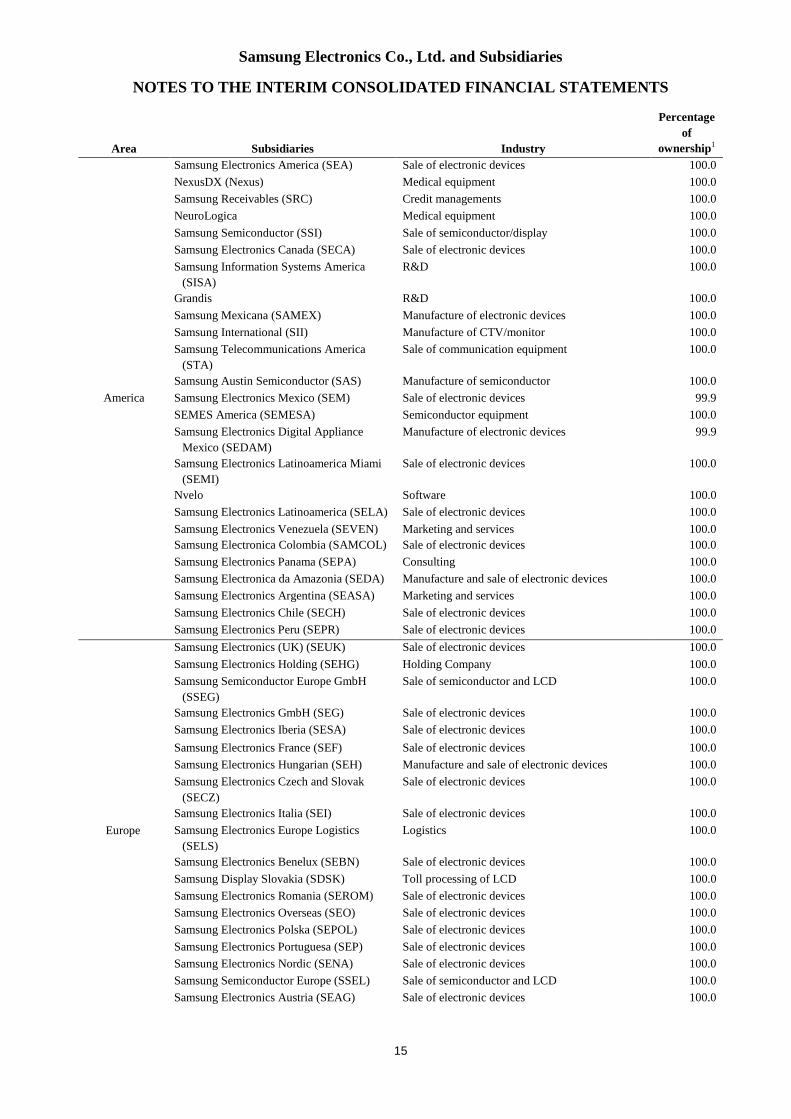
Samsung Electronics Co., Ltd. and Subsidiaries
NOTES TO THE INTERIM CONSOLIDATED FINANCIAL STATEMENTS
15
Area Subsidiaries Industry
Percentageof
ownership1
America
Samsung Electronics America (SEA) Sale of electronic devices 100.0
NexusDX (Nexus) Medical equipment 100.0
Samsung Receivables (SRC) Credit managements 100.0
NeuroLogica Medical equipment 100.0
Samsung Semiconductor (SSI) Sale of semiconductor/display 100.0
Samsung Electronics Canada (SECA) Sale of electronic devices 100.0
Samsung Information Systems America
(SISA)
R&D 100.0
Grandis R&D 100.0
Samsung Mexicana (SAMEX) Manufacture of electronic devices 100.0
Samsung International (SII) Manufacture of CTV/monitor 100.0
Samsung Telecommunications America
(STA)
Sale of communication equipment 100.0
Samsung Austin Semiconductor (SAS) Manufacture of semiconductor 100.0
Samsung Electronics Mexico (SEM) Sale of electronic devices 99.9
SEMES America (SEMESA) Semiconductor equipment 100.0
Samsung Electronics Digital Appliance
Mexico (SEDAM)
Manufacture of electronic devices 99.9
Samsung Electronics Latinoamerica Miami
(SEMI)
Sale of electronic devices 100.0
Nvelo Software 100.0
Samsung Electronics Latinoamerica (SELA) Sale of electronic devices 100.0
Samsung Electronics Venezuela (SEVEN) Marketing and services 100.0
Samsung Electronica Colombia (SAMCOL) Sale of electronic devices 100.0
Samsung Electronics Panama (SEPA) Consulting 100.0
Samsung Electronica da Amazonia (SEDA) Manufacture and sale of electronic devices 100.0
Samsung Electronics Argentina (SEASA) Marketing and services 100.0
Samsung Electronics Chile (SECH) Sale of electronic devices 100.0
Samsung Electronics Peru (SEPR) Sale of electronic devices 100.0
Europe
Samsung Electronics (UK) (SEUK) Sale of electronic devices 100.0
Samsung Electronics Holding (SEHG) Holding Company 100.0
Samsung Semiconductor Europe GmbH
(SSEG)
Sale of semiconductor and LCD 100.0
Samsung Electronics GmbH (SEG) Sale of electronic devices 100.0
Samsung Electronics Iberia (SESA) Sale of electronic devices 100.0
Samsung Electronics France (SEF) Sale of electronic devices 100.0
Samsung Electronics Hungarian (SEH) Manufacture and sale of electronic devices 100.0
Samsung Electronics Czech and Slovak
(SECZ)
Sale of electronic devices 100.0
Samsung Electronics Italia (SEI) Sale of electronic devices 100.0
Samsung Electronics Europe Logistics
(SELS)
Logistics 100.0
Samsung Electronics Benelux (SEBN) Sale of electronic devices 100.0
Samsung Display Slovakia (SDSK) Toll processing of LCD 100.0
Samsung Electronics Romania (SEROM) Sale of electronic devices 100.0
Samsung Electronics Overseas (SEO) Sale of electronic devices 100.0
Samsung Electronics Polska (SEPOL) Sale of electronic devices 100.0
Samsung Electronics Portuguesa (SEP) Sale of electronic devices 100.0
Samsung Electronics Nordic (SENA) Sale of electronic devices 100.0
Samsung Semiconductor Europe (SSEL) Sale of semiconductor and LCD 100.0
Samsung Electronics Austria (SEAG) Sale of electronic devices 100.0
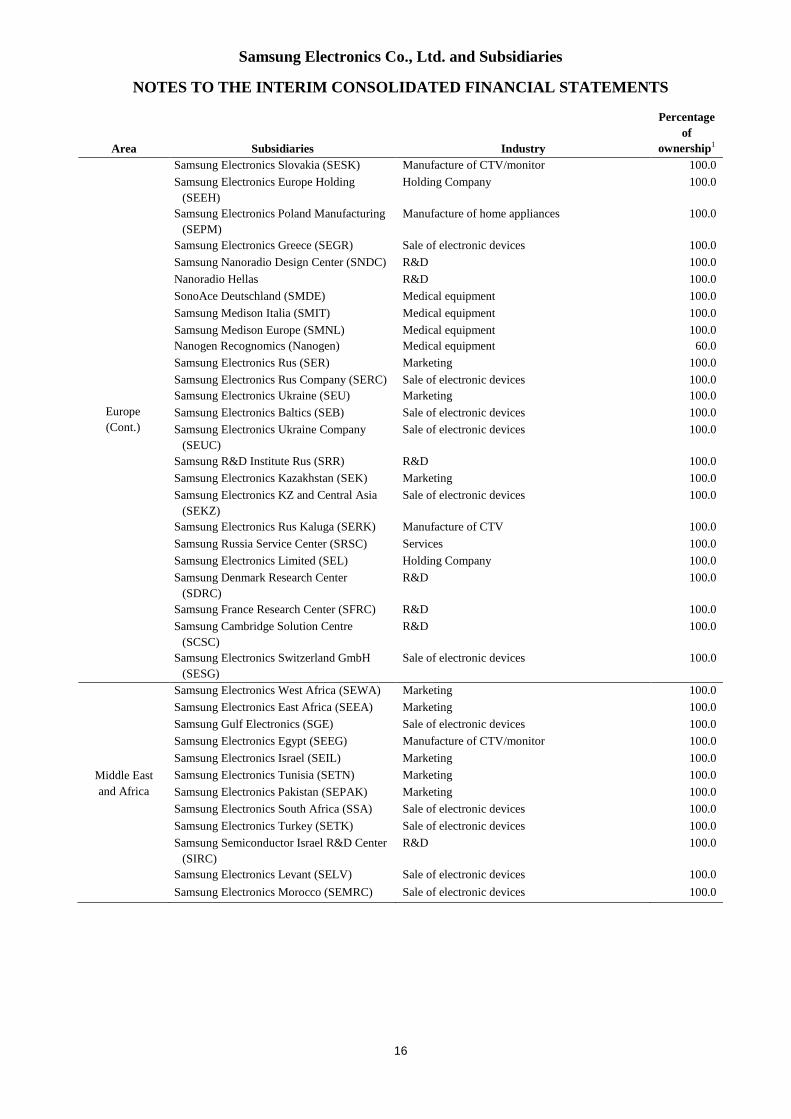
Samsung Electronics Co., Ltd. and Subsidiaries
NOTES TO THE INTERIM CONSOLIDATED FINANCIAL STATEMENTS
16
Area Subsidiaries Industry
Percentageof
ownership1
Europe
(Cont.)
Samsung Electronics Slovakia (SESK) Manufacture of CTV/monitor 100.0
Samsung Electronics Europe Holding
(SEEH)
Holding Company 100.0
Samsung Electronics Poland Manufacturing
(SEPM)
Manufacture of home appliances 100.0
Samsung Electronics Greece (SEGR) Sale of electronic devices 100.0
Samsung Nanoradio Design Center (SNDC) R&D 100.0
Nanoradio Hellas R&D 100.0
SonoAce Deutschland (SMDE) Medical equipment 100.0
Samsung Medison Italia (SMIT) Medical equipment 100.0
Samsung Medison Europe (SMNL) Medical equipment 100.0
Nanogen Recognomics (Nanogen) Medical equipment 60.0
Samsung Electronics Rus (SER) Marketing 100.0
Samsung Electronics Rus Company (SERC) Sale of electronic devices 100.0
Samsung Electronics Ukraine (SEU) Marketing 100.0
Samsung Electronics Baltics (SEB) Sale of electronic devices 100.0
Samsung Electronics Ukraine Company
(SEUC)
Sale of electronic devices 100.0
Samsung R&D Institute Rus (SRR) R&D 100.0
Samsung Electronics Kazakhstan (SEK) Marketing 100.0
Samsung Electronics KZ and Central Asia
(SEKZ)
Sale of electronic devices 100.0
Samsung Electronics Rus Kaluga (SERK) Manufacture of CTV 100.0
Samsung Russia Service Center (SRSC) Services 100.0
Samsung Electronics Limited (SEL) Holding Company 100.0
Samsung Denmark Research Center
(SDRC)
R&D 100.0
Samsung France Research Center (SFRC) R&D 100.0
Samsung Cambridge Solution Centre
(SCSC)
R&D 100.0
Samsung Electronics Switzerland GmbH
(SESG)
Sale of electronic devices 100.0
Middle East
and Africa
Samsung Electronics West Africa (SEWA) Marketing 100.0
Samsung Electronics East Africa (SEEA) Marketing 100.0
Samsung Gulf Electronics (SGE) Sale of electronic devices 100.0
Samsung Electronics Egypt (SEEG) Manufacture of CTV/monitor 100.0
Samsung Electronics Israel (SEIL) Marketing 100.0
Samsung Electronics Tunisia (SETN) Marketing 100.0
Samsung Electronics Pakistan (SEPAK) Marketing 100.0
Samsung Electronics South Africa (SSA) Sale of electronic devices 100.0
Samsung Electronics Turkey (SETK) Sale of electronic devices 100.0
Samsung Semiconductor Israel R&D Center
(SIRC)
R&D 100.0
Samsung Electronics Levant (SELV) Sale of electronic devices 100.0
Samsung Electronics Morocco (SEMRC) Sale of electronic devices 100.0
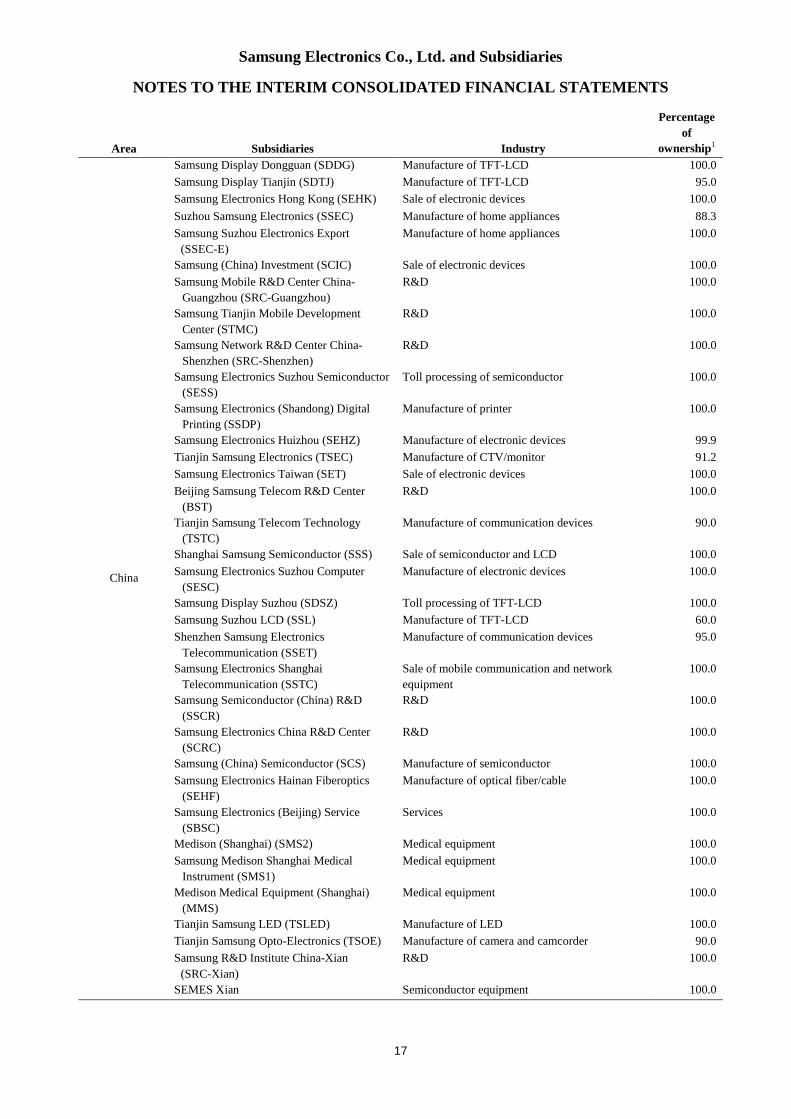
Samsung Electronics Co., Ltd. and Subsidiaries
NOTES TO THE INTERIM CONSOLIDATED FINANCIAL STATEMENTS
17
Area Subsidiaries Industry
Percentageof
ownership1
China
Samsung Display Dongguan (SDDG) Manufacture of TFT-LCD 100.0
Samsung Display Tianjin (SDTJ) Manufacture of TFT-LCD 95.0
Samsung Electronics Hong Kong (SEHK) Sale of electronic devices 100.0
Suzhou Samsung Electronics (SSEC) Manufacture of home appliances 88.3
Samsung Suzhou Electronics Export
(SSEC-E)
Manufacture of home appliances 100.0
Samsung (China) Investment (SCIC) Sale of electronic devices 100.0
Samsung Mobile R&D Center China-
Guangzhou (SRC-Guangzhou)
R&D 100.0
Samsung Tianjin Mobile Development
Center (STMC)
R&D 100.0
Samsung Network R&D Center China-
Shenzhen (SRC-Shenzhen)
R&D 100.0
Samsung Electronics Suzhou Semiconductor
(SESS)
Toll processing of semiconductor 100.0
Samsung Electronics (Shandong) Digital
Printing (SSDP)
Manufacture of printer 100.0
Samsung Electronics Huizhou (SEHZ) Manufacture of electronic devices 99.9
Tianjin Samsung Electronics (TSEC) Manufacture of CTV/monitor 91.2
Samsung Electronics Taiwan (SET) Sale of electronic devices 100.0
Beijing Samsung Telecom R&D Center
(BST)
R&D 100.0
Tianjin Samsung Telecom Technology
(TSTC)
Manufacture of communication devices 90.0
Shanghai Samsung Semiconductor (SSS) Sale of semiconductor and LCD 100.0
Samsung Electronics Suzhou Computer
(SESC)
Manufacture of electronic devices 100.0
Samsung Display Suzhou (SDSZ) Toll processing of TFT-LCD 100.0
Samsung Suzhou LCD (SSL) Manufacture of TFT-LCD 60.0
Shenzhen Samsung Electronics
Telecommunication (SSET)
Manufacture of communication devices 95.0
Samsung Electronics Shanghai
Telecommunication (SSTC)
Sale of mobile communication and network
equipment
100.0
Samsung Semiconductor (China) R&D
(SSCR)
R&D 100.0
Samsung Electronics China R&D Center
(SCRC)
R&D 100.0
Samsung (China) Semiconductor (SCS) Manufacture of semiconductor 100.0
Samsung Electronics Hainan Fiberoptics
(SEHF)
Manufacture of optical fiber/cable 100.0
Samsung Electronics (Beijing) Service
(SBSC)
Services 100.0
Medison (Shanghai) (SMS2) Medical equipment 100.0
Samsung Medison Shanghai Medical
Instrument (SMS1)
Medical equipment 100.0
Medison Medical Equipment (Shanghai)
(MMS)
Medical equipment 100.0
Tianjin Samsung LED (TSLED) Manufacture of LED 100.0
Tianjin Samsung Opto-Electronics (TSOE) Manufacture of camera and camcorder 90.0
Samsung R&D Institute China-Xian
(SRC-Xian)
R&D 100.0
SEMES Xian Semiconductor equipment 100.0
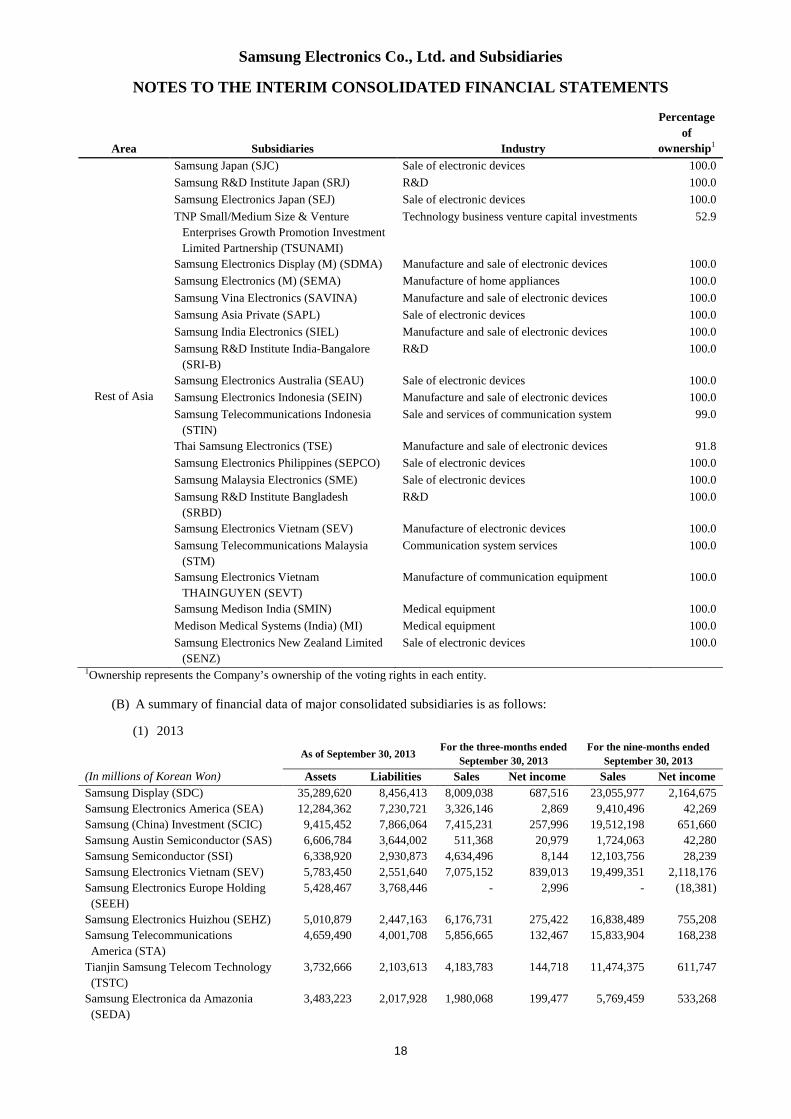
Samsung Electronics Co., Ltd. and Subsidiaries
NOTES TO THE INTERIM CONSOLIDATED FINANCIAL STATEMENTS
18
Area Subsidiaries Industry
Percentageof
ownership1
Rest of Asia
Samsung Japan (SJC) Sale of electronic devices 100.0
Samsung R&D Institute Japan (SRJ) R&D 100.0
Samsung Electronics Japan (SEJ) Sale of electronic devices 100.0
TNP Small/Medium Size & Venture
Enterprises Growth Promotion Investment
Limited Partnership (TSUNAMI)
Technology business venture capital investments 52.9
Samsung Electronics Display (M) (SDMA) Manufacture and sale of electronic devices 100.0
Samsung Electronics (M) (SEMA) Manufacture of home appliances 100.0
Samsung Vina Electronics (SAVINA) Manufacture and sale of electronic devices 100.0
Samsung Asia Private (SAPL) Sale of electronic devices 100.0
Samsung India Electronics (SIEL) Manufacture and sale of electronic devices 100.0
Samsung R&D Institute India-Bangalore
(SRI-B)
R&D 100.0
Samsung Electronics Australia (SEAU) Sale of electronic devices 100.0
Samsung Electronics Indonesia (SEIN) Manufacture and sale of electronic devices 100.0
Samsung Telecommunications Indonesia
(STIN)
Sale and services of communication system 99.0
Thai Samsung Electronics (TSE) Manufacture and sale of electronic devices 91.8
Samsung Electronics Philippines (SEPCO) Sale of electronic devices 100.0
Samsung Malaysia Electronics (SME) Sale of electronic devices 100.0
Samsung R&D Institute Bangladesh
(SRBD)
R&D 100.0
Samsung Electronics Vietnam (SEV) Manufacture of electronic devices 100.0
Samsung Telecommunications Malaysia
(STM)
Communication system services 100.0
Samsung Electronics Vietnam
THAINGUYEN (SEVT)
Manufacture of communication equipment 100.0
Samsung Medison India (SMIN) Medical equipment 100.0
Medison Medical Systems (India) (MI) Medical equipment 100.0
Samsung Electronics New Zealand Limited
(SENZ)
Sale of electronic devices 100.0
1Ownership represents the Company’s ownership of the voting rights in each entity.
(B) A summary of financial data of major consolidated subsidiaries is as follows:
(1) 2013
As of September 30, 2013 For the three-months endedSeptember 30, 2013
For the nine-months endedSeptember 30, 2013
(In millions of Korean Won) Assets Liabilities Sales Net income Sales Net incomeSamsung Display (SDC) 35,289,620 8,456,413 8,009,038 687,516 23,055,977 2,164,675
Samsung Electronics America (SEA) 12,284,362 7,230,721 3,326,146 2,869 9,410,496 42,269
Samsung (China) Investment (SCIC) 9,415,452 7,866,064 7,415,231 257,996 19,512,198 651,660
Samsung Austin Semiconductor (SAS) 6,606,784 3,644,002 511,368 20,979 1,724,063 42,280
Samsung Semiconductor (SSI) 6,338,920 2,930,873 4,634,496 8,144 12,103,756 28,239
Samsung Electronics Vietnam (SEV) 5,783,450 2,551,640 7,075,152 839,013 19,499,351 2,118,176
Samsung Electronics Europe Holding
(SEEH)
5,428,467 3,768,446 - 2,996 - (18,381)
Samsung Electronics Huizhou (SEHZ) 5,010,879 2,447,163 6,176,731 275,422 16,838,489 755,208
Samsung Telecommunications
America (STA)
4,659,490 4,001,708 5,856,665 132,467 15,833,904 168,238
Tianjin Samsung Telecom Technology
(TSTC)
3,732,666 2,103,613 4,183,783 144,718 11,474,375 611,747
Samsung Electronica da Amazonia
(SEDA)
3,483,223 2,017,928 1,980,068 199,477 5,769,459 533,268
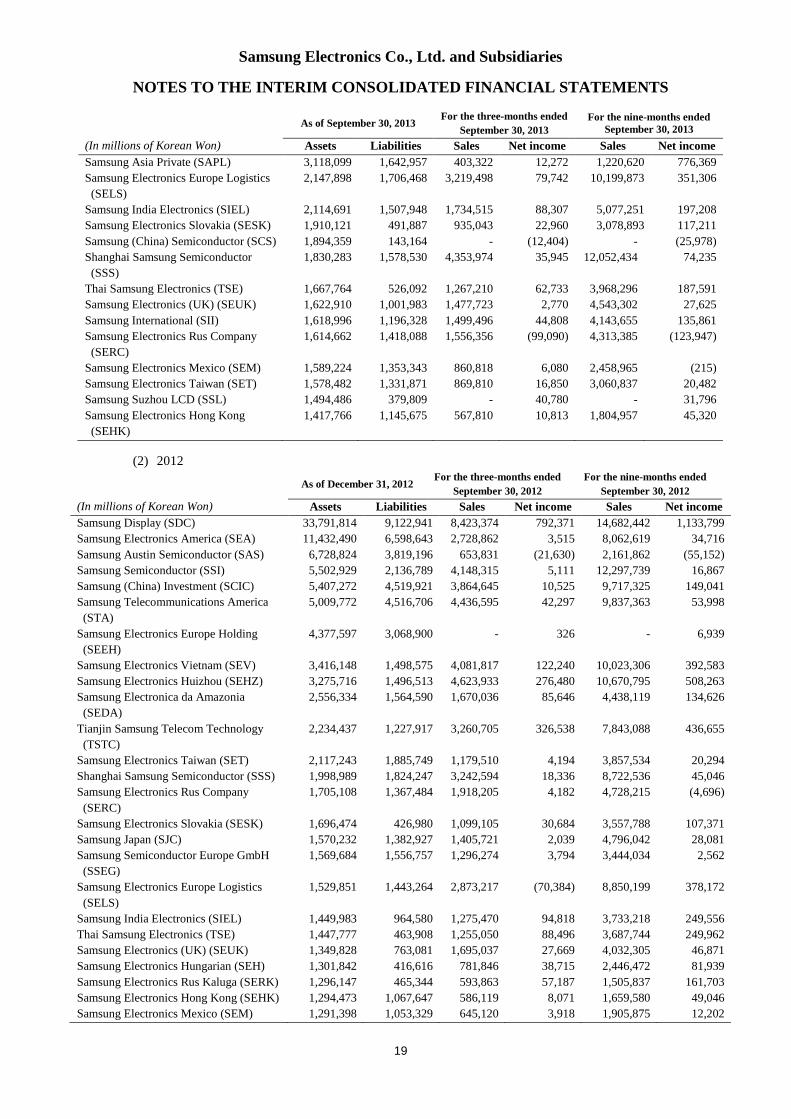
Samsung Electronics Co., Ltd. and Subsidiaries
NOTES TO THE INTERIM CONSOLIDATED FINANCIAL STATEMENTS
19
(In millions of Korean Won)
As of September 30, 2013 For the three-months endedSeptember 30, 2013
For the nine-months endedSeptember 30, 2013
Assets Liabilities Sales Net income Sales Net incomeSamsung Asia Private (SAPL) 3,118,099 1,642,957 403,322 12,272 1,220,620 776,369
Samsung Electronics Europe Logistics
(SELS)
2,147,898 1,706,468 3,219,498 79,742 10,199,873 351,306
Samsung India Electronics (SIEL) 2,114,691 1,507,948 1,734,515 88,307 5,077,251 197,208
Samsung Electronics Slovakia (SESK) 1,910,121 491,887 935,043 22,960 3,078,893 117,211
Samsung (China) Semiconductor (SCS) 1,894,359 143,164 - (12,404) - (25,978)
Shanghai Samsung Semiconductor
(SSS)
1,830,283 1,578,530 4,353,974 35,945 12,052,434 74,235
Thai Samsung Electronics (TSE) 1,667,764 526,092 1,267,210 62,733 3,968,296 187,591
Samsung Electronics (UK) (SEUK) 1,622,910 1,001,983 1,477,723 2,770 4,543,302 27,625
Samsung International (SII) 1,618,996 1,196,328 1,499,496 44,808 4,143,655 135,861
Samsung Electronics Rus Company
(SERC)
1,614,662 1,418,088 1,556,356 (99,090) 4,313,385 (123,947)
Samsung Electronics Mexico (SEM) 1,589,224 1,353,343 860,818 6,080 2,458,965 (215)
Samsung Electronics Taiwan (SET) 1,578,482 1,331,871 869,810 16,850 3,060,837 20,482
Samsung Suzhou LCD (SSL) 1,494,486 379,809 - 40,780 - 31,796
Samsung Electronics Hong Kong
(SEHK)
1,417,766 1,145,675 567,810 10,813 1,804,957 45,320
(2) 2012
As of December 31, 2012For the three-months ended
September 30, 2012For the nine-months ended
September 30, 2012(In millions of Korean Won) Assets Liabilities Sales Net income Sales Net incomeSamsung Display (SDC) 33,791,814 9,122,941 8,423,374 792,371 14,682,442 1,133,799
Samsung Electronics America (SEA) 11,432,490 6,598,643 2,728,862 3,515 8,062,619 34,716
Samsung Austin Semiconductor (SAS) 6,728,824 3,819,196 653,831 (21,630) 2,161,862 (55,152)
Samsung Semiconductor (SSI) 5,502,929 2,136,789 4,148,315 5,111 12,297,739 16,867
Samsung (China) Investment (SCIC) 5,407,272 4,519,921 3,864,645 10,525 9,717,325 149,041
Samsung Telecommunications America
(STA)
5,009,772 4,516,706 4,436,595 42,297 9,837,363 53,998
Samsung Electronics Europe Holding
(SEEH)
4,377,597 3,068,900 - 326 - 6,939
Samsung Electronics Vietnam (SEV) 3,416,148 1,498,575 4,081,817 122,240 10,023,306 392,583
Samsung Electronics Huizhou (SEHZ) 3,275,716 1,496,513 4,623,933 276,480 10,670,795 508,263
Samsung Electronica da Amazonia
(SEDA)
2,556,334 1,564,590 1,670,036 85,646 4,438,119 134,626
Tianjin Samsung Telecom Technology
(TSTC)
2,234,437 1,227,917 3,260,705 326,538 7,843,088 436,655
Samsung Electronics Taiwan (SET) 2,117,243 1,885,749 1,179,510 4,194 3,857,534 20,294
Shanghai Samsung Semiconductor (SSS) 1,998,989 1,824,247 3,242,594 18,336 8,722,536 45,046
Samsung Electronics Rus Company
(SERC)
1,705,108 1,367,484 1,918,205 4,182 4,728,215 (4,696)
Samsung Electronics Slovakia (SESK) 1,696,474 426,980 1,099,105 30,684 3,557,788 107,371
Samsung Japan (SJC) 1,570,232 1,382,927 1,405,721 2,039 4,796,042 28,081
Samsung Semiconductor Europe GmbH
(SSEG)
1,569,684 1,556,757 1,296,274 3,794 3,444,034 2,562
Samsung Electronics Europe Logistics
(SELS)
1,529,851 1,443,264 2,873,217 (70,384) 8,850,199 378,172
Samsung India Electronics (SIEL) 1,449,983 964,580 1,275,470 94,818 3,733,218 249,556
Thai Samsung Electronics (TSE) 1,447,777 463,908 1,255,050 88,496 3,687,744 249,962
Samsung Electronics (UK) (SEUK) 1,349,828 763,081 1,695,037 27,669 4,032,305 46,871
Samsung Electronics Hungarian (SEH) 1,301,842 416,616 781,846 38,715 2,446,472 81,939
Samsung Electronics Rus Kaluga (SERK) 1,296,147 465,344 593,863 57,187 1,505,837 161,703
Samsung Electronics Hong Kong (SEHK) 1,294,473 1,067,647 586,119 8,071 1,659,580 49,046
Samsung Electronics Mexico (SEM) 1,291,398 1,053,329 645,120 3,918 1,905,875 12,202
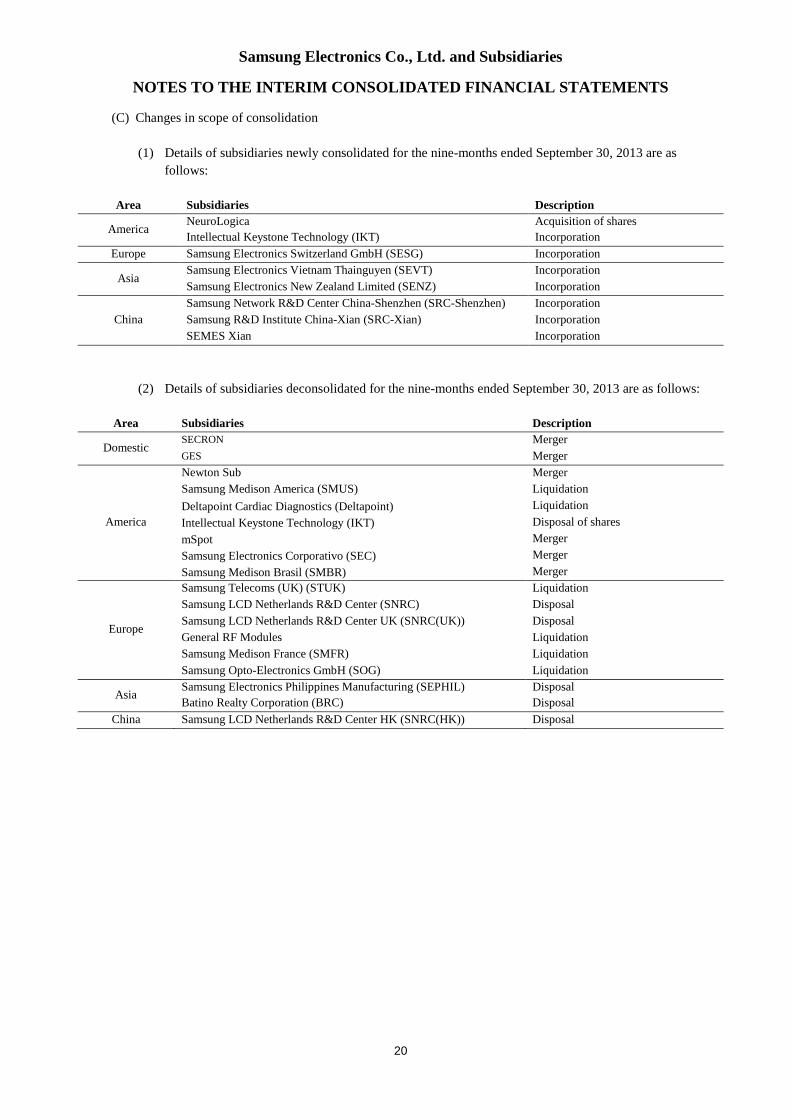
Samsung Electronics Co., Ltd. and Subsidiaries
NOTES TO THE INTERIM CONSOLIDATED FINANCIAL STATEMENTS
20
(C) Changes in scope of consolidation
(1) Details of subsidiaries newly consolidated for the nine-months ended September 30, 2013 are as
follows:
Area Subsidiaries Description
AmericaNeuroLogica
Intellectual Keystone Technology (IKT)
Acquisition of shares
Incorporation
Europe Samsung Electronics Switzerland GmbH (SESG) Incorporation
AsiaSamsung Electronics Vietnam Thainguyen (SEVT) Incorporation
Samsung Electronics New Zealand Limited (SENZ) Incorporation
China
Samsung Network R&D Center China-Shenzhen (SRC-Shenzhen) Incorporation
Samsung R&D Institute China-Xian (SRC-Xian) Incorporation
SEMES Xian Incorporation
(2) Details of subsidiaries deconsolidated for the nine-months ended September 30, 2013 are as follows:
Area Subsidiaries Description
DomesticSECRON Merger
GES Merger
America
Newton Sub Merger
Samsung Medison America (SMUS) Liquidation
Deltapoint Cardiac Diagnostics (Deltapoint) Liquidation
Intellectual Keystone Technology (IKT) Disposal of shares
mSpot Merger
Samsung Electronics Corporativo (SEC) Merger
Samsung Medison Brasil (SMBR) Merger
Europe
Samsung Telecoms (UK) (STUK) Liquidation
Samsung LCD Netherlands R&D Center (SNRC) Disposal
Samsung LCD Netherlands R&D Center UK (SNRC(UK)) Disposal
General RF Modules Liquidation
Samsung Medison France (SMFR) Liquidation
Samsung Opto-Electronics GmbH (SOG) Liquidation
AsiaSamsung Electronics Philippines Manufacturing (SEPHIL)
Batino Realty Corporation (BRC)
Disposal
Disposal
China Samsung LCD Netherlands R&D Center HK (SNRC(HK)) Disposal
Samsung Electronics Co., Ltd. and Subsidiaries
NOTES TO THE INTERIM CONSOLIDATED FINANCIAL STATEMENTS
21
2. Summary of Significant Accounting Policies
2.1 Convenience Translation into United States Dollar Amounts
The Company operates primarily in Korean Won and its official accounting records are maintained in Korean
Won. The U.S. dollar amounts provided in the financial statements represent supplementary information solely for
the convenience of the reader. All Won amounts are expressed in U.S. dollars at the rate of ₩1,075.6 to US $1,
the exchange rate in effect on September 30, 2013. Such presentation is not in accordance with generally accepted
accounting principles, and should not be construed as a representation that the Won amounts shown could be
readily converted, realized or settled in U.S. dollars at this or at any other rate.
2.2 Basis of Presentation
The interim consolidated financial information has been prepared in accordance with International Financial
Reporting Standards as adopted by Korea ("K-IFRS") effective or early adopted as of September 30, 2013. This
interim consolidated financial information for the nine-months ended September 30, 2013 has been prepared in
accordance with K-IFRS 1034, Interim Financial Reporting.
Changes in accounting policies applied in the financial year beginning on January 1, 2013 are set out below:
K-IFRS 1110, ‘Consolidated financial statements’
The standard supersedes K-IFRS 1027, ‘Consolidated and separate financial statements’ and K-IFRS
Interpretations 2012, ‘Consolidation: special purpose entities’.
The standard explains the principle of control which is the basis for determining which entities are consolidated
in the consolidated financial statements. An investor controls an investee when it is exposed, or has rights, to
variable returns from its involvement with the investee and has the ability to affect those returns through its
power over the investee. The standard sets out further guidance where it is difficult to determine control. The
adoption of this standard did not have an impact on consolidation scope in the interim consolidated financial
statements.
K-IFRS 1111, ‘Joint arrangements’
The standard reflects the substance of joint arrangements and focuses on the rights and obligations of the parties
to the joint arrangements rather than on the legal forms of the arrangements. The standard classifies joint
arrangements into joint operations and joint ventures. A joint operation is a joint arrangement whereby the parties
that have joint control of the arrangement (i.e. joint operators) have rights to the assets and obligations for the
liabilities relating to the arrangement. A joint operator accounts for the assets, liabilities, revenues and expenses
in relation to its interest in the arrangement. A joint venture is a joint arrangement whereby the parties that have
joint control of the arrangement (i.e. joint venturers) have rights to the net assets of the arrangement. Joint
venturers account for the investment using the equity method. The adoption of this standard did not have an
impact on the interim consolidated financial statements.
K-IFRS 1112, ‘Disclosure of interests in other entities’
The standard provides disclosure requirements for all types of equity investments in other entities including
subsidiaries, joint arrangements, associates, consolidated structured entities and unconsolidated structured
entities.
Samsung Electronics Co., Ltd. and Subsidiaries
NOTES TO THE INTERIM CONSOLIDATED FINANCIAL STATEMENTS
22
K-IFRS 1027, ‘Separate Financial Statements’
The standard is issued concurrently with K-IFRS 1110, ‘Consolidated Financial Statements’, which addresses
the principle of control and requirements relating to the preparation of consolidated financial statements. As a
result, K-IFRS 1027 now contains requirements for investments in subsidiaries, joint ventures and associates
relating only to separate financial statements.
K-IFRS 1113, ‘Fair value measurement’
The standard aims to improve consistency and reduce complexity by providing a precise definition of fair value
and a single source of fair value measurement and disclosure requirements for use across K-IFRS. K-IFRS 1113,
Fair value measurement (“K-IFRS 1113”) does not extend the use of fair value accounting but provides
guidance on how it should be applied where its use is already required or permitted by other standards within the
K-IFRS. The Company has applied K-IFRS 1113 prospectively for the financial year beginning on January 1,
2013 and there is no material impact of the application of this amendment on the interim consolidated financial
statements.
2.3 Accounting Policies
Significant accounting policies and estimates adopted in the preparation and presentation of the interim
consolidated financial statements are consistent with the accounting policies and estimates adopted for the annual
consolidated financial statements for the year ended December 31, 2012, except changes in accounting policies
applied in the financial year beginning on January 1, 2013 and as described below.
Income tax expense for the interim period is recognized based on management’s best estimate of the weighted
average annual income tax rate expected for the full financial year. The estimated average annual tax rate is
applied to the pre-tax income.
2.4 Significant Accounting Estimates and Assumptions
In preparing the interim consolidated financial statements, the management of the Company makes estimates and
assumptions on matters which affect the application of policies and reported amounts of assets, liabilities, income
and expenses. The estimates and underlying assumptions are reviewed on an ongoing basis and are based on
historical experience and various other factors that are believed to be reasonable under the circumstances. Actual
results may differ from these estimates.
Significant estimation methodologies and assumptions made in the preparation of interim consolidated financial
statements are consistent with those made in the preparation of the annual consolidated financial statements for the
year ended December 31, 2012, except for the methodologies and assumptions made in deriving corporate income
tax.
Samsung Electronics Co., Ltd. and Subsidiaries
NOTES TO THE INTERIM CONSOLIDATED FINANCIAL STATEMENTS
23
3. Financial Instruments by Category
Financial instruments by category consist of the following:
(1) As of September 30, 2013
(In millions of Korean Won)
Assets at fairvalue throughthe profit and
lossLoans
and receivables
Available-for-sale financial
assets Total
AssetsCash and cash equivalents ₩ - ₩ 17,514,764 ₩ - ₩ 17,514,764
Short-term financial instruments - 33,911,790 - 33,911,790
Short-term available-for-sale financial
assets- - 1,257,086 1,257,086
Trade and other receivables - 28,792,214 - 28,792,214
Long-term available-for-sale financial
assets- - 6,969,180 6,969,180
Others 76,604 5,065,208 - 5,141,812
Total ₩ 76,604 ₩ 85,283,976 ₩ 8,226,266 ₩ 93,586,846
(In millions of Korean Won)
Liabilities at fairvalue through the
profit and loss
Financial liabilitiesmeasured at
amortized cost
Otherfinancialliabilities Total
LiabilitiesTrade and other payables ₩ - ₩ 20,419,343 ₩ - ₩ 20,419,343
Short-term borrowings - 3,770,244 3,084,849 6,855,093
Accrued expenses - 9,883,404 - 9,883,404
Debentures - 1,836,936 - 1,836,936
Long-term borrowings - 1,701,932 - 1,701,932
Long-term other payables - 968,238 - 968,238
Others 188,778 1,664,384 - 1,853,162
Total ₩ 188,778 ₩ 40,244,481 ₩ 3,084,849 ₩ 43,518,108
Samsung Electronics Co., Ltd. and Subsidiaries
NOTES TO THE INTERIM CONSOLIDATED FINANCIAL STATEMENTS
24
(2) As of December 31, 2012
(In millions of Korean Won)
Assets at fairvalue throughthe profit and
lossLoans
and receivables
Available-for-sale financial
assets Total
AssetsCash and cash equivalents ₩ - ₩ 18,791,460 ₩ - ₩ 18,791,460
Short-term financial instruments - 17,397,937 - 17,397,937
Short-term available-for-sale financial
assets
- - 1,258,874 1,258,874
Trade and other receivables - 26,674,596 - 26,674,596
Long-term available-for-sale financial
assets
- - 5,229,175 5,229,175
Others 47,227 2,871,681 - 2,918,908
Total ₩ 47,227 ₩ 65,735,674 ₩ 6,488,049 ₩ 72,270,950
(In millions of Korean Won)
Liabilities atfair value
through theprofit and loss
Financialliabilities
measured atamortized cost
Otherfinancialliabilities Total
LiabilitiesTrade and other payables ₩ - ₩ 16,889,350 ₩ - ₩ 16,889,350
Short-term borrowings - 4,115,249 4,328,503 8,443,752
Accrued expenses - 9,495,156 - 9,495,156
Debentures - 1,829,374 - 1,829,374
Long-term borrowings - 3,623,028 - 3,623,028
Long-term other payables - 1,165,881 - 1,165,881
Others 79,212 1,293,667 - 1,372,879
Total ₩ 79,212 ₩ 38,411,705 ₩ 4,328,503 ₩ 42,819,420
4. Long-term Available-for-Sale Financial Assets
(A) Long-term available-for-sale financial assets as of September 30, 2013 and December 31, 2012 are as
follows:
(In millions of Korean Won) September 30, 2013 December 31, 2012Equity securities - Listed ₩ 6,044,345 ₩ 4,435,856
Equity securities - Unlisted 790,800 667,325
Debt securities1134,035 125,994
Total ₩ 6,969,180 ₩ 5,229,175
1The maximum exposure to credit risk of debt securities that are available-for-sale financial assets is the carrying value as of
September 30, 2013 and December 31, 2012.
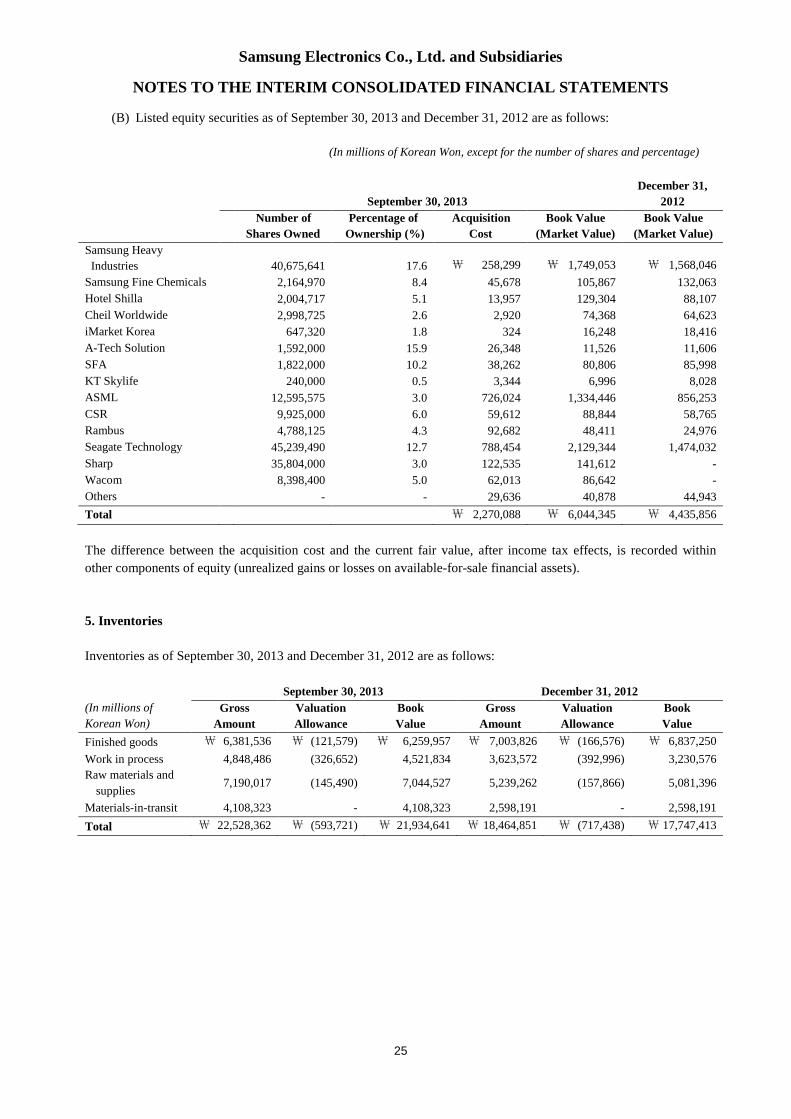
Samsung Electronics Co., Ltd. and Subsidiaries
NOTES TO THE INTERIM CONSOLIDATED FINANCIAL STATEMENTS
25
(B) Listed equity securities as of September 30, 2013 and December 31, 2012 are as follows:
(In millions of Korean Won, except for the number of shares and percentage)
September 30, 2013December 31,
2012Number of
Shares OwnedPercentage of
Ownership (%)Acquisition
CostBook Value
(Market Value)Book Value
(Market Value)Samsung Heavy
Industries 40,675,641 17.6 ₩ 258,299 ₩ 1,749,053 ₩ 1,568,046
Samsung Fine Chemicals 2,164,970 8.4 45,678 105,867 132,063
Hotel Shilla 2,004,717 5.1 13,957 129,304 88,107
Cheil Worldwide 2,998,725 2.6 2,920 74,368 64,623
iMarket Korea 647,320 1.8 324 16,248 18,416
A-Tech Solution 1,592,000 15.9 26,348 11,526 11,606
SFA 1,822,000 10.2 38,262 80,806 85,998
KT Skylife 240,000 0.5 3,344 6,996 8,028
ASML 12,595,575 3.0 726,024 1,334,446 856,253
CSR 9,925,000 6.0 59,612 88,844 58,765
Rambus 4,788,125 4.3 92,682 48,411 24,976
Seagate Technology 45,239,490 12.7 788,454 2,129,344 1,474,032
Sharp 35,804,000 3.0 122,535 141,612 -
Wacom 8,398,400 5.0 62,013 86,642 -
Others - - 29,636 40,878 44,943
Total ₩ 2,270,088 ₩ 6,044,345 ₩ 4,435,856
The difference between the acquisition cost and the current fair value, after income tax effects, is recorded within
other components of equity (unrealized gains or losses on available-for-sale financial assets).
5. Inventories
Inventories as of September 30, 2013 and December 31, 2012 are as follows:
(In millions of
Korean Won)
September 30, 2013 December 31, 2012Gross
AmountValuationAllowance
BookValue
GrossAmount
ValuationAllowance
BookValue
Finished goods ₩ 6,381,536 ₩ (121,579) ₩ 6,259,957 ₩ 7,003,826 ₩ (166,576) ₩ 6,837,250
Work in process 4,848,486 (326,652) 4,521,834 3,623,572 (392,996) 3,230,576
Raw materials and
supplies7,190,017 (145,490) 7,044,527 5,239,262 (157,866) 5,081,396
Materials-in-transit 4,108,323 - 4,108,323 2,598,191 - 2,598,191
Total ₩ 22,528,362 ₩ (593,721) ₩ 21,934,641 ₩ 18,464,851 ₩ (717,438) ₩ 17,747,413
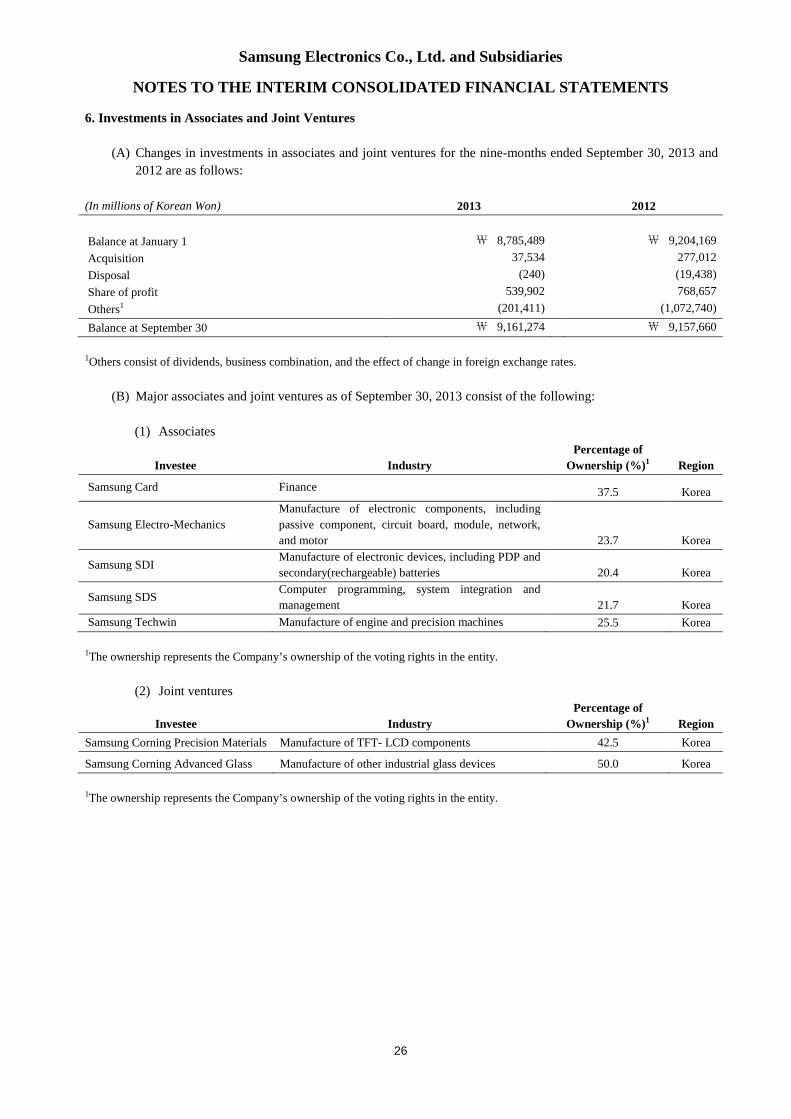
Samsung Electronics Co., Ltd. and Subsidiaries
NOTES TO THE INTERIM CONSOLIDATED FINANCIAL STATEMENTS
26
6. Investments in Associates and Joint Ventures
(A) Changes in investments in associates and joint ventures for the nine-months ended September 30, 2013 and
2012 are as follows:
(In millions of Korean Won) 2013 2012
Balance at January 1 ₩ 8,785,489 ₩ 9,204,169
Acquisition 37,534 277,012
Disposal (240) (19,438)
Share of profit 539,902 768,657
Others1 (201,411) (1,072,740)
Balance at September 30 ₩ 9,161,274 ₩ 9,157,660
1Others consist of dividends, business combination, and the effect of change in foreign exchange rates.
(B) Major associates and joint ventures as of September 30, 2013 consist of the following:
(1) Associates
Investee IndustryPercentage of
Ownership (%)1 Region
Samsung Card Finance 37.5 Korea
Samsung Electro-Mechanics
Manufacture of electronic components, including
passive component, circuit board, module, network,
and motor 23.7 Korea
Samsung SDIManufacture of electronic devices, including PDP and
secondary(rechargeable) batteries 20.4 Korea
Samsung SDSComputer programming, system integration and
management 21.7 Korea
Samsung Techwin Manufacture of engine and precision machines 25.5 Korea
1The ownership represents the Company’s ownership of the voting rights in the entity.
(2) Joint ventures
Investee IndustryPercentage of
Ownership (%)1 RegionSamsung Corning Precision Materials Manufacture of TFT- LCD components 42.5 Korea
Samsung Corning Advanced Glass Manufacture of other industrial glass devices 50.0 Korea
1The ownership represents the Company’s ownership of the voting rights in the entity.
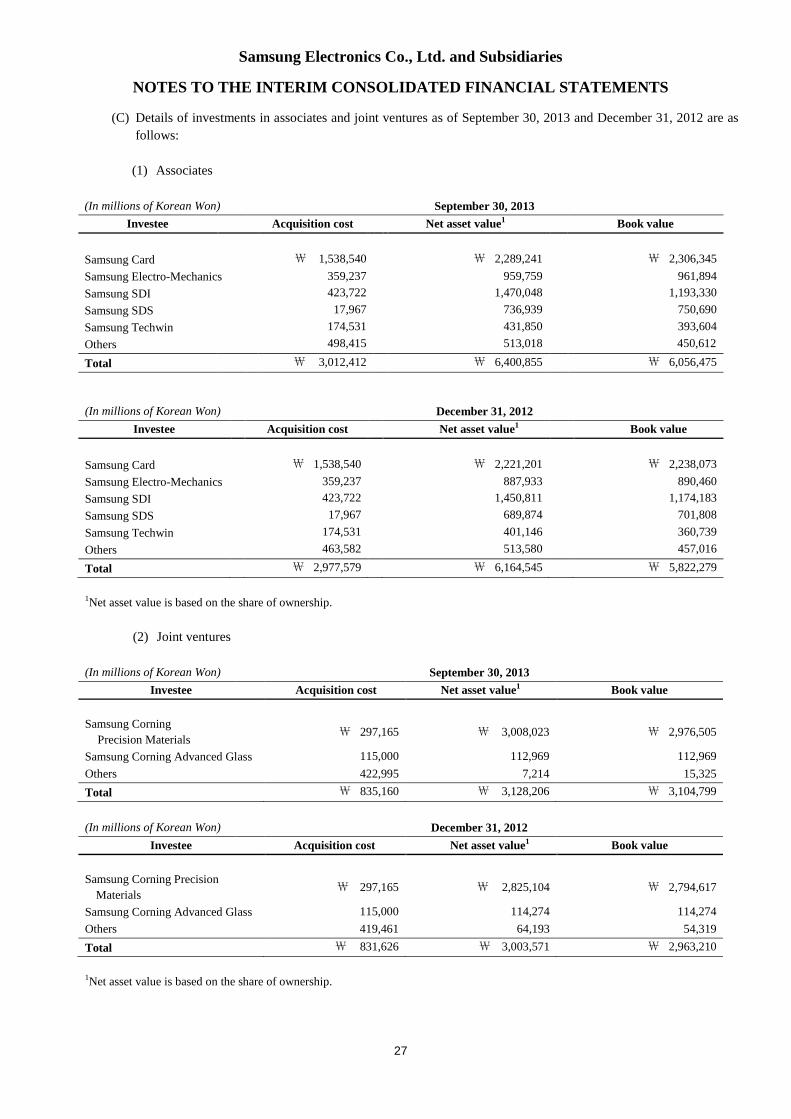
Samsung Electronics Co., Ltd. and Subsidiaries
NOTES TO THE INTERIM CONSOLIDATED FINANCIAL STATEMENTS
27
(C) Details of investments in associates and joint ventures as of September 30, 2013 and December 31, 2012 are as
follows:
(1) Associates
(In millions of Korean Won) September 30, 2013Investee Acquisition cost Net asset value1 Book value
Samsung Card ₩ 1,538,540 ₩ 2,289,241 ₩ 2,306,345
Samsung Electro-Mechanics 359,237 959,759 961,894
Samsung SDI 423,722 1,470,048 1,193,330
Samsung SDS 17,967 736,939 750,690
Samsung Techwin 174,531 431,850 393,604
Others 498,415 513,018 450,612
Total ₩ 3,012,412 ₩ 6,400,855 ₩ 6,056,475
(In millions of Korean Won) December 31, 2012Investee Acquisition cost Net asset value1 Book value
Samsung Card ₩ 1,538,540 ₩ 2,221,201 ₩ 2,238,073
Samsung Electro-Mechanics 359,237 887,933 890,460
Samsung SDI 423,722 1,450,811 1,174,183
Samsung SDS 17,967 689,874 701,808
Samsung Techwin 174,531 401,146 360,739
Others 463,582 513,580 457,016
Total ₩ 2,977,579 ₩ 6,164,545 ₩ 5,822,279
1Net asset value is based on the share of ownership.
(2) Joint ventures
(In millions of Korean Won) September 30, 2013Investee Acquisition cost Net asset value1 Book value
Samsung Corning
Precision Materials₩ 297,165 ₩ 3,008,023 ₩ 2,976,505
Samsung Corning Advanced Glass 115,000 112,969 112,969
Others 422,995 7,214 15,325
Total ₩ 835,160 ₩ 3,128,206 ₩ 3,104,799
(In millions of Korean Won) December 31, 2012Investee Acquisition cost Net asset value1 Book value
Samsung Corning Precision
Materials₩ 297,165 ₩ 2,825,104 ₩ 2,794,617
Samsung Corning Advanced Glass 115,000 114,274 114,274
Others 419,461 64,193 54,319
Total ₩ 831,626 ₩ 3,003,571 ₩ 2,963,210
1Net asset value is based on the share of ownership.
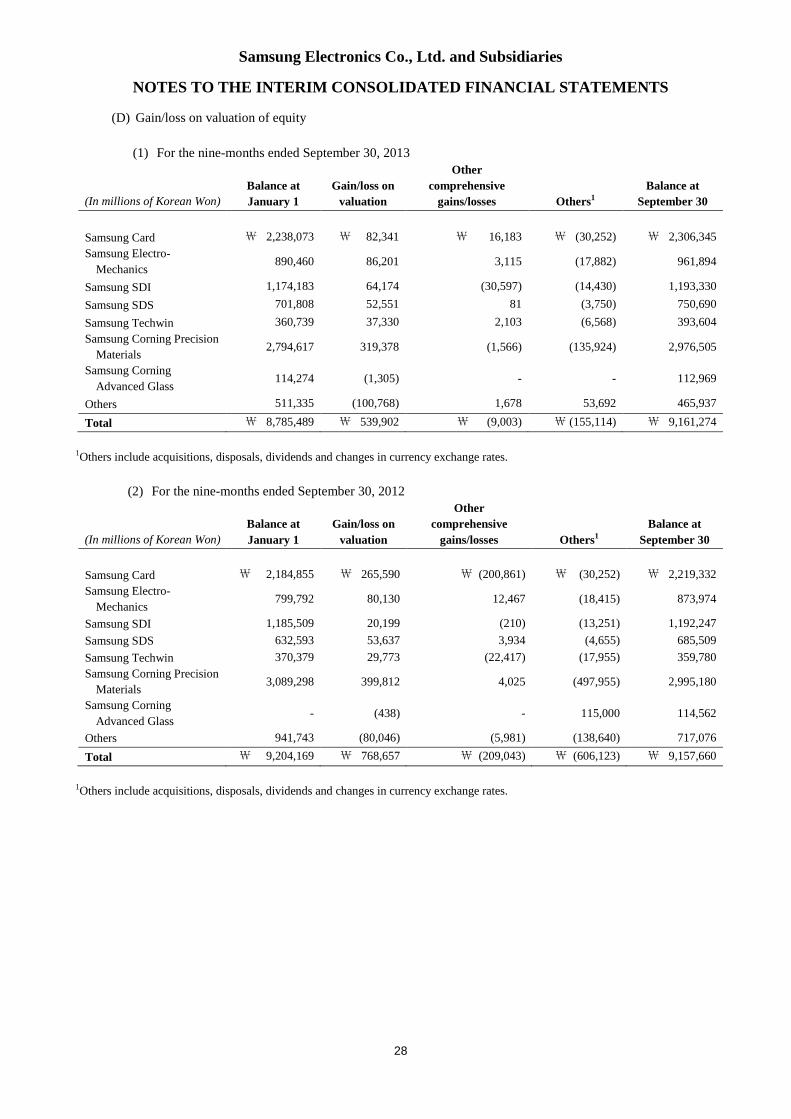
Samsung Electronics Co., Ltd. and Subsidiaries
NOTES TO THE INTERIM CONSOLIDATED FINANCIAL STATEMENTS
28
(D) Gain/loss on valuation of equity
(1) For the nine-months ended September 30, 2013
(In millions of Korean Won)
Balance atJanuary 1
Gain/loss onvaluation
Othercomprehensive
gains/losses Others1Balance at
September 30
Samsung Card ₩ 2,238,073 ₩ 82,341 ₩ 16,183 ₩ (30,252) ₩ 2,306,345
Samsung Electro-
Mechanics890,460 86,201 3,115 (17,882) 961,894
Samsung SDI 1,174,183 64,174 (30,597) (14,430) 1,193,330
Samsung SDS 701,808 52,551 81 (3,750) 750,690
Samsung Techwin 360,739 37,330 2,103 (6,568) 393,604
Samsung Corning Precision
Materials2,794,617 319,378 (1,566) (135,924) 2,976,505
Samsung Corning
Advanced Glass114,274 (1,305) - - 112,969
Others 511,335 (100,768) 1,678 53,692 465,937
Total ₩ 8,785,489 ₩ 539,902 ₩ (9,003) ₩ (155,114) ₩ 9,161,274
1Others include acquisitions, disposals, dividends and changes in currency exchange rates.
(2) For the nine-months ended September 30, 2012
(In millions of Korean Won)
Balance atJanuary 1
Gain/loss onvaluation
Othercomprehensive
gains/losses Others1Balance at
September 30
Samsung Card ₩ 2,184,855 ₩ 265,590 ₩ (200,861) ₩ (30,252) ₩ 2,219,332
Samsung Electro-
Mechanics799,792 80,130 12,467 (18,415) 873,974
Samsung SDI 1,185,509 20,199 (210) (13,251) 1,192,247
Samsung SDS 632,593 53,637 3,934 (4,655) 685,509
Samsung Techwin 370,379 29,773 (22,417) (17,955) 359,780
Samsung Corning Precision
Materials3,089,298 399,812 4,025 (497,955) 2,995,180
Samsung Corning
Advanced Glass- (438) - 115,000 114,562
Others 941,743 (80,046) (5,981) (138,640) 717,076
Total ₩ 9,204,169 ₩ 768,657 ₩ (209,043) ₩ (606,123) ₩ 9,157,660
1Others include acquisitions, disposals, dividends and changes in currency exchange rates.
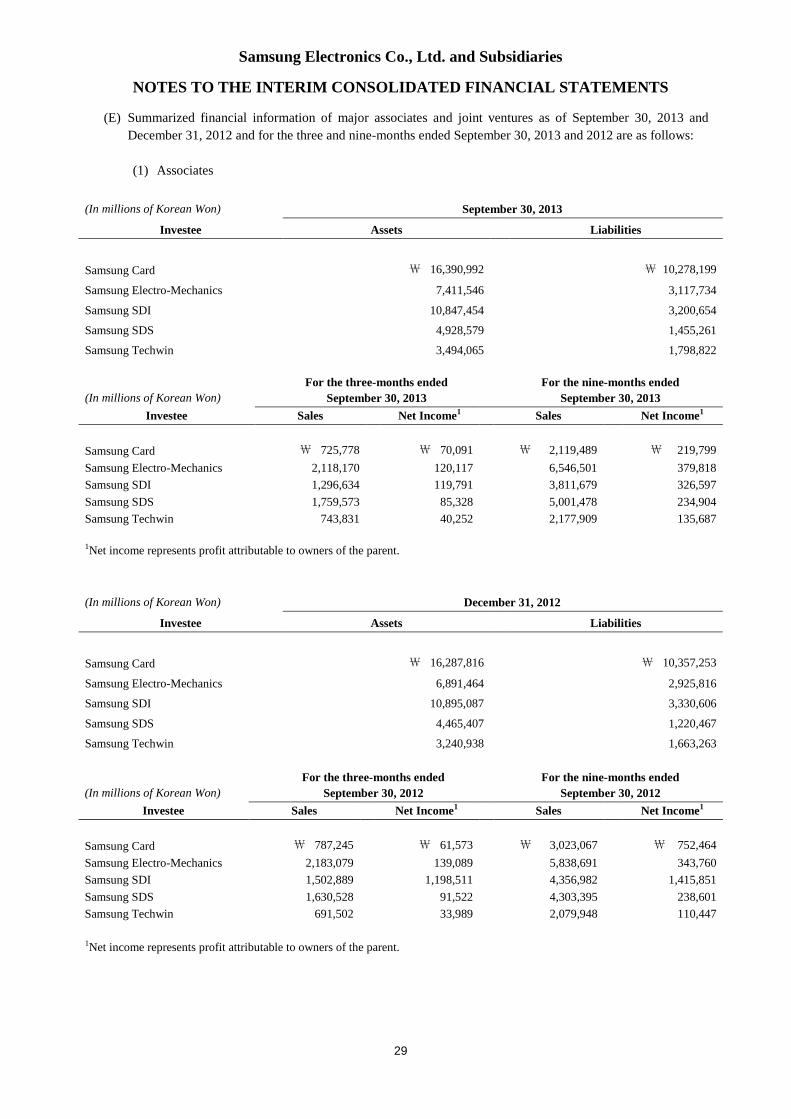
Samsung Electronics Co., Ltd. and Subsidiaries
NOTES TO THE INTERIM CONSOLIDATED FINANCIAL STATEMENTS
29
(E) Summarized financial information of major associates and joint ventures as of September 30, 2013 and
December 31, 2012 and for the three and nine-months ended September 30, 2013 and 2012 are as follows:
(1) Associates
(In millions of Korean Won) September 30, 2013
Investee Assets Liabilities
Samsung Card ₩ 16,390,992 ₩ 10,278,199
Samsung Electro-Mechanics 7,411,546 3,117,734
Samsung SDI 10,847,454 3,200,654
Samsung SDS 4,928,579 1,455,261
Samsung Techwin 3,494,065 1,798,822
(In millions of Korean Won)
For the three-months endedSeptember 30, 2013
For the nine-months endedSeptember 30, 2013
Investee Sales Net Income1 Sales Net Income1
Samsung Card ₩ 725,778 ₩ 70,091 ₩ 2,119,489 ₩ 219,799
Samsung Electro-Mechanics 2,118,170 120,117 6,546,501 379,818
Samsung SDI 1,296,634 119,791 3,811,679 326,597
Samsung SDS 1,759,573 85,328 5,001,478 234,904
Samsung Techwin 743,831 40,252 2,177,909 135,687
1Net income represents profit attributable to owners of the parent.
(In millions of Korean Won) December 31, 2012
Investee Assets Liabilities
Samsung Card ₩ 16,287,816 ₩ 10,357,253
Samsung Electro-Mechanics 6,891,464 2,925,816
Samsung SDI 10,895,087 3,330,606
Samsung SDS 4,465,407 1,220,467
Samsung Techwin 3,240,938 1,663,263
(In millions of Korean Won)
For the three-months endedSeptember 30, 2012
For the nine-months endedSeptember 30, 2012
Investee Sales Net Income1 Sales Net Income1
Samsung Card ₩ 787,245 ₩ 61,573 ₩ 3,023,067 ₩ 752,464
Samsung Electro-Mechanics 2,183,079 139,089 5,838,691 343,760
Samsung SDI 1,502,889 1,198,511 4,356,982 1,415,851
Samsung SDS 1,630,528 91,522 4,303,395 238,601
Samsung Techwin 691,502 33,989 2,079,948 110,447
1Net income represents profit attributable to owners of the parent.
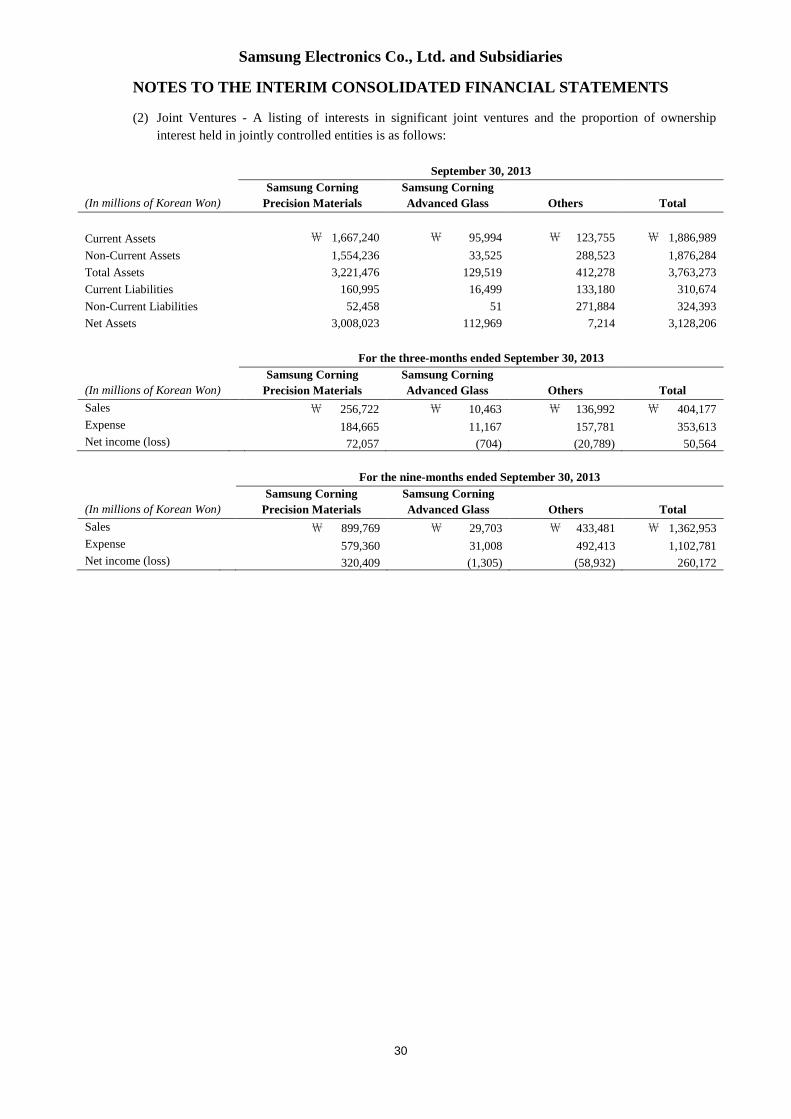
Samsung Electronics Co., Ltd. and Subsidiaries
NOTES TO THE INTERIM CONSOLIDATED FINANCIAL STATEMENTS
30
(2) Joint Ventures - A listing of interests in significant joint ventures and the proportion of ownership
interest held in jointly controlled entities is as follows:
(In millions of Korean Won)
September 30, 2013Samsung Corning
Precision MaterialsSamsung CorningAdvanced Glass Others Total
Current Assets ₩ 1,667,240 ₩ 95,994 ₩ 123,755 ₩ 1,886,989
Non-Current Assets 1,554,236 33,525 288,523 1,876,284
Total Assets 3,221,476 129,519 412,278 3,763,273
Current Liabilities 160,995 16,499 133,180 310,674
Non-Current Liabilities 52,458 51 271,884 324,393
Net Assets 3,008,023 112,969 7,214 3,128,206
For the three-months ended September 30, 2013
(In millions of Korean Won)
Samsung CorningPrecision Materials
Samsung CorningAdvanced Glass Others Total
Sales ₩ 256,722 ₩ 10,463 ₩ 136,992 ₩ 404,177
Expense 184,665 11,167 157,781 353,613Net income (loss) 72,057 (704) (20,789) 50,564
For the nine-months ended September 30, 2013
(In millions of Korean Won)
Samsung CorningPrecision Materials
Samsung CorningAdvanced Glass Others Total
Sales ₩ 899,769 ₩ 29,703 ₩ 433,481 ₩ 1,362,953
Expense 579,360 31,008 492,413 1,102,781Net income (loss) 320,409 (1,305) (58,932) 260,172
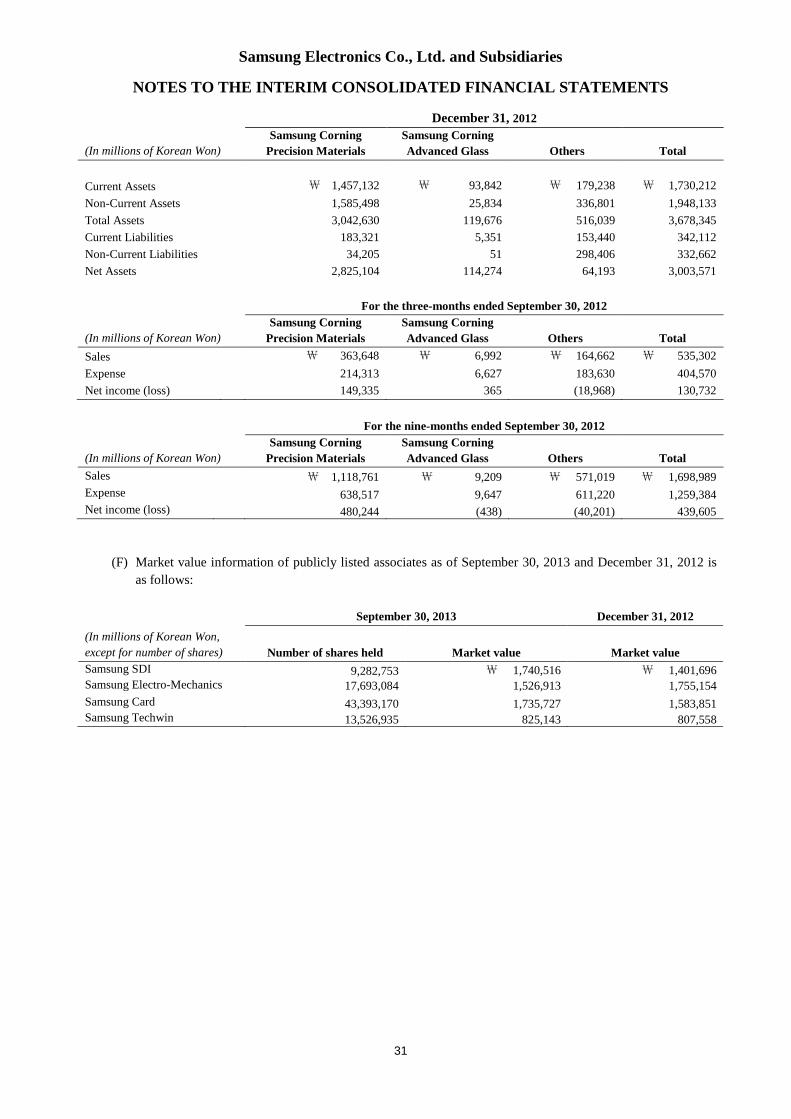
Samsung Electronics Co., Ltd. and Subsidiaries
NOTES TO THE INTERIM CONSOLIDATED FINANCIAL STATEMENTS
31
(In millions of Korean Won)
December 31, 2012Samsung Corning
Precision MaterialsSamsung CorningAdvanced Glass Others Total
Current Assets ₩ 1,457,132 ₩ 93,842 ₩ 179,238 ₩ 1,730,212
Non-Current Assets 1,585,498 25,834 336,801 1,948,133
Total Assets 3,042,630 119,676 516,039 3,678,345
Current Liabilities 183,321 5,351 153,440 342,112
Non-Current Liabilities 34,205 51 298,406 332,662
Net Assets 2,825,104 114,274 64,193 3,003,571
For the three-months ended September 30, 2012
(In millions of Korean Won)
Samsung CorningPrecision Materials
Samsung CorningAdvanced Glass Others Total
Sales ₩ 363,648 ₩ 6,992 ₩ 164,662 ₩ 535,302
Expense 214,313 6,627 183,630 404,570
Net income (loss) 149,335 365 (18,968) 130,732
For the nine-months ended September 30, 2012
(In millions of Korean Won)
Samsung CorningPrecision Materials
Samsung CorningAdvanced Glass Others Total
Sales ₩ 1,118,761 ₩ 9,209 ₩ 571,019 ₩ 1,698,989
Expense 638,517 9,647 611,220 1,259,384Net income (loss) 480,244 (438) (40,201) 439,605
(F) Market value information of publicly listed associates as of September 30, 2013 and December 31, 2012 is
as follows:
(In millions of Korean Won,
except for number of shares)
September 30, 2013 December 31, 2012
Number of shares held Market value Market valueSamsung SDI 9,282,753 ₩ 1,740,516 ₩ 1,401,696Samsung Electro-Mechanics 17,693,084 1,526,913 1,755,154
Samsung Card 43,393,170 1,735,727 1,583,851Samsung Techwin 13,526,935 825,143 807,558
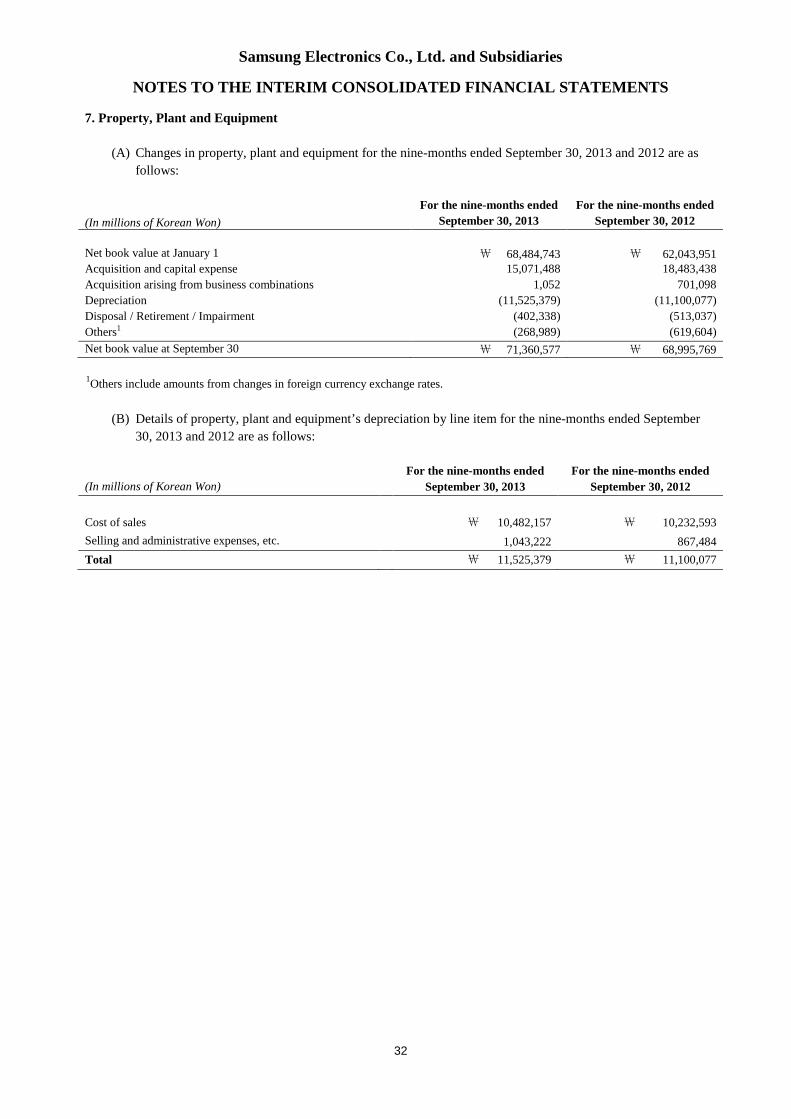
Samsung Electronics Co., Ltd. and Subsidiaries
NOTES TO THE INTERIM CONSOLIDATED FINANCIAL STATEMENTS
32
7. Property, Plant and Equipment
(A) Changes in property, plant and equipment for the nine-months ended September 30, 2013 and 2012 are as
follows:
(In millions of Korean Won)
For the nine-months endedSeptember 30, 2013
For the nine-months endedSeptember 30, 2012
Net book value at January 1 ₩ 68,484,743 ₩ 62,043,951Acquisition and capital expense 15,071,488 18,483,438
Acquisition arising from business combinations 1,052 701,098
Depreciation (11,525,379) (11,100,077)
Disposal / Retirement / Impairment (402,338) (513,037)
Others1 (268,989) (619,604)
Net book value at September 30 ₩ 71,360,577 ₩ 68,995,769
1Others include amounts from changes in foreign currency exchange rates.
(B) Details of property, plant and equipment’s depreciation by line item for the nine-months ended September
30, 2013 and 2012 are as follows:
(In millions of Korean Won)
For the nine-months endedSeptember 30, 2013
For the nine-months endedSeptember 30, 2012
Cost of sales ₩ 10,482,157 ₩ 10,232,593
Selling and administrative expenses, etc. 1,043,222 867,484
Total ₩ 11,525,379 ₩ 11,100,077
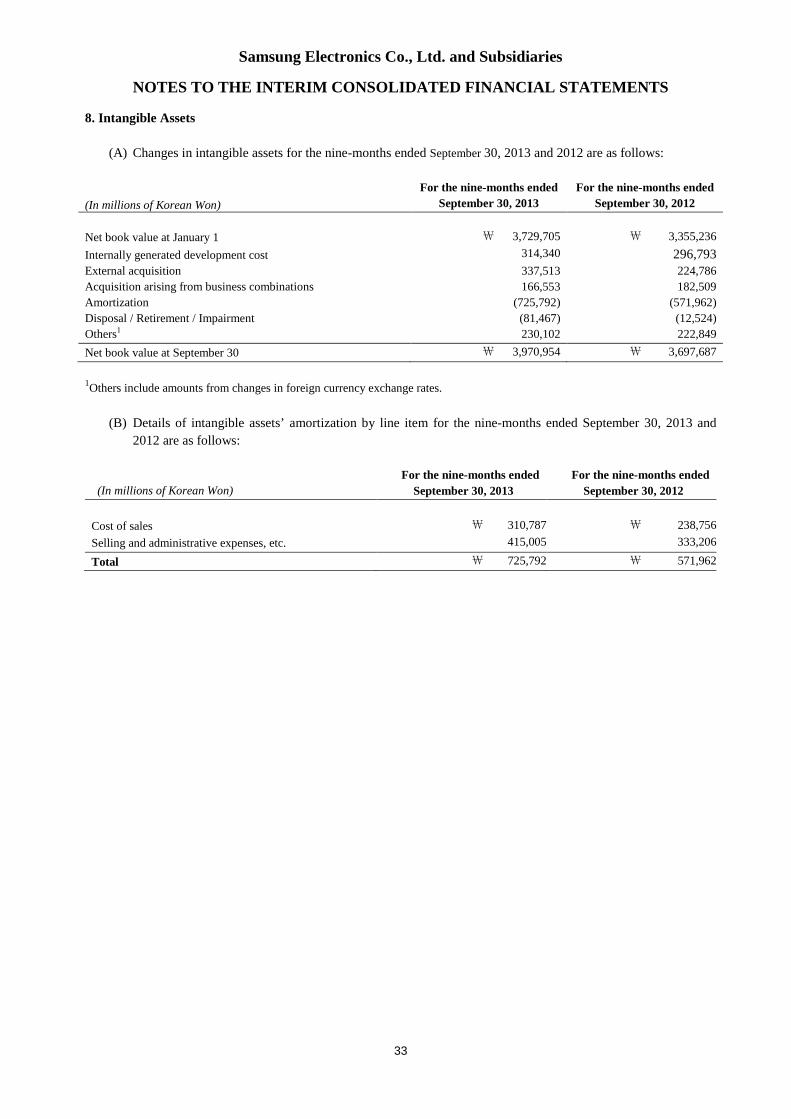
Samsung Electronics Co., Ltd. and Subsidiaries
NOTES TO THE INTERIM CONSOLIDATED FINANCIAL STATEMENTS
33
8. Intangible Assets
(A) Changes in intangible assets for the nine-months ended September 30, 2013 and 2012 are as follows:
(In millions of Korean Won)
For the nine-months endedSeptember 30, 2013
For the nine-months endedSeptember 30, 2012
Net book value at January 1 ₩ 3,729,705 ₩ 3,355,236
Internally generated development cost 314,340 296,793External acquisition 337,513 224,786
Acquisition arising from business combinations 166,553 182,509
Amortization (725,792) (571,962)
Disposal / Retirement / Impairment (81,467) (12,524)
Others1 230,102 222,849
Net book value at September 30 ₩ 3,970,954 ₩ 3,697,687
1Others include amounts from changes in foreign currency exchange rates.
(B) Details of intangible assets’ amortization by line item for the nine-months ended September 30, 2013 and
2012 are as follows:
(In millions of Korean Won)
For the nine-months endedSeptember 30, 2013
For the nine-months endedSeptember 30, 2012
Cost of sales ₩ 310,787 ₩ 238,756
Selling and administrative expenses, etc. 415,005 333,206
Total ₩ 725,792 ₩ 571,962
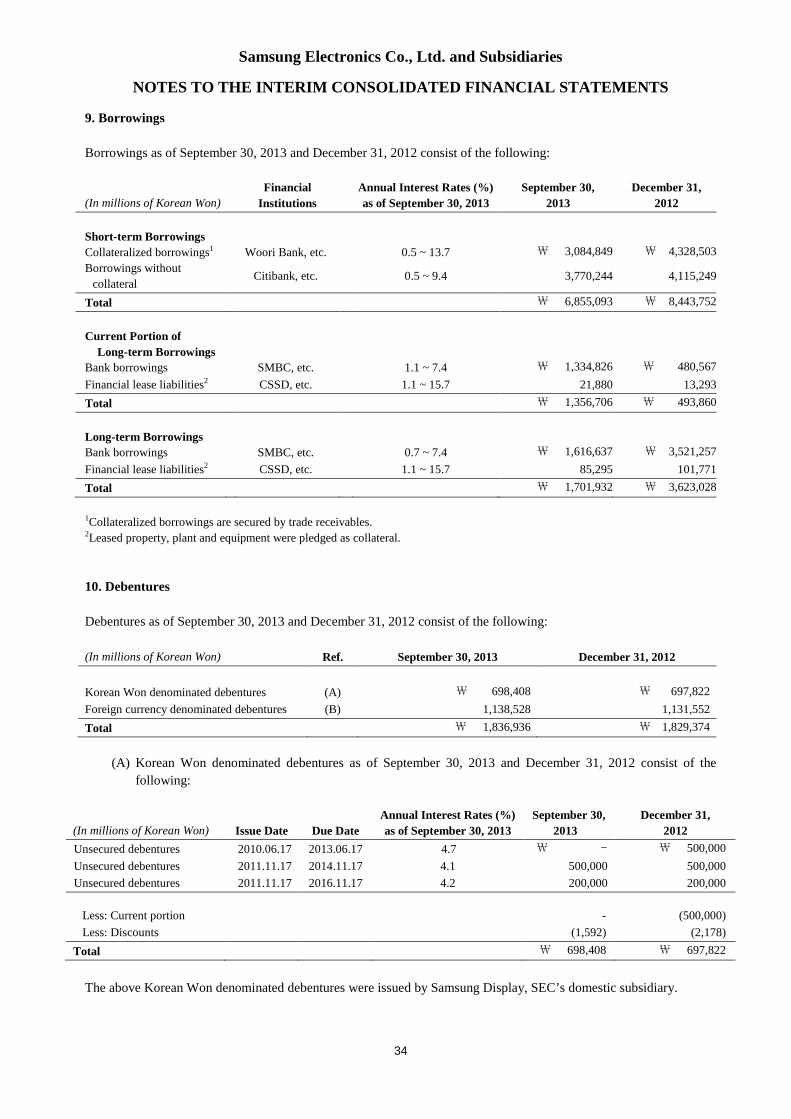
Samsung Electronics Co., Ltd. and Subsidiaries
NOTES TO THE INTERIM CONSOLIDATED FINANCIAL STATEMENTS
34
9. Borrowings
Borrowings as of September 30, 2013 and December 31, 2012 consist of the following:
(In millions of Korean Won)
FinancialInstitutions
Annual Interest Rates (%)as of September 30, 2013
September 30,2013
December 31,2012
Short-term BorrowingsCollateralized borrowings1 Woori Bank, etc. 0.5 ~ 13.7 ₩ 3,084,849 ₩ 4,328,503
Borrowings without
collateralCitibank, etc. 0.5 ~ 9.4 3,770,244 4,115,249
Total ₩ 6,855,093 ₩ 8,443,752
Current Portion ofLong-term Borrowings
Bank borrowings SMBC, etc. 1.1 ~ 7.4 ₩ 1,334,826 ₩ 480,567
Financial lease liabilities2 CSSD, etc. 1.1 ~ 15.7 21,880 13,293
Total ₩ 1,356,706 ₩ 493,860
Long-term BorrowingsBank borrowings SMBC, etc. 0.7 ~ 7.4 ₩ 1,616,637 ₩ 3,521,257
Financial lease liabilities2 CSSD, etc. 1.1 ~ 15.7 85,295 101,771
Total ₩ 1,701,932 ₩ 3,623,028
1Collateralized borrowings are secured by trade receivables.2Leased property, plant and equipment were pledged as collateral.
10. Debentures
Debentures as of September 30, 2013 and December 31, 2012 consist of the following:
(In millions of Korean Won) Ref. September 30, 2013 December 31, 2012
Korean Won denominated debentures (A) ₩ 698,408 ₩ 697,822
Foreign currency denominated debentures (B) 1,138,528 1,131,552
Total ₩ 1,836,936 ₩ 1,829,374
(A) Korean Won denominated debentures as of September 30, 2013 and December 31, 2012 consist of the
following:
(In millions of Korean Won) Issue Date Due DateAnnual Interest Rates (%)as of September 30, 2013
September 30,2013
December 31,2012
Unsecured debentures 2010.06.17 2013.06.17 4.7 ₩ - ₩ 500,000
Unsecured debentures 2011.11.17 2014.11.17 4.1 500,000 500,000
Unsecured debentures 2011.11.17 2016.11.17 4.2 200,000 200,000
Less: Current portion - (500,000)
Less: Discounts (1,592) (2,178)
Total ₩ 698,408 ₩ 697,822
The above Korean Won denominated debentures were issued by Samsung Display, SEC’s domestic subsidiary.
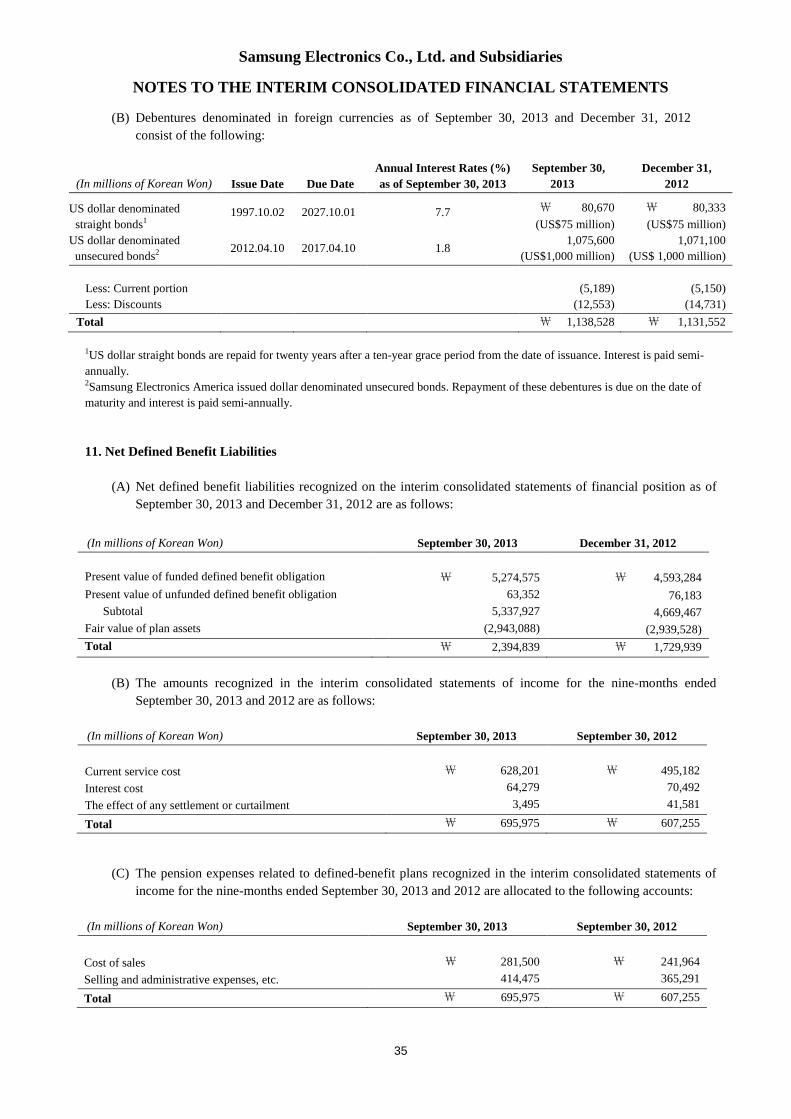
Samsung Electronics Co., Ltd. and Subsidiaries
NOTES TO THE INTERIM CONSOLIDATED FINANCIAL STATEMENTS
35
(B) Debentures denominated in foreign currencies as of September 30, 2013 and December 31, 2012
consist of the following:
(In millions of Korean Won) Issue Date Due DateAnnual Interest Rates (%)as of September 30, 2013
September 30,2013
December 31,2012
US dollar denominated
straight bonds11997.10.02 2027.10.01 7.7 ₩ 80,670
(US$75 million)
₩ 80,333
(US$75 million)
US dollar denominated
unsecured bonds2 2012.04.10 2017.04.10 1.81,075,600
(US$1,000 million)
1,071,100
(US$ 1,000 million)
Less: Current portion (5,189) (5,150)
Less: Discounts (12,553) (14,731)
Total ₩ 1,138,528 ₩ 1,131,552
1US dollar straight bonds are repaid for twenty years after a ten-year grace period from the date of issuance. Interest is paid semi-
annually.2Samsung Electronics America issued dollar denominated unsecured bonds. Repayment of these debentures is due on the date of
maturity and interest is paid semi-annually.
11. Net Defined Benefit Liabilities
(A) Net defined benefit liabilities recognized on the interim consolidated statements of financial position as of
September 30, 2013 and December 31, 2012 are as follows:
(In millions of Korean Won) September 30, 2013 December 31, 2012
Present value of funded defined benefit obligation ₩ 5,274,575 ₩ 4,593,284
Present value of unfunded defined benefit obligation 63,352 76,183
Subtotal 5,337,927 4,669,467
Fair value of plan assets (2,943,088) (2,939,528)
Total ₩ 2,394,839 ₩ 1,729,939
(B) The amounts recognized in the interim consolidated statements of income for the nine-months ended
September 30, 2013 and 2012 are as follows:
(In millions of Korean Won) September 30, 2013 September 30, 2012
Current service cost ₩ 628,201 ₩ 495,182
Interest cost 64,279 70,492
The effect of any settlement or curtailment 3,495 41,581
Total ₩ 695,975 ₩ 607,255
(C) The pension expenses related to defined-benefit plans recognized in the interim consolidated statements of
income for the nine-months ended September 30, 2013 and 2012 are allocated to the following accounts:
(In millions of Korean Won) September 30, 2013 September 30, 2012
Cost of sales ₩ 281,500 ₩ 241,964
Selling and administrative expenses, etc. 414,475 365,291
Total ₩ 695,975 ₩ 607,255
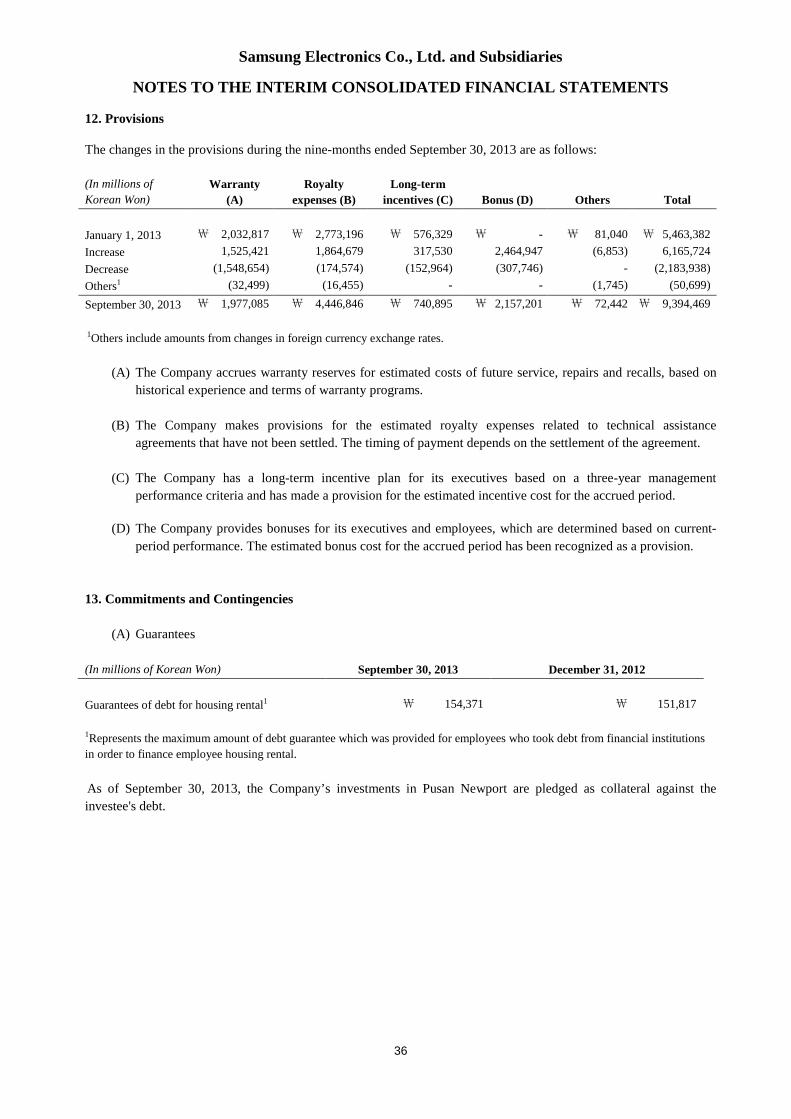
Samsung Electronics Co., Ltd. and Subsidiaries
NOTES TO THE INTERIM CONSOLIDATED FINANCIAL STATEMENTS
36
12. Provisions
The changes in the provisions during the nine-months ended September 30, 2013 are as follows:
(In millions of
Korean Won)
Warranty(A)
Royaltyexpenses (B)
Long-termincentives (C) Bonus (D) Others Total
January 1, 2013 ₩ 2,032,817 ₩ 2,773,196 ₩ 576,329 ₩ - ₩ 81,040 ₩ 5,463,382
Increase 1,525,421 1,864,679 317,530 2,464,947 (6,853) 6,165,724
Decrease (1,548,654) (174,574) (152,964) (307,746) - (2,183,938)
Others1 (32,499) (16,455) - - (1,745) (50,699)
September 30, 2013 ₩ 1,977,085 ₩ 4,446,846 ₩ 740,895 ₩ 2,157,201 ₩ 72,442 ₩ 9,394,469
1Others include amounts from changes in foreign currency exchange rates.
(A) The Company accrues warranty reserves for estimated costs of future service, repairs and recalls, based on
historical experience and terms of warranty programs.
(B) The Company makes provisions for the estimated royalty expenses related to technical assistance
agreements that have not been settled. The timing of payment depends on the settlement of the agreement.
(C) The Company has a long-term incentive plan for its executives based on a three-year management
performance criteria and has made a provision for the estimated incentive cost for the accrued period.
(D) The Company provides bonuses for its executives and employees, which are determined based on current-
period performance. The estimated bonus cost for the accrued period has been recognized as a provision.
13. Commitments and Contingencies
(A) Guarantees
(In millions of Korean Won) September 30, 2013 December 31, 2012
Guarantees of debt for housing rental1 ₩ 154,371 ₩ 151,817
1Represents the maximum amount of debt guarantee which was provided for employees who took debt from financial institutions
in order to finance employee housing rental.
As of September 30, 2013, the Company’s investments in Pusan Newport are pledged as collateral against the
investee's debt.
Samsung Electronics Co., Ltd. and Subsidiaries
NOTES TO THE INTERIM CONSOLIDATED FINANCIAL STATEMENTS
37
(B) Litigation
(1) Based on the agreement entered on August 24, 1999 with respect to Samsung Motor Inc.’s (“SMI”)
bankruptcy proceedings, Samsung Motor Inc.’s creditors (“the Creditors”) filed a civil action against Mr.
Kun Hee Lee, chairman of the Company, and 28 Samsung Group affiliates including the Company under
joint and several liability for failing to comply with such agreement. Under the suit, the Creditors have
sought ₩2,450 billion for loss of principal on loans extended to SMI, a separate amount for breach of
the agreement, and an amount for default interest. Samsung Life Insurance (“SLI”) completed its Initial
Public Offering (“IPO”) on May 7, 2010. After disposing 2,277,787 shares and paying the principal
balance owed to the Creditors, ₩878 billion was deposited in to an escrow account. That remaining
balance was to be used to pay the Creditors interest due to the delay in the SLI IPO. On January 11,
2011, the Seoul High Court ordered Samsung Group affiliates to pay₩600 billion to the Creditors and
pay 5% annual interest for the period between May 8, 2010 and January 11, 2011 and pay 20% annual
interest for the period after January 11, 2011 until the amounts owed to the Creditors are paid. In
accordance with the Seoul High Court order, ₩620.4 billion (which includes penalties and interest
owed) was paid to the Creditors from the funds held in escrow during January 2011. On February 7,
2011, the Samsung Group affiliates and the Creditors appealed the Seoul High Court’s ruling to the
Korean Supreme Court and the appeal is currently in progress. The amount of loss related to this matter
cannot be reasonably determined. Accordingly, the Company has concluded that no provision for loss
should be reflected in the Company’s interim consolidated financial statements at September 30, 2013.
(2) The litigation with Apple Inc. in multiple regions including the U.S.A. is ongoing as of the reporting
date. Regarding the ongoing lawsuit in the U.S.A, on August 24, 2012, the jury determined that the
Company partially infringed Apple’s design and utility patent and should pay damages to Apple. On
March 1, 2013, however, the Judge ordered a new trial for a certain portion of the damages, ruling that it
was originally miscalculated. The first appeal is still ongoing and the final conclusion and the effect of
the patent lawsuits with Apple are uncertain as of the reporting date.
(3) In addition, during the normal course of business with numerous companies, the Company has been
involved in various claims, disputes, and investigations conducted by regulatory bodies. Although, the
outflow of resources and timing of these matters are uncertain, the Company believes the outcome will
not have a material impact on the financial condition of the Company.
14. Share Capital and Premium
The Company’s number of authorized shares is 500,000,000 shares and the par value per share is ₩5,000. The
Company has issued 147,299,337 shares of common stock and 22,833,427 shares of preferred stock as of September
30, 2013, excluding retired shares. Due to the retirement of shares, the total par value of the shares issued is
₩850,664 million (common stock₩736,497 million, preferred stock₩114,167 million), which does not agree with
paid-in capital of₩897,514 million.
Samsung Electronics Co., Ltd. and Subsidiaries
NOTES TO THE INTERIM CONSOLIDATED FINANCIAL STATEMENTS
38
15. Retained Earnings
(A) Retained earnings as of September 30, 2013 and December 31, 2012 consist of the following:
(In millions of Korean Won) September 30, 2013 December 31, 2012
Appropriated ₩ 104,175,235 ₩ 87,915,275
Unappropriated 37,205,303 32,070,414
Total ₩ 141,380,538 ₩ 119,985,689
(B) On July 26, 2013, the Company declared cash dividends to shareholders of common stock and preferred
stock as interim dividends for the six-months ended June 30, 2013 and paid out interim dividends on August
26, 2013.
Details of interim dividends for the nine-months ended September 30, 2013 and 2012 are as follows:
(In millions of Korean won) September 30, 2013 September 30, 2012
Number of shares eligible fordividends
Common stock 130,878,713 130,759,755
Preferred stock 19,853,734 19,853,734
Dividend rate 10% 10%
Dividend amountCommon stock ₩ 65,439 ₩ 65,380
Preferred stock 9,927 9,927
Total ₩ 75,366 ₩ 75,307
16. Other Components of Equity
Other components of equity as of September 30, 2013 and December 31, 2012 consist of the following:
(In millions of Korean Won)
September 30,2013
December 31,2012
Treasury stock ₩ (7,334,784) ₩ (7,350,927)
Stock options 15,753 22,242
Unrealized gains on available-for-sale financial assets 3,040,197 2,001,536
Share of accumulated other comprehensive income of associates and joint ventures 712,111 720,944
Foreign-currency translation differences (2,944,477) (2,623,963)
Remeasurement of the net defined benefit liabilities (1,114,982) (1,097,228)
Others 143,123 134,352
Total ₩ (7,483,059) ₩ (8,193,044)
The Company repurchases registered common stock and non-voting preferred stock to stabilize its stock price and
recognizes the amount in other components of equity. This stock will be distributed when stock options are exercised
by the option holders.
Treasury stock as of September 30, 2013 and December 31, 2012 consists of the following:
September 30, 2013 December 31, 2012(In millions of Korean Won
and number of shares) Preferred Stock Common Stock Preferred Stock Common Stock
Number of shares 2,979,693 shares 16,411,969 shares 2,979,693 shares 16,451,438 shares
Acquisition cost ₩ 621,843 ₩ 6,712,941 ₩ 621,843 ₩ 6,729,084
Samsung Electronics Co., Ltd. and Subsidiaries
NOTES TO THE INTERIM CONSOLIDATED FINANCIAL STATEMENTS
39
17. Expenses by Nature
Expenses by nature for the nine-months ended September 30, 2013 and 2012 consist of the following:
September 30, 2013 September 30, 2012(In millions of Korean Won) 3 Months 9 Months 3 Months 9 MonthsChanges in inventories of finished goods
and work in progress ₩ (118,604) ₩ (713,965) ₩ (914,046) ₩ (664,041)
Raw materials and goods 24,661,503 70,013,855 22,452,408 61,688,630
Wages and salaries 4,312,396 12,147,576 3,440,471 10,315,258
Pension expenses 240,859 728,458 209,634 628,909
Depreciation expenses 3,939,419 11,525,379 3,868,223 11,100,077
Amortization expenses 253,891 725,792 193,293 571,962
Welfare expenses 763,144 2,347,786 676,954 1,837,115
Commission and service charges 2,195,830 6,986,429 2,019,548 5,121,188
Other expenses 12,671,467 37,180,997 12,169,451 34,233,617
Total1 ₩ 48,919,905 ₩ 140,942,307 ₩ 44,115,936 ₩ 124,832,715
1Expenses above are equal to the sum of cost of sales and selling and administrative expenses in the interim consolidated
statements of income.
18. Selling and Administrative Expenses
Selling and administrative expenses for the three and nine-months ended September 30, 2013 and 2012 consist of the
following:
September 30, 2013 September 30, 2012(In millions of Korean Won) 3 Months 9 Months 3 Months 9 Months
Selling and administrative expensesWages and salaries ₩ 1,313,368 ₩ 3,811,928 ₩ 1,031,172 ₩ 3,070,772
Pension expenses 56,149 172,159 51,577 161,827
Commission and service charges 2,195,830 6,986,429 2,019,548 5,121,188
Depreciation expenses 141,042 406,228 132,411 337,185
Amortization expenses 100,867 304,870 89,094 256,345
Advertising expenses 904,561 2,969,873 1,366,060 3,278,702
Sales promotion expenses 2,052,242 5,822,291 1,675,756 4,080,668
Transportation expenses 999,770 2,920,162 1,002,670 2,794,322
Warranty 699,921 2,182,170 827,254 2,362,108
Others 1,268,941 3,591,944 955,172 2,693,493
Subtotal 9,732,691 29,168,054 9,150,714 24,156,610
Research and developmentexpenses
Total research and development
expenditures ₩ 3,783,666 ₩ 10,840,199 ₩ 3,093,930 ₩ 8,873,714
Capitalized development costs (124,072) (314,340) (118,312) (296,793)
Subtotal 3,659,594 10,525,859 2,975,618 8,576,921
Total ₩ 13,392,285 ₩ 39,693,913 ₩ 12,126,332 ₩ 32,733,531
Samsung Electronics Co., Ltd. and Subsidiaries
NOTES TO THE INTERIM CONSOLIDATED FINANCIAL STATEMENTS
40
19. Other Non-Operating Income and Expenses
Other non-operating income for the three and nine-months ended September 30, 2013 and 2012 consists of the
following:
September 30, 2013 September 30, 2012(In millions of Korean Won) 3 Months 9 Months 3 Months 9 Months
Dividend income ₩ 19,877 ₩ 75,197 ₩ 17,245 ₩ 72,061Commission income 19,395 52,170 12,219 108,922Rental income 26,482 77,852 24,923 73,864Gains on disposal of investments 10,789 28,524 20,748 104,291Gains on disposal of property, plant and equipment 62,080 108,351 55,656 108,909Others 280,872 654,553 245,825 669,487Total ₩ 419,495 ₩ 996,647 ₩ 376,616 ₩ 1,137,534
Other non-operating expenses for the three and nine-months ended September 30, 2013 and 2012 consist of the
following:
September 30, 2013 September 30, 2012(In millions of Korean Won) 3 Months 9 Months 3 Months 9 Months
Losses from disposal of property, plant and
equipment ₩ 29,224 ₩ 147,803 ₩ 70,912 ₩ 195,831
Donation 218,783 351,499 39,942 111,191
Others 201,448 538,675 202,401 343,308
Total ₩ 449,455 ₩ 1,037,977 ₩ 313,255 ₩ 650,330
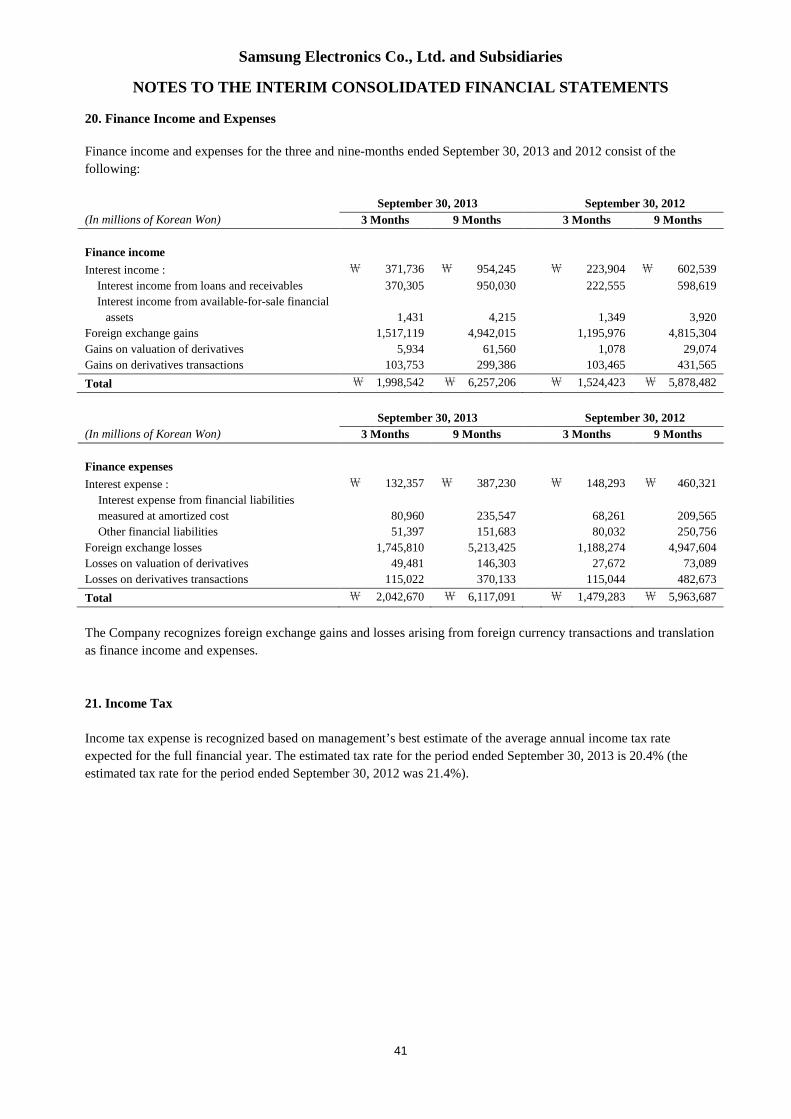
Samsung Electronics Co., Ltd. and Subsidiaries
NOTES TO THE INTERIM CONSOLIDATED FINANCIAL STATEMENTS
41
20. Finance Income and Expenses
Finance income and expenses for the three and nine-months ended September 30, 2013 and 2012 consist of the
following:
September 30, 2013 September 30, 2012(In millions of Korean Won) 3 Months 9 Months 3 Months 9 Months
Finance incomeInterest income : ₩ 371,736 ₩ 954,245 ₩ 223,904 ₩ 602,539
Interest income from loans and receivables 370,305 950,030 222,555 598,619
Interest income from available-for-sale financial
assets 1,431 4,215 1,349 3,920
Foreign exchange gains 1,517,119 4,942,015 1,195,976 4,815,304
Gains on valuation of derivatives 5,934 61,560 1,078 29,074
Gains on derivatives transactions 103,753 299,386 103,465 431,565
Total ₩ 1,998,542 ₩ 6,257,206 ₩ 1,524,423 ₩ 5,878,482
September 30, 2013 September 30, 2012(In millions of Korean Won) 3 Months 9 Months 3 Months 9 Months
Finance expensesInterest expense : ₩ 132,357 ₩ 387,230 ₩ 148,293 ₩ 460,321
Interest expense from financial liabilities
measured at amortized cost 80,960 235,547 68,261 209,565
Other financial liabilities 51,397 151,683 80,032 250,756
Foreign exchange losses 1,745,810 5,213,425 1,188,274 4,947,604
Losses on valuation of derivatives 49,481 146,303 27,672 73,089
Losses on derivatives transactions 115,022 370,133 115,044 482,673
Total ₩ 2,042,670 ₩ 6,117,091 ₩ 1,479,283 ₩ 5,963,687
The Company recognizes foreign exchange gains and losses arising from foreign currency transactions and translation
as finance income and expenses.
21. Income Tax
Income tax expense is recognized based on management’s best estimate of the average annual income tax rate
expected for the full financial year. The estimated tax rate for the period ended September 30, 2013 is 20.4% (the
estimated tax rate for the period ended September 30, 2012 was 21.4%).
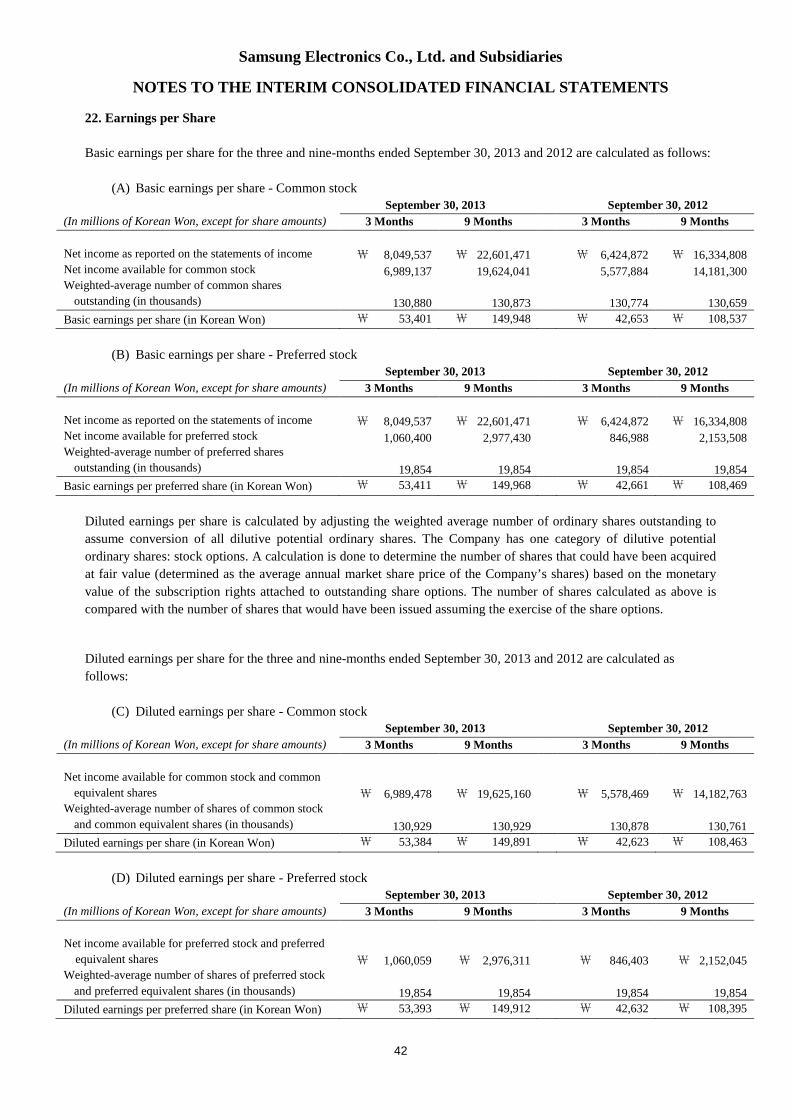
Samsung Electronics Co., Ltd. and Subsidiaries
NOTES TO THE INTERIM CONSOLIDATED FINANCIAL STATEMENTS
42
22. Earnings per Share
Basic earnings per share for the three and nine-months ended September 30, 2013 and 2012 are calculated as follows:
(A) Basic earnings per share - Common stock
September 30, 2013 September 30, 2012(In millions of Korean Won, except for share amounts) 3 Months 9 Months 3 Months 9 Months
Net income as reported on the statements of income ₩ 8,049,537 ₩ 22,601,471 ₩ 6,424,872 ₩ 16,334,808Net income available for common stock 6,989,137 19,624,041 5,577,884 14,181,300Weighted-average number of common shares
outstanding (in thousands) 130,880 130,873 130,774 130,659
Basic earnings per share (in Korean Won) ₩ 53,401 ₩ 149,948 ₩ 42,653 ₩ 108,537
(B) Basic earnings per share - Preferred stock
September 30, 2013 September 30, 2012(In millions of Korean Won, except for share amounts) 3 Months 9 Months 3 Months 9 Months
Net income as reported on the statements of income ₩ 8,049,537 ₩ 22,601,471 ₩ 6,424,872 ₩ 16,334,808Net income available for preferred stock 1,060,400 2,977,430 846,988 2,153,508Weighted-average number of preferred shares
outstanding (in thousands) 19,854 19,854 19,854 19,854
Basic earnings per preferred share (in Korean Won) ₩ 53,411 ₩ 149,968 ₩ 42,661 ₩ 108,469
Diluted earnings per share is calculated by adjusting the weighted average number of ordinary shares outstanding to
assume conversion of all dilutive potential ordinary shares. The Company has one category of dilutive potential
ordinary shares: stock options. A calculation is done to determine the number of shares that could have been acquired
at fair value (determined as the average annual market share price of the Company’s shares) based on the monetary
value of the subscription rights attached to outstanding share options. The number of shares calculated as above is
compared with the number of shares that would have been issued assuming the exercise of the share options.
Diluted earnings per share for the three and nine-months ended September 30, 2013 and 2012 are calculated as
follows:
(C) Diluted earnings per share - Common stock
September 30, 2013 September 30, 2012(In millions of Korean Won, except for share amounts) 3 Months 9 Months 3 Months 9 Months
Net income available for common stock and common
equivalent shares ₩ 6,989,478 ₩ 19,625,160 ₩ 5,578,469 ₩ 14,182,763Weighted-average number of shares of common stock
and common equivalent shares (in thousands) 130,929 130,929 130,878 130,761
Diluted earnings per share (in Korean Won) ₩ 53,384 ₩ 149,891 ₩ 42,623 ₩ 108,463
(D) Diluted earnings per share - Preferred stock
September 30, 2013 September 30, 2012(In millions of Korean Won, except for share amounts) 3 Months 9 Months 3 Months 9 Months
Net income available for preferred stock and preferred
equivalent shares ₩ 1,060,059 ₩ 2,976,311 ₩ 846,403 ₩ 2,152,045Weighted-average number of shares of preferred stock
and preferred equivalent shares (in thousands) 19,854 19,854 19,854 19,854
Diluted earnings per preferred share (in Korean Won) ₩ 53,393 ₩ 149,912 ₩ 42,632 ₩ 108,395
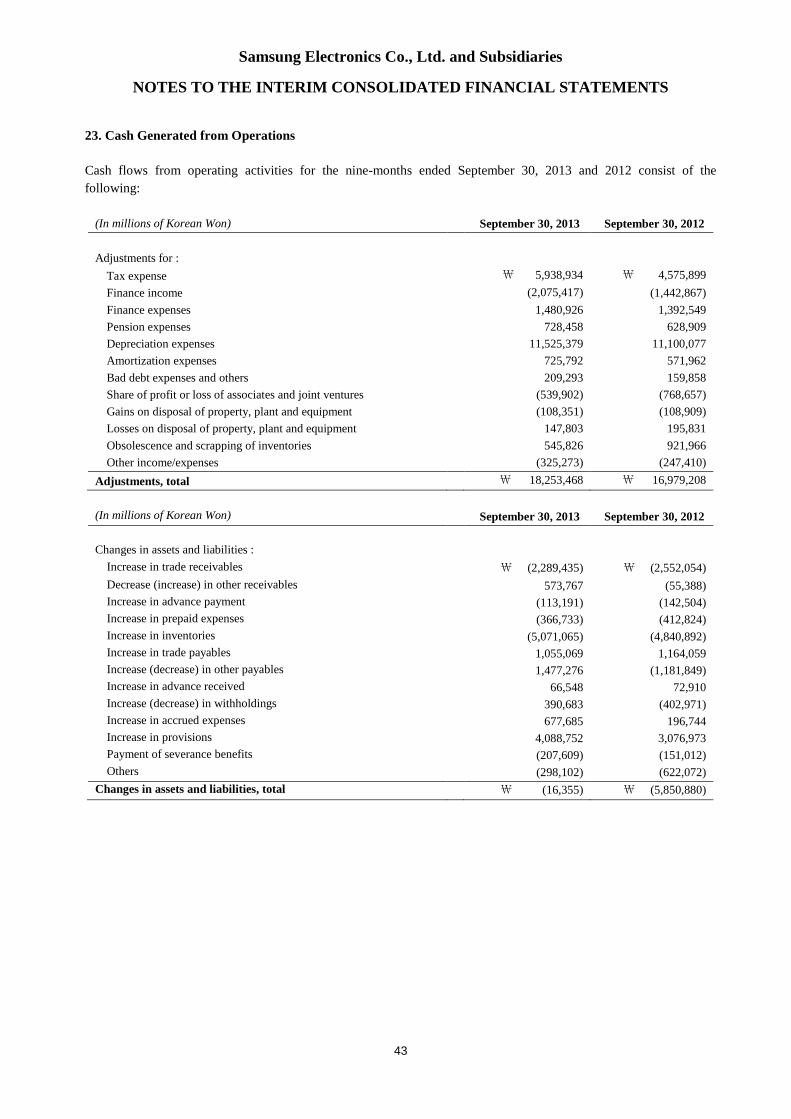
Samsung Electronics Co., Ltd. and Subsidiaries
NOTES TO THE INTERIM CONSOLIDATED FINANCIAL STATEMENTS
43
23. Cash Generated from Operations
Cash flows from operating activities for the nine-months ended September 30, 2013 and 2012 consist of the
following:
(In millions of Korean Won) September 30, 2013 September 30, 2012
Adjustments for :
Tax expense ₩ 5,938,934 ₩ 4,575,899
Finance income (2,075,417) (1,442,867)
Finance expenses 1,480,926 1,392,549
Pension expenses 728,458 628,909
Depreciation expenses 11,525,379 11,100,077
Amortization expenses 725,792 571,962
Bad debt expenses and others 209,293 159,858
Share of profit or loss of associates and joint ventures (539,902) (768,657)
Gains on disposal of property, plant and equipment (108,351) (108,909)
Losses on disposal of property, plant and equipment 147,803 195,831
Obsolescence and scrapping of inventories 545,826 921,966
Other income/expenses (325,273) (247,410)
Adjustments, total ₩ 18,253,468 ₩ 16,979,208
(In millions of Korean Won) September 30, 2013 September 30, 2012
Changes in assets and liabilities :
Increase in trade receivables ₩ (2,289,435) ₩ (2,552,054)
Decrease (increase) in other receivables 573,767 (55,388)
Increase in advance payment (113,191) (142,504)
Increase in prepaid expenses (366,733) (412,824)
Increase in inventories (5,071,065) (4,840,892)
Increase in trade payables 1,055,069 1,164,059
Increase (decrease) in other payables 1,477,276 (1,181,849)
Increase in advance received 66,548 72,910
Increase (decrease) in withholdings 390,683 (402,971)
Increase in accrued expenses 677,685 196,744
Increase in provisions 4,088,752 3,076,973
Payment of severance benefits (207,609) (151,012)
Others (298,102) (622,072)
Changes in assets and liabilities, total ₩ (16,355) ₩ (5,850,880)
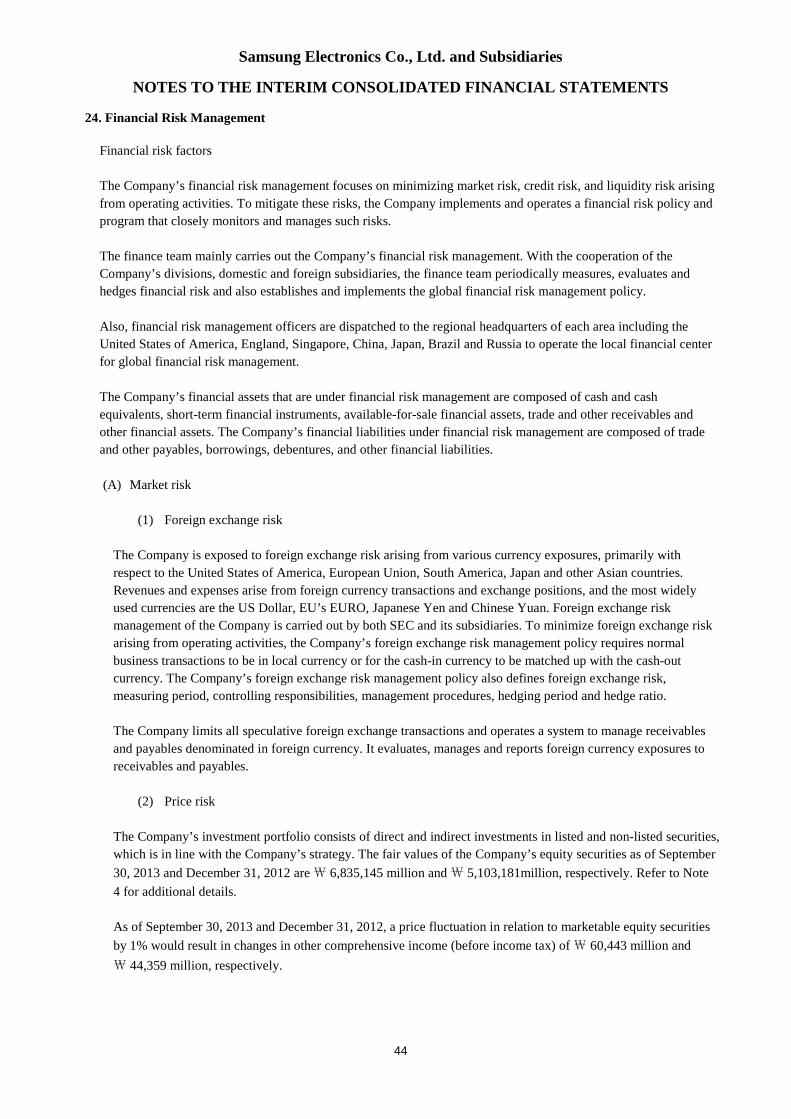
Samsung Electronics Co., Ltd. and Subsidiaries
NOTES TO THE INTERIM CONSOLIDATED FINANCIAL STATEMENTS
44
24. Financial Risk Management
Financial risk factors
The Company’s financial risk management focuses on minimizing market risk, credit risk, and liquidity risk arising
from operating activities. To mitigate these risks, the Company implements and operates a financial risk policy and
program that closely monitors and manages such risks.
The finance team mainly carries out the Company’s financial risk management. With the cooperation of the
Company’s divisions, domestic and foreign subsidiaries, the finance team periodically measures, evaluates and
hedges financial risk and also establishes and implements the global financial risk management policy.
Also, financial risk management officers are dispatched to the regional headquarters of each area including the
United States of America, England, Singapore, China, Japan, Brazil and Russia to operate the local financial center
for global financial risk management.
The Company’s financial assets that are under financial risk management are composed of cash and cash
equivalents, short-term financial instruments, available-for-sale financial assets, trade and other receivables and
other financial assets. The Company’s financial liabilities under financial risk management are composed of trade
and other payables, borrowings, debentures, and other financial liabilities.
(A) Market risk
(1) Foreign exchange risk
The Company is exposed to foreign exchange risk arising from various currency exposures, primarily with
respect to the United States of America, European Union, South America, Japan and other Asian countries.
Revenues and expenses arise from foreign currency transactions and exchange positions, and the most widely
used currencies are the US Dollar, EU’s EURO, Japanese Yen and Chinese Yuan. Foreign exchange risk
management of the Company is carried out by both SEC and its subsidiaries. To minimize foreign exchange risk
arising from operating activities, the Company’s foreign exchange risk management policy requires normal
business transactions to be in local currency or for the cash-in currency to be matched up with the cash-out
currency. The Company’s foreign exchange risk management policy also defines foreign exchange risk,
measuring period, controlling responsibilities, management procedures, hedging period and hedge ratio.
The Company limits all speculative foreign exchange transactions and operates a system to manage receivables
and payables denominated in foreign currency. It evaluates, manages and reports foreign currency exposures to
receivables and payables.
(2) Price risk
The Company’s investment portfolio consists of direct and indirect investments in listed and non-listed securities,
which is in line with the Company’s strategy. The fair values of the Company’s equity securities as of September
30, 2013 and December 31, 2012 are₩ 6,835,145 million and₩ 5,103,181million, respectively. Refer to Note
4 for additional details.
As of September 30, 2013 and December 31, 2012, a price fluctuation in relation to marketable equity securities
by 1% would result in changes in other comprehensive income (before income tax) of₩ 60,443 million and
₩ 44,359 million, respectively.
Samsung Electronics Co., Ltd. and Subsidiaries
NOTES TO THE INTERIM CONSOLIDATED FINANCIAL STATEMENTS
45
(3) Interest rate risk
Interest rate risk is defined as the risk that the fair value or future cash flows of a financial instrument will
fluctuate because of changes in market interest rates. The Company is exposed to interest rate risk mainly
through interest bearing liabilities and assets. The Company’s position with regard to interest rate risk exposure
is mainly driven by its debt obligations such as bonds, interest-bearing deposits and issuance of receivables. In
order to avoid interest rate risk, the Company maintains minimum external borrowing by facilitating cash
pooling systems on a regional and global basis. The Company manages exposed interest rate risk via periodic
monitoring and handles risk factors on a timely basis.
(B) Credit risk
Credit risk arises during the normal course of transactions and investing activities where clients or other parties
fail to discharge an obligation. The Company monitors and sets the client’s and counterparty’s credit limits on a
periodic basis based on the client’s and counterparty’s financial conditions, default history and other important
factors.
Credit risk can arise from transactions with financial institutions which include financial instrument transactions
such as cash and cash equivalents, savings, and derivative financial instruments. To minimize such risk, the
Company transacts only with banks that have strong international credit rating (S&P A and above), and all new
transactions with financial institutions with no prior transaction history are approved, managed and monitored by
the Company’s finance team and the local financial center. The Company requires separate approval for
contracts with restrictions.
Most of the Company's accounts receivable is adequately insured to manage any risk, therefore, the Company
estimates its credit risk exposure to be limited. The Company estimates that its maximum exposure to credit risk
is the carrying value of its financial assets, net of impairment losses.
(C) Liquidity risk
Due to large investments made by the Company, maintaining adequate levels of liquidity risk is critical. The
Company strives to achieve this goal by periodically forecasting its capital balance, estimating required cash
levels, and managing income and expenses.
The Company manages its liquidity risk by periodically forecasting projected cash flows. If abnormal signs are
identified, the Company works with the local finance center and provides liquidity support by utilizing a globally
integrated finance structure, such as Cash Pooling. In addition, the Company maintains a liquidity management
process which provides additional financial support by the local finance center and the Company. The Cash
Pooling program allows sharing of surplus funds among entities and contributes to minimizing liquidity risk and
strengthening the Company’s competitive position by reducing capital operation expenses and finance expenses.
In addition, the Company mitigates liquidity risk by contracting with financial institutions with respect to bank
overdrafts and foreign trade finance and by providing payment guarantees to subsidiaries. For large scale facility
investments, liquidity risk is minimized by utilizing internal reserves and long term borrowings according to the
capital injection schedule.
(D) Capital risk management
The purpose of capital management is to maintain a sound capital structure. The Company monitors capital on
the basis of the ratio of total liabilities to total equity. This ratio is calculated by dividing the total liabilities by
total equity in the consolidated financial statements.
Samsung Electronics Co., Ltd. and Subsidiaries
NOTES TO THE INTERIM CONSOLIDATED FINANCIAL STATEMENTS
46
The Company’s capital risk management policy has not changed since the financial year ended December 31,
2012. The Company has maintained an A+ and A1 credit rating from S & P and Moody’s, respectively, on its
long term debt.
The total liabilities to equity ratios as of September 30, 2013 and December 31, 2012 are as follows:
(In millions of Korean Won) September 30, 2013 December 31, 2012
Total liabilities ₩ 66,374,078 ₩ 59,591,364
Total equity 144,438,803 121,480,206
Ratio 46.0% 49.1%
(E) Fair value estimation
(1) The following table presents the assets and liabilities, by level, that are measured at fair value:
September 30, 2013
(In millions of Korean Won) Level 1 Level 2 Level 3 Total balance
Derivatives ₩ - ₩ 76,604 ₩ - ₩ 76,604
Available-for-sale financial assets17,301,431 134,035 512,670 7,948,136
Total assets 7,301,431 210,639 512,670 8,024,740
Derivatives - 188,778 - 188,778
Total liabilities ₩ - ₩ 188,778 ₩ - ₩ 188,778
December 31, 2012
(In millions of Korean Won) Level 1 Level 2 Level 3 Total balance
Derivatives ₩ - ₩ 47,227 ₩ - ₩ 47,227
Available-for-sale financial assets15,694,730 125,994 389,195 6,209,919
Total assets 5,694,730 173,221 389,195 6,257,146
Derivatives - 79,212 - 79,212
Total liabilities ₩ - ₩ 79,212 ₩ - ₩ 79,212
1Non-marketable equity securities (CSOT equity securities:₩ 278,130 million) measured at cost are excluded as the range of
reasonable fair value estimates is significant and the probabilities of the various estimates cannot be reasonably assessed.
The levels of the fair value hierarchy and its application to financial assets and liabilities are described below.
ㆍLevel 1: Quoted prices (unadjusted) in active markets for identical assets or liabilities
ㆍLevel 2: Inputs other than quoted prices included within level 1 that are observable for the asset or liability, either
directly or indirectly
ㆍLevel 3: Inputs for the asset or liability that are not based on observable market data (that is, unobservable inputs)
Samsung Electronics Co., Ltd. and Subsidiaries
NOTES TO THE INTERIM CONSOLIDATED FINANCIAL STATEMENTS
47
The fair value of financial instruments traded in active markets is based on quoted market prices at the Statement of
Financial Position date. A market is regarded as active if quoted prices are readily and regularly available from an
exchange, dealer, broker, industry group, pricing service, or regulatory agency, and those prices represent actual and
regularly occurring market transactions on an arm’s length basis. The quoted market price used for financial assets
held by the Company is the current bid price. These instruments are included in level 1. Instruments included in level
1 are listed equity investments classified as trading securities or available-for-sale financial assets.
The fair value of financial instruments that are not traded in an active market (for example, over-the-counter
derivatives) is determined by using valuation techniques. These valuation techniques maximize the use of observable
market data where it is available and rely as little as possible on entity specific estimates. If all significant inputs
required to fair value an instrument are observable, the instrument is included in level 2.
If one or more of the significant inputs is not based on observable market data, the instrument is included in level 3.
Specific valuation techniques used to value financial instruments include:
ㆍQuoted market prices or dealer quotes for similar instruments.
ㆍThe fair value of forward foreign exchange contracts is determined using forward exchange rates at the Statement
of Financial Position date, with the resulting value discounted back to present value.
Other techniques, such as discounted cash flow analysis, are used to determine fair value for the remaining financial
instruments. For trade and other receivables, the book value approximates a reasonable estimate of fair value.
25. Segment Information
The chief operating decision maker has been identified as the Management Committee. The Management Committee
is responsible for making strategic decisions based on review of the group’s internal reporting. The Management
Committee has determined the operating segments based on these reports.
The Management Committee reviews operating profits of each operating segment in order to assess performance and
to make decisions about allocating resources to the segment.
The operating segments are product based and include CE, IM, Semiconductor, DP and others. Operating segment
information for the three and nine-months ended September 30, 2012 has been restated in accordance with the
organizational changes and changes in the accounting policies. Depreciation, amortization of intangible assets, and
operating profit were prepared after the allocation of internal transaction adjustments. Total assets and liabilities of
each operating segment are excluded from the disclosure as it has not been provided regularly to the Management
Committee.
Samsung Electronics Co., Ltd. and Subsidiaries
NOTES TO THE INTERIM CONSOLIDATED FINANCIAL STATEMENTS
48
(A) The segment information provided to the Management Committee for the reportable segments for the three
and nine-months ended September 30, 2013 and 2012 is as follows:
(1) For the nine-months ended September 30, 2013
1The total amount includes others not composing operating segments.2Net revenue by segment includes inter-segment revenue by segment.
(2) For the three-months ended September 30, 2013
1The total amount includes others not composing operating segments.2Net revenue by segment includes inter-segment revenue by segment.
(3) For the nine-months ended September 30, 2012
1The total amount includes others not composing operating segments.2Net revenue by segment includes inter-segment revenue by segment.
DS
September 30, 2013(In millions of Korean Won) CE IM Total1
Semiconductor DP Total1
Intercompanyelimination
within the group Consolidated
Total segment revenue 88,715,835 225,454,070 99,731,189 50,191,364 48,068,381 413,159,851 (243,743,809) 169,416,042
Intercompany revenue (52,649,562) (120,523,352) (48,965,309) (23,193,842) (24,693,209) (243,743,809) 243,743,809 -
Net revenue2 36,066,273 104,930,718 50,765,880 26,997,522 23,375,172 169,416,042 - 169,416,042
Depreciation 493,468 463,636 10,210,936 6,933,533 3,136,703 11,525,379 - 11,525,379
Amortization 69,314 140,823 309,268 219,716 77,758 725,792 - 725,792
Operating profit 1,014,309 19,487,577 7,858,030 4,893,293 2,873,712 28,473,735 - 28,473,735
DS
September 30, 2013(In millions of Korean Won) CE IM Total1
Semiconductor DP Total1
Intercompanyelimination
within the group Consolidated
Total segment revenue 30,470,258 77,956,962 36,043,740 18,660,571 16,643,160 144,651,042 (85,567,543) 59,083,499
Intercompany revenue (18,421,839) (41,384,535) (18,139,531) (8,918,574) (8,558,186) (85,567,543) 85,567,543 -
Net revenue212,048,419 36,572,427 17,904,209 9,741,997 8,084,974 59,083,499 - 59,083,499
Depreciation 163,439 164,286 3,481,480 2,363,323 1,071,005 3,939,419 - 3,939,419
Amortization 23,749 48,008 113,686 80,490 28,990 253,891 - 253,891
Operating profit 350,826 6,696,183 3,092,060 2,062,682 984,947 10,163,594 - 10,163,594
DS
September 30, 2012(In millions of Korean Won) CE IM Total1
Semiconductor DP Total1
Intercompanyelimination
within the group Consolidated
Total segment revenue 83,462,989 159,040,918 101,785,882 48,188,068 52,736,636 344,189,915 (199,145,149) 145,044,766
Intercompany revenue (46,913,503) (83,909,154) (51,021,394) (22,892,713) (27,486,521) (199,145,149) 199,145,149 -
Net revenue236,549,486 75,131,764 50,764,488 25,295,355 25,250,115 145,044,766 - 145,044,766
Depreciation 430,755 348,925 10,015,747 6,784,330 3,178,875 11,100,077 - 11,100,077
Amortization 56,372 137,407 191,083 127,256 56,279 571,962 - 571,962
Operating profit 1,624,117 13,944,095 4,858,141 2,752,026 2,108,736 20,212,051 - 20,212,051
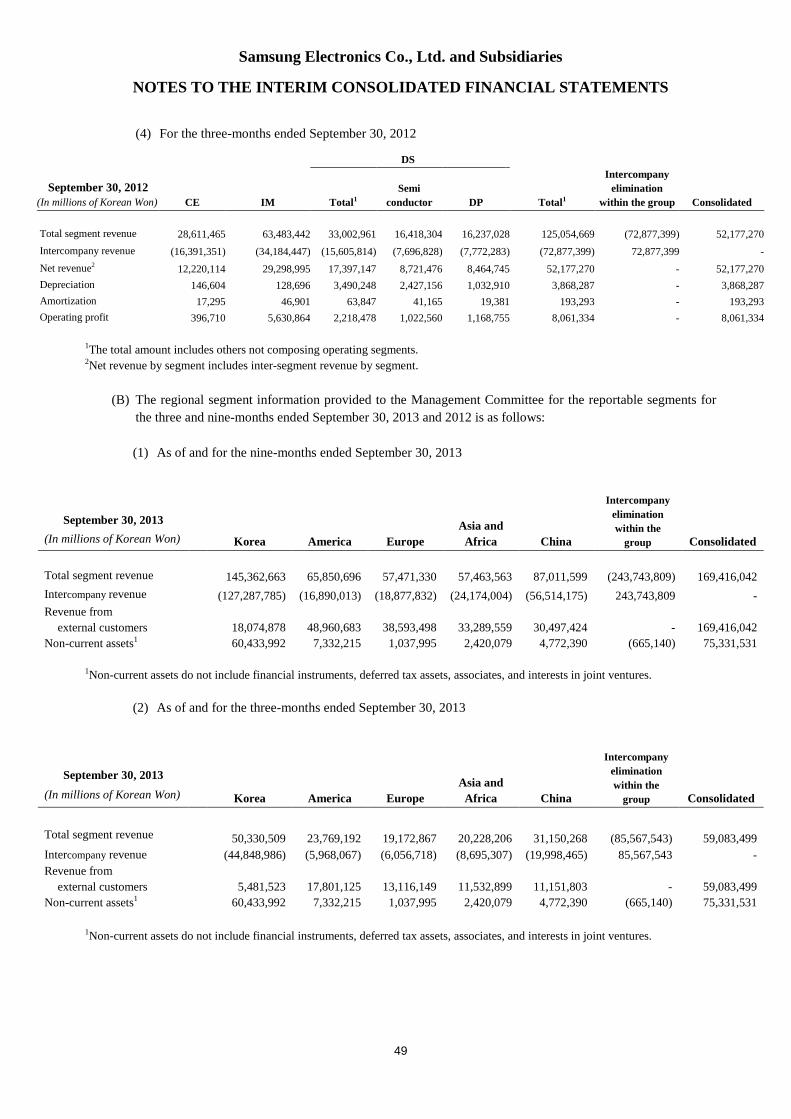
Samsung Electronics Co., Ltd. and Subsidiaries
NOTES TO THE INTERIM CONSOLIDATED FINANCIAL STATEMENTS
49
(4) For the three-months ended September 30, 2012
1The total amount includes others not composing operating segments.2Net revenue by segment includes inter-segment revenue by segment.
(B) The regional segment information provided to the Management Committee for the reportable segments for
the three and nine-months ended September 30, 2013 and 2012 is as follows:
(1) As of and for the nine-months ended September 30, 2013
September 30, 2013
Korea America EuropeAsia and
Africa China
Intercompanyeliminationwithin the
group Consolidated(In millions of Korean Won)
Total segment revenue 145,362,663 65,850,696 57,471,330 57,463,563 87,011,599 (243,743,809) 169,416,042
Intercompany revenue (127,287,785) (16,890,013) (18,877,832) (24,174,004) (56,514,175) 243,743,809 -
Revenue from
external customers 18,074,878 48,960,683 38,593,498 33,289,559 30,497,424 - 169,416,042
Non-current assets1 60,433,992 7,332,215 1,037,995 2,420,079 4,772,390 (665,140) 75,331,531
1Non-current assets do not include financial instruments, deferred tax assets, associates, and interests in joint ventures.
(2) As of and for the three-months ended September 30, 2013
Korea America EuropeAsia and
Africa China
Intercompanyeliminationwithin the
group Consolidated
September 30, 2013(In millions of Korean Won)
Total segment revenue 50,330,509 23,769,192 19,172,867 20,228,206 31,150,268 (85,567,543) 59,083,499
Intercompany revenue (44,848,986) (5,968,067) (6,056,718) (8,695,307) (19,998,465) 85,567,543 -
Revenue from
external customers 5,481,523 17,801,125 13,116,149 11,532,899 11,151,803 - 59,083,499
Non-current assets1 60,433,992 7,332,215 1,037,995 2,420,079 4,772,390 (665,140) 75,331,531
1Non-current assets do not include financial instruments, deferred tax assets, associates, and interests in joint ventures.
DS
September 30, 2012(In millions of Korean Won) CE IM Total1
Semiconductor DP Total1
Intercompanyelimination
within the group Consolidated
Total segment revenue 28,611,465 63,483,442 33,002,961 16,418,304 16,237,028 125,054,669 (72,877,399) 52,177,270
Intercompany revenue (16,391,351) (34,184,447) (15,605,814) (7,696,828) (7,772,283) (72,877,399) 72,877,399 -
Net revenue212,220,114 29,298,995 17,397,147 8,721,476 8,464,745 52,177,270 - 52,177,270
Depreciation 146,604 128,696 3,490,248 2,427,156 1,032,910 3,868,287 - 3,868,287
Amortization 17,295 46,901 63,847 41,165 19,381 193,293 - 193,293
Operating profit 396,710 5,630,864 2,218,478 1,022,560 1,168,755 8,061,334 - 8,061,334
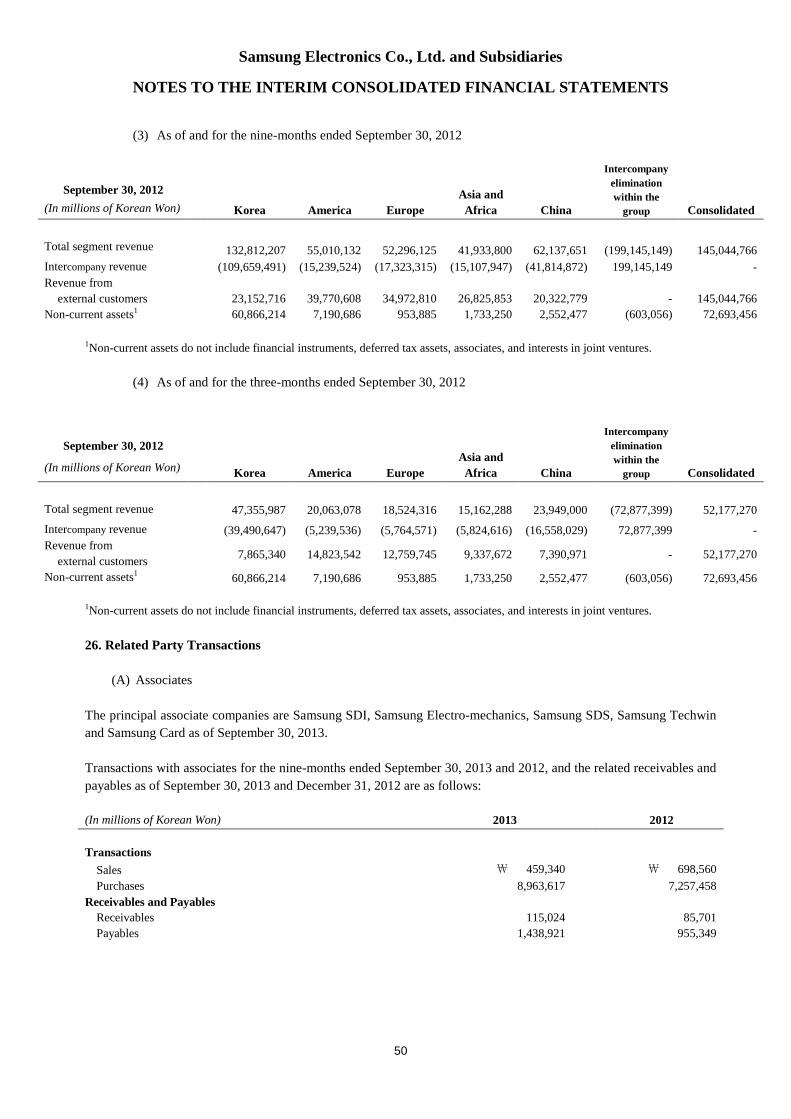
Samsung Electronics Co., Ltd. and Subsidiaries
NOTES TO THE INTERIM CONSOLIDATED FINANCIAL STATEMENTS
50
(3) As of and for the nine-months ended September 30, 2012
September 30, 2012
Korea America EuropeAsia and
Africa China
Intercompanyeliminationwithin the
group Consolidated(In millions of Korean Won)
Total segment revenue 132,812,207 55,010,132 52,296,125 41,933,800 62,137,651 (199,145,149) 145,044,766
Intercompany revenue (109,659,491) (15,239,524) (17,323,315) (15,107,947) (41,814,872) 199,145,149 -
Revenue from
external customers 23,152,716 39,770,608 34,972,810 26,825,853 20,322,779 - 145,044,766
Non-current assets1 60,866,214 7,190,686 953,885 1,733,250 2,552,477 (603,056) 72,693,456
1Non-current assets do not include financial instruments, deferred tax assets, associates, and interests in joint ventures.
(4) As of and for the three-months ended September 30, 2012
September 30, 2012
Korea America EuropeAsia and
Africa China
Intercompanyeliminationwithin the
group Consolidated(In millions of Korean Won)
Total segment revenue 47,355,987 20,063,078 18,524,316 15,162,288 23,949,000 (72,877,399) 52,177,270
Intercompany revenue (39,490,647) (5,239,536) (5,764,571) (5,824,616) (16,558,029) 72,877,399 -
Revenue from
external customers7,865,340 14,823,542 12,759,745 9,337,672 7,390,971 - 52,177,270
Non-current assets160,866,214 7,190,686 953,885 1,733,250 2,552,477 (603,056) 72,693,456
1Non-current assets do not include financial instruments, deferred tax assets, associates, and interests in joint ventures.
26. Related Party Transactions
(A) Associates
The principal associate companies are Samsung SDI, Samsung Electro-mechanics, Samsung SDS, Samsung Techwin
and Samsung Card as of September 30, 2013.
Transactions with associates for the nine-months ended September 30, 2013 and 2012, and the related receivables and
payables as of September 30, 2013 and December 31, 2012 are as follows:
(In millions of Korean Won) 2013 2012
TransactionsSales ₩ 459,340 ₩ 698,560
Purchases 8,963,617 7,257,458
Receivables and PayablesReceivables 115,024 85,701
Payables 1,438,921 955,349
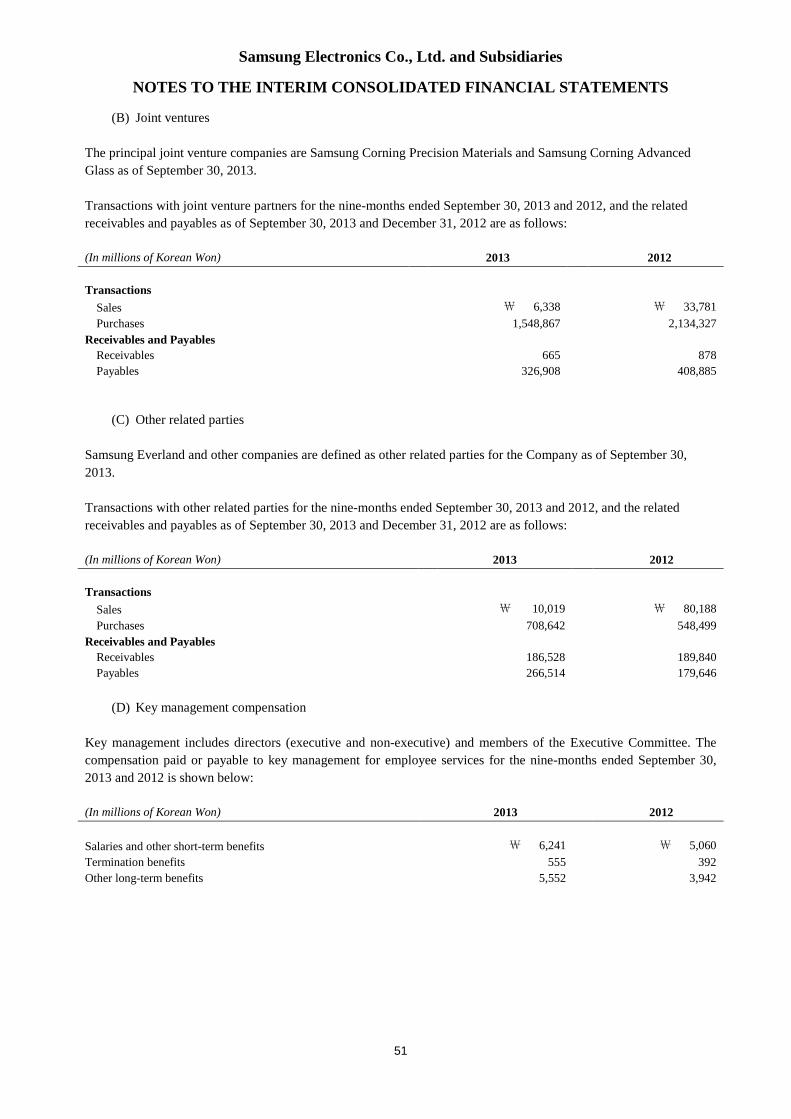
Samsung Electronics Co., Ltd. and Subsidiaries
NOTES TO THE INTERIM CONSOLIDATED FINANCIAL STATEMENTS
51
(B) Joint ventures
The principal joint venture companies are Samsung Corning Precision Materials and Samsung Corning Advanced
Glass as of September 30, 2013.
Transactions with joint venture partners for the nine-months ended September 30, 2013 and 2012, and the related
receivables and payables as of September 30, 2013 and December 31, 2012 are as follows:
(In millions of Korean Won) 2013 2012
TransactionsSales ₩ 6,338 ₩ 33,781
Purchases 1,548,867 2,134,327
Receivables and PayablesReceivables 665 878
Payables 326,908 408,885
(C) Other related parties
Samsung Everland and other companies are defined as other related parties for the Company as of September 30,
2013.
Transactions with other related parties for the nine-months ended September 30, 2013 and 2012, and the related
receivables and payables as of September 30, 2013 and December 31, 2012 are as follows:
(In millions of Korean Won) 2013 2012
TransactionsSales ₩ 10,019 ₩ 80,188
Purchases 708,642 548,499
Receivables and PayablesReceivables 186,528 189,840
Payables 266,514 179,646
(D) Key management compensation
Key management includes directors (executive and non-executive) and members of the Executive Committee. The
compensation paid or payable to key management for employee services for the nine-months ended September 30,
2013 and 2012 is shown below:
(In millions of Korean Won) 2013 2012
Salaries and other short-term benefits ₩ 6,241 ₩ 5,060
Termination benefits 555 392
Other long-term benefits 5,552 3,942
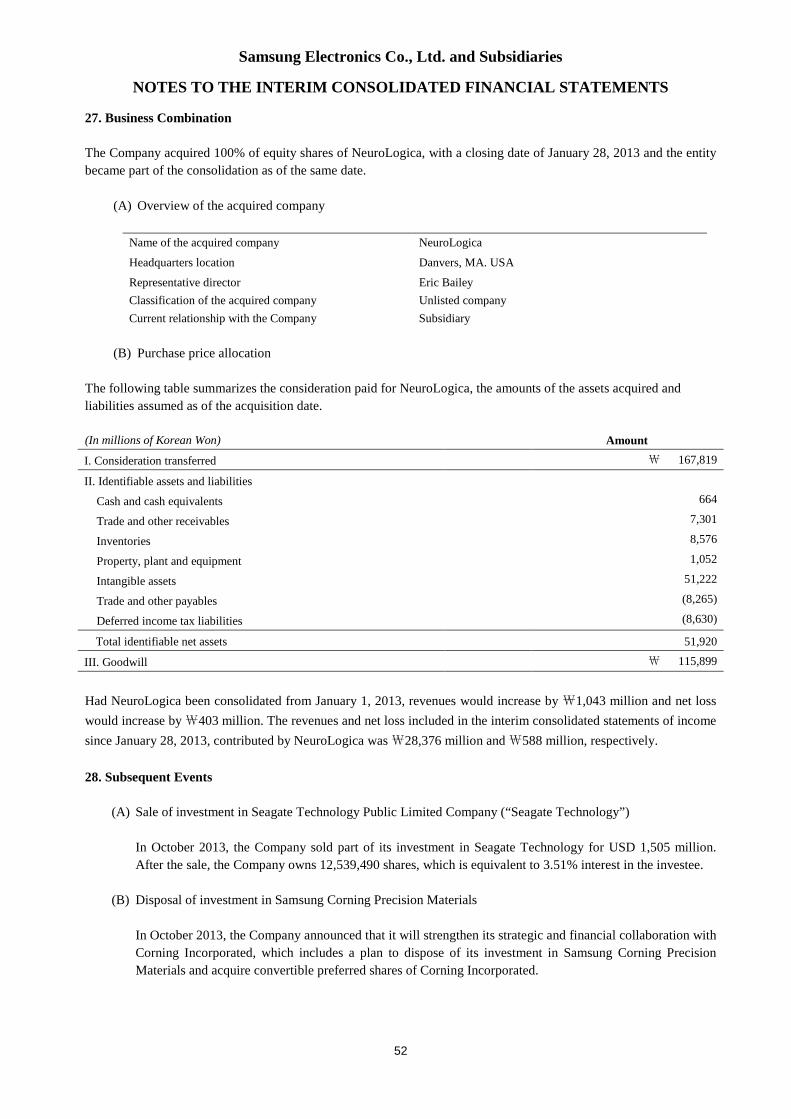
Samsung Electronics Co., Ltd. and Subsidiaries
NOTES TO THE INTERIM CONSOLIDATED FINANCIAL STATEMENTS
52
27. Business Combination
The Company acquired 100% of equity shares of NeuroLogica, with a closing date of January 28, 2013 and the entity
became part of the consolidation as of the same date.
(A) Overview of the acquired company
Name of the acquired company NeuroLogica
Headquarters location Danvers, MA. USA
Representative director Eric Bailey
Classification of the acquired company Unlisted company
Current relationship with the Company Subsidiary
(B) Purchase price allocation
The following table summarizes the consideration paid for NeuroLogica, the amounts of the assets acquired and
liabilities assumed as of the acquisition date.
(In millions of Korean Won) Amount
I. Consideration transferred ₩ 167,819
II. Identifiable assets and liabilities
Cash and cash equivalents 664
Trade and other receivables 7,301
Inventories 8,576
Property, plant and equipment 1,052
Intangible assets 51,222
Trade and other payables (8,265)
Deferred income tax liabilities (8,630)
Total identifiable net assets 51,920
III. Goodwill ₩ 115,899
Had NeuroLogica been consolidated from January 1, 2013, revenues would increase by₩1,043 million and net loss
would increase by₩403 million. The revenues and net loss included in the interim consolidated statements of income
since January 28, 2013, contributed by NeuroLogica was₩28,376 million and₩588 million, respectively.
28. Subsequent Events
(A) Sale of investment in Seagate Technology Public Limited Company (“Seagate Technology”)
In October 2013, the Company sold part of its investment in Seagate Technology for USD 1,505 million.
After the sale, the Company owns 12,539,490 shares, which is equivalent to 3.51% interest in the investee.
(B) Disposal of investment in Samsung Corning Precision Materials
In October 2013, the Company announced that it will strengthen its strategic and financial collaboration with
Corning Incorporated, which includes a plan to dispose of its investment in Samsung Corning Precision
Materials and acquire convertible preferred shares of Corning Incorporated.