Embed Size (px)
Citation preview
The Effect of Grade Retention on Child Test Scores
Samrat Bhattacharya FTAM, Fifth Third Bank1
December 2007
1 Corresponding Address: 600 Superior Avenue, East, Cleveland, Ohio – 44114. E-mail: [email protected]
1
Abstract
Each year an estimated two million children in the United States repeat a grade. Investing
an additional year in the same grade is expected to help a child to acquire the academic
skills she lacks. This, in turn, would help her to be successful in higher grades. In spite of
its popularity, grade retention remains a highly controversial practice. A majority of
researchers find that, for the repeaters, repeating a grade is strongly correlated with the
poor performance in mathematics and reading tests. In this paper I examine whether
repeating a grade adds value to the academic performance of repeaters as measured by
their improvement in mathematics and reading test scores. I focus on retention in grades
one to five. I use data from the 1979 National Longitudinal Survey of Youth (NLSY79)
and the NLSY79 Child Survey. Using a difference-in-difference propensity score
matching estimator I find that repeating a grade does not lead to an improvement in a
repeaters’ performance in these tests. On contrary, repeating a grade adversely affects
their performance in these tests.
Key words: Grade retention, repeaters, test score, propensity score, matching estimator
JEL Classifications: I2, J1, J2
2
1. Introduction2
Recent education policies to make schools accountable for children’s academic
performance focus on improving reading and mathematics test scores of children (No
Child Left Behind Act of 2001). States are expected to set standards for a grade based on
these test scores. Failure to meet these standards may lead to retention of a child in that
grade.3 This is a move away from the popular practice of social promotion where a child
is promoted to a higher grade irrespective of her performance in the class. Investing an
additional year in the same grade is expected to help a child to acquire the academic skills
she lacks. This, in turn, would help her to be successful at higher grades.
Grade retention is a very popular practice. Parents in the National Household
Education Survey report that around ten percent of children were either repeating first
grade or had repeated kindergarten in 1991. This number is approximately seven percent
in 1995. About one-fifth of all eight graders had repeated at least one grade based on
figures from the National Educational Longitudinal Survey of 1998. In a recent study,
Eide and Showalter (2001) estimates approximately two million children repeat a grade
in school in the U.S. every year. Given the average expenditure per pupil in public
schools of $7,013 in constant 1998-99 dollars, this would imply an additional annual cost
of approximately $14 billion for the public school system (NCES 2001).
2 I thank Audrey Light, Bruce Weinberg and Lucia Dunn for their helpful comments. I also benefited from discussion with Abdul Munasib. The views expressed are of the author and not necessarily of the Fifth Third Bank. 3 There is no uniform retention policy across different states in the United States. With the passage of the No Child Left Behind Act of 2001, more and more states are moving towards establishing retention policies based on reading and mathematics assessments. As of 2005, there were twelve states that passed legislation or directed their state boards to implement “promotion gate” policies. Promotion gate is a performance threshold that a student is expected to meet prior to being promoted to a higher grade. However, states are given a free hand in deciding specific tests used for assessing the progress and eligibility criteria for passing these tests.
3
Grade retention remains a highly controversial practice with the existing evidence
heavily stacked against its effectiveness in improving a repeaters’ academic performance.
Researchers find that repeating a grade is strongly correlated with the poor performance
in mathematics and reading tests of repeaters (Holmes 1989; Ferguson, Jimerson and
Dalton 2001; Jimerson et. al. 1997; Lorence et. al. 2002; Nagaoka and Roderick 2004;
Shephard and Smith 1987). However, a limited number of studies have also found
moderate, positive effects of retention on test scores (Karweit 1999; Alexander, Entwisle
and Dauber 2004; Jacob and Lefgren 2002; Greene and Winters 2007). It still remains an
open and an important question as to whether repeating a grade adds value in terms of
improving test scores of repeaters.
There is an important methodological issue that has not been addressed
adequately by the previous researchers (Alexander, Entwisle and Dauber 2004 and Jacob
and Lefgren 2002 are notable exceptions). To estimate the value-added from repeating a
grade one needs to estimate how repeaters would have performed in a test if they had not
repeated a grade. However, we do not observe this information because at any point in
time a child could be either in the repeat or non-repeat group. This is essentially a
missing data problem.4 Studies examining the effect of grade retention on test scores take
the average test scores of non-repeaters as a proxy for what repeaters would have done
had they not repeated a grade. As long as repeaters represent a random group of children
this comparison gives a correct estimate of the value added from repeating a grade.
However, repeaters are not likely to be a random group of children. There could be
important observable and unobservable differences between repeaters and non-repeaters.
4 This is also referred to as selection bias problem because children are not randomly selected to be retained in a class.
4
For example, it is possible that children who repeat a grade have lower innate ability than
those who don’t and the difference in performance between these two groups of children
simply reflects this difference in innate abilities.
In this paper I examine whether repeating a grade adds value to the academic
performance of repeaters as measured by their improvement in mathematics and reading
test scores. I focus on retention in elementary school (grades one to five).5 I use data from
the 1979 National Longitudinal Survey of Youth (NLSY79) and the NLSY79 Child
Survey. My outcome variables are mathematics and reading recognition assessments
from the Peabody Individual Achievement Test (PIAT). My choice of outcome variables
reflects the present policy drive to improve the mathematics and reading test scores at
different grade levels. This study covers the period 1979 to 2002. I use a propensity score
matching estimator to obtain the value-added from repeating a grade. Intuitively, a
weighted average of test scores of non-repeater(s) is compared with the test score of a
repeater, where weights are functions of ex-ante probability of repeating. Furthermore, by
using pre- and post-retention test scores I am able to difference out time-invariant family
and child characteristics such as child’s innate ability, parent’s motivation which are
likely to be correlated with both the retention decision and test scores.6
I find that repeating a grade does not add value in terms of improved mathematics
and reading test scores for the repeaters. For the mathematics test I find that children who
repeat a grade, on average, scores 0.30 standard deviations below what they would have
scored if they had not repeated a grade. I obtain similar result for the reading test.
5 My choice of focusing on retention in grades one to five is determined by (a) data availability and (b) most of the retention takes place in early grades, particularly in kindergarten and grade one (Karweit 1999). 6 Hence the name difference-in-difference propensity score matching estimator (Heckman, Ichimura and Todd 1997).
5
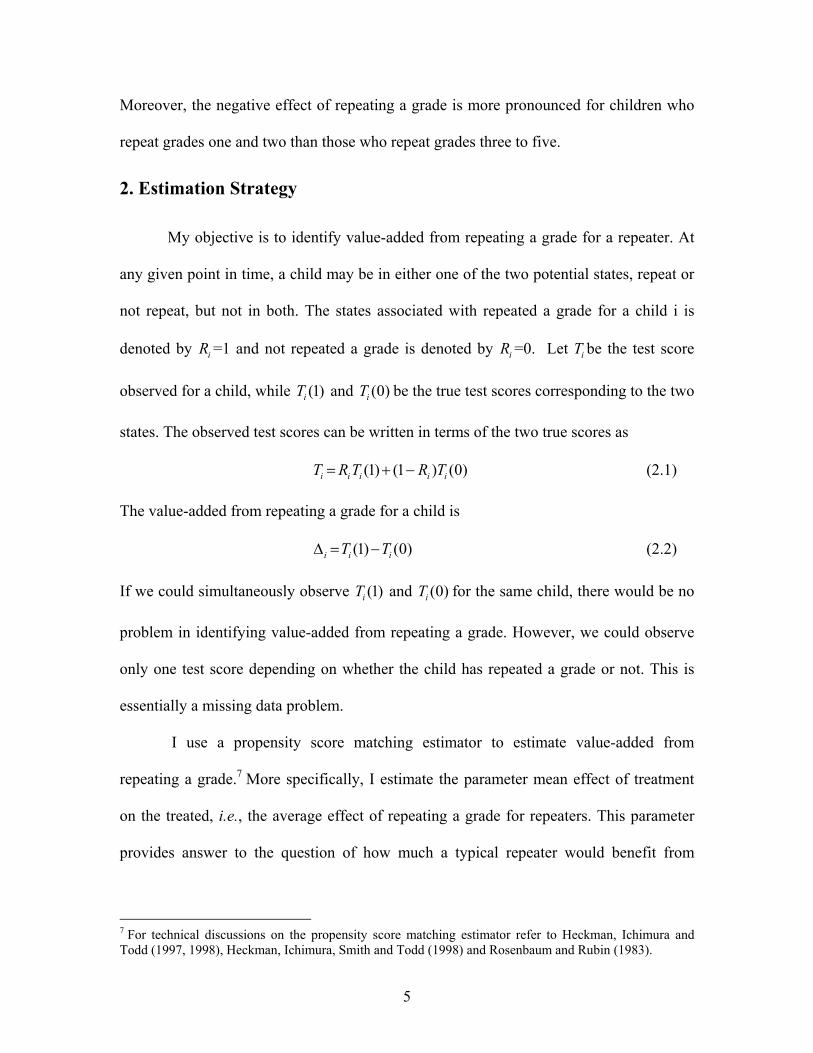
Moreover, the negative effect of repeating a grade is more pronounced for children who
repeat grades one and two than those who repeat grades three to five.
2. Estimation Strategy
My objective is to identify value-added from repeating a grade for a repeater. At
any given point in time, a child may be in either one of the two potential states, repeat or
not repeat, but not in both. The states associated with repeated a grade for a child i is
denoted by iR =1 and not repeated a grade is denoted by iR =0. Let iT be the test score
observed for a child, while (1)iT and (0)iT be the true test scores corresponding to the two
states. The observed test scores can be written in terms of the two true scores as
(1) (1 ) (0)i i i i iT R T R T= + − (2.1)
The value-added from repeating a grade for a child is
(1) (0)i i iT T∆ = − (2.2)
If we could simultaneously observe (1)iT and (0)iT for the same child, there would be no
problem in identifying value-added from repeating a grade. However, we could observe
only one test score depending on whether the child has repeated a grade or not. This is
essentially a missing data problem.
I use a propensity score matching estimator to estimate value-added from
repeating a grade.7 More specifically, I estimate the parameter mean effect of treatment
on the treated, i.e., the average effect of repeating a grade for repeaters. This parameter
provides answer to the question of how much a typical repeater would benefit from
7 For technical discussions on the propensity score matching estimator refer to Heckman, Ichimura and Todd (1997, 1998), Heckman, Ichimura, Smith and Todd (1998) and Rosenbaum and Rubin (1983).
6
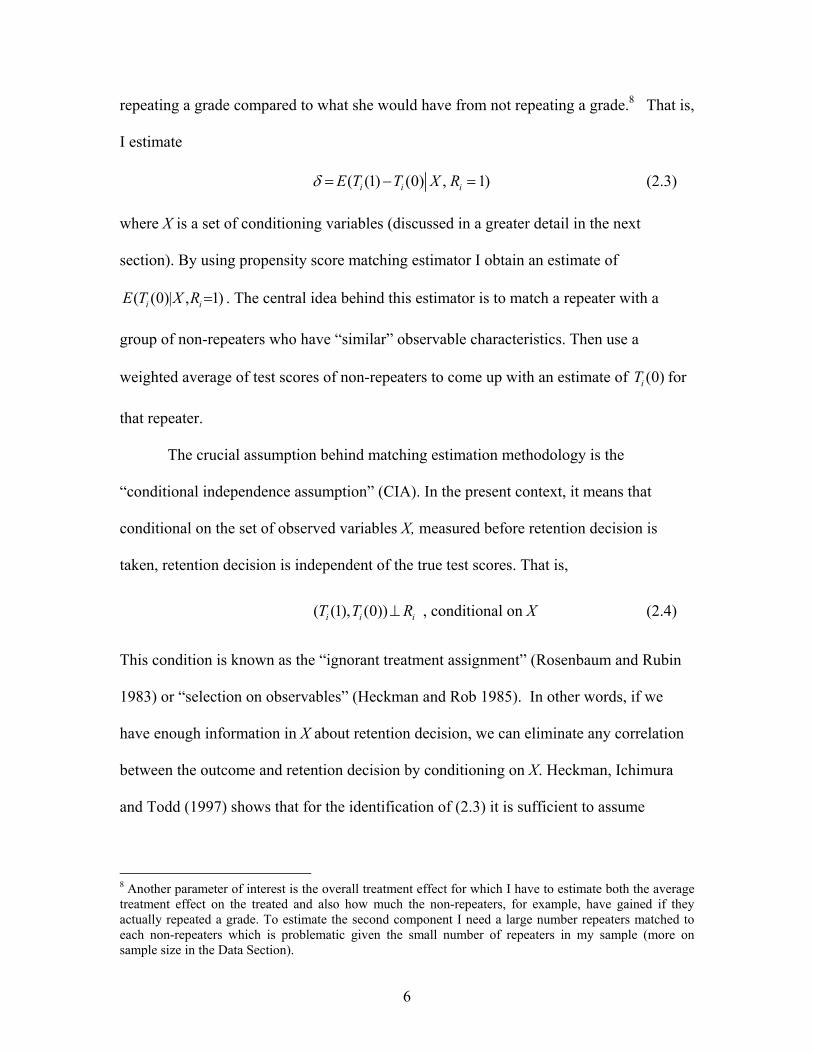
repeating a grade compared to what she would have from not repeating a grade.8 That is,
I estimate
( (1) (0) , 1)i i iE T T X Rδ = − = (2.3)
where X is a set of conditioning variables (discussed in a greater detail in the next
section). By using propensity score matching estimator I obtain an estimate of
( (0)| , 1)i iE T X R = . The central idea behind this estimator is to match a repeater with a
group of non-repeaters who have “similar” observable characteristics. Then use a
weighted average of test scores of non-repeaters to come up with an estimate of (0)iT for
that repeater.
The crucial assumption behind matching estimation methodology is the
“conditional independence assumption” (CIA). In the present context, it means that
conditional on the set of observed variables X, measured before retention decision is
taken, retention decision is independent of the true test scores. That is,
( (1), (0))i i iT T R⊥ , conditional on X (2.4)
This condition is known as the “ignorant treatment assignment” (Rosenbaum and Rubin
1983) or “selection on observables” (Heckman and Rob 1985). In other words, if we
have enough information in X about retention decision, we can eliminate any correlation
between the outcome and retention decision by conditioning on X. Heckman, Ichimura
and Todd (1997) shows that for the identification of (2.3) it is sufficient to assume
8 Another parameter of interest is the overall treatment effect for which I have to estimate both the average treatment effect on the treated and also how much the non-repeaters, for example, have gained if they actually repeated a grade. To estimate the second component I need a large number repeaters matched to each non-repeaters which is problematic given the small number of repeaters in my sample (more on sample size in the Data Section).
7
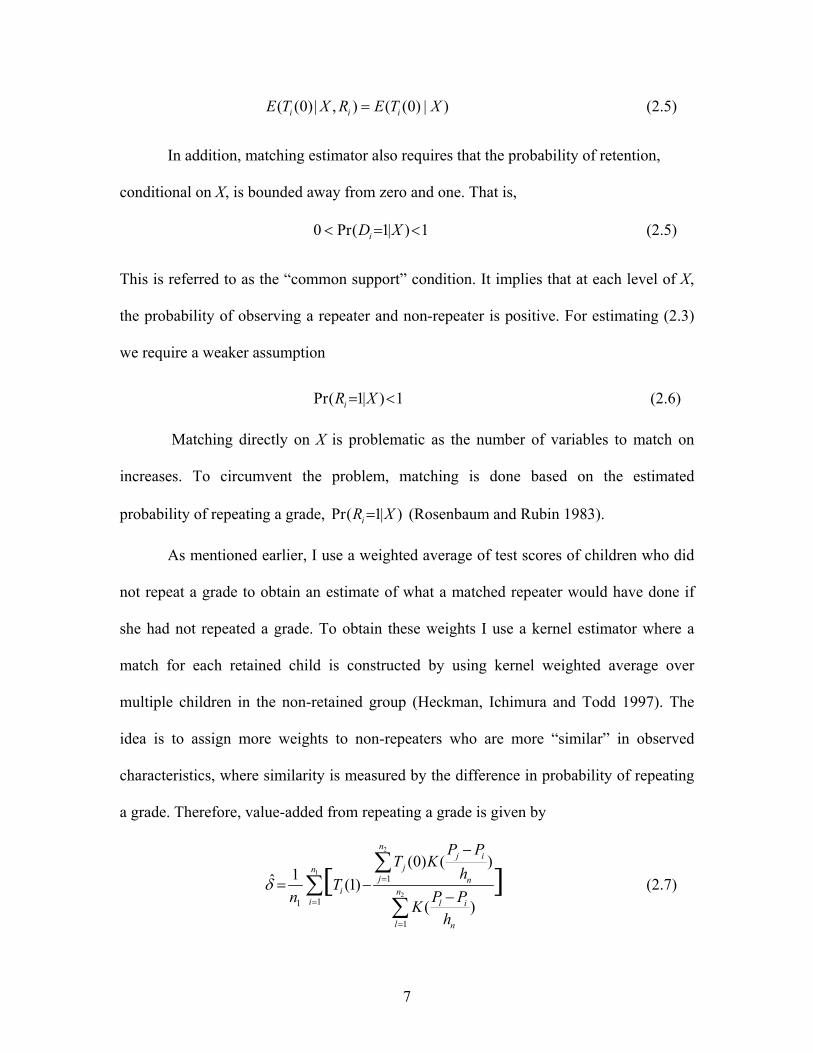
( (0)| , ) ( (0) | )i i iE T X R E T X= (2.5)
In addition, matching estimator also requires that the probability of retention,
conditional on X, is bounded away from zero and one. That is,
0 Pr( 1| ) 1iD X< = < (2.5)
This is referred to as the “common support” condition. It implies that at each level of X,
the probability of observing a repeater and non-repeater is positive. For estimating (2.3)
we require a weaker assumption
Pr( 1| ) 1iR X= < (2.6)
Matching directly on X is problematic as the number of variables to match on
increases. To circumvent the problem, matching is done based on the estimated
probability of repeating a grade, Pr( 1| )iR X= (Rosenbaum and Rubin 1983).
As mentioned earlier, I use a weighted average of test scores of children who did
not repeat a grade to obtain an estimate of what a matched repeater would have done if
she had not repeated a grade. To obtain these weights I use a kernel estimator where a
match for each retained child is constructed by using kernel weighted average over
multiple children in the non-retained group (Heckman, Ichimura and Todd 1997). The
idea is to assign more weights to non-repeaters who are more “similar” in observed
characteristics, where similarity is measured by the difference in probability of repeating
a grade. Therefore, value-added from repeating a grade is given by
2
1
2
1
11
1
(0) ( )1ˆ (1)
( )[ ]
nj i
jnj n
i ni l i
l n
P PT K
hT
P Pn Kh
δ =
=
=
−
= −−
∑∑
∑ (2.7)
8
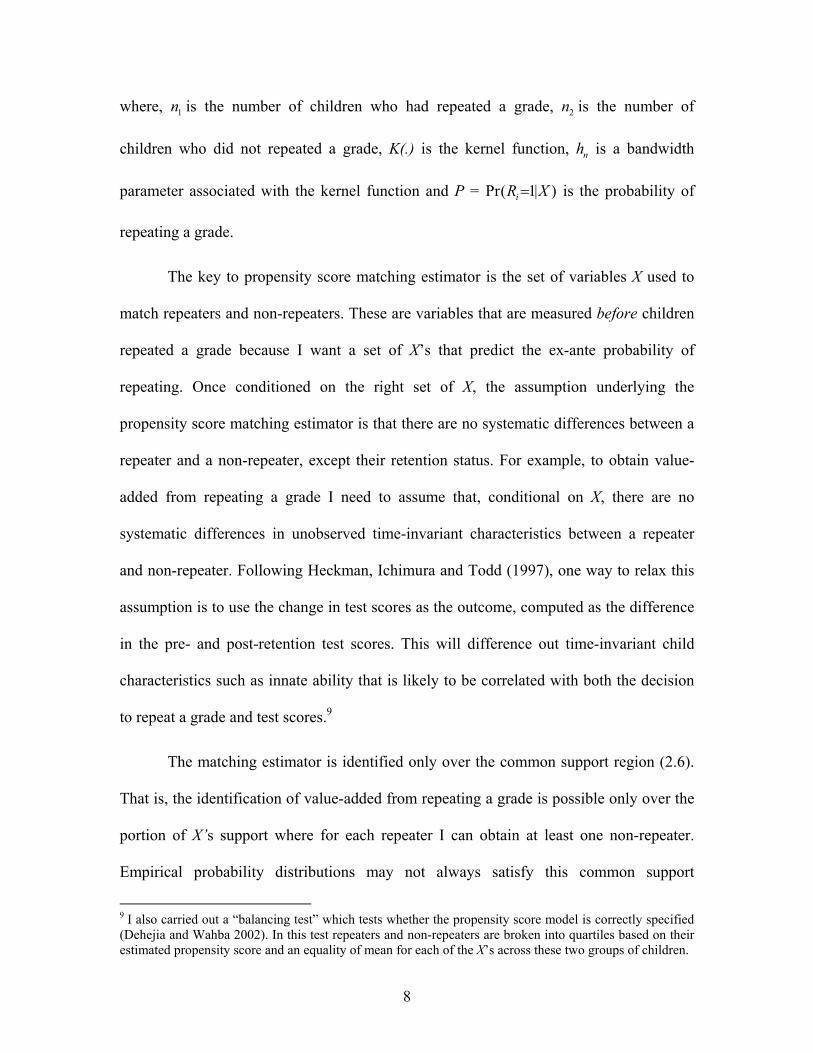
where, 1n is the number of children who had repeated a grade, 2n is the number of
children who did not repeated a grade, K(.) is the kernel function, nh is a bandwidth
parameter associated with the kernel function and P = Pr( 1| )iR X= is the probability of
repeating a grade.
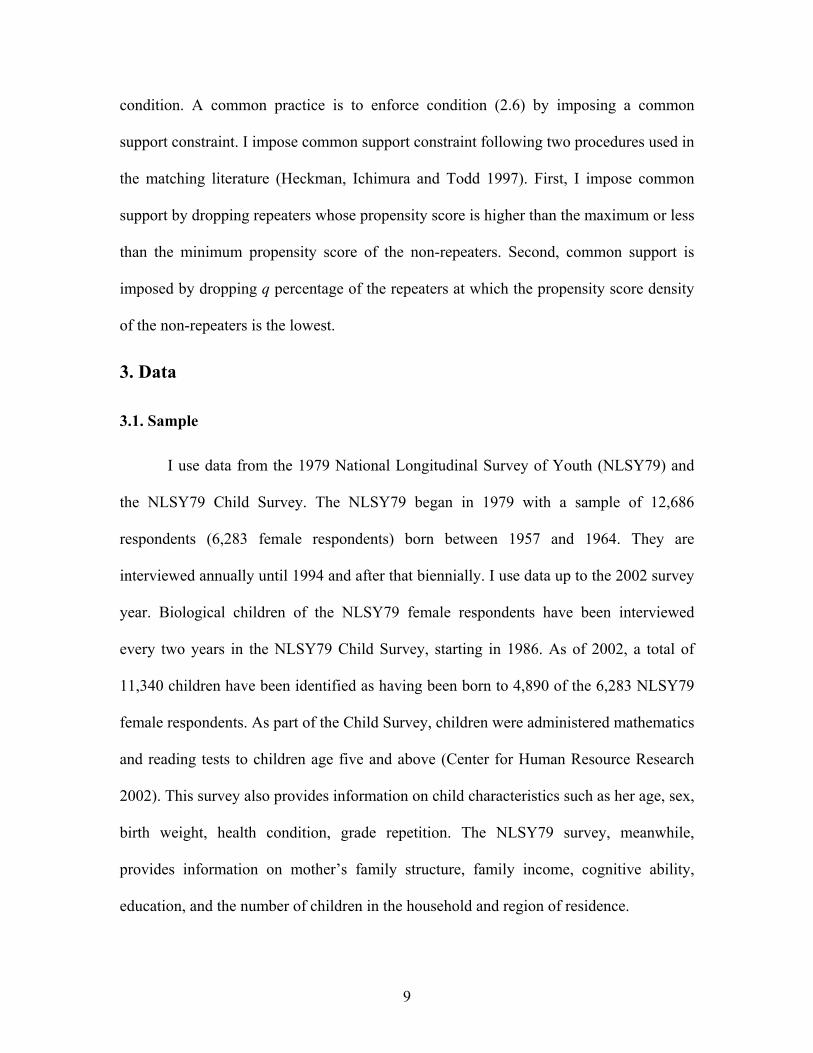
The key to propensity score matching estimator is the set of variables X used to
match repeaters and non-repeaters. These are variables that are measured before children
repeated a grade because I want a set of X’s that predict the ex-ante probability of
repeating. Once conditioned on the right set of X, the assumption underlying the
propensity score matching estimator is that there are no systematic differences between a
repeater and a non-repeater, except their retention status. For example, to obtain value-
added from repeating a grade I need to assume that, conditional on X, there are no
systematic differences in unobserved time-invariant characteristics between a repeater
and non-repeater. Following Heckman, Ichimura and Todd (1997), one way to relax this
assumption is to use the change in test scores as the outcome, computed as the difference
in the pre- and post-retention test scores. This will difference out time-invariant child
characteristics such as innate ability that is likely to be correlated with both the decision
to repeat a grade and test scores.9
The matching estimator is identified only over the common support region (2.6).
That is, the identification of value-added from repeating a grade is possible only over the
portion of X’s support where for each repeater I can obtain at least one non-repeater.
Empirical probability distributions may not always satisfy this common support
9 I also carried out a “balancing test” which tests whether the propensity score model is correctly specified (Dehejia and Wahba 2002). In this test repeaters and non-repeaters are broken into quartiles based on their estimated propensity score and an equality of mean for each of the X’s across these two groups of children.
9
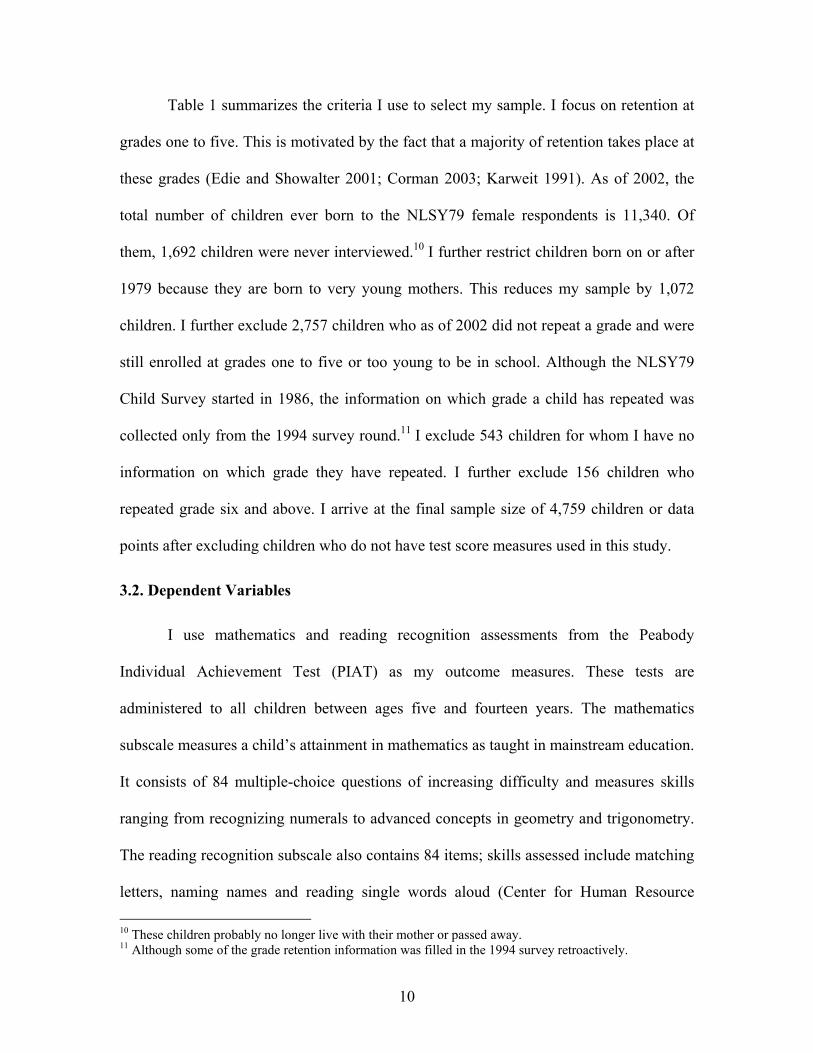
condition. A common practice is to enforce condition (2.6) by imposing a common
support constraint. I impose common support constraint following two procedures used in
the matching literature (Heckman, Ichimura and Todd 1997). First, I impose common
support by dropping repeaters whose propensity score is higher than the maximum or less
than the minimum propensity score of the non-repeaters. Second, common support is
imposed by dropping q percentage of the repeaters at which the propensity score density
of the non-repeaters is the lowest.
3. Data
3.1. Sample
I use data from the 1979 National Longitudinal Survey of Youth (NLSY79) and
the NLSY79 Child Survey. The NLSY79 began in 1979 with a sample of 12,686
respondents (6,283 female respondents) born between 1957 and 1964. They are
interviewed annually until 1994 and after that biennially. I use data up to the 2002 survey
year. Biological children of the NLSY79 female respondents have been interviewed
every two years in the NLSY79 Child Survey, starting in 1986. As of 2002, a total of
11,340 children have been identified as having been born to 4,890 of the 6,283 NLSY79
female respondents. As part of the Child Survey, children were administered mathematics
and reading tests to children age five and above (Center for Human Resource Research
2002). This survey also provides information on child characteristics such as her age, sex,
birth weight, health condition, grade repetition. The NLSY79 survey, meanwhile,
provides information on mother’s family structure, family income, cognitive ability,
education, and the number of children in the household and region of residence.
10
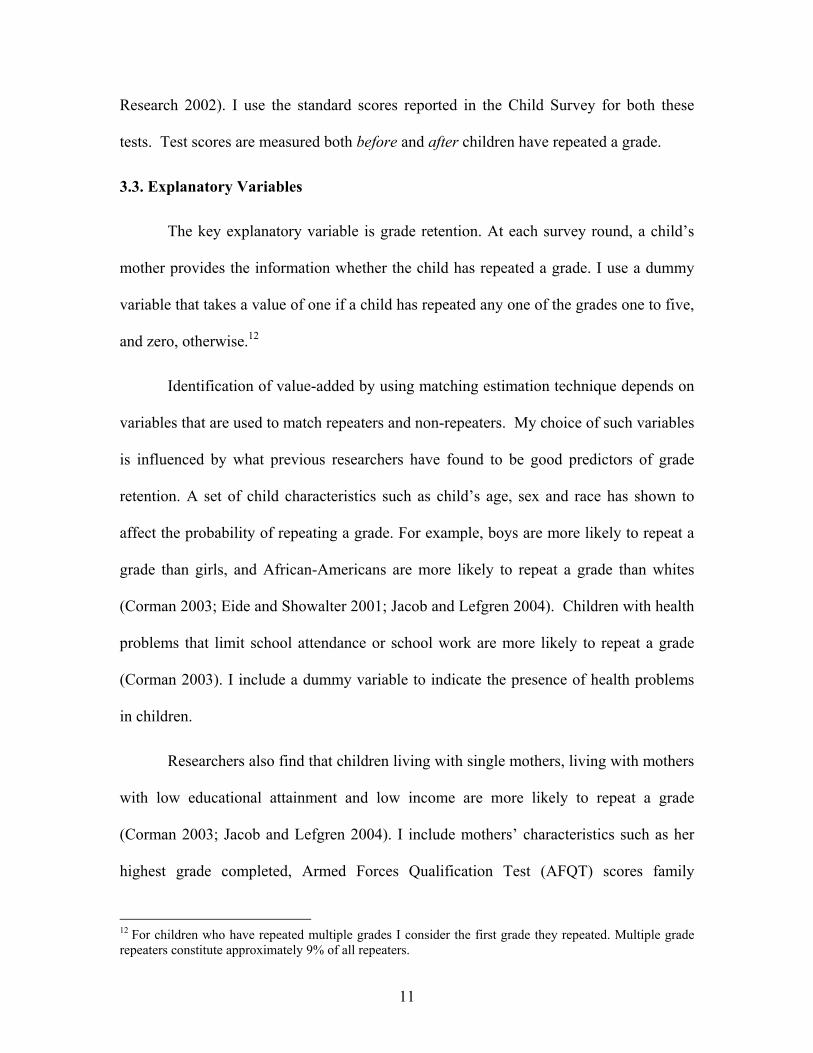
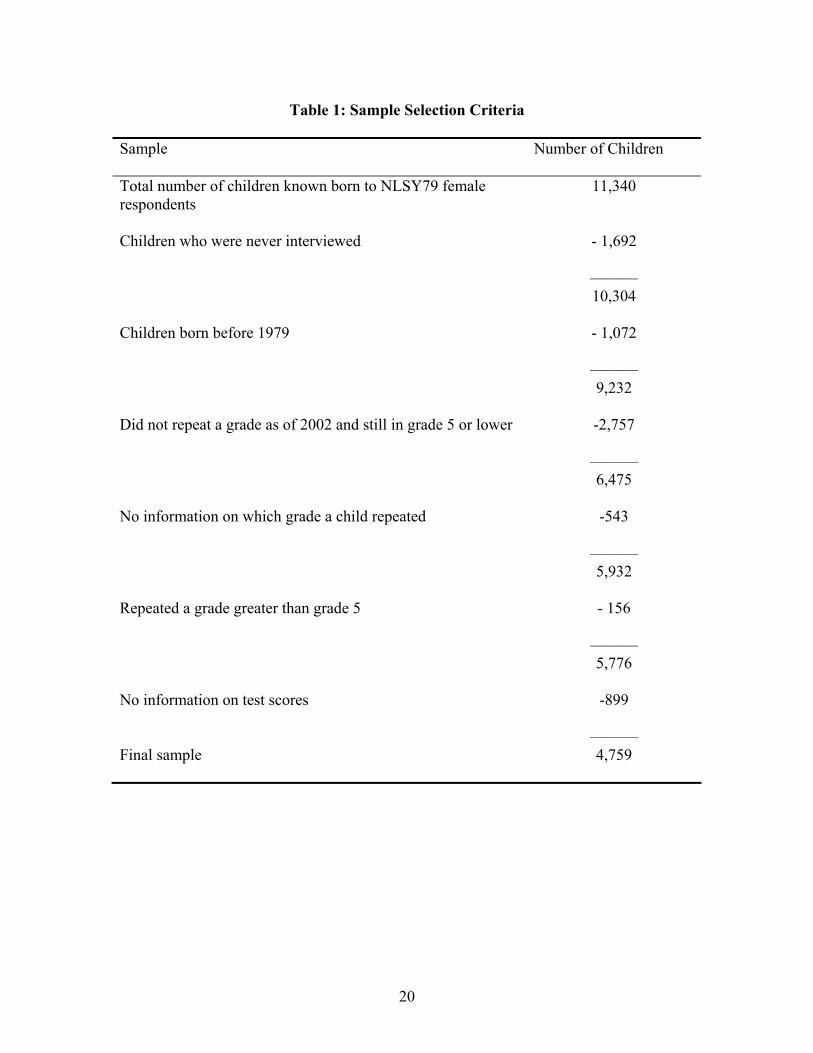
Table 1 summarizes the criteria I use to select my sample. I focus on retention at
grades one to five. This is motivated by the fact that a majority of retention takes place at
these grades (Edie and Showalter 2001; Corman 2003; Karweit 1991). As of 2002, the
total number of children ever born to the NLSY79 female respondents is 11,340. Of
them, 1,692 children were never interviewed.10 I further restrict children born on or after
1979 because they are born to very young mothers. This reduces my sample by 1,072
children. I further exclude 2,757 children who as of 2002 did not repeat a grade and were
still enrolled at grades one to five or too young to be in school. Although the NLSY79
Child Survey started in 1986, the information on which grade a child has repeated was
collected only from the 1994 survey round.11 I exclude 543 children for whom I have no
information on which grade they have repeated. I further exclude 156 children who
repeated grade six and above. I arrive at the final sample size of 4,759 children or data
points after excluding children who do not have test score measures used in this study.
3.2. Dependent Variables
I use mathematics and reading recognition assessments from the Peabody
Individual Achievement Test (PIAT) as my outcome measures. These tests are
administered to all children between ages five and fourteen years. The mathematics
subscale measures a child’s attainment in mathematics as taught in mainstream education.
It consists of 84 multiple-choice questions of increasing difficulty and measures skills
ranging from recognizing numerals to advanced concepts in geometry and trigonometry.
The reading recognition subscale also contains 84 items; skills assessed include matching
letters, naming names and reading single words aloud (Center for Human Resource 10 These children probably no longer live with their mother or passed away. 11 Although some of the grade retention information was filled in the 1994 survey retroactively.
11
Research 2002). I use the standard scores reported in the Child Survey for both these
tests. Test scores are measured both before and after children have repeated a grade.
3.3. Explanatory Variables
The key explanatory variable is grade retention. At each survey round, a child’s
mother provides the information whether the child has repeated a grade. I use a dummy
variable that takes a value of one if a child has repeated any one of the grades one to five,
and zero, otherwise.12
Identification of value-added by using matching estimation technique depends on
variables that are used to match repeaters and non-repeaters. My choice of such variables
is influenced by what previous researchers have found to be good predictors of grade
retention. A set of child characteristics such as child’s age, sex and race has shown to
affect the probability of repeating a grade. For example, boys are more likely to repeat a
grade than girls, and African-Americans are more likely to repeat a grade than whites
(Corman 2003; Eide and Showalter 2001; Jacob and Lefgren 2004). Children with health
problems that limit school attendance or school work are more likely to repeat a grade
(Corman 2003). I include a dummy variable to indicate the presence of health problems
in children.
Researchers also find that children living with single mothers, living with mothers
with low educational attainment and low income are more likely to repeat a grade
(Corman 2003; Jacob and Lefgren 2004). I include mothers’ characteristics such as her
highest grade completed, Armed Forces Qualification Test (AFQT) scores family
12 For children who have repeated multiple grades I consider the first grade they repeated. Multiple grade repeaters constitute approximately 9% of all repeaters.
12
income, family structure, and number of children in the household in the study.13 I also
include a set of dummy indicating whether the child lives in the northeast, north central,
south or western region of the United States. All these variables, except the information
on child health, are measured before a child enters school, i.e., before age five of a child.
3.4. Descriptive Statistics
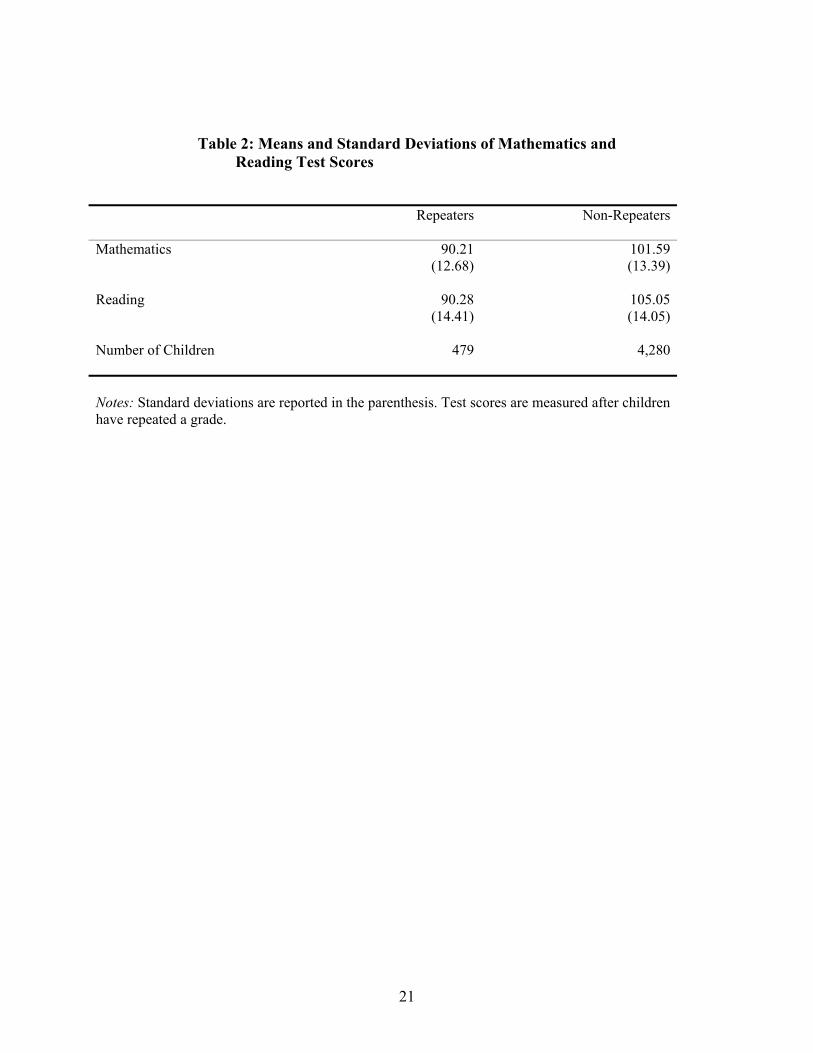
Table 2 reports means and standard deviations of mathematics and reading test
scores used in this study. For repeaters these test scores are measured after they have
repeated a grade. Approximately 10% of children in my sample have repeated grades one
to five. Children who repeat a grade have, on average, lower mathematics and reading
test scores. For example, children who repeat a grade, on average, score 11.38 lower in
the mathematics test than those who did not repeat a grade. This is equivalent to 0.75
standard deviations and is statistically significant at 5% significance level.14 For the
reading test, the corresponding difference is 14.77 points or 0.98 standard deviations and
is statistically significant at 5% significance level.
Table 3 reports sample means and standard deviations of explanatory variables
used in matching repeaters and non-repeaters. A child who repeats a grade is more likely
to be male, African-American, have a health problem that limits her school work and
lower birth weight than a child who did not repeat a grade. These differences are
statistically significant at 5% significance level. For example, forty percent of repeaters
are female compared to fifty-one percent of non-repeaters; forty-nine percent repeaters
are African-Americans compare to only twenty-eight percent of non-repeaters. Twenty- 13 Total family income is the sum of wages and salaries including tips, income from farm and business, military income, unemployment benefits, AFDC and SSI receipts, food stamps, and other income received by the mother and her spouse (partner), measured for the past calendar year. 14 1 standard deviation is 15 points in the mathematics and reading tests.
13
four percent of repeaters have attended a Head Start program compared to only fourteen
percent of non-repeaters. Mother of a repeater, on average, have completed fewer years
of schooling, have lower scores on their AFQT test and low family income than mother
of a non-repeater.15 For example, mother of a repeater have mean AFQT score of only
17.85 compare to the mean score of 35.78 of a non-repeater’s mother. Similarly, the
difference in annual family income between a mother of repeater and non-repeater is over
$10,000. Furthermore, forty-six percent of repeaters are from single-mother households
compare to twenty-seven percent of non-repeaters. Finally, comparing mathematics and
reading test scores measured at an age before children have repeated a grade, I find that
would-be repeaters were performing poorly in these tests compared to their non-repeater
counterparts. For instance, would-be repeaters were scoring 7.92 points or 0.52 standard
deviations lower in the mathematics test than the non-repeaters.
4. Empirical Results
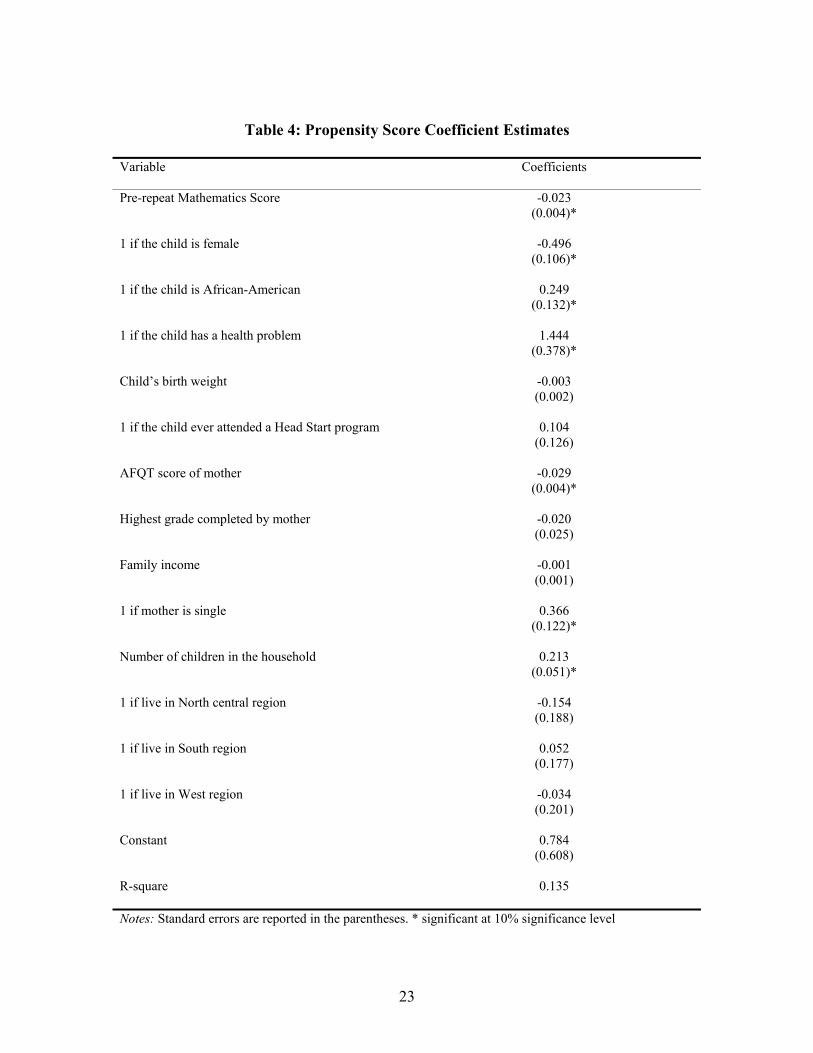
For matching estimator I first compute the probability of repeating a grade for a
child by estimating a logistic regression where the dependent variable is a dummy
variable that takes on a value of one, if a child repeats a grade and zero, otherwise. The
independent variables used in the logistic regression are given in the Table 4. Findings
are consistent with what I reported in the descriptive statistics section. Being an African-
American, male and having health problems significantly increases the probability of
being retained. Having a lower birth weight also positively affects the probability of
repeating a grade. Attending a Head Start program also positively, although not
statistically significant, affects the probability of retention. Mother’s characteristics such
15 These differences are statistically significant.
14
as lower score on the AFQT test, lower years of schooling and being single significantly
increases the probability of retention. Belonging to a family with lower income level also
increases, although not statistically significant, the probability of retention. A larger
number of children in the household also significantly increase the probability of
retention. This specification of the propensity score model satisfies the balancing test
discussed in section 2.
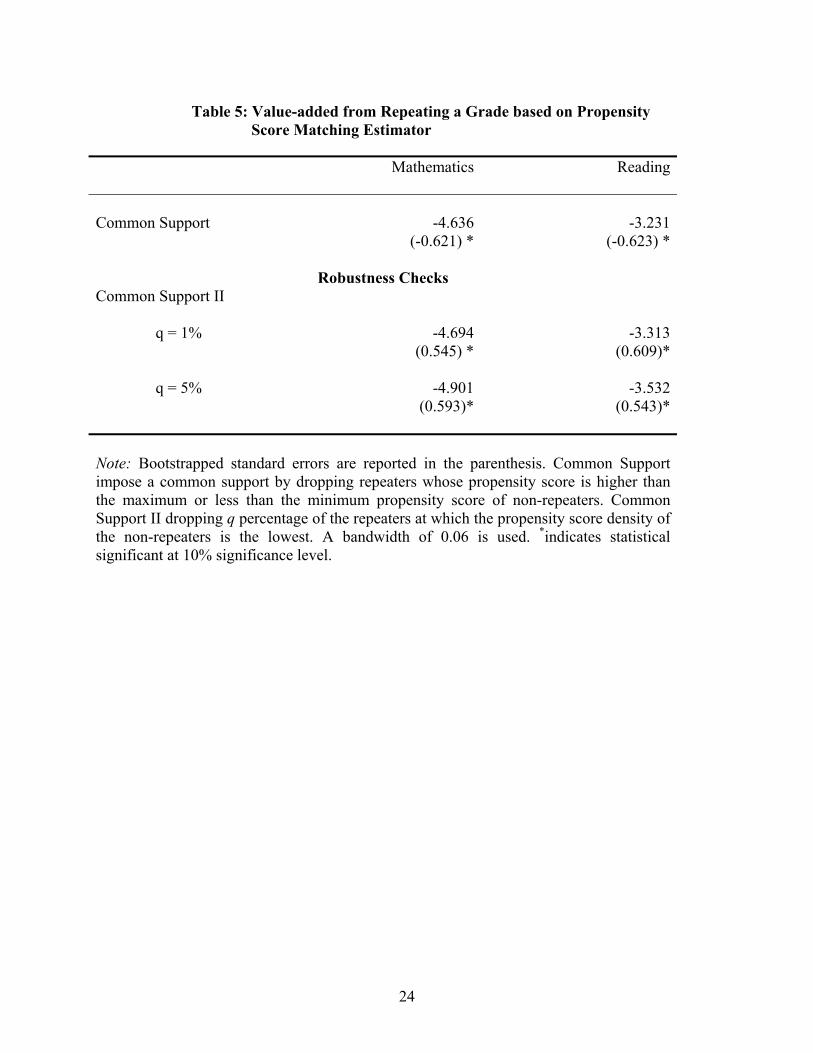
Table 5 reports the value-added from repeating a grade for the repeaters obtained
from the propensity score matching estimator. I find that repeaters score 4.63 points or
0.30 standard deviations lower in the mathematics test than what they would have if they
had not repeated a grade and this difference is statistically significant (row one of the
Table 5). Similarly, the repeaters score a statistically significant 3.23 points or 0.21
standard deviations lower in the reading test than what they would have if they had not
repeated a grade (row one of the Table 5). Therefore, repeating a grade does not help a
child to improve her academic performance — a finding contrary to the popular belief.
The conclusion is robust to different common support specifications (rows two and three
of Table 5). On average, for the failing students just spending an additional year in a
grade is not enough to improve their test scores. Of course, “repeating a grade” does not
mean same thing for all the repeaters. Some may get more attention in school and home
than others while they were repeating a grade. I do not have information on what kind of
treatment children were exposed to during the year they were repeating a grade. All I can
conclude is that, on average, there is no value-added from repeating a grade.
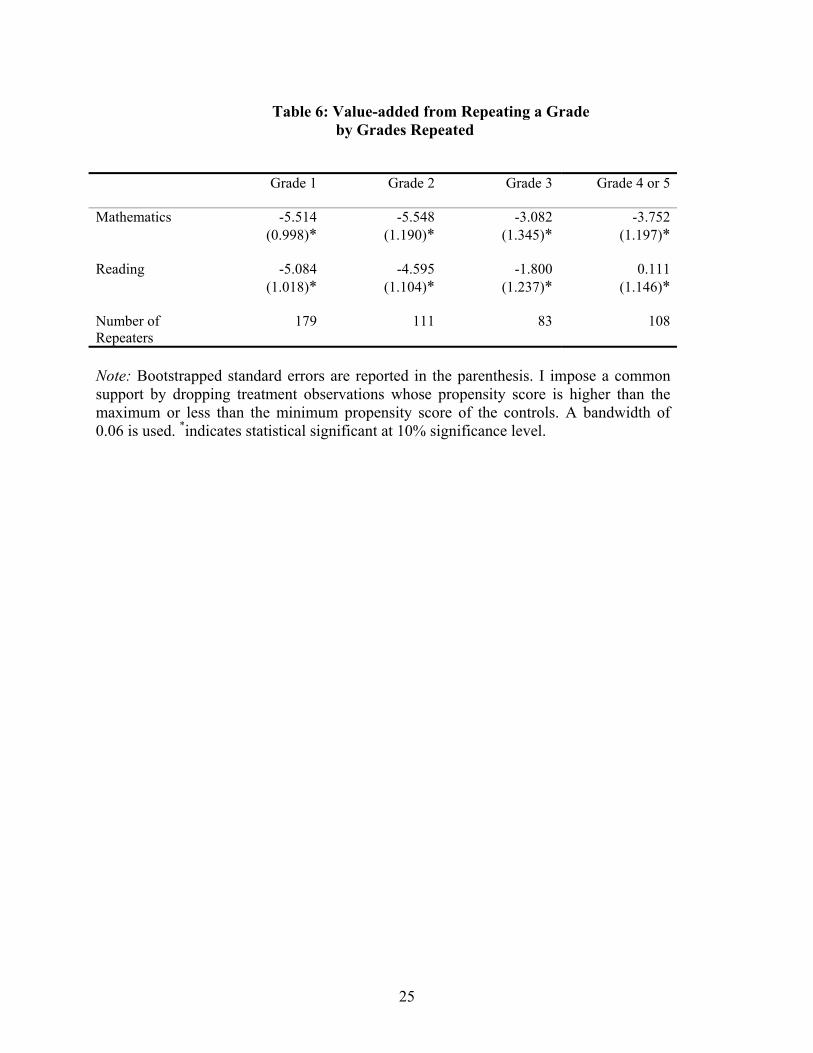
More children are retained at earlier grades with the expectation that any lack of
academic skills is likely to be corrected if they are detected and improved upon at an
15
early age given the malleability of such skills at an early age. It would be interesting to
examine how the effect of repeating varies by grade level. In particular, I am interested to
know whether those who repeat an early grade is benefited more than those who repeat
later grades. The results are reported in Table 6. Around thirty-seven percent of all
repeaters in my sample repeated grade one, followed by twenty-three percent in grade
two, seventeen percent in grade three and rest in grade four and five. I find that repeaters
score lower in the mathematics and reading than what they would have if they hadn’t
repeated irrespective of the grade level they have repeated. However, there is
considerable heterogeneity in the effect of repeating a grade across the different grade
levels repeated. The negative effect of repeating a grade is higher for those repeaters who
repeat early grades than those who repeat later grades. For example, for the mathematics
test, children who repeat grade one score 5.51 points or 0.36 standard deviations below
what they would have if they hadn’t repeated the grade; this number drops to 3.08 points
or 0.20 standard deviations for those who repeat grade three. For the reading test, the
negative effect of repeating is significant only for children who repeat grade one and two.
5. Conclusion
The objective of this study is to determine whether grade repetition adds value to
the academic skills of repeaters. I use reading and mathematics test scores to measure
academic skills of children. Using data from the NLSY79 and its associated Child
Survey, I estimate value-added of repeating a grade by using a propensity score matching
estimator. I find that grade repetition, on average, does not add any value in terms of
improved mathematics and reading test scores for the repeaters. Children who repeat a
16
grade are more likely to experience a decrease in test scores than they would have if they
hadn’t been retained.
My research contributes to the ongoing debate on how to improve the academic
performance of low-achieving students. No Child Left Behind Act of 2001 proposes strict
enforcement of standard based approach of evaluating children’s academic performance.
Children failing to meet these standards will likely to be held back in a grade. Such
additional investment of time and other resources is expected to help the failing child to
perform better in schools. My findings are not supportive of this conjecture. To improve
the performance of low-achieving children, it would be more prudent to adopt a more
targeted approach to address the deficits in their specific skills rather than retaining them
in a grade.
17
Bibliography Alexander, K.L., D.R. Entwisle, and S.L. Dauber. On the Success of Failure. Cambridge,
U.K.: Cambridge University Press, 2004.
Center for Human Resource Research. 2002. NLSY79 Child and Young Adult Data Users
Guide. The Ohio State University.
Corman, H. 2003. “The Effects of State Policies, Individual Characteristics, Family
Characteristics, and Neighbourhood Characteristics on Grade Repetition in the United
State.” Economics of Education Review 22: 409-420.
Dehejia, R.H. and S.Wahba. 1999. “Causal Effects in Non-Experimental Studies: Re-
evaluating the Evaluation of Training Programs”, Journal of the American Statistical
Association, 94: 1053 – 1062.
Eide, E.R. and Showalter, M.H. 2000. “The Effect of Grade Retention on Educational
and Labor Market Outcomes.” Economics of Education Review 86: 563-576.
Ferguson, P., S.R. Jimerson and M.J. Dalton. 2001. “Sorting Out Successful Failures:
Exploratory Analysis of Factors Associated with Academic and Behavioral Outcomes of
Retained Students.” Psychology in the Schools, 38(4): 327-341.
Greene J.P. and M.A.Winters. 2007. Revisiting Grade Retention: An Evaluation of
Florida’s Test Based Retention Policy, American Education Finance Association.
Jacob, Brian A. and Lars Lefgren. 2004. “Remedial Education and Student Achievement:
A Regression-Discontinuity Approach.” Review of Economics and Statistics 86: 226-244.
Jimerson et.al. 1997. “A Prospective, Longitudinal Study of the Correlates and
Consequences of Early Grade Retention.” Journal of School Psychology 35: 3-25.
18
Heckman, James J., H. Ichimura and P. Todd. 1997. “Matching as an Econometric
Evaluation Estimator: Evidence from Evaluating a Job Training Program.” Review of
Economic Studies 64: 605-654.
Heckman, James J., H. Ichimura and P. Todd. 1997. “Matching as an Econometric
Evaluation Estimator.” Review of Economic Studies 65: 261-294.
Heckman, James J., H. Ichimura, J. Smith and P. Todd. 1998. “Characterizing Selection
Bias Using Experimental Data.” Econometrica 66: 1017-1098.
Heckman, James J., Robert J. LaLonde and Jeffrey A. Smith. 1999. “The Economics and
Econometrics of Active Labor Market Programs.” in Orley Ashenfelter and David Card
(eds) Handbook of Labor Economics. Amsterdam, New York and Oxford: Elsevier
Science North-Holland.
Heckman, J. and R.Robb. 1985. “Longitudinal Analysis of Labor Market Data”,
Econometric Society Monographs Series, No. 10. Cambridge University Press.
Holmes, T.C. 1989. “Grade Level Retention Effects: A Meta-Analysis of Research
Studies.” In L.A. Shepard and M.L. Smith (eds), Flunking Grades: Research and Policies
on Retention. Philadelphia PA: The Falmer Press.
Karweit, N. 1999. Grade Retention: Prevalence, Timing, and Effects. Report No. 33.
Baltimore: John Hopkins University, CRESPAR.
Lorence, J., A.G.Dworkin, A.L. Toenjes and A.N. Hill. 2002. Grade Retention and Social
Promotion in Texas 1994-1999: An Assessment of Academic Achievement among
Elimentary School Students. In Brookings Papers on Education Policy, 13-67,
Washington D.C.: Brookings Institutions Press.
19
NCES. 2001. Digest of Education Statistics. U.S. Department of Education.
Roderick, M. and J.Nagaoka. 2005. “Retention Under Chicago’s High Stakes Testing
Program: Helpful, Harmful or Harmless?”, Educational Evaluation and Policy Analysis,
27 (4): 309-340.
Rosenbaum, P.R. and D.B. Rubin. 1983. “The Central Role of the Propensity Score in
Observational Studies for Causal Effects.” Biometrika 70: 41-55.
Shepard, L.A. and M.L. Smith. Flunking Grades: Research and Policies on Retention.
Philadelphia PA: The Falmer Press, 1989.
20
Table 1: Sample Selection Criteria
Sample
Number of Children
Total number of children known born to NLSY79 female respondents
11,340
Children who were never interviewed
- 1,692
——— 10,304
Children born before 1979
- 1,072
——— 9,232
Did not repeat a grade as of 2002 and still in grade 5 or lower
-2,757
——— 6,475
No information on which grade a child repeated
-543
——— 5,932
Repeated a grade greater than grade 5 - 156
——— 5,776
No information on test scores -899
——— Final sample 4,759
21
Table 2: Means and Standard Deviations of Mathematics and Reading Test Scores
Repeaters Non-Repeaters
Mathematics 90.21 (12.68)
101.59 (13.39)
Reading 90.28 (14.41)
105.05 (14.05)
Number of Children 479 4,280
Notes: Standard deviations are reported in the parenthesis. Test scores are measured after children have repeated a grade.

22
Table 3: Means and Standard Deviations of Explanatory Variables
used in Matching Estimator
Variables Repeaters Non Repeaters
1 if the child is female 0.40 0.51
1 if the child is African-American 0.49 0.28
1 if the child has a health problem 0.03 0.01
1 if the child ever attended a Head Start Program
0.22 0.14
Child’s birth weight (ounces)
113.59 (24.71)
117.21 (19.04)
Family income (‘000 $) 22.52 (24.78)
33.57 (39.34)
Mother’s AFQT (percentiles) 17.85 (18.49)
35.78 (25.42)
Mother’s highest grade completed (years) 11.15 (2.06)
12.13 (3.06)
1 if single mother 0.46 0.27
Number of children in the household 2.70 (1.41)
2.26 (1.04)
1 if Northcentral 0.20 0.26
1 if South 0.46 0.37
1 if West 0.19 0.21
Pre-repeat Mathematics Score 91.82 (12.94)
99.74 (13.09)
Pre-repeat Reading Score 94.72 (12.50)
105.03 (12.99)
Note: Standard deviations are reported in the parenthesis
23
Table 4: Propensity Score Coefficient Estimates
Variable
Coefficients
Pre-repeat Mathematics Score -0.023 (0.004)*
1 if the child is female -0.496
(0.106)*
1 if the child is African-American 0.249 (0.132)*
1 if the child has a health problem 1.444
(0.378)*
Child’s birth weight
-0.003 (0.002)
1 if the child ever attended a Head Start program 0.104
(0.126)
AFQT score of mother
-0.029 (0.004)*
Highest grade completed by mother -0.020
(0.025)
Family income -0.001 (0.001)
1 if mother is single 0.366
(0.122)*
Number of children in the household 0.213 (0.051)*
1 if live in North central region -0.154
(0.188)
1 if live in South region 0.052 (0.177)
1 if live in West region -0.034
(0.201)
Constant 0.784 (0.608)
R-square 0.135
Notes: Standard errors are reported in the parentheses. * significant at 10% significance level
24
Table 5: Value-added from Repeating a Grade based on Propensity
Score Matching Estimator
Mathematics Reading
Common Support -4.636
(-0.621) *-3.231
(-0.623) *
Robustness Checks Common Support II q = 1% -4.694
(0.545) * -3.313
(0.609)*
q = 5% -4.901(0.593)*
-3.532(0.543)*
Note: Bootstrapped standard errors are reported in the parenthesis. Common Support impose a common support by dropping repeaters whose propensity score is higher than the maximum or less than the minimum propensity score of non-repeaters. Common Support II dropping q percentage of the repeaters at which the propensity score density of the non-repeaters is the lowest. A bandwidth of 0.06 is used. *indicates statistical significant at 10% significance level.
25
Table 6: Value-added from Repeating a Grade
by Grades Repeated
Grade 1 Grade 2 Grade 3 Grade 4 or 5
Mathematics
-5.514 (0.998)*
-5.548 (1.190)*
-3.082 (1.345)*
-3.752 (1.197)*
Reading
-5.084 (1.018)*
-4.595 (1.104)*
-1.800 (1.237)*
0.111 (1.146)*
Number of Repeaters
179 111 83 108
Note: Bootstrapped standard errors are reported in the parenthesis. I impose a common support by dropping treatment observations whose propensity score is higher than the maximum or less than the minimum propensity score of the controls. A bandwidth of 0.06 is used. *indicates statistical significant at 10% significance level.