Embed Size (px)
Citation preview
Sampling of Continuous Time Signal
Section 5.3-5.4
Topics
• Impulse Sampling• Frequency Spectrum of a Periodic
Impulse Signal–Generating Function–Time Invariance–Review of Impulse Function–Convolution & Fourier Transform
• Sampling
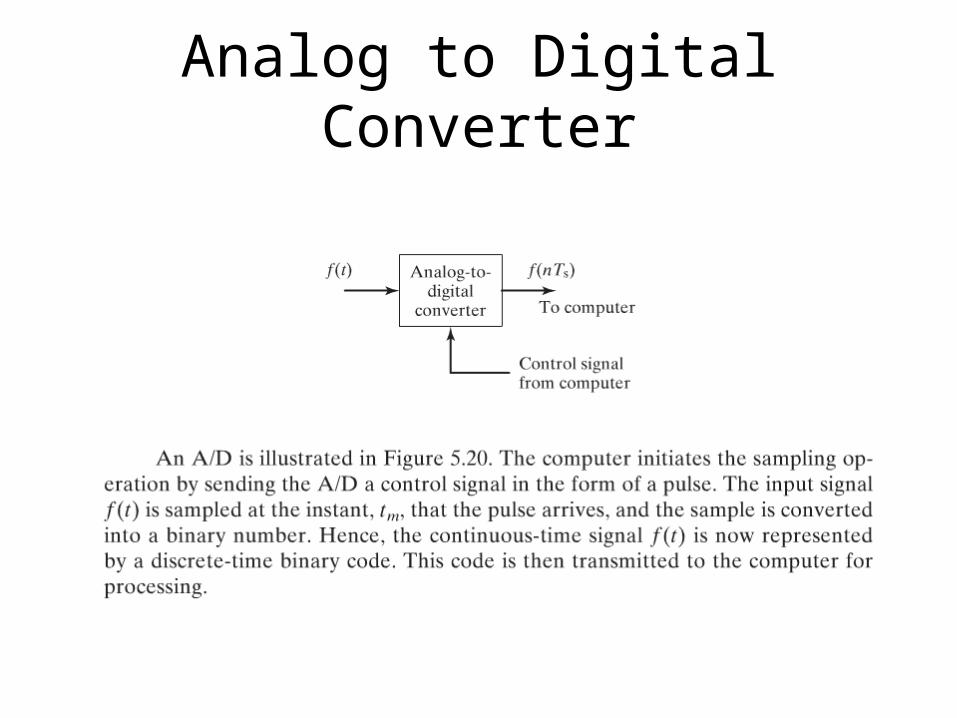
Analog to Digital Converter
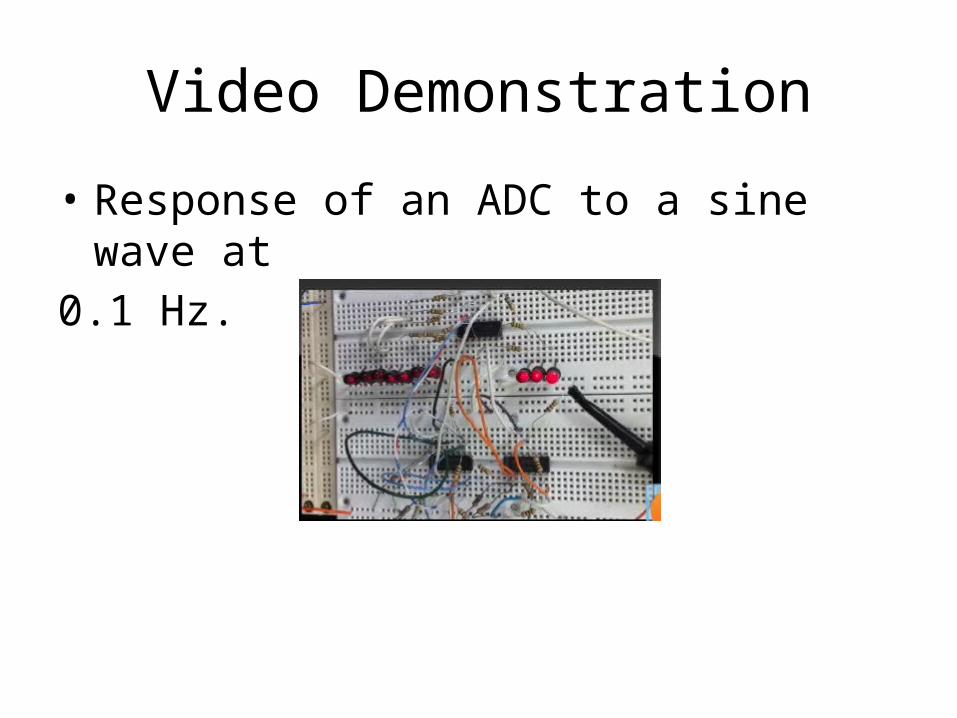
Video Demonstration
• Response of an ADC to a sine wave at
0.1 Hz.
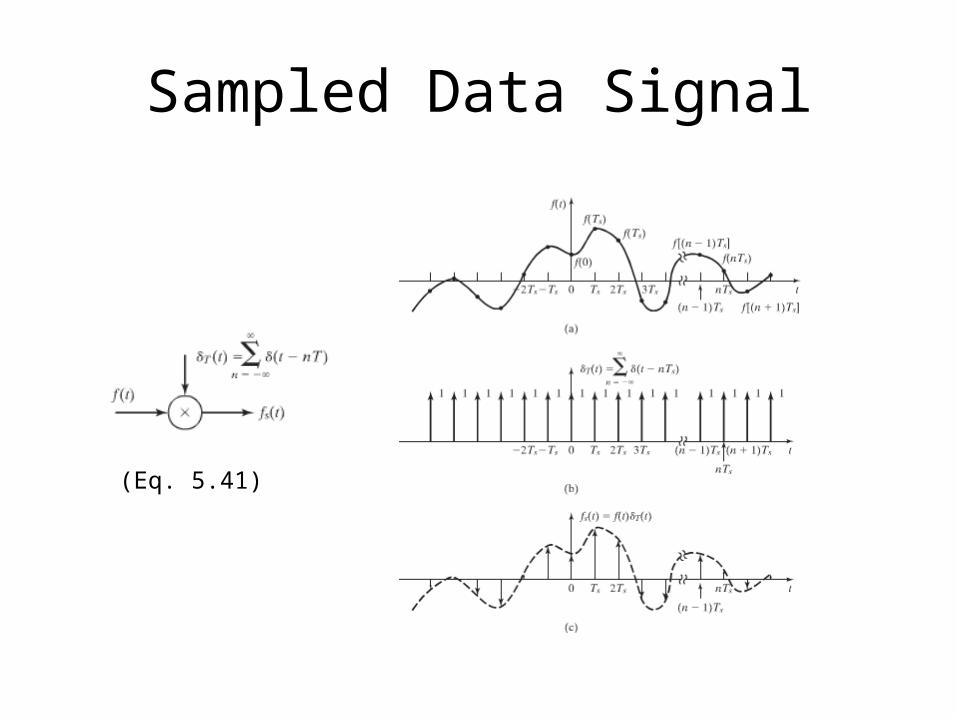
Sampled Data Signal
(Eq. 5.41)
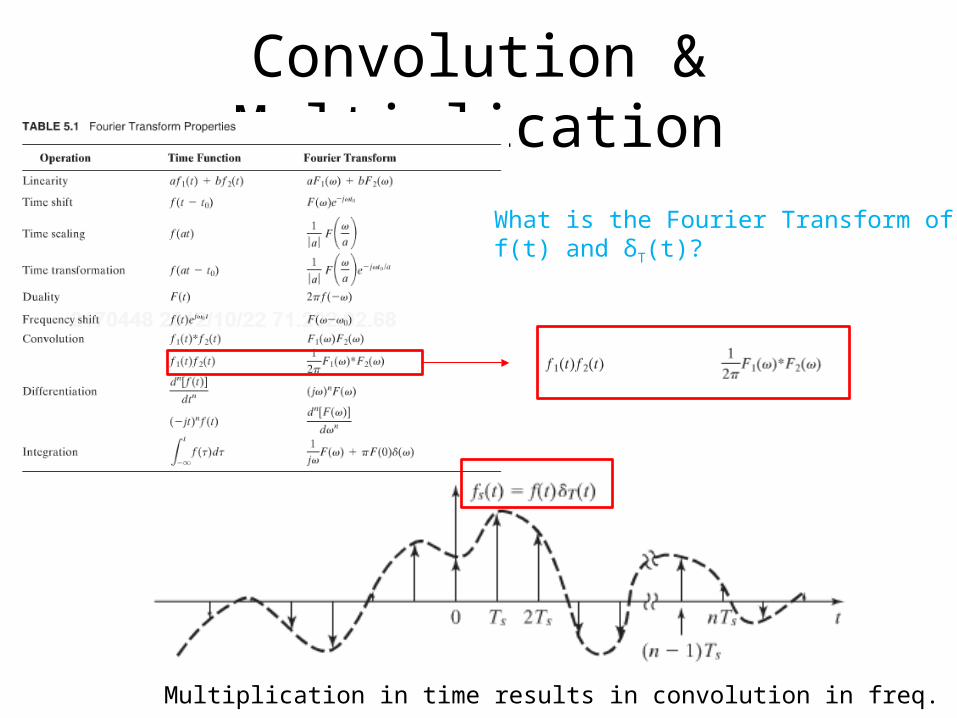
Convolution & Multiplication
Multiplication in time results in convolution in freq.
What is the Fourier Transform of f(t) and δT(t)?
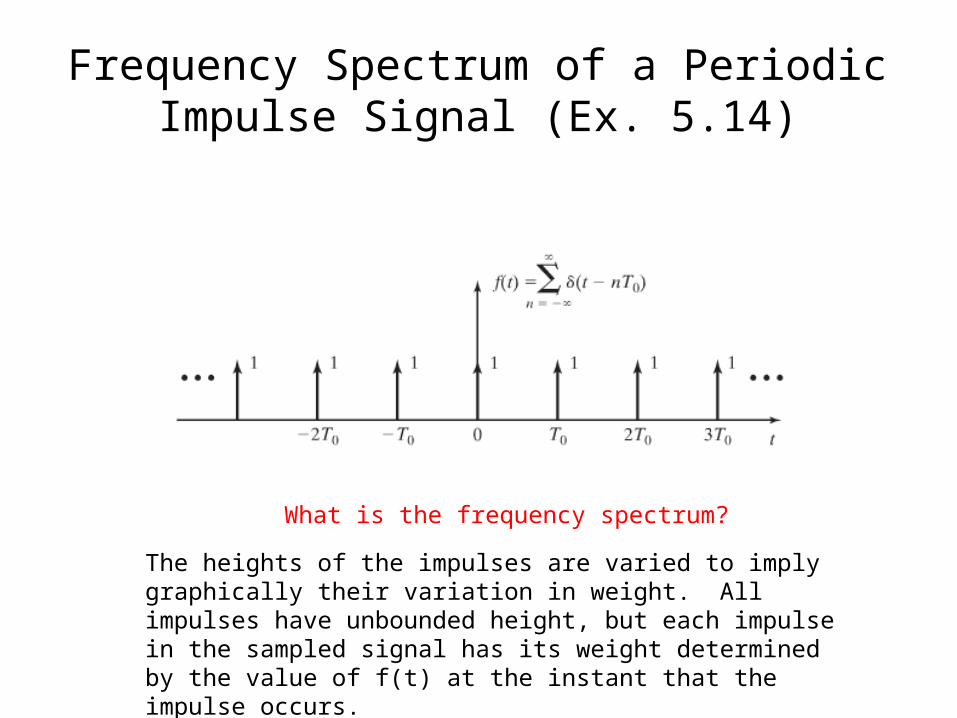
Frequency Spectrum of a Periodic Impulse Signal (Ex. 5.14)
What is the frequency spectrum?
The heights of the impulses are varied to imply graphically their variation in weight. All impulses have unbounded height, but each impulse in the sampled signal has its weight determined by the value of f(t) at the instant that the impulse occurs.
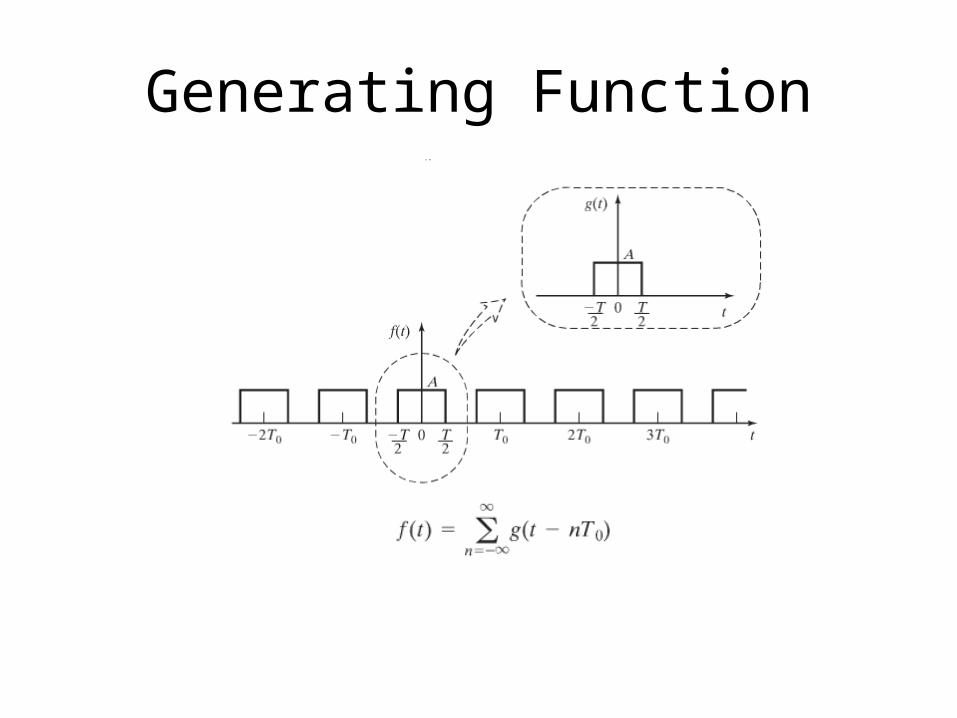
Generating Function
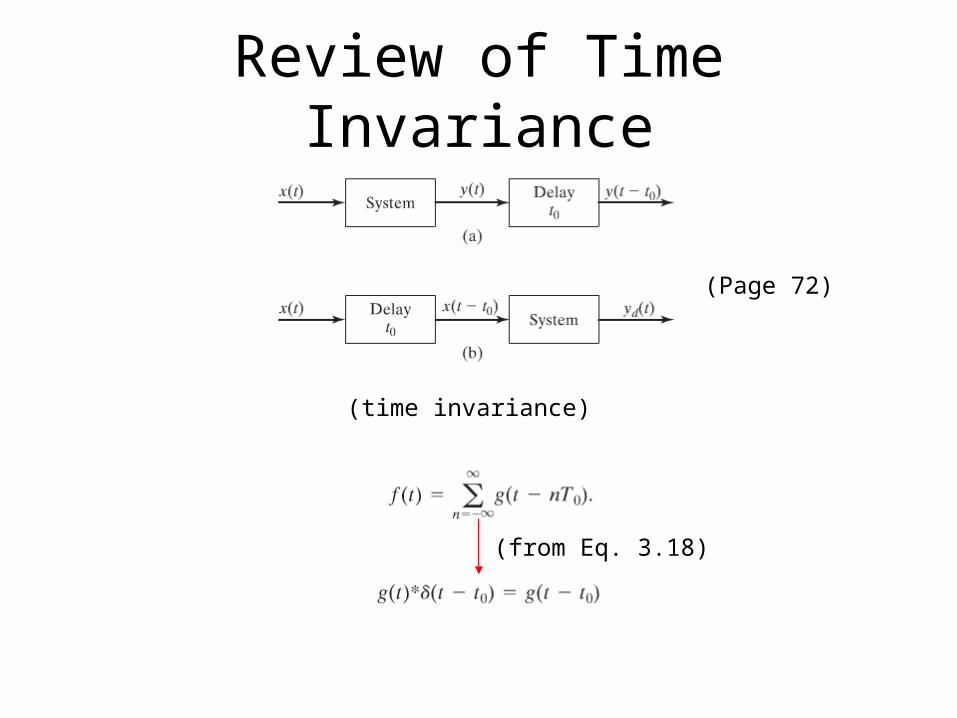
Review of Time Invariance
(time invariance)
(Page 72)
(from Eq. 3.18)
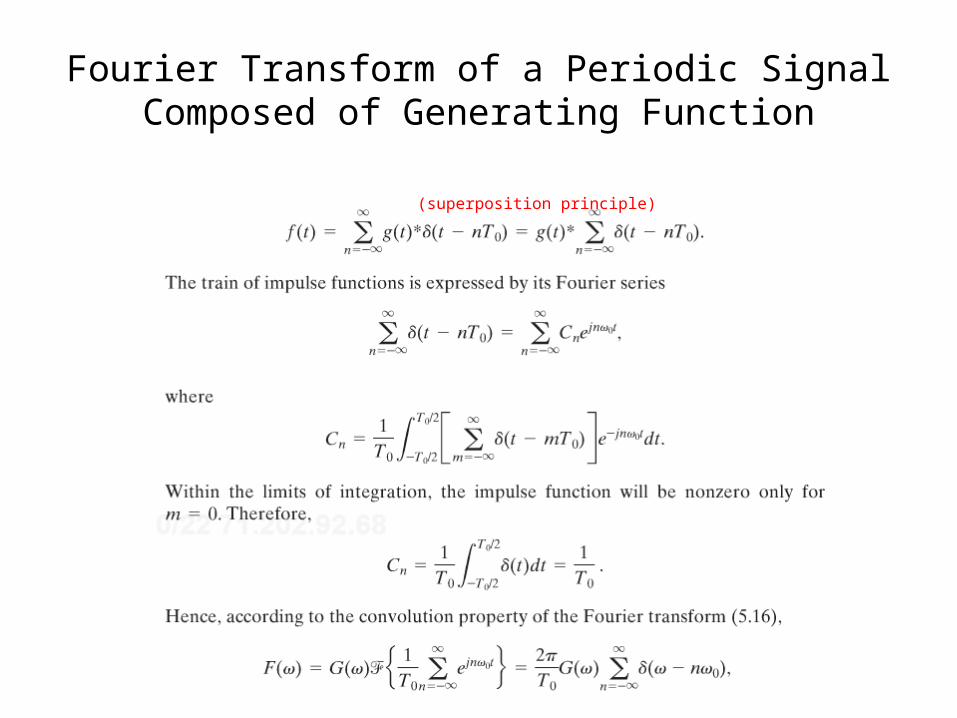
Fourier Transform of a Periodic Signal Composed of Generating Function
(superposition principle)
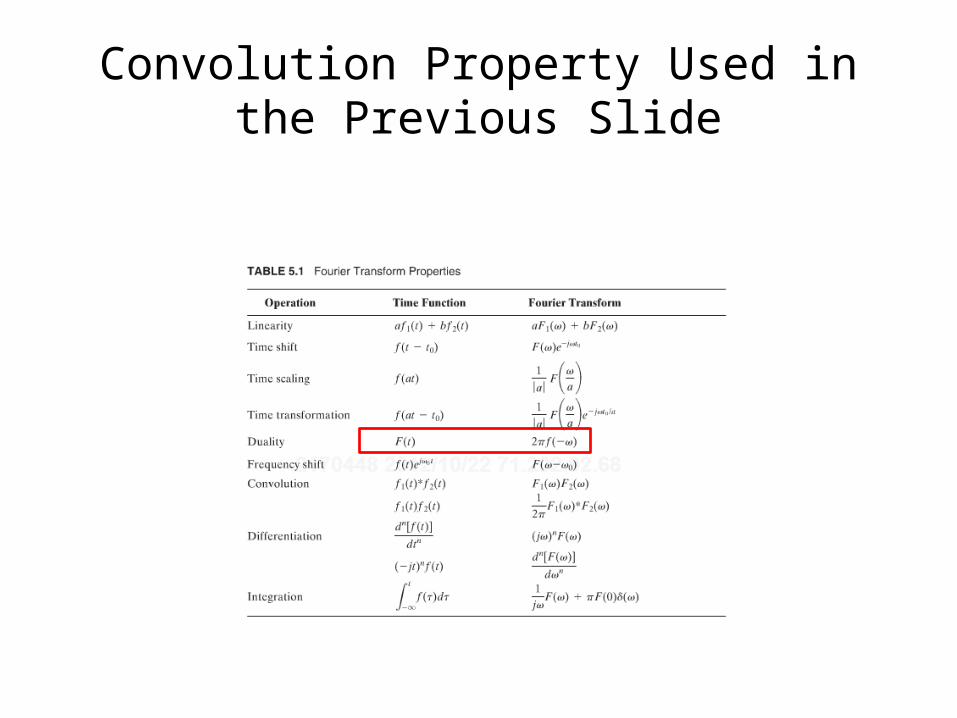
Convolution Property Used in the Previous Slide
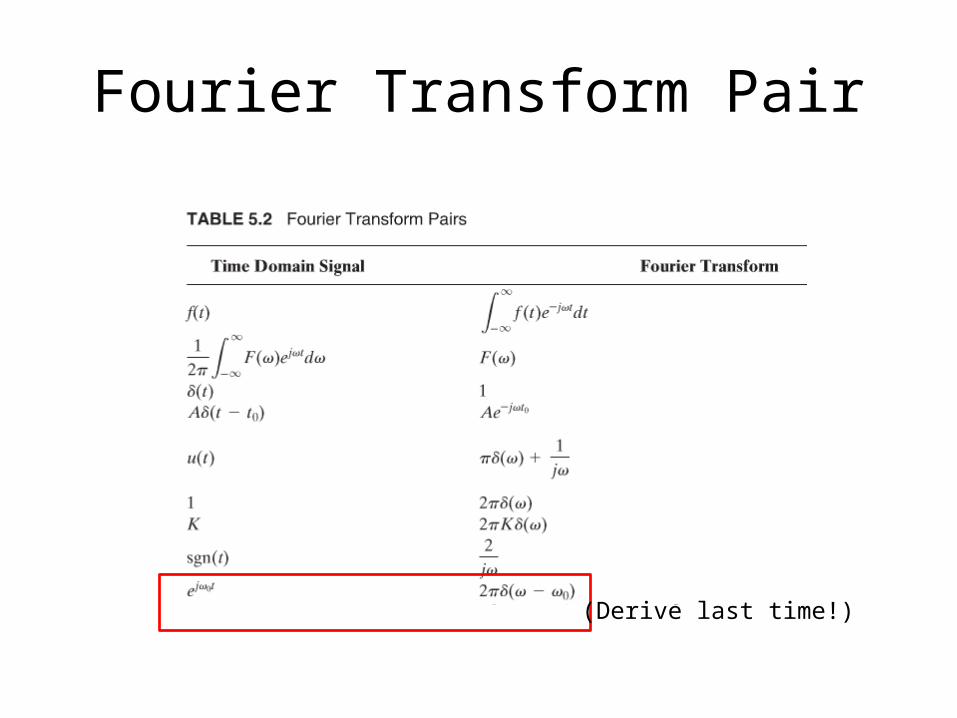
Fourier Transform Pair
(Derive last time!)
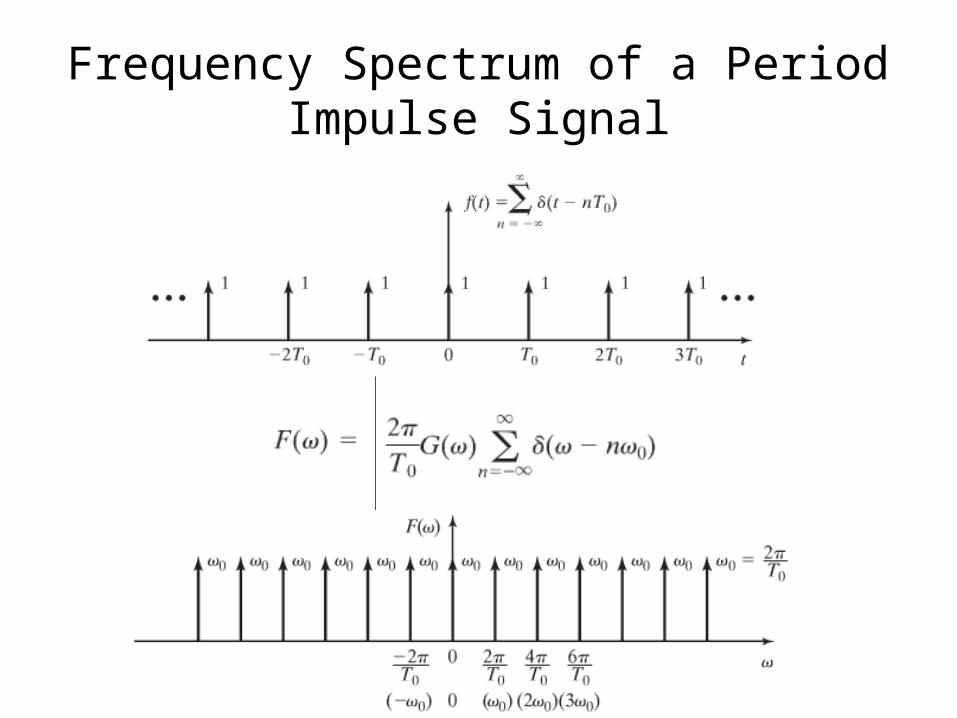
Frequency Spectrum of a Period Impulse Signal
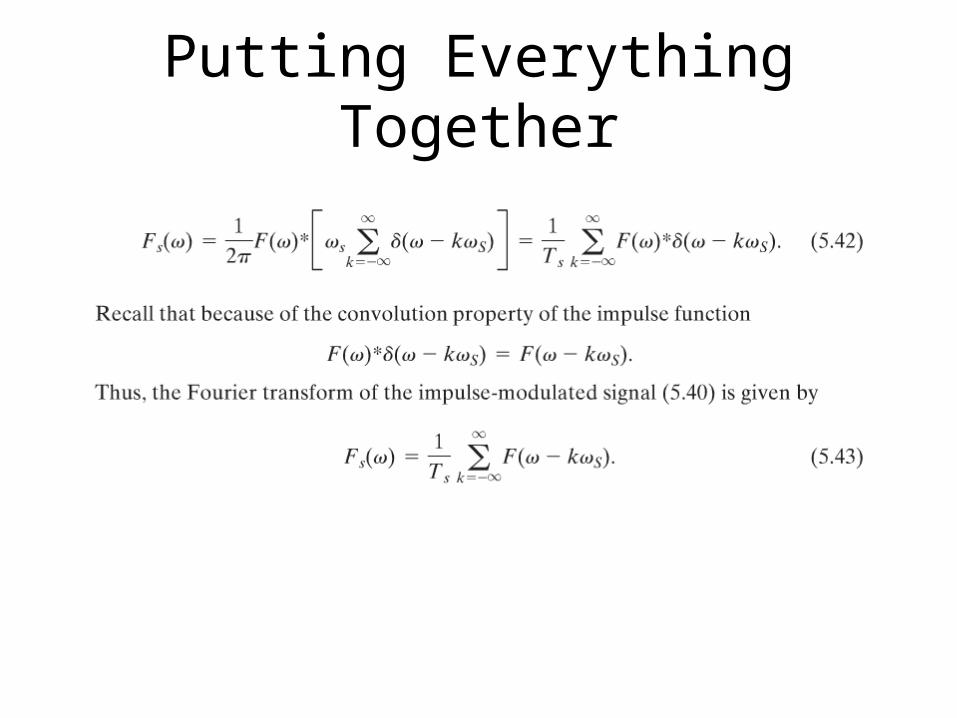
Putting Everything Together
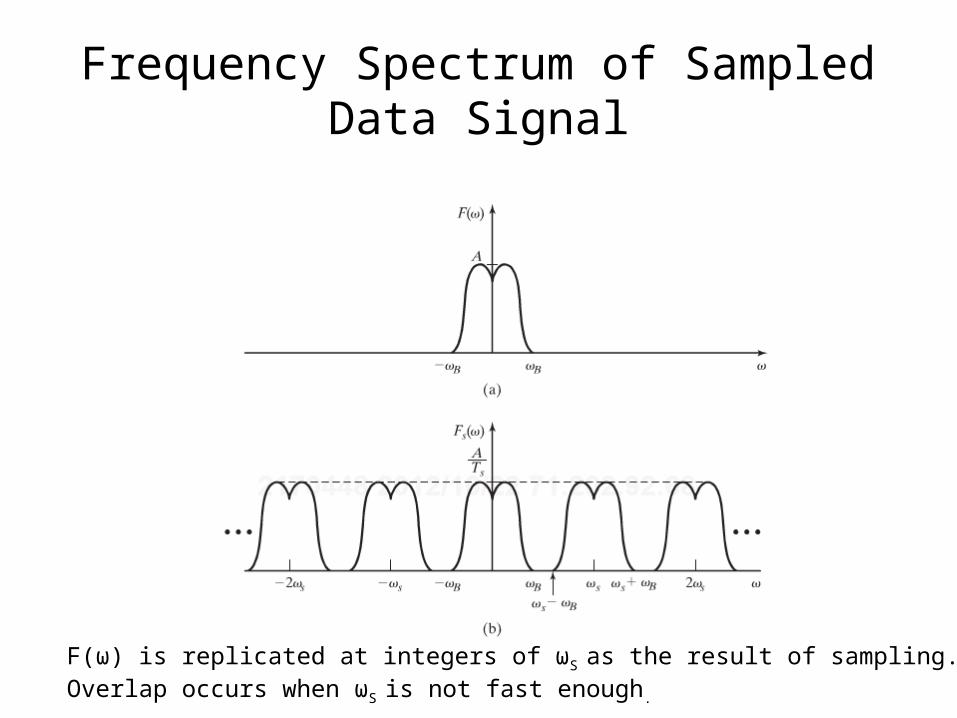
Frequency Spectrum of Sampled Data Signal
F(ω) is replicated at integers of ωS as the result of sampling.Overlap occurs when ωS is not fast enough.
Shannon’s Sampling Theorem
• Let ωS be the sampling frequency
• Let ωM be the highest frequency in the frequency spectrum of the signal to be sampled.
• If we want to avoid aliasing, F(ω) needs to be bandlimited.
• ωS should be larger than 2 ωM
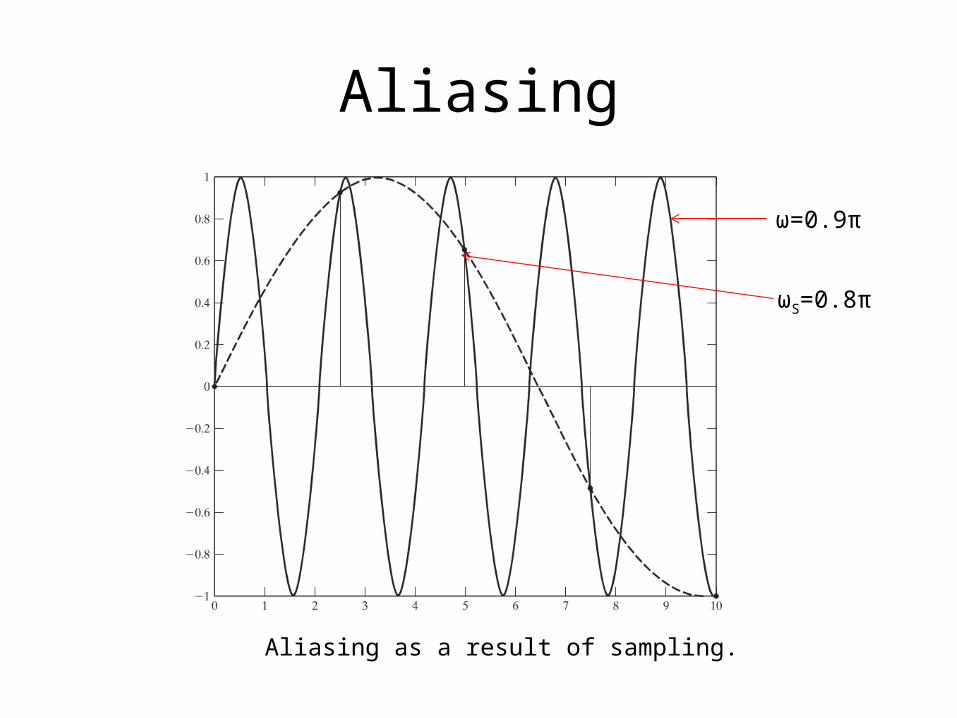
Aliasing
ω=0.9π
ωS=0.8π
Aliasing as a result of sampling.