Embed Size (px)
Citation preview
Sampling Concepts in Sales and Use Tax Audits
Revised February 23, 2008
Dr. Will Yancey, CPAIndependent Consultant
Dallas, [email protected]
972.387.8558
2
Objective
Objective is NOT: To stress you To make you a statistician in one hour
Objective IS: To stimulate your thinking To impart practical knowledge for managing audits
of sales and use tax, unclaimed property, etc.
Encourage discussion at any time
3
Copyright
You are welcome to use these concepts and repeat anecdotes.
Before you reproduce or distribute these materials, please let me know.
Dr. Will Yancey retains the copyright on all materials he creates.
©
4
Know Your Data!
Availability of supporting documents is your best defense in any audit of sales and use tax, unclaimed property, or other transactions.
Do a preliminary investigation before the auditors arrive. Conduct a “walk-through” to discover and document what
supporting documents are available and retrievable. Include electronic and paper files
Identify potential exposure areas
Data mining software links at http://willyancey.com/data-mining.htm IDEA from www.audimation.com in Houston
5
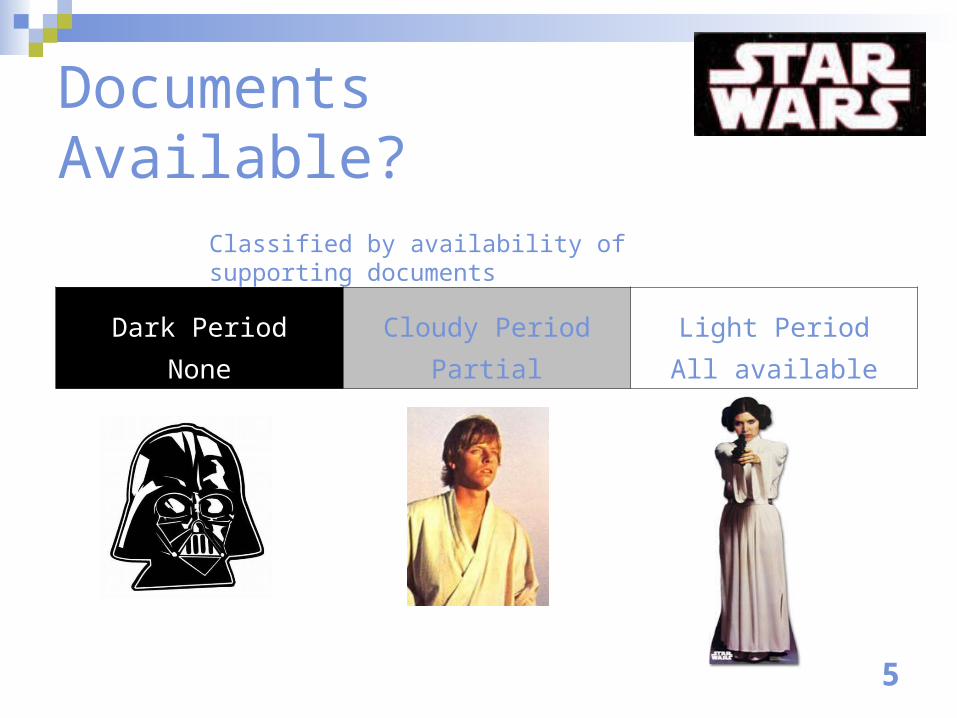
Documents Available?
Classified by availability of supporting documents
Dark Period Cloudy Period Light Period
None Partial All available
6
Dark Period
The Dark Period includes the older years where no supporting documentation can be located.
All that may be known about the Dark Period is total revenue by year, total purchases, or some other total $.
7
Light Period
The Light Period covers the more recent years where we have access to all data:
Total revenue Supporting documents Name and address information
The Light Period is the basis for estimation to the Dark Period
Depending on the number of items we can: Sample, or Review the actual detail (also known as 100% sample, census,
actual basis).
8
Cloudy Period
Facts and data are unclear in the Cloudy Period.
Control totals may exist.
Some supporting documents are missing. BUT, we must make a decision on where to separate
the Dark Period from the Light Period. Know your records before the auditor selects the sample!
9
Dark Period Estimation
Estimate liability for the Dark Period. Generally involves an estimated ratio of Liability-to-
Revenue or Liability-to-Total-Payables from the Light Period.
Project that ratio onto Dark Period.
Justification All states do estimates for bars, restaurants, and small
businesses where records are unavailable. If there is less than 100% error rate in the Light Period, it
is reasonable to assume less than 100% error rate in the Dark Period.
10
Sales Data
Billing system versus Accounts Receivable (A/R) system
Customer master file Sales tax exemption certificates
http://willyancey.com/tax_sales.htm#exempt-certs Sales product description codes Sales tax billed but not paid (“short pay”) Bad debts: billed but no payment On consignment but sale not consummated
11
Location Data
Bill-to versus ship-to address Origin vs. Destination sourcing for taxing
jurisdiction Local city and county situsing errors
Increasing attention from local government Goods received documentation Services delivered documentation Modification at central facility before deployment
to field locations
12
Purchases Data General Ledger (G/L) versus Accounts Payable (A/P)
Detail versus aggregate Documenting where and how used
Purchase orders (PO) Requisitions to vendor or company stores Authorization for expenditure (AFE) Contracts Receiving reports Affidavits from operations people
Clearing accounts Work in progress (WIP) Construction in progress (CIP) Prepaid expenses Installment payments and deposits paid
13
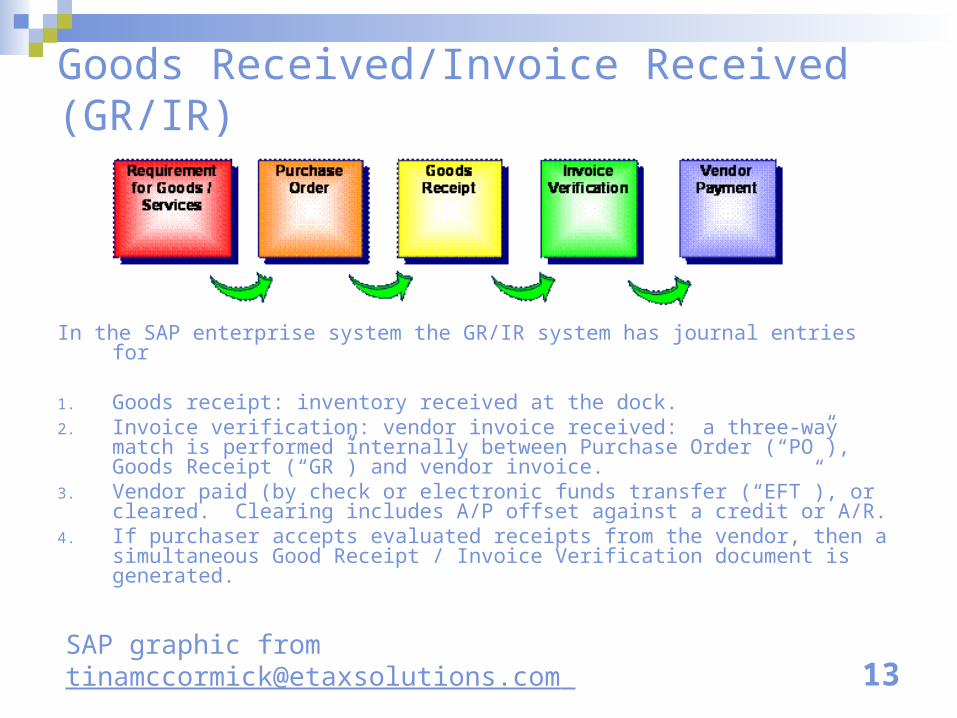
Goods Received/Invoice Received (GR/IR)
In the SAP enterprise system the GR/IR system has journal entries for
1. Goods receipt: inventory received at the dock.2. Invoice verification: vendor invoice received: a three-way match is
performed internally between Purchase Order (“PO”), Goods Receipt (“GR”) and vendor invoice.
3. Vendor paid (by check or electronic funds transfer (“EFT”), or cleared. Clearing includes A/P offset against a credit or A/R.
4. If purchaser accepts evaluated receipts from the vendor, then a simultaneous Good Receipt / Invoice Verification document is generated.
SAP graphic from [email protected]
14
Fruit Salad Parable
Task is to estimate the amount of different fruits by sampling a single spoonful.
1. Fruit in four large chunks.
2. Fruit cut in many small pieces
3. Fruit crushed in a smoothie
4. Fruit floating in liquid
15
Triage
Different strategies for
different sub-populations Exclude: No likelihood of error Detail: Actual base exam of every item Sample: Likely to be some errors; and
cost of sampling is less than cost of detail.
16
Exclude
Possible exclusions in a sales and use tax audit (but not all situations):
Always pay sales tax to vendor and always taxable: telecom, utilities, etc.
Never pay sales or use tax and always exempt: charitable contributions, government taxes and fees, inventory for resale, employee benefits
No tax consequence: some journal entries, reversals, and reclasses, etc.
17
Detail
Possible detail in a sales and use tax audit (but not all situations):
High dollar items. High threshold somewhere between $5,000 and $500,000,
depending on population. Select vendors or customers where always in
error. Construction in progress (CIP) Information Technology (IT) purchases that
include taxable and nontaxable components
18
Reversals
Reversals (“negative amounts”) occur because of reclassifications, error corrections, returns, voids, etc.
The negative amounts are offset to the positive amounts.Matched pair = one positive $ offset one
negative $ to the exact amountMultiple rows or partial offsets
19
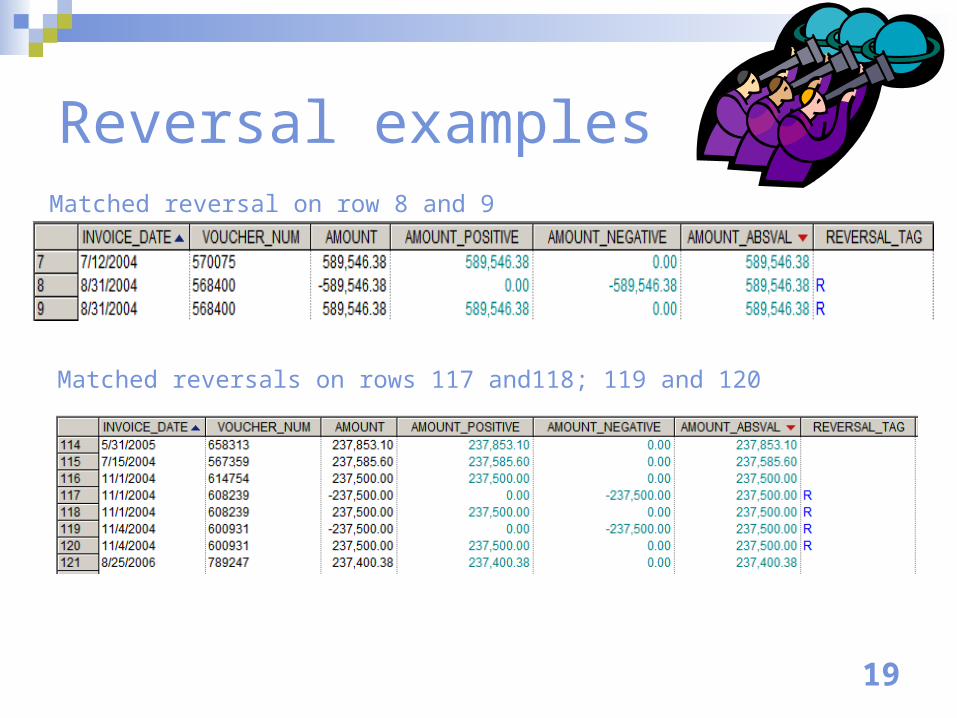
Reversal examplesMatched reversal on row 8 and 9
Matched reversals on rows 117 and118; 119 and 120
20
Strategies for Reversals
Chose a combination of these: Match and extract
Sort by descending absolute value $ Detail the largest negative items Sample some negative items Apply error rate from positive $ onto negative $ Ignore the negatives if very small % of total
positive population base $Does the auditor need to see supporting
documentation for every reversal?
21
Sampling
Sampling in a sales and use tax audit (but not all situations):
Likely to be some error Cost of sampling is less than detail exam. Mix of many different vendors. Taxpayer and auditor can agree on
sampling plan.
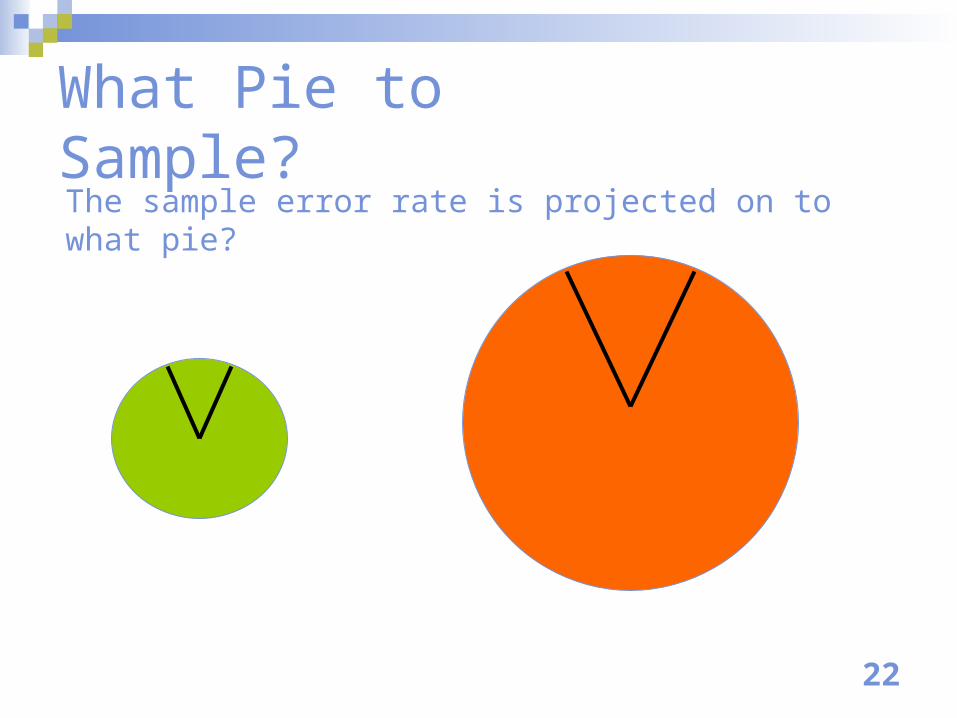
22
What Pie to Sample?The sample error rate is projected on to what pie?
23
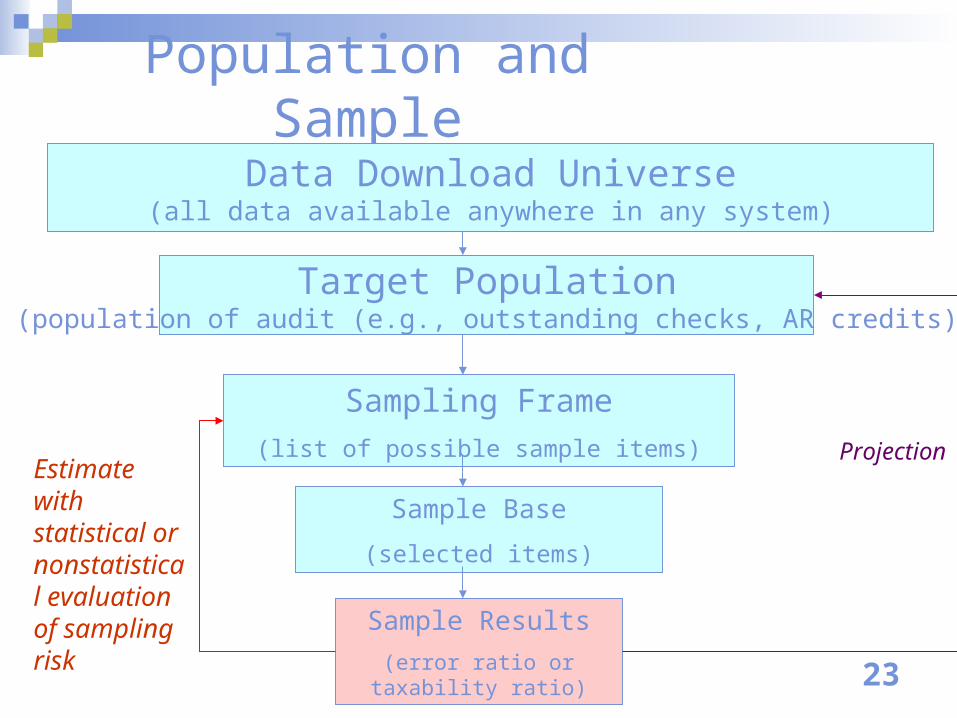
Population and Sample
Data Download Universe(all data available anywhere in any system)
Target Population(population of audit (e.g., outstanding checks, AR credits)
Sampling Frame
(list of possible sample items)
Sample Base
(selected items)
Sample Results
(error ratio or taxability ratio)
Estimate with statistical or nonstatistical evaluation of sampling risk
Projection
24
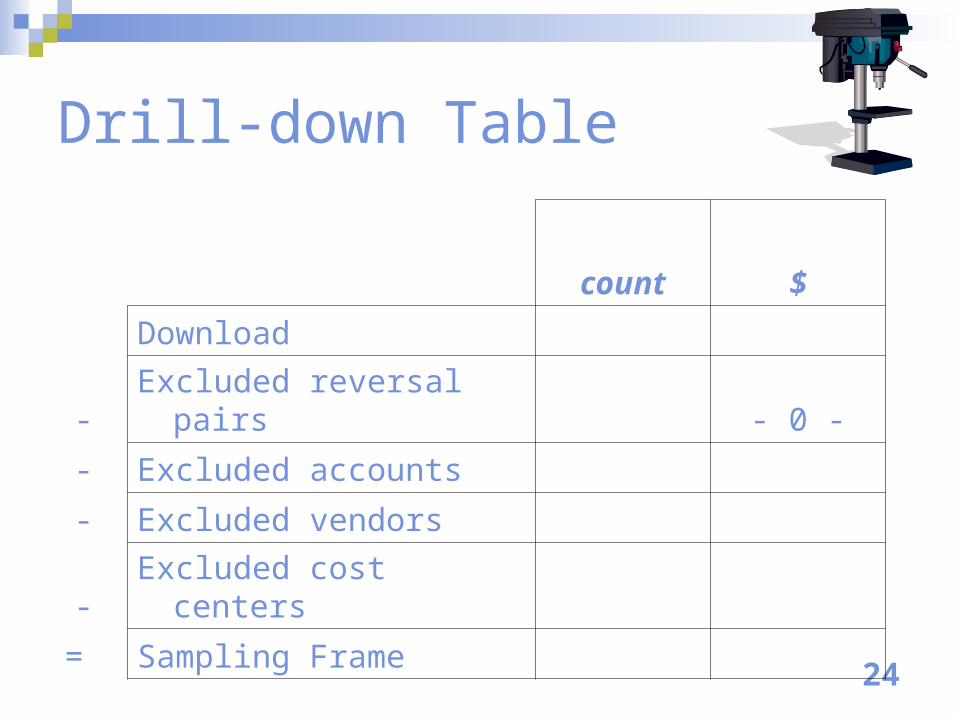
Drill-down Table
count $
Download
- Excluded reversal pairs - 0 -
- Excluded accounts
- Excluded vendors
- Excluded cost centers
= Sampling Frame
25
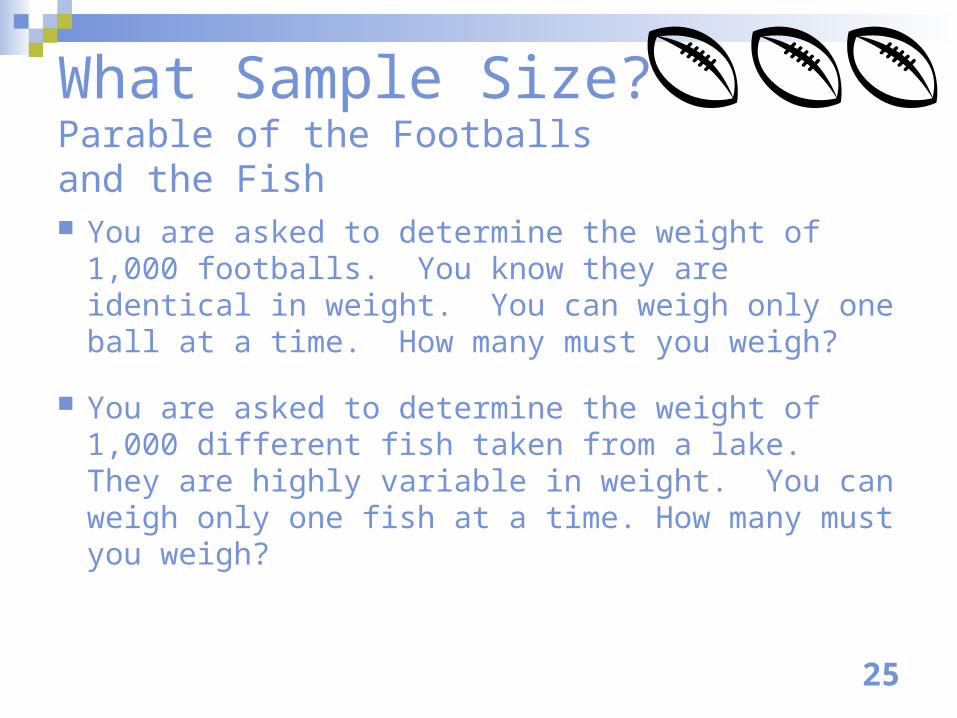
What Sample Size?Parable of the Footballs and the Fish
You are asked to determine the weight of 1,000 footballs. You know they are identical in weight. You can weigh only one ball at a time. How many must you weigh?
You are asked to determine the weight of 1,000 different fish taken from a lake. They are highly variable in weight. You can weigh only one fish at a time. How many must you weigh?
26
Stratification
How could we organize the fish into piles so we could sample and make a reasonable estimate of total weight of all fish?
What criteria should we use? How can we define criteria so each fish is in one
and only one pile? How many piles should we have? How precise do we want the estimate?
27
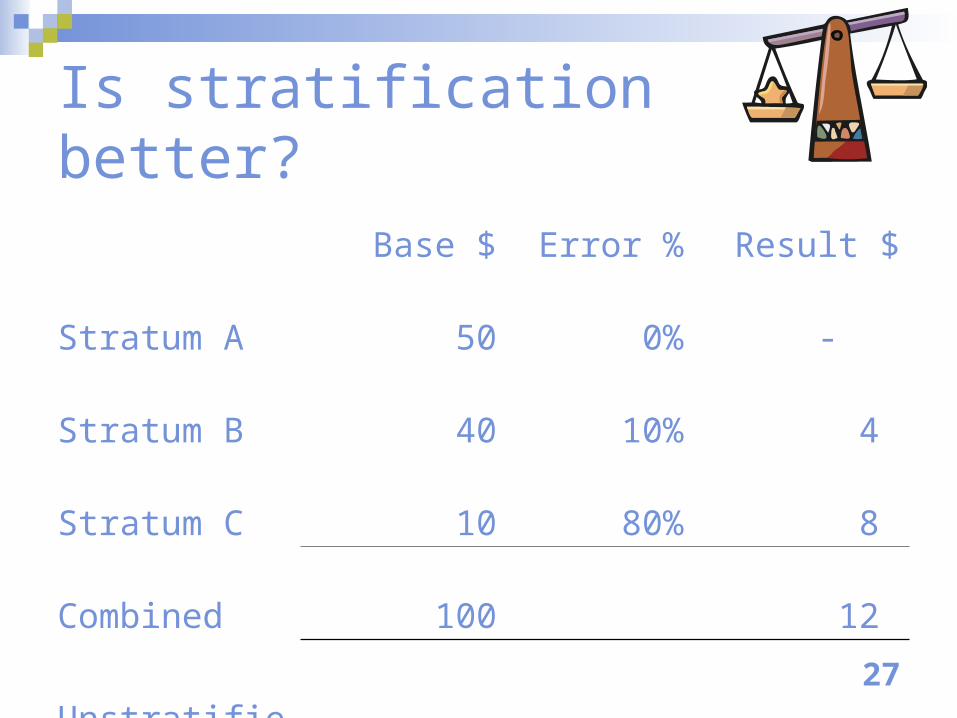
Is stratification better?
Base $ Error % Result $
Stratum A 50 0% -
Stratum B 40 10% 4
Stratum C 10 80% 8
Combined 100 12
Unstratified 100 12% 12
28
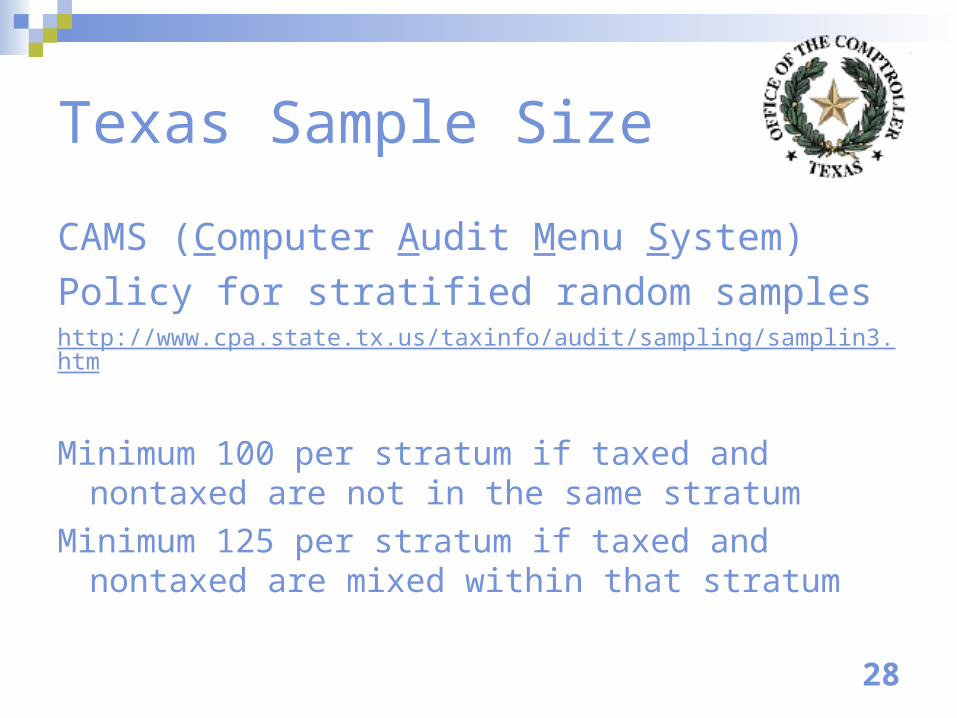
Texas Sample Size
CAMS (Computer Audit Menu System)
Policy for stratified random samples
http://www.cpa.state.tx.us/taxinfo/audit/sampling/samplin3.htm Minimum 100 per stratum if taxed and nontaxed
are not in the same stratum
Minimum 125 per stratum if taxed and nontaxed are mixed within that stratum
29
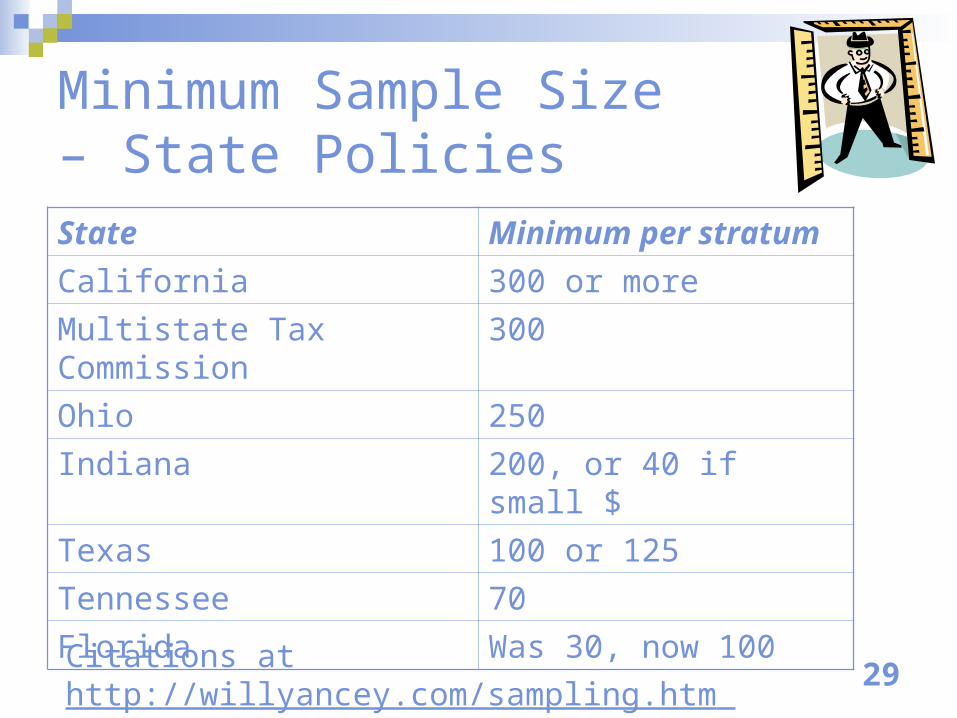
Minimum Sample Size – State PoliciesState Minimum per stratum
California 300 or more
Multistate Tax Commission 300
Ohio 250
Indiana 200, or 40 if small $
Texas 100 or 125
Tennessee 70
Florida Was 30, now 100
Citations at http://willyancey.com/sampling.htm
30
Minimum Errors for Projection
How many is the minimum number of errors in the sample results for the auditor to project from that stratum to population?
Usually the number of errors includes both overpayments and underpayments.
IRS: minimum of 3 to 5 per stratum California BOE: minimum of 3 per stratum Texas: appears to be a minimum of 3
31
Statistical versus NonstatisticalStatistical sampling requires that: Every sample item is selected with some known
probability of selection. Results are evaluated using mathematical
statistics. Confidence interval is presented.Nonstatistical sampling does not meet above. Texas Comptroller uses nonstatistical sampling. Time period block sampling is nonstatistical.
32
References
Statistical Education and Software http://willyancey.com/statistics.htm
Sampling in Sales and Use Tax Audits http://willyancey.com/sampling.htm
Sampling SUT Audit Review Articles http://willyancey.com/sampling-sut-review.html
May the Force be with you!