Embed Size (px)
Citation preview
Sampling According to the IAPWS Technical Guidance
Document (TGD) on Corrosion Product Sampling
Matarvattenkonferensen 201510-11 November 2015
Karsten Thomsen, COWI, DenmarkMail: [email protected]
Phone: +45 2787 5744
in collaboration with
Water Chemistry LabNordjyllandsværketVodskov, Denmark
10 November 2015 Karsten Thomsen, COWI A/S, Denmark 1
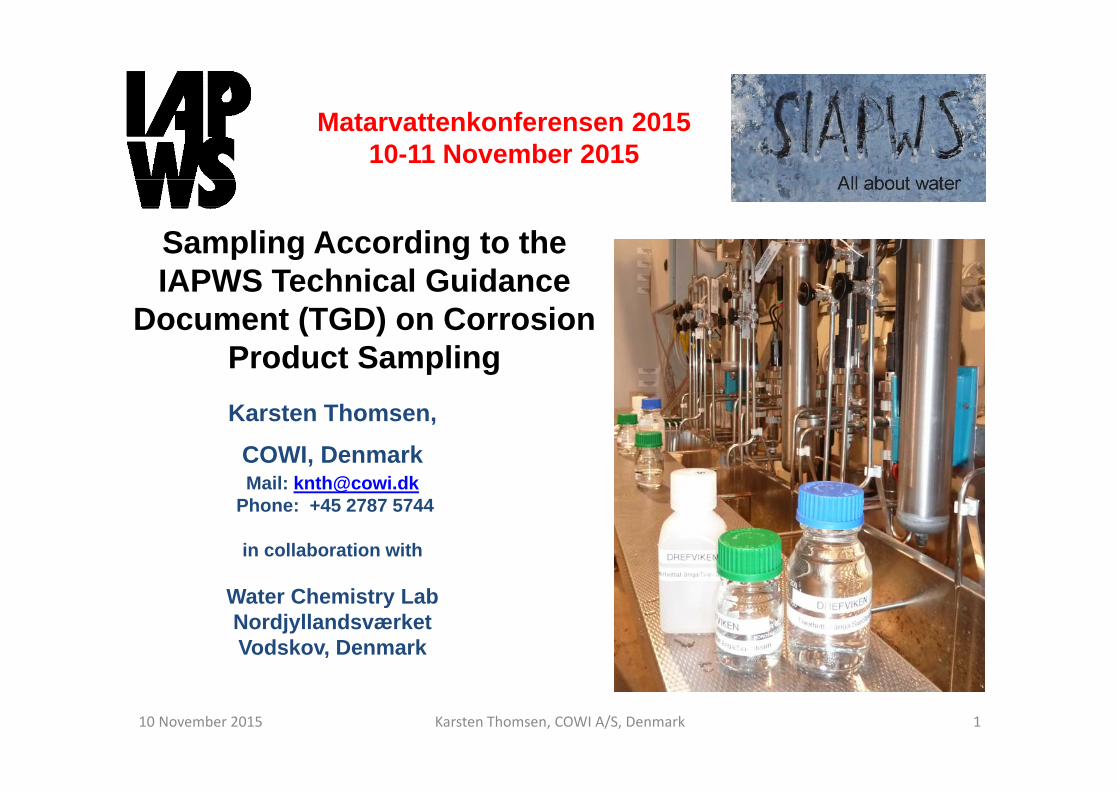
How to optimise cycle chemistry
10 November 2015 Karsten Thomsen, COWI A/S, Denmark 2
IAPWS TGD for plant type
Current CP levels
Adapt cyclechemistry to plantMonitor CP levels
Optimised cycle chemistry
Sampling
Pretreatment& analysis
Representative result
Premise for successPlant conditions:Steady load, 70-100 %
With optimised cycle chemistry:• Run 2 x 3 week
campaigns annually to check CP levels
• Run campaigns on changes in operation mode, e.g. change to varying load or cycling operation

Scope of sampling TGD
10 November 2015 Karsten Thomsen, COWI A/S, Denmark 3
Scope of sampling TGD Remark• Highlight problems associated with
sampling of CP in flowing water and steam• Indicate how problems occur and may be
solved
• Tools to review critically an existing or planned sampling system in order to minimise sampling errors
• Indicate key plant locations for sampling of CP
• Major concern: To optimise cycle chemistry
• Outline the optimum sampling system for representative sampling of CP
• Advice on operation and maintenance => sampling errors kept constant at minimum level
• Sampling errors are minimised by principal consideration and good operating practise
• Highlight analytical methods that are fit for purpose
• Indicate advantages and disadvantages of the methods
• Suitable method is selected
• Suggest level of quality control to ensure reliable analysis
• Validation: Uncertainty of pretreatmentand analysis is defined
• QC: The uncertainty is kept stable over extended periods
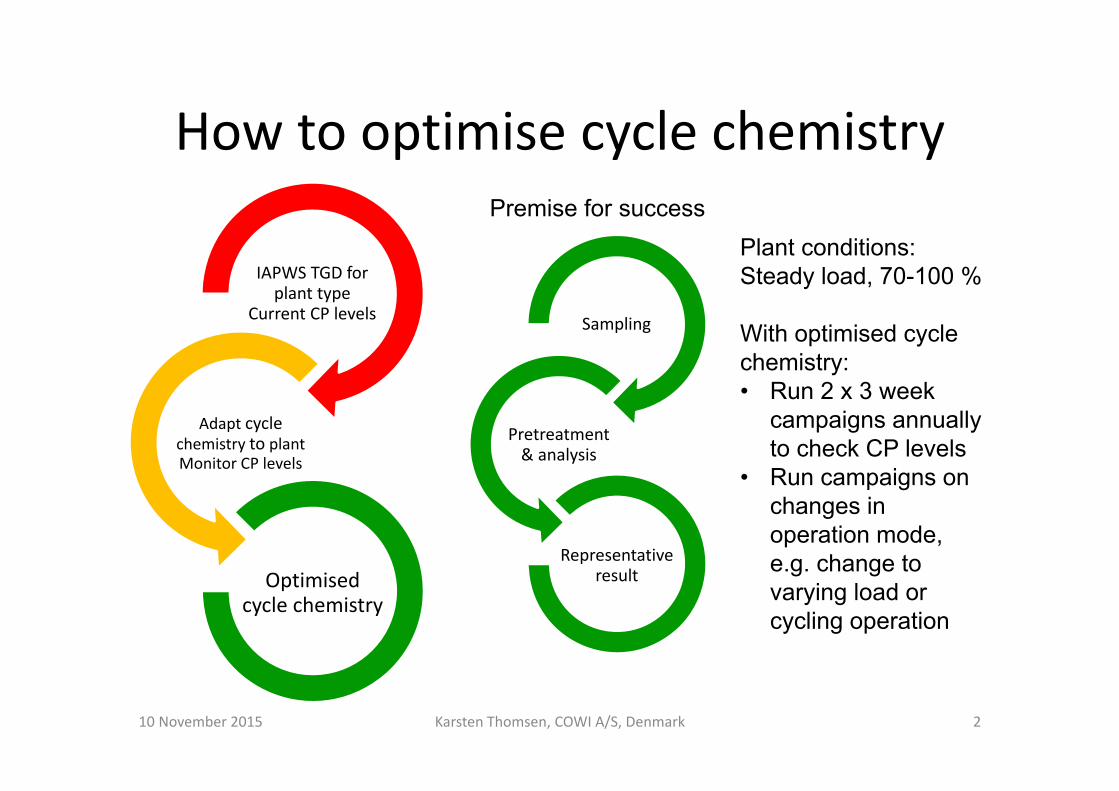
Optimal CP levels (as Fe) from IAPWS TGD's
10 November 2015 Karsten Thomsen, COWI A/S, Denmark 4
* Downstream 5 µm condensate filter
Fossil – All Ferrous
Fossil – Mixed Metallurgy
Combined Cycle/HRSG
Plants
Cogeneration Plants
ACC Outlet* Measured Measured <5 µg/kg(AVT, pH ~ 9.8)
Measured
Condensate* Measured Measured Measured Measured
Cond. Pump Discharge
Measured Measured Measured Measured
Process Cond. Return
<10 or <5* µg/kg(AVT, pH ~ 9.8)
LP & HP Heater Drains
HP: <10 µg/kg (AVT, pH ~ 9.8)
HP: <10 µg/kg
Deaerator inlet Fe, Cu measured
Feed water/ECOinlet
OT: <1 µg/kgAVT: <2 µg/kg
AVT: Cu<2 µg/kgAVT: Fe<2 µg/kg
<2 µg/kg <2 µg/kg
Boiler/Evaporator <5 µg/kg Measured
Sat. & Sup. Steam N/A N/A N/A N/A
10 November 2015 Karsten Thomsen, COWI A/S, Denmark
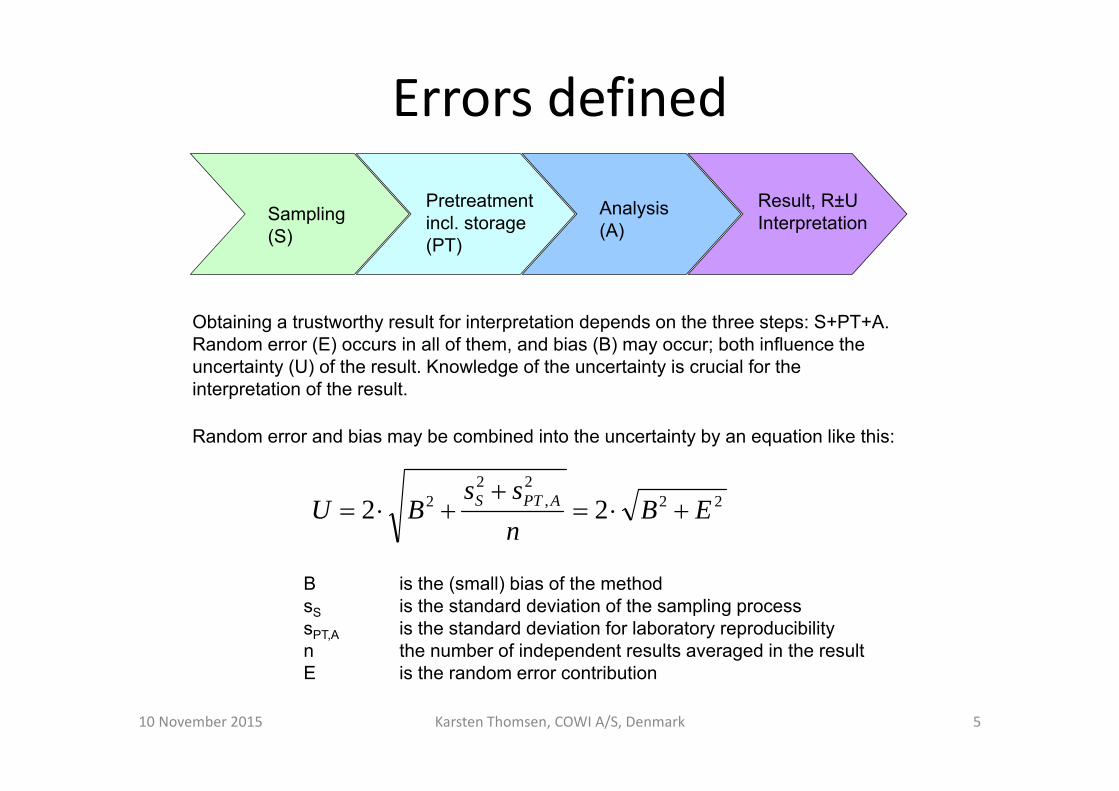
Errors defined
Sampling (S)
Pretreatment incl. storage (PT)
Analysis (A)
Result, R±UInterpretation
Obtaining a trustworthy result for interpretation depends on the three steps: S+PT+A.Random error (E) occurs in all of them, and bias (B) may occur; both influence the uncertainty (U) of the result. Knowledge of the uncertainty is crucial for the interpretation of the result.
5
Random error and bias may be combined into the uncertainty by an equation like this:
222
,2
2 22 EBnss
BU APTS
B is the (small) bias of the methodsS is the standard deviation of the sampling processsPT,A is the standard deviation for laboratory reproducibilityn the number of independent results averaged in the resultE is the random error contribution

Potential errors from sampling, pre‐treatment and analysis
Sampling – non‐representative
samples
• Adsorption/deposition of analyte in sampling lines, coolers and valves• Contamination of sample:• Release of deposited products to sample• Corrosion products from sample lines of wrong materials
• Bias from non‐isokinetic sampling (only steam samples, avoided in TGD)• Bias/random error due to varying operators and no SOP in use
Pre‐treatment –adverse effects on
sample
• Contamination from sample containers• Adsorption/desorption of analyte in sample containers due to wrong materialsor no conservation applied
• Insufficient digestion of sample – particulates remain after digestion
Analysis – incorrect results
• Method not adequately validated and not checked by QC => unknownuncertainty on results
• Random errors not under control (e.g. varying operators, lab. environment)• Contamination (source: Applied chemicals, ultra pure water, etc.)
Uncertaintytoo large relative to guidingvalues, e.g.R = (8±6) µg/kg comparespoorly with guiding valueof 5 µg/kg
10 November 2015 Karsten Thomsen, COWI A/S, Denmark 6
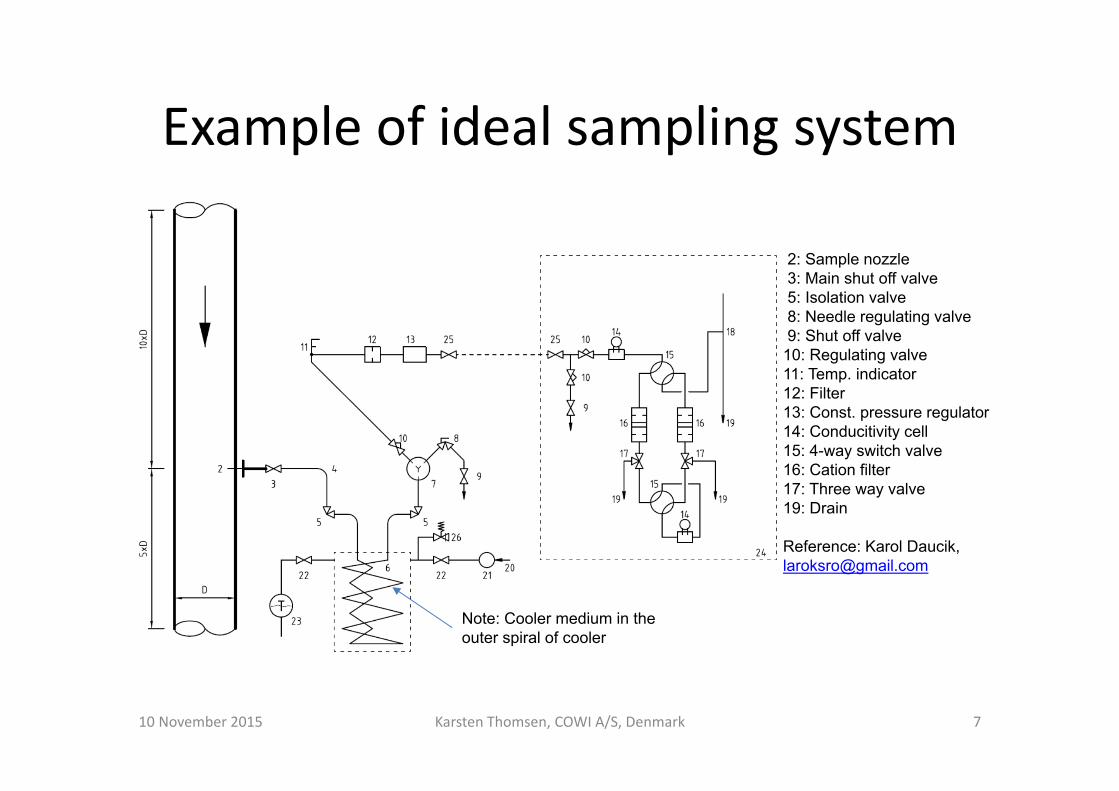
Example of ideal sampling system
10 November 2015 Karsten Thomsen, COWI A/S, Denmark 7
2: Sample nozzle3: Main shut off valve5: Isolation valve8: Needle regulating valve9: Shut off valve
10: Regulating valve11: Temp. indicator12: Filter13: Const. pressure regulator14: Conducitivity cell15: 4-way switch valve16: Cation filter17: Three way valve19: Drain
Reference: Karol Daucik, [email protected]
Note: Cooler medium in the outer spiral of cooler

How to take CP samples
Optimal sampling conditions• Stable load in the range (e.g. 80‐100 %) where sampling is normally done• Sample isolation valves fully open• By‐pass or remove any sample line filters• Flow rate sufficient to establish turbulent flow in sample line and sample cooler
(e.g. ~2 m/s linear flow rate for typical dimensions of 4 mm internal diameter and 50 mm diameter cooling coil)
• Sufficient flushing at this flow rate to establish steady state conditions(2 h suggested)
Sampling for Fe and Cu oxides (in contrast to dissolved components)• Do not flush sample bottles in sample stream, do not overflow sample bottle, i.e.
fill the bottle with the amount of sample needed.• No contact to sampling equipment, the sample must fall directly into the bottle.• Add conservation agent (nitric or thioglycolic acid) ASAP
10 November 2015 Karsten Thomsen, COWI A/S, Denmark 8

Ferrozine method – classical spectrophotometry
Pre-treatment and analysisDissolution of iron oxides in thioglycolic acid at 90 °C:
Fe2O3 + 6 HSCH2COOH 2 Fe3+ + 6 HSCH2COO- + 3 H2O
Fe3O4 + 8 HSCH2COOH 2 Fe3+ + Fe2+ + 8 HSCH2COO- + 4 H2O
Reduction of Fe(III) in acid enviroment
2 Fe3+ + 2 HSCH2COOH 2 Fe2+ + HOOCCH2S-SCH2COOH + 2 H+
Complex formation at neutral or slightly alkaline pH (pH 4-10)
Fe2+ + 3 fz2- [Fe(fz)3]4- where "fz2-" is the ferrozine reagent
10 November 2015 Karsten Thomsen, COWI A/S, Denmark 9
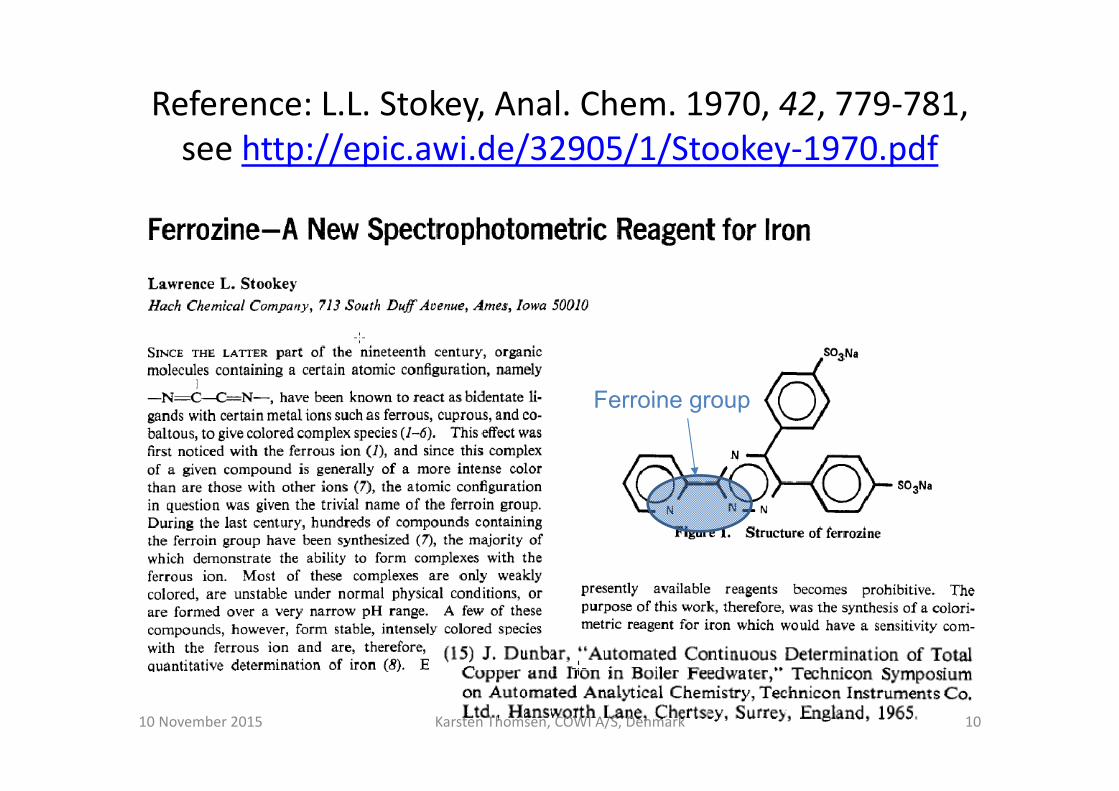
Reference: L.L. Stokey, Anal. Chem. 1970, 42, 779‐781, see http://epic.awi.de/32905/1/Stookey‐1970.pdf
10 November 2015 Karsten Thomsen, COWI A/S, Denmark 10
Ferroine group
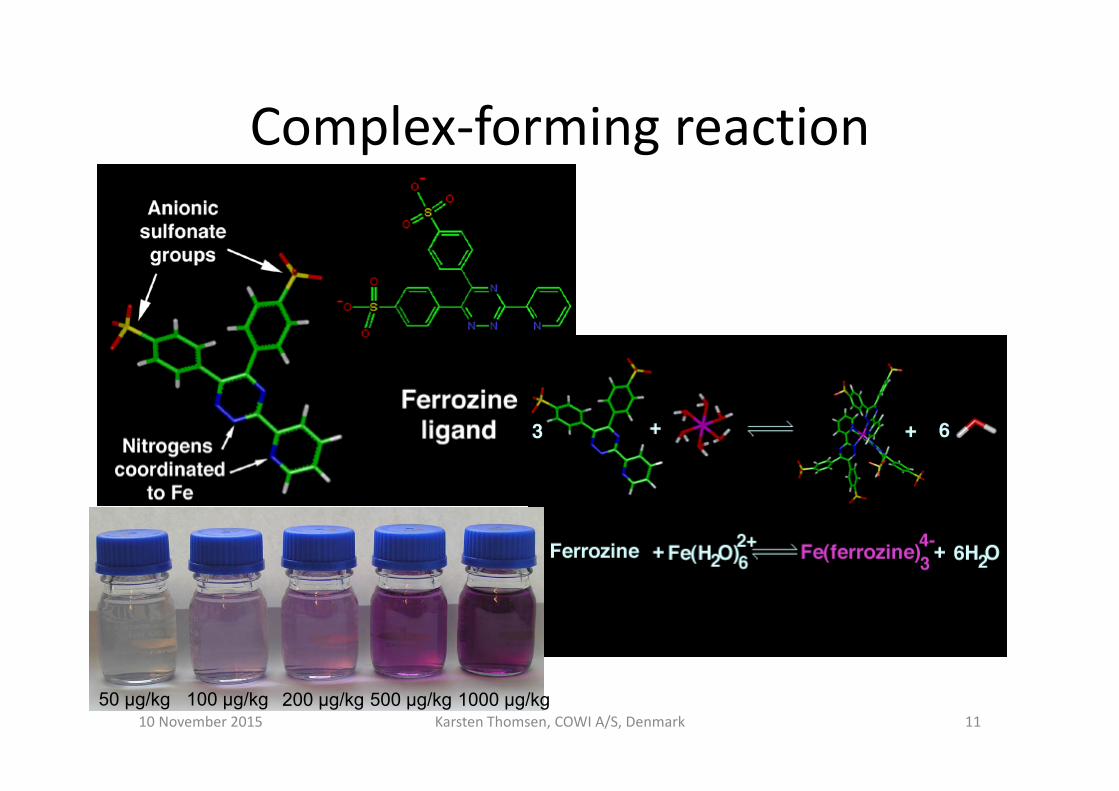
Complex‐forming reaction
10 November 2015 Karsten Thomsen, COWI A/S, Denmark 1150 µg/kg 100 µg/kg 200 µg/kg 500 µg/kg 1000 µg/kg

Verification of ferrozine method
• Data from verification of new spectrophotometer at NJV water chemistry lab: Analytic Jena SPECORD 210 PLUS
• Performed by lab‐tech‐student, Kimmie Mølgaard Dalgas, for her bachelor project.
• Results compared to lab. specs and specs mentioned in TGD
10 November 2015 Karsten Thomsen, COWI A/S, Denmark 12
5 cm quartz cuvette

Travel kit for Fe analysis
10 November 2015 Karsten Thomsen, COWI A/S, Denmark 13

ResultsResults of verification Unit New instrument Old instrument Spec/remark
Linearity ppb 100‐1250R²=0.9997
100‐1250R²=0.9999
R²>0.98
Sensitivity ppb‐1 0.0023 0.0023 Abs‐units per ppb
Trueness (accuracy) ppb At 10, 100 & 500 ppb:No statistically significant bias demonstrated, i.e. bias ≈ 0
No significant bias
Precision (as repeatability)
% At 10 ppb 3.2At 100 ‐ 0.46At 500 ‐ 0.13
At 10 ppb <10At 100 ‐ <1At 500 ‐ <1
Precision (as reproducibility)
% At 10 ppb 6.0At 100 ‐ 2.8At 500 ‐ 0.53
Statistical control in X‐chart (actually specs both trueness and precision)
Quantification limit (QL) ppb 1.1 (=10*s0) ~1 Lab: <2TGD: <2
Detection limit (DL) ppb 0.33 (=3*s0) s0 is std. dev. at DL
Reagent correction (C0) ppb 0.42±0.22 Stability ≥ 2 months(C0 subtracted frommeasured value for realsamples)
10 November 2015 Karsten Thomsen, COWI A/S, Denmark 14

QC tools mentioned in TGD
• Internal quality control ‐ what may be achieved:– Check of pre‐treatment and analysis – verifying uncertainty from
verification over time– Comparison of different analytical techniques, e.g. spectrophotometry
and ICP/AES or ICP/MS– Check contribution to uncertainty from sampling – verify that this is
stable over time for key parameter sampling lines, e.g. Fe in feed water
• Parallel measurements and round robins– Check analytical results versus independent technique and lab– Establish solid basis for total uncertainty per technique and/or
sampling practise – essential knowledge when comparing operational data between plants/laboratories
10 November 2015 Karsten Thomsen, COWI A/S, Denmark 15

Comparison of uncertainty of real and synthetic samples in lab‐tech‐project
• Real sample of LPH‐condensate according to TGD procedure:– Stable operating conditions, stable sampling conditions– Take 5‐6 separate samples in rapid succession. Here 3 batches of 6 samples to check effect of storage conditions
– Analyse batches separately, take potential outliers into account, and compare mean and standard deviation.
• Synthetic samples – prepared from stock solutions to 10 µg/kg – analyse following the SOP for samples.
10 November 2015 Karsten Thomsen, COWI A/S, Denmark 16
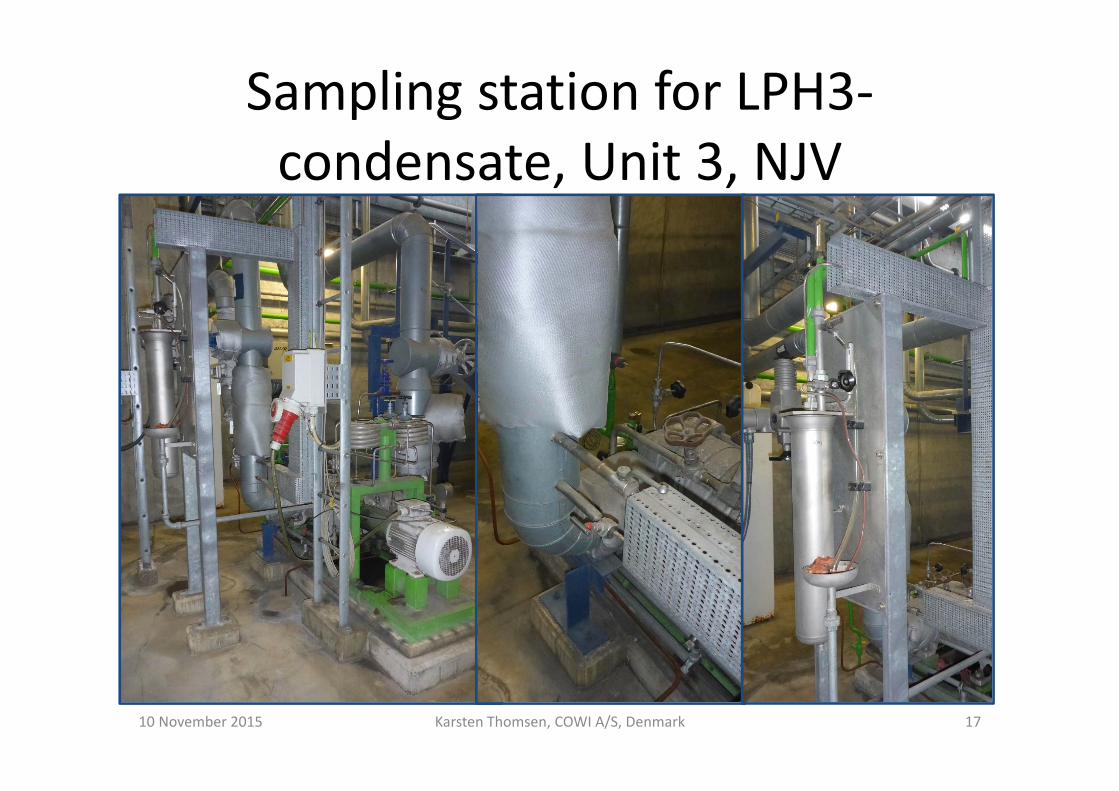
Sampling station for LPH3‐condensate, Unit 3, NJV
10 November 2015 Karsten Thomsen, COWI A/S, Denmark 17

Results – no outliers discardedBatch Sample Mean StdDev U Control Mean StdDev UBatch 1 3,5 9,03
1 3,58 9,691 7,97 9,251 6,41 5,4 2,0 1,65 9,77 9,6 0,4 0,341 3,63 37,8% 10,06 4,3%1 7,08 9,99
Batch 2 18,43 9,572 5,45 10,412 2,25 9,342 12,73 9,792 1,69 5,5 4,0 3,24 9,83 9,7 0,4 0,322 4,58 72,1% 9,63 4,1%
Batch 3 6,38 9,343 9,03 9,563 6,59 10,263 10,6 8,0 3,6 2,97 10,09 9,8 0,3 0,283 2,64 45,2% 9,98 3,5%3 12,99 9,82
All 7,0 4,4 2,08 9,7 0,4 0,1763,3% 3,7%
10 November 2015 Karsten Thomsen, COWI A/S, Denmark 18
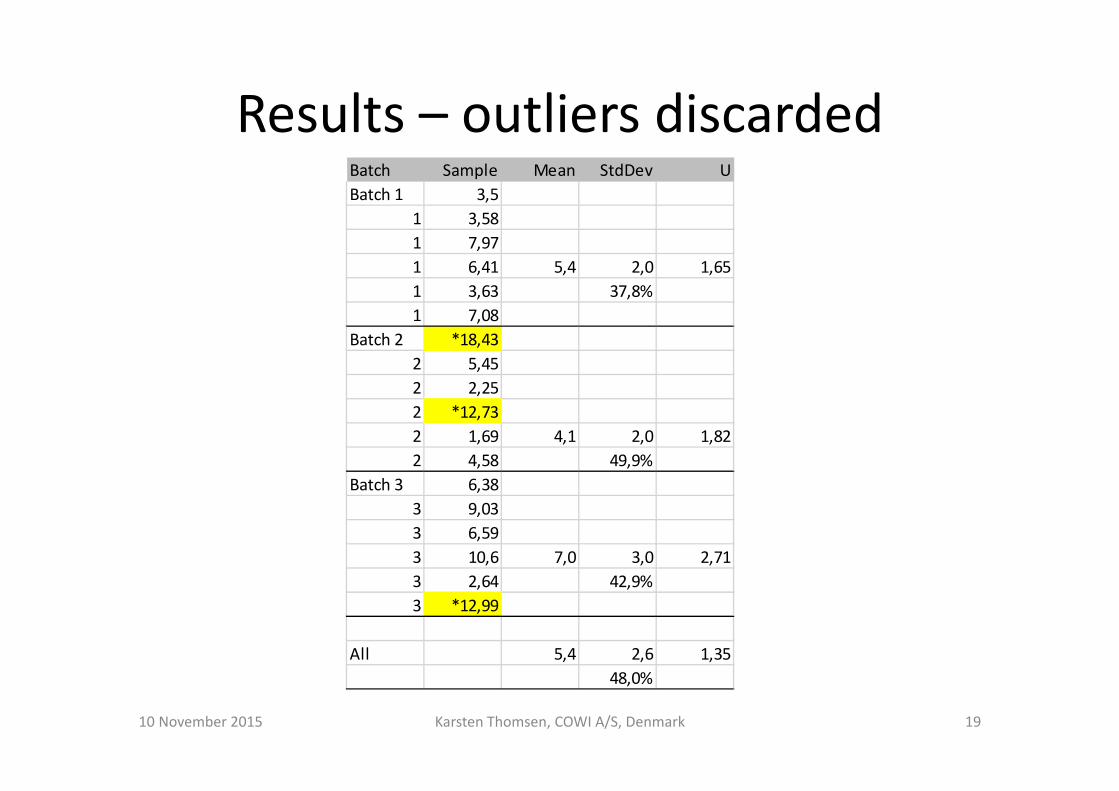
Results – outliers discardedBatch Sample Mean StdDev UBatch 1 3,5
1 3,581 7,971 6,41 5,4 2,0 1,651 3,63 37,8%1 7,08
Batch 2 *18,432 5,452 2,252 *12,732 1,69 4,1 2,0 1,822 4,58 49,9%
Batch 3 6,383 9,033 6,593 10,6 7,0 3,0 2,713 2,64 42,9%3 *12,99
All 5,4 2,6 1,3548,0%
10 November 2015 Karsten Thomsen, COWI A/S, Denmark 19

Results – log‐normal distribution assumed
Batch Sample LogC Mean StdDev Mean ‐U +UBatch 1 3,5 0,544068
1 3,58 0,5538831 7,97 0,9014581 6,41 0,806858 0,703 0,167 5,0 1,4 1,91 3,63 0,5599071 7,08 0,850033
Batch 2 18,43 1,2655252 5,45 0,7363972 2,25 0,3521832 12,73 1,104828 0,725 0,407 5,3 2,8 6,12 1,69 0,2278872 4,58 0,660865
Batch 3 6,38 0,8048213 9,03 0,9556883 6,59 0,8188853 10,6 1,025306 0,857 0,244 7,2 2,6 4,23 2,64 0,4216043 12,99 1,113609
All 0,761 0,282 5,8 2,4 4,0
10 November 2015 Karsten Thomsen, COWI A/S, Denmark 20
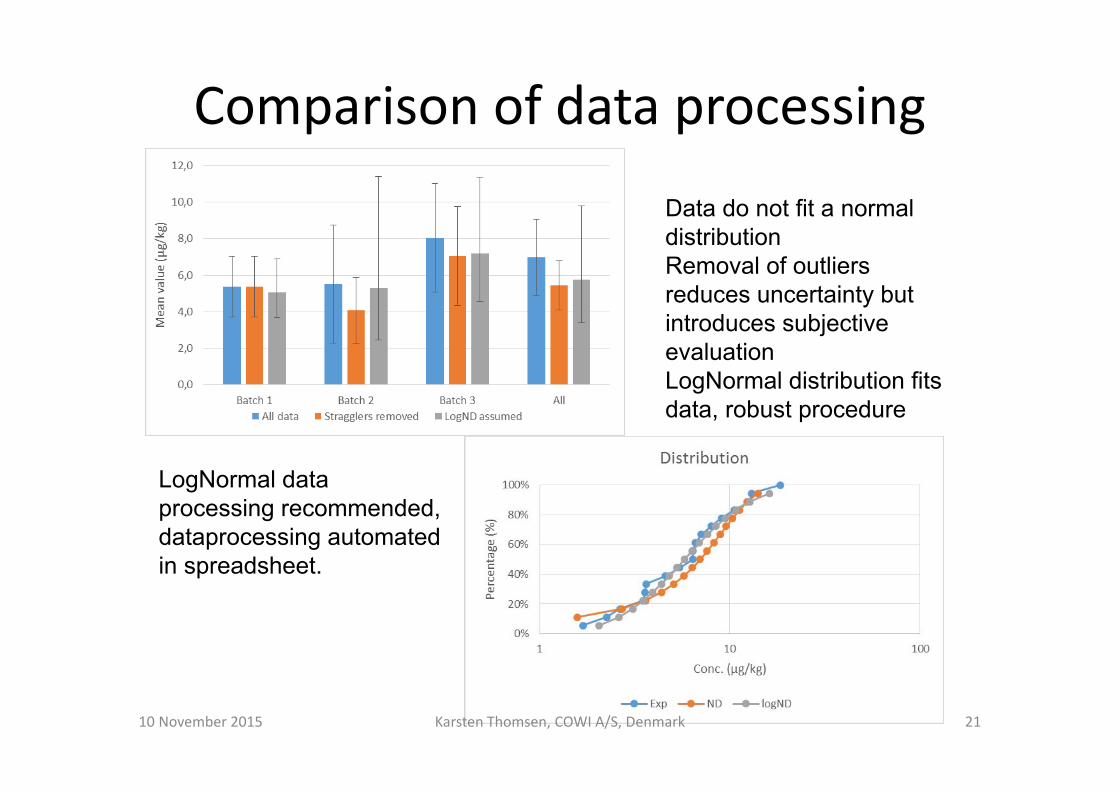
Comparison of data processing
LogNormal data processing recommended, dataprocessing automated in spreadsheet.
Data do not fit a normal distributionRemoval of outliers reduces uncertainty but introduces subjective evaluationLogNormal distribution fits data, robust procedure
10 November 2015 Karsten Thomsen, COWI A/S, Denmark 21
Lab comparisons
• Tools for quality assurrance when the analysis method has initially been verified– Round robins on natural and synthetic samples among a group of laboratories
• More demanding with respect to planning, preparation of homogeneous natural samples, and reporting
– Parallel analysis between 3‐4 laboratories of natural and synthetic samples
• Less demanding with respect to planning and reporting• Natural samples taken in series with short time interval from ordinary sampling points of interest
• Recommended as an important tool in the TGD
10 November 2015 Karsten Thomsen, COWI A/S, Denmark 22
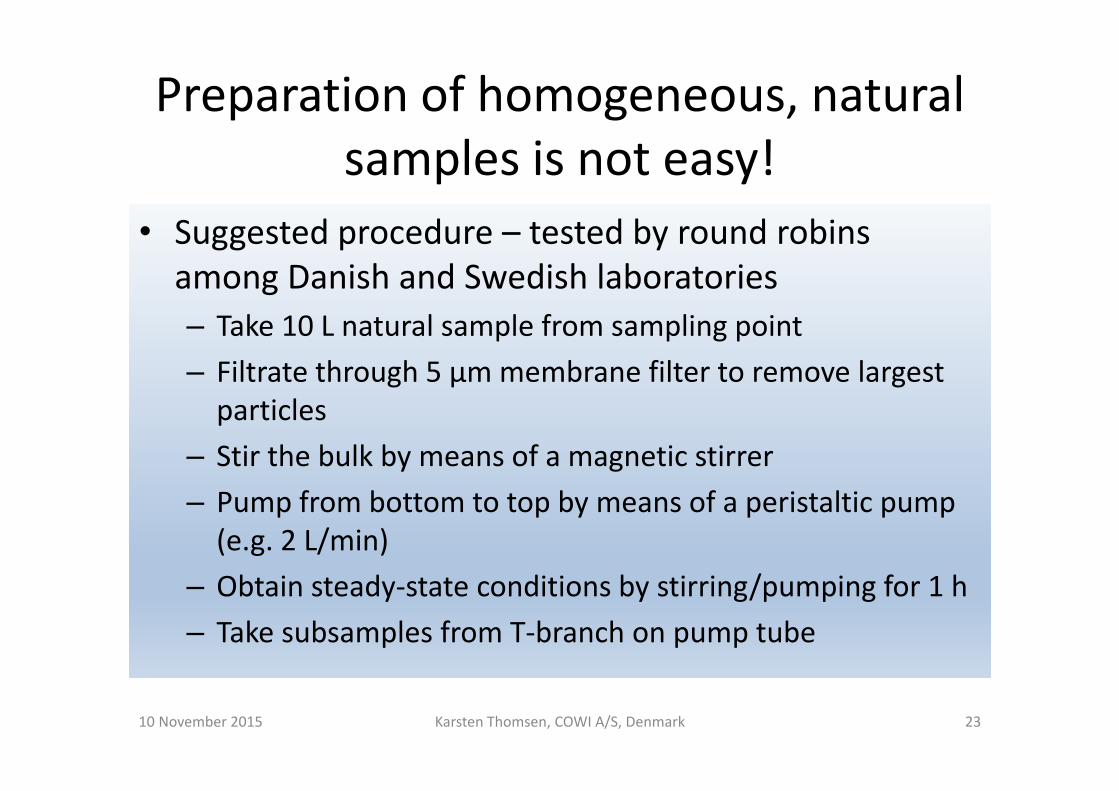
Preparation of homogeneous, natural samples is not easy!
• Suggested procedure – tested by round robinsamong Danish and Swedish laboratories– Take 10 L natural sample from sampling point– Filtrate through 5 µm membrane filter to remove largestparticles
– Stir the bulk by means of a magnetic stirrer– Pump from bottom to top by means of a peristaltic pump (e.g. 2 L/min)
– Obtain steady‐state conditions by stirring/pumping for 1 h– Take subsamples from T‐branch on pump tube
10 November 2015 Karsten Thomsen, COWI A/S, Denmark 23

Test of homogeneity and stability
• 10 L of district heating water, typical iron level 10‐50 µg/L, treated according to procedure
• 63 subsamples produced, ramdomly divided in 3 batches
• The batches were analysed after 1, 10 and 21 days to test stability during storage
• Test method: Digestion with thioglycolic acid directlyin sample bottle, analysis by the ferrozinespectrophotometric method
10 November 2015 Karsten Thomsen, COWI A/S, Denmark 24

Results as cumulated frequenciesDistribution of results
0,0%
20,0%
40,0%
60,0%
80,0%
100,0%
120,0%
1,0 10,0 100,0
Fe (µg/kg)
Perc
entil
e (%
)
1 day10 days21 days
Batch Mean Std.dev.
1 day 3.4 0.4
10 days 3.9 0.3
21 days 3.3 0.1The highest result in each batch excluded
Evaluation: The samples are fairly homogeneous, however some stragglers remain.
Samples could be used for round robins or as internal reference materials, possible stragglers must be taken into account when evaluating results.
Stragglers
10 November 2015 Karsten Thomsen, COWI A/S, Denmark 25

Results of round robinsMeasured versus nominal value
-20
0
20
40
60
80
100
120
140
0 20 40 60 80 100 120
Nominal (µg/kg)
Mea
sure
d (µ
g/kg
)
LabAccept-minAccept-maxReject-minReject-max
10 laboratories7 round robins
14 different samples
Specs:
-SD = 2 µg/kg, C < 20
-SD = 10 %, C ≥ 20
-Z = (Clab-Cnom)/SD
-Accepted: Z ≤ 2
-Doubtful: Z ≤ 3
-Rejected: Z > 3
10 November 2015 Karsten Thomsen, COWI A/S, Denmark 26
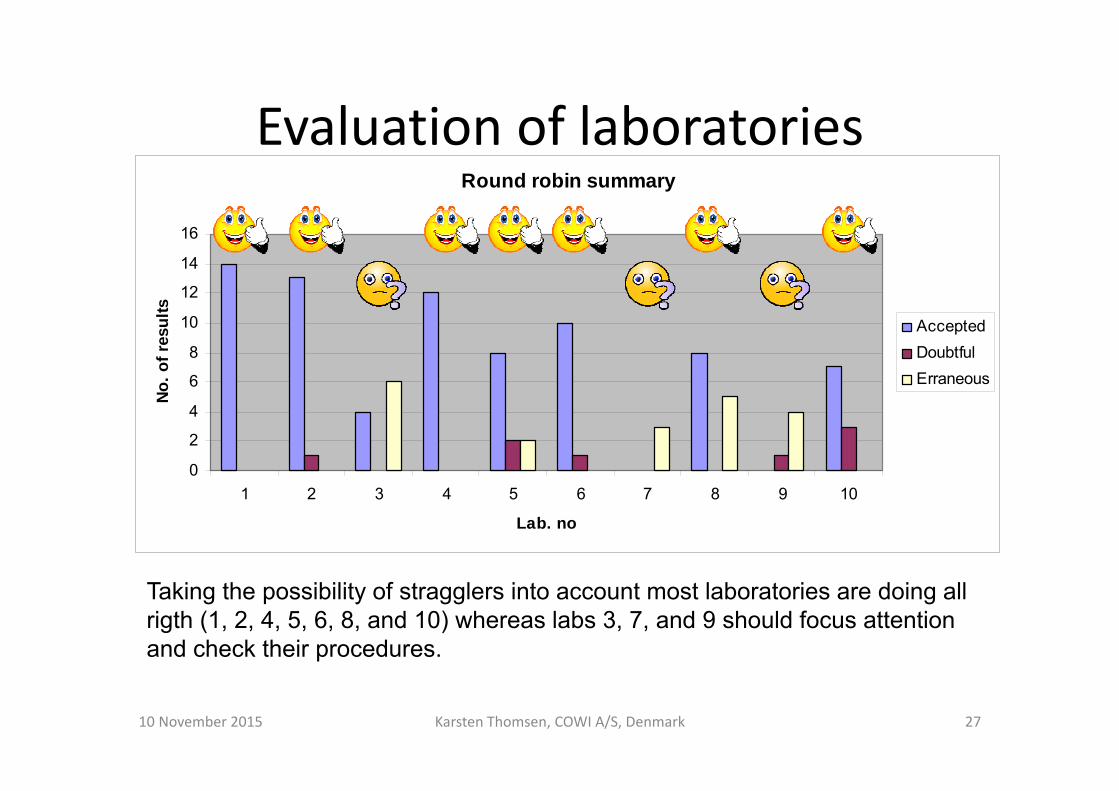
Evaluation of laboratoriesRound robin summary
0
2
4
6
8
10
12
14
16
1 2 3 4 5 6 7 8 9 10
Lab. no
No. o
f res
ults
AcceptedDoubtfulErraneous
Taking the possibility of stragglers into account most laboratories are doing all rigth (1, 2, 4, 5, 6, 8, and 10) whereas labs 3, 7, and 9 should focus attention and check their procedures.
10 November 2015 Karsten Thomsen, COWI A/S, Denmark 27

Parallel measurements
• Procedure– Use ordinary sampling point(s) for Fe, establish stable sampling conditions
– Take 4 subsamples for each lab and 8‐10 extra in rapid succession, mark with number in sequence
– Randomize subsamples, analyse extra samples initially to check homogeneity
– Distribute samples to the laboratories– Labs: Analyze and submit sample no. and result– Assessor: Compare levels among laboratories, check for tendency in sample sequence and stragglers
10 November 2015 Karsten Thomsen, COWI A/S, Denmark 28
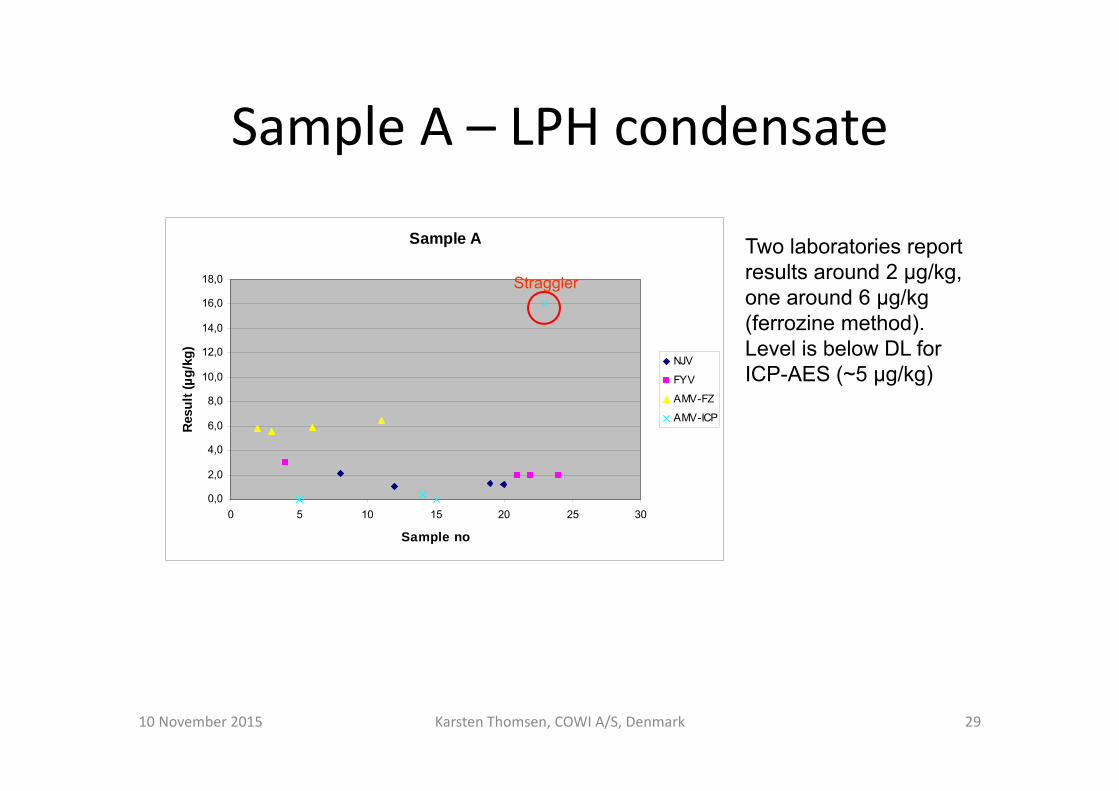
Sample A – LPH condensate
Sample A
0,0
2,0
4,0
6,0
8,0
10,0
12,0
14,0
16,0
18,0
0 5 10 15 20 25 30
Sample no
Resu
lt (µ
g/kg
)
NJV
FYV
AMV-FZ
AMV-ICP
Straggler
Two laboratories report results around 2 µg/kg, one around 6 µg/kg (ferrozine method). Level is below DL for ICP-AES (~5 µg/kg)
10 November 2015 Karsten Thomsen, COWI A/S, Denmark 29

Sample B – filtrate from sand filter in water worksSample B
0,0
5,0
10,0
15,0
20,0
25,0
30,0
35,0
40,0
0 5 10 15 20 25
Sample no
Resu
lt (µ
g/kg
)
NJV
FYV
AMV-FZ
AMV-ICP
Results in the range 30±5 µg/kg, however one lab finds ~15 µg/kg with the ferrozine method
10 November 2015 Karsten Thomsen, COWI A/S, Denmark 30
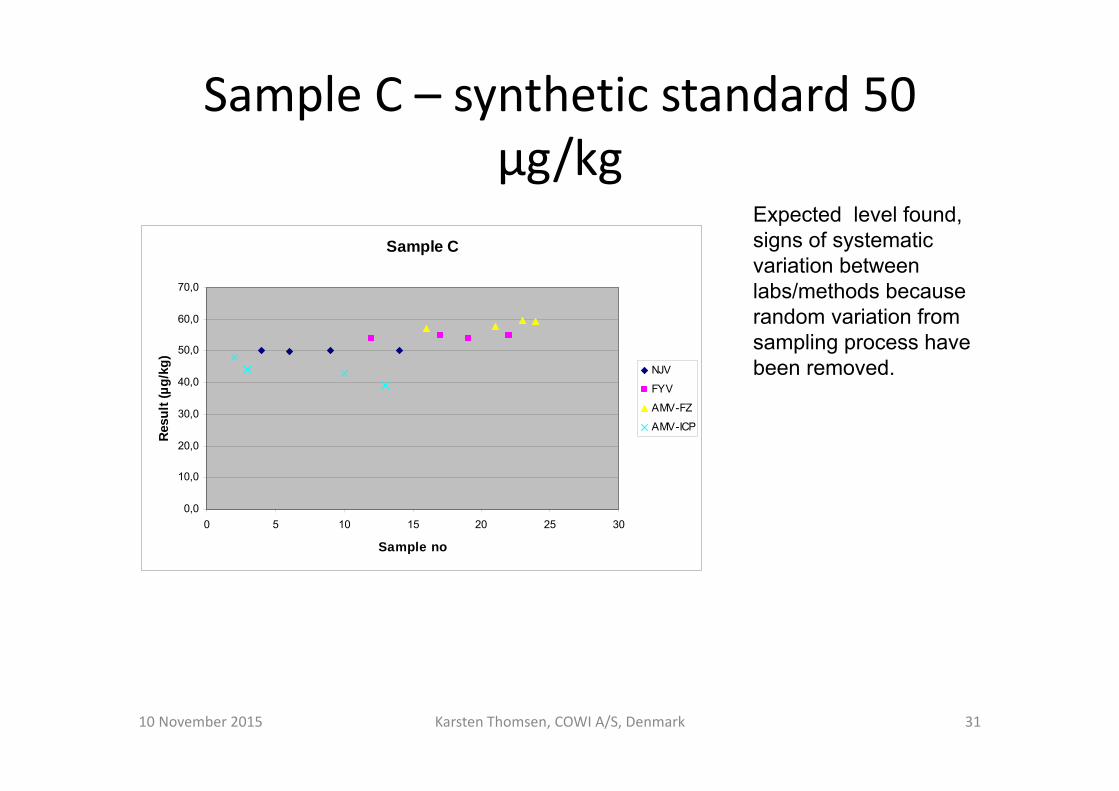
Sample C – synthetic standard 50 µg/kg
Sample C
0,0
10,0
20,0
30,0
40,0
50,0
60,0
70,0
0 5 10 15 20 25 30
Sample no
Resu
lt (µ
g/kg
)
NJV
FYV
AMV-FZ
AMV-ICP
Expected level found, signs of systematic variation between labs/methods because random variation from sampling process have been removed.
10 November 2015 Karsten Thomsen, COWI A/S, Denmark 31
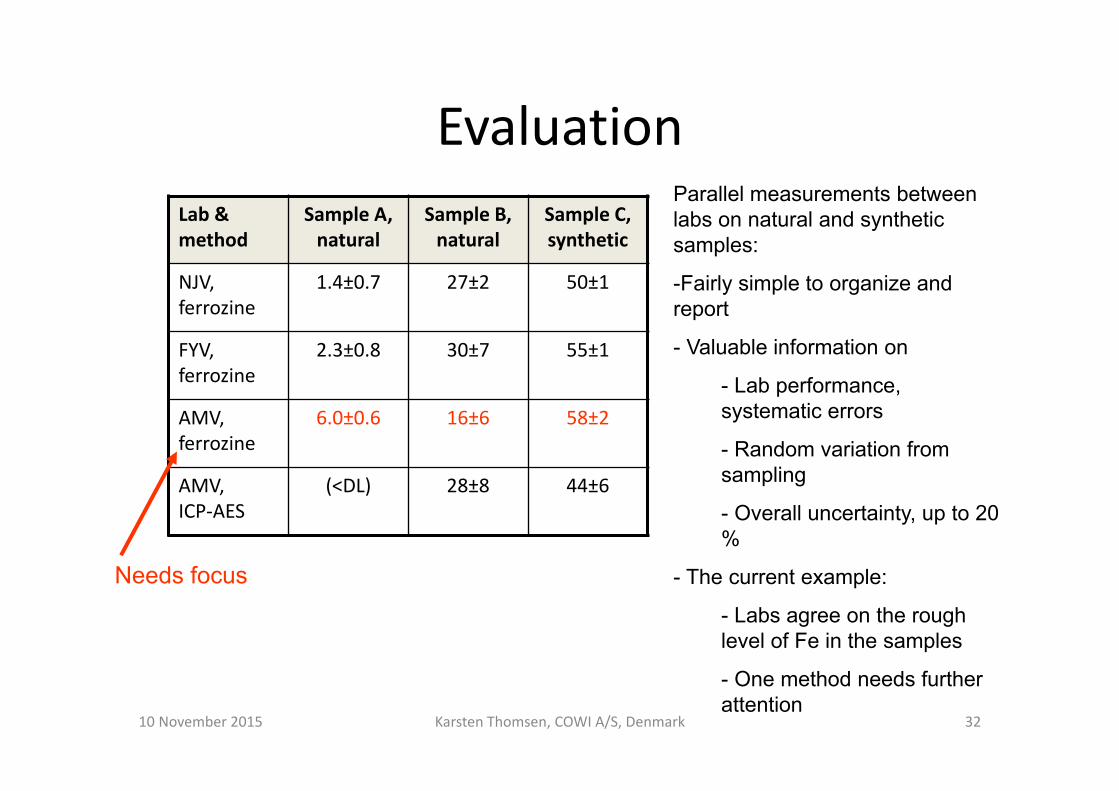
EvaluationLab & method
Sample A, natural
Sample B, natural
Sample C, synthetic
NJV, ferrozine
1.4±0.7 27±2 50±1
FYV, ferrozine
2.3±0.8 30±7 55±1
AMV, ferrozine
6.0±0.6 16±6 58±2
AMV,ICP‐AES
(<DL) 28±8 44±6
Needs focus
Parallel measurements between labs on natural and synthetic samples:
-Fairly simple to organize and report
- Valuable information on
- Lab performance, systematic errors
- Random variation from sampling
- Overall uncertainty, up to 20 %
- The current example:
- Labs agree on the rough level of Fe in the samples
- One method needs further attention
10 November 2015 Karsten Thomsen, COWI A/S, Denmark 32

Conclusions
• Specs in TGD for spectrophotometry may realized in practice, even with relatively cheap and simple instrumentation.
• Internal quality control must be a part of the SOP in any lab.
• Lab comparisons give value for time/money:– The least complex setup allow assessment of lab performance
– The more complex round robin brings detailed quality information, but is more costly in time or money
10 November 2015 Karsten Thomsen, COWI A/S, Denmark 33
Revision of sampling TGD
• Many plants do not operate under steady, high load conditions:– When and how should CP measurements be done?– How to interpret the results? Do the results express CP burst due to start‐up or
changing load conditions? How to "filter out" the measurements related to current corrosion processes?
– Could on‐line measurement of turbidity be related to corrosion product levels and eventually to corrosion rate?
• How fast should the pretreatment/analysis take place after sampling? Differences between the techniques?
• What is the normal level of uncertainty from the sampling process?• Could the log‐normal distribution be used to alleviate the problem of
"outliers"?• Gathering of experiences and experimental data supports the revision of the
TGD on sampling.
10 November 2015 Karsten Thomsen, COWI A/S, Denmark 34

Invitation
• Take part in an international test of sampling uncertainty– Fill out questionnaire on boiler type, conditioning, operating mode/load
pattern, sampling system, etc.– Take 20 samples in ~20 min, analyse with several 10 µg/kg QC‐standards,
report the data in predefined Excel dataform.– Should be done for feed water and a sample point of your own choice –
what you consider important to monitor CPs.• Data from all plant will be processed and according to main
variables from questionnaire– Gives the broad experience necessary to improve the TGD– Report to all participants with comparison of your data to the group data
=> check of your own sampling system/procedures• Contact Karsten, if preliminary interested
10 November 2015 Karsten Thomsen, COWI A/S, Denmark 35

Outlook
• The revised sampling TGD will provide:– Advice on sampling of CP's and interpretation of results for plants under cycling/fast‐start conditions
– Evaluate alternatives to CP measurements as e.g. turbidity– Improve instructions on the analysis methods– Provide experience on uncertainty levels and data processing
• New version available September 2016 (hopefully!)
10 November 2015 Karsten Thomsen, COWI A/S, Denmark 36


![国际水和水蒸气性质学会 年...IAPWS-IF97 公式取代了之前由国际公式化委员会制定的“工业用1967 年IFC 公式”(简称IFC-67 公式)[1]. 关于本公告的更多细节可参考W](https://img.pdfslide.us/doc/110x75/610e5d5186fd114a2506267e/eoeee-iapws-if97-ceoecaoec1967.jpg)