Embed Size (px)
Citation preview
SampleCo 2015
Management Intelligence Report | Company Overview
Page 2
Introduction
At WorkplaceDynamics we have found that
the most successful companies are the ones
that employees believe in.
We have helped thousands of companies to
improve their workplace and their
long-term performance by listening to their
employees.
This Management Intelligence Company
Overview provides a snapshot of your
employees’ opinions about their jobs and
your organization’s health.
Page 2©2015 WorkplaceDynamics, LLC
Page 3
Introduction
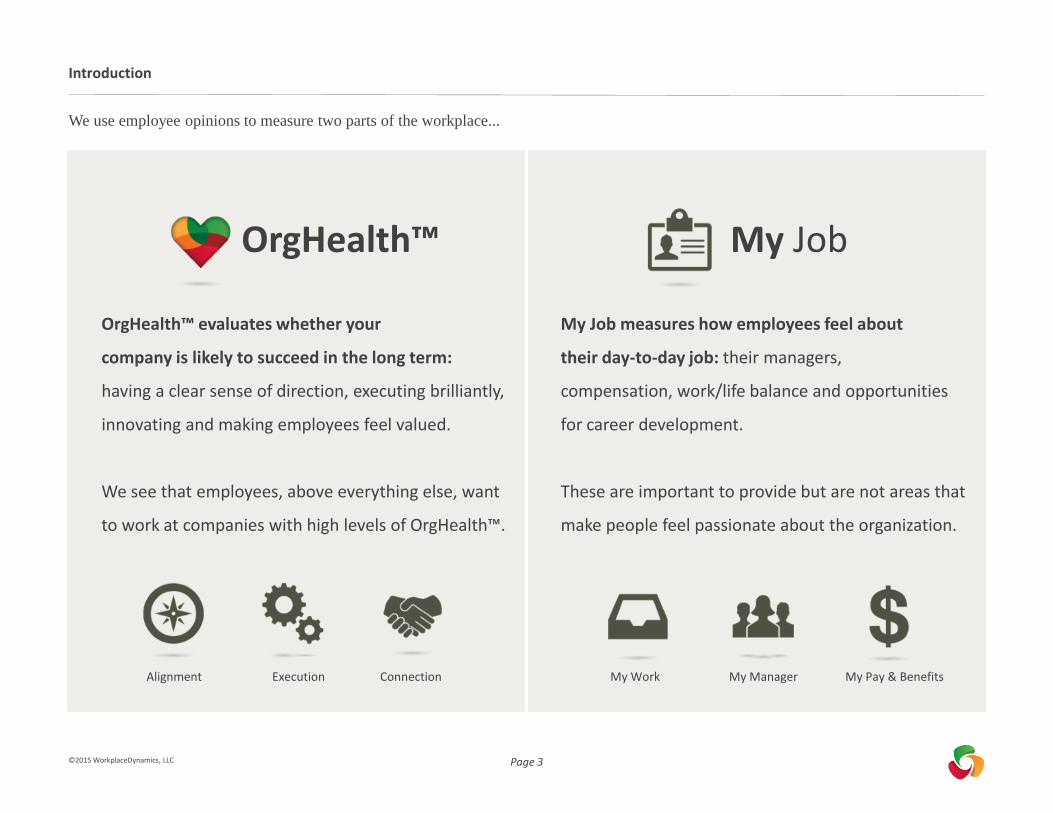
We use employee opinions to measure two parts of the workplace...
Alignment
OrgHealth™ My Job
Execution Connection My Work My Manager My Pay & Benefits
OrgHealth™ evaluates whether your
company is likely to succeed in the long term:
having a clear sense of direction, executing brilliantly,
innovating and making employees feel valued.
We see that employees, above everything else, want
to work at companies with high levels of OrgHealth™.
My Job measures how employees feel about
their day-to-day job: their managers,
compensation, work/life balance and opportunities
for career development.
These are important to provide but are not areas that
make people feel passionate about the organization.
©2015 WorkplaceDynamics, LLC
Page 4
Key Facts
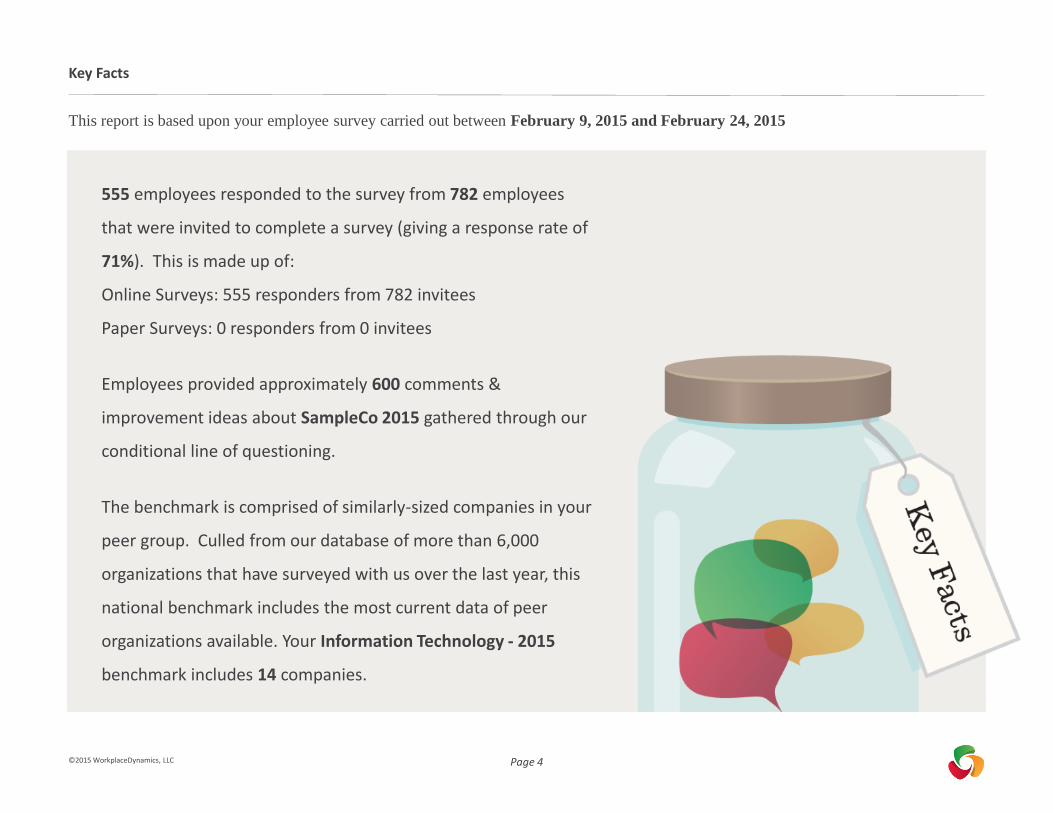
This report is based upon your employee survey carried out between February 9, 2015 and February 24, 2015
555 employees responded to the survey from 782 employees
that were invited to complete a survey (giving a response rate of
71%). This is made up of:
Online Surveys: 555 responders from 782 invitees
Paper Surveys: 0 responders from 0 invitees
Employees provided approximately 600 comments &
improvement ideas about SampleCo 2015 gathered through our
conditional line of questioning.
The benchmark is comprised of similarly-sized companies in your
peer group. Culled from our database of more than 6,000
organizations that have surveyed with us over the last year, this
national benchmark includes the most current data of peer
organizations available. Your Information Technology - 2015
benchmark includes 14 companies.
©2015 WorkplaceDynamics, LLC
Page 5
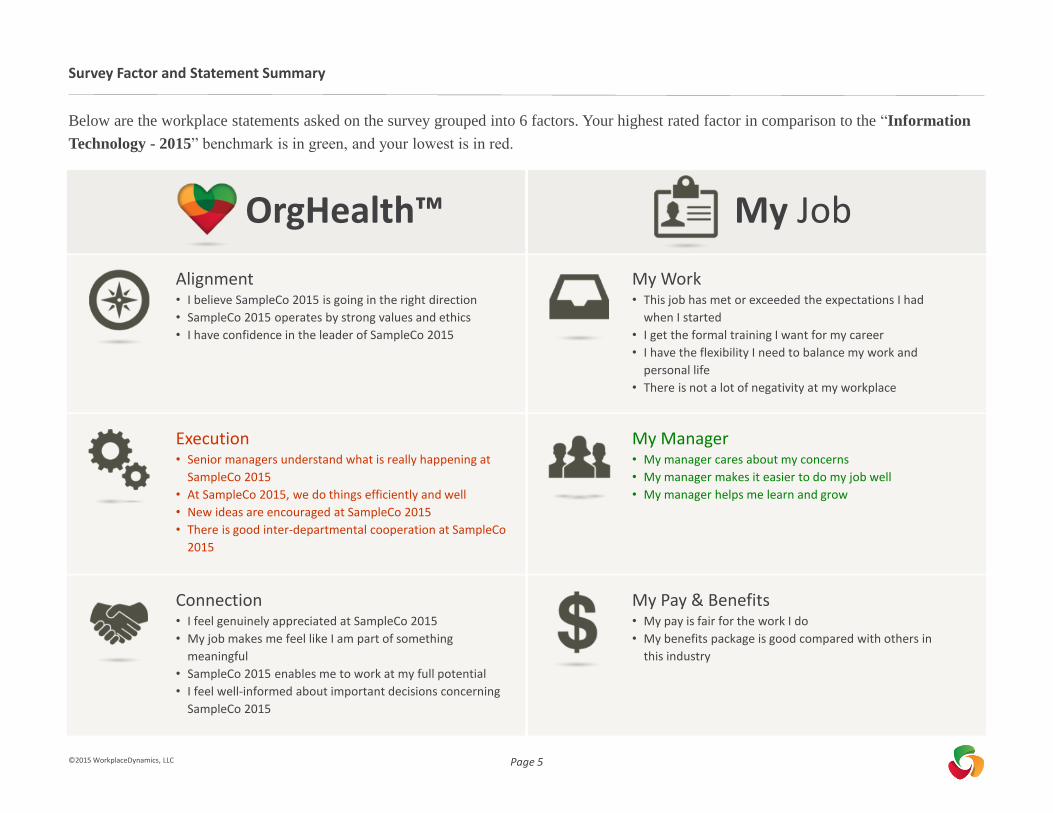
Survey Factor and Statement Summary
Execution• Senior managers understand what is really happening at
SampleCo 2015
• At SampleCo 2015, we do things efficiently and well
• New ideas are encouraged at SampleCo 2015
• There is good inter-departmental cooperation at SampleCo
2015
Connection• I feel genuinely appreciated at SampleCo 2015
• My job makes me feel like I am part of something
meaningful
• SampleCo 2015 enables me to work at my full potential
• I feel well-informed about important decisions concerning
SampleCo 2015
My Work• This job has met or exceeded the expectations I had
when I started
• I get the formal training I want for my career
• I have the flexibility I need to balance my work and
personal life
• There is not a lot of negativity at my workplace
My Manager• My manager cares about my concerns
• My manager makes it easier to do my job well
• My manager helps me learn and grow
My Pay & Benefits• My pay is fair for the work I do
• My benefits package is good compared with others in
this industry
Alignment• I believe SampleCo 2015 is going in the right direction
• SampleCo 2015 operates by strong values and ethics
• I have confidence in the leader of SampleCo 2015
Below are the workplace statements asked on the survey grouped into 6 factors. Your highest rated factor in comparison to the “Information
Technology - 2015” benchmark is in green, and your lowest is in red.
OrgHealth™ My Job
©2015 WorkplaceDynamics, LLC
Page 6
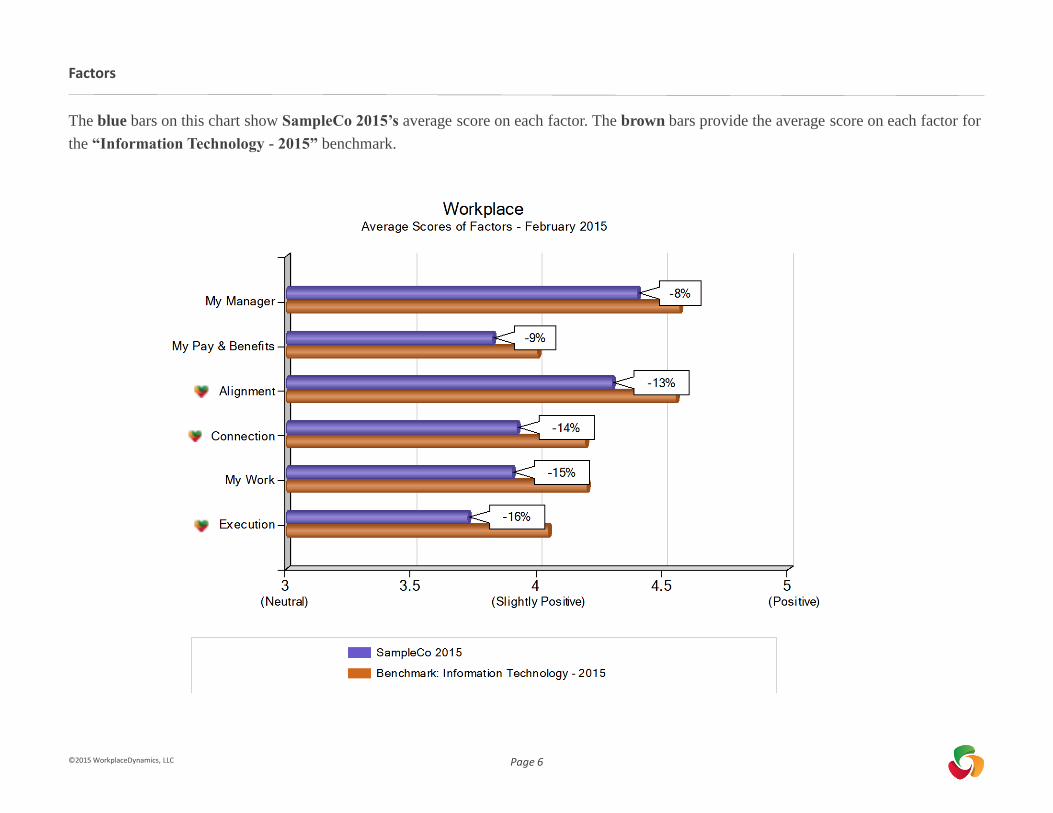
The blue bars on this chart show SampleCo 2015’s average score on each factor. The brown bars provide the average score on each factor for
the “Information Technology - 2015” benchmark.
Factors
©2015 WorkplaceDynamics, LLC
Page 7
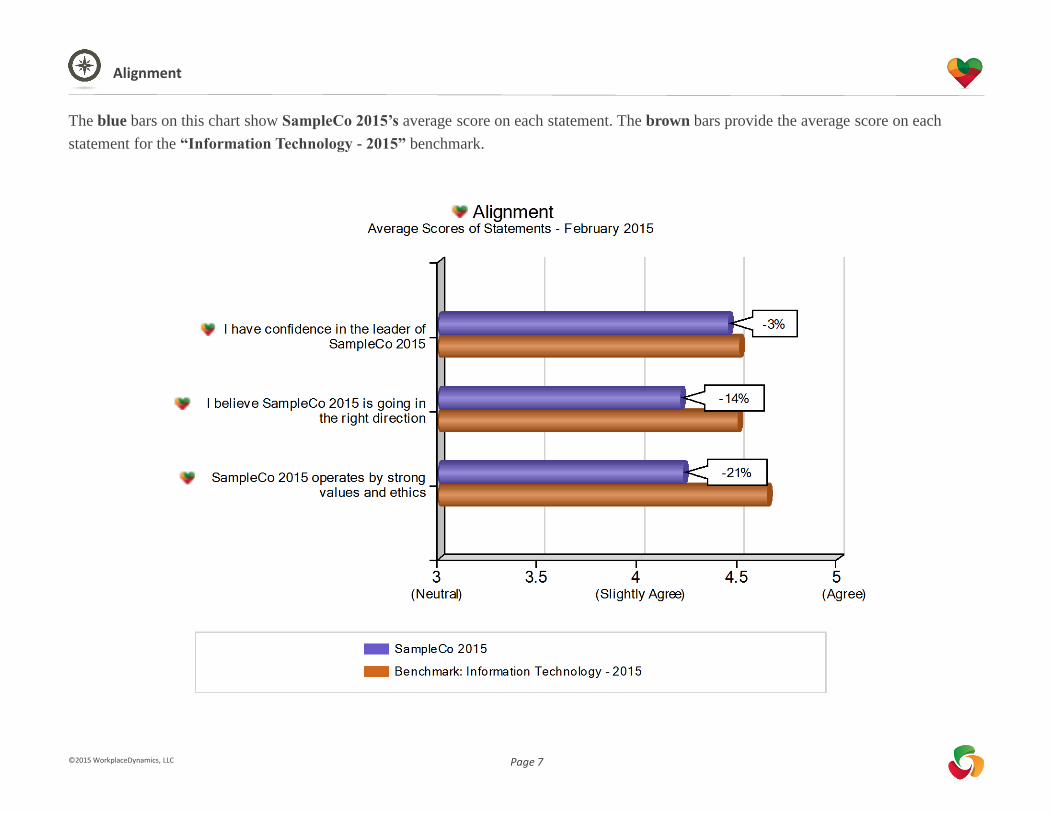
The blue bars on this chart show SampleCo 2015’s average score on each statement. The brown bars provide the average score on each
statement for the “Information Technology - 2015” benchmark.
Alignment
©2015 WorkplaceDynamics, LLC
Page 8
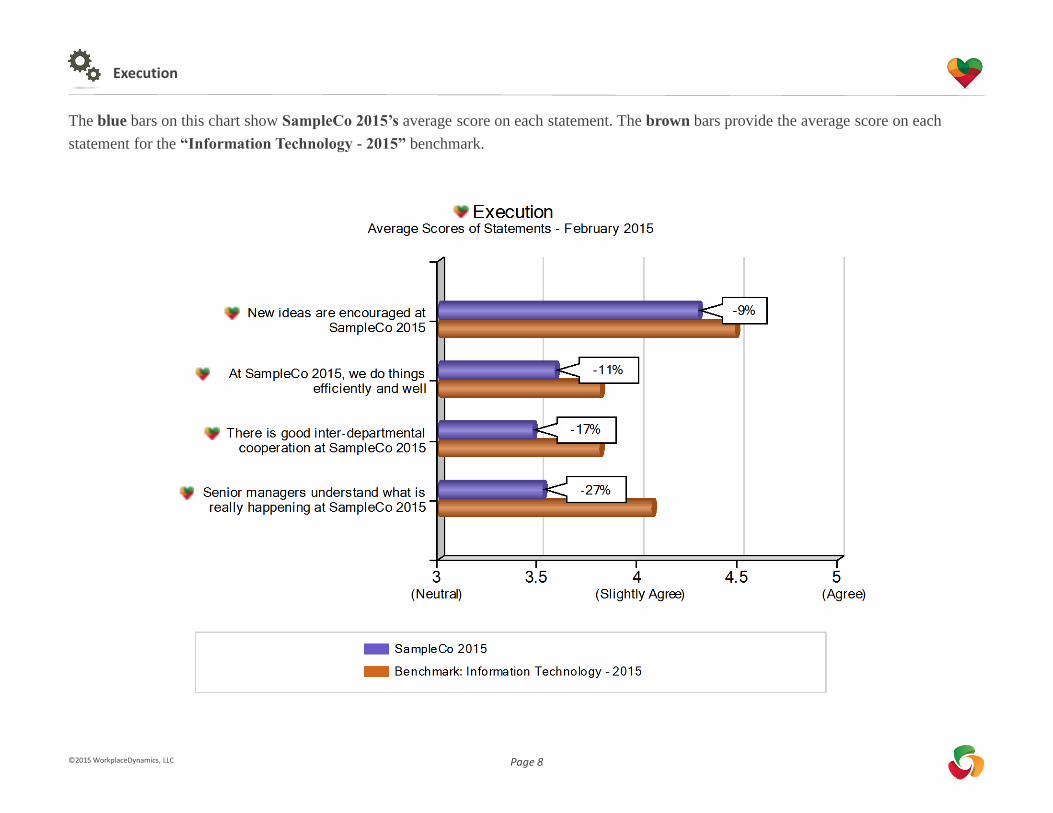
Execution
The blue bars on this chart show SampleCo 2015’s average score on each statement. The brown bars provide the average score on each
statement for the “Information Technology - 2015” benchmark.
©2015 WorkplaceDynamics, LLC
Page 9
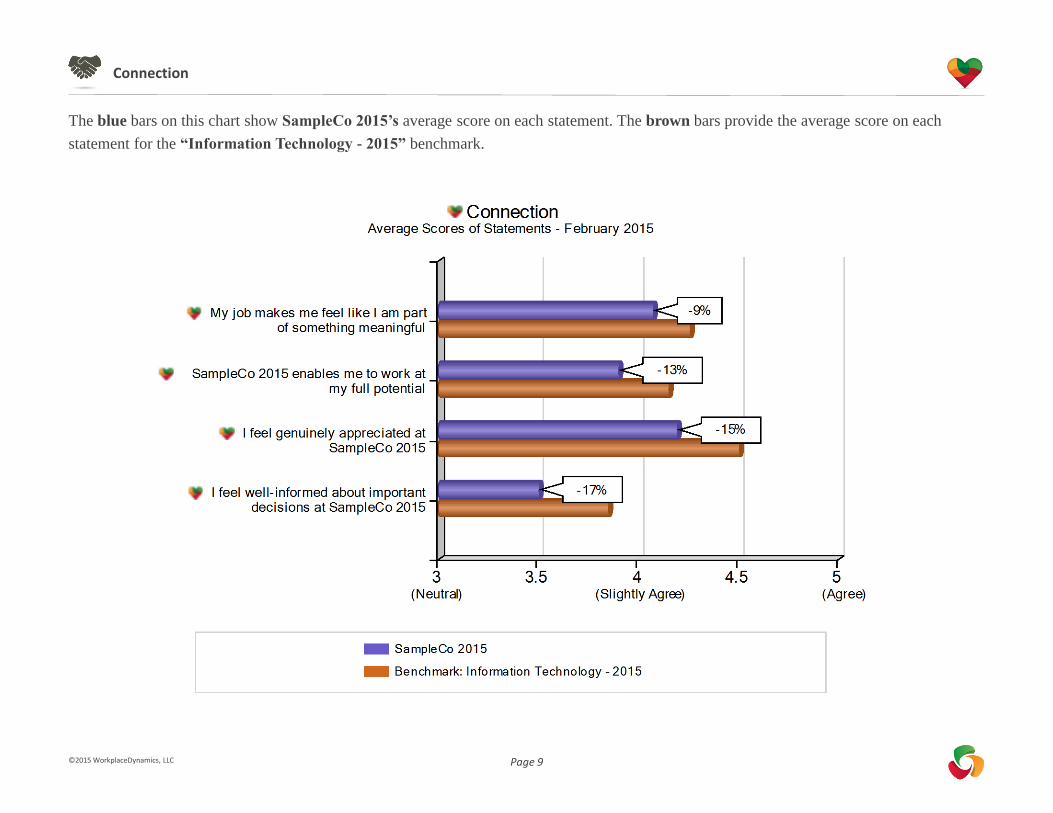
Connection
The blue bars on this chart show SampleCo 2015’s average score on each statement. The brown bars provide the average score on each
statement for the “Information Technology - 2015” benchmark.
©2015 WorkplaceDynamics, LLC
Page 10
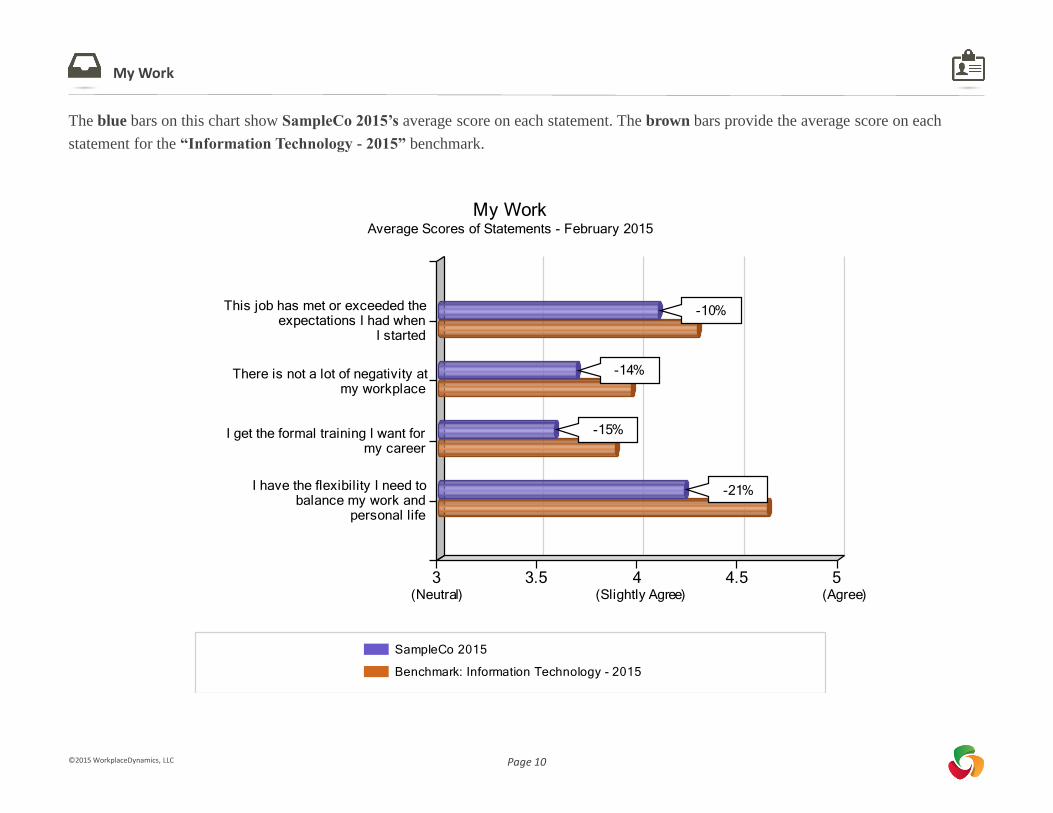
My Work
3 3.5 4 4.5 5
I have the flexibility I need tobalance my work and
personal life
I get the formal training I want formy career
There is not a lot of negativity atmy workplace
This job has met or exceeded theexpectations I had when
I started
SampleCo 2015
Benchmark: Information Technology - 2015
My WorkAverage Scores of Statements - February 2015
-21%
-15%
-14%
-10%
(Neutral) (Slightly Agree) (Agree)
The blue bars on this chart show SampleCo 2015’s average score on each statement. The brown bars provide the average score on each
statement for the “Information Technology - 2015” benchmark.
©2015 WorkplaceDynamics, LLC
Page 11
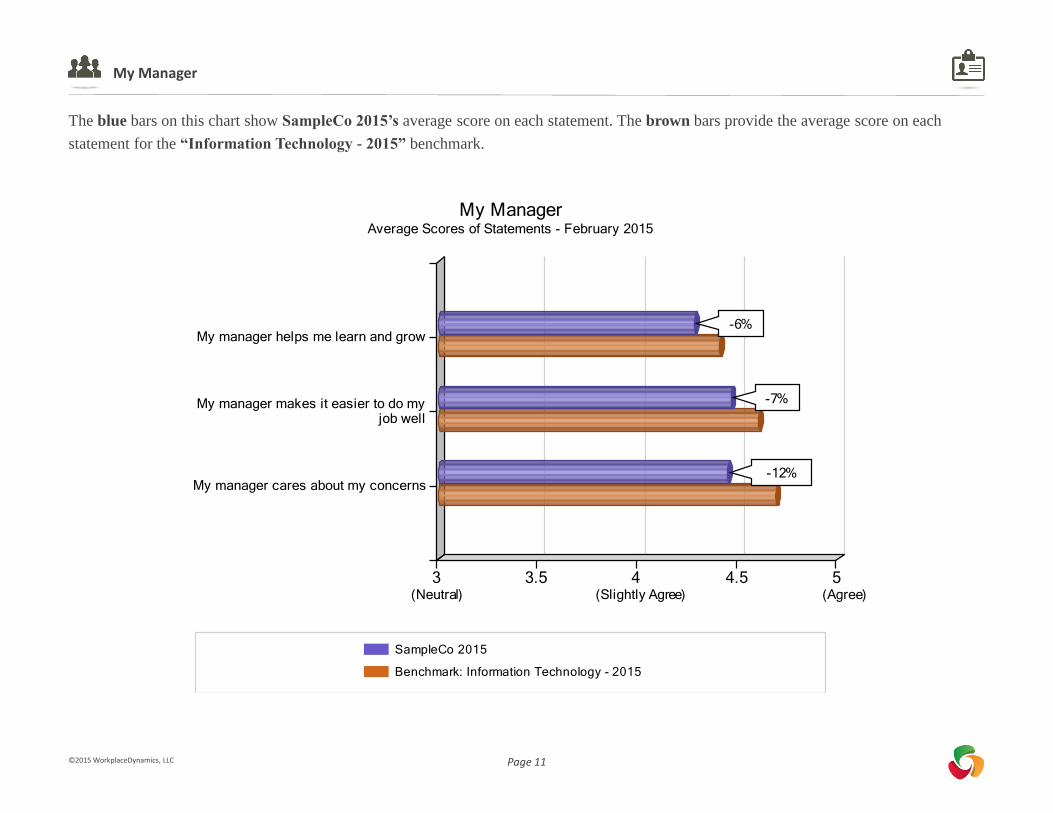
My Manager
3 3.5 4 4.5 5
My manager cares about my concerns
My manager makes it easier to do myjob well
My manager helps me learn and grow
SampleCo 2015
Benchmark: Information Technology - 2015
My ManagerAverage Scores of Statements - February 2015
-12%
-7%
-6%
(Neutral) (Slightly Agree) (Agree)
The blue bars on this chart show SampleCo 2015’s average score on each statement. The brown bars provide the average score on each
statement for the “Information Technology - 2015” benchmark.
©2015 WorkplaceDynamics, LLC
Page 12
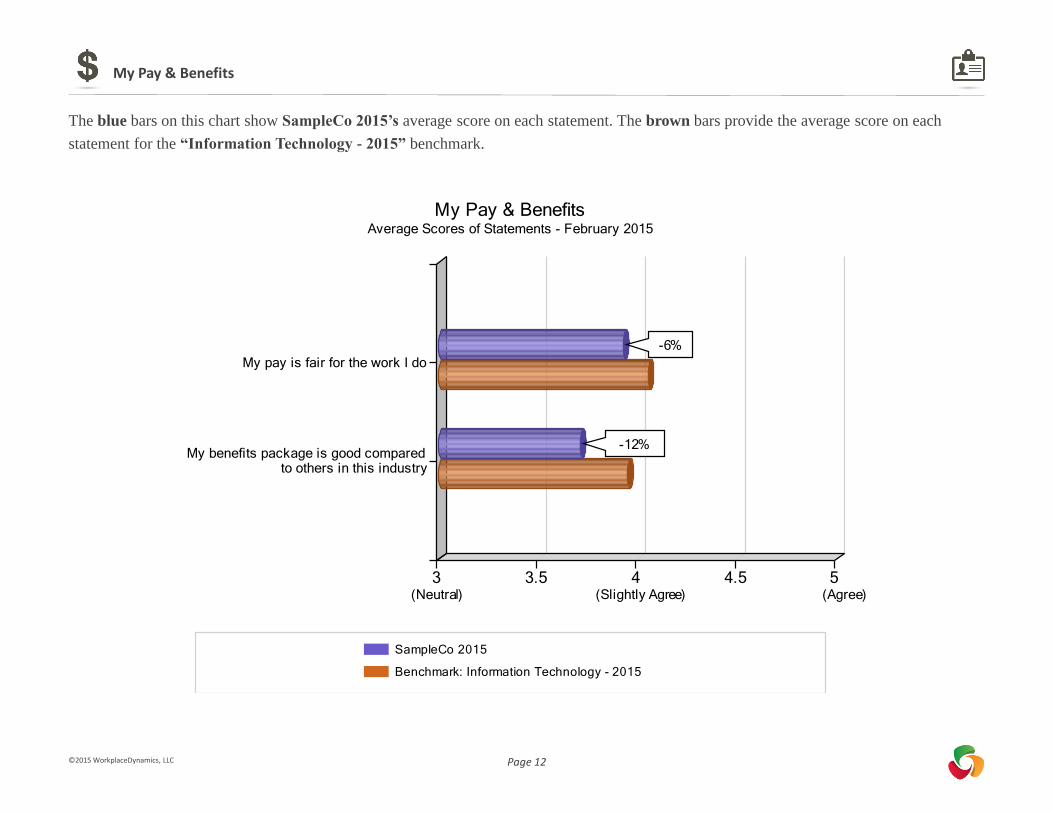
My Pay & Benefits
3 3.5 4 4.5 5
My benefits package is good comparedto others in this industry
My pay is fair for the work I do
SampleCo 2015
Benchmark: Information Technology - 2015
My Pay & BenefitsAverage Scores of Statements - February 2015
-12%
-6%
(Neutral) (Slightly Agree) (Agree)
The blue bars on this chart show SampleCo 2015’s average score on each statement. The brown bars provide the average score on each
statement for the “Information Technology - 2015” benchmark.
©2015 WorkplaceDynamics, LLC
Page 13
Results by Year
SampleCo 2015 | Management Intelligence Report | Company Overview
©2015 WorkplaceDynamics, LLC
Page 14
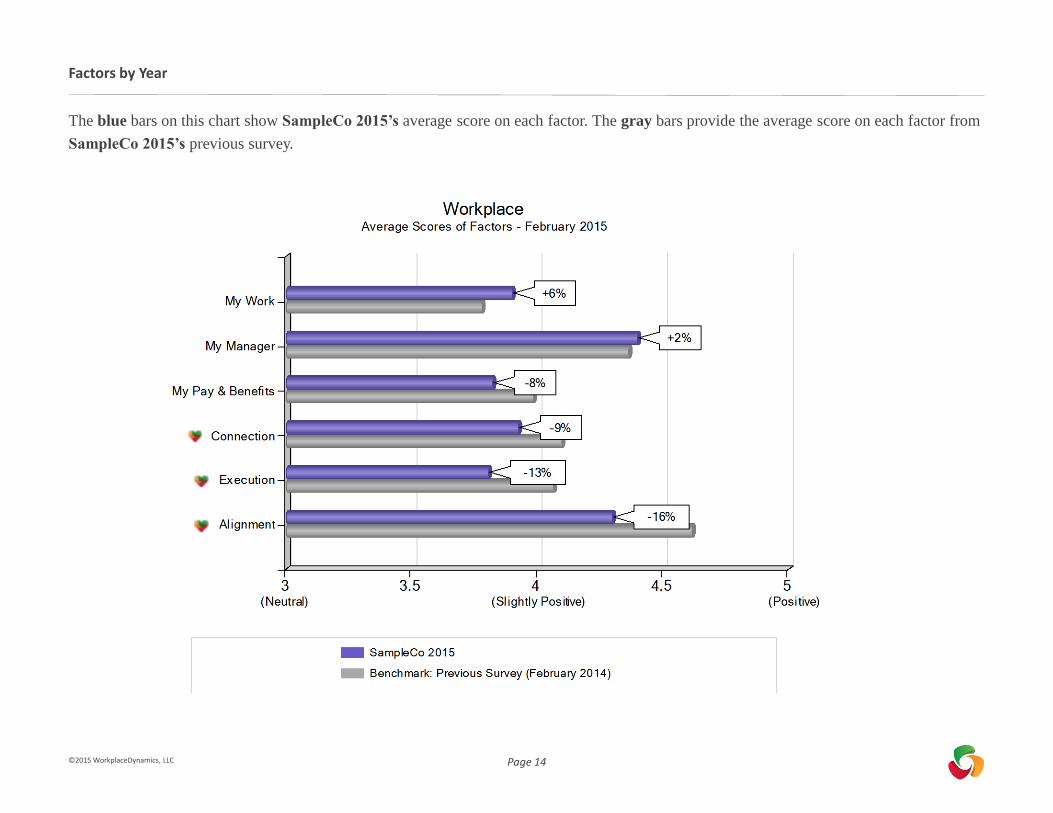
The blue bars on this chart show SampleCo 2015’s average score on each factor. The gray bars provide the average score on each factor from
SampleCo 2015’s previous survey.
Factors by Year
©2015 WorkplaceDynamics, LLC
Page 15
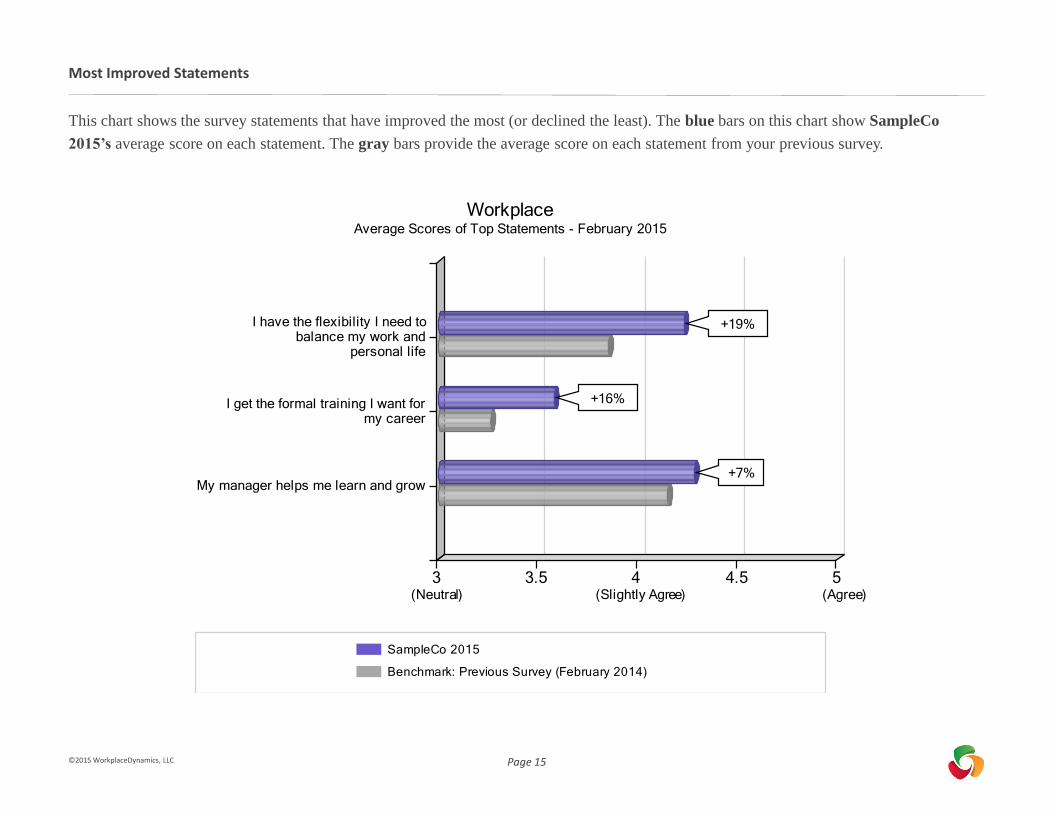
This chart shows the survey statements that have improved the most (or declined the least). The blue bars on this chart show SampleCo
2015’s average score on each statement. The gray bars provide the average score on each statement from your previous survey.
Most Improved Statements
3 3.5 4 4.5 5
My manager helps me learn and grow
I get the formal training I want formy career
I have the flexibility I need tobalance my work and
personal life
SampleCo 2015
Benchmark: Previous Survey (February 2014)
WorkplaceAverage Scores of Top Statements - February 2015
+7%
+16%
+19%
(Neutral) (Slightly Agree) (Agree)
©2015 WorkplaceDynamics, LLC
Page 16
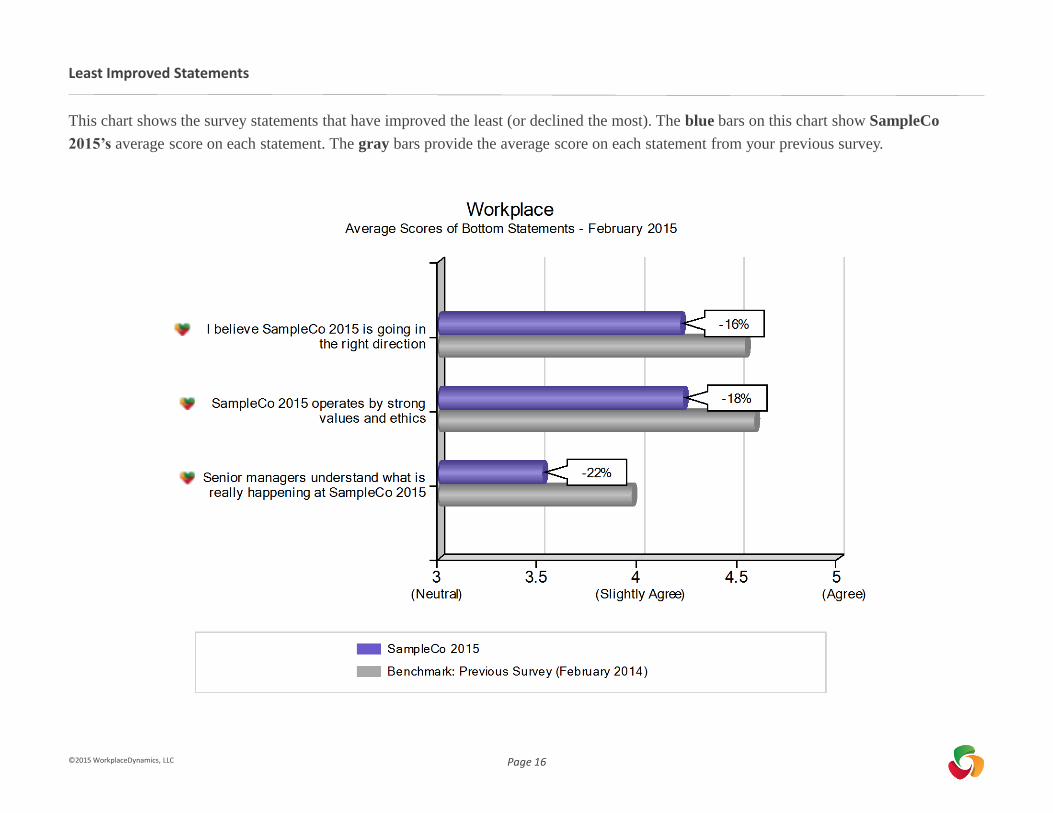
This chart shows the survey statements that have improved the least (or declined the most). The blue bars on this chart show SampleCo
2015’s average score on each statement. The gray bars provide the average score on each statement from your previous survey.
Least Improved Statements
©2015 WorkplaceDynamics, LLC
Page 17
Results by Demographic
SampleCo 2015 | Management Intelligence Report | Company Overview
©2015 WorkplaceDynamics, LLC
Page 18
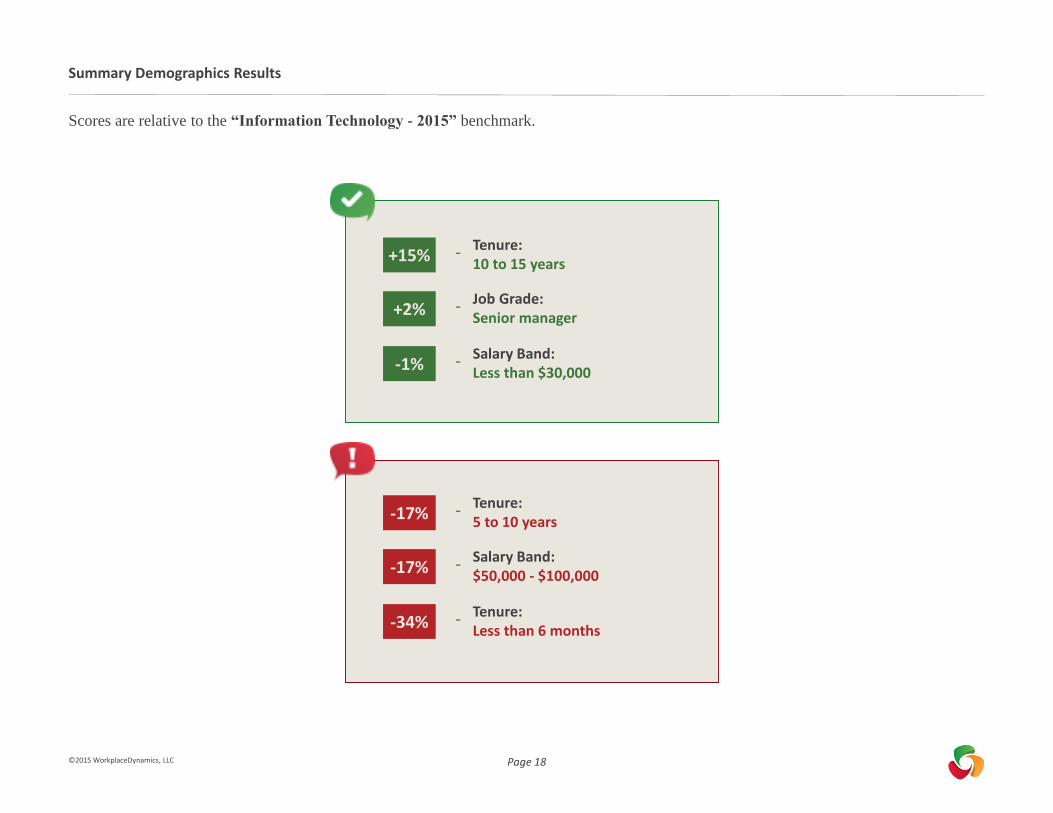
Scores are relative to the “Information Technology - 2015” benchmark.
Summary Demographics Results
+15% - Tenure: 10 to 15 years
+2% - Job Grade:Senior manager
-1% - Salary Band:Less than $30,000
-17% - Tenure: 5 to 10 years
-17% - Salary Band:$50,000 - $100,000
-34% - Tenure: Less than 6 months
©2015 WorkplaceDynamics, LLC
Page 19
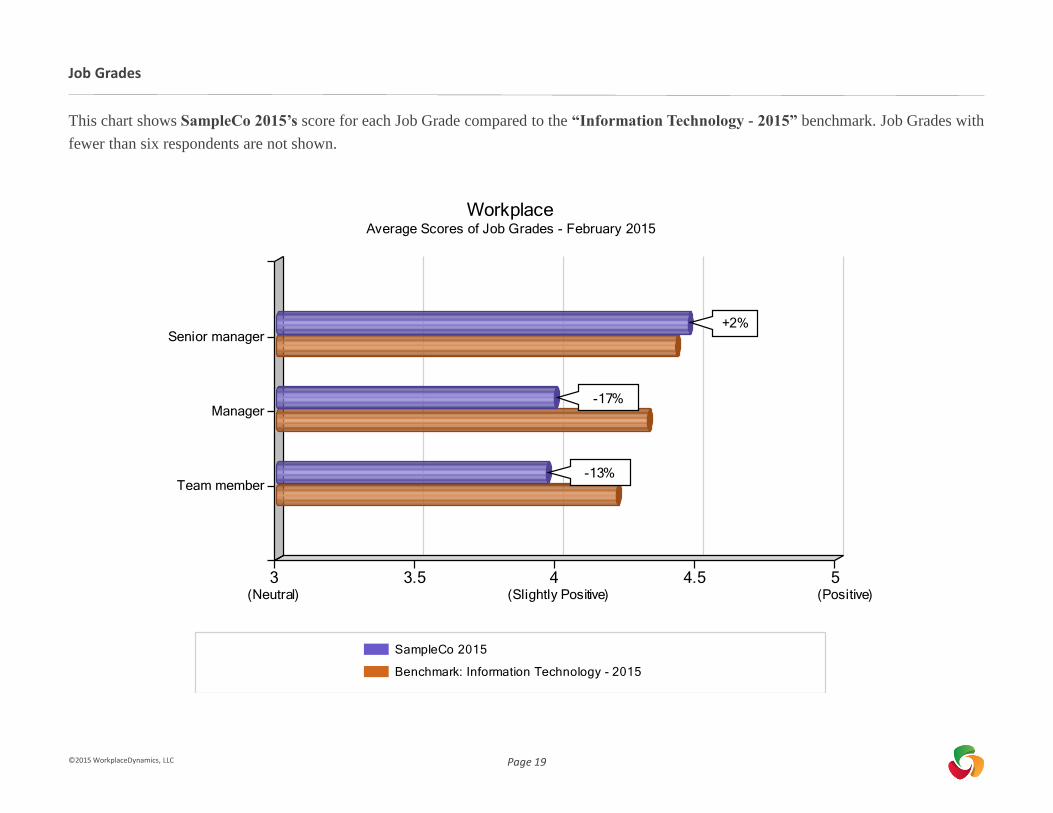
This chart shows SampleCo 2015’s score for each Job Grade compared to the “Information Technology - 2015” benchmark. Job Grades with
fewer than six respondents are not shown.
Job Grades
3 3.5 4 4.5 5
Team member
Manager
Senior manager
SampleCo 2015
Benchmark: Information Technology - 2015
WorkplaceAverage Scores of Job Grades - February 2015
-13%
-17%
+2%
(Neutral) (Slightly Positive) (Positive)
©2015 WorkplaceDynamics, LLC
Page 20
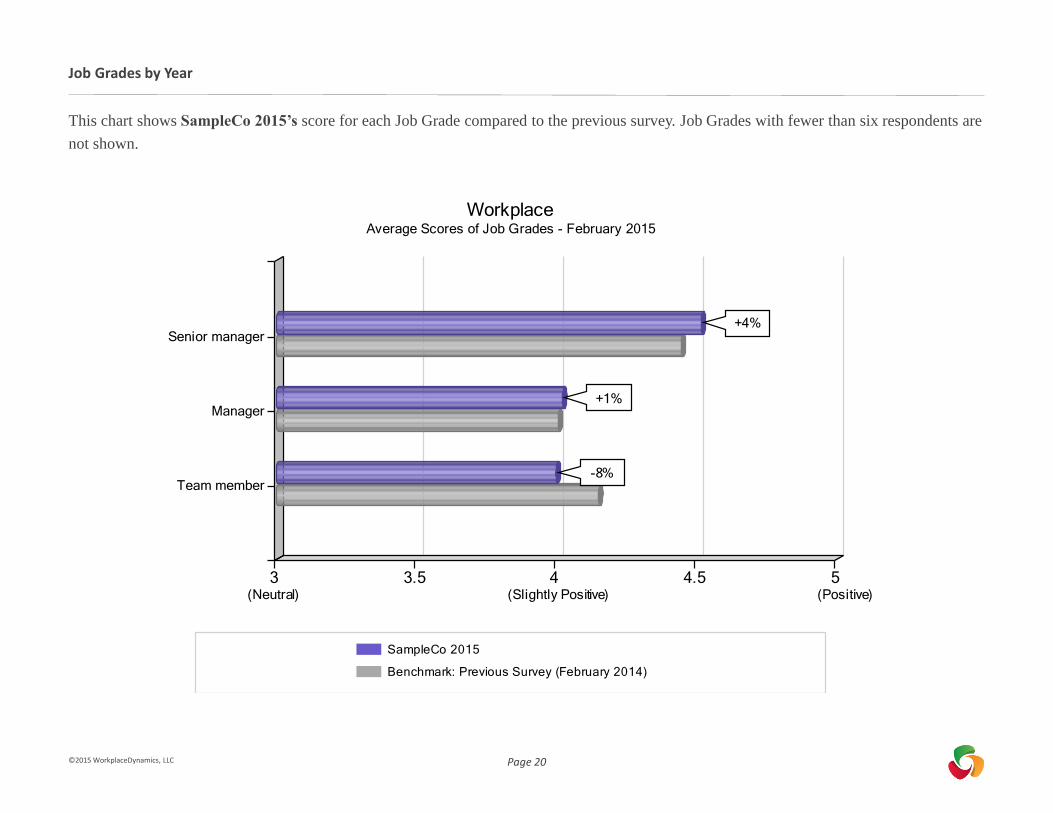
This chart shows SampleCo 2015’s score for each Job Grade compared to the previous survey. Job Grades with fewer than six respondents are
not shown.
Job Grades by Year
3 3.5 4 4.5 5
Team member
Manager
Senior manager
SampleCo 2015
Benchmark: Previous Survey (February 2014)
WorkplaceAverage Scores of Job Grades - February 2015
-8%
+1%
+4%
(Neutral) (Slightly Positive) (Positive)
©2015 WorkplaceDynamics, LLC
Page 21
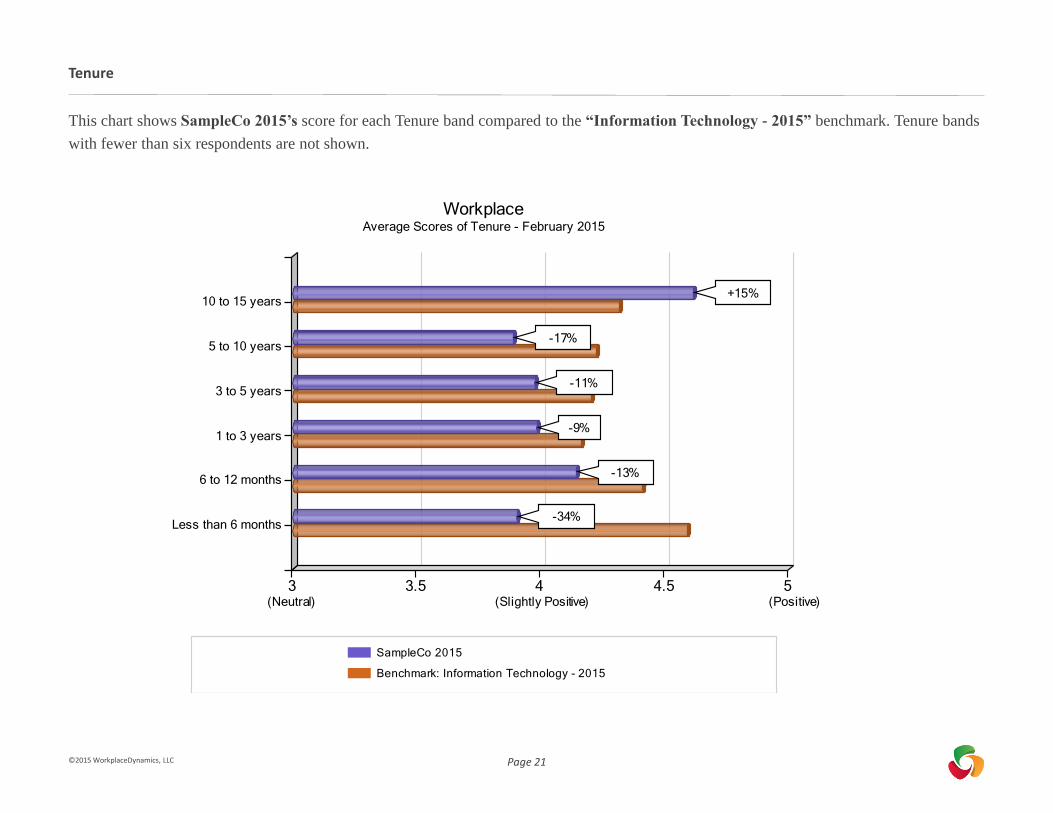
This chart shows SampleCo 2015’s score for each Tenure band compared to the “Information Technology - 2015” benchmark. Tenure bands
with fewer than six respondents are not shown.
Tenure
3 3.5 4 4.5 5
Less than 6 months
6 to 12 months
1 to 3 years
3 to 5 years
5 to 10 years
10 to 15 years
SampleCo 2015
Benchmark: Information Technology - 2015
WorkplaceAverage Scores of Tenure - February 2015
-34%
-13%
-9%
-11%
-17%
+15%
(Neutral) (Slightly Positive) (Positive)
©2015 WorkplaceDynamics, LLC
Page 22
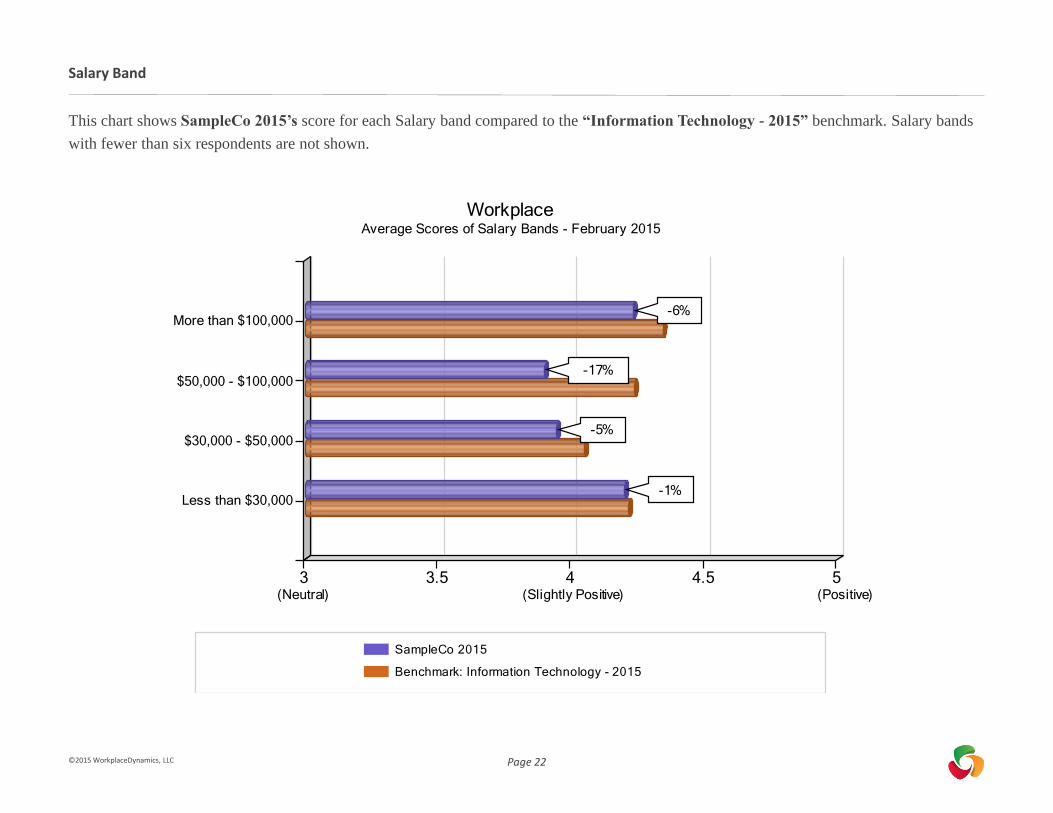
This chart shows SampleCo 2015’s score for each Salary band compared to the “Information Technology - 2015” benchmark. Salary bands
with fewer than six respondents are not shown.
Salary Band
3 3.5 4 4.5 5
Less than $30,000
$30,000 - $50,000
$50,000 - $100,000
More than $100,000
SampleCo 2015
Benchmark: Information Technology - 2015
WorkplaceAverage Scores of Salary Bands - February 2015
-1%
-5%
-17%
-6%
(Neutral) (Slightly Positive) (Positive)
©2015 WorkplaceDynamics, LLC
Page 23
Results by Department
SampleCo 2015 | Management Intelligence Report | Company Overview
Page 24
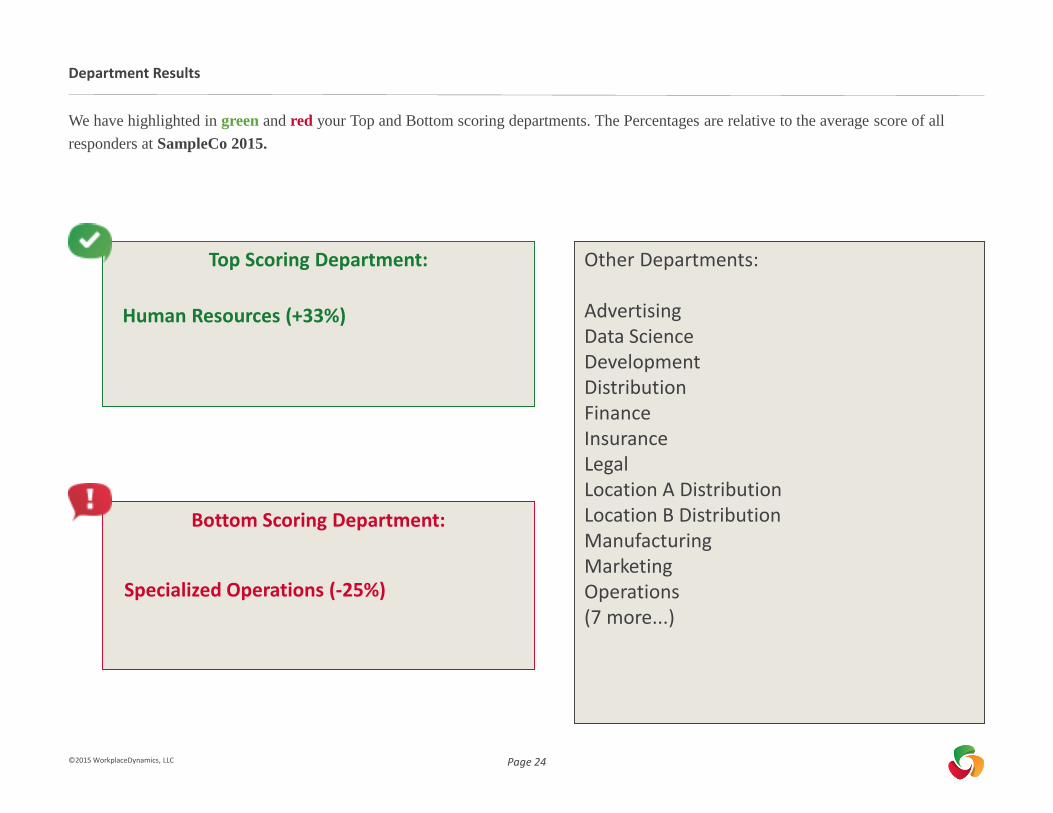
We have highlighted in green and red your Top and Bottom scoring departments. The Percentages are relative to the average score of all
responders at SampleCo 2015.
Department Results
Bottom Scoring Department:
Top Scoring Department: Other Departments:
AdvertisingData ScienceDevelopmentDistributionFinanceInsuranceLegalLocation A DistributionLocation B DistributionManufacturingMarketingOperations(7 more...)
Human Resources (+33%)
Specialized Operations (-25%)
©2015 WorkplaceDynamics, LLC
Page 25
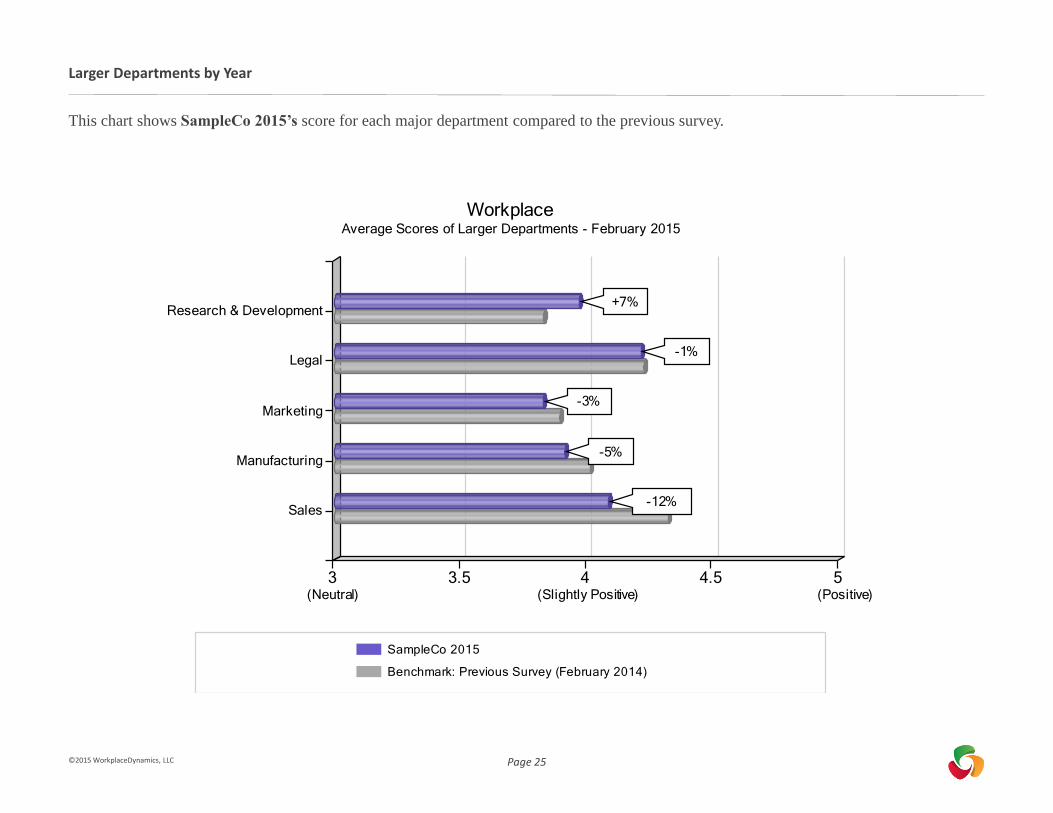
This chart shows SampleCo 2015’s score for each major department compared to the previous survey.
Larger Departments by Year
3 3.5 4 4.5 5
Sales
Manufacturing
Marketing
Legal
Research & Development
SampleCo 2015
Benchmark: Previous Survey (February 2014)
WorkplaceAverage Scores of Larger Departments - February 2015
-12%
-5%
-3%
-1%
+7%
(Neutral) (Slightly Positive) (Positive)
©2015 WorkplaceDynamics, LLC
WorkplaceDynamics, LLC180 Sheree Blvd., Ste 2000 | Exton, PA 19341Tel: (484) 323-6300
©2015 WorkplaceDynamics, LLC
www.workplacedynamics.comEmail: [email protected]
Find out more about WorkplaceDynamics:
Find out more about OrgHealth™:
Further Reading