Embed Size (px)
Citation preview
Switch Report 2017
A BASELINE EVALUATION OF
DIGITAL INCLUSION IN YOUR AREA
SAMPLE SWITCH REPORT
A BASELINE EVALUATION OF DIGITAL INCLUSION IN YOUR AREA 2
CONTENTS
Author: ................................................................................................................................ 4
Date: ................................................................................................................................... 4
Version: ............................................................................................................................... 4
Acknowledgements: .......................................................................................................... 4
FINDINGS & RECOMMENDATIONS REPORT (PART 1) ............................................................... 5
Introduction ........................................................................................................................... 5
Methodology in Brief ............................................................................................................. 6
The Scale of Digital Exclusion in your area ........................................................................... 7
Online/Offline Population ..................................................................................................... 7
Demographic Data ................................................................................................................. 8
Policy and Strategy Landscape ........................................................................................... 10
Key Issues ......................................................................................................................... 10
Partnership and Partners .................................................................................................... 11
Key Issues ......................................................................................................................... 11
What’s Needed? ............................................................................................................... 12
The Digital resilience Foundation Programme .................................................................. 12
BASELINE EVIDENCE REPORT (PART 2) .................................................................................. 14
Introduction ......................................................................................................................... 14
Switch 1: Findings from Data Mapping ............................................................................... 16
Introduction ..................................................................................................................... 16
Population: Rurality, Density, and Age ........................................................................... 17
Digital inclusion: Digital Skills, Internet Use and Connectivity in your area ..................... 23
Summary: ......................................................................................................................... 23
Technology Ownership and Behaviour: .......................................................................... 27
SAMPLE SWITCH REPORT
A BASELINE EVALUATION OF DIGITAL INCLUSION IN YOUR AREA 3
Connectivity: .................................................................................................................... 28
Switch 2: Strategic Landscape Findings ............................................................................. 31
Switch 3: Findings From Surveying the Digital Ecosystem ................................................ 32
Sample Pathfinder Proposals ................................................................................................. 34
Rural Economy Pathfinder: Digital skills to support Tourism and Farm Diversification .. 34
Digital Health Pathfinder..................................................................................................... 36
Introduction ..................................................................................................................... 36
Appendix 1: Methodology ....................................................................................................... 39
Approach and Workstreams: ............................................................................................... 39
From Findings to Recommendations: ................................................................................ 40
The Digital Resilience Model ............................................................................................... 40
Data Sets .............................................................................................................................. 42
SAMPLE SWITCH REPORT
A BASELINE EVALUATION OF DIGITAL INCLUSION IN YOUR AREA 4
AUTHOR:
Citizens Online
DATE:
Autumn-Winter 2017
VERSION:
V2.0
ACKNOWLEDGEMENTS:
We would like to thank all of the organisations, departments, teams and
individuals who facilitated, took part in and contributed to the Baseline
Evaluation process in Anglesey and Northern Ireland.
SAMPLE SWITCH REPORT
A BASELINE EVALUATION OF DIGITAL INCLUSION IN YOUR AREA 5
FINDINGS & RECOMMENDATIONS
REPORT (PART 1)
INTRODUCTION
This sample Switch report has been designed by Citizens
Online to give you an impression of the comprehensive
analysis of digital inclusion issues that we offer. We
produce these reports to improve understanding of
digital exclusion across an area, to identify opportunities
to improve delivery of basic digital skills work and to
ensure stakeholders are equipped to make business
cases for change.
Citizens Online promote a collaborative and networked
partnership approach to tackling digital exclusion; using
and valuing current resources and strategies in local
areas and working together to improve the lives of
residents.
Our Switch projects are made up of ‘Findings &
Recommendations’ reports which constitute Calls to
Action to tackle digital inequality in a particular area, and
a ‘Baseline Evidence’ report which details the research
evidence in full. This sample report provides examples
from our work in Anglesey and Northern Ireland.
Together these reports propose a comprehensive and
coordinated approach to supporting digital inclusion
over a three year period. We hope the sample reports
prove compelling reading and are happy to answer
questions or provide additional examples of other
elements of our work.
Motivating digitally
excluded citizens to
engage with the digital
world can be difficult and
requires compelling
‘hooks’ for each person,
and indeed each
organisation.
Simply ‘selling’ or
presenting a new digital
service or technology
does not on its own
create digital journeys –
people and organisations
need to understand what
is beneficial for them and
what an improved life or
service might feel like in a
digital world.
OUR APPROACH
SAMPLE SWITCH REPORT
A BASELINE EVALUATION OF DIGITAL INCLUSION IN YOUR AREA 6
METHODOLOGY IN BRIEF
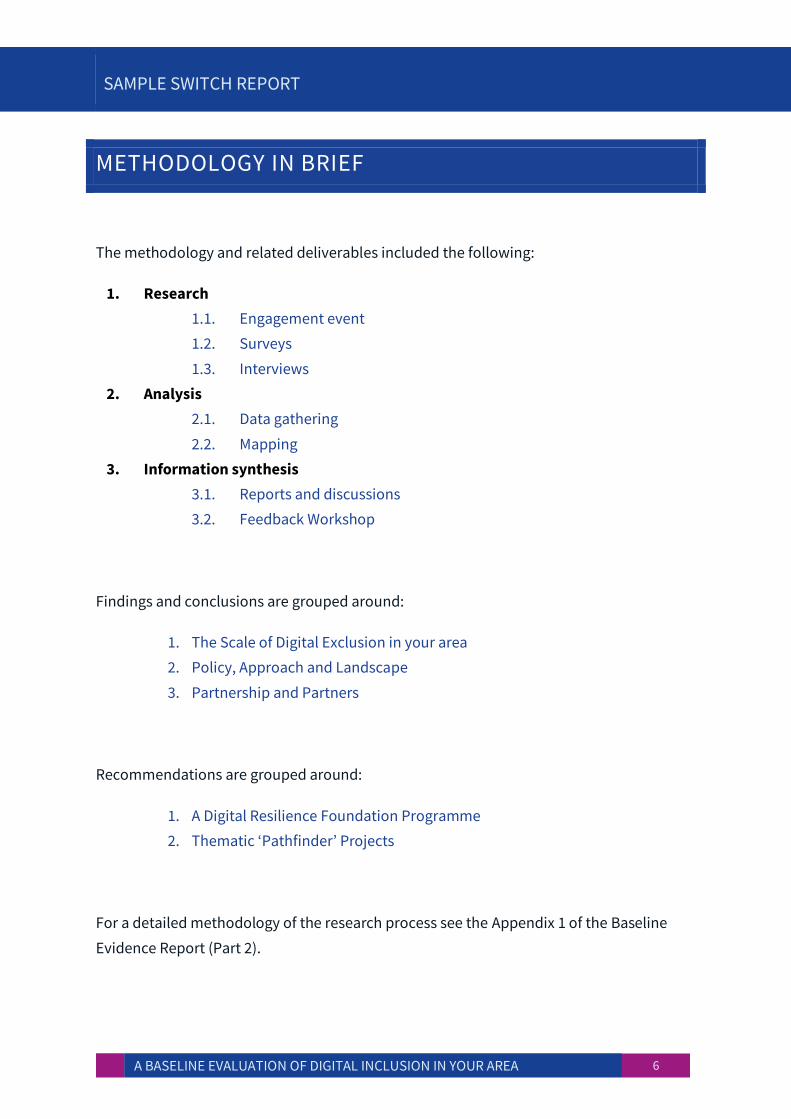
The methodology and related deliverables included the following:
1. Research
1.1. Engagement event
1.2. Surveys
1.3. Interviews
2. Analysis
2.1. Data gathering
2.2. Mapping
3. Information synthesis
3.1. Reports and discussions
3.2. Feedback Workshop
Findings and conclusions are grouped around:
1. The Scale of Digital Exclusion in your area
2. Policy, Approach and Landscape
3. Partnership and Partners
Recommendations are grouped around:
1. A Digital Resilience Foundation Programme
2. Thematic ‘Pathfinder’ Projects
For a detailed methodology of the research process see the Appendix 1 of the Baseline
Evidence Report (Part 2).
SAMPLE SWITCH REPORT
A BASELINE EVALUATION OF DIGITAL INCLUSION IN YOUR AREA 7
THE SCALE OF DIGITAL EXCLUSION IN YOUR AREA
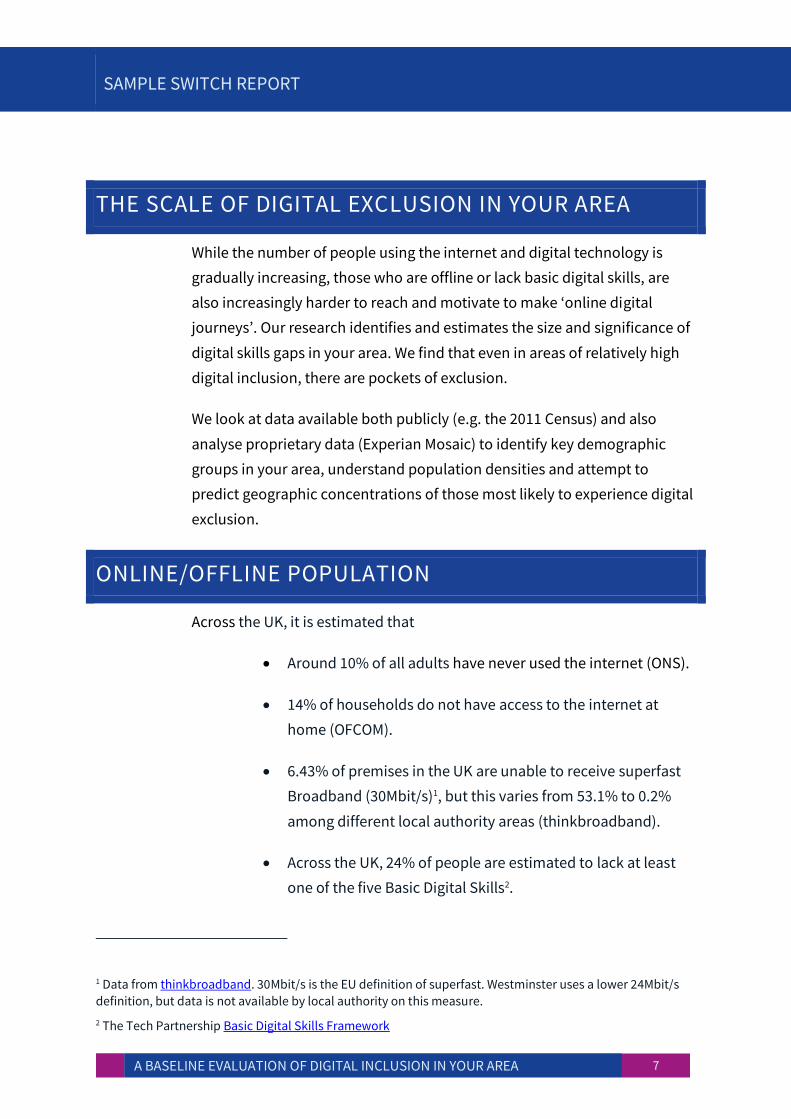
While the number of people using the internet and digital technology is
gradually increasing, those who are offline or lack basic digital skills, are
also increasingly harder to reach and motivate to make ‘online digital
journeys’. Our research identifies and estimates the size and significance of
digital skills gaps in your area. We find that even in areas of relatively high
digital inclusion, there are pockets of exclusion.
We look at data available both publicly (e.g. the 2011 Census) and also
analyse proprietary data (Experian Mosaic) to identify key demographic
groups in your area, understand population densities and attempt to
predict geographic concentrations of those most likely to experience digital
exclusion.
ONLINE/OFFLINE POPULATION
Across the UK, it is estimated that
Around 10% of all adults have never used the internet (ONS).
14% of households do not have access to the internet at
home (OFCOM).
6.43% of premises in the UK are unable to receive superfast
Broadband (30Mbit/s)1, but this varies from 53.1% to 0.2%
among different local authority areas (thinkbroadband).
Across the UK, 24% of people are estimated to lack at least
one of the five Basic Digital Skills2.
1 Data from thinkbroadband. 30Mbit/s is the EU definition of superfast. Westminster uses a lower 24Mbit/s
definition, but data is not available by local authority on this measure.
2 The Tech Partnership Basic Digital Skills Framework
SAMPLE SWITCH REPORT
A BASELINE EVALUATION OF DIGITAL INCLUSION IN YOUR AREA 8
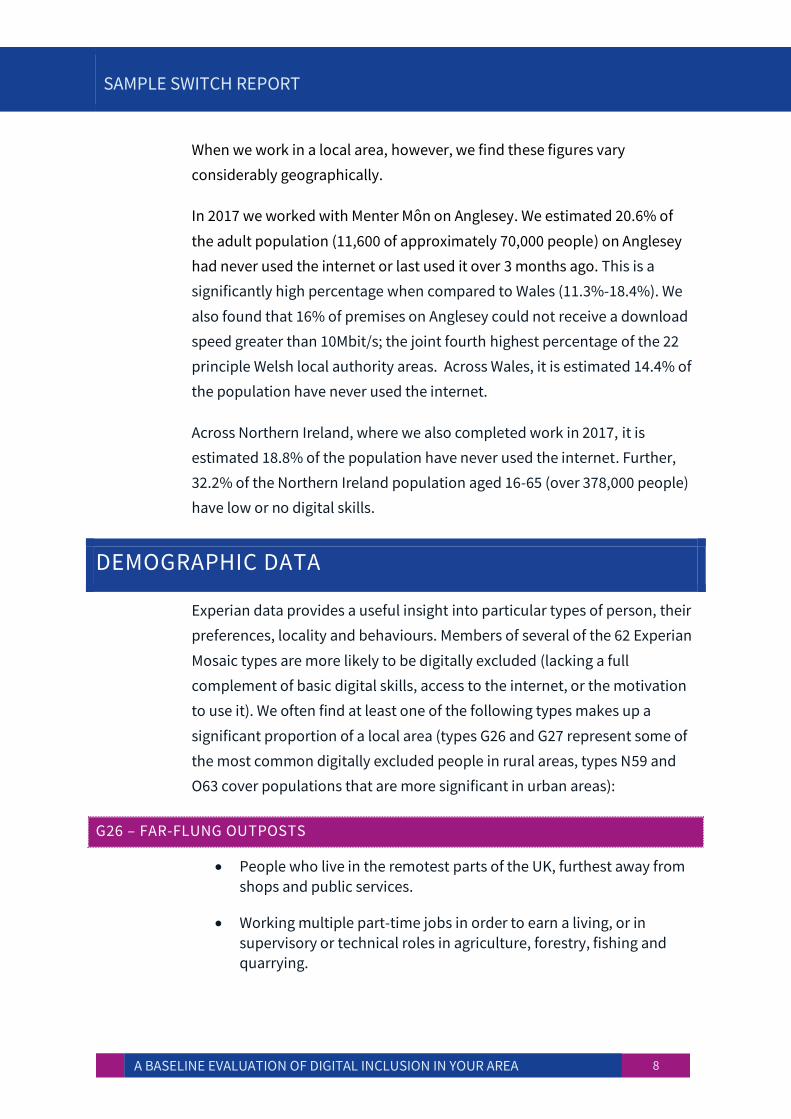
When we work in a local area, however, we find these figures vary
considerably geographically.
In 2017 we worked with Menter Môn on Anglesey. We estimated 20.6% of
the adult population (11,600 of approximately 70,000 people) on Anglesey
had never used the internet or last used it over 3 months ago. This is a
significantly high percentage when compared to Wales (11.3%-18.4%). We
also found that 16% of premises on Anglesey could not receive a download
speed greater than 10Mbit/s; the joint fourth highest percentage of the 22
principle Welsh local authority areas. Across Wales, it is estimated 14.4% of
the population have never used the internet.
Across Northern Ireland, where we also completed work in 2017, it is
estimated 18.8% of the population have never used the internet. Further,
32.2% of the Northern Ireland population aged 16-65 (over 378,000 people)
have low or no digital skills.
DEMOGRAPHIC DATA
Experian data provides a useful insight into particular types of person, their
preferences, locality and behaviours. Members of several of the 62 Experian
Mosaic types are more likely to be digitally excluded (lacking a full
complement of basic digital skills, access to the internet, or the motivation
to use it). We often find at least one of the following types makes up a
significant proportion of a local area (types G26 and G27 represent some of
the most common digitally excluded people in rural areas, types N59 and
O63 cover populations that are more significant in urban areas):
G26 – FAR-FLUNG OUTPOSTS
People who live in the remotest parts of the UK, furthest away from
shops and public services.
Working multiple part-time jobs in order to earn a living, or in
supervisory or technical roles in agriculture, forestry, fishing and
quarrying.
SAMPLE SWITCH REPORT
A BASELINE EVALUATION OF DIGITAL INCLUSION IN YOUR AREA 9
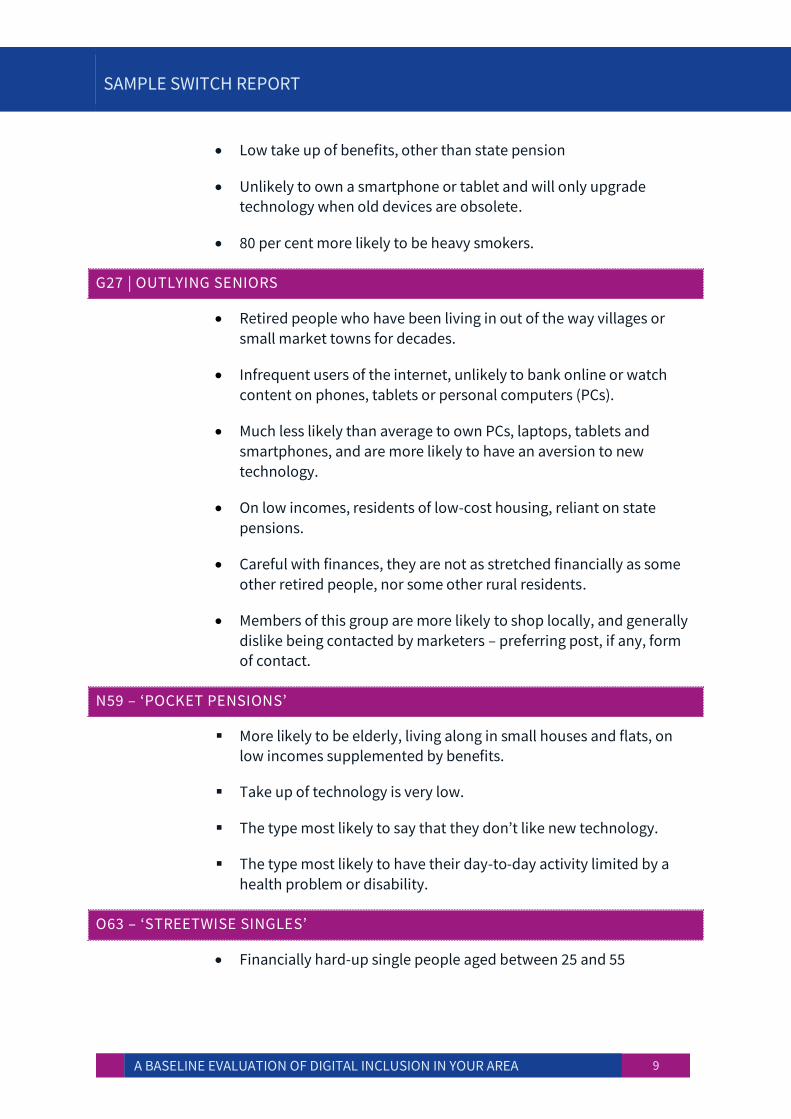
Low take up of benefits, other than state pension
Unlikely to own a smartphone or tablet and will only upgrade technology when old devices are obsolete.
80 per cent more likely to be heavy smokers.
G27 | OUTLYING SENIORS
Retired people who have been living in out of the way villages or
small market towns for decades.
Infrequent users of the internet, unlikely to bank online or watch
content on phones, tablets or personal computers (PCs).
Much less likely than average to own PCs, laptops, tablets and
smartphones, and are more likely to have an aversion to new
technology.
On low incomes, residents of low-cost housing, reliant on state
pensions.
Careful with finances, they are not as stretched financially as some
other retired people, nor some other rural residents.
Members of this group are more likely to shop locally, and generally
dislike being contacted by marketers – preferring post, if any, form of contact.
N59 – ‘POCKET PENSIONS’
More likely to be elderly, living along in small houses and flats, on low incomes supplemented by benefits.
Take up of technology is very low.
The type most likely to say that they don’t like new technology.
The type most likely to have their day-to-day activity limited by a
health problem or disability.
O63 – ‘STREETWISE SINGLES’
Financially hard-up single people aged between 25 and 55
SAMPLE SWITCH REPORT
A BASELINE EVALUATION OF DIGITAL INCLUSION IN YOUR AREA 10
Living in purpose-built flats rented from the council or another
social landlord, often in urban and fringe locations.
Polarised attitudes to technology: either love technology or dislike
it.
More likely that the average household to own a smartphone, but
less likely to own any other form of digital device; digital skills and ability to access services may be hampered by the limitations of
‘smartphone-by-default’ access - lacing keyboards and large screens.
POLICY AND STRATEGY LANDSCAPE
Inspiring and motivating internet use and the development of digital skills
amongst those offline or with few skills is a significant challenge. It requires
informality, empathy and time. However, the far greater challenge is to
create a holistic, sustainable and ongoing digital skills provision, especially
within a landscape dominated by austerity cuts. Partnership becomes
essential because no single stakeholder is able to provide the people and
resources needed to solve this problem.
The underlying factor for such sustainable provision, is that it should not
only support the development of digital skills, but it should also meet the
specific needs of stakeholders to deliver on other impacts, such as reducing
the cost base for service delivery (for example in local government and
health), supporting economic development and reducing inequality.
Whilst it may be useful for one department or organisation to lead on digital
skills, it is essential that this is seen as a cross-cutting issue. It should be
embedded into multiple local government departments’ and organisations’
work because it is a tool for achieving wider impacts.
KEY ISSUES
We report on the local policy environment for promoting digital skills,
assessing:
SAMPLE SWITCH REPORT
A BASELINE EVALUATION OF DIGITAL INCLUSION IN YOUR AREA 11
Understanding of the issue at the national/regional level (whether in
a region of England, Northern Ireland, Scotland or Wales).
Work on relevant agendas at the national/regional level through
which digital skills, including anti-poverty work, work to support businesses and rural communities.
Specific budget for digital skills and the funding situation of relevant elements (for example libraries).
The extent to which local partnerships exist already.
Service transformation in your local area
Existing programmes of digital technology and skills support.
PARTNERSHIP AND PARTNERS
The question we are aiming to answer as part of the baseline research for
any locality, is “How ready and able are the network of local organisations
to collaborate on tackling digital exclusion?”
KEY ISSUES
DIGITAL LEADERSHIP
We look at the extent to which senior managers and leaders are involved in
or supporting digital transformation and inclusion as a core element of
their organisation’s work, and the extent to which there is a connection
between high level thinking and commitment, and operational action and
change on the ground.
DIGITAL WORKFORCE DEVELOPMENT
Levels of basic digital skills within organisations’ staff and volunteers are
also assessed, and we make recommendations for workforce development
DIGITAL CHAMPIONS NETWORK
SAMPLE SWITCH REPORT
A BASELINE EVALUATION OF DIGITAL INCLUSION IN YOUR AREA 12
We look at digital champion recruitment and activity to support current
provision and address any identified gaps.
DATA, INFORMATION & SIGNPOSTING
Where possible, we analyse data from relevant local organisations about
their customers’ online journeys or offline service touch points. We examine
whether your area would benefit from having improved information
available to all partners, detailing exactly what internet access and support
services were available at any one time on the island and their location, and
have created ‘signposting’ sites that do this work in four locations.
CONNECTIVITY
We explore the desire among organisations to experience better
connectivity and the existing coverage and programme of improvement in
your area. On Anglesey, for example, OFCOM reported in 2016 that 16% of
premises could not receive a download speed greater than 10Mbit/s, and
many people and businesses reported experiencing intermittent
connectivity or remain disconnected through lack of funds, lack of up to
date equipment with capacity for multiple WiFi connections, or availability
of a good connection (not spots).
WHAT’S NEEDED?
Our reports identify whether additional resources are needed and, if so,
where they can best be directed to support digital inclusion. We provide
‘pathfinder’ proposals for action around themes such as ‘Welfare Reform
and Employability’, ‘Digital Health’, or ‘Rural SME Diversification’
THE DIGITAL RESILIENCE FOUNDATION PROGRAMME
Current best practice suggests that a 'resilient' digital inclusion ecosystem
is one where a variety of service providers and organisations work in
partnership to identify, triage and refer people at risk of digital exclusion to
appropriate digital skills training and to support in using digital services
SAMPLE SWITCH REPORT
A BASELINE EVALUATION OF DIGITAL INCLUSION IN YOUR AREA 13
(Assisted Digital) where necessary. The impetus to work together arises
because no one stakeholder can solve the digital exclusion issue alone.
Furthermore, efficiencies are achieved by partnering and collaborating and
a culture of sharing, mutual learning and support can be fostered.
A Switch report for your area would provide recommendations for work
that could be taken forward by a local partnership, and identify suitable
stakeholders and providers. We provide a ‘Resource Roadmap’, listing
starting points for designing the delivery system. The report would also
include a Call to Action – next steps covering the first six months of a three
year programme of work, built around the Digital Resilience Foundation
Programme and a set of Thematic Pathfinders that could be undertaken
either singularly or collectively, together or as part of a phased approach.
SAMPLE SWITCH REPORT
A BASELINE EVALUATION OF DIGITAL INCLUSION IN YOUR AREA 14
BASELINE EVIDENCE REPORT (PART 2)
INTRODUCTION
This section of a Switch report is the ‘evidence base’
which collates the findings from data sources and
stakeholders. This report supports the Findings &
Recommendations Report (Part 1), which proposes a
coordinated, resourced and comprehensive Digital
Resilience approach to supporting digital inclusion in
your area. It can be used as the ‘reference book’ for the
Part 1 report, so that stakeholders with individual
interests are able to go directly to the evidence base
sections which interest them.
We recognise that issues surrounding digital inclusion
are wide-ranging, interrelated, complex and in a
continual state of flux; affected by both internal
organisational factors, external policy drivers and
changes in citizen behaviour. The report’s purpose is to
provide the foundations on which to build
recommendations for action across the system. We
detail the current data, issues, risks, and opportunities,
so that stakeholders across the system can make
business cases for initiatives or service transformation.
We write our reports in the hope that in future years,
colleagues can refer back to this research and identify
their progress and achievements in tackling digital
exclusion and the related issues of social exclusion and
isolation, economic inequality, financial capability,
employability, health and wellbeing, skills and literacy.
In order to deliver an
effective and efficient
programme of activity, that
reaches people at risk of
exclusion, it is necessary to
know where they are and
what they need. It is also
necessary to know what
activities are already
happening in an area,
where ‘assets’ such as
libraries and community
centres are and to
understand the relevant
activity undertaken by
partners and any existing
relationships between them.
The Baseline process is a
way of gathering this
information so that the local
partnership can make
evidence-based decisions
regarding how they can best
use available resources to
get desired outcomes.
BASELINE
SAMPLE SWITCH REPORT
A BASELINE EVALUATION OF DIGITAL INCLUSION IN YOUR AREA 15
This section of the report describes in more detail the ‘baseline’ data upon
which Citizens Online’s analysis of the people at risk of digital exclusion
within an area is based. It aims to provide insights as to why people are at
risk of exclusion, where they are most likely to be concentrated, what the
key barriers to digital inclusion are.
In our Baseline Findings reports we hint at how the barriers we identify
might be overcome, fleshing these out in Pathfinder proposals. We hope
that the data contained in this part of our reports can lay the foundations
for successful engagement strategies to help digitally excluded people gain
basic digital skills, get online and realise benefits, as well impacting
positively on local service providers and other stakeholders.
Citizens Online’s analysis here draws on publicly available ‘open source’
data together with data provided by partners during the course of the
research, and proprietary data from the Experian Mosaic demographic
profiling and segmentation tool. This analysis also gives an indication of
which public services these groups are most likely to use, and through this,
which organisations will be natural partners in achieving inclusion.
SAMPLE SWITCH REPORT
A BASELINE EVALUATION OF DIGITAL INCLUSION IN YOUR AREA 16
SWITCH 1: FINDINGS FROM DATA MAPPING
INTRODUCTION
In our experience detailed demographic profiling and mapping of
populations that are likely to be digitally excluded is critical to arriving at an
effective digital inclusion strategy. Reaching people at risk of exclusion
requires knowledge about where they are, what they need, and insight into
their preferences and behaviours.
It is also necessary to know what activities are already happening in the
area, where ‘assets’ such as libraries and community centres are and which
partners are doing what. Our “Switch” process is a way of gathering this
information so that local partnerships can make evidence-based decisions
regarding how they can best use the available resources to get the desired
outcomes.
In order to identify populations more likely to be at risk of digital exclusion
we explore data on population age profile, Housing Benefit Claimants (a
proxy for low income), Pension Credit (a proxy for age and low income),
Employment Support Allowance (a proxy for disability and low income),
and other benefits at small geographic areas.
In addition, we use data from the Experian Mosaic market segmentation
tool to identify concentrations of households allocated to Experian Mosaic
Types that our analysis indicates are less likely to be regular users of the
internet and digital government services.
Experian’s Mosaic tool provides us with additional insight into the attitudes,
preferences and behaviours of people likely to be at risk of digital exclusion,
including views about exercise, channel preferences (telling us about the
effectiveness of Direct Mail, for instance), and the priorities of any existing
online activity.
SAMPLE SWITCH REPORT
A BASELINE EVALUATION OF DIGITAL INCLUSION IN YOUR AREA 17
Using this information, we can develop appropriate marketing materials
and workshops using different messages and emphasising different aspects
of digital skills in different areas, maximising the engagement of people
who have been digitally excluded.
Finally, we also collect and map the locations of venues where beneficial
interactions with digitally excluded people can take place (libraries, DWP
offices, community centres, GP surgeries and social housing properties).
Layered maps using QGIS can help us to understand an ecosystem of
services, training providers, hubs of activity, and IT/internet and public
transport access points. Some locations of previous training have also been
added, and should further work continue, the locations of Digital
Champions and learners can be added as layers to these maps to monitor
effectiveness of marketing, social impact, and gaps in provision.
POPULATION: RURALITY, DENSITY, AND AGE
SUMMARY:
We use the Office for National Statistics’ most recent estimates3 to look at
the total population and compare with other datasets, specifically:
What percentage of people live in areas classified as rural?
How is the population distributed, and which are the areas of highest and lowest population density?
How many individuals resident in your area are 65 or over?
RURALITY AND POPULATION DENSITY:
On Anglesey, each of the 45 ‘Lower Super Output Areas’ (LSOAs, a
geographic unit used in the Census and other statistical datasets) are
allocated to one of 5 of the 10 Rural-Urban classifications in the 2011 Rural-
3 ONS: United Kingdom population mid-year estimate, 2015.
SAMPLE SWITCH REPORT
A BASELINE EVALUATION OF DIGITAL INCLUSION IN YOUR AREA 18
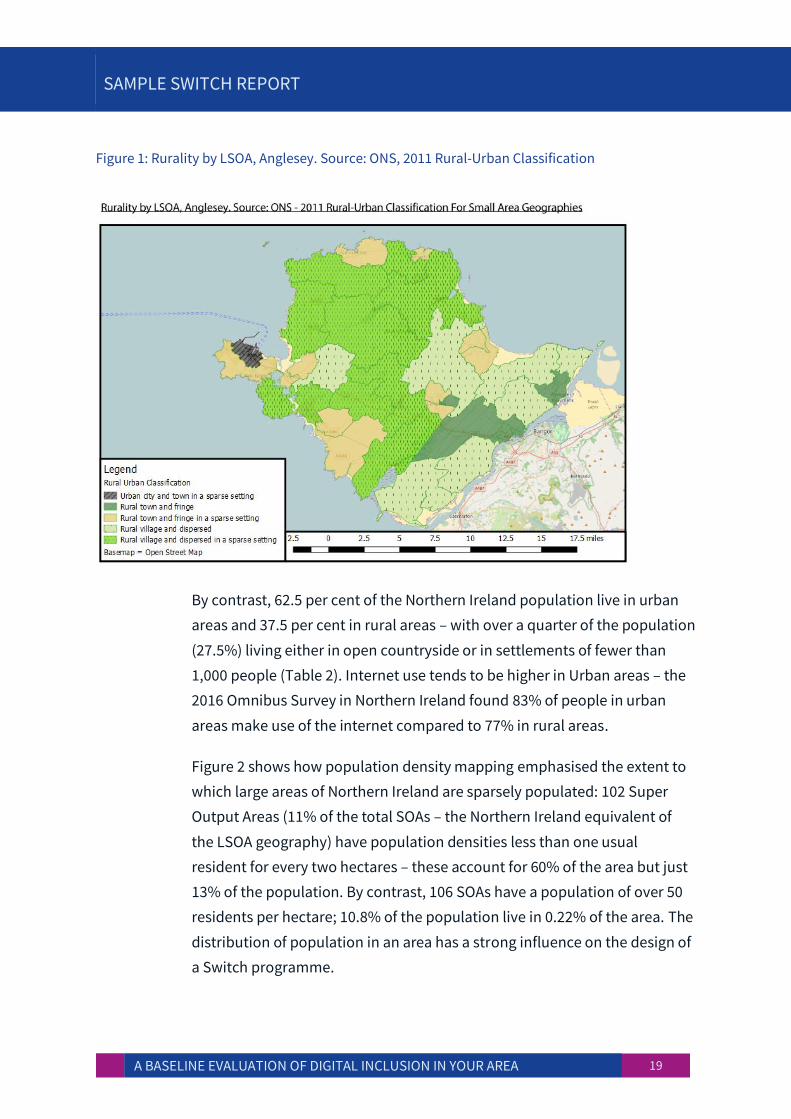
Urban Classification For Small Area Geographies system. Only eight LSOAs
are deemed urban, and only in the least urbanised category: “City and
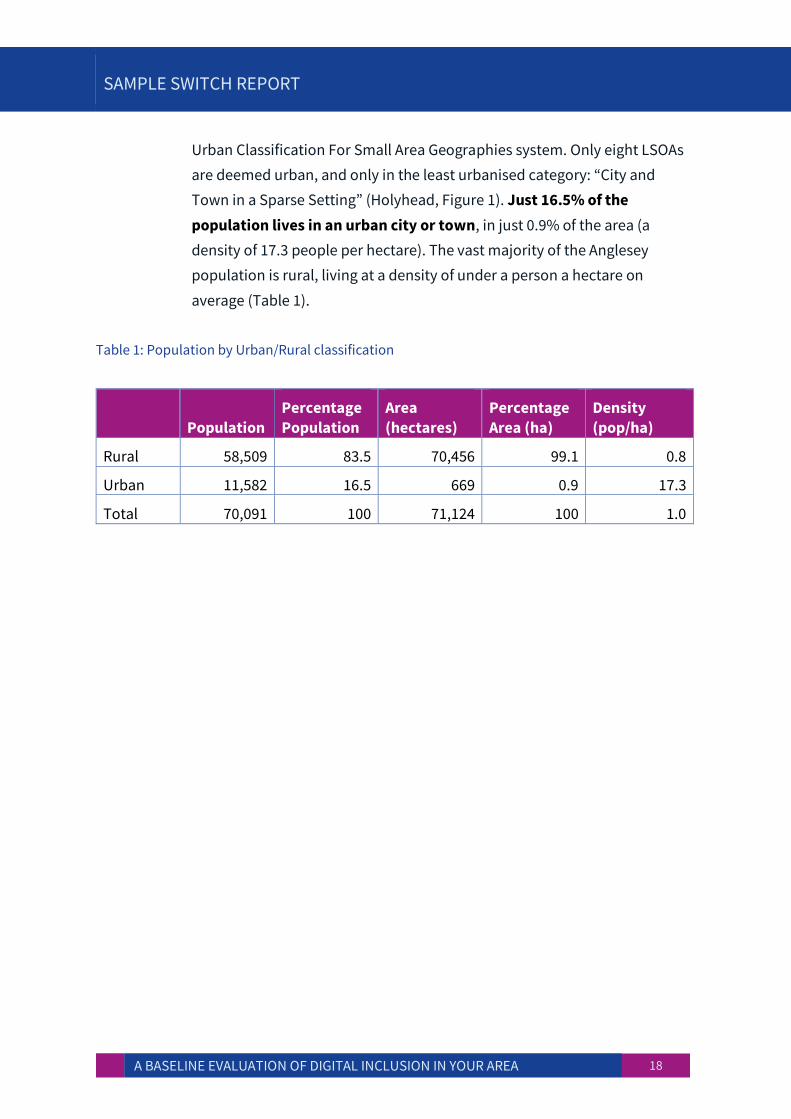
Town in a Sparse Setting” (Holyhead, Figure 1). Just 16.5% of the
population lives in an urban city or town, in just 0.9% of the area (a
density of 17.3 people per hectare). The vast majority of the Anglesey
population is rural, living at a density of under a person a hectare on
average (Table 1).
Table 1: Population by Urban/Rural classification
Population Percentage Population
Area (hectares)
Percentage Area (ha)
Density (pop/ha)
Rural 58,509 83.5 70,456 99.1 0.8
Urban 11,582 16.5 669 0.9 17.3
Total 70,091 100 71,124 100 1.0
SAMPLE SWITCH REPORT
A BASELINE EVALUATION OF DIGITAL INCLUSION IN YOUR AREA 19
Figure 1: Rurality by LSOA, Anglesey. Source: ONS, 2011 Rural-Urban Classification
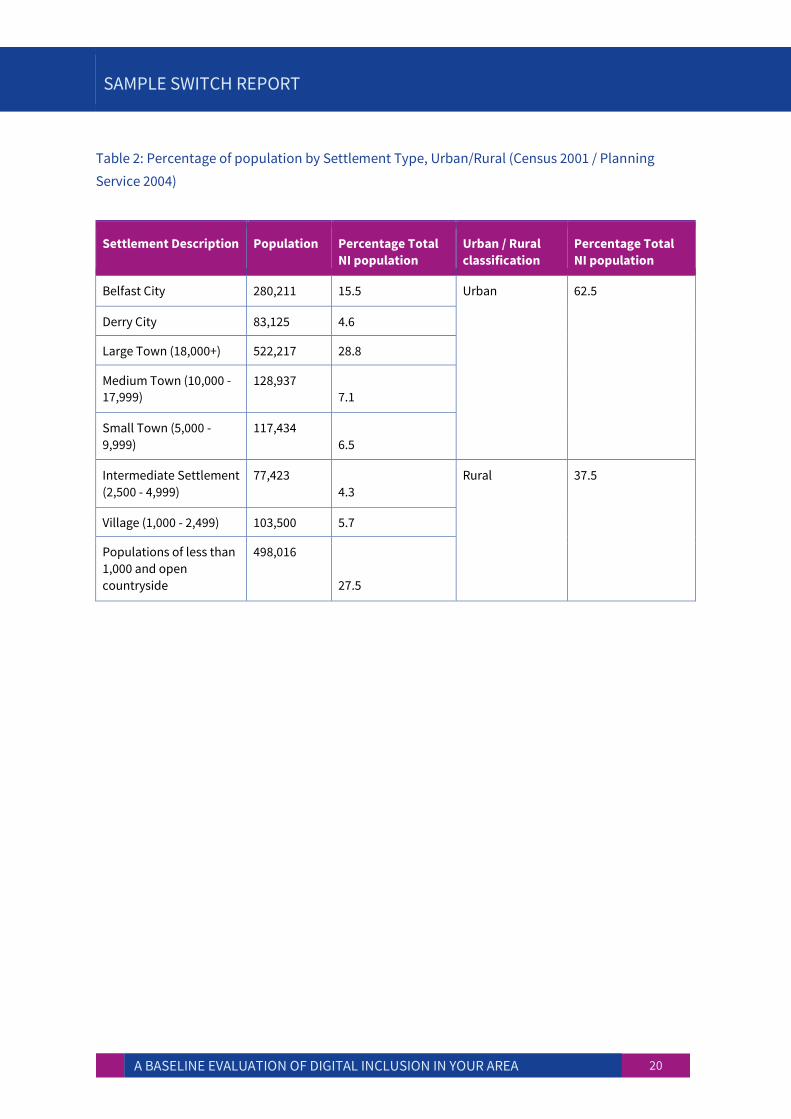
By contrast, 62.5 per cent of the Northern Ireland population live in urban
areas and 37.5 per cent in rural areas – with over a quarter of the population
(27.5%) living either in open countryside or in settlements of fewer than
1,000 people (Table 2). Internet use tends to be higher in Urban areas – the
2016 Omnibus Survey in Northern Ireland found 83% of people in urban
areas make use of the internet compared to 77% in rural areas.
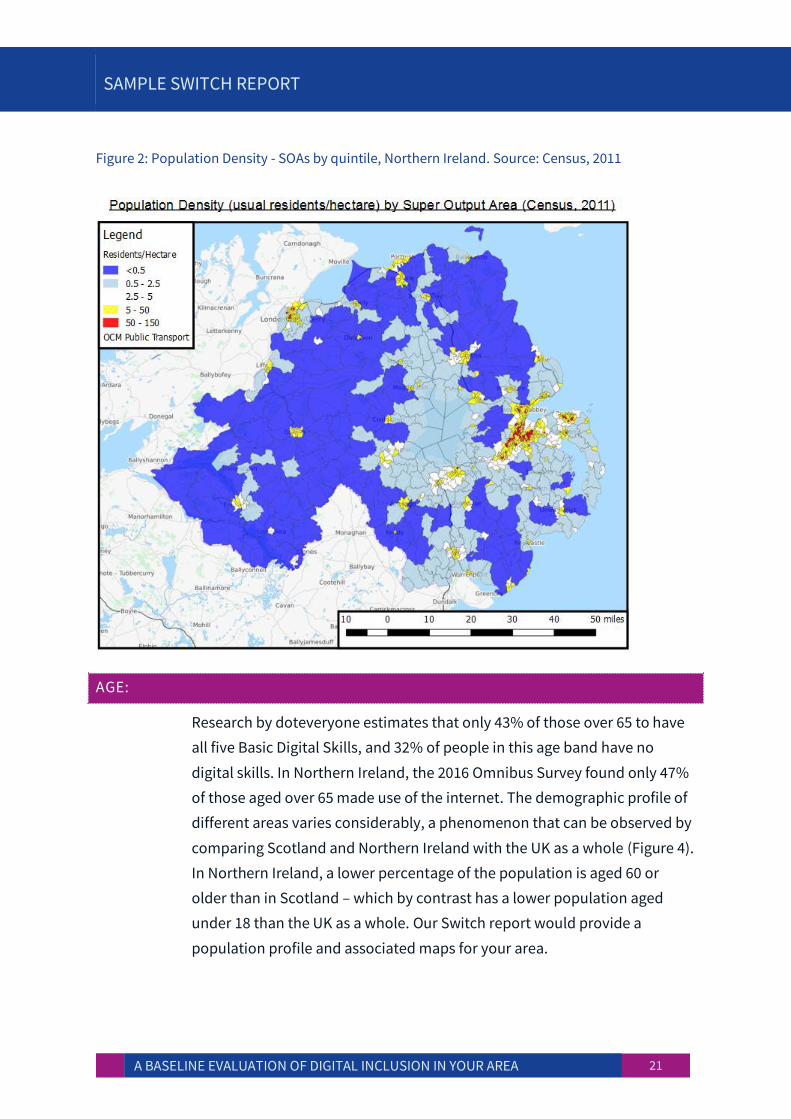
Figure 2 shows how population density mapping emphasised the extent to
which large areas of Northern Ireland are sparsely populated: 102 Super
Output Areas (11% of the total SOAs – the Northern Ireland equivalent of
the LSOA geography) have population densities less than one usual
resident for every two hectares – these account for 60% of the area but just
13% of the population. By contrast, 106 SOAs have a population of over 50
residents per hectare; 10.8% of the population live in 0.22% of the area. The
distribution of population in an area has a strong influence on the design of
a Switch programme.
SAMPLE SWITCH REPORT
A BASELINE EVALUATION OF DIGITAL INCLUSION IN YOUR AREA 20
Table 2: Percentage of population by Settlement Type, Urban/Rural (Census 2001 / Planning
Service 2004)
Settlement Description Population Percentage Total
NI population
Urban / Rural
classification
Percentage Total
NI population
Belfast City 280,211 15.5 Urban 62.5
Derry City 83,125 4.6
Large Town (18,000+) 522,217 28.8
Medium Town (10,000 - 17,999)
128,937 7.1
Small Town (5,000 -
9,999)
117,434
6.5
Intermediate Settlement
(2,500 - 4,999)
77,423
4.3
Rural 37.5
Village (1,000 - 2,499) 103,500 5.7
Populations of less than
1,000 and open
countryside
498,016
27.5
SAMPLE SWITCH REPORT
A BASELINE EVALUATION OF DIGITAL INCLUSION IN YOUR AREA 21
Figure 2: Population Density - SOAs by quintile, Northern Ireland. Source: Census, 2011
AGE:
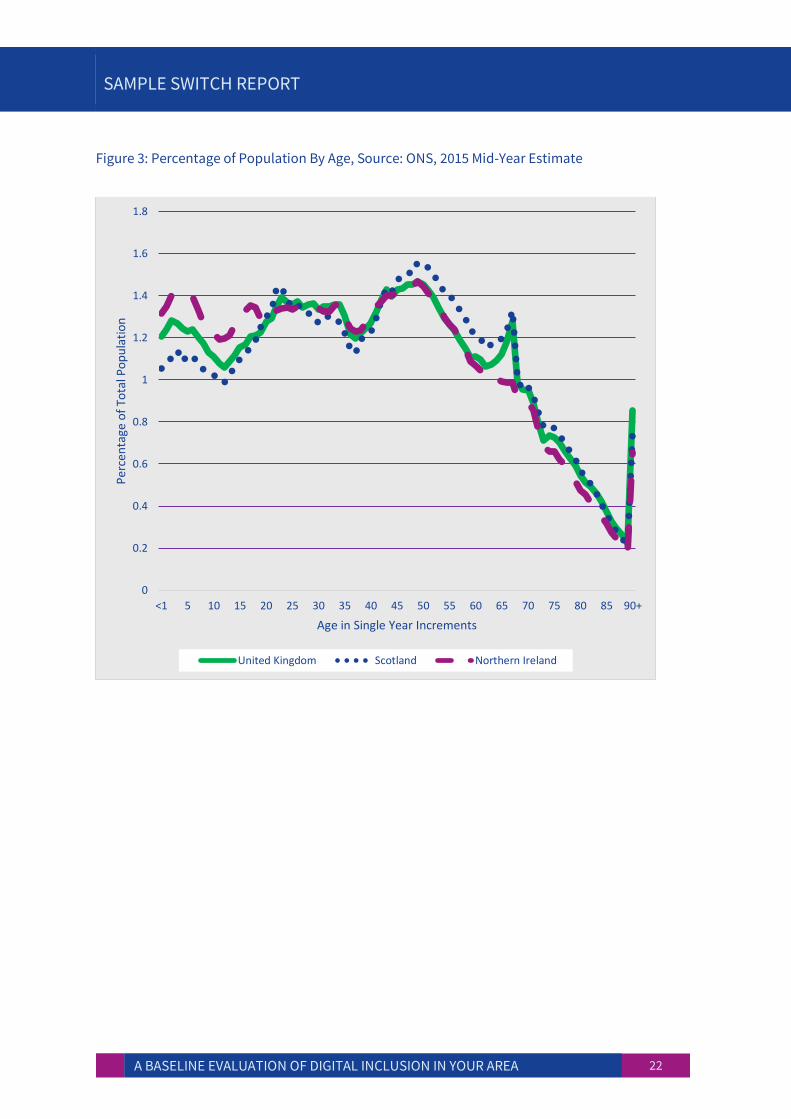
Research by doteveryone estimates that only 43% of those over 65 to have
all five Basic Digital Skills, and 32% of people in this age band have no
digital skills. In Northern Ireland, the 2016 Omnibus Survey found only 47%
of those aged over 65 made use of the internet. The demographic profile of
different areas varies considerably, a phenomenon that can be observed by
comparing Scotland and Northern Ireland with the UK as a whole (Figure 4).
In Northern Ireland, a lower percentage of the population is aged 60 or
older than in Scotland – which by contrast has a lower population aged
under 18 than the UK as a whole. Our Switch report would provide a
population profile and associated maps for your area.
SAMPLE SWITCH REPORT
A BASELINE EVALUATION OF DIGITAL INCLUSION IN YOUR AREA 22
Figure 3: Percentage of Population By Age, Source: ONS, 2015 Mid-Year Estimate
0
0.2
0.4
0.6
0.8
1
1.2
1.4
1.6
1.8
<1 5 10 15 20 25 30 35 40 45 50 55 60 65 70 75 80 85 90+
Per
cen
tage
of
Tota
l Po
pu
lati
on
Age in Single Year Increments
United Kingdom Scotland Northern Ireland

SAMPLE SWITCH REPORT
A BASELINE EVALUATION OF DIGITAL INCLUSION IN YOUR AREA 23
DIGITAL INCLUSION: DIGITAL SKILLS, INTERNET USE
AND CONNECTIVITY IN YOUR AREA
SUMMARY:
When estimating the number or proportion of people likely to be digitally
excluded, we look at a variety of sources. In Northern Ireland, the
Continuous Household and Omnibus Surveys provided estimates for the
proportion of individuals or households with regard to access to digital
devices and services (computers, the internet, broadband (and/or
superfast), and to digital behaviour. A doteveryone / Ipsos MORI survey
produced estimates of those lacking basic digital skills based on self-
assessment for different regions of the UK including Northern Ireland, while
the OECD Adult Skills Survey provides estimates of digital skill level based
on computer usage tests. Finally, the Lloyds UK Business Digital Index and
Consumer Digital Index also include estimates specifically for Northern
Ireland.
SAMPLE SWITCH REPORT
A BASELINE EVALUATION OF DIGITAL INCLUSION IN YOUR AREA 24
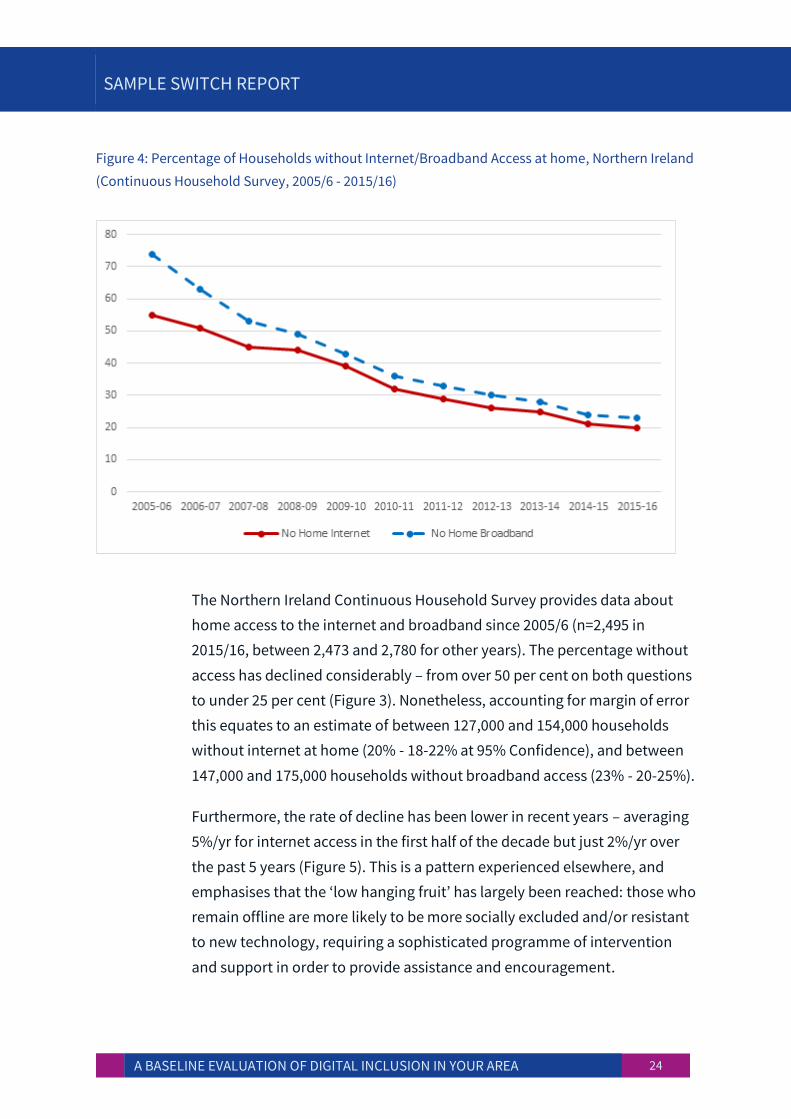
Figure 4: Percentage of Households without Internet/Broadband Access at home, Northern Ireland
(Continuous Household Survey, 2005/6 - 2015/16)
The Northern Ireland Continuous Household Survey provides data about
home access to the internet and broadband since 2005/6 (n=2,495 in
2015/16, between 2,473 and 2,780 for other years). The percentage without
access has declined considerably – from over 50 per cent on both questions
to under 25 per cent (Figure 3). Nonetheless, accounting for margin of error
this equates to an estimate of between 127,000 and 154,000 households
without internet at home (20% - 18-22% at 95% Confidence), and between
147,000 and 175,000 households without broadband access (23% - 20-25%).
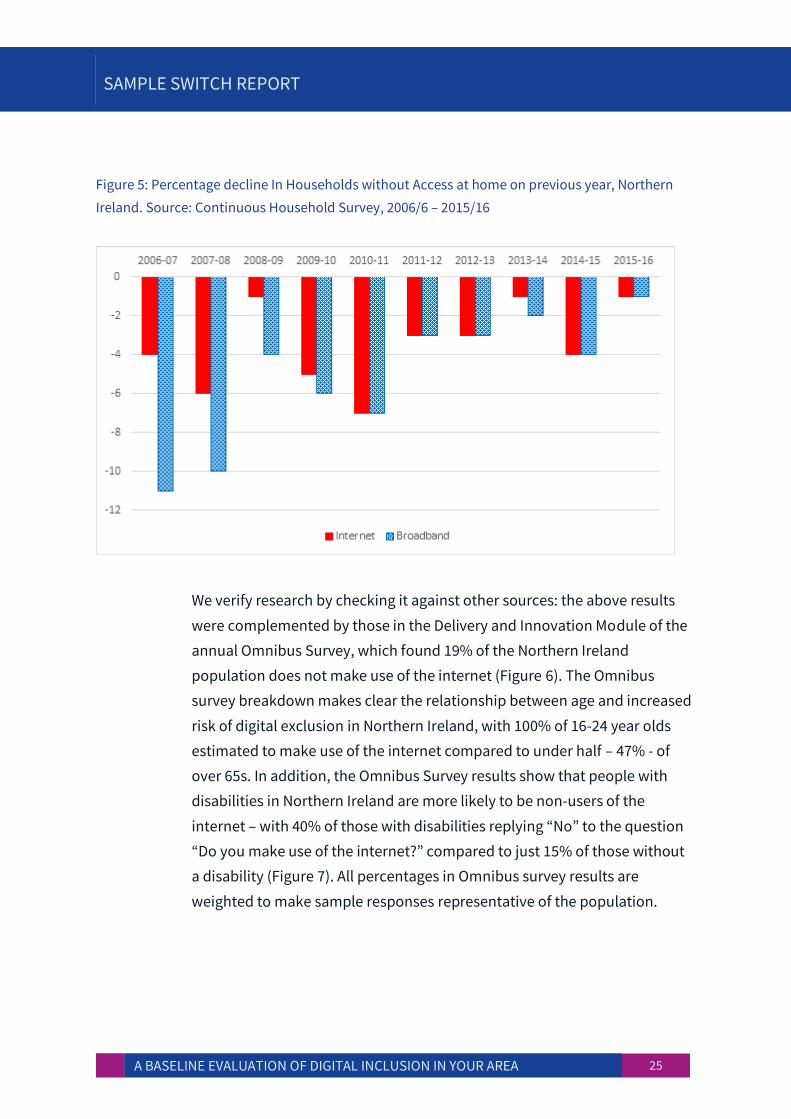
Furthermore, the rate of decline has been lower in recent years – averaging
5%/yr for internet access in the first half of the decade but just 2%/yr over
the past 5 years (Figure 5). This is a pattern experienced elsewhere, and
emphasises that the ‘low hanging fruit’ has largely been reached: those who
remain offline are more likely to be more socially excluded and/or resistant
to new technology, requiring a sophisticated programme of intervention
and support in order to provide assistance and encouragement.
SAMPLE SWITCH REPORT
A BASELINE EVALUATION OF DIGITAL INCLUSION IN YOUR AREA 25
Figure 5: Percentage decline In Households without Access at home on previous year, Northern
Ireland. Source: Continuous Household Survey, 2006/6 – 2015/16
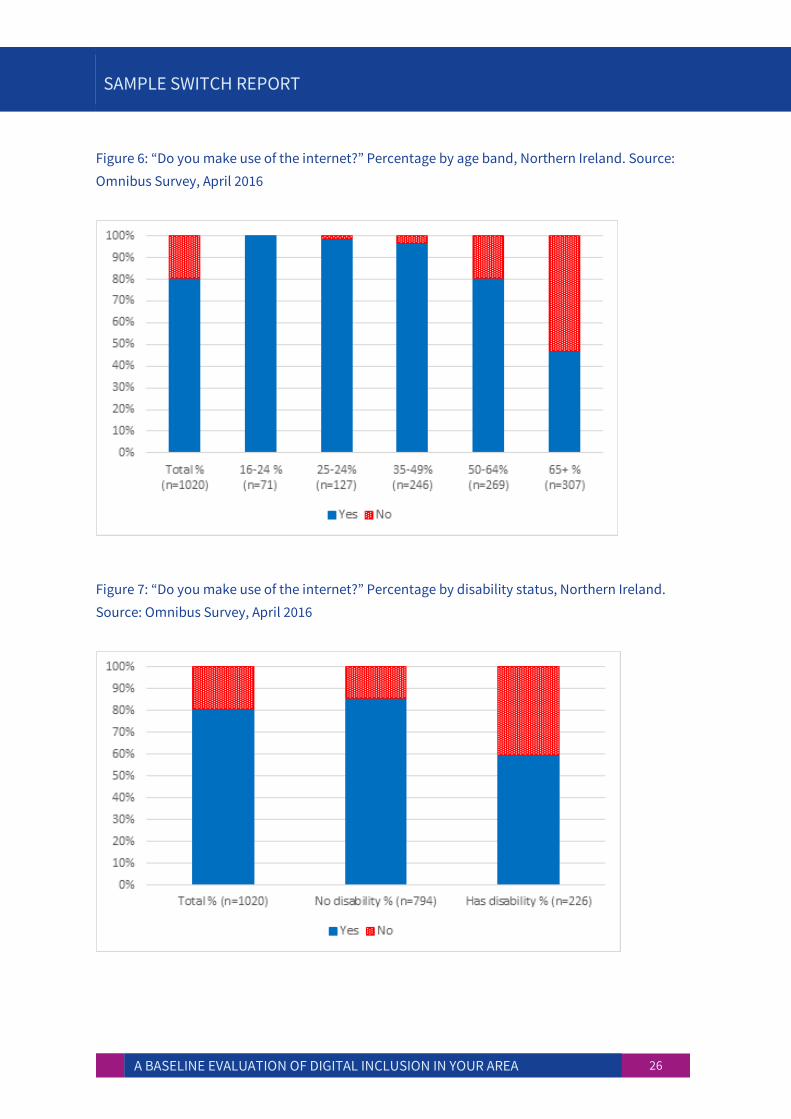
We verify research by checking it against other sources: the above results
were complemented by those in the Delivery and Innovation Module of the
annual Omnibus Survey, which found 19% of the Northern Ireland
population does not make use of the internet (Figure 6). The Omnibus
survey breakdown makes clear the relationship between age and increased
risk of digital exclusion in Northern Ireland, with 100% of 16-24 year olds
estimated to make use of the internet compared to under half – 47% - of
over 65s. In addition, the Omnibus Survey results show that people with
disabilities in Northern Ireland are more likely to be non-users of the
internet – with 40% of those with disabilities replying “No” to the question
“Do you make use of the internet?” compared to just 15% of those without
a disability (Figure 7). All percentages in Omnibus survey results are
weighted to make sample responses representative of the population.
SAMPLE SWITCH REPORT
A BASELINE EVALUATION OF DIGITAL INCLUSION IN YOUR AREA 26
Figure 6: “Do you make use of the internet?” Percentage by age band, Northern Ireland. Source:
Omnibus Survey, April 2016
Figure 7: “Do you make use of the internet?” Percentage by disability status, Northern Ireland.
Source: Omnibus Survey, April 2016
SAMPLE SWITCH REPORT
A BASELINE EVALUATION OF DIGITAL INCLUSION IN YOUR AREA 27
TECHNOLOGY OWNERSHIP AND BEHAVIOUR:
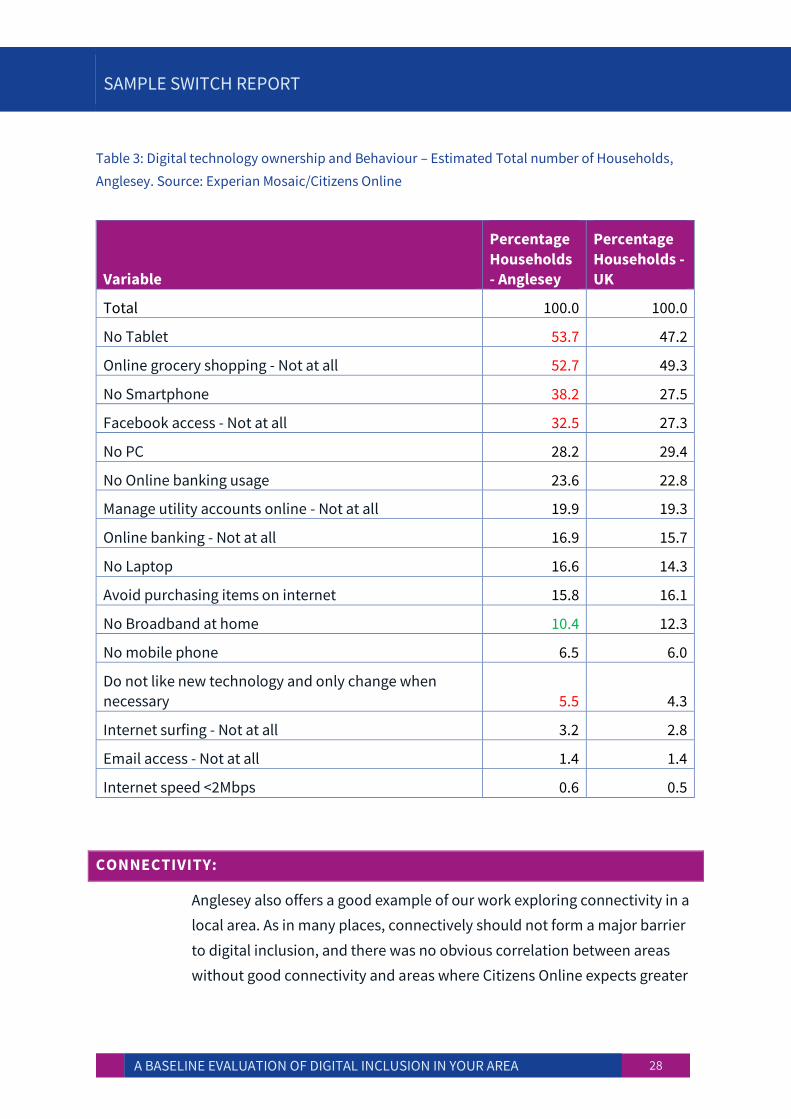
Experian Mosaic data allows estimates of numbers of households without
access to particular technologies and not undertaking certain types of
digital behaviour (Table 3), and to draw up targeted plans for marketing
digital skills support and digital transformation efforts to distinct segments
of the population. While these tentative estimates suggested that on
Anglesey, just 1.4% of households do not have email access, and just 3.2%
never surf the internet, 10% are without broadband at home and 38.2% are
not expected to have a smartphone. Over half of households are not
expected to have a tablet or use conduct grocery shopping online.
Table 3 makes comparisons regarding the percentage of Households across
the UK and in Anglesey as an example area with particular access or
behaviour issues that imply risk of digital exclusion. Instances where the
proportion is at least one percentage point higher than for the UK are
highlighted in red (Percentage of households unlikely to have a Tablet,
Smartphone, likely never to use Facebook or online grocery shopping, and
those who “Do not like new technology and only change when necessary”).
The proportion with no broadband internet at home is expected to be lower
by at least one percentage point for Anglesey and is marked green, while
higher exclusion by some distance is marked red. Table 2 presents the
percentages for Anglesey as numbers of Households, while Figure 4
provides a visual bar chart, comparing percentages with those for Wales
and the UK.
SAMPLE SWITCH REPORT
A BASELINE EVALUATION OF DIGITAL INCLUSION IN YOUR AREA 28
Table 3: Digital technology ownership and Behaviour – Estimated Total number of Households,
Anglesey. Source: Experian Mosaic/Citizens Online
Variable
Percentage
Households - Anglesey
Percentage
Households - UK
Total 100.0 100.0
No Tablet 53.7 47.2
Online grocery shopping - Not at all 52.7 49.3
No Smartphone 38.2 27.5
Facebook access - Not at all 32.5 27.3
No PC 28.2 29.4
No Online banking usage 23.6 22.8
Manage utility accounts online - Not at all 19.9 19.3
Online banking - Not at all 16.9 15.7
No Laptop 16.6 14.3
Avoid purchasing items on internet 15.8 16.1
No Broadband at home 10.4 12.3
No mobile phone 6.5 6.0
Do not like new technology and only change when necessary 5.5 4.3
Internet surfing - Not at all 3.2 2.8
Email access - Not at all 1.4 1.4
Internet speed <2Mbps 0.6 0.5
CONNECTIVITY:
Anglesey also offers a good example of our work exploring connectivity in a
local area. As in many places, connectively should not form a major barrier
to digital inclusion, and there was no obvious correlation between areas
without good connectivity and areas where Citizens Online expects greater
SAMPLE SWITCH REPORT
A BASELINE EVALUATION OF DIGITAL INCLUSION IN YOUR AREA 29
digital exclusion. However, found that there were clear pockets where lack
of connectively may contribute to digital exclusion.
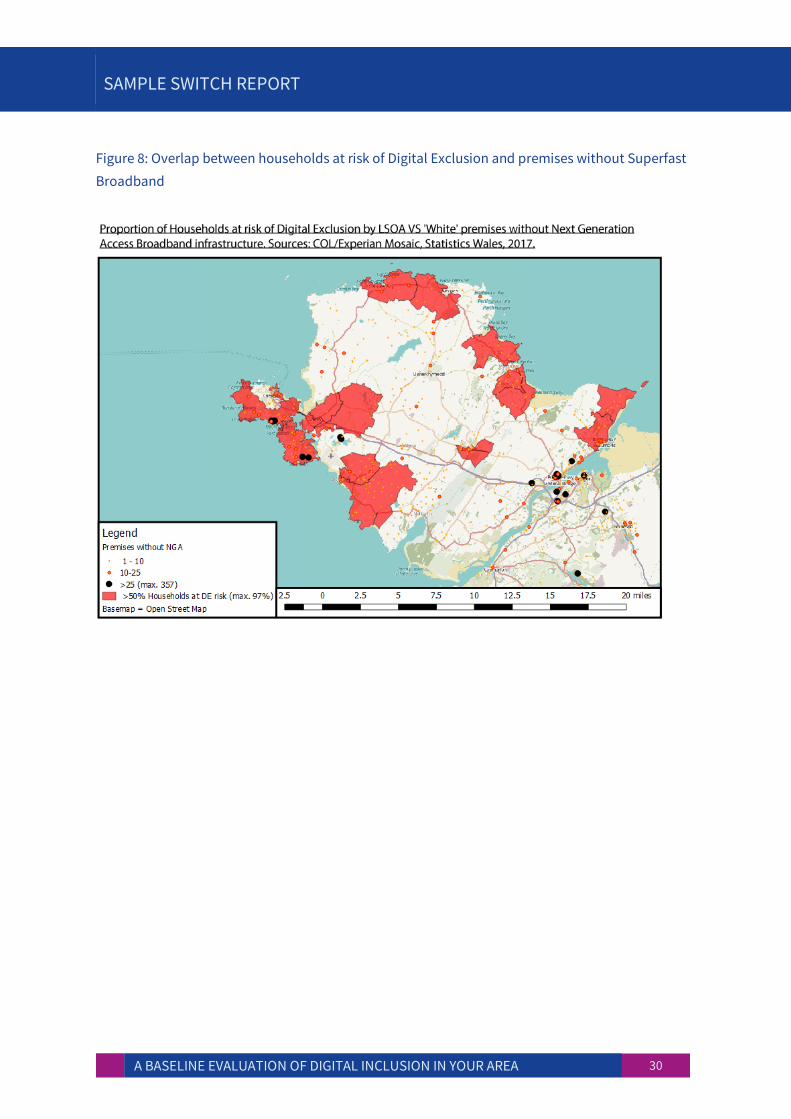
As of September 2017, independent organisation thinkbroadband reported
Superfast coverage on Anglesey was available to 84.6% of premises -
compared to 91.5% across Wales and 93.3% over the UK as a whole. OFCOM
reports the percentage of premises that cannot receive a download speed
greater than 10Mbit/s was 16%, the joint fourth highest percentage for a
Welsh local authority. However, the report also highlighted that Gwynedd
and the Isle of Anglesey had the fastest standard broadband speeds with a
15Mbit/s average.
Figure 8 shows 2,956 'White' premises across Anglesey where there is no
qualifying ‘Next Generation’ broadband infrastructure and none is likely to
be developed within 3 years. While these premises are distributed across
the island, concentrations of over 25 properties at a single postcode occur
around Menai and in the West of the island.
Our connectivity studies also explore 3G and 4G coverage, roll-out
programmes and funding available for rural or otherwise difficult
connections.
SAMPLE SWITCH REPORT
A BASELINE EVALUATION OF DIGITAL INCLUSION IN YOUR AREA 30
Figure 8: Overlap between households at risk of Digital Exclusion and premises without Superfast
Broadband
SAMPLE SWITCH REPORT
A BASELINE EVALUATION OF DIGITAL INCLUSION IN YOUR AREA 31
SWITCH 2: STRATEGIC LANDSCAPE FINDINGS
This deals with the strategic context in your area. It summarises our key
findings from reviewing policy and strategy documentation relating to
connectivity and digital inclusion. This section could also be understood as
‘what is being said publicly’.
Citizens Online undertook a document review of strategies, policies and
action plans relevant to digital inclusion issues in your area. Again, these
were sourced either from the internet or on request from stakeholders. This
review sought to make an assessment of the overall digital inclusion
landscape in order to support our recommendations.
We look at:
Current strategies
Current policies
Current action plans (e.g. project plans or update reports)
A combination of desk research and stakeholder input provided a list of
policies, strategies and action plans to review, of relevance to the digital
skills agenda. This enabled us to temperature check current activity and
also to make links to activities that could enable the mainstreaming of
digital skills work, if they are brought into alignment.
SAMPLE SWITCH REPORT
A BASELINE EVALUATION OF DIGITAL INCLUSION IN YOUR AREA 32
SWITCH 3: FINDINGS FROM SURVEYING THE DIGITAL
ECOSYSTEM
This section of a Switch report deals with findings from surveys undertaken
with partner organisations and staff in your area. It contains statistical
findings and qualitative feedback. This section can also be understood as
‘what you tell us’. The intention is to generate qualitative data and feedback
directly from those people in your area active or interested in digital
inclusion. The format of this work-stream is varied: meetings, conference
calls, phone calls, emails and the initial workshop all contribute. This
activity is integrated with other work-streams and forms an iterative
process of testing ideas, learning, reflecting, sharing information and
ultimately supporting our findings and recommendations.
We conduct surveys of four types:
1. Telephone / Face to Face Interview –targeted at specific stakeholder organisations involved in digital inclusion activity or other activity with
a digital inclusion link such as employability, financial inclusion and housing.
2. Digital Maturity Assessment (DMA) - a comprehensive ‘deep dive’
questionnaire, aimed at some of the key organisations influencing or
delivering digital inclusion outcomes. These surveys are conducted face
to face or over the phone with one or more members of staff representing the organisation providing feedback.
3. Organisational Survey - aimed at any organisation that involved in delivering digital inclusion activity, or a stakeholder in digital inclusion. Intended to be a relatively simple ‘gateway’ assessment of an
organisation’s connection with the digital inclusion agenda.
4. Staff Survey - aimed at customer facing personnel and intending to
measure the skills and confidence of staff and volunteers to be able to help others with basic digital skills; acting as Digital Champions.
The different types of online survey allow various strata of the digital
inclusion picture to be layered together. These layers (Digital Maturity
Assessments (DMAs), Organisational Surveys and Staff Surveys) are
combined with the insights we glean from engaging with organisations
through telephone interviews, meetings, phone calls and emails.
SAMPLE SWITCH REPORT
A BASELINE EVALUATION OF DIGITAL INCLUSION IN YOUR AREA 33
TELEPHONE / FACE TO FACE INTERVIEWS
Not every organisation is able to complete a full DMA process. In some
cases, it proves more effective to undertake a phone interview with an
organisational representative or team, rather than complete a full
assessment. We are still able to ask key questions about digital inclusion,
future delivery plans and collaboration with partners.
DIGITAL MATURITY ASSESSMENT SURVEYS
By far the most intensive form of survey is our Digital Maturity Assessment,
consisting of fifty questions, covering Digital Culture, Digital Inclusion,
Digital Service Delivery and Digital Infrastructure. This presents an
opportunity for organisations to reflect on how far along their organisation
has moved toward digital service delivery and/or a state of readiness for
providing an accessible service for digitally excluded people. While rating
some responses or statement out of 5 on a ‘maturity scale’ provides some
quantitative data for analysis, these ‘deep dive’ conversations are primarily
designed to identify the best qualitative data about an area’s local digital
ecosystem, through dialogue with organisational representatives. To
support such complex surveys, completion is undertaken by Citizens Online
through a conference call or face to face interview, where several
representatives from an organisation sometimes contribute to the answers.
ORGANISATIONAL SURVEYS
Online-only organisational surveys enable us to get feedback from a
broader range of stakeholders across the area. They ask similar questions
to the DMA while remaining a ‘lighter’ version; much easier to access and
complete without support from Citizens Online.
STAFF SURVEYS
Anonymous staff surveys enable us to get a broad overview of the current
level of digital skills within a customer facing workforce. Importantly, it also
means we get a sense of capacity, willingness and ability for staff to
undertake digital skills support work within normal working hours.
SAMPLE SWITCH REPORT
A BASELINE EVALUATION OF DIGITAL INCLUSION IN YOUR AREA 34
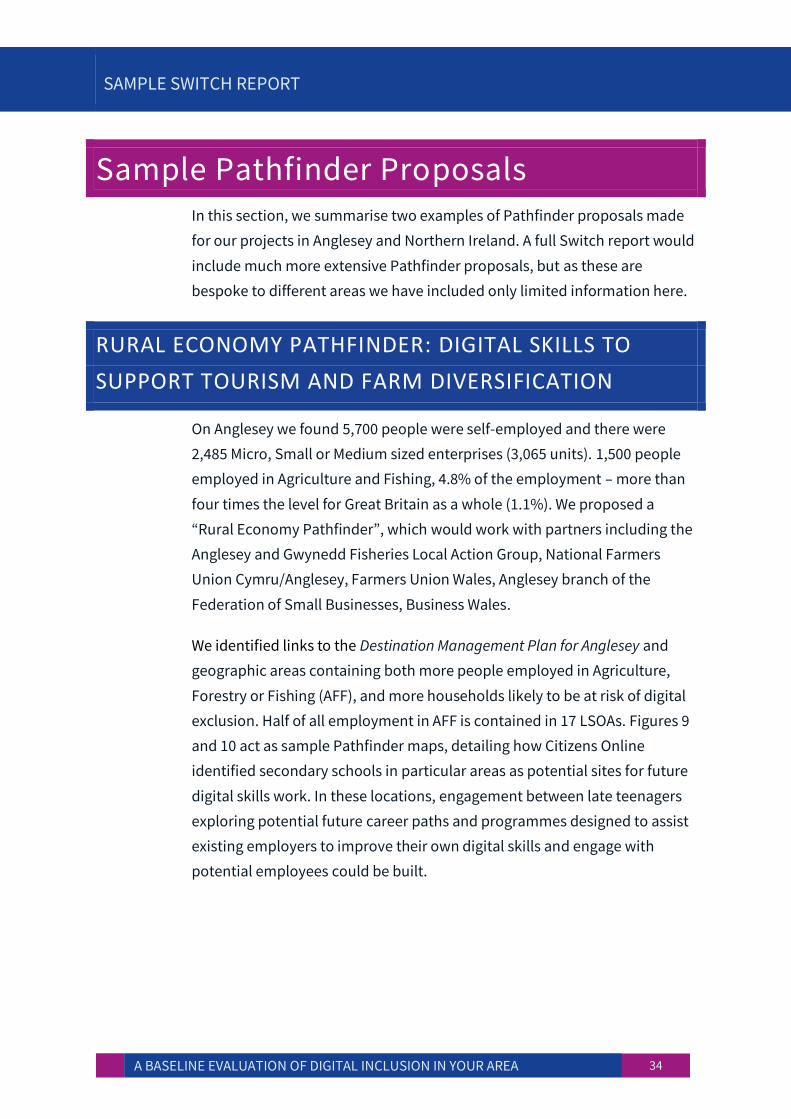
Sample Pathfinder Proposals In this section, we summarise two examples of Pathfinder proposals made
for our projects in Anglesey and Northern Ireland. A full Switch report would
include much more extensive Pathfinder proposals, but as these are
bespoke to different areas we have included only limited information here.
RURAL ECONOMY PATHFINDER: DIGITAL SKILLS TO
SUPPORT TOURISM AND FARM DIVERSIFICATION
On Anglesey we found 5,700 people were self-employed and there were
2,485 Micro, Small or Medium sized enterprises (3,065 units). 1,500 people
employed in Agriculture and Fishing, 4.8% of the employment – more than
four times the level for Great Britain as a whole (1.1%). We proposed a
“Rural Economy Pathfinder”, which would work with partners including the
Anglesey and Gwynedd Fisheries Local Action Group, National Farmers
Union Cymru/Anglesey, Farmers Union Wales, Anglesey branch of the
Federation of Small Businesses, Business Wales.
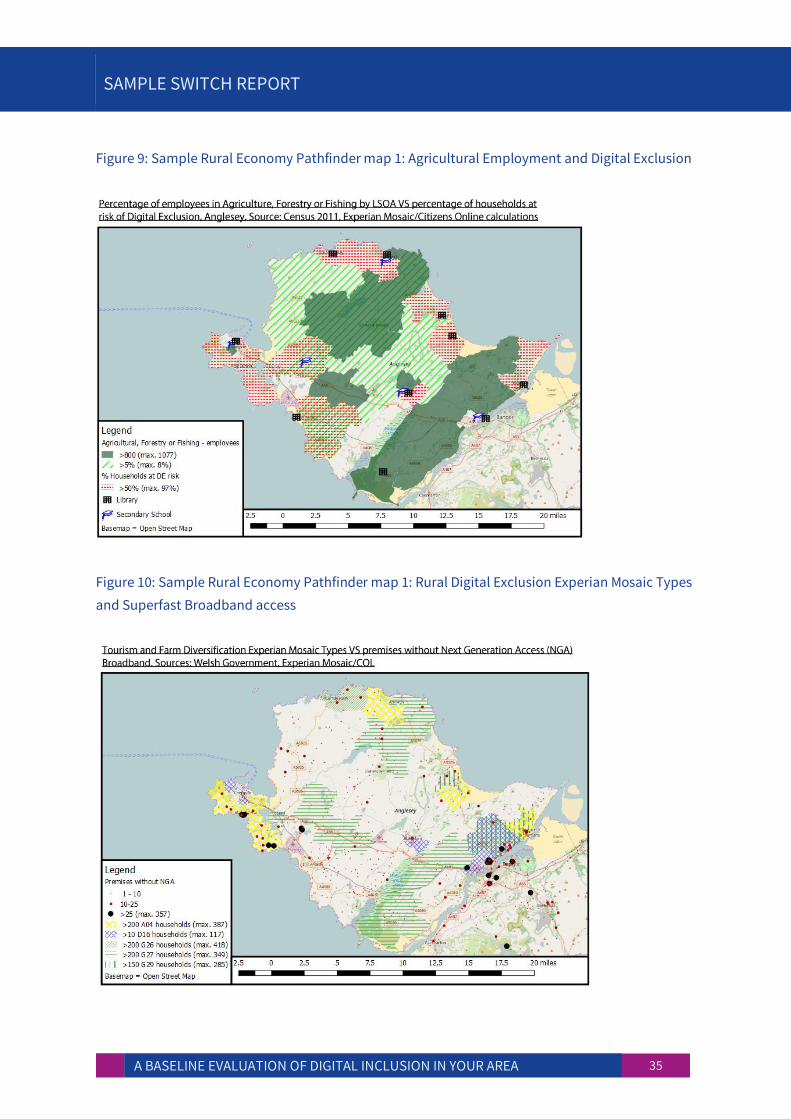
We identified links to the Destination Management Plan for Anglesey and
geographic areas containing both more people employed in Agriculture,
Forestry or Fishing (AFF), and more households likely to be at risk of digital
exclusion. Half of all employment in AFF is contained in 17 LSOAs. Figures 9
and 10 act as sample Pathfinder maps, detailing how Citizens Online
identified secondary schools in particular areas as potential sites for future
digital skills work. In these locations, engagement between late teenagers
exploring potential future career paths and programmes designed to assist
existing employers to improve their own digital skills and engage with
potential employees could be built.
SAMPLE SWITCH REPORT
A BASELINE EVALUATION OF DIGITAL INCLUSION IN YOUR AREA 35
Figure 9: Sample Rural Economy Pathfinder map 1: Agricultural Employment and Digital Exclusion
Figure 10: Sample Rural Economy Pathfinder map 1: Rural Digital Exclusion Experian Mosaic Types
and Superfast Broadband access

SAMPLE SWITCH REPORT
A BASELINE EVALUATION OF DIGITAL INCLUSION IN YOUR AREA 36
DIGITAL HEALTH PATHFINDER
INTRODUCTION
One of the major challenges facing the UK is how to properly care for an
aging population and ensure adequate personal care is provided to people
in their homes if and when they need this. In remote and rural areas the
challenge is more acute due to the large distances carers need to travel
between clients and distance between people’s homes and facilities such
as GP practices. One of the issues identified as crucial in the provision of
future care is ‘patient activation’ or encouraging people to take an active
role in maintaining their own health. Digital technology is likely to have a
key role in ‘patient activation’ or motivating individuals particularly in
regard to chronic long term conditions.
Digital technology is also likely to play a key role in connecting friends and
families providing care with the professional teams involved in care. Digital
technology can also offer a way of providing many kinds of support ranging
from neighbours dropping in for a chat, to doing shopping or helping with
simple tasks like cleaning and tidying. This kind of engagement can be
critical in maintaining mental and physical health in old age and for those
suffering long term illness. It is also a valuable way of maintain community
cohesion and preventing social isolation.
In Northern Ireland, we proposed a digital inclusion programme focused on
health information and apps available to the public which will support
people to remain independent and self-managing health conditions. At the
time of the 2011 Census there were 359,956 people in Northern Ireland for
whom “day to day activities” are limited – approximately 20% of the
population. We proposed a targeted approach in the Causeway Coast and
Glens local authority area of Northern Ireland, where 27,247 people have
their day-to-day activities limited (19.7% usual residents), 17.1% of the
population is over 65 (24,432 people), and 8.17% of the population are
Employment and Support Allowance (ESA) claimants (12,680 people).
SAMPLE SWITCH REPORT
A BASELINE EVALUATION OF DIGITAL INCLUSION IN YOUR AREA 37
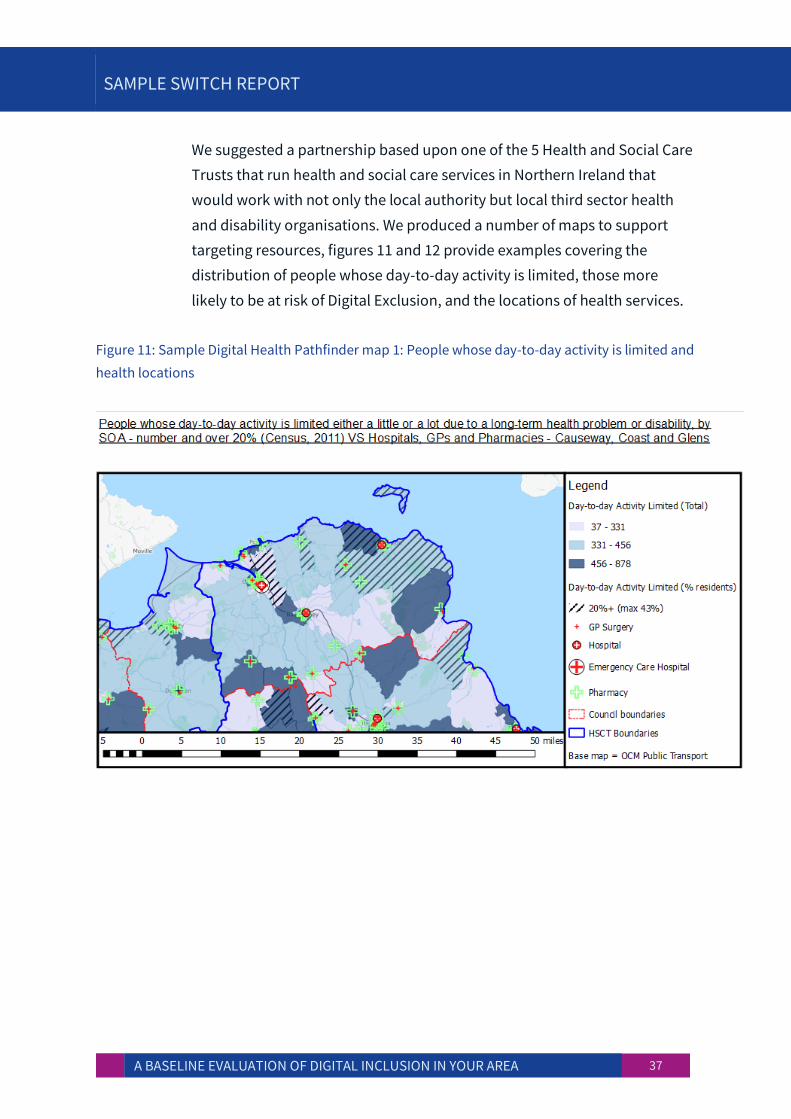
We suggested a partnership based upon one of the 5 Health and Social Care
Trusts that run health and social care services in Northern Ireland that
would work with not only the local authority but local third sector health
and disability organisations. We produced a number of maps to support
targeting resources, figures 11 and 12 provide examples covering the
distribution of people whose day-to-day activity is limited, those more
likely to be at risk of Digital Exclusion, and the locations of health services.
Figure 11: Sample Digital Health Pathfinder map 1: People whose day-to-day activity is limited and
health locations
SAMPLE SWITCH REPORT
A BASELINE EVALUATION OF DIGITAL INCLUSION IN YOUR AREA 38
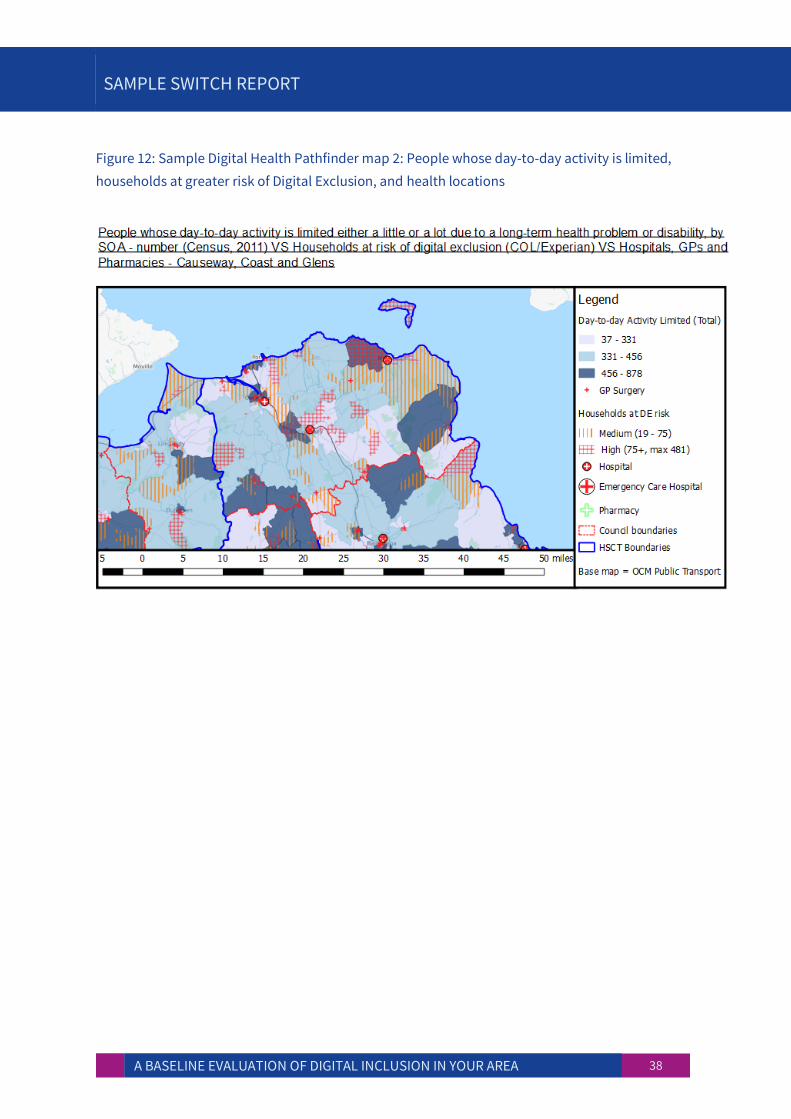
Figure 12: Sample Digital Health Pathfinder map 2: People whose day-to-day activity is limited,
households at greater risk of Digital Exclusion, and health locations
SAMPLE SWITCH REPORT
A BASELINE EVALUATION OF DIGITAL INCLUSION IN YOUR AREA 39
Appendix 1: Methodology
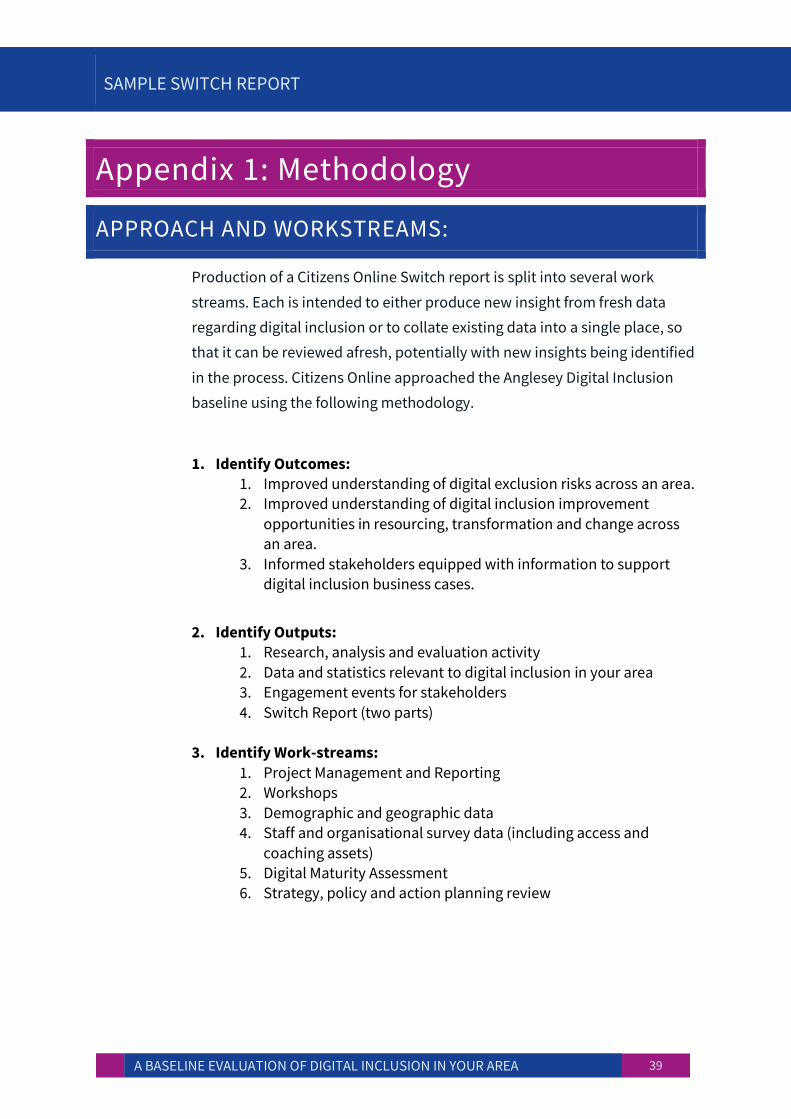
APPROACH AND WORKSTREAMS:
Production of a Citizens Online Switch report is split into several work
streams. Each is intended to either produce new insight from fresh data
regarding digital inclusion or to collate existing data into a single place, so
that it can be reviewed afresh, potentially with new insights being identified
in the process. Citizens Online approached the Anglesey Digital Inclusion
baseline using the following methodology.
1. Identify Outcomes: 1. Improved understanding of digital exclusion risks across an area.
2. Improved understanding of digital inclusion improvement
opportunities in resourcing, transformation and change across an area.
3. Informed stakeholders equipped with information to support digital inclusion business cases.
2. Identify Outputs: 1. Research, analysis and evaluation activity
2. Data and statistics relevant to digital inclusion in your area 3. Engagement events for stakeholders
4. Switch Report (two parts)
3. Identify Work-streams:
1. Project Management and Reporting 2. Workshops
3. Demographic and geographic data 4. Staff and organisational survey data (including access and
coaching assets) 5. Digital Maturity Assessment 6. Strategy, policy and action planning review
SAMPLE SWITCH REPORT
A BASELINE EVALUATION OF DIGITAL INCLUSION IN YOUR AREA 40
FROM FINDINGS TO RECOMMENDATIONS:
Our information synthesis process involves:
1. Research
2. Analysing data
3. Producing findings
4. Triangulating key data sources to prioritise action areas
5. Developing a “Digital Resilience Foundation Programme” including a
number of key strategic recommendations which can be linked to other
aims in business plans
6. Developing Pathfinder Project Proposals which can each form the basis
of a business case for a priority digital inclusion opportunity, targeted
for lead organisations or budget holders
7. Collating reports
THE DIGITAL RESILIENCE MODEL
Citizens Online’s whole system approach to tackling Digital Inclusion is
called Digital Resilience. This is an award-winning methodology which
seeks to identify key digital exclusion risks in an area and use an evidence
based approach, to target resources and create an action plan for local
stakeholders to deliver. We estimate a comprehensive Digital Resilience
programme of change requires around three years of activity to ensure that
different ways of working can be fully embedded into a locality.
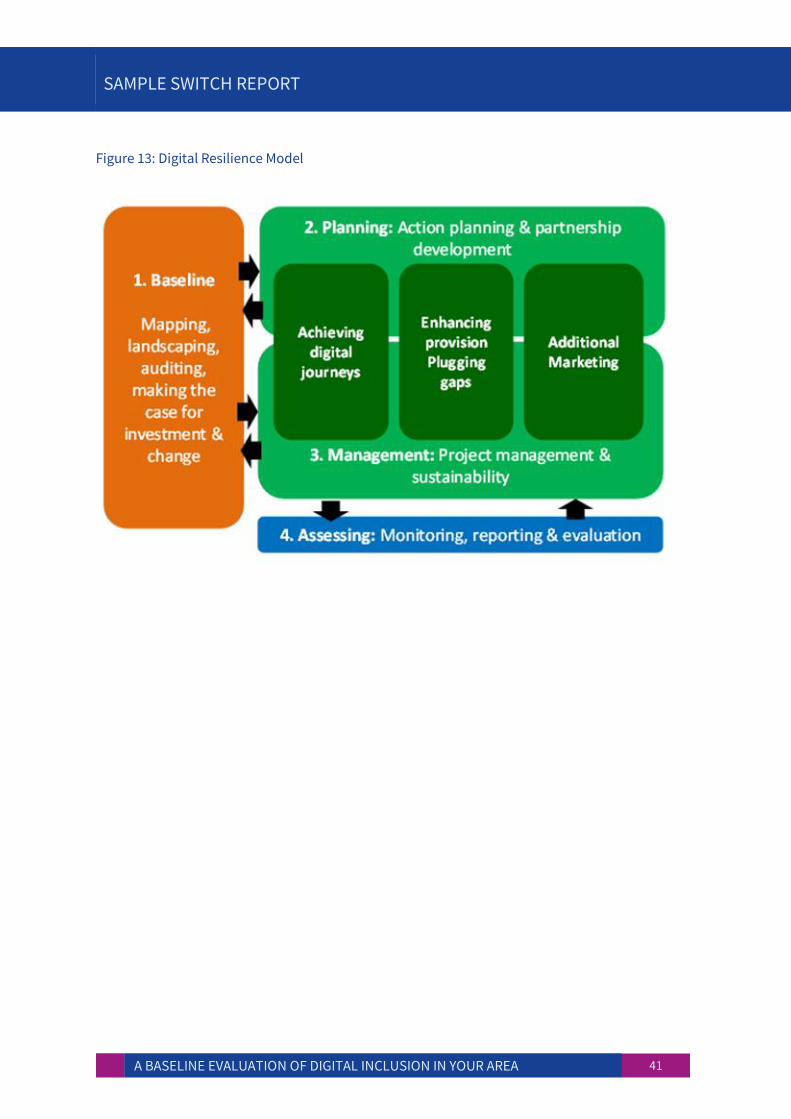
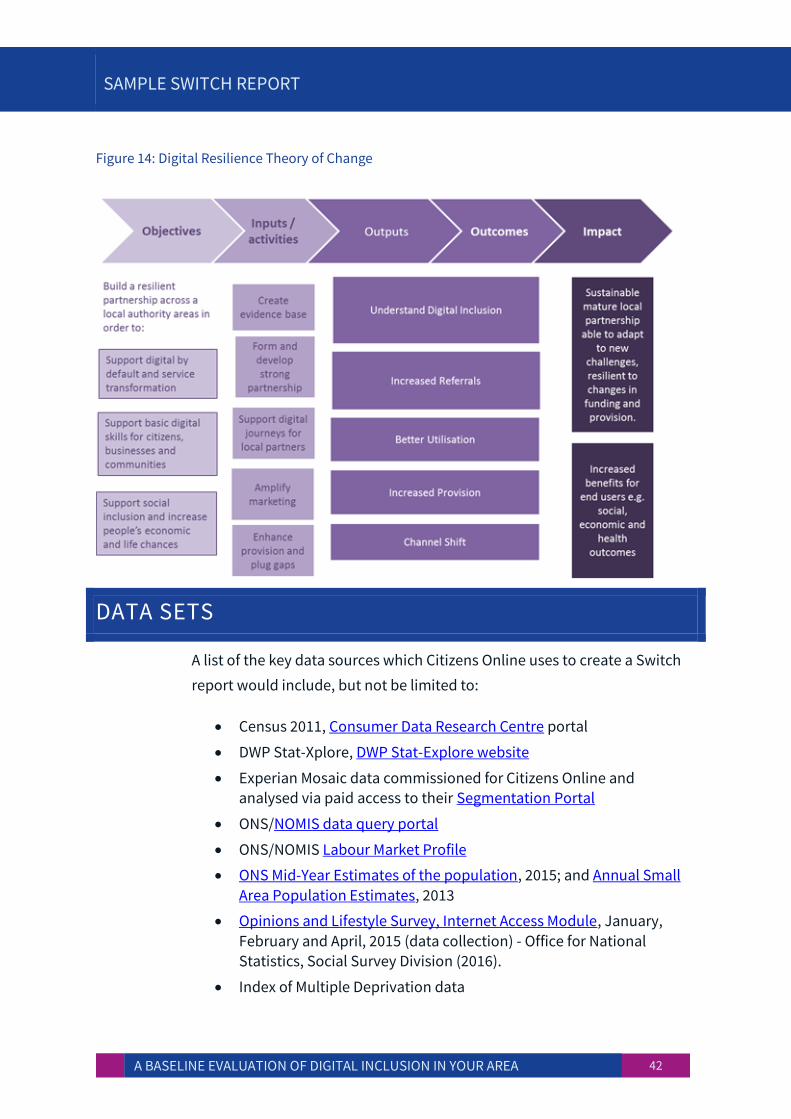
Figure 13 shows the different elements within the Digital Resilience model
and how they relate to each other. Figure 14 shows our Theory of Change
for Digital Resilience, which supports this thinking.
SAMPLE SWITCH REPORT
A BASELINE EVALUATION OF DIGITAL INCLUSION IN YOUR AREA 41
Figure 13: Digital Resilience Model
SAMPLE SWITCH REPORT
A BASELINE EVALUATION OF DIGITAL INCLUSION IN YOUR AREA 42
Figure 14: Digital Resilience Theory of Change
DATA SETS
A list of the key data sources which Citizens Online uses to create a Switch
report would include, but not be limited to:
Census 2011, Consumer Data Research Centre portal
DWP Stat-Xplore, DWP Stat-Explore website
Experian Mosaic data commissioned for Citizens Online and analysed via paid access to their Segmentation Portal
ONS/NOMIS data query portal
ONS/NOMIS Labour Market Profile
ONS Mid-Year Estimates of the population, 2015; and Annual Small
Area Population Estimates, 2013
Opinions and Lifestyle Survey, Internet Access Module, January,
February and April, 2015 (data collection) - Office for National
Statistics, Social Survey Division (2016).
Index of Multiple Deprivation data
SAMPLE SWITCH REPORT
A BASELINE EVALUATION OF DIGITAL INCLUSION IN YOUR AREA 43