Embed Size (px)
Citation preview
42510011 0010 1010 1101 0001 0100 1011
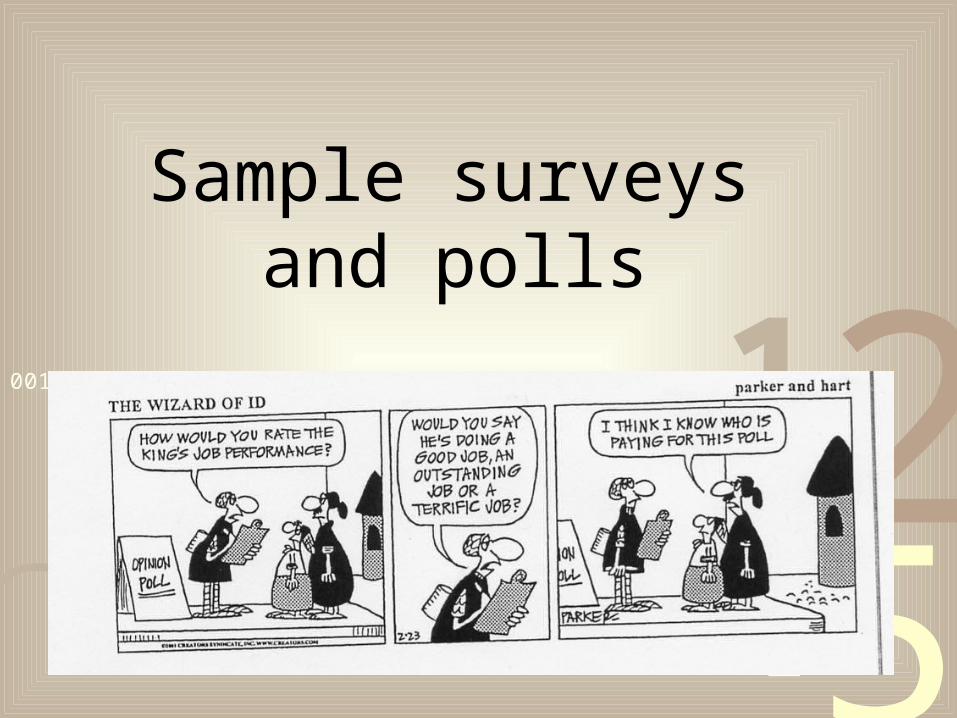
Sample surveys and polls
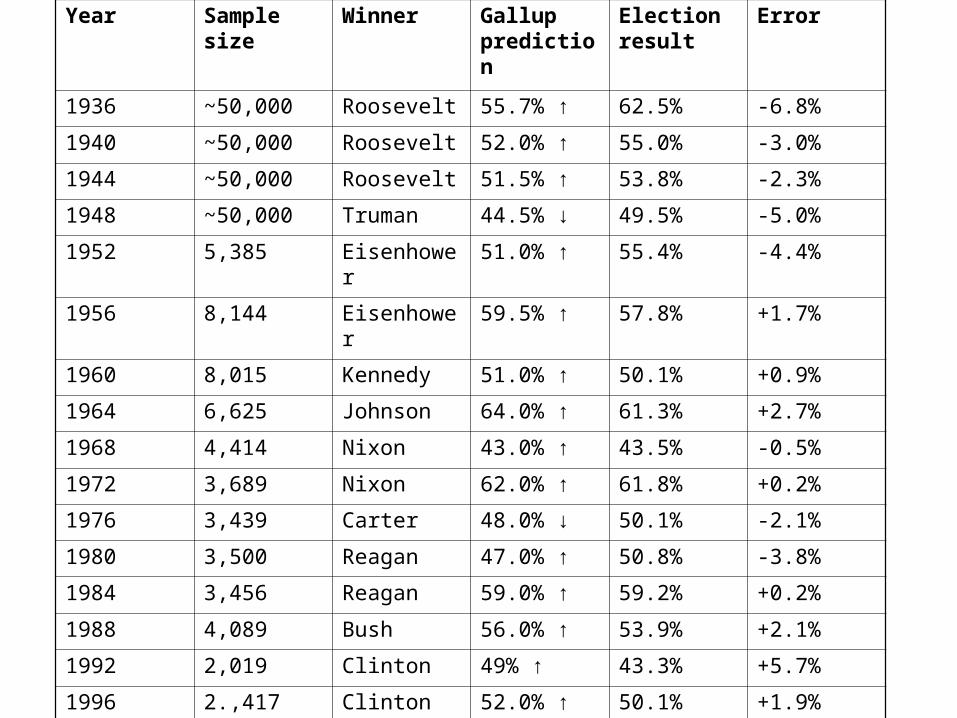
Year Sample size
Winner Gallup prediction
Election result
Error
1936 ~50,000 Roosevelt 55.7% ↑ 62.5% -6.8%
1940 ~50,000 Roosevelt 52.0% ↑ 55.0% -3.0%
1944 ~50,000 Roosevelt 51.5% ↑ 53.8% -2.3%
1948 ~50,000 Truman 44.5% ↓ 49.5% -5.0%
1952 5,385 Eisenhower 51.0% ↑ 55.4% -4.4%
1956 8,144 Eisenhower 59.5% ↑ 57.8% +1.7%
1960 8,015 Kennedy 51.0% ↑ 50.1% +0.9%
1964 6,625 Johnson 64.0% ↑ 61.3% +2.7%
1968 4,414 Nixon 43.0% ↑ 43.5% -0.5%
1972 3,689 Nixon 62.0% ↑ 61.8% +0.2%
1976 3,439 Carter 48.0% ↓ 50.1% -2.1%
1980 3,500 Reagan 47.0% ↑ 50.8% -3.8%
1984 3,456 Reagan 59.0% ↑ 59.2% +0.2%
1988 4,089 Bush 56.0% ↑ 53.9% +2.1%
1992 2,019 Clinton 49% ↑ 43.3% +5.7%
1996 2.,417 Clinton 52.0% ↑ 50.1% +1.9%
2000 3,129 Bush 48.0% ↑ 47.9% +0.1%
2004 1,866 Bush 49.0% ↔ 51.0% -2.0%
4251
0011 0010 1010 1101 0001 0100 1011
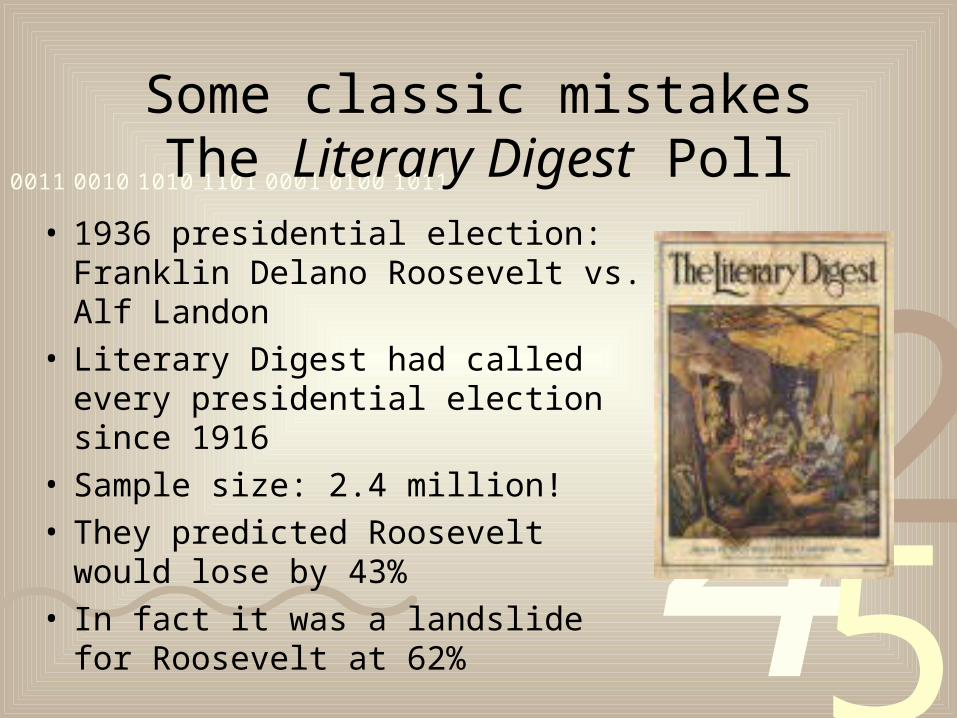
Some classic mistakesThe Literary Digest Poll
• 1936 presidential election: Franklin Delano Roosevelt vs. Alf Landon
• Literary Digest had called every presidential election since 1916
• Sample size: 2.4 million!• They predicted Roosevelt would lose
by 43%• In fact it was a landslide for
Roosevelt at 62%
4251
0011 0010 1010 1101 0001 0100 1011
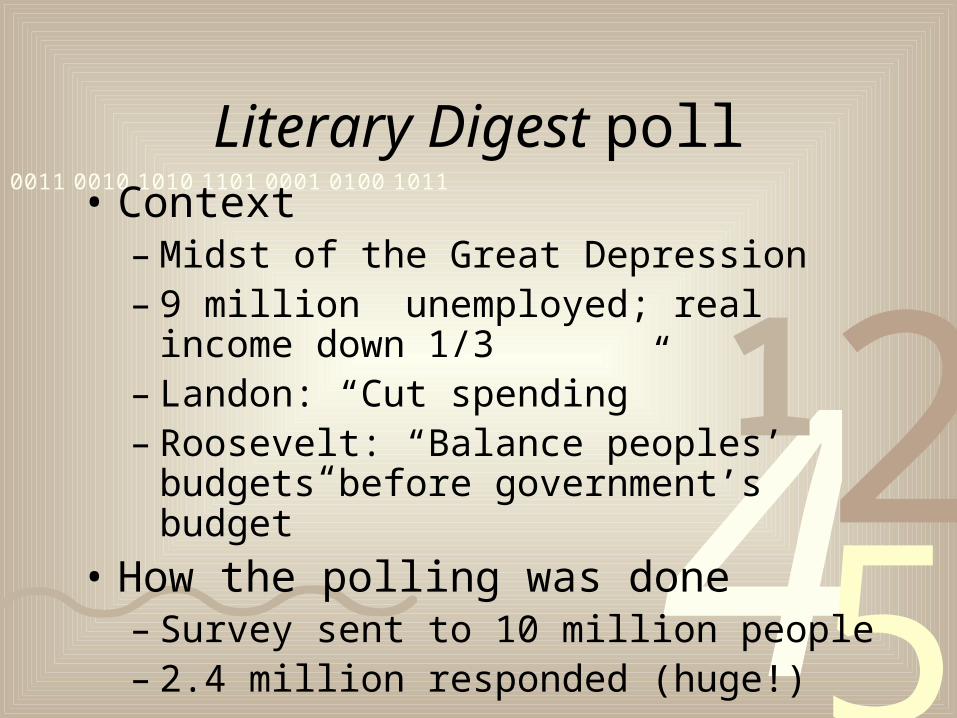
Literary Digest poll• Context
– Midst of the Great Depression– 9 million unemployed; real income down 1/3– Landon: “Cut spending” – Roosevelt: “Balance peoples’ budgets before
government’s budget”
• How the polling was done– Survey sent to 10 million people – 2.4 million responded (huge!)
4251
0011 0010 1010 1101 0001 0100 1011
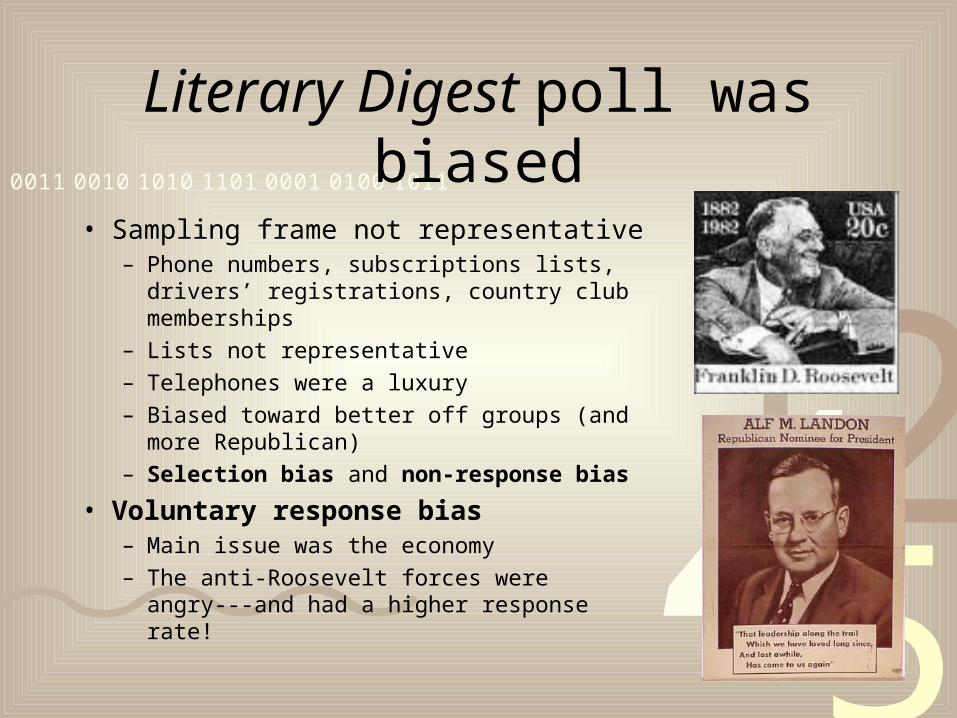
Literary Digest poll was biased
• Sampling frame not representative– Phone numbers, subscriptions lists, drivers’
registrations, country club memberships
– Lists not representative
– Telephones were a luxury
– Biased toward better off groups (and more Republican)
– Selection bias and non-response bias
• Voluntary response bias– Main issue was the economy
– The anti-Roosevelt forces were angry---and had a higher response rate!
4251
0011 0010 1010 1101 0001 0100 1011
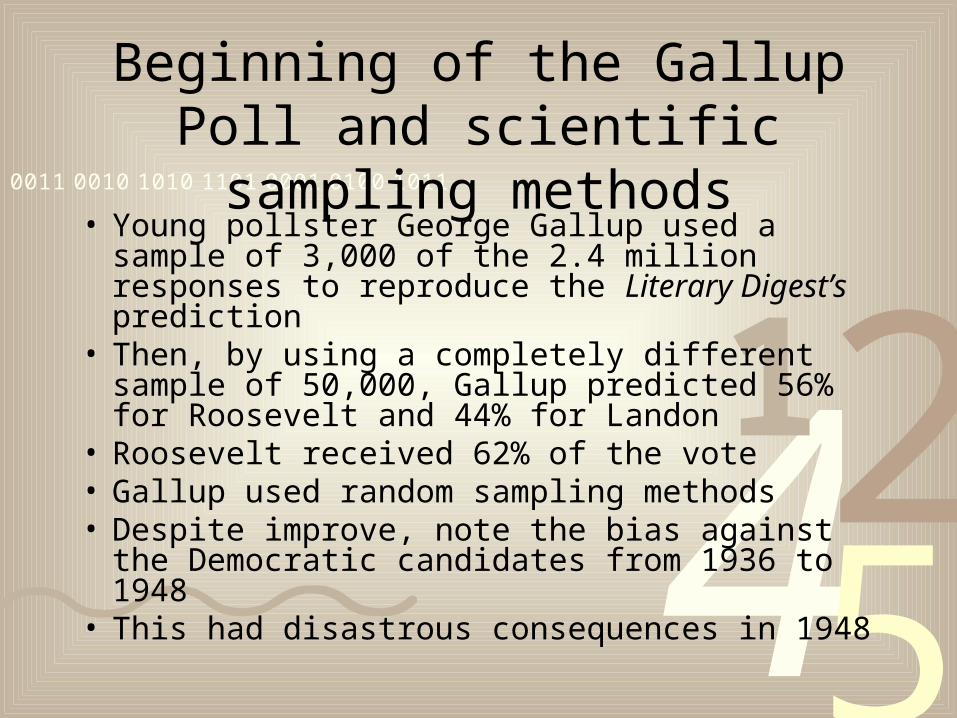
• Young pollster George Gallup used a sample of 3,000 of the 2.4 million responses to reproduce the Literary Digest’s prediction
• Then, by using a completely different sample of 50,000, Gallup predicted 56% for Roosevelt and 44% for Landon
• Roosevelt received 62% of the vote• Gallup used random sampling methods• Despite improve, note the bias against the
Democratic candidates from 1936 to 1948• This had disastrous consequences in 1948
Beginning of the Gallup Poll and scientific sampling methods
4251
0011 0010 1010 1101 0001 0100 1011
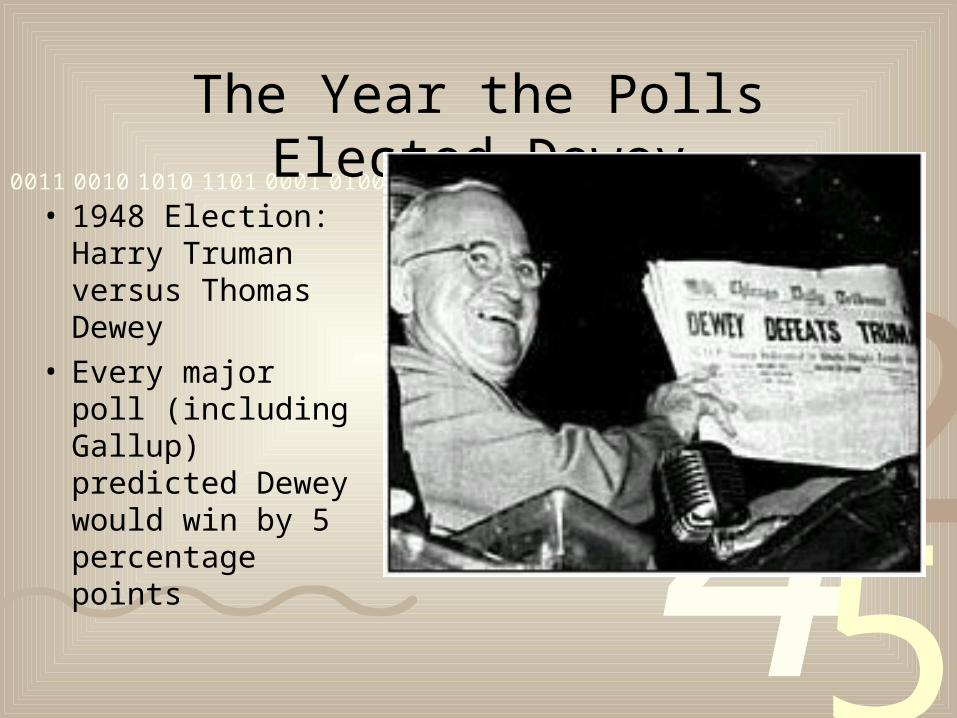
The Year the Polls Elected Dewey
• 1948 Election: Harry Truman versus Thomas Dewey
• Every major poll (including Gallup) predicted Dewey would win by 5 percentage points
4251
0011 0010 1010 1101 0001 0100 1011
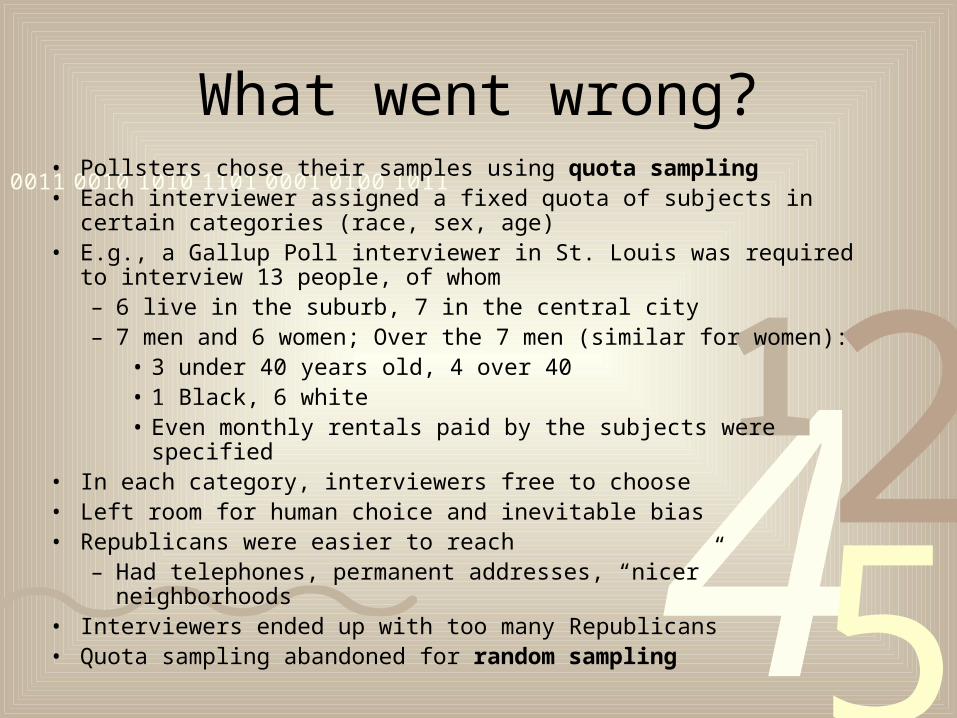
What went wrong?• Pollsters chose their samples using quota sampling• Each interviewer assigned a fixed quota of subjects in certain categories
(race, sex, age)• E.g., a Gallup Poll interviewer in St. Louis was required to interview 13
people, of whom– 6 live in the suburb, 7 in the central city– 7 men and 6 women; Over the 7 men (similar for women):
• 3 under 40 years old, 4 over 40• 1 Black, 6 white• Even monthly rentals paid by the subjects were specified
• In each category, interviewers free to choose• Left room for human choice and inevitable bias• Republicans were easier to reach
– Had telephones, permanent addresses, “nicer” neighborhoods• Interviewers ended up with too many Republicans• Quota sampling abandoned for random sampling
4251
0011 0010 1010 1101 0001 0100 1011
How surveys can get it wrong
• Sampling error– Errors caused by taking a sample (versus census)
• Random sampling error– Deviation between statistic and parameter– Error due to chance inevitable with random sample– Margin of error in confidence statement includes only
random sampling error• Non-sampling error
– Errors not related to act of selecting a sample– Could happen in a census
• Distinction between sampling error and non-sampling error: could it happen in a census
4251
0011 0010 1010 1101 0001 0100 1011
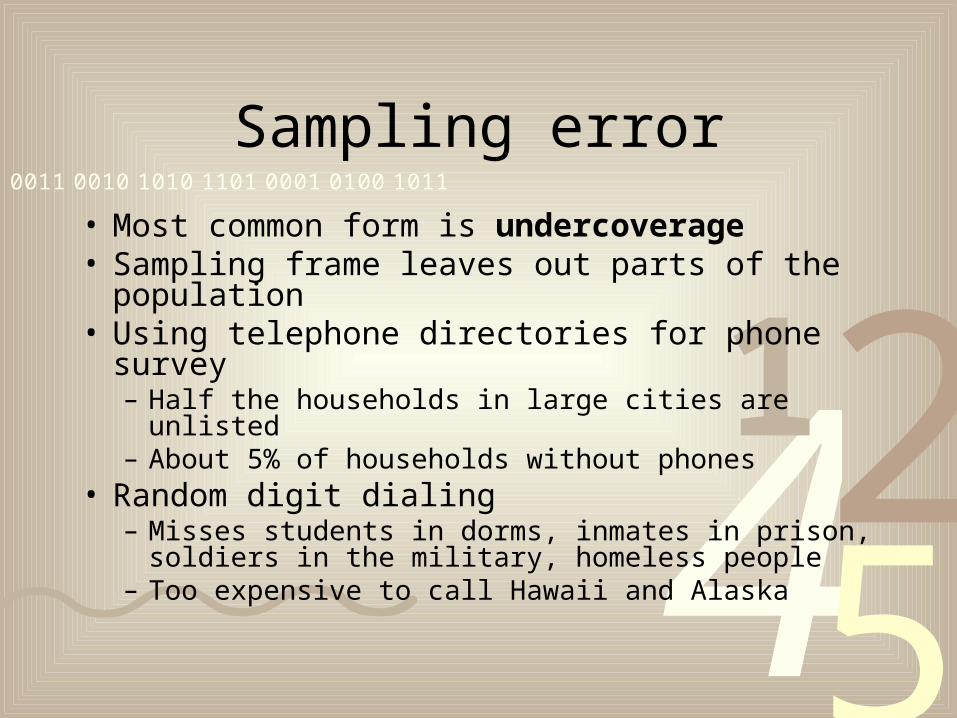
Sampling error
• Most common form is undercoverage• Sampling frame leaves out parts of the population• Using telephone directories for phone survey
– Half the households in large cities are unlisted– About 5% of households without phones
• Random digit dialing– Misses students in dorms, inmates in prison, soldiers in
the military, homeless people– Too expensive to call Hawaii and Alaska
4251
0011 0010 1010 1101 0001 0100 1011
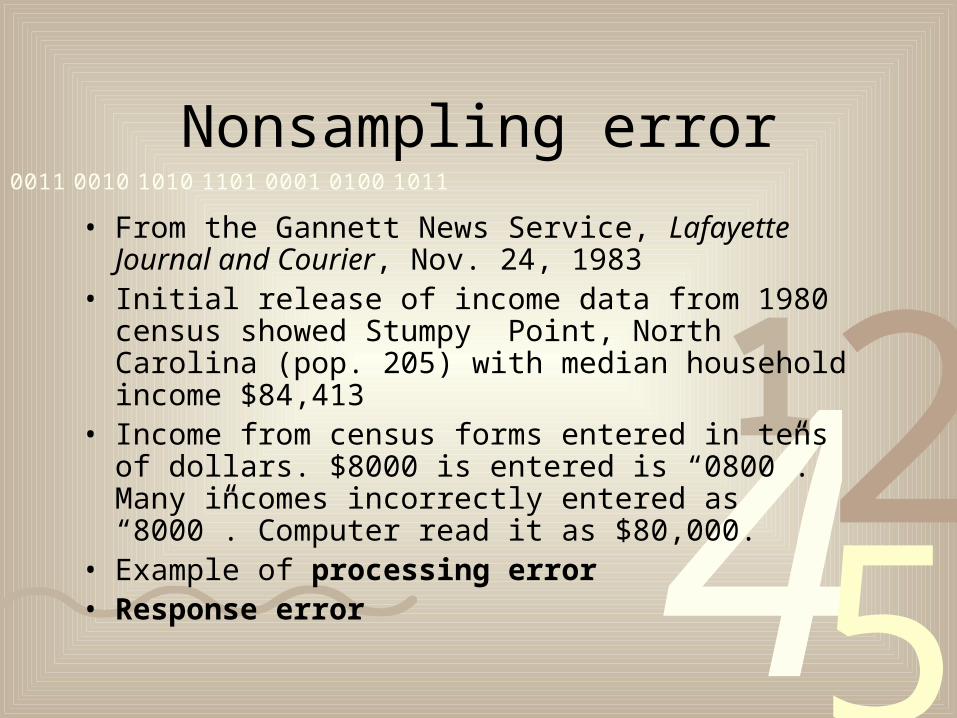
Nonsampling error
• From the Gannett News Service, Lafayette Journal and Courier, Nov. 24, 1983
• Initial release of income data from 1980 census showed Stumpy Point, North Carolina (pop. 205) with median household income $84,413
• Income from census forms entered in tens of dollars. $8000 is entered is “0800”. Many incomes incorrectly entered as “8000”. Computer read it as $80,000.
• Example of processing error• Response error
4251
0011 0010 1010 1101 0001 0100 1011
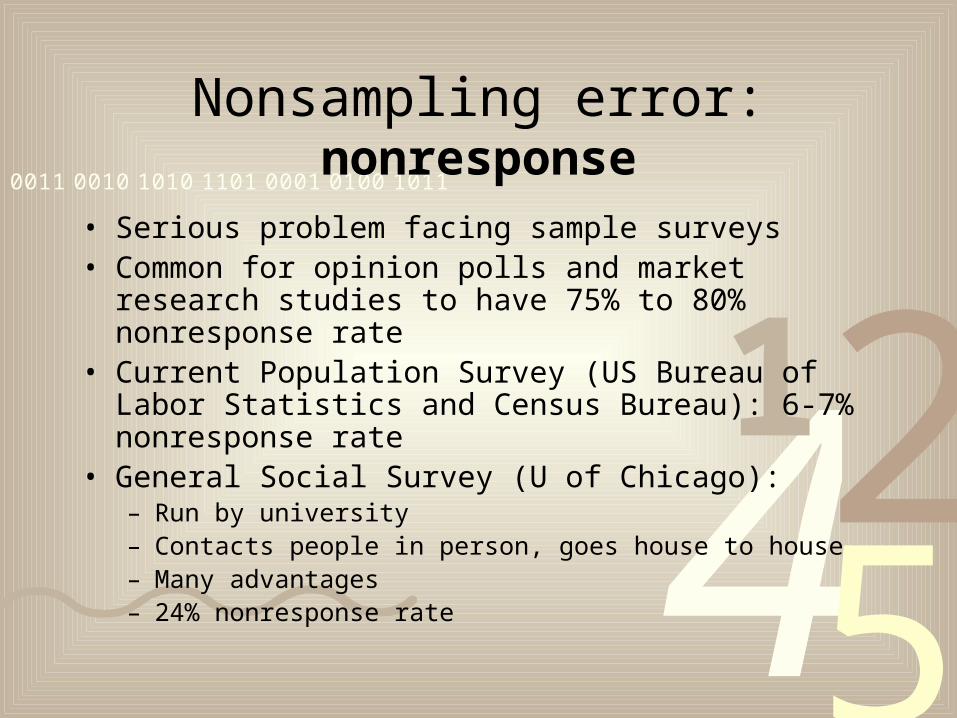
Nonsampling error: nonresponse
• Serious problem facing sample surveys• Common for opinion polls and market research studies to
have 75% to 80% nonresponse rate• Current Population Survey (US Bureau of Labor Statistics
and Census Bureau): 6-7% nonresponse rate• General Social Survey (U of Chicago):
– Run by university– Contacts people in person, goes house to house– Many advantages– 24% nonresponse rate
4251
0011 0010 1010 1101 0001 0100 1011
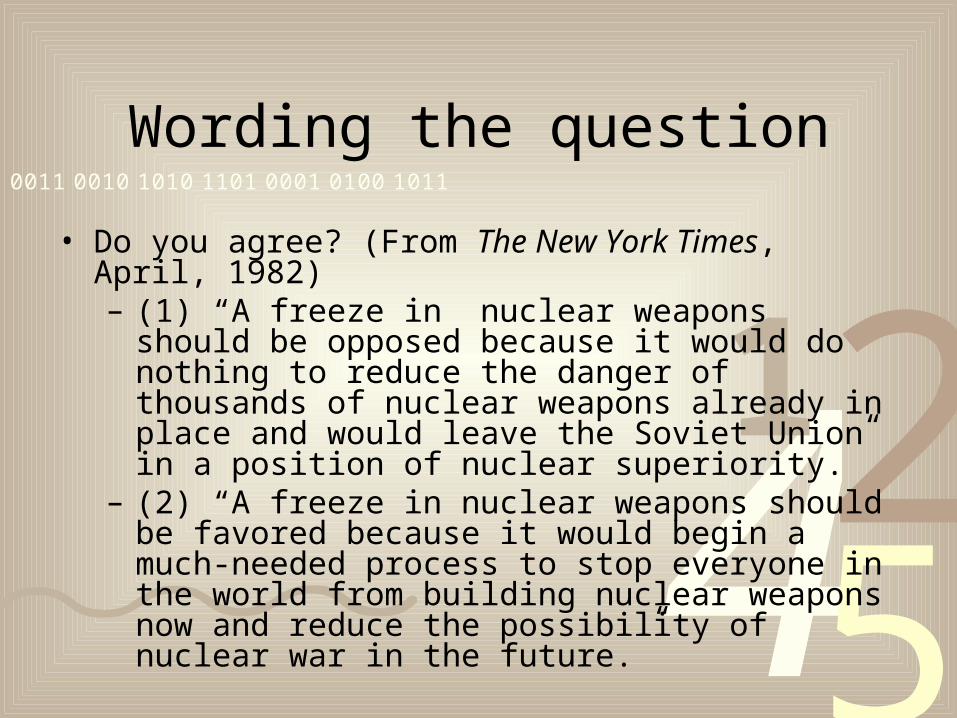
Wording the question
• Do you agree? (From The New York Times, April, 1982)– (1) “A freeze in nuclear weapons should be
opposed because it would do nothing to reduce the danger of thousands of nuclear weapons already in place and would leave the Soviet Union in a position of nuclear superiority.”
– (2) “A freeze in nuclear weapons should be favored because it would begin a much-needed process to stop everyone in the world from building nuclear weapons now and reduce the possibility of nuclear war in the future.”
• Results: 58% agreed with (1). 56% agreed with (2), and 27% agreed with both!
4251
0011 0010 1010 1101 0001 0100 1011
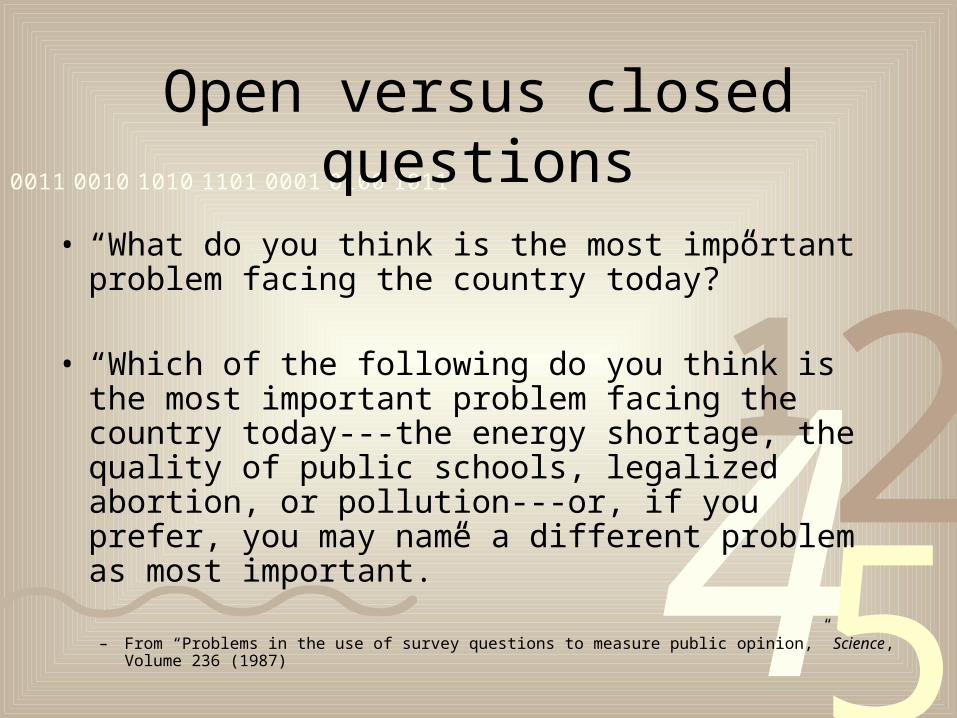
Open versus closed questions
• “What do you think is the most important problem facing the country today?”
• “Which of the following do you think is the most important problem facing the country today---the energy shortage, the quality of public schools, legalized abortion, or pollution---or, if you prefer, you may name a different problem as most important.”
– From “Problems in the use of survey questions to measure public opinion,” Science, Volume 236 (1987)
4251
0011 0010 1010 1101 0001 0100 1011
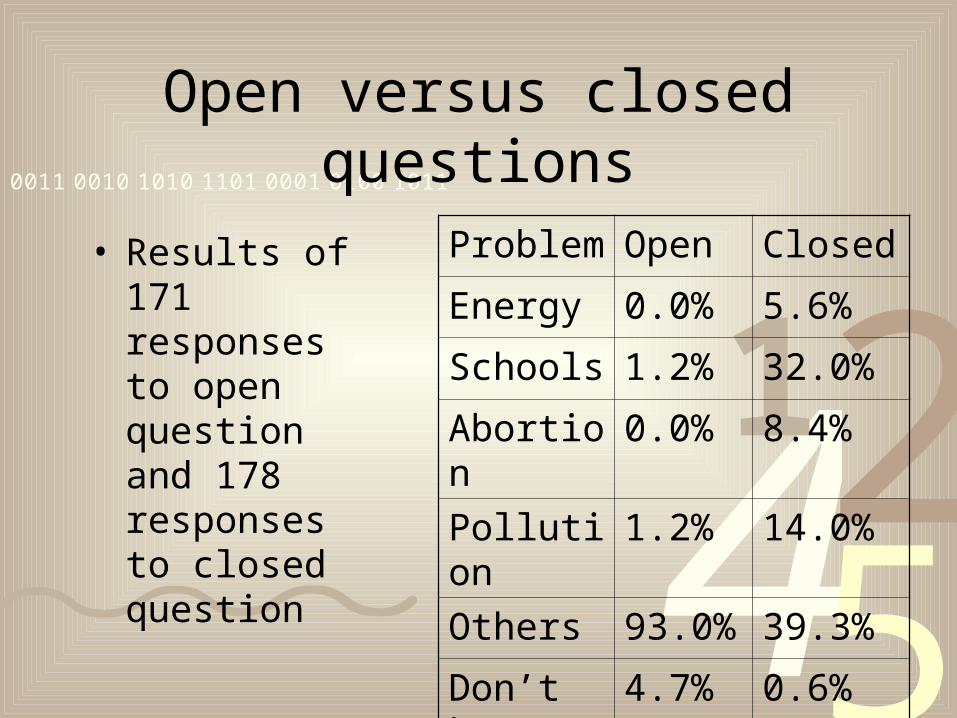
Open versus closed questions
• Results of 171 responses to open question and 178 responses to closed question
Problem Open Closed
Energy 0.0% 5.6%
Schools 1.2% 32.0%
Abortion 0.0% 8.4%
Pollution 1.2% 14.0%
Others 93.0% 39.3%
Don’t know
4.7% 0.6%
4251
0011 0010 1010 1101 0001 0100 1011
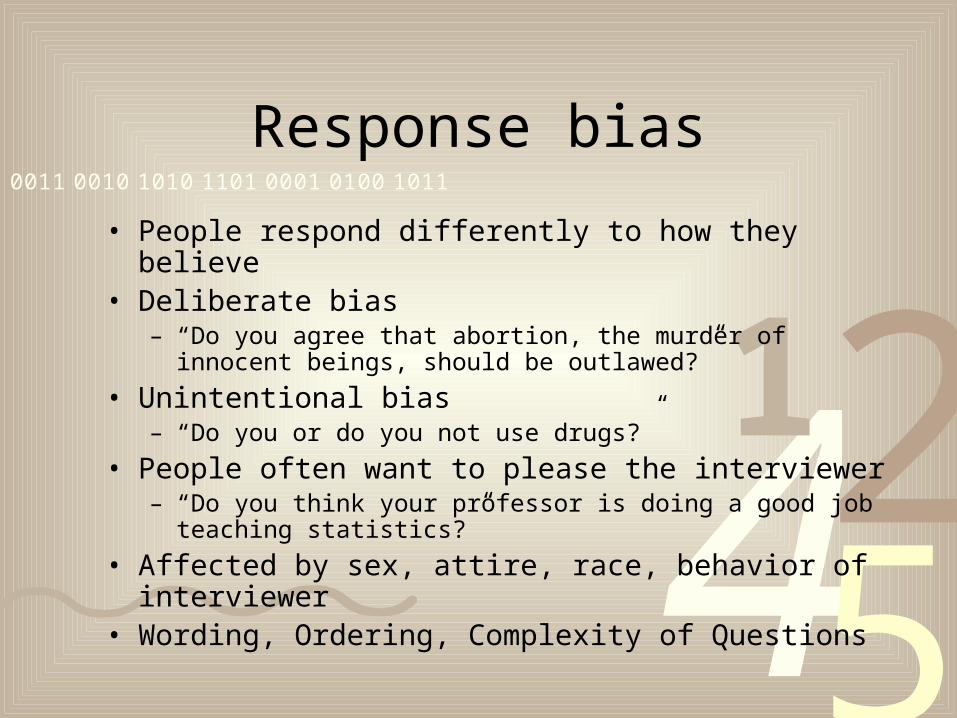
Response bias
• People respond differently to how they believe• Deliberate bias
– “Do you agree that abortion, the murder of innocent beings, should be outlawed?”
• Unintentional bias– “Do you or do you not use drugs?”
• People often want to please the interviewer– “Do you think your professor is doing a good job teaching
statistics?”
• Affected by sex, attire, race, behavior of interviewer• Wording, Ordering, Complexity of Questions
4251
0011 0010 1010 1101 0001 0100 1011
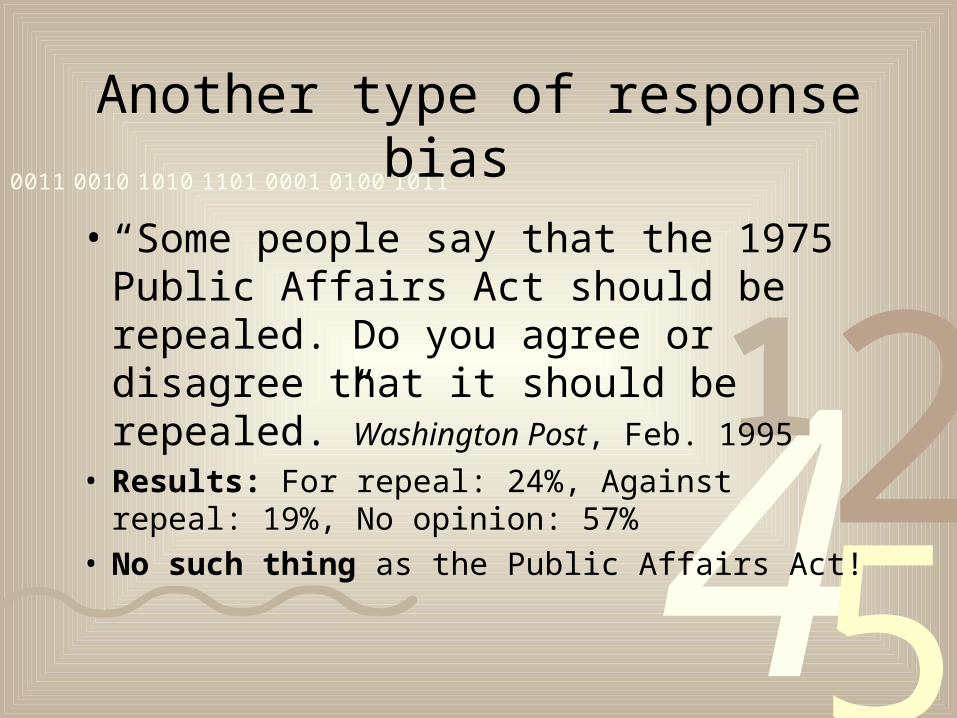
Another type of response bias
• “Some people say that the 1975 Public Affairs Act should be repealed. Do you agree or disagree that it should be repealed.” Washington Post, Feb. 1995
• Results: For repeal: 24%, Against repeal: 19%, No opinion: 57%
• No such thing as the Public Affairs Act!
4251
0011 0010 1010 1101 0001 0100 1011
How to cope with errors: weighting the sample
“The sample first was weighted to take into account unequal probabilities of selection from sampling: Weighting accounts for the number of telephones going into the household, and household size. It then was weighted for age, gender, and education to take care of minor fluctuations in the sample, and align it with the findings of the 2000 Census of the adult population. It is assumed to be representative of all Minnesota households with telephones, within the margin of sampling error.”
– How the Poll was Conducted, Minneapolis Star Tribune
4251
0011 0010 1010 1101 0001 0100 1011
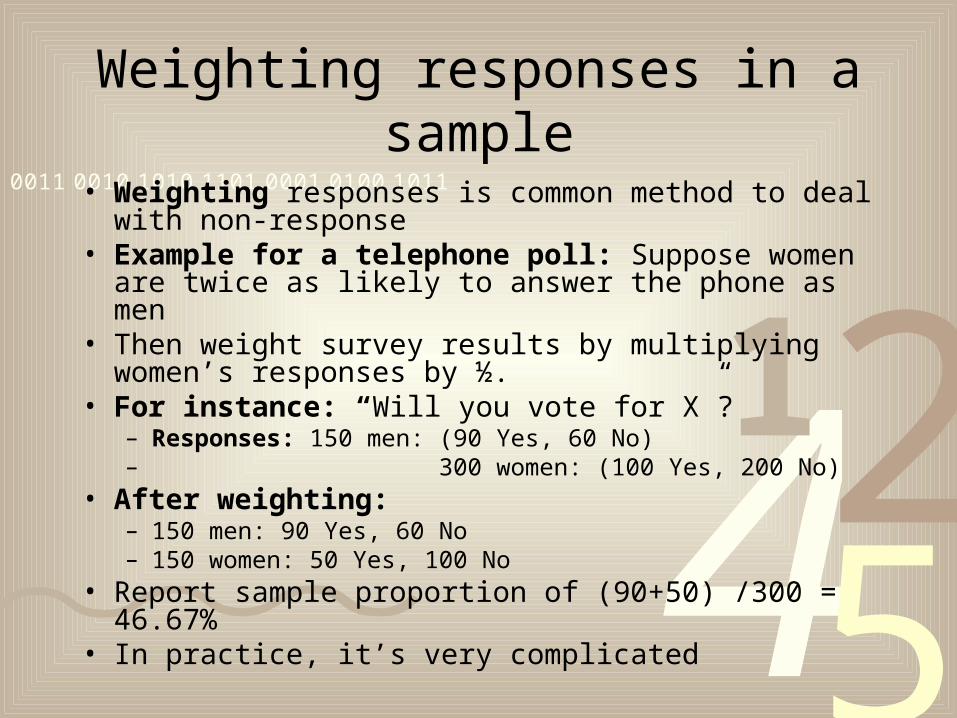
Weighting responses in a sample
• Weighting responses is common method to deal with non-response
• Example for a telephone poll: Suppose women are twice as likely to answer the phone as men
• Then weight survey results by multiplying women’s responses by ½.
• For instance: “Will you vote for X”?– Responses: 150 men: (90 Yes, 60 No)– 300 women: (100 Yes, 200 No)
• After weighting:– 150 men: 90 Yes, 60 No– 150 women: 50 Yes, 100 No
• Report sample proportion of (90+50) /300 = 46.67%• In practice, it’s very complicated
4251
0011 0010 1010 1101 0001 0100 1011
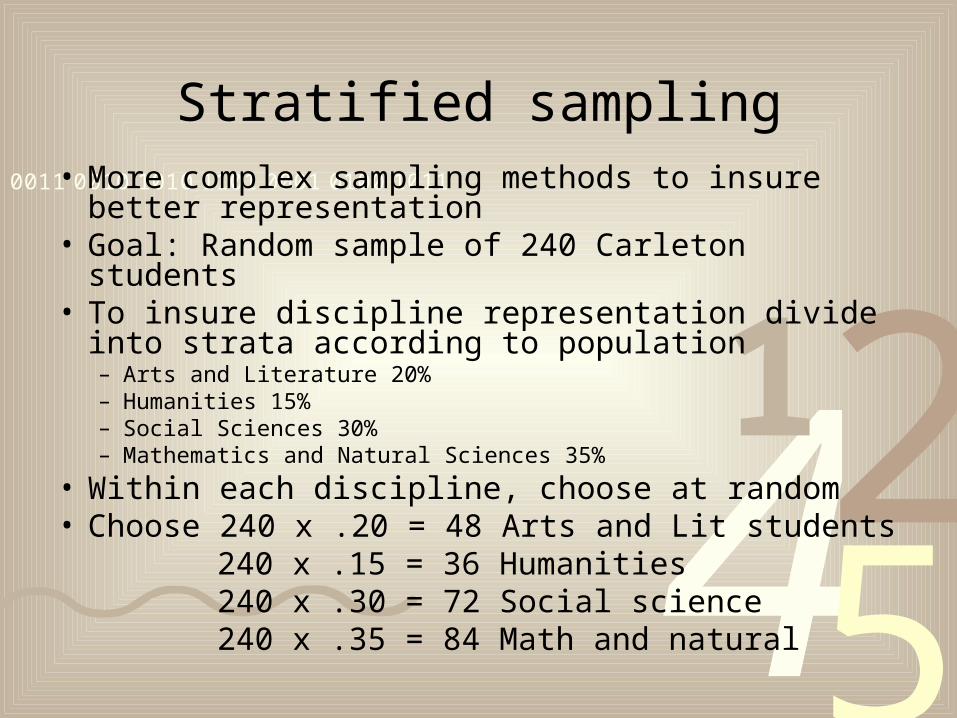
Stratified sampling• More complex sampling methods to insure better
representation• Goal: Random sample of 240 Carleton students• To insure discipline representation divide into strata
according to population– Arts and Literature 20%– Humanities 15%– Social Sciences 30%– Mathematics and Natural Sciences 35%
• Within each discipline, choose at random• Choose 240 x .20 = 48 Arts and Lit students
240 x .15 = 36 Humanities 240 x .30 = 72 Social science 240 x .35 = 84 Math and natural
4251
0011 0010 1010 1101 0001 0100 1011
Stratified sampling
• Advantages: Sample will be representative for the strata; Can gain precision of estimate
• Disadvantages: Logistically difficult; must know about the population; May not be possible
• Note that technically a stratified sample is not a simple random sample
• Every possible group of 240 students is not equally likely to be selected
4251
0011 0010 1010 1101 0001 0100 1011
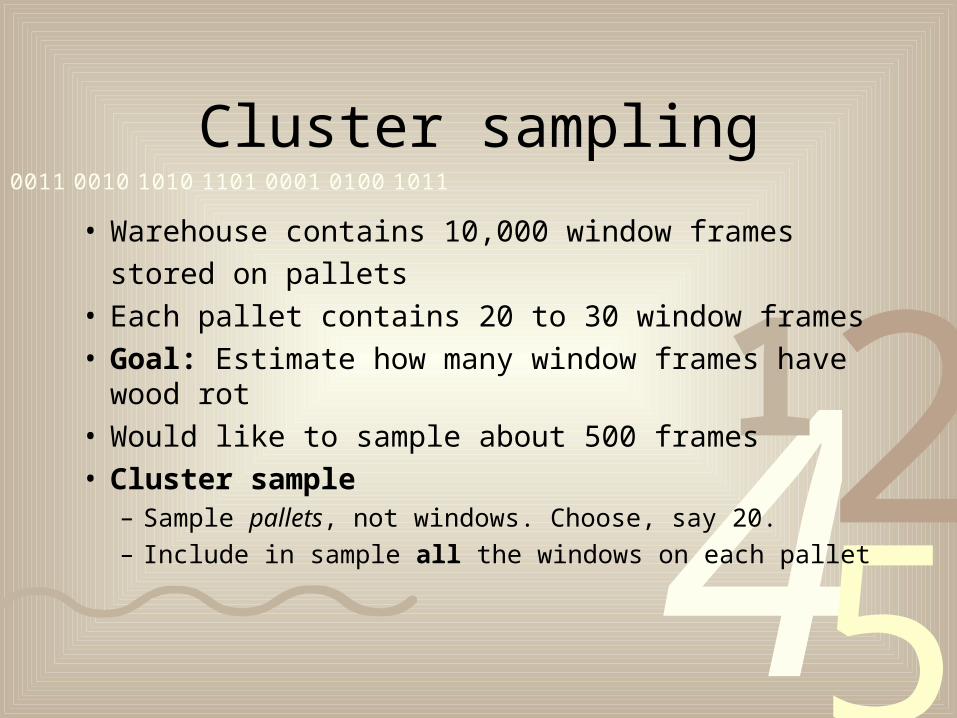
Cluster sampling
• Warehouse contains 10,000 window frames
stored on pallets• Each pallet contains 20 to 30 window frames• Goal: Estimate how many window frames have
wood rot• Would like to sample about 500 frames• Cluster sample
– Sample pallets, not windows. Choose, say 20.
– Include in sample all the windows on each pallet
4251
0011 0010 1010 1101 0001 0100 1011
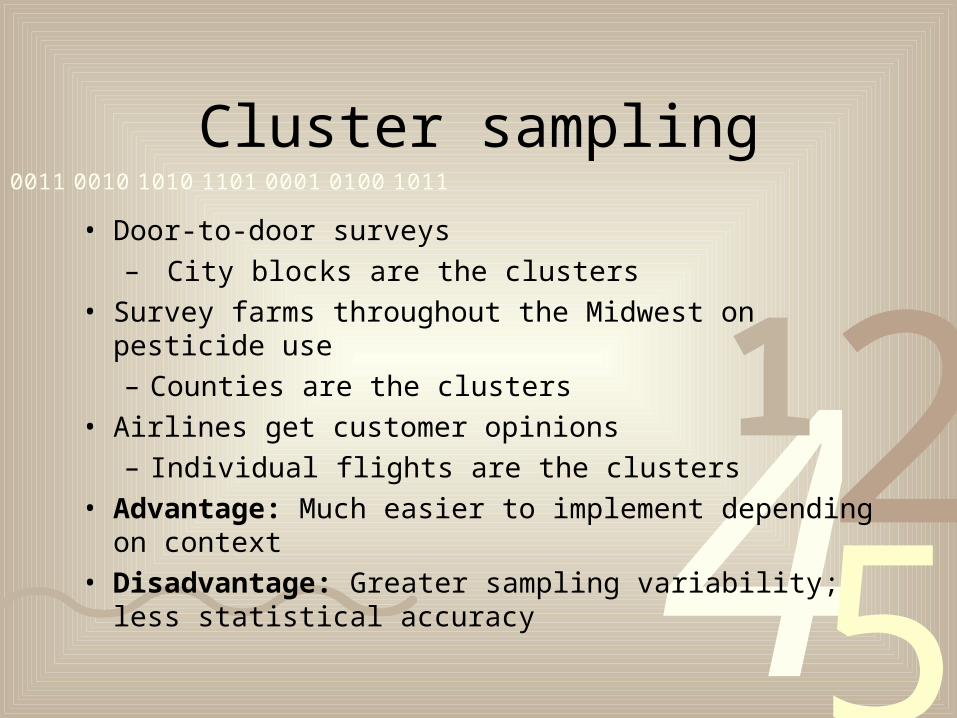
Cluster sampling
• Door-to-door surveys
– City blocks are the clusters
• Survey farms throughout the Midwest on pesticide use
– Counties are the clusters
• Airlines get customer opinions
– Individual flights are the clusters
• Advantage: Much easier to implement depending on context
• Disadvantage: Greater sampling variability; less statistical accuracy
4251
0011 0010 1010 1101 0001 0100 1011
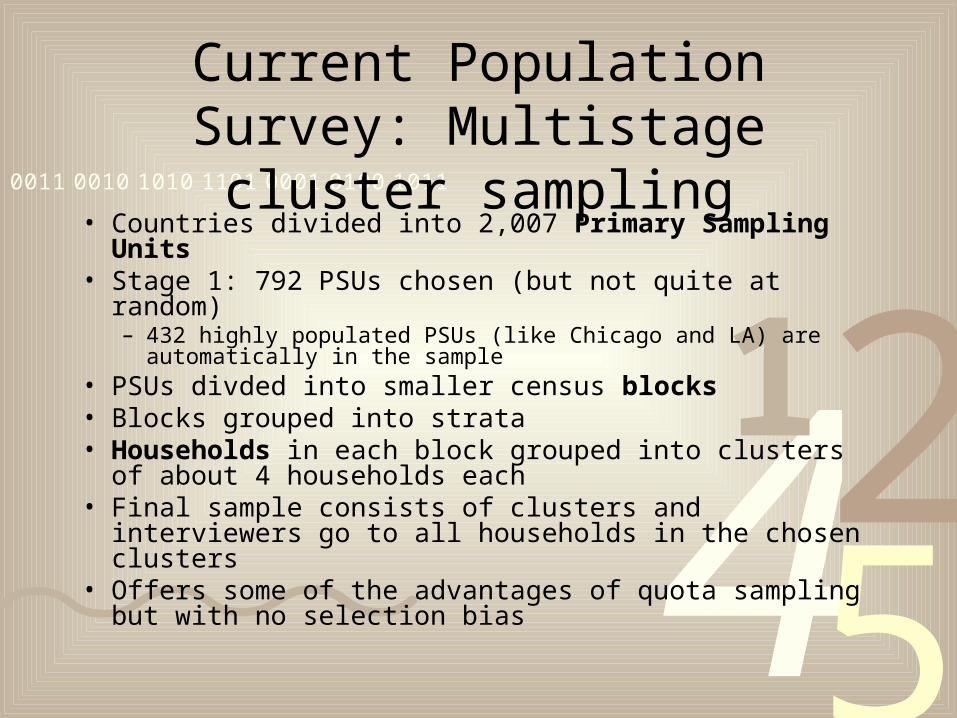
Current Population Survey: Multistage cluster sampling
• Countries divided into 2,007 Primary Sampling Units• Stage 1: 792 PSUs chosen (but not quite at random)
– 432 highly populated PSUs (like Chicago and LA) are automatically in the sample
• PSUs divded into smaller census blocks• Blocks grouped into strata• Households in each block grouped into clusters of about 4
households each• Final sample consists of clusters and interviewers go to all
households in the chosen clusters• Offers some of the advantages of quota sampling but with
no selection bias
4251
0011 0010 1010 1101 0001 0100 1011
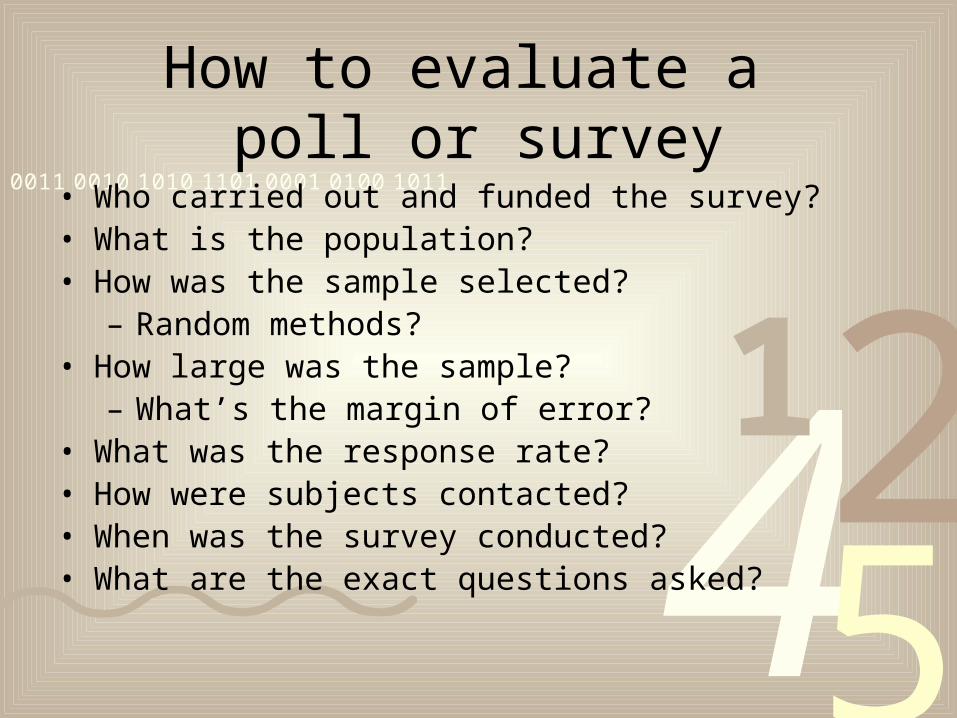
How to evaluate a poll or survey
• Who carried out and funded the survey?• What is the population?• How was the sample selected?
– Random methods?• How large was the sample?
– What’s the margin of error?• What was the response rate?• How were subjects contacted?• When was the survey conducted?• What are the exact questions asked?