Embed Size (px)
Citation preview

Sample Smart Ground Report.doc 1 of 39 4/2/2008
Smart Ground Test Report
Springfield Energy - Springfield Power Station
Grounding System Evaluation
Prepared for
*C.M. Burns *Springfield Energy – Springfield Power Station
U.S.A.
Prepared by
A. P. Sakis Meliopoulos and
G. J. Cokkinides
June 25, 2007
*The client name and location are fictitious to protect proprietary information. As a result, the information contained in this sample report is for illustrative purposes only and is intended to provide a representation of the types of information that are typically included in a Smart Ground Report. It is not intended as a complete report. Portions of the report are abbreviated as well as a number of sections were omitted in their entirety.

Lightning Eliminators & Consultants, Inc. - 2-
Sample Smart Ground Report.doc 2 of 39 4/2/2008
Table of Contents
Table of Contents _________________________________________________________________ 1
1. Executive Summary _____________________________________________________________ 2
2. System Network Model __________________________________________________________ 8 2.1 System Network Model _________________________________________________________________ 8 2.2 Grounding Model _____________________________________________________________________ 9 2.3 Fault Current Analysis ________________________________________________________________ 11
3. Soil Resistivity Measurements ____________________________________________________ 20
4. Ground System Impedance Measurements _________________________________________ 23
5. Point to Point Ground Impedance Measurements ___________________________________ 25
6. Field Observations _____________________________________________________________ 34
7. Evaluation of Present Grounding System – Safety Assessment _________________________ 40 7.1 Safety Assessment at Power Plant Area ___________________________________________________ 40 7.2 Safety Assessment at Switchyard ________________________________________________________ 54 7.3 Transfer Voltages ____________________________________________________________________ 65
8. Recommendations ______________________________________________________________ 70 8.1 Ground Conductor Size Selection ________________________________________________________ 70 8.2 Top Layer Material ___________________________________________________________________ 71 8.3 Grounding System Upgrades ___________________________________________________________ 72 8.4 Bill of Materials _____________________________________________________________________ 75
9. Evaluation of Recommendations – Safety Assessment ________________________________ 76 9.1 Safety Assessment at Power Plant Area ___________________________________________________ 76 9.2 Safety Assessment at Switchyard ________________________________________________________ 89 9.3 Transfer Voltages ___________________________________________________________________ 100
Appendix A: _______________________________________________________________ 105
Description of System Model __________________________________________________ 105
Appendix B: Soil Resistivity Data ______________________________________________ 128
Appendix C: Ground Impedance Measurements __________________________________ 138
Appendix D: Point to Point Ground Impedance Measurements ______________________ 150
Appendix E: Photographs ____________________________________________________ 224
Attachment 1 ______________________________________________________________ 273
Lightning Eliminators & Consultants, Inc. - 3-
Sample Smart Ground Report.doc 3 of 39 4/2/2008
Grounding System Testing and Analysis of the Springfield Power Station
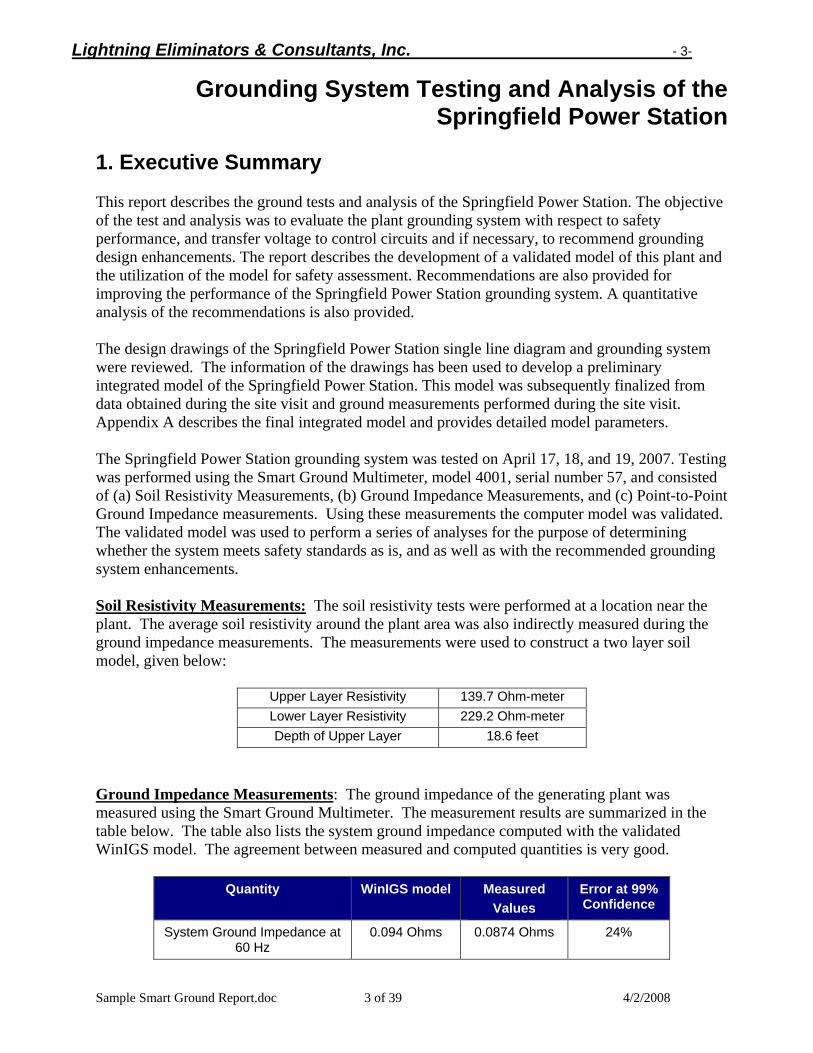
1. Executive Summary This report describes the ground tests and analysis of the Springfield Power Station. The objective of the test and analysis was to evaluate the plant grounding system with respect to safety performance, and transfer voltage to control circuits and if necessary, to recommend grounding design enhancements. The report describes the development of a validated model of this plant and the utilization of the model for safety assessment. Recommendations are also provided for improving the performance of the Springfield Power Station grounding system. A quantitative analysis of the recommendations is also provided. The design drawings of the Springfield Power Station single line diagram and grounding system were reviewed. The information of the drawings has been used to develop a preliminary integrated model of the Springfield Power Station. This model was subsequently finalized from data obtained during the site visit and ground measurements performed during the site visit. Appendix A describes the final integrated model and provides detailed model parameters. The Springfield Power Station grounding system was tested on April 17, 18, and 19, 2007. Testing was performed using the Smart Ground Multimeter, model 4001, serial number 57, and consisted of (a) Soil Resistivity Measurements, (b) Ground Impedance Measurements, and (c) Point-to-Point Ground Impedance measurements. Using these measurements the computer model was validated. The validated model was used to perform a series of analyses for the purpose of determining whether the system meets safety standards as is, and as well as with the recommended grounding system enhancements. Soil Resistivity Measurements: The soil resistivity tests were performed at a location near the plant. The average soil resistivity around the plant area was also indirectly measured during the ground impedance measurements. The measurements were used to construct a two layer soil model, given below:
Upper Layer Resistivity 139.7 Ohm-meter Lower Layer Resistivity 229.2 Ohm-meter Depth of Upper Layer 18.6 feet
Ground Impedance Measurements: The ground impedance of the generating plant was measured using the Smart Ground Multimeter. The measurement results are summarized in the table below. The table also lists the system ground impedance computed with the validated WinIGS model. The agreement between measured and computed quantities is very good.
Quantity WinIGS model Measured Values
Error at 99% Confidence
System Ground Impedance at 60 Hz
0.094 Ohms 0.0874 Ohms 24%

Lightning Eliminators & Consultants, Inc. - 4-
Sample Smart Ground Report.doc 4 of 39 4/2/2008
Point to Point Ground Measurements: Point to point measurements were taken to determine the status of the plant grounding system. A total of 65 point-to-point ground impedance measurements were performed. These tests are reported in Section 5 and in Appendix D. The measured point to point ground impedance measurements were compared to the computed point to point ground impedances. A summary of the measured and computed values is given in Table 5.1 in section 5. The agreement between the measured and computed values is good except in some cases that are discussed below. (An abbreviated table on page 5 is included for the purpose of document.) The following observations were made by comparing the measured and computed results:
• All of the tested ground connections within the switchyard area are bonded together. In most locations, the measured impedances are close to the values computed using the WinIGS grounding model.
• The impedance between the switchyard fence posts is low, but the impedance between the
fence and the switchyard grounding system is substantially higher that the computed value. This suggests that the fence ground may not be bonded to the switchyard ground or the bonding is very poor. (See measurements on Figures D-3, D-14, and D-63, Appendix D).
• The impedance between the 161 kV line poles near the generator building and the
generator building grounding system is substantially higher than the computed values. This suggests that the bonding between these points is made only via the overhead shield wires. (See measurements on Figures D-34, D-35, and D-36, Appendix D).
• The impedance between the substation grounding system and the microwave tower ground
is considerably higher than the computed value (See measurements on Figures D-53, D-54, and D-55, Appendix D).
• The impedance between the substation grounding system and the conveyor level shift
ground is considerably higher than the computed value (See measurement on Figure D-56, Appendix D).
• The impedance between the switchyard and the generator building grounding system is
high. As a matter of fact it is substantially higher than the computed value assuming that the only bonding between the two grounding systems is a single 4/0 copper cable running along the control cable conduits (See measurement on Figure D-62, Appendix D).
• The impedance between the switchyard ground and the 161 kV startup and step-up line
poles nearest to the switchyard is high. This suggests that the bonding between these points is made only via the overhead shield wires. In fact at one of the downlead conductors the impedance was measured to be approximately 13 ohms which indicates that the connector between the shield wire and the downlead conductor has failed. (See measurements on Figures D-64, D-65, D-66, D-67, and D-68, Appendix D).

Lightning Eliminators & Consultants, Inc. - 5-
Sample Smart Ground Report.doc 5 of 39 4/2/2008
Point to Point Measurements Fig. #
Location
Computed Resistance
(mΩ)
Measured Resistance
(mΩ)
Measured Impedance
(mΩ) 3 P01 Fence Bonding 21.79 134.33 66.074 P02 N.W. side, 345kV, Support St 6.85 9.329 18.88 10 P08 CCVT 345 T6 4.04 8.565 17.67 11 P09 Breaker, CB162, B-Phase 4.74 8.878 18.01 12 P10 Line Trap 5.53 12.13 26.36 13 P11 Wire Vault, 133 5.45 58.04 120.3 14 P12 S.W. Corner, Fence, 161kV Side 10.32 134.56 65.30 53 P48 S Yard Fence to Microwave Twr
Dwn Cndtr 37.58 323.4 355.5
54 P49 S Yard Fence to Microwave Twr Bldg
37.60 323.3 355.3
55 P50 S Yard Fence to Microwave Twr Fence
39.71 329.0 361.3
56 P51 S Yard Fence to Conveyor Level Shift Tower
38.91 216.5 308.4
57 P53 S Yard Fence to Sub A-Frame Structure
55.33 46.01 88.14
58 P53 Conv. Tower to Sub Bus Support 55.33 187.2 273.8 Grounding System Safety Evaluation: The measurements, additional data and field observations were used to complete and validate the Springfield Power Station computer model. Using the validated model, the plant grounding system was analyzed to determine whether it meets the safety requirements of the IEEE Standard 80, 2000 edition. Specifically, a comprehensive safety analysis was performed at two locations: (a) Generating Plant area, and (b) Switchyard. The safety evaluation is based on the analysis of the plant grounding system performance under worst fault conditions. The analysis was performed using the validated computer model of the Springfield Power Station, and nearby transmission lines. Using the computer model, a comprehensive fault analysis was performed to determine the fault that causes maximum ground potential rise at locations (a) and (b). A detailed description of the safety analysis is presented in Section 7. The analysis results are also summarized in the Table below.
Quantity Generating Plant Switchyard Fault Type Double Line to Ground Double Line to Ground Fault Location 161 kV Bus 161 kV Bus Ground Potential Rise 387 Volts 1639 Volts Fault Current 20.89 kA, 19.78 kA 20.89 / 19.78 kA Earth Current 2.597 kA 7.484 kA X/R Ratio at Fault Location 7.73 7.73 Current division ratio 12.43% 35.82 % Allowable Touch Voltage (with for 4” Gravel / Native Soil)
170 V 488 V
Maximum Touch Voltage in Substation Area 116 V 625 V Allowable Step Voltage, for Native Soil Top Layer 199 V 199 V Maximum Step Voltage 23 V 130 V
The safety analysis indicated that the generating plant grounding system meets the safety requirements of IEEE Std 80. However, the switchyard violates the IEEE Std 80 requirements by a 28% margin.

Lightning Eliminators & Consultants, Inc. - 6-
Sample Smart Ground Report.doc 6 of 39 4/2/2008
Transfer Voltage Evaluation: An analysis was performed to evaluate the voltage transferred to control circuits located in underground conduits running from the switchyard to the generating plant. The voltage transferred to control circuits during faults and other transients is caused by a combination of (a) ground potential differences between the switchyard ground and the generating plant ground, (b) induced voltages due to currents flowing in the two 161 kV transmission lines connecting the generating plant and the switchyard, and (c) induced voltages due to current flowing in the ground conductor installed along the conduits of the communication and control circuits. It appears that presently this ground conductor is the only substantial conductor connecting the two grounding systems, and thus potential differences in the two grounding systems may result in a high current flow through this conductor. Since this conductor is in close proximity to the control circuits, the induced voltages to the control circuits can be significant.
In order to evaluate the level of transfer voltages to the control circuits a detailed representation of the power circuits as well as a typical control circuit connecting the power plant with the switchyard was included in the integrated computer model of the system. The model and the detailed analysis results are is described in section 7.3. Using this model, a transfer voltage analysis was performed for the worst fault condition, i.e. the fault that causes the highest level of induced voltage on the communication circuits. The analysis results include the common mode and differential mode terminal voltages on the control circuit on the generating plant side, the ground potential difference between generating plant and switchyard grounding systems, and the current flowing through the conduit ground conductor. The results are summarized in the Table below.
Common Mode Voltages 893 V / 927 V Differential Mode Voltage 37 V
Ground Potential Difference 926 V Ground Conductor Current 2.22 kA
Recommendations: In order to make the switchyard ground system IEEE Std 80 compliant and to reduce the impact of the induced voltages and ground potential differences on the communication and control circuits it is recommended that the bonding between the switchyard and generating plant grounds is enhanced. The bonding shall be accomplished as follows:
• Install one bare 4/0 Copper conductor between the switchyard and generating plant grounding systems along the path of the 161 kV circuits.
• Install one additional 4/0 copper wire along the control circuits and on opposite side of the existing 4/0 copper ground conductor.
• Install one bare 500 mcm Copper conductor between the switchyard and generating plant
grounding systems along the shortest possible straight path. The recommended path shown in Figure 8.1 is between the north east corner of the switchyard and the generator building.
• Repair the grounding and bonding connections especially around the area of the chimney stack. See also relevant comments included in section 6 (Field Observations).
Lightning Eliminators & Consultants, Inc. - 7-
Sample Smart Ground Report.doc 7 of 39 4/2/2008
• Install two 4/0 copper conductors between the switchyard grounding system and the communication tower as the present drawing shows (and the testing revealed that these bonds may not be there). See also relevant comments included in section 6 (Field Observations) and Appendix D (point to point ground measurements).
• Install two additional ground conductors in the switchyard as it is shown in the design drawings in Attachment 1.
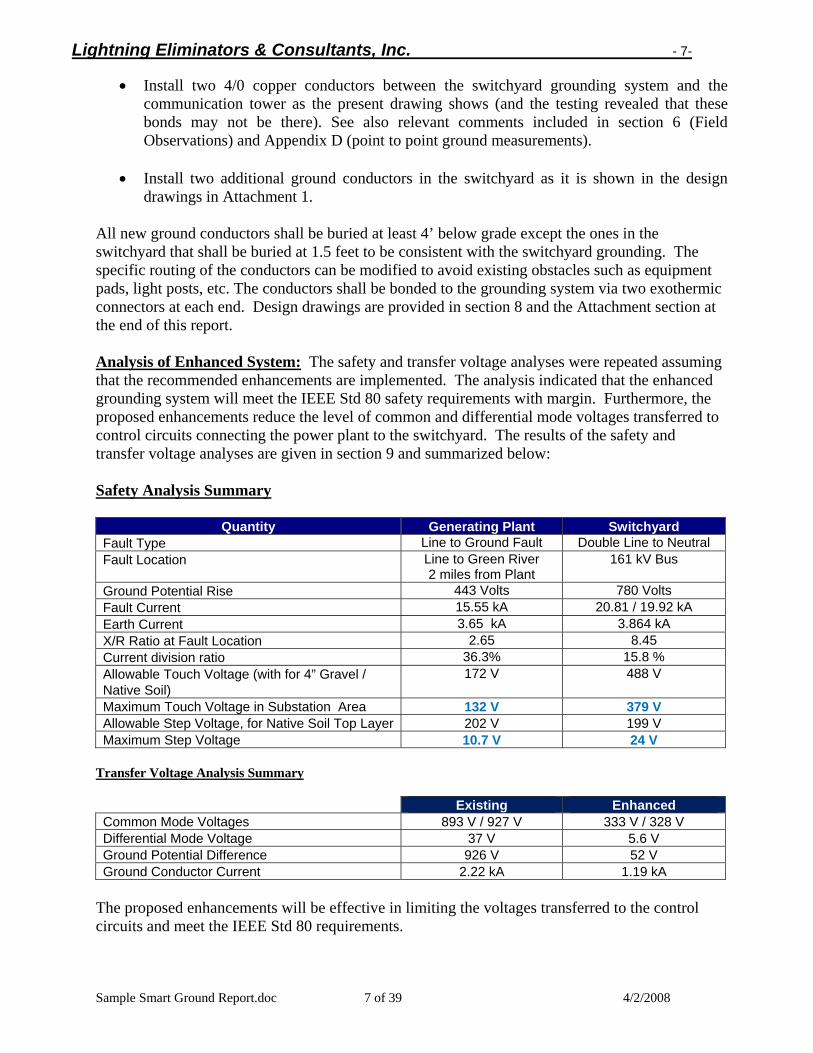
All new ground conductors shall be buried at least 4’ below grade except the ones in the switchyard that shall be buried at 1.5 feet to be consistent with the switchyard grounding. The specific routing of the conductors can be modified to avoid existing obstacles such as equipment pads, light posts, etc. The conductors shall be bonded to the grounding system via two exothermic connectors at each end. Design drawings are provided in section 8 and the Attachment section at the end of this report. Analysis of Enhanced System: The safety and transfer voltage analyses were repeated assuming that the recommended enhancements are implemented. The analysis indicated that the enhanced grounding system will meet the IEEE Std 80 safety requirements with margin. Furthermore, the proposed enhancements reduce the level of common and differential mode voltages transferred to control circuits connecting the power plant to the switchyard. The results of the safety and transfer voltage analyses are given in section 9 and summarized below: Safety Analysis Summary
Quantity Generating Plant Switchyard Fault Type Line to Ground Fault Double Line to Neutral Fault Location Line to Green River
2 miles from Plant 161 kV Bus
Ground Potential Rise 443 Volts 780 Volts Fault Current 15.55 kA 20.81 / 19.92 kA Earth Current 3.65 kA 3.864 kA X/R Ratio at Fault Location 2.65 8.45 Current division ratio 36.3% 15.8 % Allowable Touch Voltage (with for 4” Gravel / Native Soil)
172 V 488 V
Maximum Touch Voltage in Substation Area 132 V 379 V Allowable Step Voltage, for Native Soil Top Layer 202 V 199 V Maximum Step Voltage 10.7 V 24 V
Transfer Voltage Analysis Summary Existing Enhanced Common Mode Voltages 893 V / 927 V 333 V / 328 V Differential Mode Voltage 37 V 5.6 V Ground Potential Difference 926 V 52 V Ground Conductor Current 2.22 kA 1.19 kA
The proposed enhancements will be effective in limiting the voltages transferred to the control circuits and meet the IEEE Std 80 requirements.

Lightning Eliminators & Consultants, Inc. - 8-
Sample Smart Ground Report.doc 8 of 39 4/2/2008
2. System Network Model This section summarizes the integrated model of the Springfield Energy Station and the local Switchyard. The initial model was developed from a number of drawings supplied by the sponsor. During the site visit data were collected and were used to update the model as well as ground measurements. The field collected data are photographs of nameplates and ground construction and observations acquired during the site visit. The ground measurements were utilized to validate the model. The details of the final integrated model are given in Appendix A. 2.1 System Network Model The single line diagram of the network model is illustrated in Figures 2.1, 2.2, and 2.3 (overall integrated network). Note that the model consists of a detailed model of the Springfield Energy Station (Figure 2.3), a detailed model of the 161/345 kV switchyard (Figure 2.2), and a model of the 161 and 345 kV transmission lines terminating at the switchyard (Figure 2.1). The power system beyond these transmission lines is represented by equivalent sources, Substations A & B. The equivalent source parameters ware adjusted in order to matching the provided short circuit analysis results (see section 2.3). The parameters of all major components of the system model are given in Appendix A.
G
G
G
PTS
PTS
1 2
G
PT
S
PT
S
PT
S
Switchyard
Power Plant
COLEMAN
S345-04
GREENRIV
S161-07REID
S345-01
S345-6
S161-01S13-01
S345-03
S345-02
S345-05
S345-07
S161-02
S13-02
S161-03 S161-05
S161-04
S161-06
S345-06 S161-08 S161-09
GEN161-1 GEN22-1
GEN6-6
GEN161-2
GEN22-2
GEN6-5
GEN22-3 GEN6-1
GEN6-2
GEN22-4 GEN6-3
GEN6-4
S-CTRL G-CTRL
Figure 2.1 Single Line Diagram of the Overall Electric Power System
Lightning Eliminators & Consultants, Inc. - 9-
Sample Smart Ground Report.doc 9 of 39 4/2/2008
P-S OhmsPer UnitPer Cent
3-Phase Autrotransformer with Tertiary AcceptCancel
AutoTransformer #1
Primary Bus NameS345-6
S161-01
1
DeltaWye
kV Rating (L-L)
S13-01
R X Base (MVA)
(Per Cent)
P-T
S-T
Nominal Core Loss :
Nominal Magnetizing Current :
Ap
P
Winding LeakageWinding Impedances (Ohms)
S
T
Short Circuit Test Data
Primary Zero
R XSequence Parameters (PU)
Second. ZeroGround Zero
Resistance Reactance
Display Circuit
Core Parameters (PU)
Base (MVA) :
Circuit Number
Pos/Neg
0.0099188 37.319
0.0075940 28.572
0.00066768 1.2360
0.003 5.98
0.005 5.47
0.005 6.31
180.0
38.0
38.0
0.005
0.005
180.00
13.8
161.0
345.0
0.0000097110.000020480.0005409
0.000028950.0099970.049800.2488
0.05980
BpCpNp
AsBsCs
AtBtCt
Secondary Bus Name
Tertiary Bus Name
kV Rating (L-L)
kV Rating (L-L)
WinIGS - Form: IGS_M106 - Copyright © A. P. Meliopoulos 1998-2007
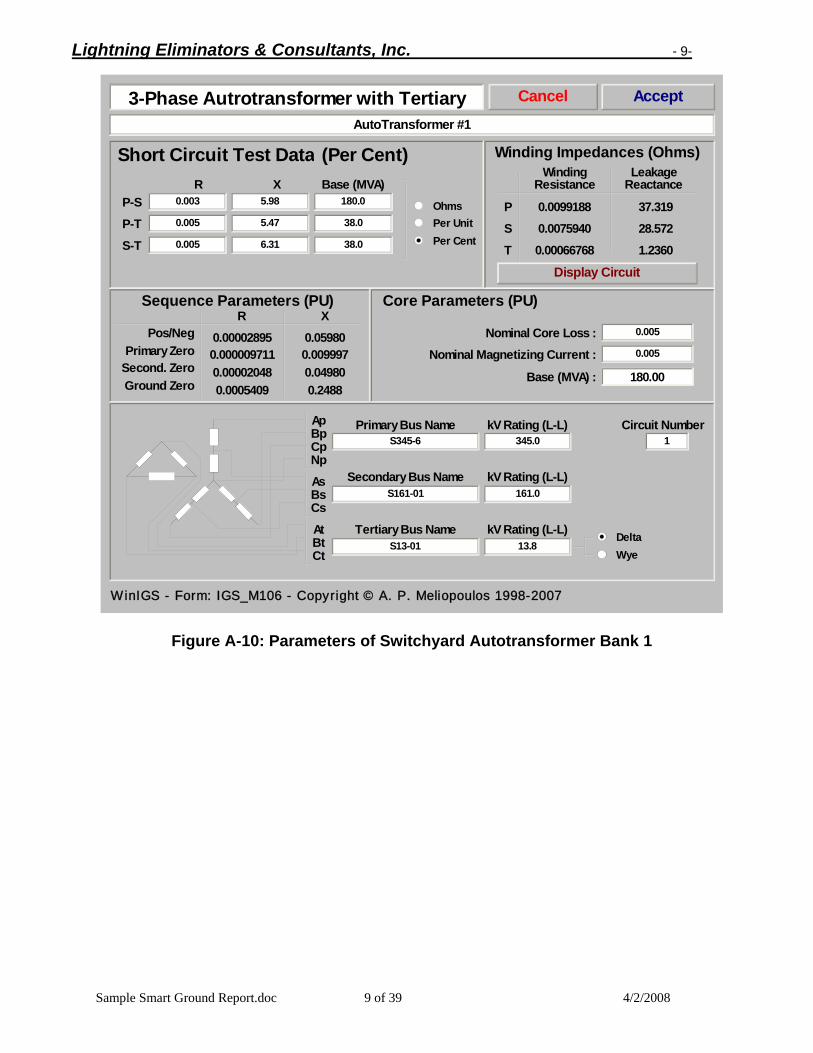
Figure A-10: Parameters of Switchyard Autotransformer Bank 1

Lightning Eliminators & Consultants, Inc. - 10-
Sample Smart Ground Report.doc 10 of 39 4/2/2008
0.9P-S 9.1
0.9 9.1
1.7 17.2
OhmsPer UnitPer Cent
3-Phase 3-WindingTransformer AcceptCancel
Station Service Transformer #1
PrimaryGEN22-3 Circuit Number
1kV (L-L)22.8
Delta Wye
R X30.0
30.0
30.0
Base (MVA)(Per Cent)
P-T
S-T
0.001Nominal Core Loss :0.001Nominal Magnetizing Current :
30.00
P
Winding LeakageWinding Impedances (Ohms)
ST
Primary Zero :
R XSequence Parameters (PU)
Second. Zero :Ground Zero :
Resistance Reactance
Display Equivalent Circuit
Core Parameters (PU)
0.0044970.0045050.01251
Base (MVA) :
Pos/Neg : 0.008998
Short Circuit Test Data
SecondaryGEN6-1
kV (L-L)6.9
Delta Wye
TertiaryGEN6-2
kV (L-L)6.9
Delta Wye
StandardAlternate
A
B
C PhaseA
B
C
B
C
A
Connection
0.077976 0.936610.0071415 0.0857810.059512 0.71547
0.0050040.085990.08598
0.09100
Program WinIGS - Form IGS_M105
Figure A-13: Parameters of Station Service Transformer 1

Lightning Eliminators & Consultants, Inc. - 11-
Sample Smart Ground Report.doc 11 of 39 4/2/2008
Conductors
Mutually Coupled Multiphase Lines AcceptCancel
161 kV Circuits + Control Circuit
0.6467Line Length (miles) 35.0Soil Resistivity (ohm-meters) Circuit Number 1
FromNode ToNode Circuit Cond Size Sub Sep Gnd X(ft) Y(ft)123456789
10111213
S161-08_A GEN161-1_A CKT1 ACSR FALCON 2 12.00 INO 0.000 55.500S161-08_B GEN161-1_B CKT1 ACSR FALCON 2 12.00 INO -14.000 55.500S161-08_C GEN161-1_C CKT1 ACSR FALCON 2 12.00 INO 14.000 55.500S161-08_N GEN161-1_N CKT1 HS 1/2HS 1 0.00 IYES -7.750 67.750S161-08_N GEN161-1_N CKT1 HS 1/2HS 1 0.00 IYES 7.750 67.750S161-09_A GEN161-2_A CKT2 ACSR DRAKE 1 0.00 INO 75.000 55.500S161-09_B GEN161-2_B CKT2 ACSR DRAKE 1 0.00 INO 61.000 55.500S161-09_C GEN161-2_C CKT2 ACSR DRAKE 1 0.00 INO 89.000 55.500S161-09_N GEN161-2_N CKT2 HS 1/2HS 1 0.00 IYES 67.250 67.750S161-09_N GEN161-2_N CKT2 HS 1/2HS 1 0.00 IYES 82.750 67.750S-CTRL_N G-CTRL_N CKT3 COPPER 4/0 1 0.00 NO 300.0 -3.0S-CTRL_N G-CTRL_L1 CKT3 COPPER #14 1 0.00 INO 302.0 -3.0S-CTRL_N G-CTRL_L2 CKT3 COPPER #14 1 0.00 INO 302.5 -3.0
View Configuration
Name Span Gr-R Gr-X OpV(kV) FOW(kV) BIL(kV) AC(kV) TrPh TrSh Shld Tower123
CKT1 0.0808 25.0 0.0 161.0 1450.0 1135.0 525.0 NO NO BND AGC-H-161BCKT2 0.0808 25.0 0.0 161.0 1450.0 1135.0 525.0 NO NO BND AGC-H-161BCKT3 0.6467 25.0 0.0 115.0 1450.0 1135.0 525.0 NO NO BND UNDEFINED
Copy DeleteEdit
Circuits Copy DeleteEdit
Select Tower 75.00X Offset (ft):Add Tower
WinIGS - Form: IGS_M109 - Copyright © A. P. Meliopoulos 1998-2007
Figure A-15: 161 kV Circuits between Plant and Switchyard + Control Circuit
Lightning Eliminators & Consultants, Inc. - 12-
Sample Smart Ground Report.doc 12 of 39 4/2/2008
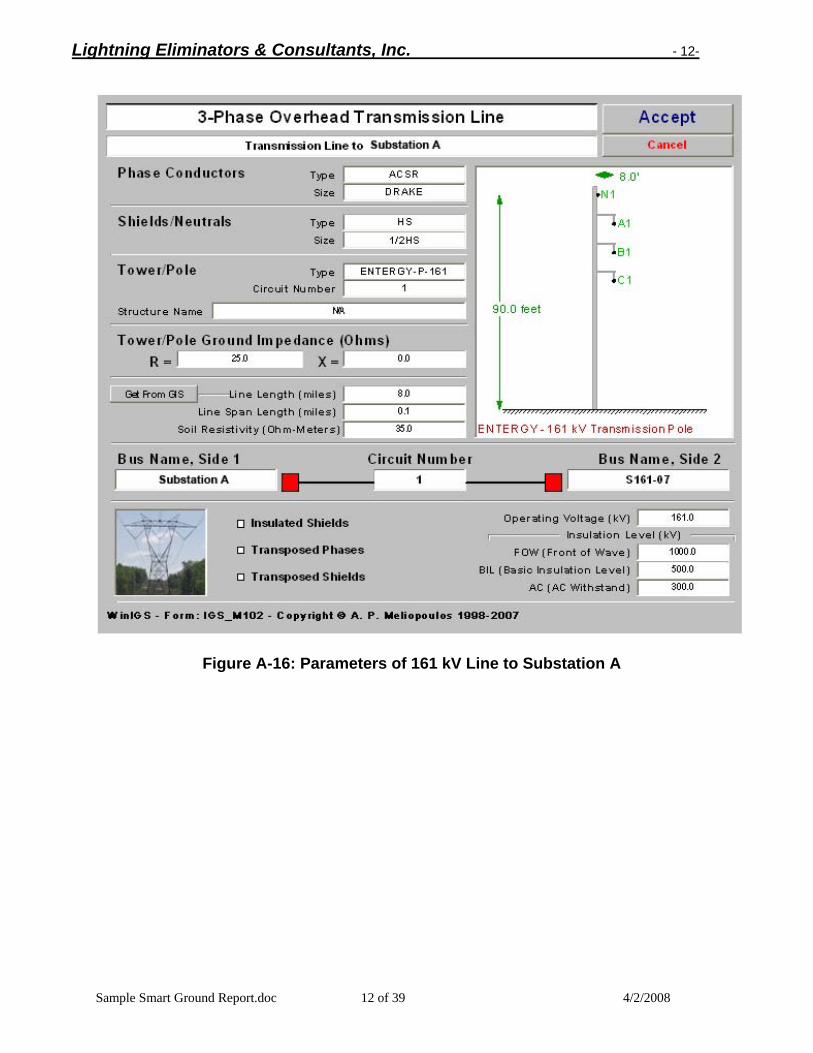
Figure A-16: Parameters of 161 kV Line to Substation A
Lightning Eliminators & Consultants, Inc. - 13-
Sample Smart Ground Report.doc 13 of 39 4/2/2008
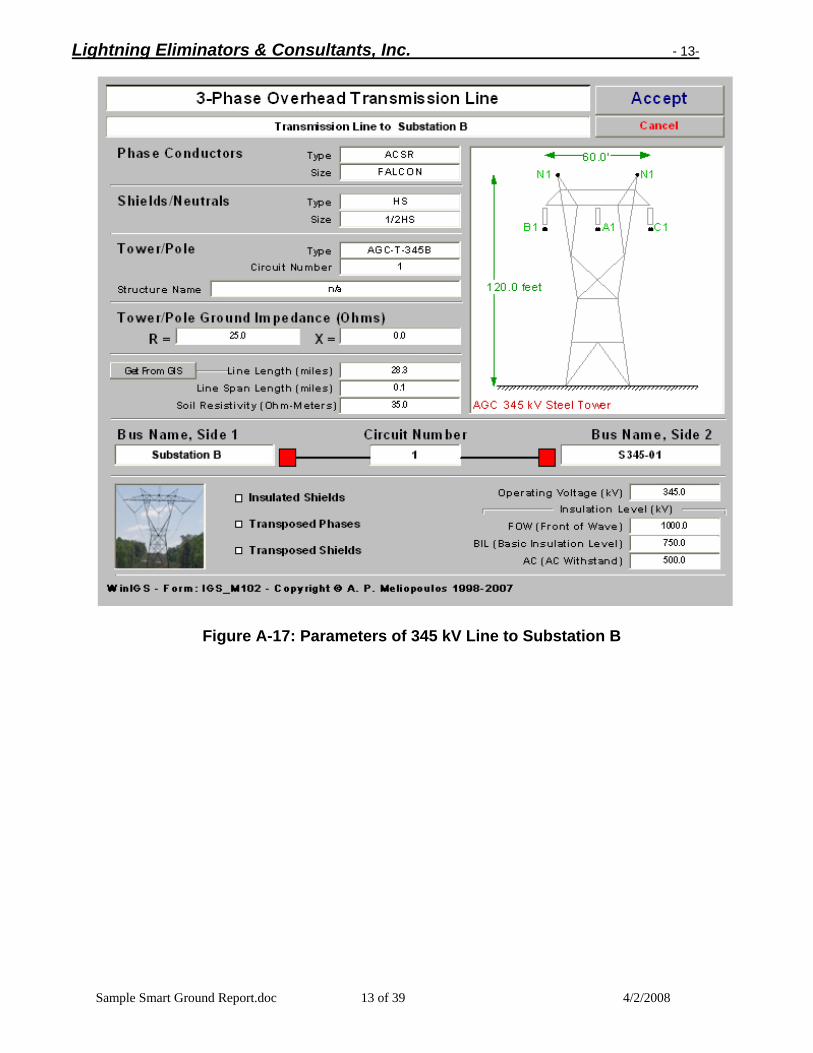
Figure A-17: Parameters of 345 kV Line to Substation B

Lightning Eliminators & Consultants, Inc. - 14-
Sample Smart Ground Report.doc 14 of 39 4/2/2008
Figure A-21: Parameters of Equivalent Source at Substation B

Lightning Eliminators & Consultants, Inc. - 15-
Sample Smart Ground Report.doc 15 of 39 4/2/2008
2.2 Grounding Model The grounding system model of the Springfield Energy Station and the local switchyard was constructed from the available drawings and photographs obtained during the site visit. The 3-D view of the grounding system is given in Figure 2.4. Note that the grounding model includes 3-D representations of all ground conductors. Figure 2.5 shows the top view of the grounding system model superimposed over a satellite photograph of the area. This model was validated with the field measurements described in Appendices B, C and D. The validated model was used for grounding system analysis to assess the safety of the plant.
Figure 2.4: Grounding Model of Springfield Energy Station – 3-D Rendered View

Lightning Eliminators & Consultants, Inc. - 16-
Sample Smart Ground Report.doc 16 of 39 4/2/2008
Figure A-4: Top View of the Grounding System – Overall View
Lightning Eliminators & Consultants, Inc. - 17-
Sample Smart Ground Report.doc 17 of 39 4/2/2008
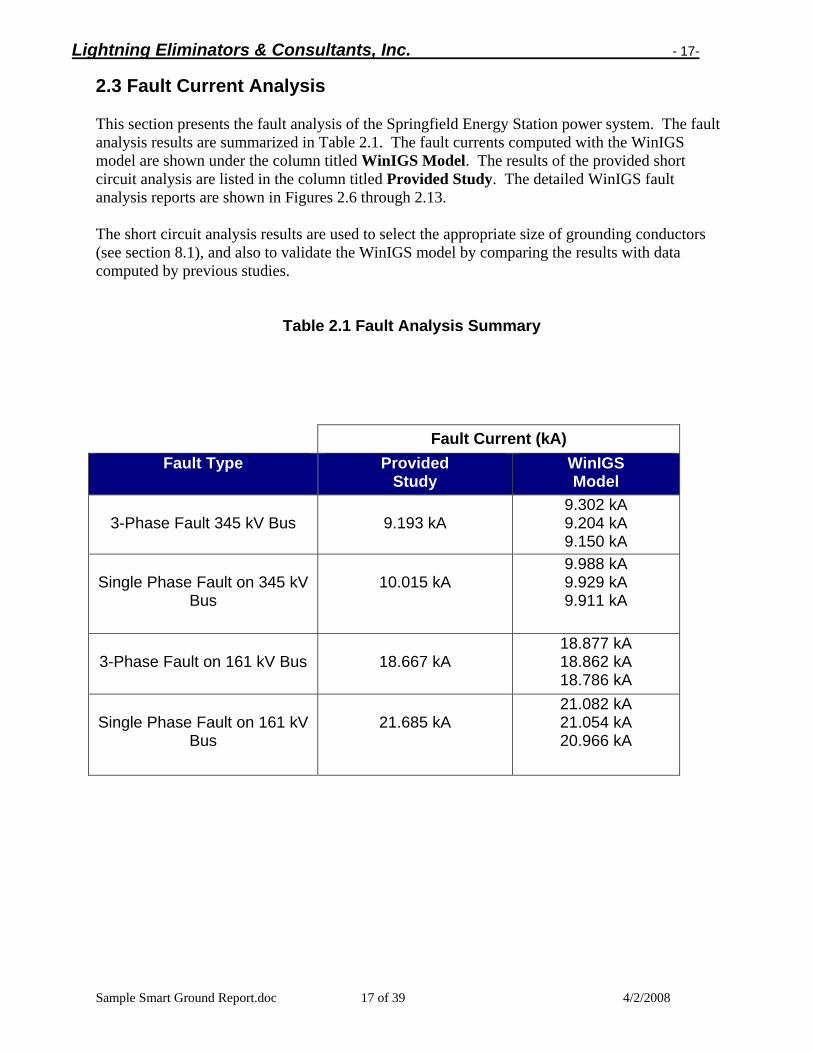
2.3 Fault Current Analysis This section presents the fault analysis of the Springfield Energy Station power system. The fault analysis results are summarized in Table 2.1. The fault currents computed with the WinIGS model are shown under the column titled WinIGS Model. The results of the provided short circuit analysis are listed in the column titled Provided Study. The detailed WinIGS fault analysis reports are shown in Figures 2.6 through 2.13. The short circuit analysis results are used to select the appropriate size of grounding conductors (see section 8.1), and also to validate the WinIGS model by comparing the results with data computed by previous studies.
Table 2.1 Fault Analysis Summary
Fault Current (kA) Fault Type Provided
Study WinIGS Model
3-Phase Fault 345 kV Bus
9.193 kA
9.302 kA 9.204 kA 9.150 kA
Single Phase Fault on 345 kV
Bus
10.015 kA
9.988 kA 9.929 kA 9.911 kA
3-Phase Fault on 161 kV Bus
18.667 kA
18.877 kA 18.862 kA 18.786 kA
Single Phase Fault on 161 kV
Bus
21.685 kA
21.082 kA 21.054 kA 20.966 kA

Lightning Eliminators & Consultants, Inc. - 18-
Sample Smart Ground Report.doc 18 of 39 4/2/2008
3. Soil Resistivity Measurements A series of soil resistivity measurements were performed near the Springfield Energy Station site on April 18, 2007. The measurements were performed using the Smart Ground Multimeter (Model 4001, SN57). Weather conditions were dry, about 70 Degrees Fahrenheit. The test location is illustrated in Figure 3.1.
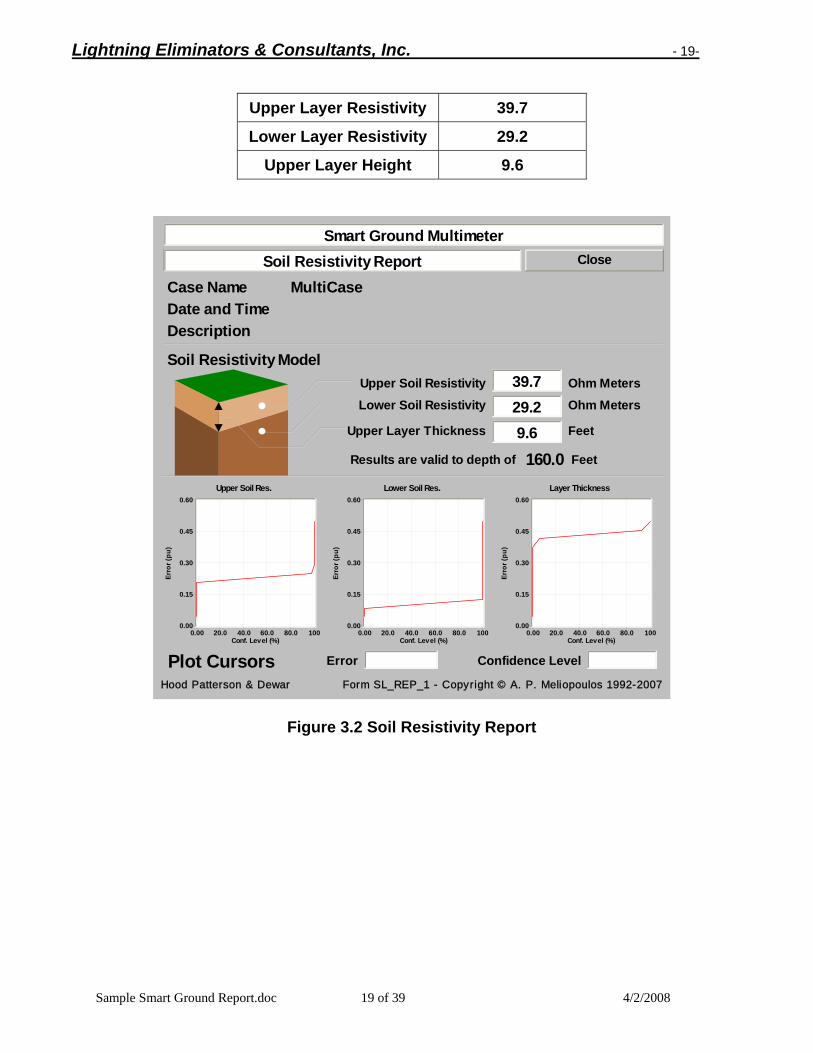
Figure 3.1: Soil Resistivity Test Site The soil model parameters are summarized in Table 3.1. The detailed soil resistivity measurement data are given in Appendix B. The “Best-Fit” soil resistivity report is shown in Figure 3.2. This report shows the results obtained by processing all soil resistivity measurements together. The final soil model used in grounding system performance analyses is given below:
Lightning Eliminators & Consultants, Inc. - 19-
Sample Smart Ground Report.doc 19 of 39 4/2/2008
Upper Layer Resistivity 39.7
Lower Layer Resistivity 29.2
Upper Layer Height 9.6
Soil Resistivity ReportCase Name
Smart Ground Multimeter
MultiCase
Close
39.7
Confidence LevelError
Soil Resistivity ModelUpper Soil Resistivity Ohm Meters
29.2Upper Layer Thickness Feet9.6
Lower Soil Resistivity Ohm Meters
0.00 20.0 40.0 60.0 80.0 100Conf. Level (%)
0.00
0.15
0.30
0.45
0.60
Erro
r (pu
)
Upper Soil Res.
0.00 20.0 40.0 60.0 80.0 100Conf. Level (%)
0.00
0.15
0.30
0.45
0.60
Erro
r (pu
)
Lower Soil Res.
0.00 20.0 40.0 60.0 80.0 100Conf. Level (%)
0.00
0.15
0.30
0.45
0.60Er
ror (
pu)
Layer Thickness
Plot Cursors
160.0Results are valid to depth of Feet
Date and TimeDescription
Hood Patterson & Dewar Form SL_REP_1 - Copyright © A. P. Meliopoulos 1992-2007
Figure 3.2 Soil Resistivity Report

Lightning Eliminators & Consultants, Inc. - 20-
Sample Smart Ground Report.doc 20 of 39 4/2/2008
4. Ground System Impedance Measurements This section summarizes the results of the ground impedance measurements at the Springfield Energy Station. The measurements were performed on April 18, 2007 using the Smart Ground Multimeter, model 4001, SN57. The weather conditions were dry with ambient temperature 70 degrees Fahrenheit. A detailed description of the measurements and the results are given in Appendix C. The ground impedance measurement report is given in Figure 4.1. The results are summarized in Table 4.1, below. The table also lists the ground system impedance computed with the WinIGS model. The WinIGS impedance report is shown in Figure 4.2. The computed values are in good agreement with the measured values.
Table 4.1: Ground Impedance Measurement Result Summary
Quantity WinIGS model Measured Values
Error at 99% Confidence
System Ground Impedance at 60 Hz
0.059 Ohms 0.0524 Ohms 24%
Ground Impedance Versus Frequency SGM Smart Ground Multimeter
Case Name KY_SYS_Z_FINAL
0.00 50.0 100 150 200 250Frequency (Hertz)
0.030
0.060
0.090
0.12
0.15
Impe
danc
e (O
hms)
0.00
15.0
30.0
45.0
60.0
Phas
e (D
egre
es)
MagnitudePhase
ReturnStatistical Analysis
60.00
0.05242
38.56
Frequency (Hz)Plot Cursor
Magnitude / PhaseResistance / ReactanceSeries R-L
Magnitude (Ohms)
Phase (Degrees)
Parallel R-L
Hood Patterson & Dewar Form GR_REP_1A - Copyright © A. P. Meliopoulos 1992-2007
Figure 4.1: Ground System Impedance Measurement Report
Lightning Eliminators & Consultants, Inc. - 21-
Sample Smart Ground Report.doc 21 of 39 4/2/2008
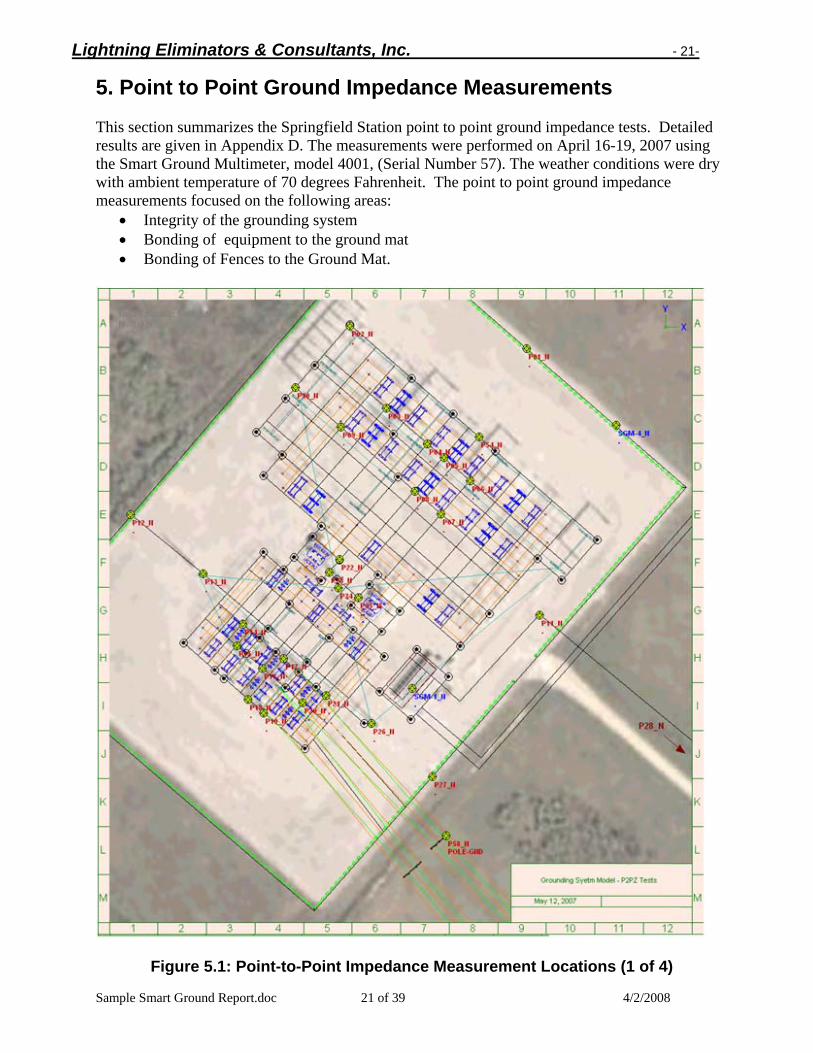
5. Point to Point Ground Impedance Measurements This section summarizes the Springfield Station point to point ground impedance tests. Detailed results are given in Appendix D. The measurements were performed on April 16-19, 2007 using the Smart Ground Multimeter, model 4001, (Serial Number 57). The weather conditions were dry with ambient temperature of 70 degrees Fahrenheit. The point to point ground impedance measurements focused on the following areas:
• Integrity of the grounding system • Bonding of equipment to the ground mat • Bonding of Fences to the Ground Mat.
Figure 5.1: Point-to-Point Impedance Measurement Locations (1 of 4)

Lightning Eliminators & Consultants, Inc. - 22-
Sample Smart Ground Report.doc 22 of 39 4/2/2008
Figure 5.2: Point-to-Point Impedance Measurement Locations (2 of 4)

Lightning Eliminators & Consultants, Inc. - 23-
Sample Smart Ground Report.doc 23 of 39 4/2/2008
Figure 5.3: Point-to-Point Impedance Measurement Locations (3 of 4)
Lightning Eliminators & Consultants, Inc. - 24-
Sample Smart Ground Report.doc 24 of 39 4/2/2008
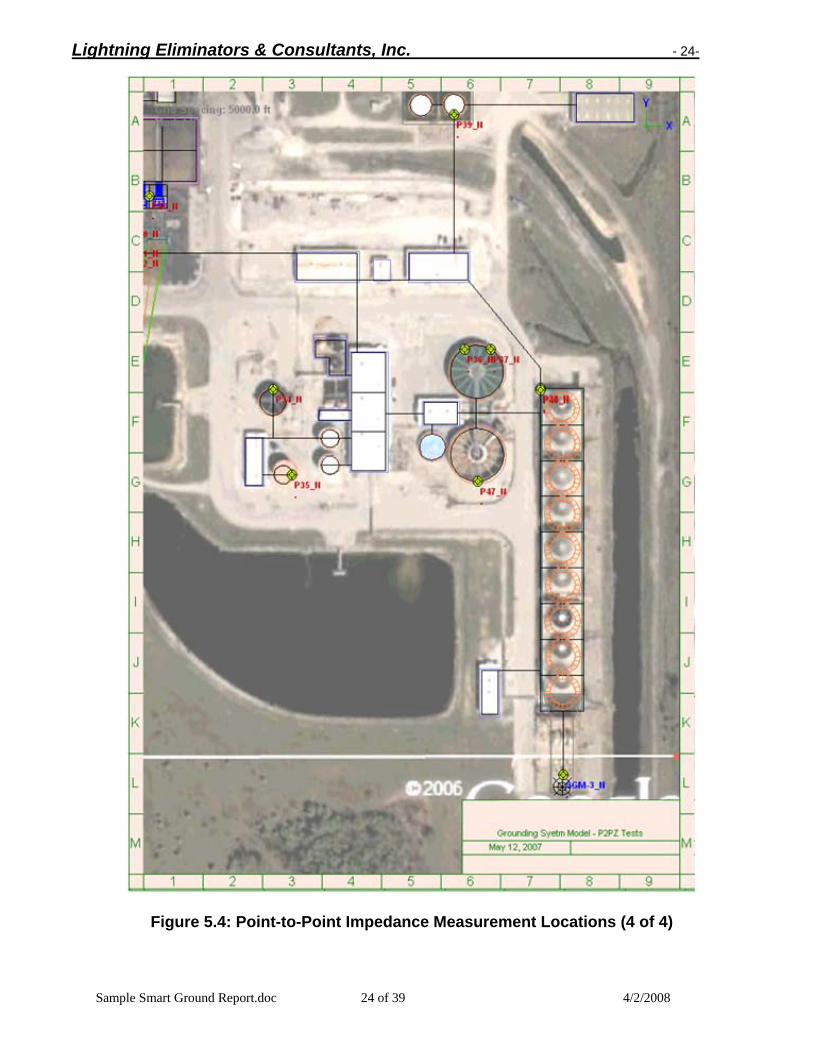
Figure 5.4: Point-to-Point Impedance Measurement Locations (4 of 4)
Lightning Eliminators & Consultants, Inc. - 25-
Sample Smart Ground Report.doc 25 of 39 4/2/2008
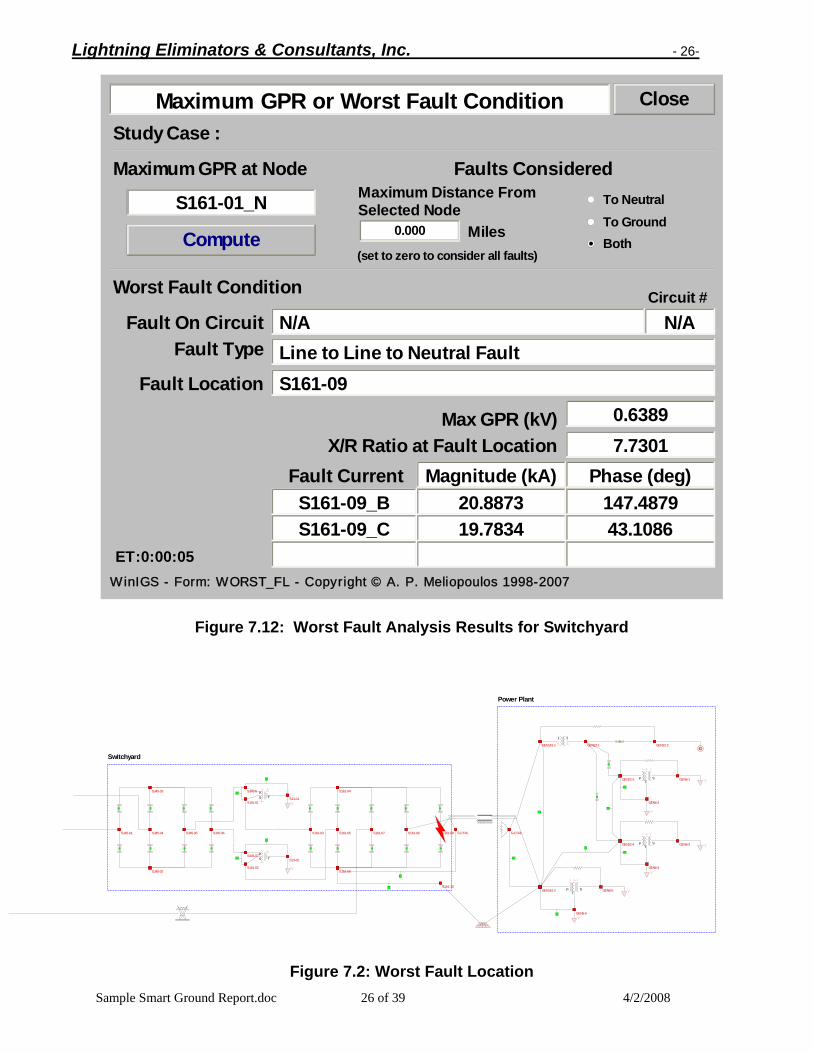
6. Field Observations Not included 7. Evaluation of Present Grounding System – Safety Assessment This section provides the safety assessment of the validated grounding system of the Springfield Station Power plant. Safety assessment was performed in two areas (a) Power Plant Area and (b) Switchyard. The grounding system in these areas was analyzed to determine whether it meets the safety requirements of the IEEE Standard 80, 2000 edition. The safety evaluation is based on the analysis of the plant grounding system performance under worst fault conditions. The analysis was performed using the computer model of the Springfield Station, and nearby transmission lines (the system model details are described in Appendix A). Using the computer model, a comprehensive fault analysis was performed to determine the fault that causes maximum ground potential rise at areas (a) and (b). The analysis includes both single and double line to neutral faults at all buses, and along all transmission and distribution lines of the modeled network. In addition to the safety analysis the voltage induced on the instrumentation cables connected between the power plant and switchyard during fault conditions was computed. The induced voltage results are given in section 7.3, entitled “Transfer Voltages”. 7.1 Safety Assessment at Power Plant Area Not included. 7.2 Safety Assessment at Switchyard A safety assessment for the switchyard has been also performed and the results are reported here. The worst fault condition report for ground potential rise at the switchyard ground system is shown in Figure 7.12. The fault that results in maximum Ground Potential Rise (GPR) at the switchyard grounding system is a double line to neutral fault at the 161 kV bus (bus S161-09) (see Figures 7.12 and 7.13). A safety analysis for the worst fault conditions was performed based on the IEEE Std 80 guidelines. The detailed analysis results are given in Figures 7.14 through 7.20. The results are summarized in Table 7.2. Note that the maximum touch and step voltages are lower than the permissible touch and step voltages per IEEE Std 80.
Lightning Eliminators & Consultants, Inc. - 26-
Sample Smart Ground Report.doc 26 of 39 4/2/2008
Compute
S161-01_N
Maximum GPR at Node
CloseMaximum GPR or Worst Fault ConditionStudy Case :
Worst Fault Condition
Fault TypeFault On Circuit
Max GPR (kV)
Fault Location S161-09
N/ALine to Line to Neutral Fault
0.6389
19.7834S161-09_C20.8873S161-09_B
Fault Current
43.1086147.4879
Magnitude (kA) Phase (deg)
To NeutralTo GroundBoth
Faults Considered
X/R Ratio at Fault Location 7.7301
N/ACircuit #
ET:0:00:05
Maximum Distance From
Miles0.000Selected Node
(set to zero to consider all faults)
WinIGS - Form: WORST_FL - Copyright © A. P. Meliopoulos 1998-2007
Figure 7.12: Worst Fault Analysis Results for Switchyard
PTS
PTS
1 2
G
PT
S
PT
S
PT
S
Switchyard
Power Plant
S345-04 S161-07S345-01
S345-6
S161-01S13-01
S345-03
S345-02
S345-05
S345-07
S161-02
S13-02
S161-03 S161-05
S161-04
S161-06
S345-06 S161-08 S161-09
GEN161-1 GEN22-1
GEN6-6
GEN161-2
GEN22-2
GEN6-5
GEN22-3 GEN6-1
GEN6-2
GEN22-4 GEN6-3
GEN6-4
S161-10
S-CTRL G-CTRL
Figure 7.2: Worst Fault Location

Lightning Eliminators & Consultants, Inc. - 27-
Sample Smart Ground Report.doc 27 of 39 4/2/2008
Table 7.2: Safety Analysis Summary
Quantity Value
Fault Type Double Line to Ground Fault Location 161 kV Bus Ground Potential Rise 639 Volts Fault Current 20.89 / 19.78 kA Earth Current 3.728 kA X/R Ratio at Fault Location 7.73 Current division ratio 18.85 % Allowable Touch Voltage with for 4” Gravel 488 V Maximum Touch Voltage in Substation Area 250 V Allowable Step Voltage, for Native Soil Top Layer 199 V Maximum Step Voltage 100 V
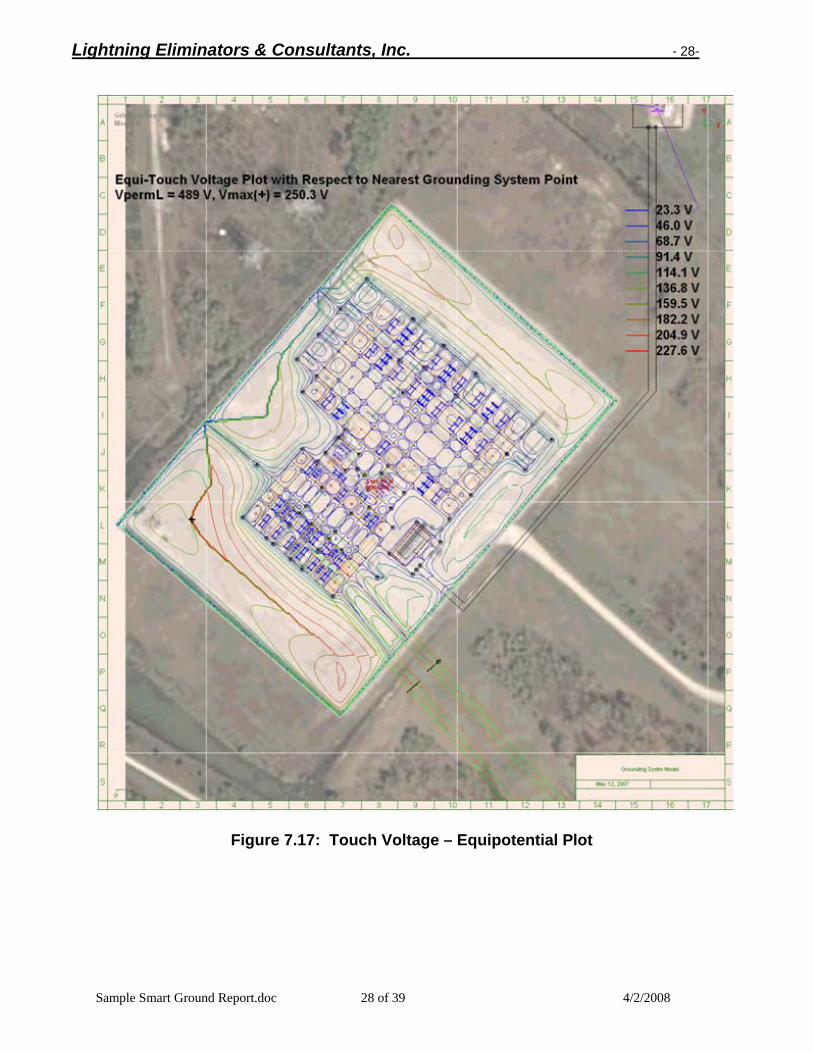
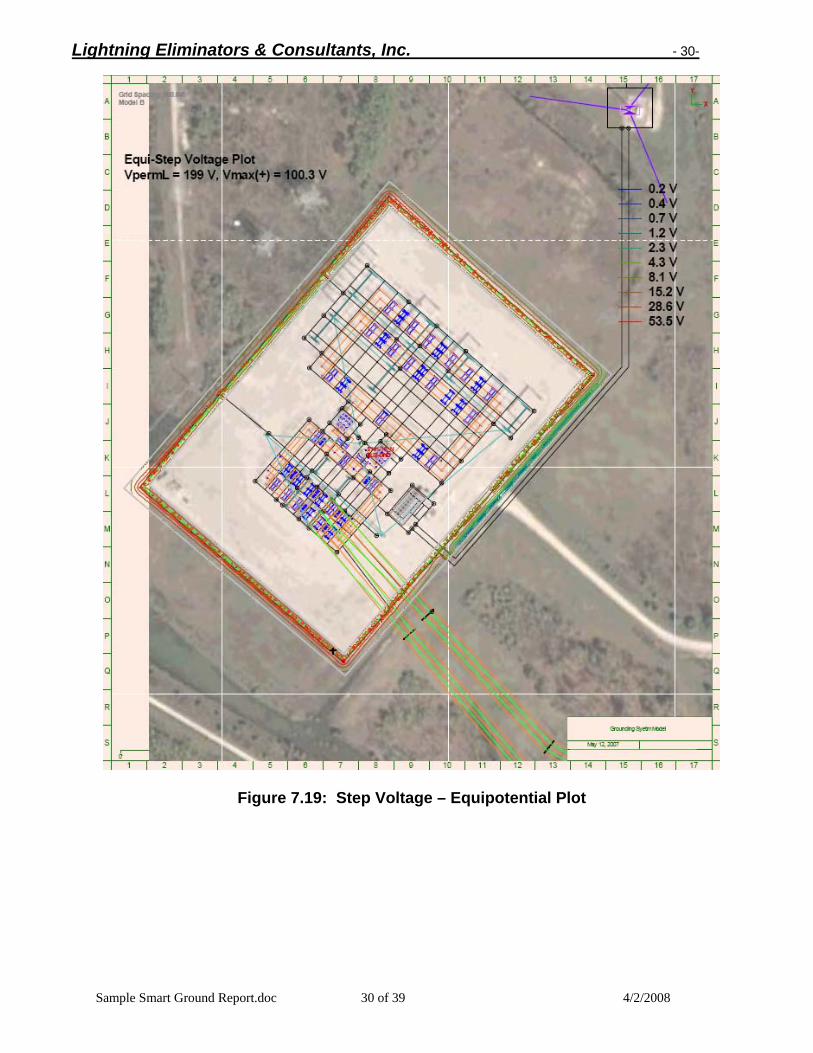
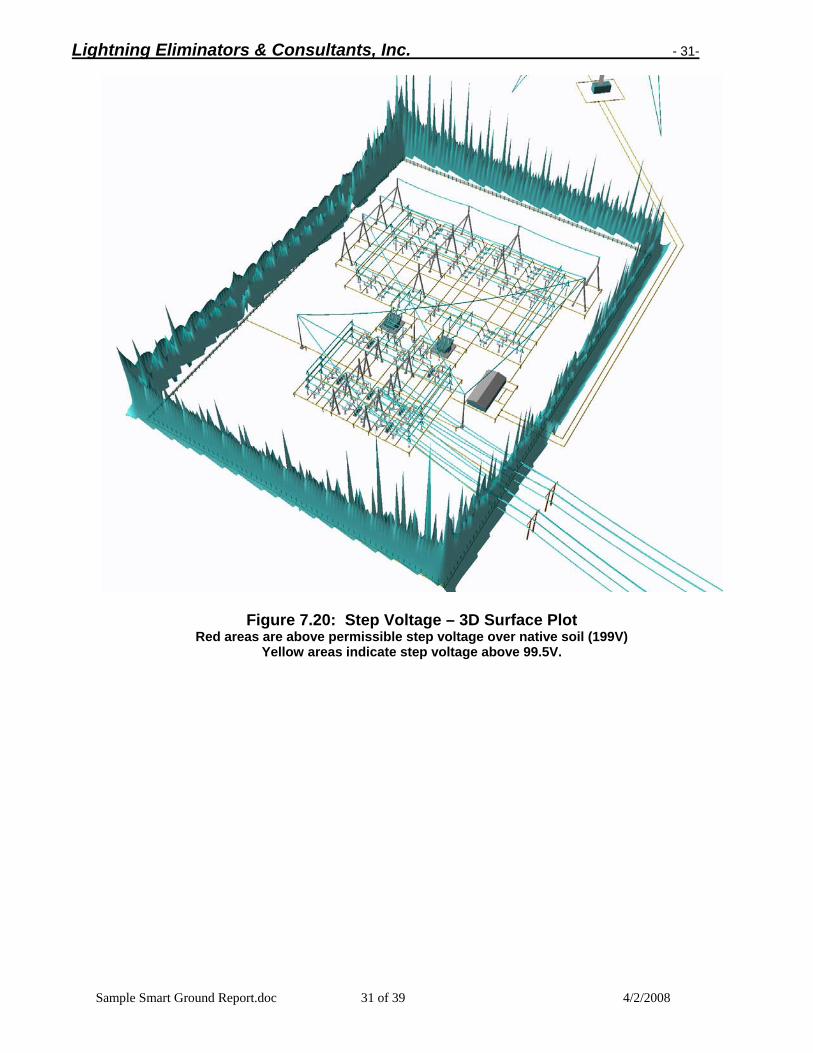
Figure 7.14 shows the ground potential rise and earth currents during the worst fault conditions. The current flowing into the grounding of the generating area is 7.12 kA, the electric current flowing into the grounding system of the switchyard is 10.78 kA, and the net current into the soil is 3.73 kA. Therefore there is a substantial fault current circulating between the two grounds during the worst fault condition. Figure 7.15 gives the correction factor for the allowable touch voltage computations. This factor models the effect of a 2,000 Ohm-meter, 4” gravel layer. Figure 7.16a gives the allowable touch voltage and allowable step voltage for the worst fault conditions for areas covered by a 4” gravel layer. Figure 7.16b gives the allowable touch voltage and allowable step voltage for the worst fault conditions for native soil areas. These figures are computed based on the following additional parameters: Fault Duration 0.5 seconds Body Weight 50 kg (110 lb) Figures 7.17 and 7.18 illustrate the touch voltage distributions during worst fault conditions. The touch voltage is illustrated via equipotential contours (Figure 7.17) and 3-D surface plot (Figure 7.18). Note that the touch voltage does not exceed the permissible touch voltage per IEEE Std-80 in all areas. Figures 7.19 and 7.20 illustrate the step voltage distribution during worst fault conditions in selected areas of the site, i.e. near the extremity of the generating plant. The area has been so selected because step voltages are highest in this area. The step voltage is illustrated via equipotential contours (Figure 7.19) and 3-D surface plot (Figure 7.20). Note that the maximum step voltage does not exceed the permissible step voltage. The permissible step voltage on native soil is 199 volts while the actual maximum step voltage is 100 volts. The conclusion is that the present system meets the safety requirements of IEEE Std 80.
Lightning Eliminators & Consultants, Inc. - 28-
Sample Smart Ground Report.doc 28 of 39 4/2/2008
Figure 7.17: Touch Voltage – Equipotential Plot

Lightning Eliminators & Consultants, Inc. - 29-
Sample Smart Ground Report.doc 29 of 39 4/2/2008
Figure 7.18: Touch Voltage – 3D Surface Plot Red areas are above permissible touch voltage with insulating surface layer (488V)
Yellow areas indicate areas with touch voltage above (244V)
Lightning Eliminators & Consultants, Inc. - 30-
Sample Smart Ground Report.doc 30 of 39 4/2/2008
Figure 7.19: Step Voltage – Equipotential Plot
Lightning Eliminators & Consultants, Inc. - 31-
Sample Smart Ground Report.doc 31 of 39 4/2/2008
Figure 7.20: Step Voltage – 3D Surface Plot Red areas are above permissible step voltage over native soil (199V)
Yellow areas indicate step voltage above 99.5V.
Lightning Eliminators & Consultants, Inc. - 32-
Sample Smart Ground Report.doc 32 of 39 4/2/2008
8. Recommendations This section presents a list of recommendations for enhancement of the Springfield Station grounding system performance. The recommendations were selected with a trial and error approach for the purpose of selecting the most cost effective enhancements of the grounding system. The recommendations comprise addition of ground conductors in order to reduce the impact of the induced voltages and ground potential differences that develop between the substation and generating plant grounding systems during transients. The size of the ground conductors to be added was selected based on the following criteria:
• Adequate mechanical strength • Prevent conductor melting under worst fault conditions with industry accepted safety
margins • Allow for increased future system capacity
The final design and bill of materials is given in this section. The final design evaluation is given in section 10. 8.1 Ground Conductor Size Selection The ground conductor size selection is based on fault analysis. Line to neutral and three phase faults at all voltage levels were considered. The detailed results are given in section 2.3. The parameters affecting ground conductor size selection are: (a) Maximum Fault Current – 161 kV Level: 21.7 kA* (b) Maximum Fault Current – 345 kV Level: 10.0 kA* (c) Assumed Fault Clearing Time: 0.5 seconds. The required size of the grounding conductors is computed with the aid of the equations in the IEEE Std 80-2000 assuming a specific maximum permissible temperature rise. Using exothermic connectors (which are recommended here) the recommended maximum permissible temperature is 250 or 450 degrees Celsius. It is recommended to use the lower temperature of 250 degrees Celsius. The required cross section of the grounding conductors for 97% commercial drawn copper is: *Note: The worst case fault used in this analysis is the one that produces the highest fault current, and thus causes highest conductor temperature rise. The objective here is to prevent melting of the ground conductors. Thus fault that produces the highest current is a fault at the 138 kV bus of substation U (26.5 kAmperes) and a fault on the 2.4 kV bus for substation H (19.4 kAmperes). This should not be confused with the worst case fault for safety analysis, where the objective is to keep touch and step voltages below a permissible value.

Lightning Eliminators & Consultants, Inc. - 33-
Sample Smart Ground Report.doc 33 of 39 4/2/2008
Figure 8.1: Recommended Grounding System Enhancements – Top Vew

Lightning Eliminators & Consultants, Inc. - 34-
Sample Smart Ground Report.doc 34 of 39 4/2/2008
Figure 8.2: Recommended Grounding System Enhancements – 3D View

Lightning Eliminators & Consultants, Inc. - 35-
Sample Smart Ground Report.doc 35 of 39 4/2/2008
8.4 Bill of Materials The bill of materials for the recommended design is given in Figure 8.3. The bill of materials does not include the corrections from the field observations, i.e. repairing damage conductors and reinstalling the ground bonds to the communication tower.
CloseBill of Materials
Type and Size Quantity123
COPPER/4/0 2689.24 feetCOPPER/500KCM 5390.38 feet
Exothermic Connector (4/0 to 500KCM) 8
Grounding System / Geometric ModelStudy Case :
Grounding System : SingleAdded Ground Conductors and Connectors AllLayer : Selected
Figure 8.3: Bill of Materials - Recommended Grounding System Enhancements

Lightning Eliminators & Consultants, Inc. - 36-
Sample Smart Ground Report.doc 36 of 39 4/2/2008
9. Evaluation of Recommendations – Safety Assessment This section provides the safety assessment of the grounding system of the Springfield Station assuming that the proposed enhancements have been implemented. The analysis procedure is similar to the one used for the existing system case, presented in section 7.
Figure 9.17: Touch Voltage – Equipotential Plot
Lightning Eliminators & Consultants, Inc. - 37-
Sample Smart Ground Report.doc 37 of 39 4/2/2008
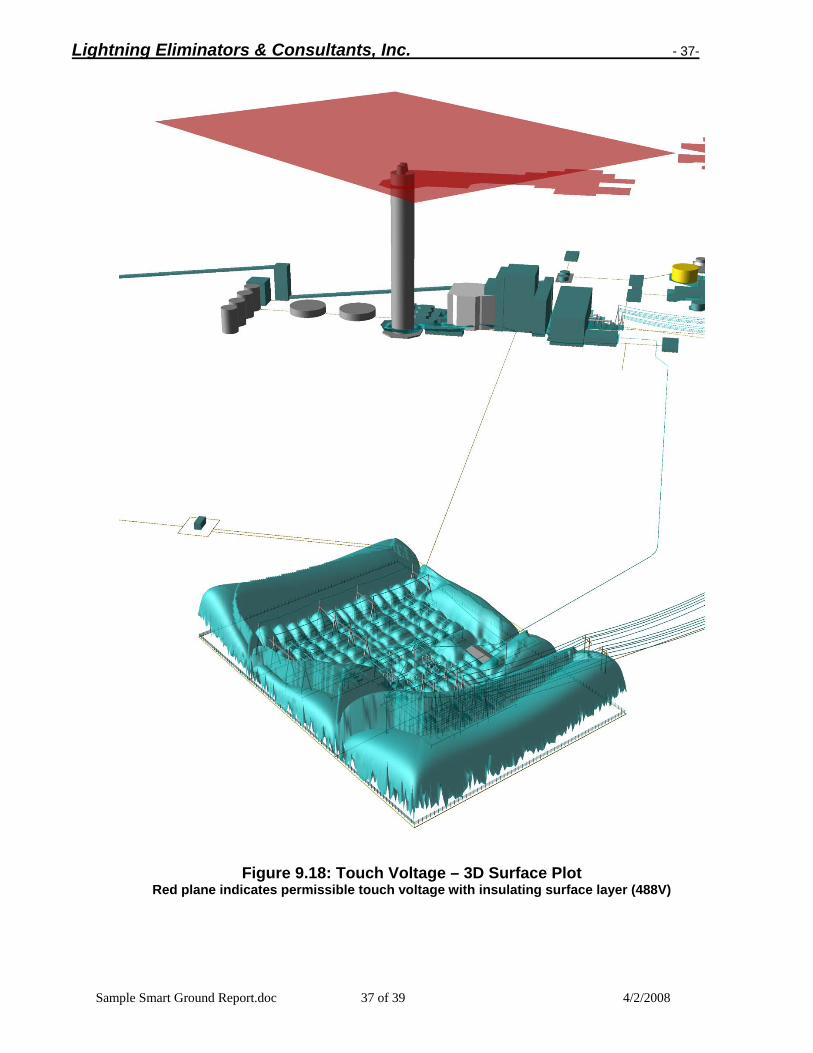
Figure 9.18: Touch Voltage – 3D Surface Plot Red plane indicates permissible touch voltage with insulating surface layer (488V)

Lightning Eliminators & Consultants, Inc. - 38-
Sample Smart Ground Report.doc 38 of 39 4/2/2008
Figure 9.19: Step Voltage – Equipotential Plot

Lightning Eliminators & Consultants, Inc. - 39-
Sample Smart Ground Report.doc 39 of 39 4/2/2008
Figure 9.20: Step Voltage – 3D Surface Plot