Embed Size (px)
Citation preview

HAL Id: inserm-00638404https://www.hal.inserm.fr/inserm-00638404
Submitted on 4 Nov 2011
HAL is a multi-disciplinary open accessarchive for the deposit and dissemination of sci-entific research documents, whether they are pub-lished or not. The documents may come fromteaching and research institutions in France orabroad, or from public or private research centers.
L’archive ouverte pluridisciplinaire HAL, estdestinée au dépôt et à la diffusion de documentsscientifiques de niveau recherche, publiés ou non,émanant des établissements d’enseignement et derecherche français ou étrangers, des laboratoirespublics ou privés.
Sample size requirements for the internal validation ofpsychiatric scales.
Alexandra Rouquette, Bruno Falissard
To cite this version:Alexandra Rouquette, Bruno Falissard. Sample size requirements for the internal validation of psychi-atric scales.. International Journal of Methods in Psychiatric Research, Wiley, 2011, 20 (4), pp.235-49.<10.1002/mpr.352>. <inserm-00638404>
1
Sample Size Requirements for the Internal Validation of
Psychiatric Scales
Alexandra ROUQUETTE1, 2
, Bruno FALISSARD1, 3, 4
1Unité INSERM U669, Paris Sud Innovation Group in Adolescent Mental Health, Paris, France
2 Département Universitaire de Santé Publique, CHU Angers, France.
3 Université Paris-Sud et Université Paris Descartes, Paris, France.
4Département de Santé Publique, Hôpital Paul Brousse, Villejuif, France.
Address for correspondence: Alexandra ROUQUETTE, INSERM U669, Maison de Solenn,
97 Boulevard de Port Royal, 75679 Paris cedex 14, France.
Tel: (+33) 6 22 87 67 78
Fax: (+33) 1 58 41 28 43
Email: [email protected]

2
Abstract:
The ratio of subjects to variables (N/p), as a rule to calculate the sample size required in internal
validity studies on measurement scales, has been recommended without any strict theoretical or
empirical basis being provided. The purpose of the present study was to develop a tool to determine
sample size for these studies in the field of psychiatry. First, a literature review was carried out to
identify the distinctive features of psychiatric scales. Then, two simulation methods were developed
to generate data according to: 1/ the model for factor structure derived from the literature review
and 2/ a real dataset. This enabled the study of the quality of solutions obtained from principal
component analysis or Exploratory Factor Analysis (EFA) on various sample sizes. Lastly, the
influence of sample size on the precision of Cronbach‟s alpha coefficient was examined. The N/p
ratio rule is not upheld by this study: short scales do not allow smaller sample size. As a rule of
thumb, if one‟s aim is to reveal the factor structure, a minimum of 300 subjects is generally
acceptable but should be increased when the number of factors within the scale is large, when EFA
is used and when the number of items is small.
Keywords: Sample size, validation studies, factor analysis, questionnaires, psychiatry.

3
Introduction
One of the most critical methodological issues when designing a study and planning the
statistical analysis, is the number of subjects to include. Generally, the sample size is based on the
power of a statistical test of hypothesis. In descriptive studies, this approach cannot be used, and it
is usually the range of the confidence interval of a given parameter which determines sample size.
This is likely to be the case in internal validity studies of measurement scales in which,
traditionally, two types of parameters are of interest: Cronbach‟s alpha coefficient (α) which
assesses reliability, and factor analysis loadings which explore the dimensional structure of the
scale. In practice, these loadings are estimated either by Principal Component Analysis (PCA) or by
Exploratory Factor Analysis (EFA). A formula for the confidence interval of Cronbach‟s alpha
coefficient was developed by Feldt in the 1960s (Fan et al., 2001; Feldt, 1965). The sample size
required for a desired precision of this coefficient can, therefore, be easily assessed. In fact, the
difficulty in establishing a simple rule for sample size calculation in internal validity studies arises
from the use of factor analysis.
Many recommendations regarding sample size in factor analysis have been made, but none
are founded on a strict theoretical or empirical basis. The most widely used rule uses the ratio of the
number of subjects (N) to the number of items (p), and this varies from three to 10 depending on
authors (Cattell, 1978; Everitt, 1975; Gorsuch, 1983; Nunnaly, 1978). Other authors have suggested
an absolute minimum sample size of 50 to 500 to enable factor analysis (Aleamoni, 1973; Comrey,
1978; Comrey et al., 1992; Loo, 1983). Given these various recommendations and their lack of
documented explanation, some researchers have put them to the test by studying the consequences
of using factor analysis on insufficient sample sizes. They all found that, in addition to N, two other
parameters are important to obtain accurate and stable solutions: firstly the ratio of the number of
variables to the number of factors (ratio p/M, which is an indicator of „factor overdetermination‟, a
concept defined by MacCallum in 1999 as the degree to which each factor is clearly represented by

4
a sufficient number of variables, at least three or four); and secondly the level of factor loadings
(which reflects the level of communalities, the communality of a variable being the portion of the
variance that a variable shares with the common factors). The lower the p/M ratio and the factor
loading level, the larger the sample size required for a given accuracy and stability of solutions
obtained from factor analysis (Guadagnoli et al., 1988; Hogarty et al., 2005; MacCallum et al.,
1999; Mundfrom et al., 2005; Velicer et al., 1998). All these studies have shown that sample size
partly depends on the nature of the data: their „strength‟. Strong data in factor analysis means
uniformly high communalities without cross-loadings, plus several variables loading strongly on
each factor (Costello et al., 2005; Fabrigar et al., 1999). The stronger the data, the smaller the
sample size required. It does not therefore seem possible to recommend a general rule for sample
size calculation that is valid in all the fields to which psychometric procedures apply.
However, in each field, there are distinctive features. In psychiatry, factor loading values are
usually close to 0.6, the p/M ratio can vary from three to 20 or more, depending on scales, and the
number of items is often different for each factor within a scale (Dawkins et al., 2006;
Gabryelewicz et al., 2004; Iwata et al., 2000; Loza et al., 2003). Another characteristic observed in
psychiatric scales is the shape of the scree plot. Unidimensionality is rare, and usually there is a first
dimension representing a large part of the variance contained in the data (30 to 35%), and then there
are one or more other dimensions explaining smaller and decreasing proportions of variance (from
15 to 5%) (Chapman et al., 2009; Sanchez-Lopez Mdel et al., 2008; Uslu et al., 2008; Villalta-Gil et
al., 2006). This factor structure can be explained by the presence of correlated factors or, likewise,
by a two-order factor model in which a second order factor explains the pattern of correlations
among the first order factors.
The unresolved methodological issue about sample size in validation studies of
measurement scales can lead to erroneous conclusions being drawn if the sample is too small.
Conversely, the inclusion of too many subjects in a study wastes time and resources for researchers.
The main purpose of this study is therefore to use the distinctive features encountered in psychiatric
5
scales to develop a tool for the determination of the sample size required in internal validity studies
on such scales in order to guarantee an acceptable level of precision for Cronbach‟s alpha
coefficient and, above all, accuracy and stability of the factor solution. A secondary aim is to
determine the influence of the choice of PCA or EFA on the sample size required and on the
accuracy of the factor solution.
Material and Methods
This study comprised three stages. The first consisted in a literature review to determine the
shared characteristics of psychiatric scales. The second used simulations to study the influence of
sample size on the stability and accuracy of the solutions obtained from PCA and EFA. These
simulations were based, firstly, on artificial data generated according to the factor pattern observed
in psychiatric scales from the literature review, and then on real data. Finally, the influence of
sample size on the precision of Cronbach‟s alpha coefficient in the conditions encountered in
psychiatry was studied.
Literature Review
10 psychiatric scales were selected taking account of the frequency of their use in clinical
practice and their representativeness of different pathologies encountered in psychiatry:
Positive And Negative Syndrome Scale (PANSS - 30 items)
Brief Psychiatric Rating Scale (BPRS – 18 items)
Beck Anxiety Inventory (BAI - 21 items)
State-Trait Anxiety Inventory (STAI - 40 items)
Hamilton Anxiety Rating Scale (HAMA - 14 items)
Hamilton Rating Scale for Depression (HAMD - 17 items)

6
Montgomery-Asberg Depression Rating Scale (MADRS - 10 items)
Beck Depression Inventory (BDI - 21 items)
Hospital Anxiety and Depression Scale (HADS - 14 items)
General Health Questionnaire (GHQ – 12 items)
Articles including results of PCA or EFA concerning any of these ten scales were sought in
the Medline database using the following keywords: for each scale, the “name of the scale” and/or
“its abbreviation”, the expressions “factor analysis” and/or “components analysis” and the article
language “English” and/or “French”. A pre-selection was carried out on the basis of the abstracts,
and articles were then included if the following three criteria were met: the factor structure of one of
the ten scales was studied using PCA or EFA; eigenvalues or percentage of variance accounted for
by each factor before rotation were specified; sample size was equal to or greater than 100.
In each article, the following data were collected: the method used for factor extraction (PCA or
EFA), the rotation method used (orthogonal or oblique), the number of factors extracted, the
eigenvalues or the percentage of variance accounted for by each factor before rotation, the number
of items per factor and the values of the factor inter-correlations. When the loading matrix was
reproduced, the mean of the salient loadings was calculated by considering only the higher value in
case of cross-loadings. If several groups were studied, only the results from the largest group were
considered. Likewise, if analyses were carried out on data collected at different times, only the
results collected at the initial collection time were considered. All these data were recorded on the
Microsoft® Office Excel 2007 spreadsheet program and descriptive statistical analyses for each of
these variables were performed using R software 2.6.2 (R Development Core Team, 2008).
Simulation Studies
Simulations based on artificial data.
The simulation method developed here is based on the common factor model and is
described in the appendix. To summarize, certain important points should be noted. In this
7
simulation model, two hypotheses are set. The first is the existence of a simple structure, i.e. each
item loads on a single factor and all the non-salient loadings are equal to zero. The second is that all
salient loadings (λ) are equal. When a common factor model is used, responses have a normal
distribution. To come closer to real-life instruments, these responses were categorised into four-
class ordered variables as in a four-point Likert response pattern. The response distribution was
different for each item in the scale and non-symmetrical so as to simulate floor and ceiling effects.
Finally, parameters that can be controlled using this method are: the number of items (p), the
number of factors (M), the number of items loading on each factor in the scale (pm, m=1 to M), the
value of salient loadings (λ), the level of the factor inter-correlations (cor(Fm,Fm’), m ≠ m’) and the
sample size (N).
For M and p, we decided to study the values usually encountered in psychiatry, i.e. scales
with two, three or four factors and a number of items varying between 10 and 45 (p= 10, 15, 20, 25,
30, 35, 40 or 45). The results from the literature review then enabled the determination of the value
of λ and pm. Levels of factor inter-correlations were chosen amongst the values encountered in the
literature review, and also in order to obtain the percentage of variance accounted for by each factor
that was nearest to the mean of this percentage found in the review. Once all these parameter values
were determined, two sets of 10 000 samples were generated for each sample size studied (N= 50,
100, 150, 200, 300, 500, 1 000) and for each condition defined by M and p. Then, PCA was
performed on one set and EFA on the other. These two methods of factor extraction were followed
by a promax rotation which is an oblique rotation method as recommended when factors are
correlated with each other (Costello and Osborn, 2005; Fabrigar et al., 1999; Floyd et al., 1995). To
determine the adequate sample size, three criteria were used as a threshold for good quality of the
factor solution:
standard deviation of the salient loadings obtained after rotation over the 10 000 simulations
(ζλ) below 0.05 (95% confidence interval of the salient loadings close to ̂ 0.1)

8
percentage of simulations in which all the items in the scale loaded on the right factor (i.e.
that which is determined in the simulation model) after rotation (R%) greater than 90%
the mean of percentages of items loading on the wrong factor in the scale after rotation over
the 10 000 simulations (W%) below 1%
When EFA was performed, the percentage of simulations where Heywood cases occurred (i.e.
loading estimates greater than 1.0, which occurs only with EFA) was also estimated. Finally, for
either method (PCA and EFA), the mean of the salient loadings over the 10 000 simulations (μλ)
was computed.
Simulations based on real data.
To offer a complementary perspective, a simulation study was also conducted by the aid of
an important real data set of 1009 patients consecutively hospitalized between January 1988 and
July 2004 in the Eating Disorder Unit of the Clinique des Maladies Mentales et de l‟Encéphale at
Sainte-Anne Hospital, Paris, France. Patient characteristics and procedures have been described
previously in Fedorowicz et al., 2007 (Fedorowicz et al., 2007). We focused on two instruments, the
13-item version of the BDI (Beck et al., 1961) and the 21-item version of the HAMD (Hamilton,
1960). For each of these scales, a parallel analysis was performed to determine the number of
factors to extract. Next, two sets of 10 000 samples were repeatedly drawn from the entire sample
(with replacement) for each sample size: 100, 200, 300, 400, 500, 600, 700 and 800. Then, PCA
was performed on one set and EFA on the other, followed by a promax rotation in the case of a
multidimensional instrument. The mean of the standard deviations of the loadings was then
calculated over the 10 000 samples for each sample size.
These analyses were performed using R software 2.6.2. The function princomp was used
for PCA and the loading matrix obtained was rotated using promax with a constant set at four
(Costello and Osborn, 2005; Jackson, 1991). For EFA, the function factanal (with the argument
rotation=promax),which uses the maximum likelihood estimation procedure, was chosen for

9
two reasons: it finds the solution with the optimal statistical properties and it is likely the most
widely used method (Revelle, 2008). Finally, the draw was performed using the function sample
and parallel analysis using the function scree.plot from the psy package.
Precision of Cronbach’s alpha coefficient
The most widely cited minimum value considered as acceptable for the Cronbach's alpha
coefficient is 0.7 (Fedorowicz et al., 2007; Nunnaly, 1978; Peterson, 1994). We therefore chose to
study the half-width of the confidence interval of this coefficient for three expected values (α=0.7,
0.8 and 0.9) in relation to p and N (same values as previously). Feldt's formula for this confidence
interval was used with type I error rate set at 0.05 (Fan and Thompson, 2001; Feldt, 1965).
Upper bound: 21 ,,025.0
11ddlddlupper
CI
Lower bound: 21 ,,975.0
11ddlddllower
CI
where 11
Nddl , 112
pNddl and represents the values of the F-distribution for
percentiles 0.025 and 0.975 respectively.
Results
Psychiatric scale characteristics
The keywords used for the search in Medline database enabled the identification of 827
studies. Amongst these, 232 articles were pre-selected on the basis of the abstracts, and a total of 56
articles met the inclusion criteria. Five of these articles showed results from factor analysis on two
of the scales selected for this review, which finally increased the total to 61 references. Table 1
contains, for each scale, the total number of references included and the number of references
extracting the same number of factors for each.
[Table 1 near here]
10
In order to estimate a pattern of factor structure encountered in psychiatric scales, the descriptive
statistical analyses were carried out over all the references without considering the number of
factors found in the scales. The means of percentages of variance accounted for by each factor
before rotation are shown in table 2 for each scale and a box-plot of these percentages over all the
references is provided in figure 1.
[Table 2 and figure 1 near here]
The loadings matrix was present in 95.1% (58) of the references. The mean of the salient
loadings was 0.626 with a median (med) of 0.636 and an interquartile range (IQR) of [0.587;
0.662]. This mean was 0.635 (med=0.642, IQR=[0.601; 0.671]) when the method of factor
extraction was PCA (80.3% - 49 - of the references) and 0.593 (med=0.601, IQR=[0.545; 0.637]) in
the case of EFA. The orthogonal rotation method was used in 63.9% (39) of the references and the
values of factor inter-correlations were reported in 34.4% (21) which represented 51 values
(mean=0.356, med=0.33, IQR=[0.155; 0.535]). Concerning the p/M ratio, on average 7.1 items
loaded on each factor in the scale (med=6, IQR=[5; 10.5]) but this number varied depending on the
number and the rank of the factors present within the scale as is shown in table 3.
[Table 3 near here]
Sample size influence on the quality of solutions obtained using PCA or EFA
Results using artificial data
Choice of the parameter values for the simulation models. The determination of λ was
based on the literature review so that λ was fixed at 0.6. Determination of the pm values was based
on the percentages shown in table 3. For example, in the three-factor model, the largest integer not
greater than 45.0p was chosen as the value for p1, the largest integer not greater than p 0.35 as
the value for p2 and the remaining items loaded on the third factor. As regards the values of factor
inter-correlations, they were set at 0.45 in the two-factor model, at 0.45 for cor(F1,F2) and 0.35 for

11
the two other inter-correlations in the three-factor model and finally, in the four-factor model, at
0.45 for cor(F1,F2), cor(F2,F4) and cor(F1,F4) and 0.35 for the three other inter-correlations. Figure
2 shows the path diagram for the three-factor simulation model with 10 items.
[Figure 2 near here]
Criteria of quality of the factor solutions. To reduce amounts of data presented in the
results, only the details concerning the three criteria ζλ, R% and W% in the case of a three-factor scale
are shown. Table 4 presents results when PCA was performed and Table 5 when it was EFA. All
three criteria, ζλ<0.05, R%>90% and W%<1% were met when N= 500 if the scale contained less than
25 items, and when N=300 if the scale contained 25 items or more in the case of PCA. When EFA
was performed, N needed to be larger to reach the thresholds: 1 000 if the scale contained less than
20 items, 500 if there were 25 items or more. For a two-factor scale, on the whole, N could be
smaller to meet the thresholds: 300 unless the scale contained less than 30 items and EFA was used,
in which case N needed to be 500. In contrast, with both methods of factor analysis, a higher N
value (500) was necessary when the scale contained four factors (and the criteria were not satisfied
when N=1 000 in the case of EFA and p below 20). Concerning the percentage of simulations
where Heywood cases occurred when EFA was performed, it was always under 2% whatever the
number of factors in the scale with these values of N.
[Table 4 and table 5 near here]
In order to narrow the sample size required to meet the criteria, we interpolated values from
the curves representing σλ in relation to N for the two methods of factor extraction, and each value
of p and M. The junction between these curves and the line corresponding to σλ=0.05 allowed the
determination of the sample sizes required with a precision of 50 subjects. Results are summarized
in table 6. Numbers reported in this table were always overestimated and at these sample sizes, the
two other criteria were always met.
[Table 6 near here]
12
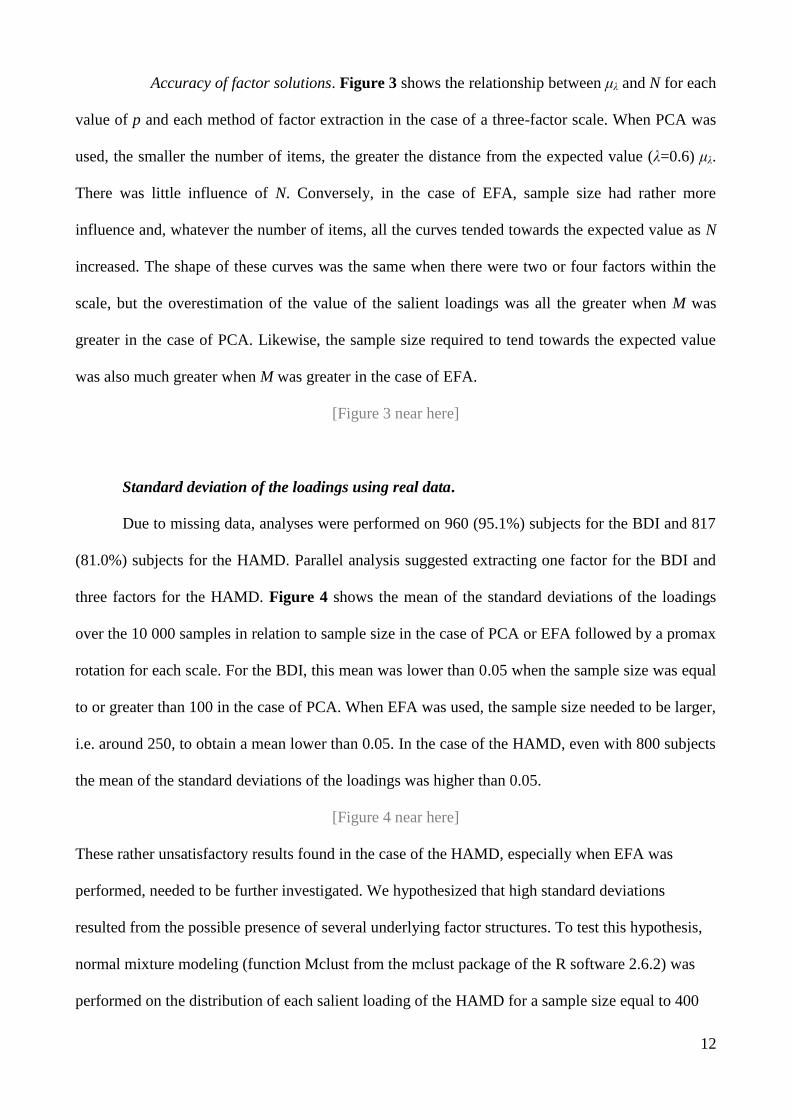
Accuracy of factor solutions. Figure 3 shows the relationship between μλ and N for each
value of p and each method of factor extraction in the case of a three-factor scale. When PCA was
used, the smaller the number of items, the greater the distance from the expected value (λ=0.6) μλ.
There was little influence of N. Conversely, in the case of EFA, sample size had rather more
influence and, whatever the number of items, all the curves tended towards the expected value as N
increased. The shape of these curves was the same when there were two or four factors within the
scale, but the overestimation of the value of the salient loadings was all the greater when M was
greater in the case of PCA. Likewise, the sample size required to tend towards the expected value
was also much greater when M was greater in the case of EFA.
[Figure 3 near here]
Standard deviation of the loadings using real data.
Due to missing data, analyses were performed on 960 (95.1%) subjects for the BDI and 817
(81.0%) subjects for the HAMD. Parallel analysis suggested extracting one factor for the BDI and
three factors for the HAMD. Figure 4 shows the mean of the standard deviations of the loadings
over the 10 000 samples in relation to sample size in the case of PCA or EFA followed by a promax
rotation for each scale. For the BDI, this mean was lower than 0.05 when the sample size was equal
to or greater than 100 in the case of PCA. When EFA was used, the sample size needed to be larger,
i.e. around 250, to obtain a mean lower than 0.05. In the case of the HAMD, even with 800 subjects
the mean of the standard deviations of the loadings was higher than 0.05.
[Figure 4 near here]
These rather unsatisfactory results found in the case of the HAMD, especially when EFA was
performed, needed to be further investigated. We hypothesized that high standard deviations
resulted from the possible presence of several underlying factor structures. To test this hypothesis,
normal mixture modeling (function Mclust from the mclust package of the R software 2.6.2) was
performed on the distribution of each salient loading of the HAMD for a sample size equal to 400
13
(10000 samplings). The hypothesis of a unique component was systematically rejected and the
number of components which optimized the Bayesian Information Criterion (BIC), ranged from
two to six with a mode equal to three (the simulation program ruled out the possibility of an
artificial phenomenon of label switching).
Influence of sample size on the precision of Cronbach’s alpha coefficient
The half-width of the 95% confidence interval of Cronbach‟s alpha coefficient in relation to
N for the three expected values (α=0.7, 0.8 and 0.9) is shown in figure 5. Only the two extreme
values for the number of items (p=10 and 45) are represented because, as can be seen from this
figure, there was little influence of p on the precision of Cronbach‟s alpha coefficient in the
conditions studied here. A half-width of 0.05 was reached when N=300 for α=0.7, 150 for α=0.8
and only 50 for α=0.9.
[Figure 5 near here]
Discussion
These simulation studies, approaching as closely as possible the conditions usually met in
practice during an internal validity study on a psychiatric scale, provide an answer to researchers
facing the unavoidable issue of sample size in this field. When the factor structure underlying the
instrument is clear, Table 6 gives the estimates for the numbers of subjects required to obtain stable
and accurate solution in factor analysis in various usual conditions, defined by the number of items
and the number of factors present within a psychiatric scale. These estimates can then be adapted to
the results set out in figure 5 according to the desired precision of the Cronbach‟s alpha coefficient.
As shown by the simulation study using artificial data, a sample size of 300 is generally
required, but it needs to be increased in three cases: when the number of factors within the scale is
large, when EFA is chosen as the method for factor extraction and when the number of items is
small. One of the most important results of this study is this last point. Indeed, it shows how the use

14
of the N/p ratio rule can be deleterious, particularly for scales with a small number of items. This is
consistent with the conclusions drawn by other recent simulation studies on sample size in factor
analysis. These studies did not however provide a simple answer to the sample size issue because of
the wide ranges of the parameter values (λ, p, M) studied (Guadagnoli and Velicer, 1988; Hogarty et
al., 2005; MacCallum et al., 1999; Mundfrom et al., 2005; Velicer and Fava, 1998). Another
important result concerns the choice between the two different methods of factor extraction.
Criticisms have been voiced in the literature against the use of the PCA. The common factor model
rests on the assumption of the existence of latent variables that explain the inter-item correlations
observed. It is often remarked that PCA is not fully compatible with this assumption (Costello and
Osborn, 2005; Fabrigar et al., 1999; Floyd and Widaman, 1995). Another criticism concerns the
part of variance taken into account to estimate the loadings. In the common factor model, the shared
variance of each item is partitioned from its unique variance and error variance whereas in PCA,
this distinction is not made (Fabrigar et al., 1999; Ford et al., 1986; Widaman, 1993). Relationships
between items are therefore overestimated and in the conditions occurring in psychiatry, loading
estimates obtained by PCA are all the more overestimated when p is small and M large; and when N
is large, this bias does not diminish (figure 3). The use of EFA is therefore recommended in this
field to obtain factor solutions with a lesser bias.
Considering the difficulty in recommending a general rule for sample size calculation valid
in all the fields to which psychometric procedures apply, the literature review made it possible to
determine an "average" pattern of factor structure characteristic of psychiatric scales. While a
review is not as accurate as a formal meta-analysis, it suggested that, in psychiatry, a particular
factor structure is generally observed. Factors are correlated, salient loadings are close to 0.6 and
there is a rather good factor overdetermination with an average p/M ratio greater than 7. The
simulation of the categorical data was then performed on the basis of these characteristics and took
into account different levels of floor and ceiling effects for each item. This was not the case in the
previous simulation studies exploring sample size in factor analysis (Guadagnoli and Velicer, 1988;

15
Hogarty et al., 2005; MacCallum et al., 1999; Mundfrom et al., 2005; Velicer and Fava, 1998;
Velicer et al., 1982). The conditions encountered in psychiatry were therefore nearly reproduced in
the artificial data. This helped to obtain results appropriate to this field that can be easily used in
practice.
Concerning the limitations of the present results, two assumptions were made that could
have artificially increased the strength of the artificial data as compared to real psychiatric data. One
of these assumptions concerns the equality of the salient loadings. The absence of any significant
influence of this on the quality of the factor solutions has been highlighted in a simulation study
conducted by Velicer and Fava in 1998 (Velicer and Fava, 1998). The other assumption relates to
simple structure (absence of cross-loadings and non-salient loadings set at zero). The simulation
study based on real data suggests that the sample sizes recommended here could be underestimated.
This is not sure. Different factor solutions were observed after resampling from the real data set.
The standard deviations of loadings were thus high because of the melded fluctuations due to
sampling and to the mixture of factor solutions. The interpretation of these standard deviations is
not straightforward and, obviously, future studies are needed to further explore this area. At this
point, we can conclude that sample sizes presented in the table 6 represent minimal values
determined from an idealized situation in which the common factor model is true. In practice, the
stability of a solution obtained from real data can require a larger sample size. Of course, the
present results are based on an “average” psychiatric scale and can vary according the properties of
a given instrument. However, certain elements of knowledge concerning p and M could help to
obtain a clearer idea. For example, determination of the internal validity of a five-factor psychiatric
scale requires at least 400 subjects if PCA is chosen as the method of factor extraction, and 450 in
the case of EFA. Finally, we chose to study the influence of sample size on the precision of
Cronbach‟s alpha coefficient, but recent developments suggest more appropriate methods for
reliability estimation, such as those based on nonlinear structural equation modelling (Green et al.,
2009) or estimation of the greatest lower bound (Sijtsma, 2009a). However, debate is still open

16
concerning which method should be used (Sijtsma, 2009b) and the Cronbach‟s alpha coefficient is
by far the most used in practice.
Conclusion
The rule of the N/p ratio, which has already been criticised in previous studies on required
sample sizes for factor analysis, is not upheld by the results of this simulation study, and researchers
should refrain from using it. The validation of short scales (i.e. with a small number of items) does
not warrant smaller sample size. If one‟s aim is to reveal the factor structure, under the hypothesis
that the underlying common factor model is true, a minimum of 300 subjects is generally acceptable
in the conditions encountered in the field of psychiatry. This sample size needs, however, to be
larger when the expected number of factors within the scale is large. Furthermore, this study shows
that, to obtain more accurate solutions, researchers should choose EFA as the method for factor
extraction.
Acknowledgements
The authors wish to thank the two reviewers for their helpful suggestions especially concerning the
addition of simulations based on real data.
Declaration of interest statement
The authors have no competing interests.
17
Appendix
The common factor model postulates that each observed variable is a linear function of one
or more common factors and one unique factor. Its fundamental equation can be written:
jMjMmjmjjjFFFFy ......
2211
where yj is the vector of the N subjects' answers to the item j (j=1 to p) and Fm the vector of the N
subjects' non-observable scores on the common factor m (m=1 to M). Each item j loads on each
common factor m with the factor loading λjm. The unique factor εj, for each item j is independent
( ) from all the Fm and from the other ε(j’≠j) (Brown, 2006). In our simulation model, two
hypotheses are set out. The first is the existence of a simple structure, i.e. each item loads on a
single factor and all the non-salient loadings are equal to zero. The second is that all salient loadings
(λ) are equal. Therefore, if the p1 first items load only onto the first factor F1, the p2 following items
load onto F2, …, the pm following onto Fm, …, and the pm last items onto FM, ( ppM
m m 1
), then
all the answers to a p item scale can be modelled as:
],1[1
pj , jj
Fy 1
'
]),1[(21
ppj , jj
Fy 2
'
]),1[()1( mm
ppj
, jmj
Fy '
]),1[()1( MM
ppj
, jMj
Fy '
where ],1[ pj , εj ~ N(0,1) and εj ε(j’≠j)
and ],1[ Mm , Fm ~ N(0,1) and Fm εj
In this model, the coefficient λ’ is not directly equal to the salient loadings. Indeed, in order to
preserve the variances of the yj equal to unity, standardization is required using the factor 2
'1
1
.

18
Individual data can therefore be simulated in a matrix where each row represents the answers of one
individual to all p items in the scale and each column represents the answers of the N individuals to
one item. If i represents subjects (i = 1 to N), the answer of the subject i to the item j is:
],1[ Ni , ],1[ Mm , ]),1[()1( mm
ppj
, 2
'1
'
ijmi
ij
Fy
To introduce correlations between factors in this simulation model, each factor is modelled using a
term specific to each factor (fm ~ N(0,1)) and a term common to all factors (C ~ N(0,1)):
CbfaFmmmm
Thus, the proportions of each of these terms, am and bm, make it possible to control for the factor
inter-correlation levels with solely the constraint that 122
mmba to preserve the variances of
factors equal to unity. A last stage is necessary to obtain a non-symmetrical distribution of
categorical data, as for data encountered in a real internal validity study on a psychiatric scale, for
example, answers to a four-point Likert scale. The conversion of the yij into integral numbers from
one to four is performed using three breakpoints in their distribution N(0,1). For each item j, these
three breakpoints are (-1+δj), (0+δj), and (1+δj) where δj is drawn from a uniform distribution
between [-0.5, 0.5] to introduce asymmetry and thus simulate floor and ceiling effects. The data
simulation was performed using R software 2.6.2.; vectors εj, fm and C were generated using the
function rnorm and δj using runif.

19
References
* References marked with an asterisk were included in the literature review
*Adachi N., Onuma T., Nishiwaki S., Murauchi S., Akanuma N., Ishida S., Takei N. (2000). Inter-
ictal and post-ictal psychoses in frontal lobe epilepsy: a retrospective comparison with psychoses in
temporal lobe epilepsy. Seizure; 9, 328-35, DOI: 10.1053/seiz.2000.0413S1059-1311(00)90413-8
[pii]
Aleamoni L. M. (1973). Effects of size of sample on eigenvalues, observed communalities, and
factor loadings. J Appl Psychol; 58, 266-9, DOI: 10.1037/h0035429
*Basker M., Moses P. D., Russell S., Russell P. S. (2007). The psychometric properties of Beck
Depression Inventory for adolescent depression in a primary-care paediatric setting in India. Child
Adolesc Psychiatry Ment Health; 1, 8, DOI: 1753-2000-1-8 [pii]10.1186/1753-2000-1-8
*Beck A. T. (1991). Relationship between the Beck Anxiety Inventory and the Hamilton Anxiety
Rating Scale with anxious outpatients. J Anxiety Disord; 5, 213-23, DOI: 10.1016/0887-
6185(91)90002-B
Beck A. T., Ward C. H., Mendelson M., Mock J., Erbaugh J. (1961). An inventory for measuring
depression. Arch Gen Psychiatry; 4, 561-71.
*Bell M. D., Lysaker P. H., Beam-Goulet J. L., Milstein R. M., Lindenmayer J. P. (1994). Five-
component model of schizophrenia: assessing the factorial invariance of the positive and negative
syndrome scale. Psychiatry Res; 52, 295-303, DOI: 0165-1781(94)90075-2 [pii]
*Bonicatto S., Dew A. M., Soria J. J. (1998). Analysis of the psychometric properties of the
Spanish version of the Beck Depression Inventory in Argentina. Psychiatry Res; 79, 277-85, DOI:
S0165-1781(98)00047-X [pii]
*Bonilla J., Bernal G., Santos A., Santos D. (2004). A revised Spanish version of the Beck
Depression Inventory: psychometric properties with a Puerto Rican sample of college students. J
Clin Psychol; 60, 119-30, DOI:10.1002/jclp.10195
Brown T. A. (2006). Confirmatory factor analysis for applied research. New York: The Guilford
Press.
*Castro-Costa E., Uchoa E., Firmo J. O., Lima-Costa M. F., Prince M. (2008). Association of
cognitive impairment, activity limitation with latent traits in the GHQ-12 in the older elderly. The
Bambui Health and Aging Study (BHAS). Aging Clin Exp Res; 20, 562-8, DOI: 5323 [pii]
Cattell R. B. (1978). The scientific use of factor analysis in behavioral and life sciences. New York
Plenum press.
*Chapman L. K., Williams S. R., Mast B. T., Woodruff-Borden J. (2009). A confirmatory factor
analysis of the Beck Anxiety Inventory in African American and European American young adults.
J Anxiety Disord; 23, 387-92, DOI: S0887-6185(08)00218-1 [pii]10.1016/j.janxdis.2008.12.003
Comrey A. L. (1978). Common Methodological Problems in Factor Analytic Studies. J Consult
Clin Psych; 46, 648-59, DOI: 10.1037/0022-006X.46.4.648
20
Comrey A. L., Lee H. B. (1992). A first course in factor analysis. Hillsdale, New Jersey: Lawrence
Erlbaum Associates.
Costello A. B., Osborn J. W. (2005). Best Practices in Exploratory Factor Analysis: Four
Recommendations for Getting the Most From Your Analysis. Practical Assessment, Research &
Evaluation; 10.
*Dagnan D., Jahoda A., McDowell K., Masson J., Banks P., Hare D. (2008). The psychometric
properties of the Hospital Anxiety and Depressions Scale adapted for use with people with
intellectual disabilities. J Intell Disabil Res; 52, 942-9, DOI: JIR1053 [pii]10.1111/j.1365-
2788.2008.01053.x
*Dawkins N., Cloherty M. E., Gracey F., Evans J. J. (2006). The factor structure of the Hospital
Anxiety and Depression Scale in acquired brain injury. Brain Injury; 20, 1235-9, DOI:
V041611313646066 [pii]10.1080/02699050601076414
Everitt B. S. (1975). Multivariate analysis: the need for data, and other problems. Brit J Psychiat;
126, 237-40, DOI: 10.1192/bjp.126.3.237
Fabrigar L. R., Wegener D. T., MacCallum R. C., Strahan E. J. (1999). Evaluating the Use of
Exploratory Factor Analysis in Psychological Research. Psychol Methods; 4, 272-99, DOI:
10.1037/1082-989X.4.3.272
Fan X., Thompson B. (2001). Confidence Intervals about Score Reliability Coefficients, Please: An
EPM Guideline Editorial. Educ Psychol Meas; 61, 517-31, DOI: 10.1177/0013164401614001
*Farrell G. A. (1998). The mental health of hospital nurses in Tasmania as measured by the 12-item
General Health Questionnaire. J Adv Nurs; 28, 707-12, DOI: 10.1046/j.1365-2648.1998.00735
Fedorowicz V. J., Falissard B., Foulon C., Dardennes R., Divac S. M., Guelfi J. D., Rouillon F.
(2007). Factors associated with suicidal behaviors in a large French sample of inpatients with eating
disorders. Int J Eat Disorder; 40, 589-95, DOI: 10.1002/eat.20415
Feldt L. S. (1965). The approximate sampling distribution of Kuder-Richardson reliability
coefficient twenty. Psychometrika; 30, 357-70, DOI: 10.1007/BF02289499
Floyd F. J., Widaman K. F. (1995). Factor analysis in the development and refinement of clinical
assessment instruments. Psychol Assessment; 7, 286-99, DOI: 10.1037/1040-3590.7.3.286
Ford J. K., MacCallum R. C., Tait M. (1986). The application of exploratory factor analysis in
applied psychology: a critical review and analysis. Personnel Psychology; 39, 291-314, DOI:
10.1111/j.1744-6570.1986.tb00583.x
*Fresan A., De la Fuente-Sandoval C., Loyzaga C., Garcia-Anaya M., Meyenberg N., Nicolini H.,
Apiquian R. (2005). A forced five-dimensional factor analysis and concurrent validity of the
Positive and Negative Syndrome Scale in Mexican schizophrenic patients. Schizophr Res; 72, 123-
9, DOI:10.1016/j.schres.2004.03.021
*Friedman S., Samuelian J. C., Lancrenon S., Even C., Chiarelli P. (2001). Three-dimensional
structure of the Hospital Anxiety and Depression Scale in a large French primary care population
suffering from major depression. Psychiatry Res; 104, 247-57, DOI: S0165-1781(01)00309-2 [pii]
*Gabryelewicz T., Styczynska M., Pfeffer A., Wasiak B., Barczak A., Luczywek E., Androsiuk W.,
Barcikowska M. (2004). Prevalence of major and minor depression in elderly persons with mild

21
cognitive impairment--MADRS factor analysis. Int J Geriatr Psych; 19, 1168-72, DOI:
10.1002/gps.1235
*Galinowski A., Lehert P. (1995). Structural validity of MADRS during antidepressant treatment.
Int Clin Psychopharm; 10, 157-61, DOI: 10.1097/00004850-199510030-00004
*Gorenstein C., Andrade L., Vieira Filho A. H., Tung T. C., Artes R. (1999). Psychometric
properties of the Portuguese version of the Beck Depression Inventory on Brazilian college
students. J Clin Psychol; 55, 553-62, DOI: 10.1002/(SICI)1097-4679(199905)55:5<553::AID-
JCLP3>3.0.CO;2-D [pii]
Gorsuch R. L. (1983). Factor Analysis London: Lawrence Erlbaum Associates.
Green S. A., Yang Y. (2009). Reliability of summed item scores using structural equation
modeling: an alternative to coefficient alpha. Psychometrika; 74, 155-67, DOI: 10.1007/S11336-
008-9099-3
*Grunebaum M. F., Keilp J., Li S., Ellis S. P., Burke A. K., Oquendo M. A., Mann J. J. (2005).
Symptom components of standard depression scales and past suicidal behavior. J Affect Disorders;
87, 73-82, DOI: S0165-0327(05)00073-X [pii] 10.1016/j.jad.2005.03.002
*Guadagnoli E., Velicer W. F. (1988). Relation of sample size to the stability of component
patterns. Psychol Bull; 103, 265-75, DOI: 10.1037/0033-2909.103.2.265
Hamilton M. (1960). A rating scale for depression. J Neurol Neurosurg Psychiatry; 23, 56-62,
*Hankins M. (2008). The factor structure of the twelve item General Health Questionnaire (GHQ-
12): the result of negative phrasing? Clinical Practice and Epidemiology in Mental Health 4, 10,
DOI: 1745-0179-4-10 [pii]10.1186/1745-0179-4-10
*Harvey P. D., Davidson M., White L., Keefe R. S., Hirschowitz J., Mohs R. C., Davis K. L.
(1996). Empirical evaluation of the factorial structure of clinical symptoms in schizophrenia: effects
of typical neuroleptics on the brief psychiatric rating scale. Biol Psychiatry; 40, 755-60, DOI: 0006-
3223(95)00486-6 [pii]10.1016/0006-3223(95)00486-6
*Helm H. W., Jr., Boward M. D. (2003). Factor structure of the Beck Depression Inventory in a
university sample. Psychol Rep; 92, 53-61.
Hogarty K. Y., Hines C. V., Kromrey J. D., Ferron J. M., Mumford K. R. (2005). The Quality of
Factor Solutions in Exploratory Factor Analysis: The Influence of Sample Size, Communality, and
Overdetermination Educ Psychol Meas; 65, 202-6, DOI: 10.1177/0013164404267287
*Honey G. D., Sharma T., Suckling J., Giampietro V., Soni W., Williams S. C., Bullmore E. T.
(2003). The functional neuroanatomy of schizophrenic subsyndromes. Psychol Med; 33, 1007-18,
DOI:10.1017/S0033291703007864
*Hu Y., Stewart-Brown S., Twigg L., Weich S. (2007). Can the 12-item General Health
Questionnaire be used to measure positive mental health? Psychol Med; 37, 1005-13,
DOI:10.1017/S0033291707009993
*Iwata N., Mishima N., Okabe K., Kobayashi N., Hashiguchi E., Egashira K. (2000). Psychometric
properties of the State-Trait Anxiety Inventory among Japanese clinical outpatients. J Clin Psychol;
56, 793-806, DOI: 10.1002/(SICI)1097-4679(200006)56:6<793::AID-JCLP8>3.0.CO;2-4 [pii]

22
*Iwata N., Mishima N., Shimizu T., Mizoue T., Fukuhara M., Hidano T., Spielberger C. D. (1998).
Positive and negative affect in the factor structure of the State-Trait Anxiety Inventory for Japanese
workers. Psychol Rep; 82, 651-6, DOI: 10.2466/PR0.82.2.651-656
Jackson J. E. (1991). A user's guide to principal components. New York: John Wiley & sons.
*Jo S. A., Park M. H., Jo I., Ryu S. H., Han C. (2007). Usefulness of Beck Depression Inventory
(BDI) in the Korean elderly population. Int J Geriatr Psych; 22, 218-23, DOI: 10.1002/gps.1664
*Kabacoff R. I., Segal D. L., Hersen M., Van Hasselt V. B. (1997). Psychometric properties and
diagnostic utility of the Beck Anxiety Inventory and the State-Trait Anxiety Inventory with older
adult psychiatric outpatients. J Anxiety Disord; 11, 33-47, DOI: S0887618596000333 [pii]
*Kay S. R., Sevy S. (1990). Pyramidical model of schizophrenia. Schizophr Bull; 16, 537-45,
DOI:10.1016/0165-1781(94)90075-2
*Kilic C., Rezaki M., Rezaki B., Kaplan I., Ozgen G., Sagduyu A., Ozturk M. O. (1997). General
Health Questionnaire (GHQ12 &GHQ28) : psychometric properties and factor structure of the
scales in a Turkish primary care sample. Soc Psychiatry Psychiatr Epidemiol; 32, 327-31, DOI:
10.1007/BF00805437
*Killgore W. D. (1999). Empirically derived factor indices for the Beck Depression Inventory.
Psychol Rep; 84, 1005-13.
*Lachar D., Bailley S. E., Rhoades H. M., Espadas A., Aponte M., Cowan K. A., Gummattira P.,
Kopecky C. R., Wassef A. (2001). New subscales for an anchored version of the Brief Psychiatric
Rating Scale: construction, reliability, and validity in acute psychiatric admissions. Psychol
Assessment; 13, 384-95, DOI: 10.1037/1040-3590.13.3.384
*Lancon C., Reine G., Llorca P. M., Auquier P. (1999). Validity and reliability of the French-
language version of the Positive and Negative Syndrome Scale (PANSS). Acta Psychiatr Scand;
100, 237-43, DOI: 10.1111/j.1600-0447.1999.tb10851.x
*Lee K. H., Harris A. W., Loughland C. M., Williams L. M. (2003). The five symptom dimensions
and depression in schizophrenia. Psychopathology; 36, 226-33, DOI: 10.1159/000073447
PSP2003036005226 [pii]
*Lindenmayer J. P., Czobor P., Volavka J., Lieberman J. A., Citrome L., Sheitman B., McEvoy J.
P., Cooper T. B., Chakos M. (2004). Effects of atypical antipsychotics on the syndromal profile in
treatment-resistant schizophrenia. J Clin Psychiat; 65, 551-6.
Loo R. (1983). Caveat on Sample Sizes in Factor Analysis. Percept Mot Skills; 56, 371-4.
*Lopez-Castedo A., Fernandez L. (2005). Psychometric properties of the Spanish version of the 12-
item General Health Questionnaire in adolescents. Percept Mot Skills 100, 676-80.
*Loza B., Kucharska-Pietura K., Kopacz G., Debowska G. (2003). Factor structure of paranoid
schizophrenia: a prospective study. Psychopathology; 36, 132-41, DOI: 10.1159/000071258
PSP2003036003132 [pii]
*Lykouras L., Oulis P., Psarros K., Daskalopoulou E., Botsis A., Christodoulou G. N., Stefanis C.
(2000). Five-factor model of schizophrenic psychopathology: how valid is it? Eur Arch Psy Clin N;
250, 93-100, DOI: 10.1007/s004060070041
23
MacCallum R. C., Widaman K. F., Zhang S., Hong S. (1999). Sample Size in Factor Analysis.
Psychol Methods; 4, 84-99, DOI: 10.1037/1082-989X.4.1.84
Mundfrom D. J., Shaw D. G., Ke T. L. (2005). Minimum Sample Size Recommendations for
Conducting Factor Analyses International Journal of Testing; 5, 159-68, DOI:
10.1207/s15327574ijt0502_4
*Munoz D. J., Chen E., Fischer S., Roehrig M., Sanchez-Johnson L., Alverdy J., Dymek-Valentine
M., le Grange D. (2007). Considerations for the use of the Beck Depression Inventory in the
assessment of weight-loss surgery seeking patients. Obes Surg; 17, 1097-101, DOI:
10.1007/s11695-007-9185-0
Nunnaly J. C. (1978). Psychometric theory. New York McGraw-Hill.
*Olden M., Rosenfeld B., Pessin H., Breitbart W. (2009). Measuring depression at the end of life: is
the Hamilton Depression Rating Scale a valid instrument? Assessment; 16, 43-54, DOI:
1073191108320415 [pii] 10.1177/1073191108320415
*Pallant J. F., Bailey C. M. (2005). Assessment of the structure of the Hospital Anxiety and
Depression Scale in musculoskeletal patients. Health Qual Life Out; 3, 82, DOI: 1477-7525-3-82
[pii] 10.1186/1477-7525-3-82
*Parker R. D., Flint E. P., Bosworth H. B., Pieper C. F., Steffens D. C. (2003). A three-factor
analytic model of the MADRS in geriatric depression. Int J Geriatr Psych; 18, 73-7, DOI:
10.1002/gps.776
Peterson R. A. (1994). A Meta-Analysis of Cronbach's Coefficient Alpha. J Consum Res; 21, 381-
91, DOI: 10.1086/209405
*Powell R. (2003). Psychometric properties of the Beck Depression Inventory and the Zung Self
Rating Depression Scale in adults with mental retardation. Ment Retard; 41, 88-95, DOI:
10.1352/0047-6765(2003)041<0088:PPOTBD>2.0.CO;2
R Development Core Team (2008). R: A language and environment for statistical computing.
Vienna, Austria: R Foundation for statistical Computing.
Revelle W. (2008). R Documentation: Procedures for Personality, Psychometric, and Psychological
Research. Help pages for package „psych‟ version 1.0-58: Principal Axis Factor Analysis: CRAN.
*Salamero M., Marcos T., Gutierrez F., Rebull E. (1994). Factorial study of the BDI in pregnant
women. Psychol Med; 24, 1031-5.
*Salokangas R. K., Honkonen T., Stengard E., Koivisto A. M. (2002). Symptom dimensions and
their association with outcome and treatment setting in long-term schizophrenia. Results of the DSP
project. Nord J Psychiat; 56, 319-27, DOI: 10.1080/080394802760322079
*Sanchez-Lopez Mdel P., Dresch V. (2008). The 12-Item General Health Questionnaire (GHQ-12):
reliability, external validity and factor structure in the Spanish population. Psicothema; 20, 839-43.
*Serretti A., Jori M. C., Casadei G., Ravizza L., Smeraldi E., Akiskal H. (1999). Delineating
psychopathologic clusters within dysthymia: a study of 512 out-patients without major depression. J
Affect Disorders; 56, 17-25, DOI: S0165-0327(99)00056-7 [pii]

24
*Shek D. T. (1990). Reliability and factorial structure of the Chinese version of the Beck
Depression Inventory. J Clin Psychol; 46, 35-43, DOI: 10.1002/1097-4679(199001)46:1<35::AID-
JCLP2270460106>3.0.CO;2-W
Sijtsma K. (2009a). On the use, the misuse, and the very limited usefulness of Cronbach's alpha.
Psychometrika; 74, 107-20, DOI: 10.1007/S11336-008-9101-0
Sijtsma K. (2009b). Reliability beyond theory and into practice. Psychometrika; 74, 169-73, DOI:
10.1007/S11336-008-9103-Y
*Smith A. B., Selby P. J., Velikova G., Stark D., Wright E. P., Gould A., Cull A. (2002). Factor
analysis of the Hospital Anxiety and Depression Scale from a large cancer population. Psychol
Psychother; 75, 165-76.
*Steer R. A., Beck A. T., Brown G. (1989). Sex differences on the revised Beck Depression
Inventory for outpatients with affective disorders. J Pers Assess; 53, 693-702, DOI:
10.1207/s15327752jpa5304_6
*Steer R. A., Kumar G., Ranieri W. F., Beck A. T. (1995). Use of the Beck Anxiety Inventory with
adolescent psychiatric outpatients. Psychol Rep; 76, 459-65.
*Steer R. A., Rissmiller D. J., Ranieri W. F., Beck A. T. (1993). Structure of the computer-assisted
Beck Anxiety Inventory with psychiatric inpatients. J Pers Assess; 60, 532-42, DOI:
10.1207/s15327752jpa6003_10
*Uslu R. I., Kapci E. G., Oncu B., Ugurlu M., Turkcapar H. (2008). Psychometric properties and
cut-off scores of the Beck Depression Inventory-II in Turkish adolescents. J Clin Psychol Med S 15,
225-33, DOI:10.1007/s10880-008-9122-y
Velicer W. F., Fava J. L. (1998). Effects of variable and subject sampling on factor pattern recovery
Psychol Methods; 3, 231-51, doi: 10.1037/1082-989X.3.2.231
Velicer W. F., Peacock A. C., Jackson D. N. (1982). A Comparison of Component and Factor
Patterns: A Monte Carlo Approach. Multivar Behav Res; 17, 371-88, DOI:
10.1207/s15327906mbr1703_5
*Ventura J., Nuechterlein K. H., Subotnik K. L., Gutkind D., Gilbert E. A. (2000). Symptom
dimensions in recent-onset schizophrenia and mania: a principal components analysis of the 24-item
Brief Psychiatric Rating Scale. Psychiatry Res; 97, 129-35, DOI: S0165178100002286 [pii]
*Villalta-Gil V., Vilaplana M., Ochoa S., Dolz M., Usall J., Haro J. M., Almenara J., Gonzalez J.
L., Lagares C. (2006). Four symptom dimensions in outpatients with schizophrenia. Compr
Psychiatry; 47, 384-8, DOI: S0010-440X(06)00019-8 [pii] 10.1016/j.comppsych.2006.01.005
*Wang Y. P., Andrade L. H., Gorenstein C. (2005). Validation of the Beck Depression Inventory
for a Portuguese-speaking Chinese community in Brazil. Braz J Med Biol Res; 38, 399-408, DOI:
S0100-879X2005000300011 [pii] /S0100-879X2005000300011
*Werneke U., Goldberg D. P., Yalcin I., Ustun B. T. (2000). The stability of the factor structure of
the General Health Questionnaire. Psychol Med; 30, 823-9, DOI: 10.1017/S0033291799002287
Widaman K. F. (1993). Common Factor Analysis Versus Principal Component Analysis:
Differential Bias in Representing Model Parameters? Multivar Behav Res; 28, 263-311, DOI:
10.1207/s15327906mbr2803_1

25
*Woolrich R. A., Kennedy P., Tasiemski T. (2006). A preliminary psychometric evaluation of the
Hospital Anxiety and Depression Scale (HADS) in 963 people living with a spinal cord injury.
Psychol Health Med; 11, 80-90, DOI: J07M627G23552610 [pii] 10.1080/13548500500294211

26
Tables
Table 1: References included and numbers of references extracting the same number of factors for
each scale
Scale References Total Number of factors
2 3 4 5 6 7
PANSS
(Bell et al., 1994; Fresan et al., 2005; Honey et al., 2003; Kay et al., 1990;
Lancon et al., 1999; Lee et al., 2003; Lindenmayer et al., 2004; Loza et al.,
2003; Lykouras et al., 2000; Salokangas et al., 2002; Villalta-Gil et al.,
2006)
11 - - 1 8 - 2
BPRS (Adachi et al., 2000; Harvey et al., 1996; Lachar et al., 2001; Ventura et al.,
2000) 4 - - 2 1 1 -
BAI (Beck, 1991; Chapman et al., 2009; Kabacoff et al., 1997; Steer et al., 1995;
Steer et al., 1993) 5 4 - 1 - - -
STAI (Iwata et al., 2000; Iwata et al., 1998; Kabacoff et al., 1997) 3 2 1 - - - -
HAMA (Beck, 1991; Serretti et al., 1999) 2 2 - - - - -
HAMD (Grunebaum et al., 2005; Olden et al., 2009) 2 - - 1 1 - -
MADRS (Gabryelewicz et al., 2004; Galinowski et al., 1995; Lee et al., 2003; Parker
et al., 2003; Serretti et al., 1999) 5 3 2 - - - -
BDI
(Basker et al., 2007; Bonicatto et al., 1998; Bonilla et al., 2004; Gorenstein
et al., 1999; Grunebaum et al., 2005; Helm et al., 2003; Jo et al., 2007;
Killgore, 1999; Munoz et al., 2007; Powell, 2003; Salamero et al., 1994;
Shek, 1990; Steer et al., 1989; Uslu et al., 2008; Wang et al., 2005)
15 9 2 3 - - 1
HADS (Dagnan et al., 2008; Dawkins et al., 2006; Friedman et al., 2001; Pallant et
al., 2005; Smith et al., 2002; Woolrich et al., 2006) 6 4 2 - - - -
GHQ
(Castro-Costa et al., 2008; Farrell, 1998; Hankins, 2008; Hu et al., 2007;
Kilic et al., 1997; Lopez-Castedo et al., 2005; Sanchez-Lopez Mdel and
Dresch, 2008; Werneke et al., 2000)
8 5 3 - - - -
Total 61 29 10 8 10 1 3

27
Table 2: Percentage of variance accounted for by each factor and numbers of references used to
estimate the means for each scale
Scale Factors
F1 F2 F3 F4 F5 F6 F7
PANSS
Mean
(Minimum – Maximum)
25.8
(14.5 – 41.2)
12.8
(8.7 – 18.6)
8.8
(6.1 – 13.4)
6.8
(3.9 – 11.1)
5.8
(3.6 – 9.3)
3.6
(3.6 – 3.7)
3.6
(3.6 – 3.7)
Number of references 11 11 11 11 10 2 2
BPRS
Mean
(Minimum – Maximum)
18.9
(12.8 – 23.3)
14.0
(9.3 – 17.2)
10.4
(8.7 – 11.7)
8.3
(6.7 – 10.0)
6.9
(6.1 – 7.8)
6.7
(. - .)
Number of references 4 4 4 4 2 1
BAI
Mean
(Minimum – Maximum)
37.6
(36.3 – 39.5)
7.2
(4.4 – 7.7)
6.2
(. - .)
5.2
(. - .)
Number of references 5 5 1 1
STAI
Mean
(Minimum – Maximum)
32.2
(29.8 – 34.3)
9.6
(7.4 – 11)
6.0
(. - .)
Number of references 3 3 1
HAMA
Mean
(Minimum – Maximum)
26.9
(20.4 – 33.5)
8.2
(6.4 – 10)
Number of references 2 2
HAMD
Mean
(Minimum – Maximum)
12.8
(12.6 – 13.0)
11.3
(11.2 - 11.4)
10.7
(10.4 – 11.0)
8.5
(7.3 – 9.8)
9.4
(. - .)
Number of references 2 2 2 2 1
MADRS
Mean
(Minimum – Maximum)
33.7
(25.1 – 41.1)
15.6
(10.4 – 26.9)
10.6
(10.2 – 1.0)
Number of references 5 5 2
BDI
Mean
(Minimum – Maximum)
29.4
(22.9 – 34.5)
8.8
(5.9 – 25.1)
6.8
(5.0 – 6.1)
5.4
(4.9 – 6.1)
6.0
(. - .)
5.5
(. - .)
4.9
(. - .)
Number of references 15 15 6 4 1 1 1
HADS
Mean
(Minimum – Maximum)
34.3
(23.6 – 41.4)
13.1
(11.4 – 16.4)
8.4
(8.1 – 8.6)
Number of references 6 6 2
GHQ
Mean
(Minimum – Maximum)
39.6
(30.3 – 50.9)
13.0
(8.5 – 25.9)
9.2
(8.6 – 9.8)
Number of references 8 8 3
Total
Mean
(Minimum – Maximum)
30.4
(12.6 - 50.8)
11.3
(4.4 – 26.9)
8.7
(5.0 – 13.4)
6.9
(3.9 – 11.1)
6.3
(3.6 – 9.4)
4.9
(3.6 – 6.7)
4.0
(3.6 – 4.9)
Number of references 61 61 32 22 14 4 3

28
Table 3: Mean of the percentages of items per factor (IQR: Interquartile Range)
Number of factors
in the scale
Factors
F1 F2 F3 F4 F5 F6 F7
2 Mean
IQR
55.7
[50.0 - 59.2]
39.0
[33.3 - 42.9]
3 Mean
IQR
43.2
[40.4 - 49.4]
34.8
[27.8 - 41.3]
20.2
[16.7 - 24.1]
4 Mean
IQR
29.1
[27.0 - 33.0]
26.6
[22.9 - 32.2]
19.3
[16.3 - 20.6]
20.3
[14.8 - 23.7]
5 Mean
IQR
22.6
[20.0 - 25.8]
20.1
[16.7 - 22.5]
15.7
[13.3 - 19.2]
16.7
[16.7 - 19.7]
15.1
[12.7 - 16.7]
6 Mean
IQR
16.7
[. - .]
22.2
[. - .]
16.7
[. - .]
16.7
[. - .]
11.1
[. - .]
16.7
[. - .]
7 Mean
IQR
24.1
[19.5 - 26.7]
22.4
[20.2 - 25.2]
12.5
[10.5 - 15.5]
15.2
[13.3 - 16.9]
12.1
[9.8 - 13.3]
6.5
[5.0 - 8.1]
7.1
[4.0 - 9.0]

29
Table 4: Values of the three criteria after PCA in the case of a three-factor scale (σλ: standard
deviation of the salient loadings obtained after rotation over the 10 000 simulations, R%: percentage
of simulations in which all the items in the scale load on the right factor, W%: mean of percentages
of items loading on the wrong factor in the scale after rotation over the 10 000 simulations, - : <
5.10-2
)
Sample size Number of items
10 15 20 25 30 35 40 45
50
σλ 0.182 0.161 0.144 0.136 0.130 0.127 0.124 0.123
R% 48.4 48.5 51.1 50.7 51.3 51.5 50.6 49.5
W% 9.3 6.5 4.4 3.4 2.7 2.3 2.1 1.9
100
σλ 0.111 0.097 0.092 0.088 0.087 0.086 0.084 0.083
R% 88.8 92.6 94.6 95.9 96.4 97.1 96.9 97.1
W% 1.5 0.6 0.3 0.2 0.1 0.1 0.1 0.1
150
σλ 0.081 0.075 0.072 0.071 0.069 0.069 0.068 0.068
R% 97.8 99.4 99.5 99.7 99.8 99.7 99.8 99.8
W% 0.3 0.1 - - - - - -
200
σλ 0.067 0.063 0.062 0.061 0.060 0.059 0.059 0.059
R% 99.5 99.9 99.8 99.8 99.9 99.9 99.9 99.8
W% 0.1 - - - - - - 0.1
300
σλ 0.052 0.050 0.051 0.049 0.049 0.049 0.048 0.048
R% 99.9 100.0 99.8 99.9 99.9 99.8 100.0 99.8
W% 0.1 - 0.1 - - 0.1 - -
500
σλ 0.039 0.039 0.039 0.039 0.038 0.037 0.037 0.038
R% 99.9 100.0 99.9 99.9 99.9 99.9 99.9 99.9
W% - - - - - - - -
1000
σλ 0.029 0.027 0.027 0.027 0.027 0.027 0.026 0.026
R% 99.9 100.0 100.0 99.9 100.0 99.9 100.0 100.0
W% 0.1 - - - - - - -

30
Table 5: Values of the three criteria after EFA in the case of a three-factor scale (σλ: standard
deviation of the salient loadings obtained after rotation over the 10 000 simulations, R%: percentage
of simulations in which all the items of the scale load on the right factor, W%: mean of percentages
of items loading on the wrong factor in the scale after rotation over the 10 000 simulations, - : <
5.10-2
)
Sample size Number of items
10 15 20 25 30 35 40 45
50
σλ 0.226 0.187 0.164 0.153 0.144 0.138 0.134 0.131
R% 31.1 34.9 40.9 43.7 45.3 47.3 47.1 46.7
W% 14.9 10.5 6.6 4.8 3.5 2.8 2.4 2.1
100
σλ 0.159 0.125 0.109 0.101 0.096 0.093 0.091 0.089
R% 70.7 86.3 92.7 95.0 95.8 96.5 96.6 96.9
W% 4.4 1.3 0.4 0.2 0.1 0.1 0.1 0.1
150
σλ 0.128 0.098 0.086 0.080 0.077 0.075 0.073 0.072
R% 89.8 98.7 99.4 99.7 99.6 99.8 99.7 99.8
W% 1.3 0.1 0.0 0.0 0.0 0.0 0.0 0.0
200
σλ 0.109 0.082 0.073 0.069 0.066 0.064 0.063 0.062
R% 96.4 99.8 99.8 99.9 99.9 99.9 99.9 99.9
W% 0.4 - - - - - - -
300
σλ 0.086 0.065 0.059 0.056 0.054 0.052 0.051 0.051
R% 99.6 99.9 99.9 99.9 99.9 99.9 100.0 99.9
W% - - - - - - - -
500
σλ 0.063 0.050 0.045 0.043 0.041 0.040 0.039 0.040
R% 99.9 99.9 100.0 99.9 100.0 99.9 100.0 99.8
W% - - - - - - - 0.1
1000
σλ 0.043 0.034 0.032 0.030 0.029 0.028 0.028 0.027
R% 100.0 100.0 99.9 100.0 100.0 100.0 100.0 100.0
W% - - - - - - - -

31
Table 6: Sample size required to meet the three criteria thresholds for quality of factor solutions (- :
>1000)
Method of factor
extraction
Number
of factors
Number of items
10 15 20 25 30 35 40 45
PCA
2 300 300 300 300 300 300 250 250
3 350 350 350 300 300 300 300 300
4 400 400 350 350 350 350 350 350
EFA
2 500 400 350 300 300 300 300 300
3 800 500 450 400 350 350 350 350
4 - - 600 500 450 400 400 400

32
Legends of figures
Figure 1: Box-plot of the percentage of variance accounted for by each factor, according the factor
rank in the scale, in all the references
Figure 2: Path diagram for the three-factor simulation model with 10 items
Figure 3: Mean of the values of the salient loadings after rotation on the 10000 simulations in
relation to sample size. Example of a three-factor scale
Figure 4: Mean of the standard deviations of the loadings over the 10 000 samples in relation to
sample size in the case of Principal Component Analysis (PCA) or Exploratory Factor Analysis
(EFA) followed by a promax rotation for the Beck Depression Inventory (BDI) and the Hamilton
Depression Rating Scale (HAMD)
Figure 5: Half-width of the 95% confidence interval of Cronbach’s alpha coefficient for three
expected values (α) in relation to the sample size and the number of items