Embed Size (px)
DESCRIPTION
A research about the difference in the academic performance of public and private elementary school graduates
Citation preview

THE DIFFERENCE OF PRIVATE AND PUBLIC ELEMENTARY SCHOOL
GRADUATES AS PERCIEVED FROM THE ACADEMIC
PERFORMANCE OF GRADE 7 STUDENTS OF
ROOSEVELT COLLEGE CUBAO
SCHOOL YEAR 2013-2014
A research paper
Presented to the faculty of
Roosevelt College Cubao
Secondary education department
In partial fulfillment of the
Requirements for graduation from
Secondary education
Mrs. Maria Thelma Demoy
Research – Adviser
Vincent Adrian Collado
Rojaimon Mosses Pacupac
Francis Arnold Barsaga
Patrick Lloyd Jacobo
Renz Chester Gumaru
John Carlo Florendo
Cyrus Paul Labarda
IV- Burgos
March 2014
CHAPTER I
THE PROBLEM AND ITS BACKGROUND
This chapter contains an overview of this study, it consists
of the parts: Background of the Study,
Theoretical/Conceptual Framework, Statement of the Problem,
Hypothesis, Significance of the Study, Scope and
Delimitation, and Definition of Terms.
BACKGROUND OF THE STUDY
In our generation, the Private and Public schools have
a huge difference. The Public and Private schools each have
their own positive and negative stereotypes. A few of these
stereotypes are: Public students are mostly bullies,
cigarette smokers, and even drug addicts. Some say that
Private school students are arrogant and lazy. The
researchers thought that if these kinds of stereotypes were
to be abolished, then our community can have equal
perceptions with each other.
We are all aware that most students coming from public
elementary schools have financial problems in their family.
We are also aware that problems can be used by a person as a
motivation to study harder. Our group realized that students

coming from public elementary schools often overwork those
coming from private schools.
Private elementary schools also have an edge against
Public elementary schools. Private elementary schools have a
small and refined community. For this reason, teachers are
able to focus their attention on individual students.
Private schools can do expulsion; this is very rare in
public elementary schools. Public schools consider that
education is a right and not a privilege. Consequently,
private elementary school students have a great advantage
against public elementary school students.
The researchers had observed that both schools have
each unique advantage against each other. One of which is
that private elementary schools have better facilities, on
the other hand Public elementary schools have better school
teachers and personnel.
The researchers conducted this study because they want
to prove that not all students coming from public elementary
schools are stupid, and not all students from private
elementary schools are arrogant. The researchers wanted to
abolish negative stereotypes which can affect the students
socially.

Theoretical And Conceptual Framework
The conceptual framework above illustrates the data to
be used by the researchers in conducting the research. The
data consists of the Profile variables of the respondents;
namely, the gender, age, and economic status; the type of
school in which they graduated, and their academic
performance in the 1st and 2nd quarter of S.Y. 2013-2014.
The Difference of Private and Public Elementary School Graduates as perceived from the
Academic Performance of Grade 7Students of Roosevelt College
Cubao S.Y. 2013 – 2014
Profile of the respondents
Gender Age Economic
Status
Type of School in which the respondents graduated in
Public elementary school
Private elementary school
Academic Performance
Statement Of The Problem
This research was aimed to know if there is a difference
between the Public elementary school graduates and Private
elementary school graduates as perceived in the academic
performance of grade 7 students of Roosevelt College Cubao
S.Y. 2013 – 2014
1. What is the profile of the grade 7 students of Roosevelt
College Cubao S.Y. 2013 – 2014 according to:
1.1 Age
1.2 Gender
1.3 Economic status
2. What is the type of elementary school in which the
respondents graduated?
2.1 Public
2.2 Private
3. What is the academic performance of the grade 7 students
of Roosevelt College Cubao in the following grading period:
3.1 First Grading Period
3.2 Second Grading Period

4. Is there a significant difference in the academic
performance of the public and private elementary school
graduates?
Hypothesis
The researchers found the hypothesis helpful as a base for
the determining assumptions and for the explanation about
the data to be gathered. We, the researchers, will be aware
about our temporary answers, we will know if it is correct
or wrong.
1. There is no significant difference between the academic
performance of private elementary school graduates and
public elementary school graduates.

Significance Of The Study
The result of this study is believed to be significant to
the students who came from either public or private
elementary schools and are subject to negative stereotypes
just because of the school they graduated in.
Students
This study will help the students clear the misunderstanding
caused by stereotypes. It can help students be more socially
aware of how they discriminate other students in using the
negative stereotypes.
The Teachers
This study will help the teachers understand their students
more and not get the wrong impression about the students
just because of the school they graduated in. The teachers
will also understand that each student is unique and must
not be judged by the stereotypes.
The Parents
This study will benefit to the parents because they will
have an idea on how they will encourage their son/daughter
to study much harder. They will also know the difference
between public and private elementary schools.

The School
The school will benefit to this study because they will have
an idea or background about students coming from public and
private elementary schools. The school can use this study as
one of the basis on which student will they take.
The Future Researchers
The future researchers can use the study as their basis on
how they are going to conduct their study. They can also
take some information from our study given that they ask
permission.
Scope and Delimitation
The object of this study is to determine the difference
in the academic performance of the public and private
elementary school graduates as shown in the given academic
performance of the grade 7 students of Roosevelt College
Cubao school year 2013 – 2014.
The researchers prepared a survey questionnaire on the
total of 133 respondents which is the total number of
respondents coming from the sections of grade 7 namely:
Sampaguita, Magnolia, and Ilang-Ilang.
This study was made because the researchers had
observed and experienced discrimination because of
stereotypes because of the type of school they graduated in.
Definition of terms
Public elementary school - An elementary school supported by
public funds and providing free or low priced education for
children of a community or district.
Private elementary school - An elementary school run and
supported by private individuals or a corporation rather
than by a government or public agency.
Stereotypes - a widely held but fixed and oversimplified
image or idea of a particular type of person or thing.
Grade 7 Students - These are the students that the
researchers have chosen to be the respondents.
Chapter II

Review of Related Studies and Related Literature
This includes related past studies of researchers, article
from books on the internet and some information aggregate to
guide us in conducting this study.
Related Studies
This contains facts based on previous studies written by
knowledgeable persons both foreign and local which provides
clearer vision for the researchers to analyze the problem
and have a wide range of information about the topic.
According to major study from the National Center for
Education Statistics (2013) public school teachers tend to
be more qualified than their private school counter-parts in
terms of education and experience. For example, they're more
likely to have a master's degree, and to have logged more
hours pursuing in-service study - learning, for example, how
to use computers in the classroom. The report also indicates
that on average, public school teachers earn higher salaries
than those in private schools do. They also stated that
private schools tend to be half as large as public schools.
Many experts feel that children are less likely to get lost
in the shuffle if they attend a smaller school, which
naturally nurtures a sense of community and belonging. In

addition, the teacher-student ratios in private schools tend
to be more favorable.
From the research entitled “All Private and Public
Elementary schools are equal” Taylor (2003) expounded that
“private school are organized around principles other than
academic outcomes, such as religious beliefs, safety or
discipline; in some cases, academic achievement was a
relatively low priority”
According to an article in the internet entitled
“Public School vs. Private Schools”: new studies study says
that there is no difference. Students in public schools
perform on average, just as well as those studying in
private schools.

Related Literature
This contains facts which are already known from previous
journals and articles both foreign and local, it also
emphasizes the relatedness between the current study and the
work of other authors; it provides a thematic narrative
which guides the formulation of the topic and suggests
strategies for making operational the independent and
dependent variables considered in the study.
According to John Cloud (2007) his study shows that
sending your kid to private school is still a better way to
ensure that he/she will get into college.
Clarence Durham (2000) suggested that “there are no
table differences in what private school offer from the
public school.”
Zebienski (2006), found out that when student
background, mainly SES, was taken into account, students
attending public schools actually outperform students at
private schools.

Chapter III
Research Design and methodology
This chapter discusses the methodology used or how the
research study was conducted. This chapter is composed of
five sectors namely: Methods of research, Respondents or
Subject of the study, Research instruments, Data gathering
procedure, and the Statistical tools.
Methods of research
The research method used in this study is the
“descriptive method of research”. This method is used to
assess “what is”. The main purpose of this kind of research
is to explain the data and the characteristics about the
topic. According to the book entitled “Principles and
Methods of Research” by Carmelita Cruz (2009), the
Descriptive method may be defined as a purposive process of
gathering, analyzing, classifying and tabulating data. It
usually uses survey questionnaires to gather data.
Respondents of the study
The research revolves around the respondents because
they are the source of the required data and the necessary
information. Consequently, the respondents are very
important in each research study. Each study needs a
particular set of respondents for them to make a conclusion
about the problem that they are discussing. In this study,
the chosen respondents are the grade 7 students of Roosevelt
College Cubao. This is because, objectively, these students
are fresh from their elementary years. The researchers did
not use any sampling technique.
Locale of the Study
The study was conducted inside the premises of
Roosevelt College Cubao. Roosevelt College Cubao is a
Private non-sectarian school, which provides a good quality
of education; it offers a curriculum which makes its
graduates stand out among other students.
Research Instruments
Research Instrument refers to the tool used to gather
data that are necessary. Obviously, data is very important
in a study due to the fact that it provides the basis for
observations. In order to obtain the data needed, the
researchers used the questionnaire as the research
instrument. The questionnaire intends to gather personal
information or demographic background of the chosen
respondents. This involves the name, year level, monthly
income, gender, and kind of elementary school they graduated
in. The researchers also collected the grades of the
respondents in the 1st and 2nd grading quarters.
School Records
To determine the verbal interpretation of the academic
performance of the respondents, the researchers had noted a
letter that asked the Guidance Counselor to get the
respondent’s record. The records of the respondents were
copied and were checked carefully by the researchers in
order to avoid inaccurate information. The grades were
classified as:
Proficient: 90% and above
Advanced: 85% - 89%
Approaching Proficient: 80% - 84%
Developing: 75% - 79%
Beginning: 74 and below
Data Gathering Procedure
Data is everywhere. To make serious use of it, we need
to choose the specific data we need to gather. The
researchers followed many steps to gather the data needed
for the study. The steps undertaken were specifically
discussed in detail in this section of the research paper.

First of all, the researchers sought to answer the
permission of the School Head with a letter noted by their
research adviser. After which, the researchers set the
schedule for the survey.
After the validation of the permission to conduct a
study from Mrs. Clarita Zantua and to get information about
the students from Mrs. Nimfa Robert, the researchers then
prepared the questionnaires and conducted the survey. For
every classroom in the 7th Grade, the researchers introduced
themselves as a group and also introduced the topic of the
research paper, its purpose and why were they selected as
the respondents of the study. The questionnaires will be
given in the respondents and they will answer it on how they
evaluate their selves. The information that will be gathered
is one of the most important things in the study; it will
help the researchers to answer all the questions that are
present in the statement of the problem.
Statistical tools
This part presents the different formulas/equations
used in computations for the interpretation of the different
data gathered and for the correlation of the different
variables included in the research study.

Percentage Distribution
This tool is used to express the percentage of the total
frequency that is equated to 100. This was needed to gather
the percentage of the frequency of responses for a specific
problem
Formula:
%= fnx 100
Where:
f – Frequency of respondents
n – Number of the total respondents
Mean
The mean was used to measure the central tendency of the
academic performance of the grade 7 students. The mean is
computed be adding all the scores and dividing by the number
of scores.
x=∑ x in
Where:

∑ x i = the sum of all the scores
n = number of scores
Standard deviation
It tells how tightly all the various examples are clustered
around the mean in a set of data.
s=√∑ ( x−x )2
(n )
Where
x= ungrouped data
x= mean of the data
s= Standard Deviation
n= number of measurements
T-Test

It is used to calculate the significant difference existing
among the groups only. It is used by the researchers to
calculate the difference between these factors comparing
with only two variables.
t=|x1−x2|
√(s1)2
n1+(s2)
2
n2
CHAPTER IV

PRESENTATION, INTERPRETATION AND ANALYSIS OF DATA
This chapter includes the presentation of the data
gathered and the entailing interpretation and the analysis
of the findings.
I. PROFILE OF THE RESPONDENTS
The researchers used the grade 7 students as the
respondents of the study. There are 133 students in the
grade 7 year level and the researchers utilized all of them
in the study.
Table 1.1
DISTRIBUTION OF RESPONDENTS ACCORDING TO AGE
AGE Freq. %
11 1 0.75%
12 68 51.13%
13 56 42.11%
14 7 5.26%
15 1 0.75%
Total 133 100%Table 1.1 shows the distribution of the respondents
according to age of the grade 7 students of Roosevelt
College Cubao. There are 68 or 51.13% of the total
respondents who are 12 years old; 56 or 42.11% of the total
respondents who are 13 years old; there are 6 or 5.26% of

the total respondents who are 14 years old; and 1 or 0.75%
of the total respondents are 11 and 15 years old with the
total of 133 respondents.
This table implies that most of the grade 7 students
are 12-13 years old, and very few of the grade 7 are 11, 14,
and 15 years old.
Table 1.2
DISTRIBUTION OF RESPONDENTS ACCORDING TO GENDER
Gender Freq. %
Male 67 50.38%
Female 66 49.62%
Total 133 100%
Table 1.2 shows the distribution of the respondents
when grouped according to gender. The respondents are made
up of 67 or 50.38% male and 66 or 49.62% female students
with the total of 133 respondents.
This table shows that the Male respondents exceed the
Female respondents by 1 only, which implies that there is no
large difference between the genders of the respondents.
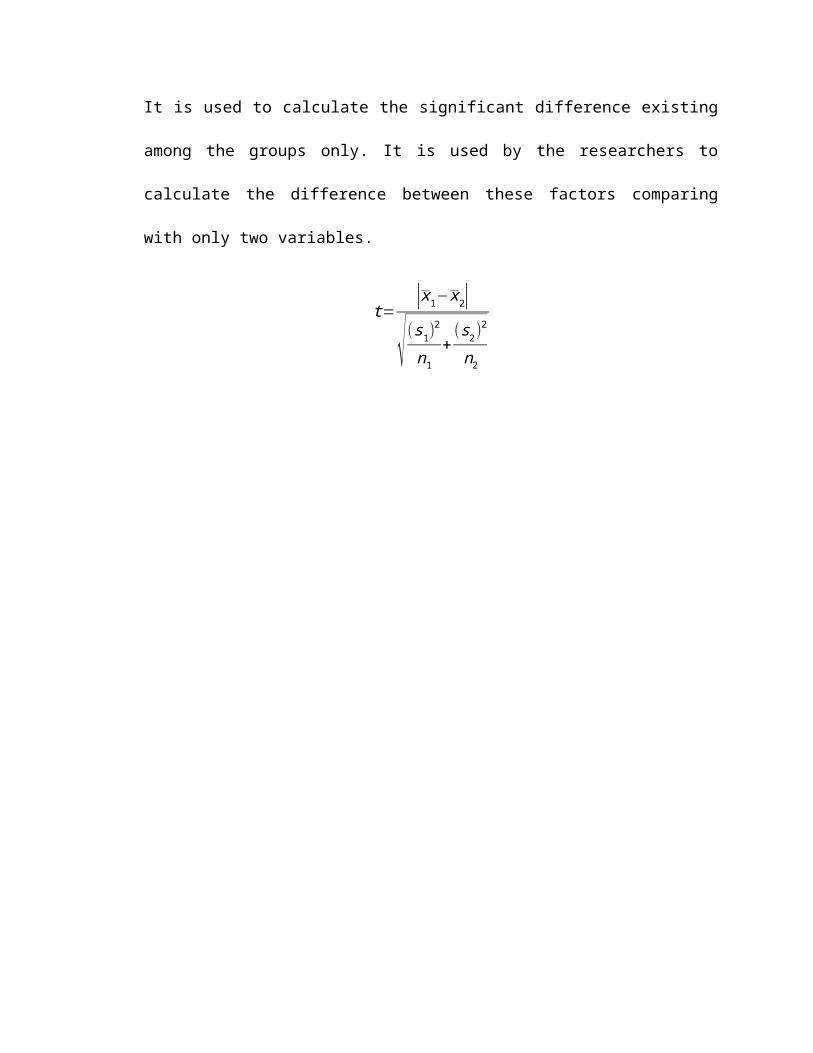
Table 1.3
DISTRIBUTION OF RESPONDENTS ACCORDING TO ECONOMIC STATUS
ES Freq. %
Below 10,000 (P) 32 24.06%
10,000 – 20,000 (A) 35 26.32%
21,000 – 30,000 (AA) 41 30.83%
Above 30,000 (R) 25 18.79%
Total 133 100%
Table 1.3 presents the distribution of the respondents
when grouped according to the Economic Status of their
family. The table shows that there are 41 respondents, or
0.83% of the total respondents that belongs to the family
which has 21,000 – 30,000 monthly income; 35 respondents or
26.32% of the total respondents belongs to the 10,000 –
20,000 family monthly income; 32 respondents or 24.06% of
the total respondents belongs to the below 10,000 family
monthly income, and lastly there are 25 respondents or
18.79% of the total respondents which belongs to above
30,000 family monthly income.
There are 4 particular ratings according which the
researchers used to give a verbal interpretation to the

family monthly income: below 10,000 is considered as poor
family income, 11,000 – 20,000 is considered as average
family income, 21,000 – 30,000 is considered as above
average family income and above 30,000 which is considered
as rich family income.
II. TYPE OF SCHOOL WHERE THE RESPONDENTS HAVE GRADUATED
The researchers used a survey questionnaire to collect
data about the past school information of the respondents.
In table 2, the researchers present the distribution of the
respondents according to the school they graduated in.
Table 2
TYPE OF SCHOOL IN WHICH THE RESPONDENTS GRADUATED IN
Type of School F %
Private 60 45.11%
Public 73 54.89%
Total 133 100%
Table 2 shows that 73 respondents or 54.89% of the
total respondents graduated in a Public elementary school
and 60 respondents or 45.11% of the total respondents
graduated in a Private elementary school.

This table implies that there is no great difference in
the number of respondents that graduated in each type of
school. Hence, the researchers did not bother to equal the
number of data to be used in each type of school.
III. ACADEMIC PERFORMANCE OF THE RESPONDENTS DURING THE 1ST
AND 2ND QUARTER OF SY 2013-2014
The table in the next 2 pages will present the grades
of the respondents during the first and second grading
period of S.Y. 2013-2014. With these tables we can observe
if there is a change between the academic performances of
the respondents.
Table 3.1
THE ACADEMIC PERFORMANCE OF THE RESPONDENTS DURING
THE 1ST QUARTER OF SY 2013-2014

Academic Performance F %
90% and above(Proficient) 11 8.27%
85% - 89%(Advanced) 43 32.33%80% - 84%(Approaching
Proficient) 65 48.87%
75% - 79%(Developing) 14 10.53%
74 and below(Beginning) 0 0%
Total 133 100%Table 3.1 shows the level of academic performance of
the respondents during the 1st grading quarter of SY 2013-
2014. The mean of the grades of the respondents during the
1st quarter is 83.84 with a verbal interpretation of
Approaching Proficient. This table implies that most of the
respondents have a grade of 80% - 84% which makes up of
48.87% of the total respondents.
Table 3.2
THE ACADEMIC PERFORMANCE OF THE RESPONDENTS DURING
THE 2nd QUARTER OF SY 2013-2014

Academic Performance F %
90% and above(Proficient) 14 10.53%
85% - 89%(Advanced) 42 31.58%80% - 84%(Approaching
Proficient) 64 48.12%
75% - 79%(Developing) 13 9.77%
74 and below(Beginning) 0 0%
Total 133 100%Table 3.2 shows the level of academic performance of the
respondents during the 2nd grading quarter of SY 2013-2014.
The mean of the grades of the respondents during the 2nd
quarter is 84.22 with a verbal interpretation of Approaching
Proficient. This table implies that most of the respondents
have a grade of 80% - 84% which makes up of 48.87% of the
total respondents. It also implies that there is a very
small chance in the average academic performance of the
respondents.
IV. The difference in the academic performance of the
Private and Public elementary school graduates

This part will present how the Null Hypothesis was tested by
the researchers, to determine whether there the variables
have a significant difference.
Table 4
THE DIFFERENCE IN THE ACADEMIC PERFORMANCE OF THE PRIVATE
AND PUBLIC ELEMENTARY SCHOOL GRADUATES
Factors Comparedin the Study
VALUES
Mean STDEV
Academic Performance of Private elementary school graduates 84.90 4.17
Academic Performance of Public elementary school graduates 83.31 3.21
T-Test
t(Computed) 2.42
t(Critical) 0.166
Null Hypothesis is REJECTED
Table 4 shows the difference in the academic
performance of the Private and Public elementary school
graduates. The computed t has a value of 2.42, while the t-
critical is 0.166. The computed t is greater than the t-
critical; therefore the Null Hypothesis is REJECTED, which
implies that there is a significant difference in the
academic performance of the Private and Public elementary
school graduates. The result on the table simply implies
that the Private elementary school graduates perform better
that the Public elementary school graduates.
CHAPTER V
SUMMARY, CONCLUSIONS, AND RECOMMENTDATIONS

This chapter contains the answers to the given problems
and specific questions. It also summarizes the overall flow
of the study. It discusses the findings made out of the data
gathered during the survey period.
SUMMARY
The study is about the difference of Private and Public
elementary school graduates.
October 3, 2013

Mrs. Nimfa C. Robert
Guidance Counselor
Roosevelt College Cubao
10th Avenue Cubao, Quezon City
Dear Mrs. Robert,
We, the students of IV – P.BURGOS under group 1 for
research, are requesting to get a copy of the record of the
general averages of all the Grade 7 students during the first and
second grading periods of the current school year. The record you
would be providing us with will be used as data for our research
entitled “The difference in the academic performance of public
and private elementary school graduates as perceived from the
academic performance of grade 7 students of Roosevelt College
Cubao school year 2013 – 2014”. We are hoping for your kind
consideration.
Thank you and God bless!
Sincerely Yours,
Vincent Adrian C.Collado
Group Leader
Noted:
Mrs. Maria Thelma I. Demoy
Approved:
Mrs. Nimfa C. Robert
Guidance Counselor
October 3, 2013

Mrs. Clarita S. Zantua
Directress
Roosevelt College Cubao
10th Avenue Cubao, Quezon City
Dear Mrs. Zantua,
We, the students of IV – P.BURGOS under group 1 for
research, as instructed by Mrs. Thelma I. Demoy, are planning to
conduct a survey for our research entitled “The difference in the
academic performance of public and private elementary school
graduates as perceived from the academic performance of grade 7
students of Roosevelt College Cubao school year 2013 – 2014”.
We are hoping for your kind Consideration.
Thank you and God bless!
Sincerely Yours
Vincent Adrian C. Collado
Group Leader
Noted:
Mrs. Maria Thelma I. Demoy
Approved:
Mrs. Clarita S. Zantua
Directress