Embed Size (px)
Citation preview

Sample Reports

Introduction
aimsweb™Plus provides comprehensive reporting for
each screening and monitoring component:
Benchmark—assess students three times per year for
universal screening (early identification)
Progress monitor—write individualized annual goals
and monitor more frequently for students who need
intensive instructional services
Response to Intervention (RTI)—organize and
evaluate the process of RTI to manage data
Multi-Tiered Systems of Support (MTSS)—provide
frequent monitoring for instructional decision making
Teachers or administrators may view student results
online through the aimswebPlus data management and
reporting system. A reporting hierarchy determines the
information available based on user role and access level.
Reports include data for students, classrooms, grades,
schools, and district levels, and they can be generated
in either HTML format or as PDFs. Reports specific to
benchmarking and progress monitoring, are available.
Sample reports are shown in the following figures.
aimswebPlus allows for this comparison of student
performance to national, district, or even site level
norms. Quantifiable student growth is also a crucial
data point. aimswebPlus provides student growth
percentiles and growth summaries which indicate
whether a student is making sufficient progress
to close learning gaps and/or to meet grade level
expectations. As educators consider performance
and progress in instructional decision-making,
the majority of aimswebPlus reports include
information on both, enabling educators to better
impact student achievement.
The following pages illustrate the wide variety of
reports available when using aimswebPlus. The data
in these reports are not authentic, so do not depict
accurate student data.

Table of Contents
Benchmark Comparison Summary (Normative View) .................................................................4
Benchmark Comparison Summary (Tier View) ............................................................................5
Individual Benchmark .....................................................................................................................6
Monitor ..............................................................................................................................................7
Individual Monitoring ......................................................................................................................8
Scores and Skills Plan ......................................................................................................................9
Scores Snapshot .............................................................................................................................10
Skills Plan – Math ............................................................................................................................11
Skills Plan – Reading .................................................................................................................12–13
Student Profile ................................................................................................................................14
Tier Transition .................................................................................................................................15
Early Screening with BASC-3 BESS and Shaywitz DyslexiaScreen™ ...................................16-17

4
Benchmark Comparison Summary (Normative View)Super HHteacher1261
Students
View / Refresh
How can we help?
Groups Manage Export
: Class 1F HH, Grade 1, Early Literacy, Winter 2017Benchmark Comparison
Roster Class 1F HH National
Alert Assess Early Literacy Percentile %ile %ileGoal
WRF ORFAV
Lexile Goalmax %ile 99
Grade 1
Battery Early Literacy
Period Winter ’17
Comparison National
Display Percentile
Only student with noComposite scores
Student (30)
Student 1265, HHSample1265
Student 1261, HHSample1261
Student 1289, HHSample1289
Student 1262, HHSample1262
Student 1288, HHSample1288
Student 1276, HHSample1276
Student 1278, HHSample1278
Student 1282, HHSample1282
Student 1263, HHSample1263
Student 1294, HHSample1294
Student 1277, HHSample1277
!
!
!
!
%ile
8
9
10
12
14
14
21
22
28
28
30
2
2
4
27
15
27
49
15
74
74
74
8
9
10
12
14
14
21
22
28
28
30
BR
BR
BR
BR
BR
BR
BR
BR
BR
BR
BR
%ile
8
15
15
6
14
20
9
26
26
27
40
76%
49%
60%
70%
73%
NA
NA
NA
Page Size: 50 1 / 1Percentile Bands 1-10th
Lexile Common Core Stretch Bands Below Grade Level
Goal Met Optional Measure (VS) Vertical Score
Legend
On Grade Level Above Grade Level Learn more about Lexiles11-25th 26-74th 75-89th 90-99th
Required Measure
Once assessment data enters the system, aimswebPlus
enables immediate reporting for assessments.
The Benchmark Comparison page displays students’
composite scores as the color-coded bar lines.
By default, students are listed with those most at-risk
at the top. Each column provides specific information
on the composite and individual measures, accessible by
clicking on the colored tiles. In the alert column,
pink alerts draw attention to students for whom
progress monitoring is recommended. Teachers can
immediately see students’ progress toward instructional
goals via the goal bar lines. Type-ahead rostering makes
finding the correct class quick and easy.
! “Pink Alerts” will display when the student is
performing below expectations and does not
have a progress monitoring schedule level to alert
the teacher that a student may need additional
intervention.

5
Benchmark Comparison Summary (Tier View) Super HHteacher1261
Students
View / Refresh
How can we help?
Groups Manage Export
: Class 1F HH, Grade 1, Early Literacy, Fall 2016Benchmark Comparison
Roster Class 1F HH National
Alert Assess Early Literacy Score Score Score Score Goal ScoreScore
LWSF PS AV ORFWRF
Score Lexile Goalmax score 425
Grade 1
Battery Early Literacy
Period Fall ’16
Comparison Tiers
Target Account (30 %ile)
Only student with noComposite scores
Student (30)
Student 1289, HHSample1289
Student 1276, HHSample1276
Student 1277, HHSample1277
Student 1263, HHSample1263
Student 1294, HHSample1294
Student 1293, HHSample1293
Student 1279, HHSample1279
Student 1268, HHSample1268
Student 1267, HHSample1267
Student 1264, HHSample1264
Student 1285, HHSample1285
43
49
51
61
63
67
68
74
82
83
87
10
16
16
22
16
44
18
27
29
35
37
BR
BR
BR
BR
BR
BR
BR
BR
BR
BR
BR
33
33
35
39
47
23
50
47
53
48
50
35
29
32
36
43
42
36
44
46
40
12
13
21
24
73%
NA
Page Size: 50 1 / 1Tier Bands Tier 3 (<50% probability)
Lexile Common Core Stretch Bands Below Grade Level
Goal Met Optional Measure (VS) Vertical Score
Legend
On Grade Level Above Grade Level Learn more about LexilesTier 2 (50-79% probability) Tier 1 (80%+ probability)
Required Measure
The Benchmark Comparison Tiers report, a criterion-referenced option of the teacher’s dashboard, automatically
groups students according to risk status, relative to the year-end target. Note that while this can be sorted by the
student roster view, the default view shows the struggling students first. At a glance, teachers can see which
students are on track to meet local targets and which students might need additional help like small group
instruction or intensive intervention.

6
Individual Benchmark
This Individual Benchmark report shows performance relative to norms (national or local) and seasons or years.
It displays the student’s rate of improvement (ROI) and Student Growth Percentile (SGP), and includes a Lexile®
score based on the Oral Reading Fluency (ORF) measure as well. The lines in the graph allow comparison of the student
growth summary to the national average growth.

7
Monitor
This Monitor view provides a snapshot of all of your
students on an intervention plan. The goal progress bar
is color-coded to indicate whether the student is on- or
off- track to meet the goal. This summary view shows
the latest score students have received as well as their
current rate of improvement being made per week.
From this screen, the teacher can access the Individual
Monitor report for more detailed information.
The “Status” column provides at a glance
information to see where students are on track.
Example: a pink goal feedback bar indicates
a student is below target in reference to their
current performance to goal.

8
Individual Monitoring
The Individual Monitoring report shows the goal score,
number of errors, a line connecting the baseline score
to the goal score (the aimline), the weekly progress
monitoring scores, and a best-fitting linear regression
line (the trendline) projected out to the goal date.
The aimswebPlus system uses the trendline and
the spread of scores around the line to analyze the
student’s likelihood of meeting the performance goal by
the goal date. The report also includes a table that lists
individual scores, the rate of improvement (updated
with each new score), the Goal Statement, and other
graphical elements indicating when an intervention or
goal change was made.

9
Scores and Skills Plan
The Scores and Skills Plan group report provides a
holistic view of student performance in math and
reading across the individual measures and the
composite scores. It shows the distribution of
performance levels by measure and the percentage
of students at low, moderate, or high risk, at the
classroom or grade level. This report helps teachers
identify areas of strength and/or areas needing
remediation, and is available for class, grade level, school,
and whole district views.

10
Scores Snapshot
This Scores Snapshot report allows teachers to see
at-a-glance student performance by individual measure
as well as the composite, and is often shared to
communicate student performance during parent/teacher
conferences. The report provides a brief narrative
description of performance by measure and includes a
recommendation regarding the intensity of instructional
need. This report also charts the fall, winter, and spring
benchmark composite scores and describes student’s
growth relative to the national average.

11
Skills Plan – Math Super HHteacher1261
Students
How can we help?
Groups Manage Export
Skills Plan HHSample 1261 Student 1261, Grade 1, Early Numeracy, Winter’2017
Battery Early Numeracy
Period Winter’2017
Target Account (30 %ile) 908070605040302010
100
0
Concepts & Applications Performance Summary
Concepts & Applications Item Analysis and Pearson Summary
Acc
urac
y (P
erce
nt C
orre
ct)
Operations & Algebraic Thinking 6 of 12Identi�es equivalent addition expressions. 1Solves subtraction word problems. 1Determines the missing number in addition equation. 2Identi�es a true equation. 2Solves addition word problems. 0Solves word problems involving the addition of three numbers. 0Determines the missing number in subtraction equation. 0Geometry 2 of 3Identi�es a shape divided into halves. 0Identi�es a composite shape by its smaller shapes. 0Measurement & Data 3 of 5
Skills Area & Skill Assessed
What does this graph show?This graph shows the percent of items answered correctly by domain.
HHSample 1261’s score is: Average for Operations & Algebraic Thinking, Geometry, Measurement & Data, and Number & Operations: Base 10.
View / Refresh
Operation &Algebraic Thinking
Geometry Number & Operations:Base 10
Measurement& Data
HHSample 1261’s 2016 Early Numeracy Benchmark ScoresNat’l %ile
36
Risk Status Growth Scale Val
N/A
Quantile
N/A
SGP
95
Raw Score
14
Perf Level
Average Moderate
The Skills Plan - Math report provides further analysis
of the student’s math performance. It shows how the
student performed in each of the major math domains,
and indicates whether performance is below, above,
or average, relative to the national sample of students
at the same grade level. A brief narrative describes the
results reported in the graph.
A score summary table provides the student’s national
percentile, performance level, Quantile, and Growth
Scale Value (vertical scale score) on the Concepts &
Applications measure. The report also shows item-level
performance, organized by math domain, and provides
a brief description of the behavioral objective for each
item. Teachers can use this table to identify very specific
skills that need further instruction.
12
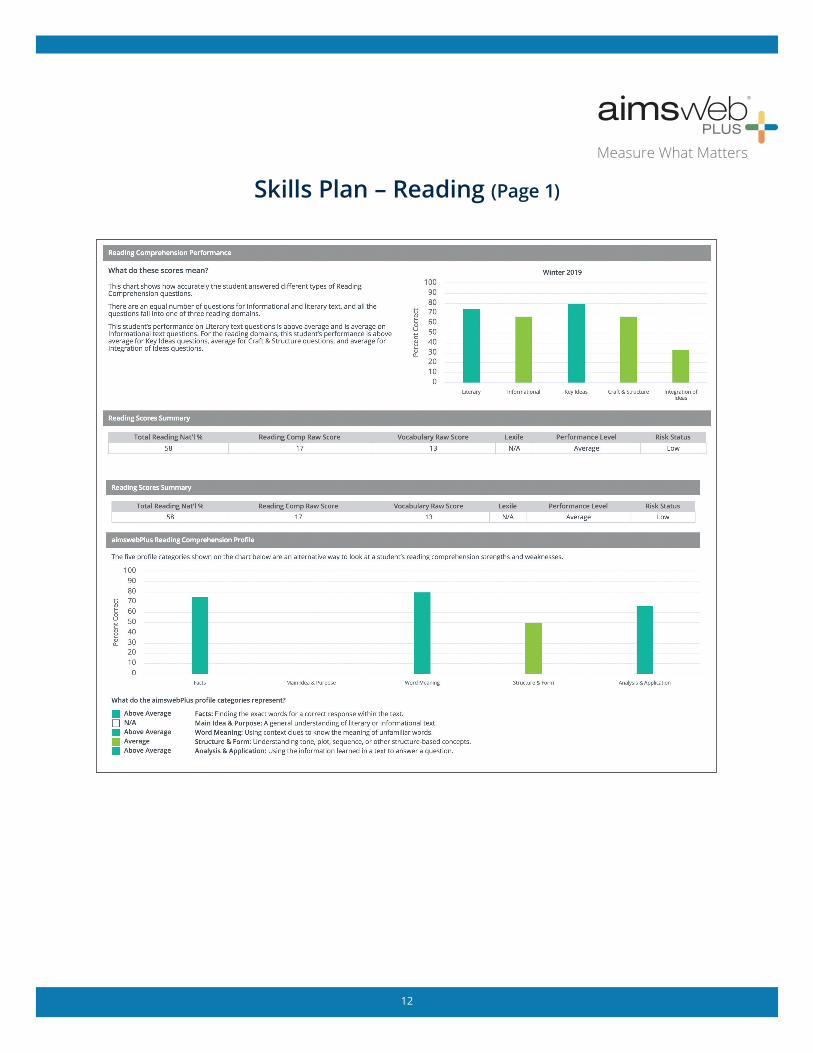
Skills Plan – Reading (Page 1)
13
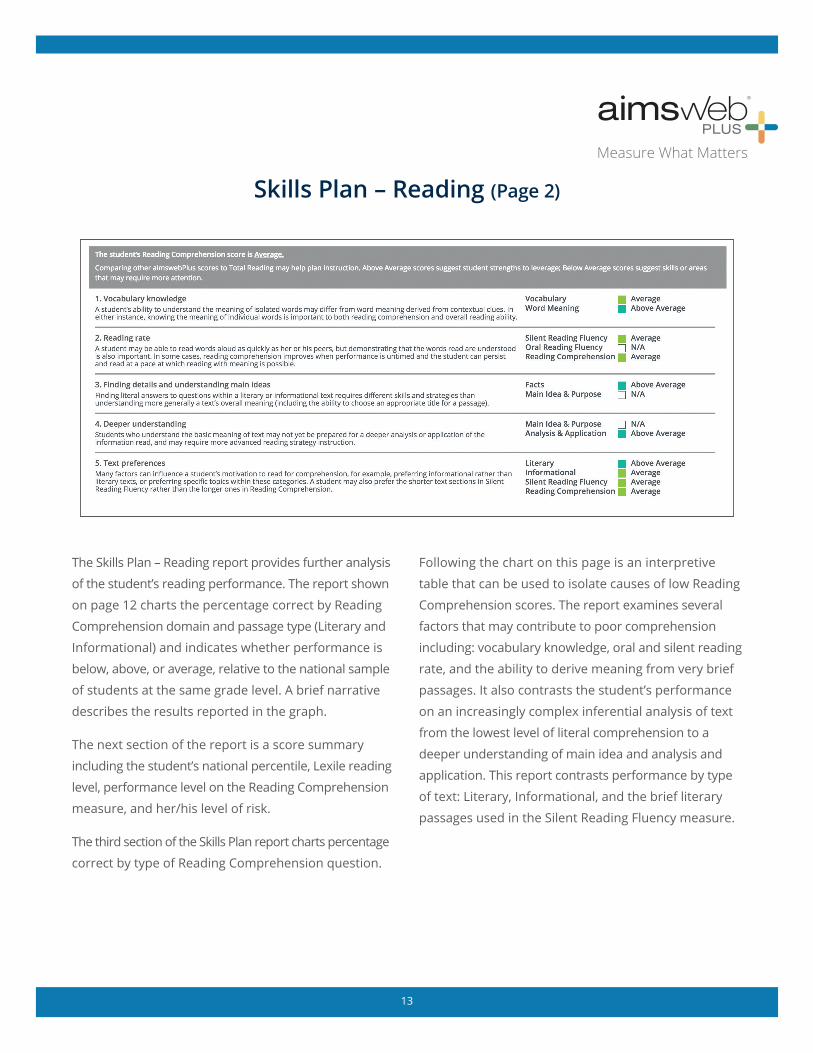
Skills Plan – Reading (Page 2)
The Skills Plan – Reading report provides further analysis
of the student’s reading performance. The report shown
on page 12 charts the percentage correct by Reading
Comprehension domain and passage type (Literary and
Informational) and indicates whether performance is
below, above, or average, relative to the national sample
of students at the same grade level. A brief narrative
describes the results reported in the graph.
The next section of the report is a score summary
including the student’s national percentile, Lexile reading
level, performance level on the Reading Comprehension
measure, and her/his level of risk.
The third section of the Skills Plan report charts percentage
correct by type of Reading Comprehension question.
Following the chart on this page is an interpretive
table that can be used to isolate causes of low Reading
Comprehension scores. The report examines several
factors that may contribute to poor comprehension
including: vocabulary knowledge, oral and silent reading
rate, and the ability to derive meaning from very brief
passages. It also contrasts the student’s performance
on an increasingly complex inferential analysis of text
from the lowest level of literal comprehension to a
deeper understanding of main idea and analysis and
application. This report contrasts performance by type
of text: Literary, Informational, and the brief literary
passages used in the Silent Reading Fluency measure.

14
Student Profile
The Student Profile serves as the dashboard for an
individual student. This report allows teachers to see
a holistic view across measures and periods for the
selected school year. The student profile displays all
scores for all measures administered to a student
during the school year. The paper icons link directly
to individual reports. The page also includes student
demographic information, as well as a complete
intervention history. The task pane at the bottom right
of the page provides teachers and interventionists
a place to document meetings regarding a student’s
instructional plan, and a place to upload additional
information such as IEP meeting notes, student work
samples, or other assessment data.

15
Tier Transition
The Tier Transition report shows the movement of students across instructional tiers. This group report is useful for
determining effectiveness of core and intervention instruction and also for allocating resources to meet student need.
From this report, the teacher can view the student details to see a specific student’s movement across the tiers.
16
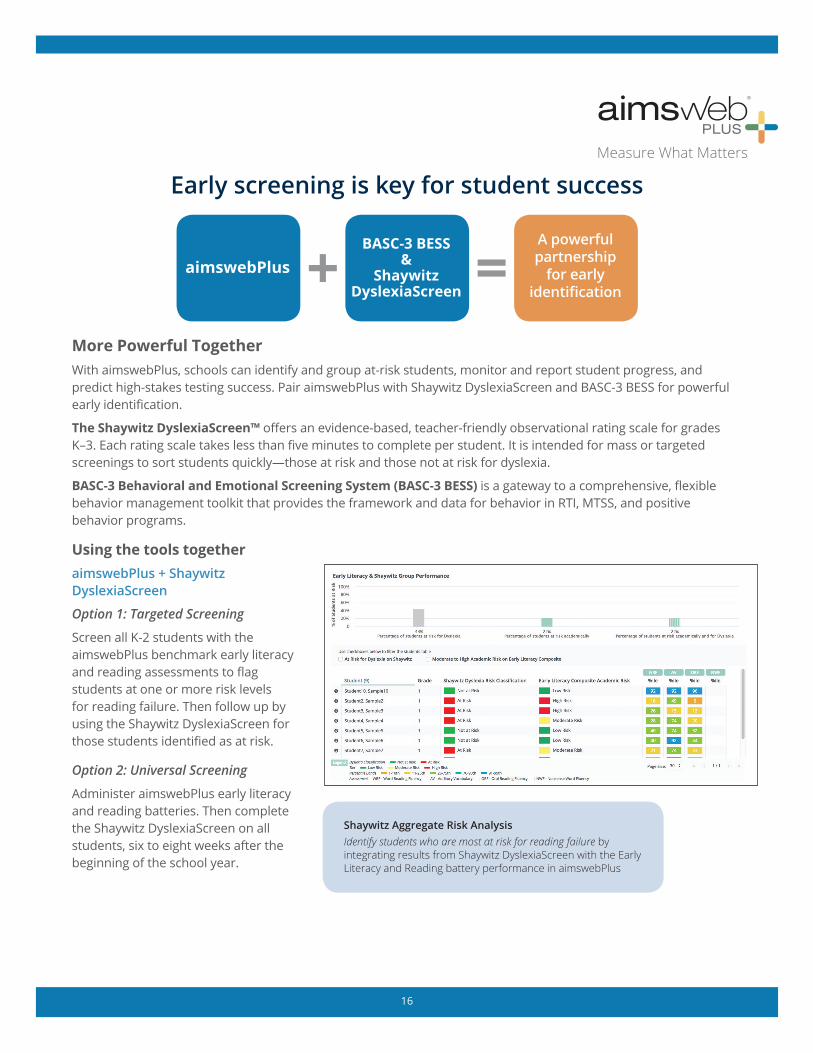
Early screening is key for student success
More Powerful TogetherWith aimswebPlus, schools can identify and group at-risk students, monitor and report student progress, and predict high-stakes testing success. Pair aimswebPlus with Shaywitz DyslexiaScreen and BASC-3 BESS for powerful early identification.
The Shaywitz DyslexiaScreen™ offers an evidence-based, teacher-friendly observational rating scale for grades K–3. Each rating scale takes less than five minutes to complete per student. It is intended for mass or targeted screenings to sort students quickly—those at risk and those not at risk for dyslexia.
BASC-3 Behavioral and Emotional Screening System (BASC-3 BESS) is a gateway to a comprehensive, flexible behavior management toolkit that provides the framework and data for behavior in RTI, MTSS, and positive behavior programs.
Using the tools togetheraimswebPlus + Shaywitz DyslexiaScreen
Option 1: Targeted Screening
Screen all K-2 students with the aimswebPlus benchmark early literacy and reading assessments to flag students at one or more risk levels for reading failure. Then follow up by using the Shaywitz DyslexiaScreen for those students identified as at risk.
Option 2: Universal Screening
Administer aimswebPlus early literacy and reading batteries. Then complete the Shaywitz DyslexiaScreen on all students, six to eight weeks after the beginning of the school year.
aimswebPlusBASC-3 BESS
& Shaywitz
DyslexiaScreen
A powerful partnership
for early identification
Shaywitz Aggregate Risk AnalysisIdentify students who are most at risk for reading failure by integrating results from Shaywitz DyslexiaScreen with the Early Literacy and Reading battery performance in aimswebPlus

17
Early screening is key for student success (Page 2)
Using the tools togetheraimswebPlus + BASC-3 BESS
Option 1: Targeted Screening
Screen all of your students with aimswebPlus measures to identify ones at risk for falling behind in reading and/or math. Next, follow up by using the BASC-3 BESS to help identify behavior or emotional issues that may be interfering with their academic performance.
Option 2: Universal Screening
Six to eight weeks after the beginning of the school year, administer the BASC-3 BESS to all students.
After screening, review data sets for direction on next steps for intervention and/or instructional planning for students.

18
Demonstrating Student Growth
Data collected from aimswebPlus assessments,
including the rate of improvement (ROI), are powerful
tools to assess whether students are making academic
progress. ROI has long been a component of classic
reporting in individual progress monitoring reports
and in local and national norm tables.
To make ROI even more valuable, aimswebPlus includes
student ROI growth norms that will allow schools to
evaluate the progress of individual students relative
to the rate of growth shown by similar students in a
national norm sample.
Student ROI Growth NormsROI growth norms are percentile norms that indicate
the percentage of students in the large, representative
national norm sample who had ROI equal to or smaller
than a particular ROI. Because growth rates vary by
initial performance level, these norms are most meaningful
when the comparison group consists of other students
who had a similar level of initial performance.
To be able to make such comparisons, five separate
sets of ROI growth norms were developed for each
grade and time interval (fall-winter, winter-spring,
and fall-spring) that correspond to five ranges of initial
scores (well below average, below average, average,
above average, and well above average).
Through the use of stratified comparison groups,
the ROI growth norms can help teachers more
accurately interpret each student’s progress and set
realistic yet challenging goals.
ROI growth norms allow educators to complete the
following tasks:
• Determine and report individual student growth by
calculating a student’s ROI relative to the ROI of
other students at the same grade and at a similar
level of initial score
• Set meaningful and realistic progress monitoring goals
• Generate group growth reports, which display the
distribution of student ROI growth percentiles at the
class, grade, school, and district levels
ROI growth norms are available for all measures and
composite scores
For additional information or to speak with a Pearson specialist, we invite you to call 800.328.5999 | Or visit us online at aimswebPlus.com
© 2019 Pearson Education, Inc. or its affiliates. All rights reserved. LRNAS13480 EL 5/19