Embed Size (px)
Citation preview
SAMPLE REPORT
Energy Yield Assessment of the Photovoltaic Power Plant
Hrnčiarska Ves
district Detva, region Banskobystrický, Slovakia
Installed power 999.69 kWp
Reference No. 00-04/2013 Date: 17 June 2013
Contractor Supplier
GeoModel Solar s.r.o.
Contact: Mr. Marcel Šúri
Pionierska 15, 831 02 Bratislava
Slovak Republic
Tel. +421 2 492 12491, fax +421 2 492 12423
E-mail: [email protected]
http://geomodelsolar.eu
GeoModel Solar s.r.o.
Contact: Mr. Marcel Šúri
Pionierska 15, 831 02 Bratislava
Slovak Republic
Tel. +421 2 492 12491, fax +421 2 492 12423
E-mail: [email protected]
http://geomodelsolar.eu

Energy Yield Assessment of 999.69 kWp photovoltaic power plant Hrnčiarska Ves, Slovakia. Sample Report No. 00-04/2013
© 2013 GeoModel Solar s.r.o., Bratislava, Slovakia page 2 of 44
TABLE OF CONTENTS
1 Summary .............................................................................................................................................. 3
2 Characteristics of the site and PV power plant .................................................................................... 5 2.1 Site description............................................................................................................................... 5 2.2 Photovoltaic power plant ................................................................................................................. 8
3 Data and methods .............................................................................................................................. 10 3.1 Satellite-derived solar radiation SolarGIS and validation of GHI with regional measurements .......... 10 3.2 Air temperature ............................................................................................................................ 12 3.3 PV simulation methods ................................................................................................................. 13 3.4 PV simulation assumptions and uncertainties ................................................................................ 14 3.5 Inter-row shading and electricity losses ......................................................................................... 17
4 Local climate ...................................................................................................................................... 19 4.1 Global horizontal irradiation and air temperature ............................................................................ 19 4.2 Global tilted (in-plane) irradiation................................................................................................... 21 4.3 Deviation from theoretical optimum inclination angle ...................................................................... 23
5 Solar electricity production ................................................................................................................ 24 5.1 Estimation of system losses and performance ratio ....................................................................... 24 5.2 Theoretical PV power production – monthly statistics ..................................................................... 26 5.3 Interannual variability of PV power output ...................................................................................... 30 5.4 PV electricity production over 15 and 25 years .............................................................................. 32 5.5 Uncertainty of PV power production .............................................................................................. 34
6 Conclusions ....................................................................................................................................... 36
7 Acronyms ........................................................................................................................................... 37
8 Glossary ............................................................................................................................................. 38
9 List of figures ..................................................................................................................................... 39
10 List of tables ....................................................................................................................................... 40
11 List of references ............................................................................................................................... 41
12 Support information ........................................................................................................................... 43 12.1 Background on GeoModel Solar ................................................................................................... 43 12.2 Legal information .......................................................................................................................... 43
Energy Yield Assessment of 999.69 kWp photovoltaic power plant Hrnčiarska Ves, Slovakia. Sample Report No. 00-04/2013
© 2013 GeoModel Solar page 3 of 44
1 SUMMARY
This report estimates electricity yield from a 999.69 kWp (DC) photovoltaic power plant, located in Hrnčiarska Ves, district Detva, region Banskobystrický, Slovakia. The power plant is located in a flat terrain.
Data and model approach
Simulation of photovoltaic (PV) power output is based on SolarGIS data and numerical models, developed by GeoModel Solar. In simulation, the 15-minute time series of solar irradiance and air temperature data are used, covering a period of the most recent 19 years (period 1994 to 2012). The simulation of energy conversion at the level of PV modules considers site-specific interaction of solar radiation and temperature with the PV modules (Chapter 3).
PV power plant
The total installed capacity of the power plant is 999.69 kWp (totally 4254 photovoltaic polycrystalline modules Renesola JC 235M/24Bb-a with performance 235 Wp). The AC output at the feeding point to the grid will be lower since there are losses associated with energy transformation in several stages. These losses comprise losses due to PV conversion, mismatch, interconnections, dirt, dust, bird droppings, soiling, inter-row shading, inverter losses and AC cabling and power transformer losses. Breakdown of losses is presented in Chapters 3.3 to 3.4 and is summarized in Chapter 5.1.
PV modules are installed on the Ekosolar structures manufactured by Hesco s.r.o. inclined at 30° South) on the flat terrain. For the designed power plant, relative row spacing is approximately 2.2. Losses due to near shading are relatively high due this small row spacing (high shading angle) and it is estimated that approximately 3.0% will be lost due to near shading (Chapter 3.5). Since crystalline silicon modules are sensitive to partial shading and losses depend on the topology of module interconnections the estimate of losses in winter may have higher uncertainty.
Technical availability of the power plant (i.e. excluding downtime due to maintenance, failures, and grid blackouts) is considered to be 99%, i.e. annual electricity losses of 1% are expected. Validity of this assumption depends on the operation routines, maintenance contracts or grid stability. PV plant is under operation since January 2011.
Solar resource summary
The longterm average of the annual sum of global irradiation impinging on the plane of PV modules is 1481 kWh/m
2 (there is almost no shading from surrounding terrain) for modules inclined 30° south.
The calculation uncertainty of Global Tilted Irradiation (GTI) is about ±3.4%. Solar radiation is determined by cycles and stochastic behaviour of weather and this phenomenon is quantified below by interannual variability.
PV electricity yield summary
Assuming longterm average of global irradiation and 99% technical availability, the following theoretical PV energy yield parameters are calculated, constituting the best average estimate, or P50 estimate:
Theoretical electric output: 1175 kWh/kWp
Theoretical performance ratio: 79.3%
Uncertainty of the PV output calculation: ±5.2%.
Overall, two elements of uncertainty determining the minimum expected electricity output are considered, constituting a base for an estimate of the conservative production scenario, P90:
Uncertainty of PV power production estimate: ±5.2% (which is combined uncertainty of solar radiation ±3.4% and PV simulation ±4.0%);
Interannual variability of weather: with 90% probability year-by-year PV power production may differ from the longterm average by up to ±6.7%. Assuming a period of 15 or alternatively 25 years, this uncertainty decreases to about ±1.7% or ±1.3% respectively.
Energy Yield Assessment of 999.69 kWp photovoltaic power plant Hrnčiarska Ves, Slovakia. Sample Report No. 00-04/2013
© 2013 GeoModel Solar page 4 of 44
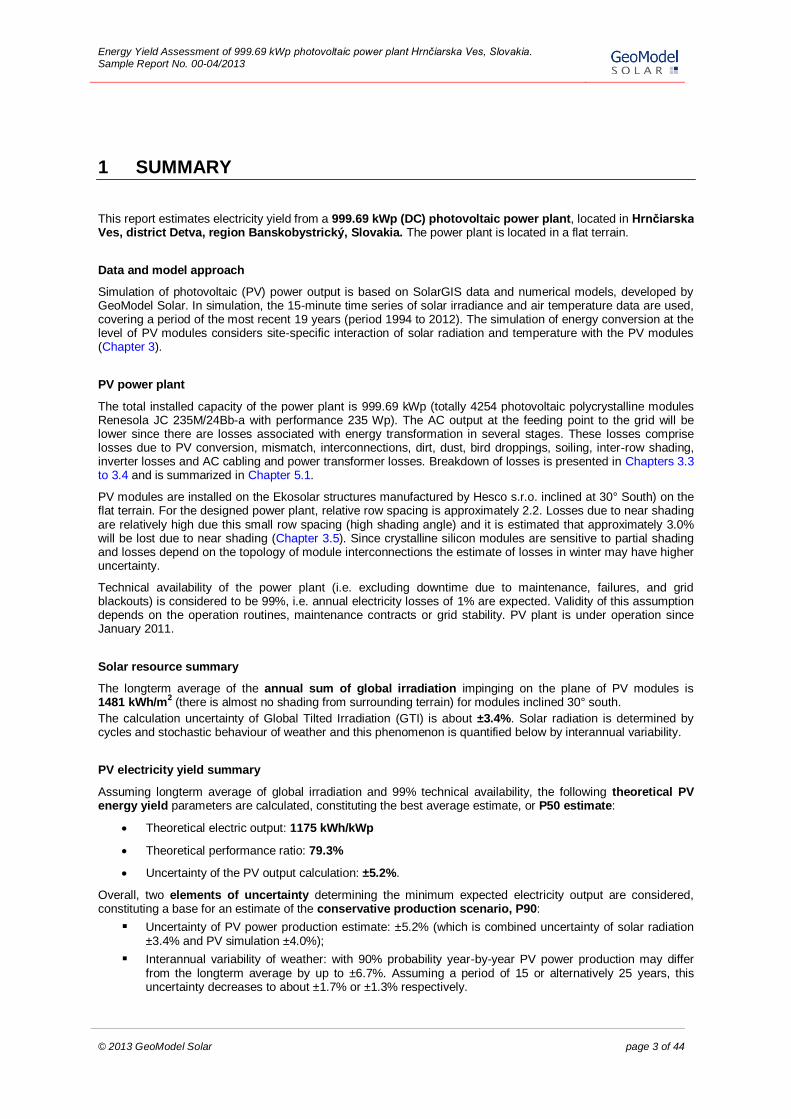
Combined effect of the three uncertainties is ±8.5% for the first year, ±5.5% for a period of operation of 15 years and ±5.4% for a period of operation of 25years and this uncertainty defines the P90 values (see the table below).
Average (P50) and conservative (P90) estimates of PV power production, assuming annual degradation of conversion efficiency of PV modules and combined uncertainty, are summarised in the table below.
When considering the annual reduction of conversion efficiency of PV modules, the annual PV power production is calculated as follows: 0.8% performance degradation for the first year and 0.5% for the remaining years, for a period of 25 years.
* Total uncertainty combines: (i) uncertainty of solar radiation and PV estimate and (ii) uncertainty due to interannual variability. The production estimate assumes annual reduction of conversion efficiency of PV modules 0.8% for the first year
and 0.5% for the remaining years for a period of 15 years.
At the end of the first year of the PV power plant operation, the P50 (average) yearly power plant production is estimated at 1166 MWh. Assuming all three combined uncertainties, the minimum expected production at P90 in the first year is 1066 MWh.
For a period of 15 years, and the installed capacity 999.69 kWp, the average electricity production at P50 is estimated to 1126 MWh per year and performance ratio of the power plant 76.0%. When considering combined uncertainty of all elements, it is expected at P90 that electricity production of the power plant over 15 years exceeds 1064 MWh per year in average.
Similarly for a period of 25 years, the average electricity production at P50 is estimated to 1098 MWh per year and performance ratio of the power plant 74.2%. When considering combined uncertainty of all elements, it is expected at P90 that electricity production of the power plant over 25 years exceeds 1039 MWh per year in average.
Possible man-induced climate change or extreme natural events are not considered in this study.
Average power
production at P50
Average performance
ratio at P50Combined uncertainty
Conservative power
production at P90
[kWh/kWp] [kWh/kWp]
[MWh] [%] [±%] [MWh]
1175 1075
1175 1075
1166 1067
1166 1066
1126 1064
1126 1064
1099 1039
1098 1039
Theoretical power production
per year79.3 8.5
Estimated longterm
production in first year78.7 8.5
Annual average power
production over 15 years76.0 5.5
Annual average power
production over 25 years74.2 5.4
Energy Yield Assessment of 999.69 kWp photovoltaic power plant Hrnčiarska Ves, Slovakia. Sample Report No. 00-04/2013
© 2013 GeoModel Solar page 5 of 44
2 CHARACTERISTICS OF THE SITE AND PV POWER PLANT
2.1 Site description
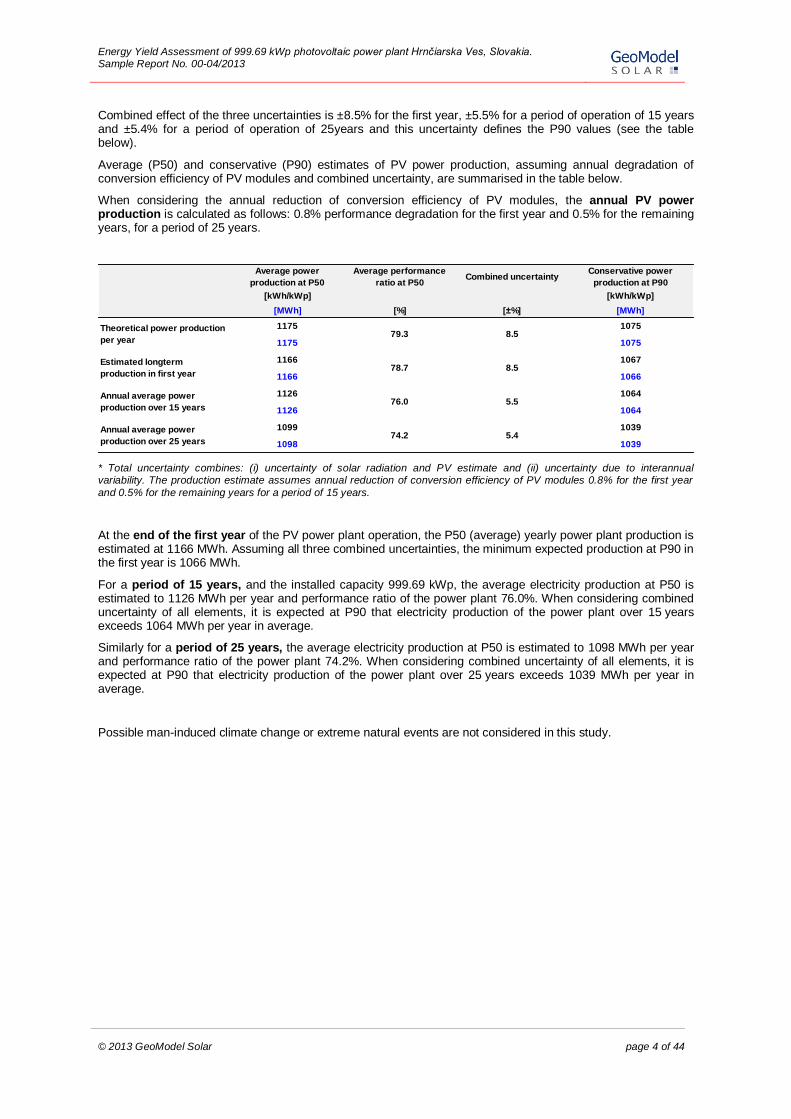
Site name: Hrnčiarska Ves
district Detva, region Banskobystrický, Slovakia
Geographical coordinates:
Elevation above sea level:
Terrain inclination:
Terrain azimuth:
48° 26' 00", 19° 51' 51"
Approx. 228 m a.s.l.
flat, 1°
210°
Location on the map:
http://solargis.info/imaps/#tl=Google:Satellite&loc=48.433443,19.864225&c=48.433045,19.863174&z=16
Fig. 1: Detailed geographical position of the site
(SolarGIS © 2013 GeoModel Solar, Google Maps © 2013 Google)
Energy Yield Assessment of 999.69 kWp photovoltaic power plant Hrnčiarska Ves, Slovakia. Sample Report No. 00-04/2013
© 2013 GeoModel Solar page 6 of 44
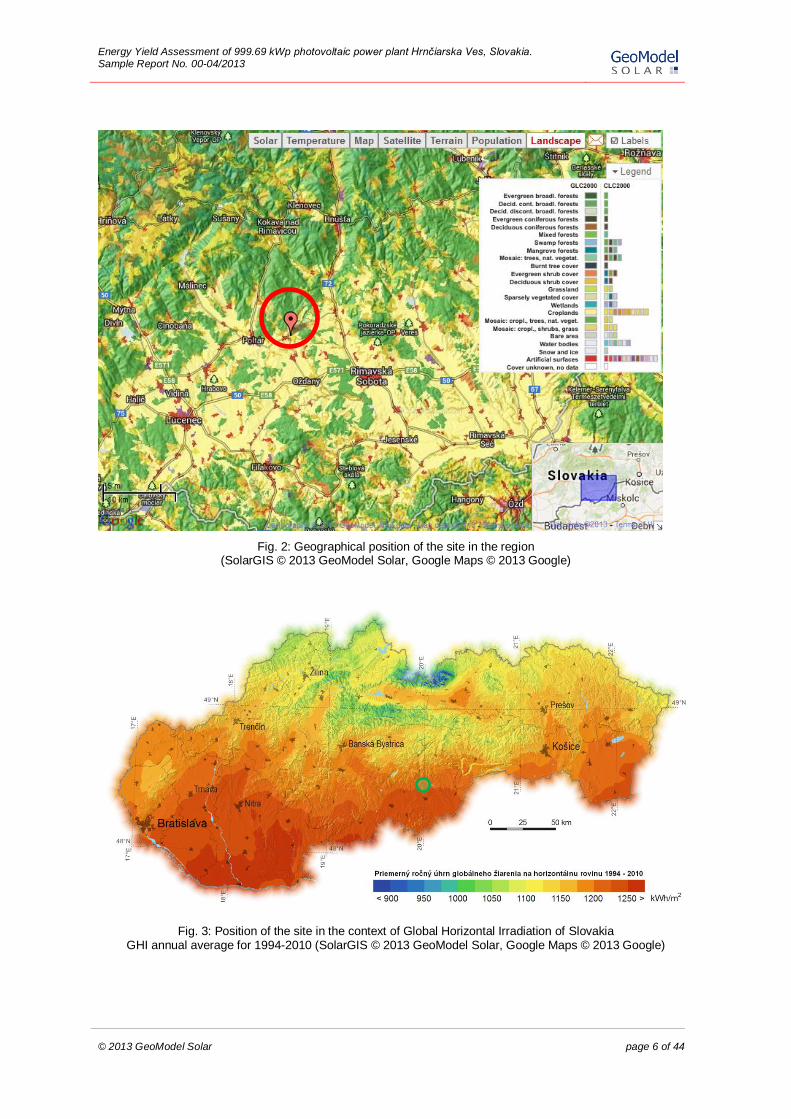
Fig. 2: Geographical position of the site in the region (SolarGIS © 2013 GeoModel Solar, Google Maps © 2013 Google)
Fig. 3: Position of the site in the context of Global Horizontal Irradiation of Slovakia GHI annual average for 1994-2010 (SolarGIS © 2013 GeoModel Solar, Google Maps © 2013 Google)
Energy Yield Assessment of 999.69 kWp photovoltaic power plant Hrnčiarska Ves, Slovakia. Sample Report No. 00-04/2013
© 2013 GeoModel Solar page 7 of 44
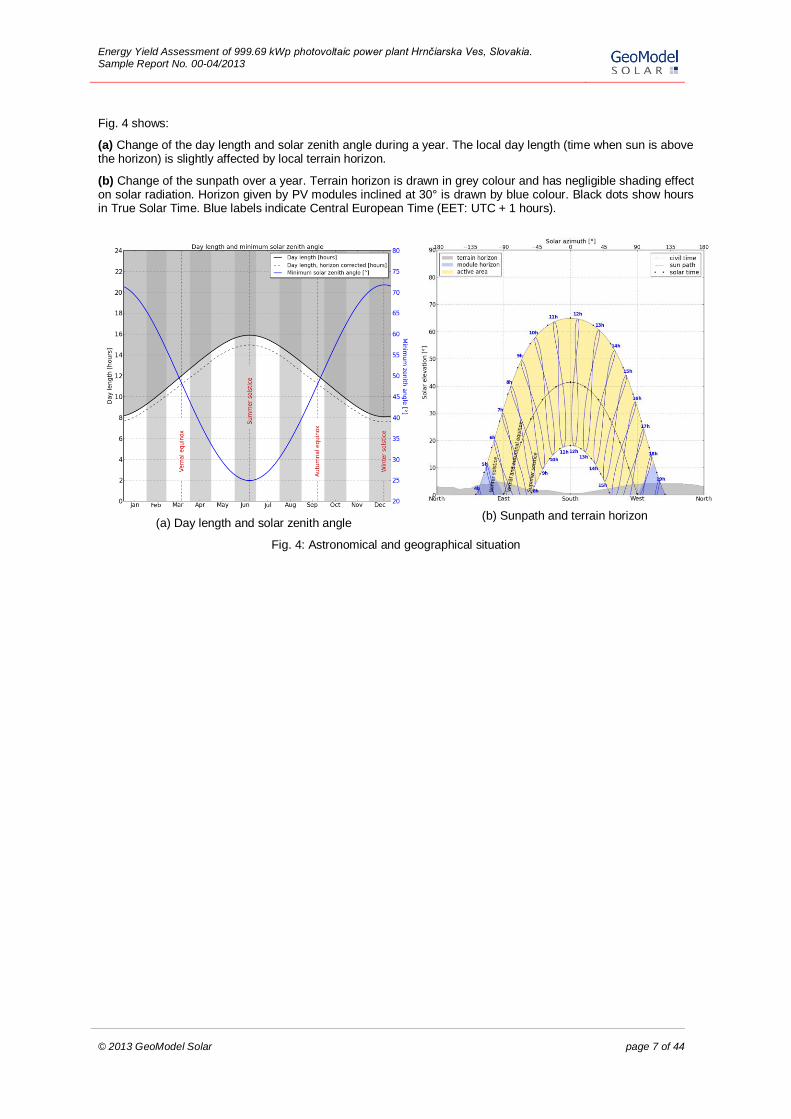
Fig. 4 shows:
(a) Change of the day length and solar zenith angle during a year. The local day length (time when sun is above the horizon) is slightly affected by local terrain horizon.
(b) Change of the sunpath over a year. Terrain horizon is drawn in grey colour and has negligible shading effect on solar radiation. Horizon given by PV modules inclined at 30° is drawn by blue colour. Black dots show hours in True Solar Time. Blue labels indicate Central European Time (EET: UTC + 1 hours).
(a) Day length and solar zenith angle
(b) Sunpath and terrain horizon
Fig. 4: Astronomical and geographical situation
Energy Yield Assessment of 999.69 kWp photovoltaic power plant Hrnčiarska Ves, Slovakia. Sample Report No. 00-04/2013
© 2013 GeoModel Solar page 8 of 44
2.2 Photovoltaic power plant
The photovoltaic power plant is constructed using technology summarised below.
Nominal capacity: 999.69 kWp
Modules: Polycrystalline silicon modules ReneSola JC235M-24/Bb-a manufactured by ReneSola Ltd.:
Total module count: 4254 units
Modules with power tolerance 0..+5%
NOCT 45ºC
Temperature coefficient of the Pmax -0.40 [%/K] Dimensions: 1640 x 992 x 40 mm
Warranty:
5 years product warranty
10 years 90% performance warranty
25 years 80% performance warranty
Inverters: 67 units of Aurora PVI-12.5-OUTD manufactured by Power One
Transformer-less decentralized inverter, nominal AC output of one piece 12.5 kW
Euro efficiency: 97.2%
Mounting: Fixed mounting structures Ekosolar manufactured by Hesco s.r.o.
Assembly of 4 rows of modules on the structure, horizontally
Inclination 30º
Azimuth: 180º
Relative row spacing 2.2
Transformer: Minera 22/0.40kV, 1000 kVA
No-load losses 770 W
Short-circuit losses 7600 W
Technological components of the photovoltaic power plant are properly selected and mutually matched. The connection and a number of panels are chosen with respect to nominal power and recommended operation values of currents and voltages, but summary of connected performance slightly exceeded recommended direct current (DC) input power of inverters. This may lead to some losses during sunny days with high irradiation and low temperatures, because inverters will not be able to consume produced over-performance. Positive tolerance in output performance of modules ensures minimum installed power of 999.69 kWp. Due to varying positive nominal power of modules, however, it can be expected that real installed power in the start-up will be higher.
Solution with decentralized inverters ensures lower demands on direct current (DC) cabling and lower losses in DC circuits. It also increases the reliability of the PV power plant as a whole, because in case of failure of one or more inverters, electricity production can continue without interruption. The disadvantage of the selected topology is lower efficiency of inverters and higher demands on production data collection compared with high power inverters used in photovoltaic power plants with central inverters concept.
Energy Yield Assessment of 999.69 kWp photovoltaic power plant Hrnčiarska Ves, Slovakia. Sample Report No. 00-04/2013
© 2013 GeoModel Solar page 9 of 44
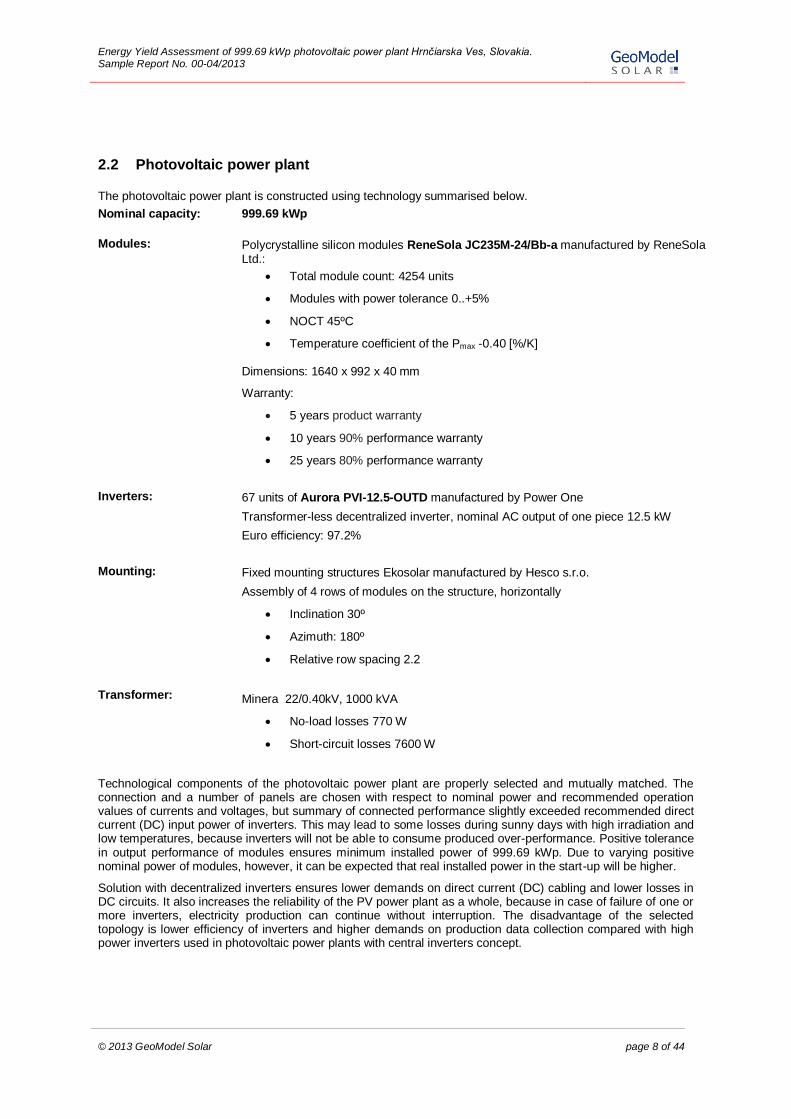
Fig. 5: Layout of the power plant.
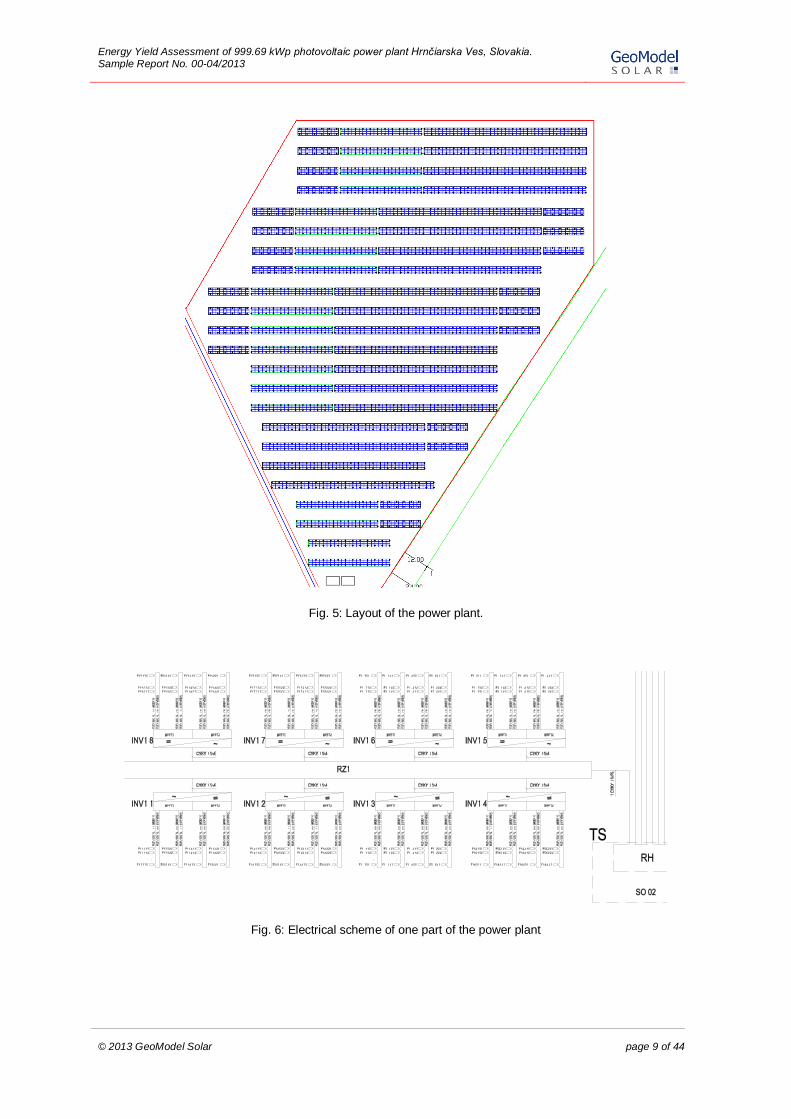
Fig. 6: Electrical scheme of one part of the power plant
Energy Yield Assessment of 999.69 kWp photovoltaic power plant Hrnčiarska Ves, Slovakia. Sample Report No. 00-04/2013
© 2013 GeoModel Solar page 10 of 44
3 DATA AND METHODS
SolarGIS is high-resolution global database of solar resource and meteo parameters, operated by GeoModel Solar. Its geographical extent covers most of the globe between 60º North and South latitudes.
3.1 Satellite-derived solar radiation SolarGIS and validation of GHI with regional measurements
Solar radiation is calculated by numerical models, which are parameterized by a set of inputs characterizing the cloud transmittance, state of the atmosphere and terrain conditions. The methodology and related uncertainties are described in several publications [1, 2, 3, 4, 5].
In SolarGIS approach, the clear-sky irradiance is calculated by the simplified SOLIS model [6]. This model allows fast calculation of clear-sky irradiance from the set of input parameters. The Sun position is deterministic parameter and it is described by the numerical models with satisfactory accuracy. Stochastic variability of clear-sky atmospheric conditions is determined by changing concentrations of atmospheric constituents, namely aerosols, water vapour and ozone. Global atmospheric data, representing these constituents, are routinely calculated by world atmospheric data centres and delivered at a spatial resolution of about 125 km. The calculation accuracy of the clear-sky irradiance is especially sensitive to the information about aerosols.
The key factor determining short-term variability of all-sky irradiance is clouds. Attenuation effect of clouds is expressed by the means of a parameter called cloud index, which is calculated from the routine observations of meteorological geostationary satellites. Spatial resolution of satellite data used in SolarGIS is about 4 x 5 km and time step is 15 and 30 minutes. To retrieve all-sky irradiance in each time step, the clear-sky global horizontal irradiance is coupled with cloud index.
The clouds are the most influencing factor, modulating clear-sky irradiance. Effect of clouds is calculated from the Meteosat MFG and MSG satellite data (© EUMETSAT) in the form of cloud index (cloud transmittance). The cloud index is derived by relating irradiance recorded by the satellite in four spectral channels and surface albedo to the cloud optical properties. In SolarGIS, the modified calculation scheme Heliosat-2 has been adopted to retrieve cloud optical properties from the satellite data. A number of improvements have been introduced to better cope with specific situations such as snow, ice, or high albedo areas (arid zones and deserts), and also with complex terrain.
In SolarGIS, the new generation aerosol data set representing Atmospheric Optical Depth (AOD) is used. This data set is developed and regularly updated by MACC project (© ECMWF) [7]. Important feature of this AOD data set is that it captures daily variability of aerosols and allows simulating more precisely the events with extreme atmospheric load of aerosol particles. Thus it reduces uncertainty of instantaneous estimates of GHI and especially DNI and allows for improved distribution of irradiance values [8]. It is to be noted that coverage of high frequency (daily) aerosol data is limited to the period from 2003 onwards, the remaining years (1994 to 2002) are represented only by monthly longterm averages. In this report the new version of the MACC database, released in year 2012, with improved quality and consistency is used.
Water vapour is also highly variable in space and time, but it has lower impact on the values of solar radiation, compared to aerosols. The daily GFS and CFSR values (© NOAA NCEP) are used in SolarGIS, thus representing the daily variability from 1994 to the present.
Ozone absorbs solar radiation at wavelengths shorter than 0.3 µm, thus having negligible influence on the broadband solar radiation.
Direct Normal Irradiance (DNI) is calculated from Global Horizontal Irradiance (GHI) using modified Dirindex model [9]. Diffuse irradiance for tilted surfaces is calculated by Perez model [10].
For Slovakia, the key solar parameters of the SolarGIS database are:
Operational calculation of irradiance at 15 minute time step (30-minute in period 1994 to 2004);
Primary spatial resolution is about 4x5 km in Central Europe. The shading effects of terrain and elevation is enhanced by disaggregation of the satellite-based irradiance up to 90 metres using Digital Elevation Model SRTM-3;
Energy Yield Assessment of 999.69 kWp photovoltaic power plant Hrnčiarska Ves, Slovakia. Sample Report No. 00-04/2013
© 2013 GeoModel Solar page 11 of 44
Period covered by database from 01/1994 onwards. This report represents 19 complete years from 01/1994 to 12/2012;
Primary parameters: Global Horizontal Irradiance (GHI) and Direct Normal Irradiance (DNI);
Data availability is higher than 99%, missing values are filled by statistical methods, i.e. there are no gaps in the data;
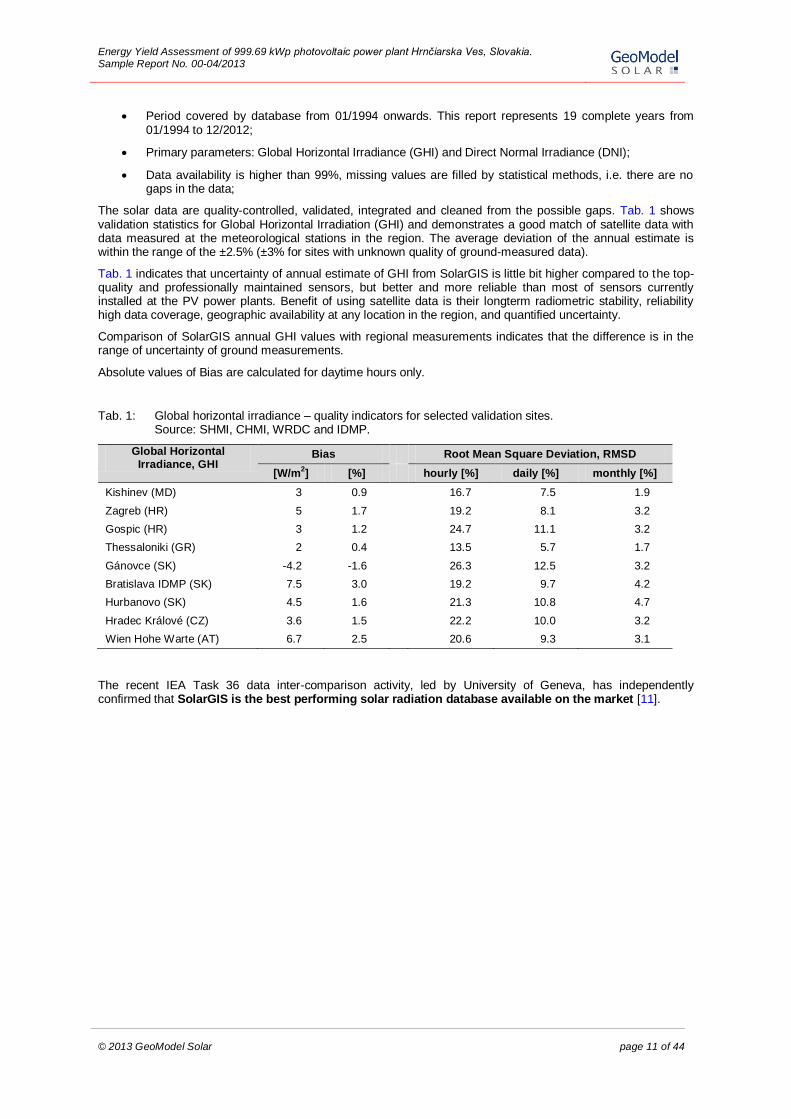
The solar data are quality-controlled, validated, integrated and cleaned from the possible gaps. Tab. 1 shows validation statistics for Global Horizontal Irradiation (GHI) and demonstrates a good match of satellite data with data measured at the meteorological stations in the region. The average deviation of the annual estimate is within the range of the ±2.5% (±3% for sites with unknown quality of ground-measured data).
Tab. 1 indicates that uncertainty of annual estimate of GHI from SolarGIS is little bit higher compared to the top-quality and professionally maintained sensors, but better and more reliable than most of sensors currently installed at the PV power plants. Benefit of using satellite data is their longterm radiometric stability, reliability high data coverage, geographic availability at any location in the region, and quantified uncertainty.
Comparison of SolarGIS annual GHI values with regional measurements indicates that the difference is in the range of uncertainty of ground measurements.
Absolute values of Bias are calculated for daytime hours only.
Tab. 1: Global horizontal irradiance – quality indicators for selected validation sites. Source: SHMI, CHMI, WRDC and IDMP.
Global Horizontal Irradiance, GHI
Bias Root Mean Square Deviation, RMSD
[W/m2] [%] hourly [%] daily [%] monthly [%]
Kishinev (MD) 3 0.9 16.7 7.5 1.9
Zagreb (HR) 5 1.7 19.2 8.1 3.2
Gospic (HR) 3 1.2 24.7 11.1 3.2
Thessaloniki (GR) 2 0.4 13.5 5.7 1.7
Gánovce (SK) -4.2 -1.6 26.3 12.5 3.2
Bratislava IDMP (SK) 7.5 3.0 19.2 9.7 4.2
Hurbanovo (SK) 4.5 1.6 21.3 10.8 4.7
Hradec Králové (CZ) 3.6 1.5 22.2 10.0 3.2
Wien Hohe Warte (AT) 6.7 2.5 20.6 9.3 3.1
The recent IEA Task 36 data inter-comparison activity, led by University of Geneva, has independently confirmed that SolarGIS is the best performing solar radiation database available on the market [11].
Energy Yield Assessment of 999.69 kWp photovoltaic power plant Hrnčiarska Ves, Slovakia. Sample Report No. 00-04/2013
© 2013 GeoModel Solar page 12 of 44
3.2 Air temperature
Air temperature stored in SolarGIS database is calculated from two principal data sources. SolarGIS algorithms and Digital Elevation Model SRTM-30 have been used in the data post-processing. The following are the features of the SolarGIS meteo database:
Sources of primary data (both are copyright of NOAA NCEP):
o CFSR (Climate Forecast System Reanalysis), years 1994 to 2009
o GFS (Global Forecast System), years 2010 to 2012
Parameters used for calculation for the site:
o Air temperature at 2 metres (dry bulb temperature), TEMP [°C]
Original temporal resolution of 1 hour (CFSR) and 3 hours (GFS) is interpolated and harmonised to the time step of 1 hour
Original spatial resolution of the primary parameters is 33 km (CFSR) and 50 km (GFS). Both data resolutions are post-processed and recalculated to the spatial resolution of 1 km
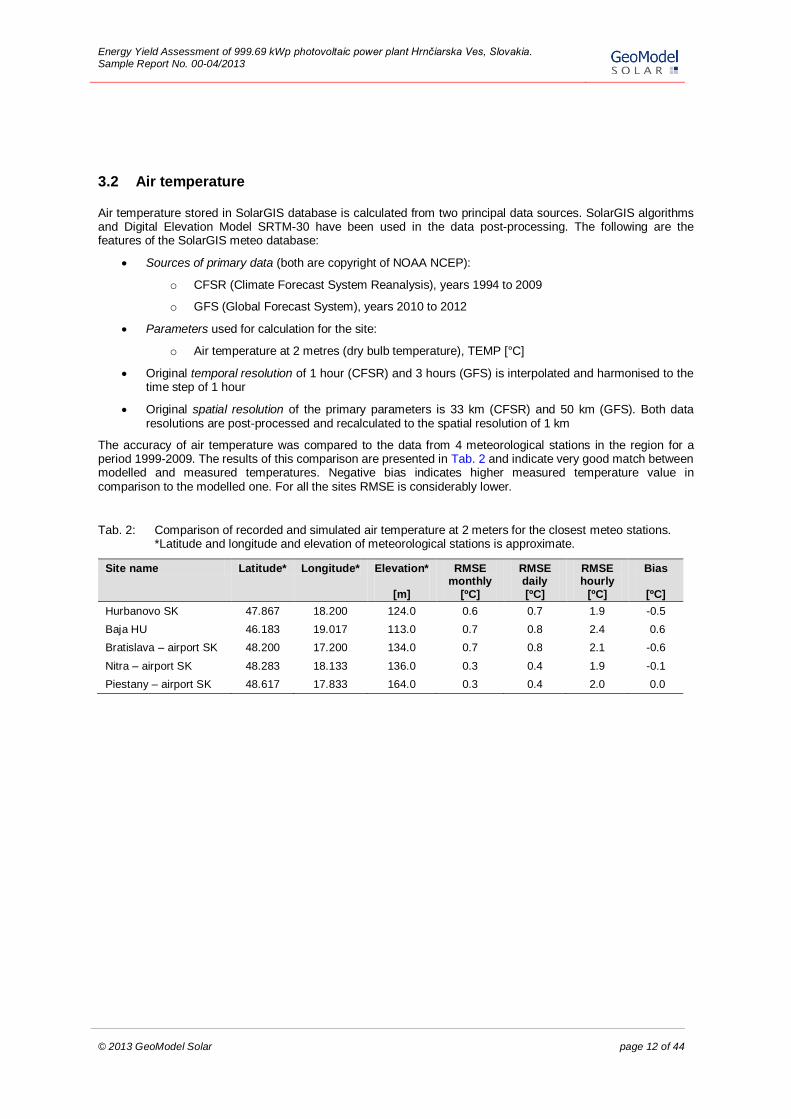
The accuracy of air temperature was compared to the data from 4 meteorological stations in the region for a period 1999-2009. The results of this comparison are presented in Tab. 2 and indicate very good match between modelled and measured temperatures. Negative bias indicates higher measured temperature value in comparison to the modelled one. For all the sites RMSE is considerably lower.
Tab. 2: Comparison of recorded and simulated air temperature at 2 meters for the closest meteo stations. *Latitude and longitude and elevation of meteorological stations is approximate.
Site name Latitude* Longitude* Elevation*
[m]
RMSE monthly
[ºC]
RMSE daily
[ºC]
RMSE hourly
[ºC]
Bias
[ºC]
Hurbanovo SK 47.867 18.200 124.0 0.6 0.7 1.9 -0.5
Baja HU 46.183 19.017 113.0 0.7 0.8 2.4 0.6
Bratislava – airport SK 48.200 17.200 134.0 0.7 0.8 2.1 -0.6
Nitra – airport SK 48.283 18.133 136.0 0.3 0.4 1.9 -0.1
Piestany – airport SK 48.617 17.833 164.0 0.3 0.4 2.0 0.0
Energy Yield Assessment of 999.69 kWp photovoltaic power plant Hrnčiarska Ves, Slovakia. Sample Report No. 00-04/2013
© 2013 GeoModel Solar page 13 of 44
3.3 PV simulation methods
Simulations of the power plant and its components are carried out by SolarGIS PV model, which uses 15-minute time series of solar radiation and air temperature data representing a period of 19 years (1994 to 2012).
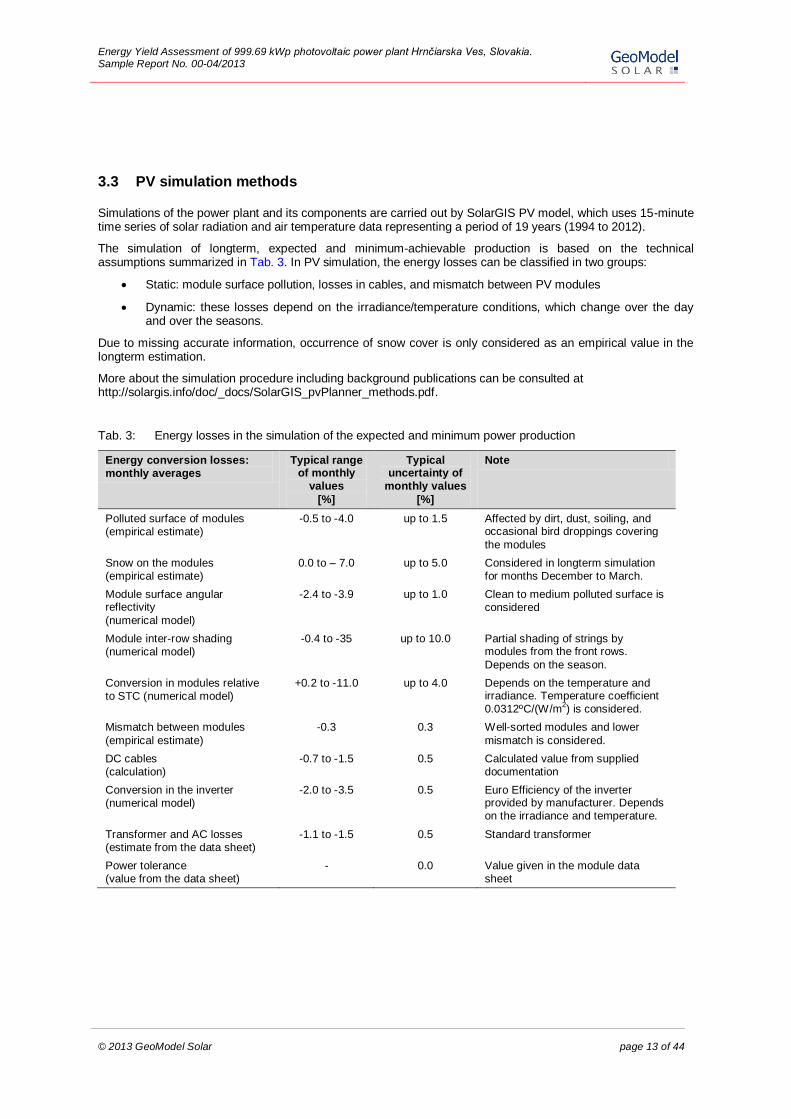
The simulation of longterm, expected and minimum-achievable production is based on the technical assumptions summarized in Tab. 3. In PV simulation, the energy losses can be classified in two groups:
Static: module surface pollution, losses in cables, and mismatch between PV modules
Dynamic: these losses depend on the irradiance/temperature conditions, which change over the day and over the seasons.
Due to missing accurate information, occurrence of snow cover is only considered as an empirical value in the longterm estimation.
More about the simulation procedure including background publications can be consulted at http://solargis.info/doc/_docs/SolarGIS_pvPlanner_methods.pdf.
Tab. 3: Energy losses in the simulation of the expected and minimum power production
Energy conversion losses: monthly averages
Typical range of monthly
values
[%]
Typical uncertainty of
monthly values
[%]
Note
Polluted surface of modules (empirical estimate)
-0.5 to -4.0 up to 1.5 Affected by dirt, dust, soiling, and occasional bird droppings covering
the modules
Snow on the modules (empirical estimate)
0.0 to – 7.0 up to 5.0 Considered in longterm simulation for months December to March.
Module surface angular reflectivity
(numerical model)
-2.4 to -3.9 up to 1.0 Clean to medium polluted surface is considered
Module inter-row shading (numerical model)
-0.4 to -35 up to 10.0 Partial shading of strings by modules from the front rows.
Depends on the season.
Conversion in modules relative
to STC (numerical model)
+0.2 to -11.0 up to 4.0 Depends on the temperature and irradiance. Temperature coefficient 0.0312ºC/(W/m
2) is considered.
Mismatch between modules
(empirical estimate)
-0.3 0.3 Well-sorted modules and lower
mismatch is considered.
DC cables (calculation)
-0.7 to -1.5 0.5 Calculated value from supplied documentation
Conversion in the inverter
(numerical model)
-2.0 to -3.5 0.5 Euro Efficiency of the inverter provided by manufacturer. Depends on the irradiance and temperature.
Transformer and AC losses (estimate from the data sheet)
-1.1 to -1.5 0.5 Standard transformer
Power tolerance (value from the data sheet)
- 0.0 Value given in the module data sheet
Energy Yield Assessment of 999.69 kWp photovoltaic power plant Hrnčiarska Ves, Slovakia. Sample Report No. 00-04/2013
© 2013 GeoModel Solar page 14 of 44
3.4 PV simulation assumptions and uncertainties
Photovoltaic power production has been calculated using numerical models developed or implemented by GeoModel Solar. As described in Chapters 3.1 and 3.2, 15-minute time series of solar radiation and air temperature data are used as inputs to the simulation of PV power production. Typical monthly and annual energy losses and uncertainties are listed in Tab.3.
Step 1: Global irradiation on the tilted surface of PV modules
Global irradiation impinging on a tilted plane of PV modules GINCLINED (GTI) is calculated from Global Horizontal Irradiance (Gh), Direct Normal Irradiance (DNI), terrain albedo, and instantaneous sun position within 15 minutes time interval (SPOS):
GINCLINED=fDIFF (Gh, DNI, Albedo, SPOS)
Perez model is used [10]. Global irradiation received by South-facing PV modules tilted at angle 30° is estimated to 1481 kWh/m
2 (Chapter 4.2). Based on the expert evaluation and data validation, the uncertainty of this
estimate is ±3.4%.
Step 2: Losses due to terrain shading
Shading by terrain features is calculated by disaggregation using SRTM-3 DEM and horizon height. Shading of local features such as from nearby building, structures or vegetation is not considered:
GINCLINED-SHAD = fSHAD(GINCLINED, SPOS, Horizon)
Method by Ruiz-Arias et al [12] is used. For open space systems the uncertainty of this estimate is very low due to high resolution of DEM (~80 m). For urban areas, where shading is mainly influenced by buildings, an additional analysis must be undertaken to consider the Detailed surface model.
For the analysed location there is very low surrounding terrain horizon with almost no effect (0.1%) on the availability of solar radiation. The uncertainty of this estimate is 0%.
Step 3: Losses due to angular reflectivity
The resulting irradiation is subject to losses from angular reflectivity (angle of incidence effects) on the surface of PV modules, and the magnitude of effects depends on relative position of the sun and plane of the module:
GANGULAR = fANGULAR(GINCLINED-SHAD, SPOS)
The model by Martin and Ruiz is used [13]. The accuracy of calculations of angular reflectivity losses depends on cleanness and specific properties of the module surface (antireflection coating, texture, etc.). In this study a typical low iron float glass and “average” effect of dirt and dust are assumed. The model led losses of solar radiation due to reflectivity of module surface are 3.4%. The uncertainty of this step is below ±0.5%.
Step 4: Losses due to snow
Losses of solar radiation during winter months are increased by snow on the modules. Typically snow remains on the modules surface from the morning hours to the noon. This happens because with increasing intensity of irradiance increases the temperature of the modules causing snow to slide off (also during cloudy sky days). The highest negative impact on the production has snowfall during cold, cloudy days, when the temperature of the modules is not high enough to melt the snow. In this study the cumulative annual losses due to the snow were estimated to be 1.0%. The uncertainty has been set to ±1.0%.
Step 5: Losses due to dirt and soiling
Losses of solar radiation at the level of surface of PV modules depend mainly on the environmental factors and cleaning of the PV modules surface during the power plant lifetime. The longterm effects are not satisfactorily known. This is especially valid for dry seasons of the year. The power plant is located in a rural area with potential dust and dirt accumulation from agricultural activities on the surface of PV modules. In this study the losses due to these effects were estimated to be 2.0%. The uncertainty has been set to ±1.0%.

Energy Yield Assessment of 999.69 kWp photovoltaic power plant Hrnčiarska Ves, Slovakia. Sample Report No. 00-04/2013
© 2013 GeoModel Solar page 15 of 44
Step 6: Losses due to performance of PV modules outside of STC conditions
Global irradiation (GANGULAR) reaching modules of the given type (MTYPE) along with the air temperature (TAIR) are the input parameters to the PV performance model:
PVDC = fPV(GANGULAR, TAIR, MTYPE)
The conversion efficiency is non-linear and depends on the distribution of both the values of irradiance and temperature. Relative change of produced energy from this stage of conversion depends on module technology and mounting type. Typically the losses at this step are higher for crystalline silicon modules than thin films due to higher negative thermal power coefficient of crystalline silicon and better behaviour of thin film at low light levels (different spectral sensitivity). The approach by King et al is used in the modelling of this physical process [14], further developed by Huld et al [15, 16] and very recently published in [17, 18]. The losses at this stage of energy conversion for polycrystalline modules are 6.9%. The uncertainty of this estimate is about ±3.0%.
Step 7: Losses by inter-row shading
In this study the relative spacing of rows is approximately 2.2 and this leads to electricity losses due short-distance shading at the level of 3.0% with uncertainty of ±1.5% (Chapter 3.5). The analysed power plant is not optimised in regard to minimising shading losses due to relatively high shading angle. Crystalline silicon modules are sensitive to partial shading, and losses depend on the topology of module interconnections. Thus an estimate of losses in the winter season has higher uncertainty.
Step 8: Power tolerance of modules
From the module power tolerance result bigger or smaller mismatch losses of the modules connected in strings. If modules with higher power tolerance are connected in series, the losses are higher. The power tolerance of modules increases uncertainty of power output estimation. In this study the uncertainty was set to ±0% because used photovoltaic modules have only positive power tolerance.
Step 9: Mismatch and DC cabling losses
Mismatch due to different MPP operating point of modules connected into an inverter and heat losses in the interconnections and cables depend on the design and components of the PV power plant. If classification of modules is considered according to the measurements of the nominal conversion efficiency performed by the manufacturer, grouping the modules from the same class is an effective measure to minimize the mismatch losses of the modules connected within one string. Overall DC losses from all these effects are estimated to be 1.0% with uncertainty of ±0.7%.
Step 10: Inverter losses from conversion of DC to AC
Although power efficiency of inverter is high, each type of inverter has its own efficiency function (dependence of the inverter efficiency on the inverter load and inverter input voltage) f INVERTER.
PVAC= fINVERTER (PVDC, DCLOSS)
Losses due to performance of inverters can be estimated using inverter power curve with 15-minute pairs of DC data or using the less accurate pre-calculated value given by the manufacturer and representing the average efficiency (Euro efficiency). The Euro efficiency of the inverters, provided by the manufacturer, is used in this simulation. The average losses at this stage are considered at the level of 2.8% and they are very similar to the values provided by manufacturer value of weighted Euro Efficiency 97.2%. Uncertainty of this estimate of ±1.0% is considered in this study.
Step 11: AC and transformer losses
The inverter output is connected to the grid through the transformer. The additional AC side losses reduce the final system output by a combination of cabling (ACLOSS) and transformer losses (TRLOSSES):
PVOUT=fAC(ACLOSS, TRLOSSES)
The combined AC losses are estimated to 1.5% (1.0% for transformers and 0.5% AC cabling) with ±0.5% uncertainty.

Energy Yield Assessment of 999.69 kWp photovoltaic power plant Hrnčiarska Ves, Slovakia. Sample Report No. 00-04/2013
© 2013 GeoModel Solar page 16 of 44
Step 12: Availability
This empirical parameter quantifies electricity losses incurred by shutdown of a PV power plant due to maintenance or failures. In the analysis of theoretical production, the availability is considered to be 99% and is shown as a separate item in the calculations with uncertainty ±0.7%.
Step 13: Long term degradation
Many years of operation of PV power plants is the ultimate test for all components, placing the module encapsulants, cell interconnections, junction boxes, cabling, and inverters under stress during the weather cycles [19]. Currently produced modules and system components represent a mature technology, and low degradation can be assumed. Manufacturer of modules in this study provides a limited power warranty for 25 years. Although it has been observed in different studies that performance degradation rate of PV modules is higher at the beginning of the exposure (initial degradation), and then stabilizes at a lower level, an assumption of linear annual degradation rate is good approximation for the payback time of the investment costs.
Based on existing in-field experiences of commercial projects the long term annual performance degradation of well-manufactured modules may be close to value of 0.8% for the first year and 0.5% for the next ones and these values are used in this study of longterm degradation.
It has to be noted that the uncertainty for the estimate of the degradation rate PV modules performance is not fully studied.
Simulations were followed according to expert knowledge, monitoring results and recommendations of [29].
Energy Yield Assessment of 999.69 kWp photovoltaic power plant Hrnčiarska Ves, Slovakia. Sample Report No. 00-04/2013
© 2013 GeoModel Solar page 17 of 44
3.5 Inter-row shading and electricity losses
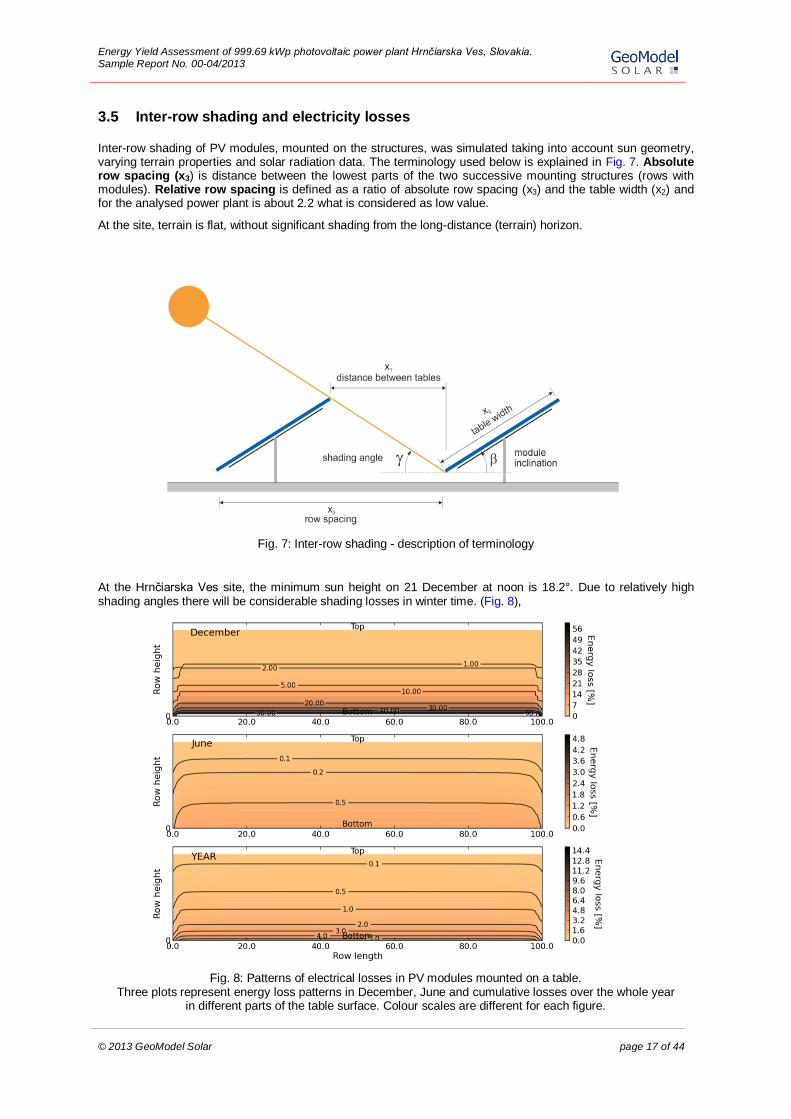
Inter-row shading of PV modules, mounted on the structures, was simulated taking into account sun geometry, varying terrain properties and solar radiation data. The terminology used below is explained in Fig. 7. Absolute row spacing (x3) is distance between the lowest parts of the two successive mounting structures (rows with modules). Relative row spacing is defined as a ratio of absolute row spacing (x3) and the table width (x2) and for the analysed power plant is about 2.2 what is considered as low value.
At the site, terrain is flat, without significant shading from the long-distance (terrain) horizon.
Fig. 7: Inter-row shading - description of terminology
At the Hrnčiarska Ves site, the minimum sun height on 21 December at noon is 18.2°. Due to relatively high shading angles there will be considerable shading losses in winter time. (Fig. 8),
Fig. 8: Patterns of electrical losses in PV modules mounted on a table. Three plots represent energy loss patterns in December, June and cumulative losses over the whole year
in different parts of the table surface. Colour scales are different for each figure.

Energy Yield Assessment of 999.69 kWp photovoltaic power plant Hrnčiarska Ves, Slovakia. Sample Report No. 00-04/2013
© 2013 GeoModel Solar page 18 of 44
The estimation of the impact of the modules arrangement on the electricity yield of partially shadowed PV modules is not a trivial task. A high number of factors need to be addressed to estimate the magnitude of these effects, such as:
Energy yield reduction in modules themselves, the mismatch between non-uniformly shaded modules,
Characteristics of photovoltaic inverter (MPP tracking voltage window, the accuracy of MPP tracking in case the I-V curve is distorted by shading),
Shape of particular shading pattern and its orientation in relation to electrical connection within the module – the orientation of strings.
The silicon-wafer based modules are very sensitive to partial shading. The loss in performance at partially shaded c-Si photovoltaic modules in the rows can be nearly proportional to the loss at the most shaded PV cell for the cells connected in series within the module, if proper counter-measures are not applied [20]. As a consequence the cells near the ground can reduce the performance of the whole module considerably when shaded. The standard technique to counterbalance the effect of shading is utilization of the bypass diodes incorporated within module structure and proper topology of modules interconnections.
The analysed power plant is not fully optimised in regard to minimising shading losses due to relatively high shading angle. Fig. 8 shows inter-row shading effect on electricity yield losses. Row length is expressed in percentage of total length. For the period of the whole year, the inter-row shading losses are estimated to a yearly average at 3.0%. In winter months (e.g. in December) the electrical losses at the bottom part of the table (the most shaded part) may reach more than 50% for modules inclination angle of 30°. In this regard the performance of the bottom row will be reduced in comparison to the other rows.
Energy Yield Assessment of 999.69 kWp photovoltaic power plant Hrnčiarska Ves, Slovakia. Sample Report No. 00-04/2013
© 2013 GeoModel Solar page 19 of 44
4 LOCAL CLIMATE
4.1 Global horizontal irradiation and air temperature
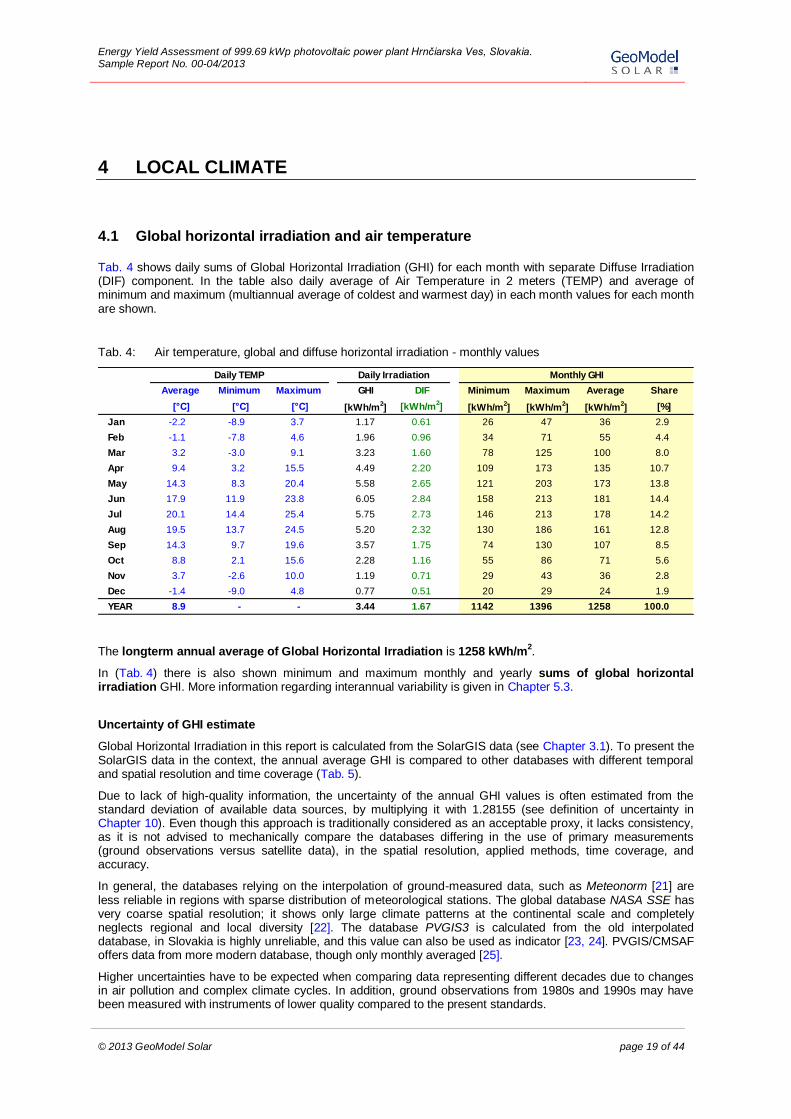
Tab. 4 shows daily sums of Global Horizontal Irradiation (GHI) for each month with separate Diffuse Irradiation (DIF) component. In the table also daily average of Air Temperature in 2 meters (TEMP) and average of minimum and maximum (multiannual average of coldest and warmest day) in each month values for each month are shown.
Tab. 4: Air temperature, global and diffuse horizontal irradiation - monthly values
The longterm annual average of Global Horizontal Irradiation is 1258 kWh/m2.
In (Tab. 4) there is also shown minimum and maximum monthly and yearly sums of global horizontal irradiation GHI. More information regarding interannual variability is given in Chapter 5.3.
Uncertainty of GHI estimate
Global Horizontal Irradiation in this report is calculated from the SolarGIS data (see Chapter 3.1). To present the SolarGIS data in the context, the annual average GHI is compared to other databases with different temporal and spatial resolution and time coverage (Tab. 5).
Due to lack of high-quality information, the uncertainty of the annual GHI values is often estimated from the standard deviation of available data sources, by multiplying it with 1.28155 (see definition of uncertainty in Chapter 10). Even though this approach is traditionally considered as an acceptable proxy, it lacks consistency, as it is not advised to mechanically compare the databases differing in the use of primary measurements (ground observations versus satellite data), in the spatial resolution, applied methods, time coverage, and accuracy.
In general, the databases relying on the interpolation of ground-measured data, such as Meteonorm [21] are less reliable in regions with sparse distribution of meteorological stations. The global database NASA SSE has very coarse spatial resolution; it shows only large climate patterns at the continental scale and completely neglects regional and local diversity [22]. The database PVGIS3 is calculated from the old interpolated database, in Slovakia is highly unreliable, and this value can also be used as indicator [23, 24]. PVGIS/CMSAF offers data from more modern database, though only monthly averaged [25].
Higher uncertainties have to be expected when comparing data representing different decades due to changes in air pollution and complex climate cycles. In addition, ground observations from 1980s and 1990s may have been measured with instruments of lower quality compared to the present standards.
Average Minimum Maximum GHI DIF Minimum Maximum Average Share
[°C] [°C] [°C] [kWh/m2] [kWh/m
2] [kWh/m
2] [kWh/m
2] [kWh/m
2] [%]
Jan -2.2 -8.9 3.7 1.17 0.61 26 47 36 2.9
Feb -1.1 -7.8 4.6 1.96 0.96 34 71 55 4.4
Mar 3.2 -3.0 9.1 3.23 1.60 78 125 100 8.0
Apr 9.4 3.2 15.5 4.49 2.20 109 173 135 10.7
May 14.3 8.3 20.4 5.58 2.65 121 203 173 13.8
Jun 17.9 11.9 23.8 6.05 2.84 158 213 181 14.4
Jul 20.1 14.4 25.4 5.75 2.73 146 213 178 14.2
Aug 19.5 13.7 24.5 5.20 2.32 130 186 161 12.8
Sep 14.3 9.7 19.6 3.57 1.75 74 130 107 8.5
Oct 8.8 2.1 15.6 2.28 1.16 55 86 71 5.6
Nov 3.7 -2.6 10.0 1.19 0.71 29 43 36 2.8
Dec -1.4 -9.0 4.8 0.77 0.51 20 29 24 1.9
YEAR 8.9 - - 3.44 1.67 1142 1396 1258 100.0
Monthly GHIDaily TEMP Daily Irradiation
Energy Yield Assessment of 999.69 kWp photovoltaic power plant Hrnčiarska Ves, Slovakia. Sample Report No. 00-04/2013
© 2013 GeoModel Solar page 20 of 44
The modern satellite-based databases have high spatial and temporal resolution, and they are considered as the mainstream source of solar information for solar energy applications - for prefeasibility studies, project optimisation, financing, and for operation and management of solar power plants. In this context, high quality ground measurements still maintain their important role for validation and maintaining accuracy of satellite-based numerical models.
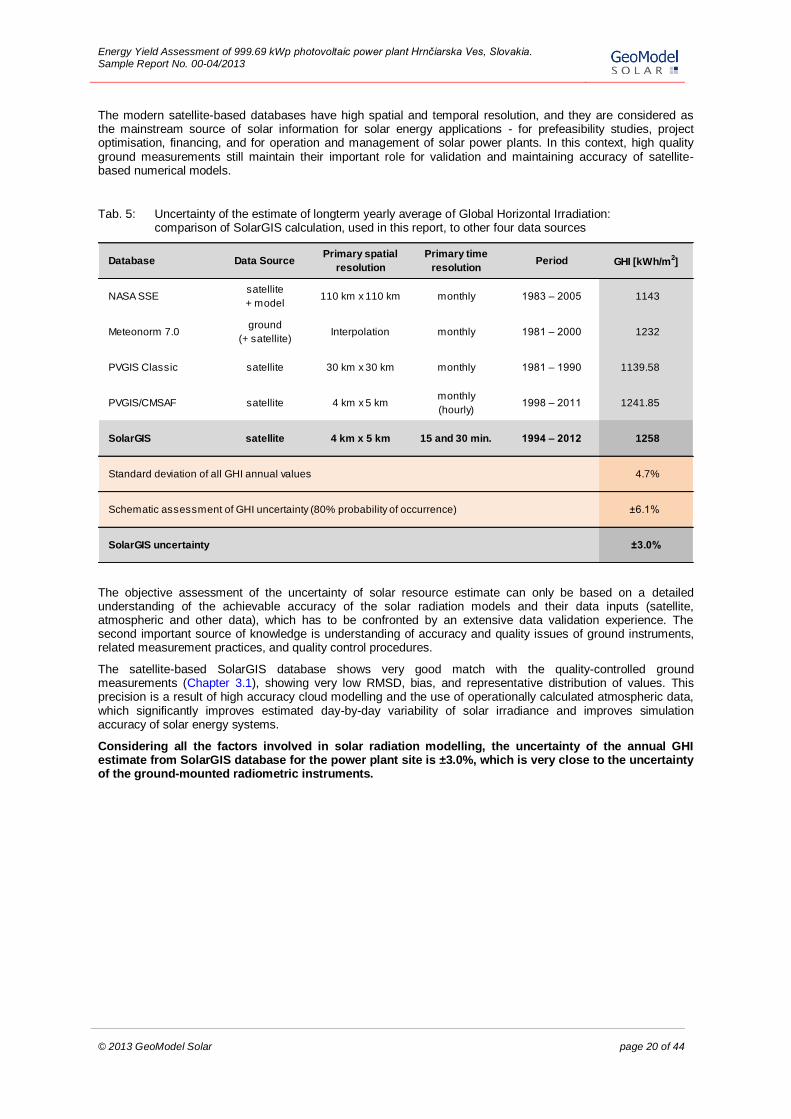
Tab. 5: Uncertainty of the estimate of longterm yearly average of Global Horizontal Irradiation: comparison of SolarGIS calculation, used in this report, to other four data sources
The objective assessment of the uncertainty of solar resource estimate can only be based on a detailed understanding of the achievable accuracy of the solar radiation models and their data inputs (satellite, atmospheric and other data), which has to be confronted by an extensive data validation experience. The second important source of knowledge is understanding of accuracy and quality issues of ground instruments, related measurement practices, and quality control procedures.
The satellite-based SolarGIS database shows very good match with the quality-controlled ground measurements (Chapter 3.1), showing very low RMSD, bias, and representative distribution of values. This precision is a result of high accuracy cloud modelling and the use of operationally calculated atmospheric data, which significantly improves estimated day-by-day variability of solar irradiance and improves simulation accuracy of solar energy systems.
Considering all the factors involved in solar radiation modelling, the uncertainty of the annual GHI estimate from SolarGIS database for the power plant site is ±3.0%, which is very close to the uncertainty of the ground-mounted radiometric instruments.
Database Data SourcePrimary spatial
resolution
Primary time
resolutionPeriod GHI [kWh/m
2]
NASA SSEsatellite
+ model110 km x 110 km monthly 1983 – 2005 1143
Meteonorm 7.0ground
(+ satellite)Interpolation monthly 1981 – 2000 1232
PVGIS Classic satellite 30 km x 30 km monthly 1981 – 1990 1139.58
PVGIS/CMSAF satellite 4 km x 5 kmmonthly
(hourly)1998 – 2011 1241.85
SolarGIS satellite 4 km x 5 km 15 and 30 min. 1994 – 2012 1258
4.7%
±6.1%
±3.0%SolarGIS uncertainty
Standard deviation of all GHI annual values
Schematic assessment of GHI uncertainty (80% probability of occurrence)
Energy Yield Assessment of 999.69 kWp photovoltaic power plant Hrnčiarska Ves, Slovakia. Sample Report No. 00-04/2013
© 2013 GeoModel Solar page 21 of 44
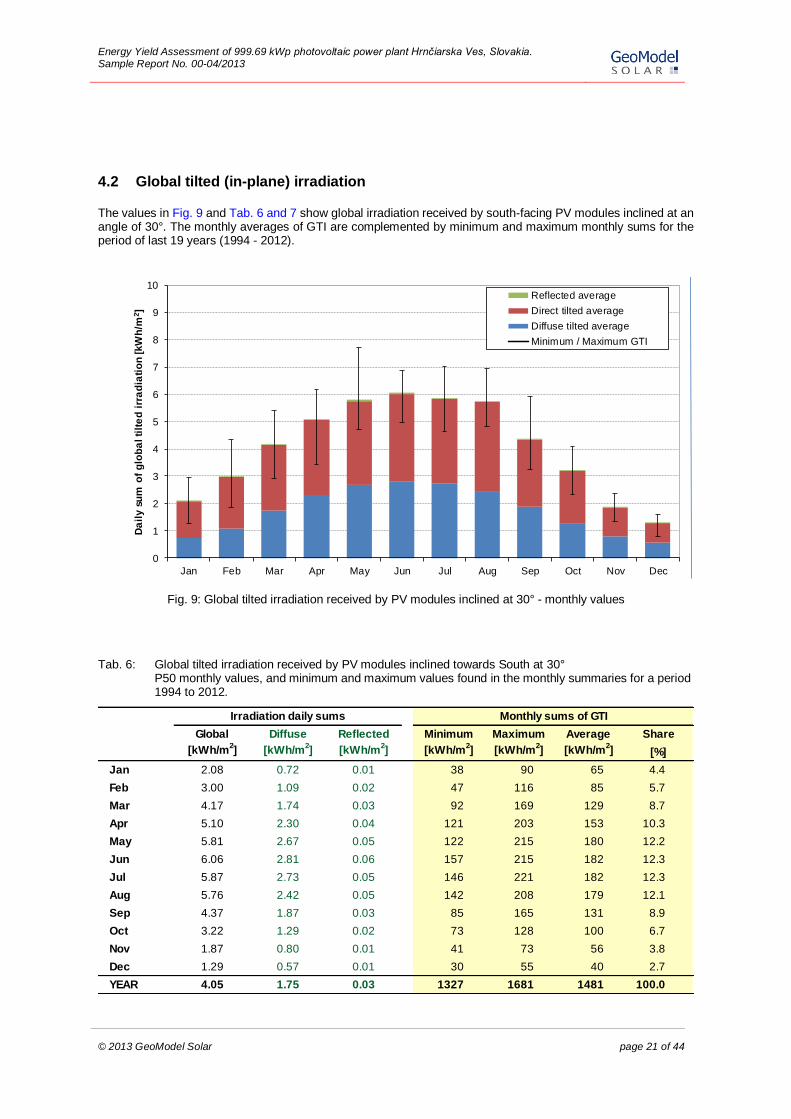
4.2 Global tilted (in-plane) irradiation
The values in Fig. 9 and Tab. 6 and 7 show global irradiation received by south-facing PV modules inclined at an angle of 30°. The monthly averages of GTI are complemented by minimum and maximum monthly sums for the period of last 19 years (1994 - 2012).
Fig. 9: Global tilted irradiation received by PV modules inclined at 30° - monthly values
Tab. 6: Global tilted irradiation received by PV modules inclined towards South at 30° P50 monthly values, and minimum and maximum values found in the monthly summaries for a period 1994 to 2012.
DaysInMonth
Diffuse tilted
average
Direct tilted
average
Reflected
average Average Minimum Maximum
Jan 31 0.72 1.35 0.01 2.08 0.87 0.82 -1
Feb 28.24 1.09 1.89 0.02 3.00 1.33 1.13 -1
Mar 31 1.74 2.40 0.03 4.17 1.21 1.27 -1
Apr 30 2.30 2.76 0.04 5.10 1.07 1.65 -1
May 31 2.67 3.09 0.05 5.81 1.89 1.11 -1
Jun 30 2.81 3.19 0.06 6.06 0.82 1.09 -1
Jul 31 2.73 3.09 0.05 5.87 1.16 1.24 -1
Aug 31 2.42 3.29 0.05 5.76 1.18 0.94 -1
Sep 30 1.87 2.47 0.03 4.37 1.55 1.13 -1
Oct 31 1.29 1.91 0.02 3.22 0.88 0.89 -1
Nov 30 0.80 1.06 0.01 1.87 0.51 0.57 -1
Dec 31 0.57 0.71 0.01 1.29 0.32 0.50 -1
0
1
2
3
4
5
6
7
8
9
10
Jan Feb Mar Apr May Jun Jul Aug Sep Oct Nov Dec
Da
ily s
um
of
glo
ba
l ti
lte
d i
rra
dia
tio
n [kW
h/m
2]
Reflected average
Direct tilted average
Diffuse tilted average
Minimum / Maximum GTI
Global Diffuse Reflected Minimum Maximum Average Share
[kWh/m2] [kWh/m
2] [kWh/m
2] [kWh/m
2] [kWh/m
2] [kWh/m
2] [%]
Jan 2.08 0.72 0.01 38 90 65 4.4
Feb 3.00 1.09 0.02 47 116 85 5.7
Mar 4.17 1.74 0.03 92 169 129 8.7
Apr 5.10 2.30 0.04 121 203 153 10.3
May 5.81 2.67 0.05 122 215 180 12.2
Jun 6.06 2.81 0.06 157 215 182 12.3
Jul 5.87 2.73 0.05 146 221 182 12.3
Aug 5.76 2.42 0.05 142 208 179 12.1
Sep 4.37 1.87 0.03 85 165 131 8.9
Oct 3.22 1.29 0.02 73 128 100 6.7
Nov 1.87 0.80 0.01 41 73 56 3.8
Dec 1.29 0.57 0.01 30 55 40 2.7
YEAR 4.05 1.75 0.03 1327 1681 1481 100.0
Irradiation daily sums Monthly sums of GTI
Energy Yield Assessment of 999.69 kWp photovoltaic power plant Hrnčiarska Ves, Slovakia. Sample Report No. 00-04/2013
© 2013 GeoModel Solar page 22 of 44
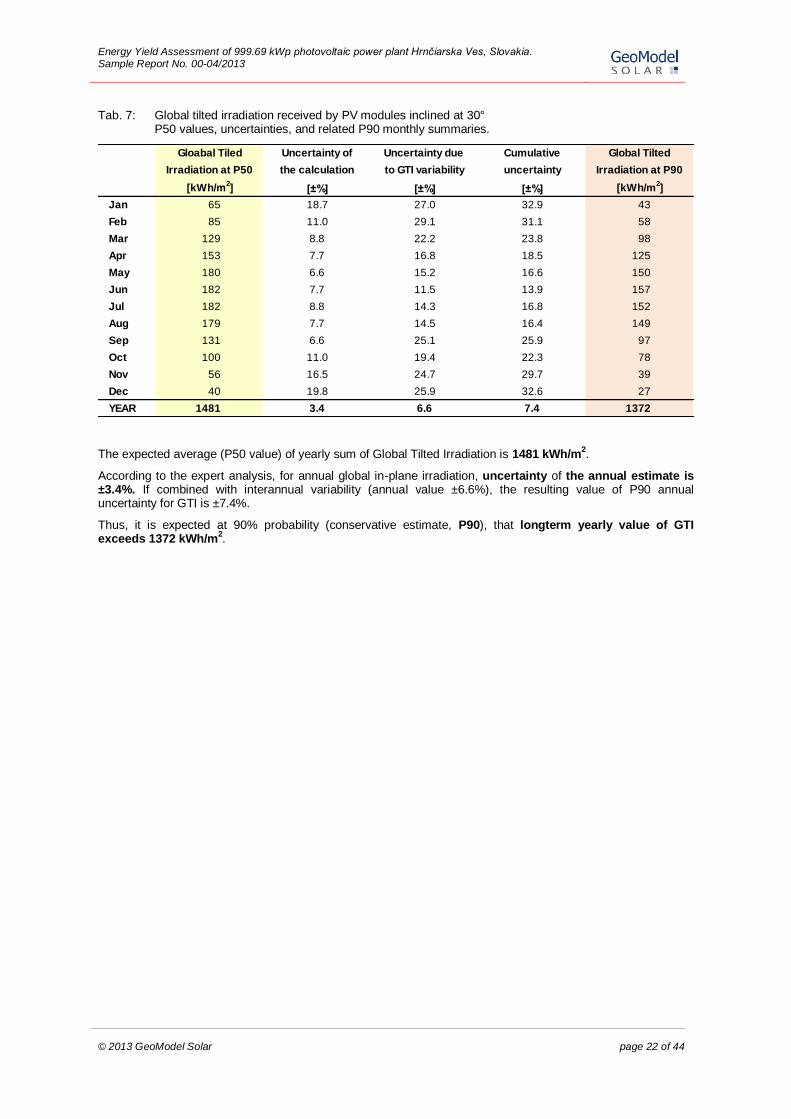
Tab. 7: Global tilted irradiation received by PV modules inclined at 30° P50 values, uncertainties, and related P90 monthly summaries.
The expected average (P50 value) of yearly sum of Global Tilted Irradiation is 1481 kWh/m2.
According to the expert analysis, for annual global in-plane irradiation, uncertainty of the annual estimate is ±3.4%. If combined with interannual variability (annual value ±6.6%), the resulting value of P90 annual uncertainty for GTI is ±7.4%.
Thus, it is expected at 90% probability (conservative estimate, P90), that longterm yearly value of GTI exceeds 1372 kWh/m
2.
Gloabal Tiled Uncertainty of Uncertainty due Cumulative Global Tilted
Irradiation at P50 the calculation to GTI variability uncertainty Irradiation at P90
[kWh/m2] [±%] [±%] [±%] [kWh/m
2]
Jan 65 18.7 27.0 32.9 43
Feb 85 11.0 29.1 31.1 58
Mar 129 8.8 22.2 23.8 98
Apr 153 7.7 16.8 18.5 125
May 180 6.6 15.2 16.6 150
Jun 182 7.7 11.5 13.9 157
Jul 182 8.8 14.3 16.8 152
Aug 179 7.7 14.5 16.4 149
Sep 131 6.6 25.1 25.9 97
Oct 100 11.0 19.4 22.3 78
Nov 56 16.5 24.7 29.7 39
Dec 40 19.8 25.9 32.6 27
YEAR 1481 3.4 6.6 7.4 1372
Energy Yield Assessment of 999.69 kWp photovoltaic power plant Hrnčiarska Ves, Slovakia. Sample Report No. 00-04/2013
© 2013 GeoModel Solar page 23 of 44
4.3 Deviation from theoretical optimum inclination angle
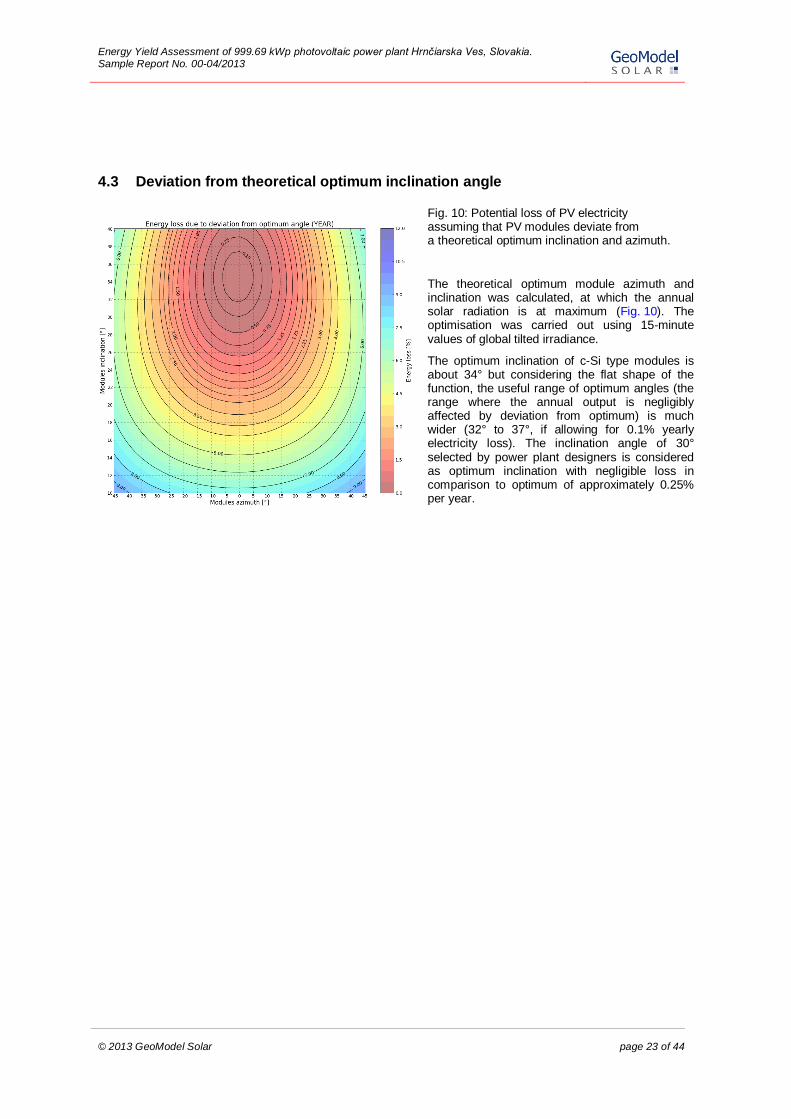
Fig. 10: Potential loss of PV electricity assuming that PV modules deviate from a theoretical optimum inclination and azimuth.
The theoretical optimum module azimuth and inclination was calculated, at which the annual solar radiation is at maximum (Fig. 10). The optimisation was carried out using 15-minute values of global tilted irradiance.
The optimum inclination of c-Si type modules is about 34° but considering the flat shape of the function, the useful range of optimum angles (the range where the annual output is negligibly affected by deviation from optimum) is much wider (32° to 37°, if allowing for 0.1% yearly electricity loss). The inclination angle of 30° selected by power plant designers is considered as optimum inclination with negligible loss in comparison to optimum of approximately 0.25% per year.
Energy Yield Assessment of 999.69 kWp photovoltaic power plant Hrnčiarska Ves, Slovakia. Sample Report No. 00-04/2013
© 2013 GeoModel Solar page 24 of 44
5 SOLAR ELECTRICITY PRODUCTION
5.1 Estimation of system losses and performance ratio
The annual and monthly energy output from the photovoltaic power plant is calculated from 19 years time series of solar irradiance and temperature. The magnitude and uncertainty of the conversion losses is explained in Chapter 3.4.
Availability is an empirical parameter that considers occasional energy losses due to complete shutdown of the power plant, which may occur during accidental failures, grid blackouts and maintenance operations. Occasionally, shutdown may be initiated also by the electrical utility. In reference to other projects installed in Europe, 99% availability (i.e. annual energy losses 1%) can be considered as a "good practice", with uncertainty ±0.7%. Validity of this assumption strongly depends on the operation routines, maintenance contracts, grid stability and under less favourable conditions it may be considered as too optimistic. The technical availability is shown separately since its nature is different from the system performance.
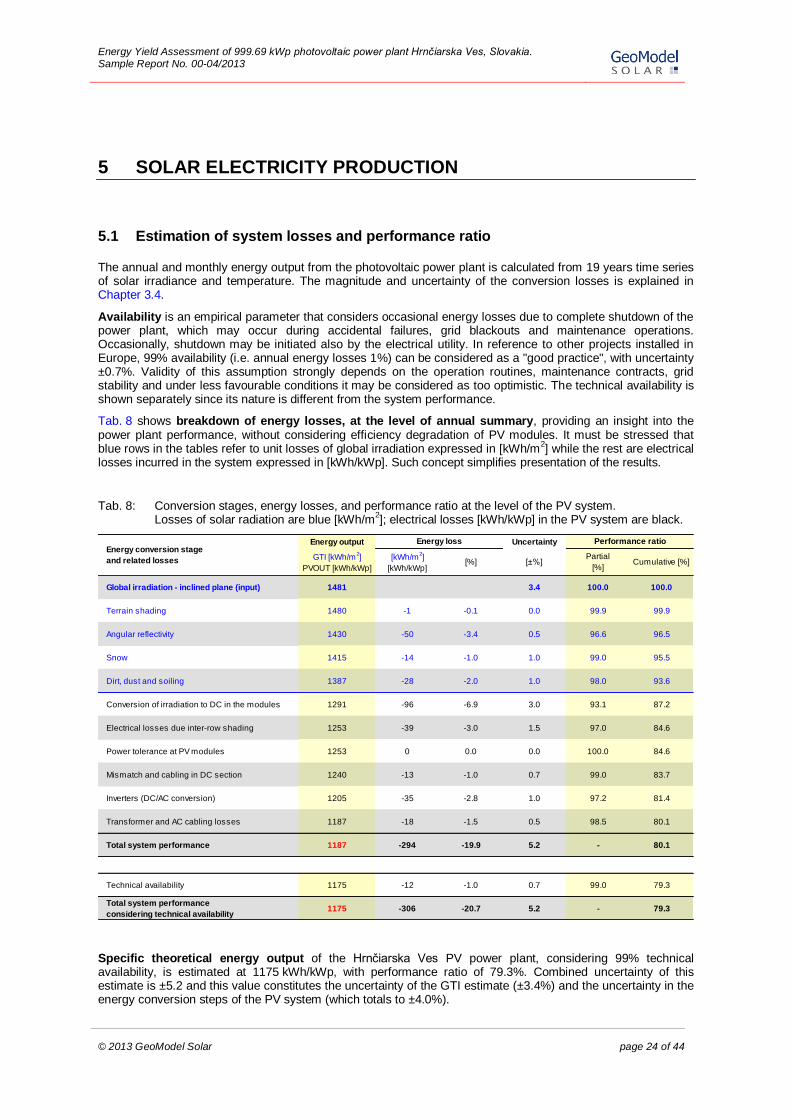
Tab. 8 shows breakdown of energy losses, at the level of annual summary, providing an insight into the power plant performance, without considering efficiency degradation of PV modules. It must be stressed that blue rows in the tables refer to unit losses of global irradiation expressed in [kWh/m
2] while the rest are electrical
losses incurred in the system expressed in [kWh/kWp]. Such concept simplifies presentation of the results.
Tab. 8: Conversion stages, energy losses, and performance ratio at the level of the PV system. Losses of solar radiation are blue [kWh/m
2]; electrical losses [kWh/kWp] in the PV system are black.
Specific theoretical energy output of the Hrnčiarska Ves PV power plant, considering 99% technical availability, is estimated at 1175 kWh/kWp, with performance ratio of 79.3%. Combined uncertainty of this estimate is ±5.2 and this value constitutes the uncertainty of the GTI estimate (±3.4%) and the uncertainty in the energy conversion steps of the PV system (which totals to ±4.0%).
Energy output Uncertainty
GTI [kWh/m2]
PVOUT [kWh/kWp]
[kWh/m2]
[kWh/kWp][%] [±%]
Partial
[%]Cumulative [%]
Global irradiation - inclined plane (input) 1481 3.4 100.0 100.0
Terrain shading 1480 -1 -0.1 0.0 99.9 99.9
Angular reflectivity 1430 -50 -3.4 0.5 96.6 96.5
Snow 1415 -14 -1.0 1.0 99.0 95.5
Dirt, dust and soiling 1387 -28 -2.0 1.0 98.0 93.6
Conversion of irradiation to DC in the modules 1291 -96 -6.9 3.0 93.1 87.2
Electrical losses due inter-row shading 1253 -39 -3.0 1.5 97.0 84.6
Power tolerance at PV modules 1253 0 0.0 0.0 100.0 84.6
Mismatch and cabling in DC section 1240 -13 -1.0 0.7 99.0 83.7
Inverters (DC/AC conversion) 1205 -35 -2.8 1.0 97.2 81.4
Transformer and AC cabling losses 1187 -18 -1.5 0.5 98.5 80.1
Total system performance 1187 -294 -19.9 5.2 - 80.1
Technical availability 1175 -12 -1.0 0.7 99.0 79.3
Total system performance
considering technical availability1175 -306 -20.7 5.2 - 79.3
Energy conversion stage
and related losses
Energy loss Performance ratio

Energy Yield Assessment of 999.69 kWp photovoltaic power plant Hrnčiarska Ves, Slovakia. Sample Report No. 00-04/2013
© 2013 GeoModel Solar page 25 of 44
It is important to note that most of energy losses are variable in time; they are determined by a season of the year, time of a day, weather conditions, and other effects. Losses due to atmospheric pollution (aerosols) may have seasonal pattern, and in a short-term they may change rapidly, occasionally having strong impact. Soiling of modules due to permanent presence of dirt may affect the power plant performance in the longterm.
Attentive operation and maintenance of the power plant may partially prevent losses in Steps 4, 5, 9 and 12, as described in Chapter 3.3.
Energy Yield Assessment of 999.69 kWp photovoltaic power plant Hrnčiarska Ves, Slovakia. Sample Report No. 00-04/2013
© 2013 GeoModel Solar page 26 of 44
5.2 Theoretical PV power production – monthly statistics
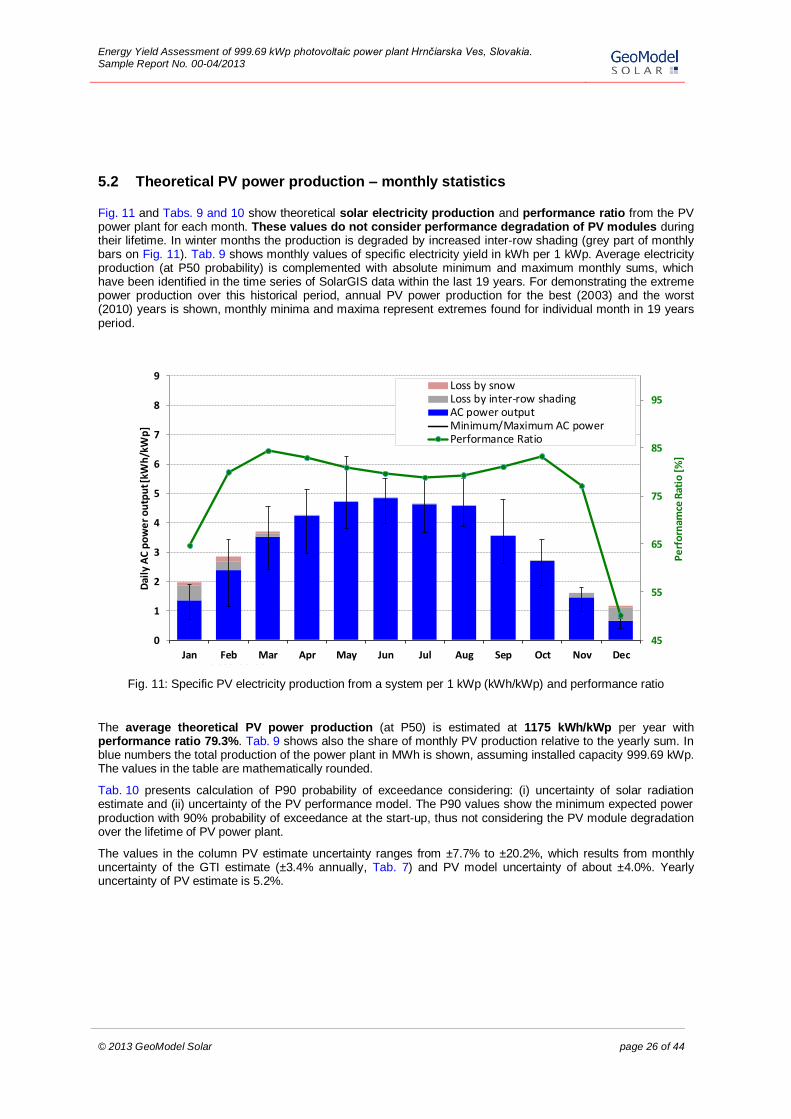
Fig. 11 and Tabs. 9 and 10 show theoretical solar electricity production and performance ratio from the PV power plant for each month. These values do not consider performance degradation of PV modules during their lifetime. In winter months the production is degraded by increased inter-row shading (grey part of monthly bars on Fig. 11). Tab. 9 shows monthly values of specific electricity yield in kWh per 1 kWp. Average electricity production (at P50 probability) is complemented with absolute minimum and maximum monthly sums, which have been identified in the time series of SolarGIS data within the last 19 years. For demonstrating the extreme power production over this historical period, annual PV power production for the best (2003) and the worst (2010) years is shown, monthly minima and maxima represent extremes found for individual month in 19 years period.
Fig. 11: Specific PV electricity production from a system per 1 kWp (kWh/kWp) and performance ratio
The average theoretical PV power production (at P50) is estimated at 1175 kWh/kWp per year with performance ratio 79.3%. Tab. 9 shows also the share of monthly PV production relative to the yearly sum. In blue numbers the total production of the power plant in MWh is shown, assuming installed capacity 999.69 kWp. The values in the table are mathematically rounded.
Tab. 10 presents calculation of P90 probability of exceedance considering: (i) uncertainty of solar radiation estimate and (ii) uncertainty of the PV performance model. The P90 values show the minimum expected power production with 90% probability of exceedance at the start-up, thus not considering the PV module degradation over the lifetime of PV power plant.
The values in the column PV estimate uncertainty ranges from ±7.7% to ±20.2%, which results from monthly uncertainty of the GTI estimate (±3.4% annually, Tab. 7) and PV model uncertainty of about ±4.0%. Yearly uncertainty of PV estimate is 5.2%.
DaysInMon
th
Specific PV out No
shading
Daily specific No
shading
Loss by inter-row
shadingAC power output Loss by snow PR Min
Jan 31 57.824 1.865 0.518 1.35 0.10 64.8 0.531
Feb 28.24 75.398 2.670 0.274 2.40 0.18 80.0 1.028
Mar 31 112.258 3.621 0.100 3.52 0.07 84.4 1.008
Apr 30 127.885 4.263 0.029 4.23 0.00 83.0 0.915
May 31 146.833 4.737 0.027 4.71 0.00 81.0 1.550
Jun 30 145.697 4.857 0.025 4.83 0.00 79.7 0.658
Jul 31 144.543 4.663 0.025 4.64 0.00 79.0 0.947
Aug 31 142.541 4.598 0.025 4.57 0.00 79.4 0.926
Sep 30 107.345 3.578 0.027 3.55 0.00 81.2 1.262
Oct 31 84.485 2.725 0.041 2.68 0.00 83.4 0.745
Nov 30 48.476 1.616 0.170 1.45 0.00 77.2 0.364
Dec 31 34.653 1.118 0.472 0.65 0.05 50.2 0.099
1227.937
40.760
0.033193496
45
55
65
75
85
95
0
1
2
3
4
5
6
7
8
9
Jan Feb Mar Apr May Jun Jul Aug Sep Oct Nov Dec
Pe
rfo
rnam
ce R
atio
[%
]
Dai
ly A
C p
ow
er
ou
tpu
t [kW
h/k
Wp
]
Loss by snowLoss by inter-row shadingAC power outputMinimum/Maximum AC powerPerformance Ratio
Energy Yield Assessment of 999.69 kWp photovoltaic power plant Hrnčiarska Ves, Slovakia. Sample Report No. 00-04/2013
© 2013 GeoModel Solar page 27 of 44
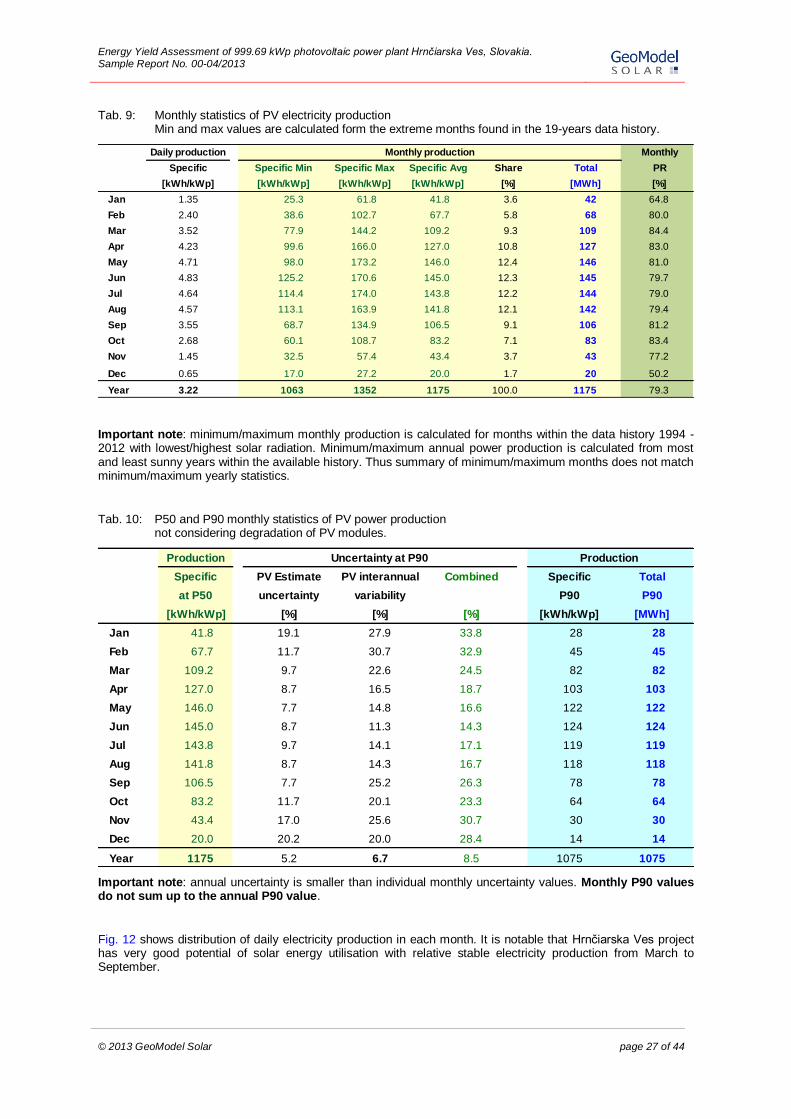
Tab. 9: Monthly statistics of PV electricity production Min and max values are calculated form the extreme months found in the 19-years data history.
Important note: minimum/maximum monthly production is calculated for months within the data history 1994 - 2012 with lowest/highest solar radiation. Minimum/maximum annual power production is calculated from most and least sunny years within the available history. Thus summary of minimum/maximum months does not match minimum/maximum yearly statistics.
Tab. 10: P50 and P90 monthly statistics of PV power production not considering degradation of PV modules.
Important note: annual uncertainty is smaller than individual monthly uncertainty values. Monthly P90 values do not sum up to the annual P90 value.
Fig. 12 shows distribution of daily electricity production in each month. It is notable that Hrnčiarska Ves project has very good potential of solar energy utilisation with relative stable electricity production from March to September.
Daily production Monthly
Specific Specific Min Specific Max Specific Avg Share Total PR
[kWh/kWp] [kWh/kWp] [kWh/kWp] [kWh/kWp] [%] [MWh] [%]
Jan 1.35 25.3 61.8 41.8 3.6 42 64.8
Feb 2.40 38.6 102.7 67.7 5.8 68 80.0
Mar 3.52 77.9 144.2 109.2 9.3 109 84.4
Apr 4.23 99.6 166.0 127.0 10.8 127 83.0
May 4.71 98.0 173.2 146.0 12.4 146 81.0
Jun 4.83 125.2 170.6 145.0 12.3 145 79.7
Jul 4.64 114.4 174.0 143.8 12.2 144 79.0
Aug 4.57 113.1 163.9 141.8 12.1 142 79.4
Sep 3.55 68.7 134.9 106.5 9.1 106 81.2
Oct 2.68 60.1 108.7 83.2 7.1 83 83.4
Nov 1.45 32.5 57.4 43.4 3.7 43 77.2
Dec 0.65 17.0 27.2 20.0 1.7 20 50.2
Year 3.22 1063 1352 1175 100.0 1175 79.3
Monthly production
Production
Specific PV Estimate PV interannual Combined Specific Total
at P50 uncertainty variability P90 P90
[kWh/kWp] [%] [%] [%] [kWh/kWp] [MWh]
Jan 41.8 19.1 27.9 33.8 28 28
Feb 67.7 11.7 30.7 32.9 45 45
Mar 109.2 9.7 22.6 24.5 82 82
Apr 127.0 8.7 16.5 18.7 103 103
May 146.0 7.7 14.8 16.6 122 122
Jun 145.0 8.7 11.3 14.3 124 124
Jul 143.8 9.7 14.1 17.1 119 119
Aug 141.8 8.7 14.3 16.7 118 118
Sep 106.5 7.7 25.2 26.3 78 78
Oct 83.2 11.7 20.1 23.3 64 64
Nov 43.4 17.0 25.6 30.7 30 30
Dec 20.0 20.2 20.0 28.4 14 14
Year 1175 5.2 6.7 8.5 1075 1075
Uncertainty at P90 Production
Energy Yield Assessment of 999.69 kWp photovoltaic power plant Hrnčiarska Ves, Slovakia. Sample Report No. 00-04/2013
© 2013 GeoModel Solar page 28 of 44
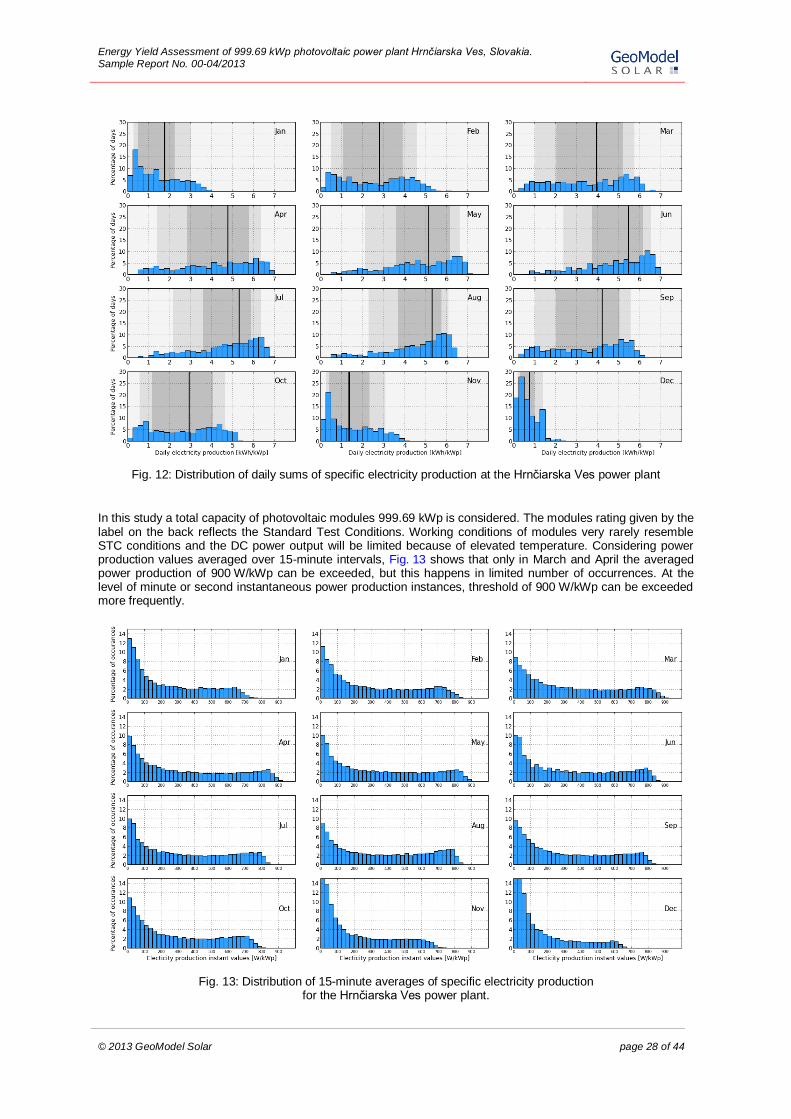
Fig. 12: Distribution of daily sums of specific electricity production at the Hrnčiarska Ves power plant
In this study a total capacity of photovoltaic modules 999.69 kWp is considered. The modules rating given by the label on the back reflects the Standard Test Conditions. Working conditions of modules very rarely resemble STC conditions and the DC power output will be limited because of elevated temperature. Considering power production values averaged over 15-minute intervals, Fig. 13 shows that only in March and April the averaged power production of 900 W/kWp can be exceeded, but this happens in limited number of occurrences. At the level of minute or second instantaneous power production instances, threshold of 900 W/kWp can be exceeded more frequently.
Fig. 13: Distribution of 15-minute averages of specific electricity production for the Hrnčiarska Ves power plant.
Energy Yield Assessment of 999.69 kWp photovoltaic power plant Hrnčiarska Ves, Slovakia. Sample Report No. 00-04/2013
© 2013 GeoModel Solar page 29 of 44
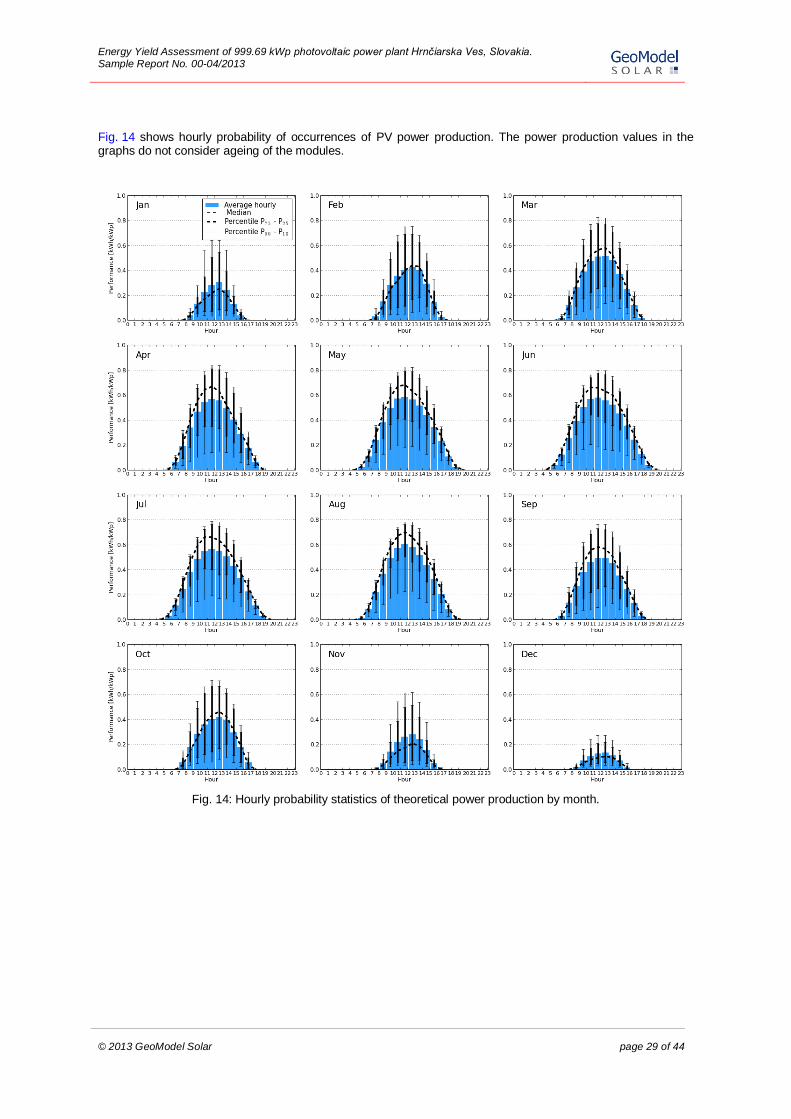
Fig. 14 shows hourly probability of occurrences of PV power production. The power production values in the graphs do not consider ageing of the modules.
Fig. 14: Hourly probability statistics of theoretical power production by month.
Energy Yield Assessment of 999.69 kWp photovoltaic power plant Hrnčiarska Ves, Slovakia. Sample Report No. 00-04/2013
© 2013 GeoModel Solar page 30 of 44
5.3 Interannual variability of PV power output
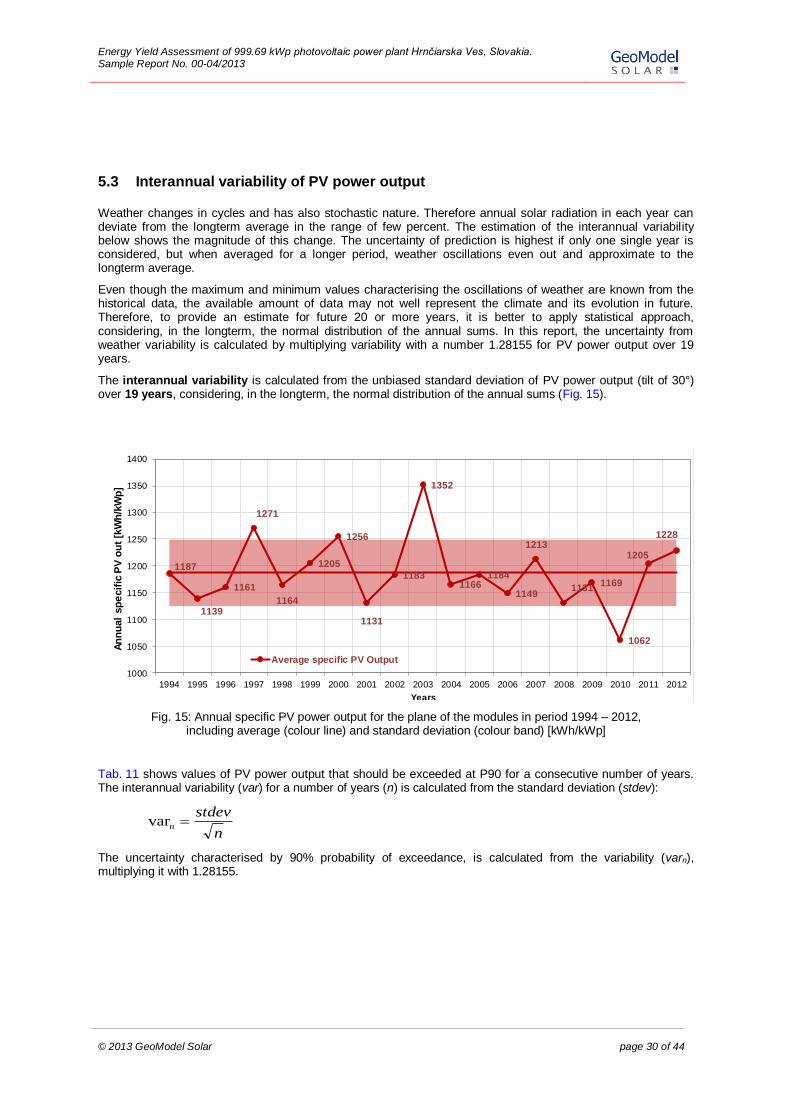
Weather changes in cycles and has also stochastic nature. Therefore annual solar radiation in each year can deviate from the longterm average in the range of few percent. The estimation of the interannual variability below shows the magnitude of this change. The uncertainty of prediction is highest if only one single year is considered, but when averaged for a longer period, weather oscillations even out and approximate to the longterm average.
Even though the maximum and minimum values characterising the oscillations of weather are known from the historical data, the available amount of data may not well represent the climate and its evolution in future. Therefore, to provide an estimate for future 20 or more years, it is better to apply statistical approach, considering, in the longterm, the normal distribution of the annual sums. In this report, the uncertainty from weather variability is calculated by multiplying variability with a number 1.28155 for PV power output over 19 years.
The interannual variability is calculated from the unbiased standard deviation of PV power output (tilt of 30°) over 19 years, considering, in the longterm, the normal distribution of the annual sums (Fig. 15).
Fig. 15: Annual specific PV power output for the plane of the modules in period 1994 – 2012, including average (colour line) and standard deviation (colour band) [kWh/kWp]
Tab. 11 shows values of PV power output that should be exceeded at P90 for a consecutive number of years. The interannual variability (var) for a number of years (n) is calculated from the standard deviation (stdev):
n
stdevn var
The uncertainty characterised by 90% probability of exceedance, is calculated from the variability (varn), multiplying it with 1.28155.
YearAverage specific PV OutputVP Out range upPV Out range dnYearly Average PV Out
1994 1187 1125 124 1187
1995 1139 1125 124 1187
1996 1161 1125 124 1187
1997 1271 1125 124 1187
1998 1164 1125 124 1187
1999 1205 1125 124 1187
2000 1256 1125 124 1187
2001 1131 1125 124 1187
2002 1183 1125 124 1187
2003 1352 1125 124 1187
2004 1166 1125 124 1187
2005 1184 1125 124 1187
2006 1149 1125 124 1187
2007 1213 1125 124 1187
2008 1131 1125 124 1187
2009 1169 1125 124 1187
2010 1062 1125 124 1187
1187
1139
1161
1271
1164
1205
1256
1131
1183
1352
11661184
1149
1213
11311169
1062
1205
1228
1000
1050
1100
1150
1200
1250
1300
1350
1400
1994 1995 1996 1997 1998 1999 2000 2001 2002 2003 2004 2005 2006 2007 2008 2009 2010 2011 2012
An
nu
al
sp
ecif
ic P
V o
ut
[kW
h/k
Wp
]
Years
Average specific PV Output
Energy Yield Assessment of 999.69 kWp photovoltaic power plant Hrnčiarska Ves, Slovakia. Sample Report No. 00-04/2013
© 2013 GeoModel Solar page 31 of 44
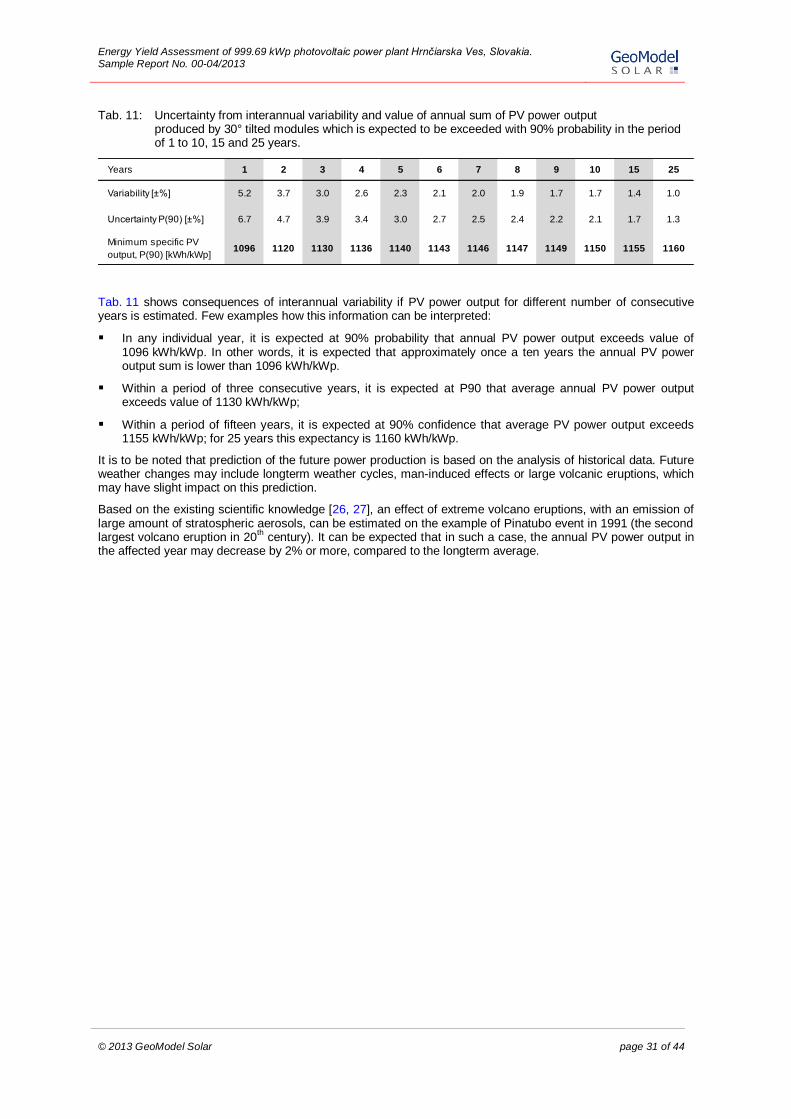
Tab. 11: Uncertainty from interannual variability and value of annual sum of PV power output produced by 30° tilted modules which is expected to be exceeded with 90% probability in the period of 1 to 10, 15 and 25 years.
Tab. 11 shows consequences of interannual variability if PV power output for different number of consecutive years is estimated. Few examples how this information can be interpreted:
In any individual year, it is expected at 90% probability that annual PV power output exceeds value of 1096 kWh/kWp. In other words, it is expected that approximately once a ten years the annual PV power output sum is lower than 1096 kWh/kWp.
Within a period of three consecutive years, it is expected at P90 that average annual PV power output exceeds value of 1130 kWh/kWp;
Within a period of fifteen years, it is expected at 90% confidence that average PV power output exceeds 1155 kWh/kWp; for 25 years this expectancy is 1160 kWh/kWp.
It is to be noted that prediction of the future power production is based on the analysis of historical data. Future weather changes may include longterm weather cycles, man-induced effects or large volcanic eruptions, which may have slight impact on this prediction.
Based on the existing scientific knowledge [26, 27], an effect of extreme volcano eruptions, with an emission of large amount of stratospheric aerosols, can be estimated on the example of Pinatubo event in 1991 (the second largest volcano eruption in 20
th century). It can be expected that in such a case, the annual PV power output in
the affected year may decrease by 2% or more, compared to the longterm average.
Years 1 2 3 4 5 6 7 8 9 10 15 25
Variability [±%] 5.2 3.7 3.0 2.6 2.3 2.1 2.0 1.9 1.7 1.7 1.4 1.0
Uncertainty P(90) [±%] 6.7 4.7 3.9 3.4 3.0 2.7 2.5 2.4 2.2 2.1 1.7 1.3
Minimum specific PV
output, P(90) [kWh/kWp]1096 1120 1130 1136 1140 1143 1146 1147 1149 1150 1155 1160
Energy Yield Assessment of 999.69 kWp photovoltaic power plant Hrnčiarska Ves, Slovakia. Sample Report No. 00-04/2013
© 2013 GeoModel Solar page 32 of 44
5.4 PV electricity production over 15 and 25 years
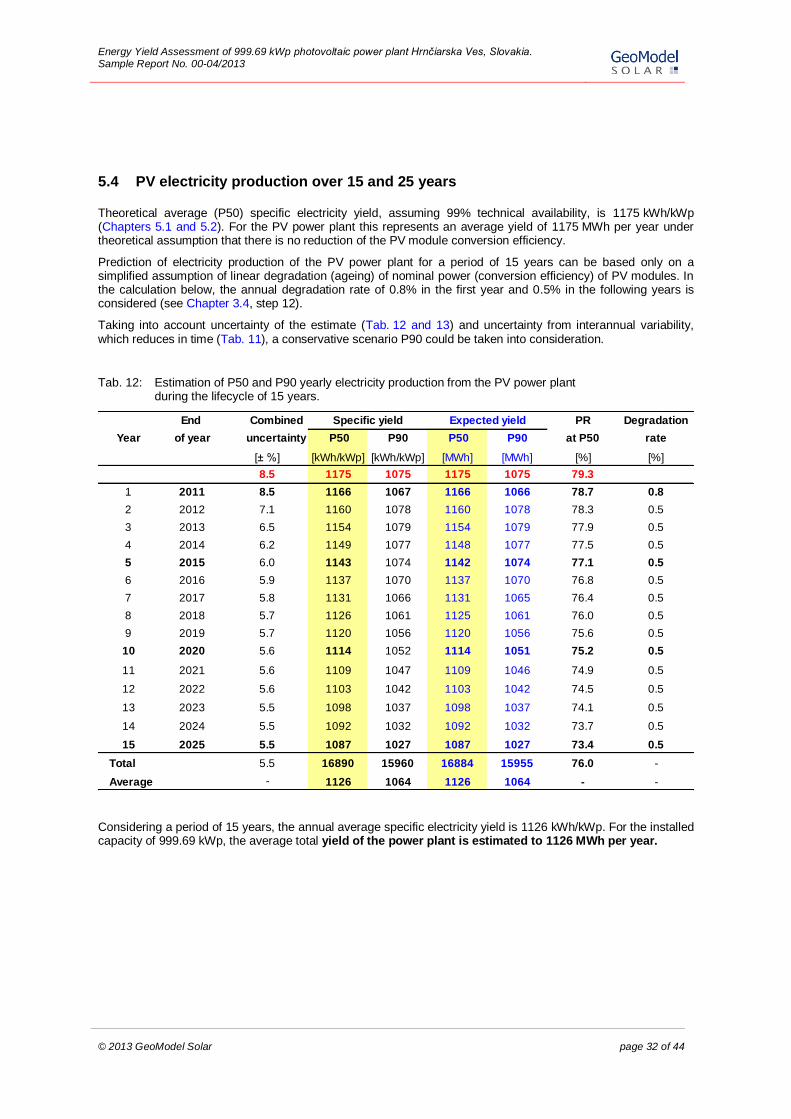
Theoretical average (P50) specific electricity yield, assuming 99% technical availability, is 1175 kWh/kWp (Chapters 5.1 and 5.2). For the PV power plant this represents an average yield of 1175 MWh per year under theoretical assumption that there is no reduction of the PV module conversion efficiency.
Prediction of electricity production of the PV power plant for a period of 15 years can be based only on a simplified assumption of linear degradation (ageing) of nominal power (conversion efficiency) of PV modules. In the calculation below, the annual degradation rate of 0.8% in the first year and 0.5% in the following years is considered (see Chapter 3.4, step 12).
Taking into account uncertainty of the estimate (Tab. 12 and 13) and uncertainty from interannual variability, which reduces in time (Tab. 11), a conservative scenario P90 could be taken into consideration.
Tab. 12: Estimation of P50 and P90 yearly electricity production from the PV power plant during the lifecycle of 15 years.
Considering a period of 15 years, the annual average specific electricity yield is 1126 kWh/kWp. For the installed capacity of 999.69 kWp, the average total yield of the power plant is estimated to 1126 MWh per year.
End Combined PR Degradation
Year of year uncertainty P50 P90 P50 P90 at P50 rate
[± %] [kWh/kWp] [kWh/kWp] [MWh] [MWh] [%] [%]
8.5 1175 1075 1175 1075 79.3
1 2011 8.5 1166 1067 1166 1066 78.7 0.8
2 2012 7.1 1160 1078 1160 1078 78.3 0.5
3 2013 6.5 1154 1079 1154 1079 77.9 0.5
4 2014 6.2 1149 1077 1148 1077 77.5 0.5
5 2015 6.0 1143 1074 1142 1074 77.1 0.5
6 2016 5.9 1137 1070 1137 1070 76.8 0.5
7 2017 5.8 1131 1066 1131 1065 76.4 0.5
8 2018 5.7 1126 1061 1125 1061 76.0 0.5
9 2019 5.7 1120 1056 1120 1056 75.6 0.5
10 2020 5.6 1114 1052 1114 1051 75.2 0.5
11 2021 5.6 1109 1047 1109 1046 74.9 0.5
12 2022 5.6 1103 1042 1103 1042 74.5 0.5
13 2023 5.5 1098 1037 1098 1037 74.1 0.5
14 2024 5.5 1092 1032 1092 1032 73.7 0.5
15 2025 5.5 1087 1027 1087 1027 73.4 0.5
Total 5.5 16890 15960 16884 15955 76.0 -
Average - 1126 1064 1126 1064 - -
Specific yield Expected yield
Energy Yield Assessment of 999.69 kWp photovoltaic power plant Hrnčiarska Ves, Slovakia. Sample Report No. 00-04/2013
© 2013 GeoModel Solar page 33 of 44
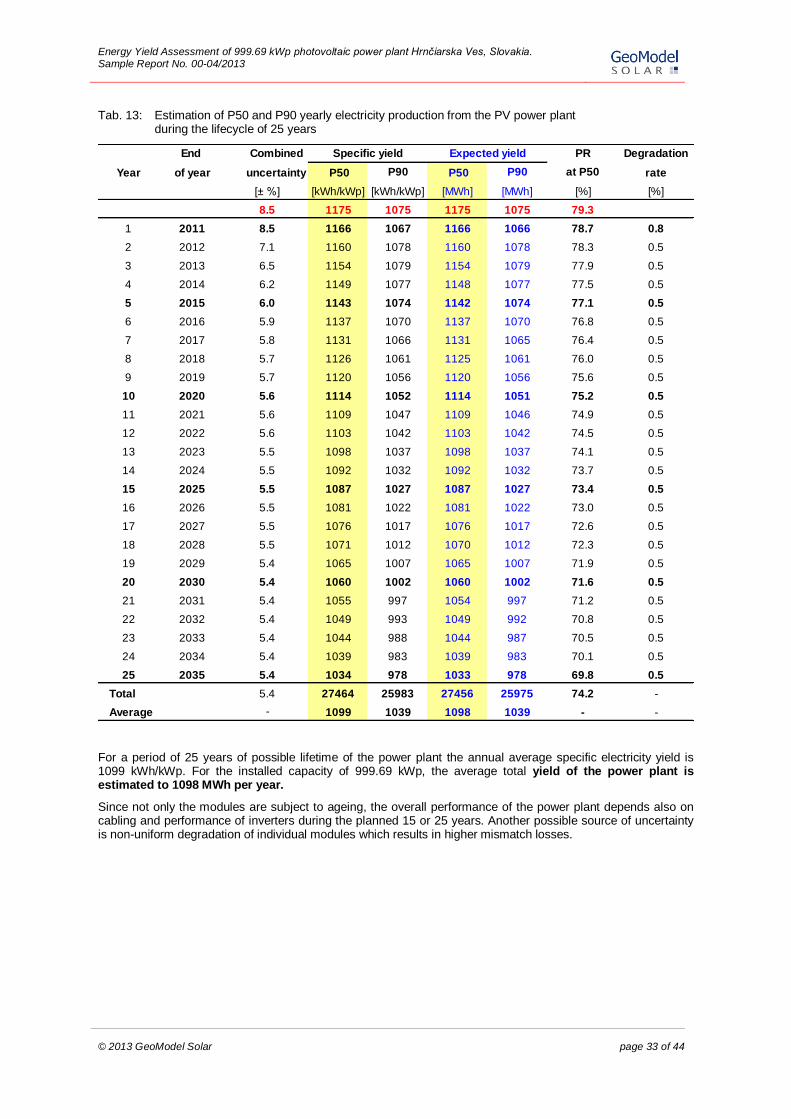
Tab. 13: Estimation of P50 and P90 yearly electricity production from the PV power plant during the lifecycle of 25 years
For a period of 25 years of possible lifetime of the power plant the annual average specific electricity yield is 1099 kWh/kWp. For the installed capacity of 999.69 kWp, the average total yield of the power plant is estimated to 1098 MWh per year.
Since not only the modules are subject to ageing, the overall performance of the power plant depends also on cabling and performance of inverters during the planned 15 or 25 years. Another possible source of uncertainty is non-uniform degradation of individual modules which results in higher mismatch losses.
End Combined PR Degradation
Year of year uncertainty P50 P90 P50 P90 at P50 rate
[± %] [kWh/kWp] [kWh/kWp] [MWh] [MWh] [%] [%]
8.5 1175 1075 1175 1075 79.3
1 2011 8.5 1166 1067 1166 1066 78.7 0.8
2 2012 7.1 1160 1078 1160 1078 78.3 0.5
3 2013 6.5 1154 1079 1154 1079 77.9 0.5
4 2014 6.2 1149 1077 1148 1077 77.5 0.5
5 2015 6.0 1143 1074 1142 1074 77.1 0.5
6 2016 5.9 1137 1070 1137 1070 76.8 0.5
7 2017 5.8 1131 1066 1131 1065 76.4 0.5
8 2018 5.7 1126 1061 1125 1061 76.0 0.5
9 2019 5.7 1120 1056 1120 1056 75.6 0.5
10 2020 5.6 1114 1052 1114 1051 75.2 0.5
11 2021 5.6 1109 1047 1109 1046 74.9 0.5
12 2022 5.6 1103 1042 1103 1042 74.5 0.5
13 2023 5.5 1098 1037 1098 1037 74.1 0.5
14 2024 5.5 1092 1032 1092 1032 73.7 0.5
15 2025 5.5 1087 1027 1087 1027 73.4 0.5
16 2026 5.5 1081 1022 1081 1022 73.0 0.5
17 2027 5.5 1076 1017 1076 1017 72.6 0.5
18 2028 5.5 1071 1012 1070 1012 72.3 0.5
19 2029 5.4 1065 1007 1065 1007 71.9 0.5
20 2030 5.4 1060 1002 1060 1002 71.6 0.5
21 2031 5.4 1055 997 1054 997 71.2 0.5
22 2032 5.4 1049 993 1049 992 70.8 0.5
23 2033 5.4 1044 988 1044 987 70.5 0.5
24 2034 5.4 1039 983 1039 983 70.1 0.5
25 2035 5.4 1034 978 1033 978 69.8 0.5
Total 5.4 27464 25983 27456 25975 74.2 -
Average - 1099 1039 1098 1039 - -
Specific yield Expected yield
Energy Yield Assessment of 999.69 kWp photovoltaic power plant Hrnčiarska Ves, Slovakia. Sample Report No. 00-04/2013
© 2013 GeoModel Solar page 34 of 44
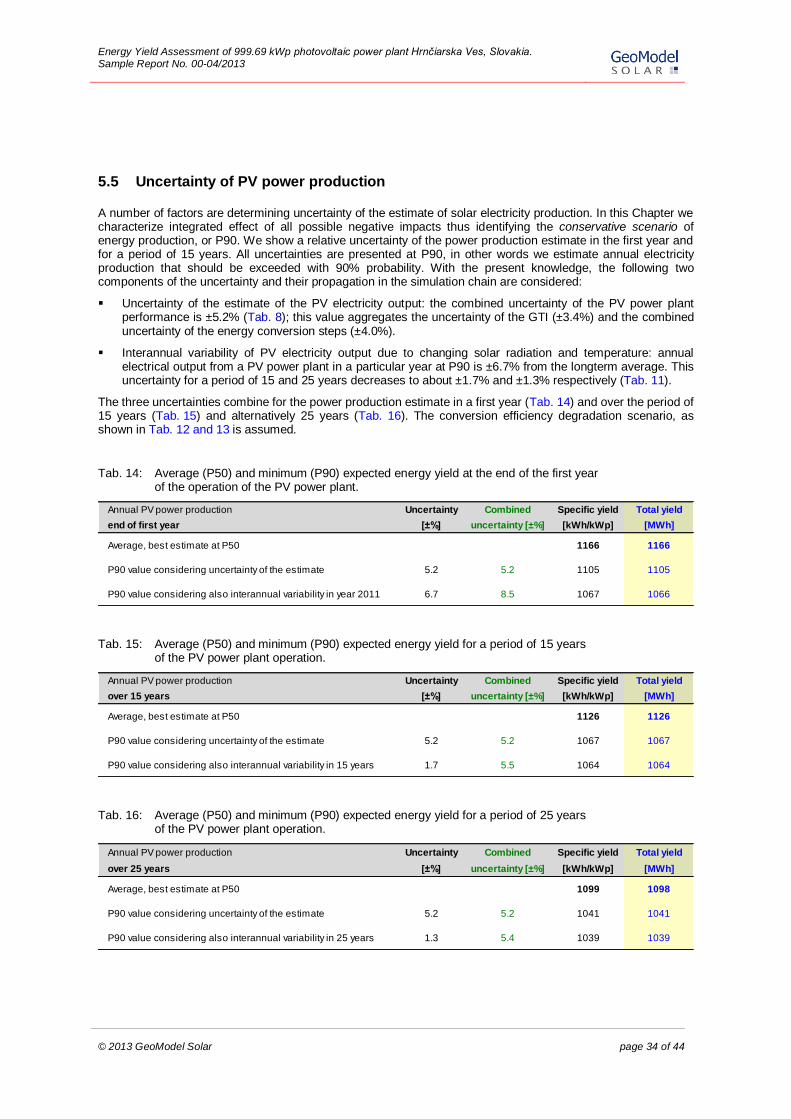
5.5 Uncertainty of PV power production
A number of factors are determining uncertainty of the estimate of solar electricity production. In this Chapter we characterize integrated effect of all possible negative impacts thus identifying the conservative scenario of energy production, or P90. We show a relative uncertainty of the power production estimate in the first year and for a period of 15 years. All uncertainties are presented at P90, in other words we estimate annual electricity production that should be exceeded with 90% probability. With the present knowledge, the following two components of the uncertainty and their propagation in the simulation chain are considered:
Uncertainty of the estimate of the PV electricity output: the combined uncertainty of the PV power plant performance is ±5.2% (Tab. 8); this value aggregates the uncertainty of the GTI (±3.4%) and the combined uncertainty of the energy conversion steps (±4.0%).
Interannual variability of PV electricity output due to changing solar radiation and temperature: annual electrical output from a PV power plant in a particular year at P90 is ±6.7% from the longterm average. This uncertainty for a period of 15 and 25 years decreases to about ±1.7% and ±1.3% respectively (Tab. 11).
The three uncertainties combine for the power production estimate in a first year (Tab. 14) and over the period of 15 years (Tab. 15) and alternatively 25 years (Tab. 16). The conversion efficiency degradation scenario, as shown in Tab. 12 and 13 is assumed.
Tab. 14: Average (P50) and minimum (P90) expected energy yield at the end of the first year of the operation of the PV power plant.
Tab. 15: Average (P50) and minimum (P90) expected energy yield for a period of 15 years of the PV power plant operation.
Tab. 16: Average (P50) and minimum (P90) expected energy yield for a period of 25 years of the PV power plant operation.
Annual PV power production Uncertainty Combined Specific yield Total yield
end of first year [±%] uncertainty [±%] [kWh/kWp] [MWh]
Average, best estimate at P50 1166 1166
P90 value considering uncertainty of the estimate 5.2 5.2 1105 1105
P90 value considering also interannual variability in year 2011 6.7 8.5 1067 1066
Annual PV power production Uncertainty Combined Specific yield Total yield
over 15 years [±%] uncertainty [±%] [kWh/kWp] [MWh]
Average, best estimate at P50 1126 1126
P90 value considering uncertainty of the estimate 5.2 5.2 1067 1067
P90 value considering also interannual variability in 15 years 1.7 5.5 1064 1064
Annual PV power production Uncertainty Combined Specific yield Total yield
over 25 years [±%] uncertainty [±%] [kWh/kWp] [MWh]
Average, best estimate at P50 1099 1098
P90 value considering uncertainty of the estimate 5.2 5.2 1041 1041
P90 value considering also interannual variability in 25 years 1.3 5.4 1039 1039

Energy Yield Assessment of 999.69 kWp photovoltaic power plant Hrnčiarska Ves, Slovakia. Sample Report No. 00-04/2013
© 2013 GeoModel Solar page 35 of 44
At the end of the first year of the PV power plant operation, the average specific PV power production is estimated at 1166 kWh/kWp. Assuming all combined uncertainties at P90, a minimum specific production 1067 kWh/kWp can be expected with 90% confidence.
Similarly, assuming a period of 15 years, the average specific PV production is 1126 kWh/kWp. For combined P90 uncertainties, it can be expected that minimum expected specific production of 1064 kWh/kWp is reached per year.
Assuming alternative period of 25 years of PV plant operation, the average specific PV production is 1099 kWh/kWp. For combined P90 uncertainties, it can be expected that minimum expected specific production of 1039 kWh/kWp is reached per year.
Weather variability is estimated from the analysis of historical data, and this study does not take into account any prediction of man-induced climate change or extreme natural events.

Energy Yield Assessment of 999.69 kWp photovoltaic power plant Hrnčiarska Ves, Slovakia. Sample Report No. 00-04/2013
© 2013 GeoModel Solar page 36 of 44
6 CONCLUSIONS
The behaviour of all components of the PV power plant, as well as natural and accelerated changes in their performance can only be better understood by implementation of the active monitoring and regular performance assessment. This service is based on the numerical analysis of the monitored production data with simulations of the expected and reference performance numbers based on real-time satellite and meteorological observations. This approach ensures sustainable bankability of the information, enables fast identification of failures, and supports operation, control, and maintenance.
Re-analysis of both monitored and simulated data time series over longer time intervals (e.g. one year) provides means for an improved understanding of the degradation effects and in-depth appraisal of the technology performance and maintenance routines.
Power plant is not well optimised regarding minimising inter-row shading losses with relative row spacing of approx. 2.2. Modules are mounted in landscape position what help in minimising impact of shading of bottom rows of modules. In ideal case all bottom shaded modules should be connected together independently from the upper modules.

Energy Yield Assessment of 999.69 kWp photovoltaic power plant Hrnčiarska Ves, Slovakia. Sample Report No. 00-04/2013
© 2013 GeoModel Solar page 37 of 44
7 ACRONYMS
GHI Global Horizontal Irradiation, if integrated solar energy is assumed. Global Horizontal Irradiance, if solar power values are discussed.
GTI Global Tilted Irradiation – irradiation impinging to the plane of photovoltaic modules defined by the tilt and azimuth.
DNI Direct Normal Irradiation, if integrated solar energy is assumed. Direct Normal Irradiance, if solar power values are discussed.
DIF Diffuse Horizontal Irradiation, if integrated solar energy is assumed. Diffuse Horizontal Irradiance, if solar power values are discussed
TEMP Air Temperature at 2 metres
MACC Monitoring Atmospheric Composition and Climate – meteorological model operated by the European service ECMWF (European Centre for Medium-Range Weather Forecasts)
CFSR Climate Forecast System Reanalysis. The meteorological model operated by the US service NOAA (National Oceanic and Atmospheric Administration)
GFS Global Forecast System. The meteorological model operated by the US service NOAA (National Oceanic and Atmospheric Administration)
Meteosat MSG Meteosat Second Generation satellite
Meteosat MFG Meteosat satellite First Generation data

Energy Yield Assessment of 999.69 kWp photovoltaic power plant Hrnčiarska Ves, Slovakia. Sample Report No. 00-04/2013
© 2013 GeoModel Solar page 38 of 44
8 GLOSSARY
Interannual variability Is derived from 19 years of data (1994 to 2012), and it is calculated from the unbiased standard deviation of monthly and yearly summaries of DNI and GHI, multiplied by number 1.28155. Thus interannual variability represents a range of values at 80% probability of occurrence. The lower boundary of interannual variability represents 90% probability of exceedance, and it is also used for calculating the P90 value. Monthly values of interannual variability indicate year-by-year instability of solar radiation for each month. The yearly values give an idea of weather fluctuation when comparing yearly DNI or GHI sums.
P50 value Best estimate or median value. For annual and monthly solar irradiation summaries it is close to average, since multiyear distribution of solar radiation resembles closely normal distribution.
P90 value Conservative estimate, assuming 90% probability of exceedance (with the 90% probability the value should be exceeded). When assuming normal distribution, the P90 value is also a lower boundary of the 80% probability of occurrence. P90 value can be calculated by subtracting uncertainty from the P50 value.
Solar irradiance Solar power (instantaneous energy) falling on a unit area per unit time [W/m2]. Solar
resource or solar radiation is used when considering both irradiance and irradiation.
Solar irradiation Amount of solar energy falling on a unit area over a stated time interval [Wh/m2].
Uncertainty Is a non-negative parameter characterizing the dispersion of the values attributed to an estimated irradiance/irradiation values. In this report, uncertainty assessment of the solar resource estimate is based on a detailed understanding of the achievable accuracy of the solar radiation model and its data inputs (satellite, atmospheric and other data), which is confronted by an extensive data validation experience. The second important source of uncertainty information is the understanding of quality issues of ground measuring instruments and methods, as well as the methods correlating the ground-measured and satellite-based data, not used in this report.
In this report, the uncertainty assumes 80% probability of occurrence of values. Thus, the lower boundary of uncertainty represents 90% probability of exceedance, and it is also used for calculating the P90 value.
Energy Yield Assessment of 999.69 kWp photovoltaic power plant Hrnčiarska Ves, Slovakia. Sample Report No. 00-04/2013
© 2013 GeoModel Solar page 39 of 44
9 LIST OF FIGURES
Fig. 1: Detailed geographical position of the site ............................................................................................... 5
Fig. 2: Geographical position of the site in the region ........................................................................................ 6
Fig. 3: Position of the site in the context of Global Horizontal Irradiation of Slovakia........................................... 6
Fig. 4: Astronomical and geographical situation ................................................................................................ 7
Fig. 5: Layout of the power plant. ..................................................................................................................... 9
Fig. 6: Electrical scheme of one part of the power plant .................................................................................... 9
Fig. 7: Inter-row shading - description of terminology ...................................................................................... 17
Fig. 8: Patterns of electrical losses in PV modules mounted on a table. ........................................................... 17
Fig. 9: Global tilted irradiation received by PV modules inclined at 30° - monthly values .................................. 21
Fig. 10: Potential loss of PV electricity ............................................................................................................ 23
Fig. 11: Specific PV electricity production from a system per 1 kWp (kWh/kWp) and performance ratio ............ 26
Fig. 12: Distribution of daily sums of specific electricity production at the Hrnčiarska Ves power plant .............. 28
Fig. 13: Distribution of 15-minute averages of specific electricity production .................................................... 28
Fig. 14: Hourly probability statistics of theoretical power production by month.................................................. 29
Fig. 15: Annual specific PV power output for the plane of the modules in period 1994 – 2012, ......................... 30
Energy Yield Assessment of 999.69 kWp photovoltaic power plant Hrnčiarska Ves, Slovakia. Sample Report No. 00-04/2013
© 2013 GeoModel Solar page 40 of 44
10 LIST OF TABLES
Tab. 1: Global horizontal irradiance – quality indicators for selected validation sites. ................................... 11
Tab. 2: Comparison of recorded and simulated air temperature at 2 meters for the closest meteo stations... 12
Tab. 3: Energy losses in the simulation of the expected and minimum power production ............................. 13
Tab. 4: Air temperature, global and diffuse horizontal irradiation - monthly values ....................................... 19
Tab. 5: Uncertainty of the estimate of longterm yearly average of Global Horizontal Irradiation: ................... 20
Tab. 6: Global tilted irradiation received by PV modules inclined towards South at 30° ................................ 21
Tab. 7: Global tilted irradiation received by PV modules inclined at 30°....................................................... 22
Tab. 8: Conversion stages, energy losses, and performance ratio at the level of the PV system. ................. 24
Tab. 9: Monthly statistics of PV electricity production ................................................................................. 27
Tab. 10: P50 and P90 monthly statistics of PV power production ............................................................ 27
Tab. 11: Uncertainty from interannual variability and value of annual sum of PV power output ................. 31
Tab. 12: Estimation of P50 and P90 yearly electricity production from the PV power plant ....................... 32
Tab. 13: Estimation of P50 and P90 yearly electricity production from the PV power plant ....................... 33
Tab. 14: Average (P50) and minimum (P90) expected energy yield at the end of the first year ................. 34
Tab. 15: Average (P50) and minimum (P90) expected energy yield for a period of 15 years .................... 34
Tab. 16: Average (P50) and minimum (P90) expected energy yield for a period of 25 years .................... 34
Energy Yield Assessment of 999.69 kWp photovoltaic power plant Hrnčiarska Ves, Slovakia. Sample Report No. 00-04/2013
© 2013 GeoModel Solar page 41 of 44
11 LIST OF REFERENCES
[1] Cebecauer T., Šúri M., Perez R., High performance MSG satellite model for operational solar energy applications. ASES National Solar Conference, May 2010, Phoenix, USA.
[2] Šúri M., Cebecauer T., Perez P., Quality procedures of SolarGIS for provision site-specific solar resource information. Conference SolarPACES 2010, September 2010, Perpignan, France.
[3] Cebecauer T., Šúri M., Accuracy improvements of satellite-derived solar resource based on GEMS re-analysis aerosols. Conference SolarPACES 2010, September 2010, Perpignan, France.
[4] Cebecauer T., Šúri M., Guyemard CH. Uncertainty Sources in Satellite-derived Direct Normal Irradiance: How can prediction accuracy be improved globally? Proceedings of the SolarPACES 2011 Conference, September 2011, Granada, Spain.
[5] Šúri M., Cebecauer T., Requirements and standards for bankable DNI data products in CSP projects, Proceedings of the SolarPACES 2011 Conference, September 2011, Granada, Spain.
[6] Ineichen P., A broadband simplified version of the Solis clear sky model. Solar Energy, 82, 8, 758-762, 2008.
[7] Morcrette J., Boucher O., Jones L., Salmond D., Bechtold P., Beljaars A., Benedetti A., Bonet A., Kaiser J.W., Razinger M., Schulz M., Serrar S., Simmons A.J., Sofiev M., Suttie M., Tompkins A., Uncht A., GEMS-AER team. Aerosol analysis and forecast in the ECMWF Integrated Forecast System. Part I: Forward modelling. Journal of Geophysical Research, 114, 2009.
[8] Cebecauer T., Perez R., Šúri M., Comparing performance of SolarGIS and SUNY satellite models using monthly and daily aerosol data. Proceedings of the ISES Solar World Congress 2011, September 2011, Kassel, Germany.
[9] Perez R., Ineichen P., Maxwell E., Seals R. and Zelenka A., Dynamic global-to-direct irradiance conversion models. ASHRAE Transactions-Research Series, pp. 354-369, 1992.
[10] Perez, R., Seals R., Ineichen P., Stewart R., Menicucci D.. A new simplified version of the Perez diffuse irradiance model for tilted surfaces. Solar Energy, 39, 221-232, 1987.
[11] Ineichen P. Five satellite products deriving beam and global irradiance validation on data from 23 ground stations, university of Geneva/IEA SHC Task 36, 2011: http://www.unige.ch/cuepe/pub/ineichen_valid-sat-2011-report.pdf http://www.unige.ch/cuepe/pub/ineichen_valid-sat-2011-annexe.pdf
[12] Ruiz-Arias J. A., Cebecauer T., Tovar-Pescador J., Šúri M., Spatial disaggregation of satellite-derived irradiance using a high-resolution digital elevation model. Solar Energy, 84, 1644-1657, 2010.
[13] Martin N., Ruiz J.M. Calculation of the PV modules angular losses under field conditions by means of an analytical model. Solar Energy Material and Solar Cells, 70, 25–38, 2001.
[14] King D.L., Boyson W.E. and Kratochvil J.A., Photovoltaic array performance model, SAND2004-3535, Sandia National Laboratories, 2004.
[15] Huld T., Šúri M., Dunlop E.D., Geographical variation of the conversion efficiency of crystalline silicon photovoltaic modules in Europe. Progress in Photovoltaics: Research and Applications, 16, 595-607, 2008.
[16] Huld T., Gottschalg R., Beyer H. G., Topic M., Mapping the performance of PV modules, effects of module type and data averaging, Solar Energy, 84, 2, 324-338, 2010.
[17] Skoczek A., Virtuani A., Cebecauer T., Chianese D., 2011. Energy Yield Prediction of Amorphous Silicon PV Modules Using Full Time Data Series of Irradiance And Temperature for Different Geographical Locations. 26th European Photovoltaics Solar Energy Conference, September 2011, Hamburg, Germany.
[18] Huld T., Friesen G., Skoczek A., Kenny R.P., Sample T., Field M., Dunlop E.D., 2011. A power-rating model for crystalline silicon PV modules. Solar Energy Materials and Solar Cells, 95, 12, 3359-3369.
[19] Skoczek A., Sample T., Dunlop E. D., The results of performance measurements of field-aged crystalline silicon photovoltaic modules, Progress in Photovoltaics: Research and Applications, 17, 227-240, 2009.

Energy Yield Assessment of 999.69 kWp photovoltaic power plant Hrnčiarska Ves, Slovakia. Sample Report No. 00-04/2013
© 2013 GeoModel Solar page 42 of 44
[20] Quaschning V. and Hanitsch R., Increased energy yield of 50% at flat roof and field installations with optimized module structures, 2nd World Conference and Exhibition on Photovoltaic Solar Energy Conversion Vienna Austria 6-10 July 1998
[21] Meteonorm handbook, Version 6.12, Part II: Theory. Meteotest, 2010
[22] Surface meteorology and Solar Energy (SSE) release 6.0, Methodology, Version 2.4, 2009.
[23] Šúri M., Remund J., Cebecauer T., Dumortier D., Wald L., Huld T., Blanc T., 2008. First steps in the cross-comparison of solar resource spatial products in Europe. Proceeding of the EUROSUN 2008, 1
st International Conference on Solar Heating, Cooling and Buildings, 7-10 October 2008, Lisbon, Portugal
[24] Šúri M., Huld T., Cebecauer T., Dunlop E.D., 2008. Geographic Aspects of Photovoltaics in Europe: Contribution of the PVGIS Web Site. IEEE Journal of Selected Topics in Applied Earth Observations and Remote Sensing, 1, 1, 34-41.
[25] Huld T., Müller R, Gambardella, A., 2012. New solar radiation database for estimating PV performance in Europe and Africa. Solar Energy, 86, 1803-1815.
[26] Lohmann S., Schillings C., Mayer B., Meyer R., Longterm variability of solar direct and global radiation derived from ISCCP data and comparison with reanalysis data, Solar Energy, 80, 11, 1390-1401, 2006.
[27] Gueymard C., Solar resource e assessment for CSP and CPV. Leonardo Energy webinar, 2010. http://www.leonardo-energy.org/webfm_send/4601
[28] The German Energy Society, 2008: Planning and Installing Photovoltaic Systems. A guide for installers, architects and engineers. Second edition. Earthscan, London, Sterling VA.

Energy Yield Assessment of 999.69 kWp photovoltaic power plant Hrnčiarska Ves, Slovakia. Sample Report No. 00-04/2013
© 2013 GeoModel Solar page 43 of 44
12 SUPPORT INFORMATION
12.1 Background on GeoModel Solar
Primary business of GeoModel Solar is in providing support to the site qualification, planning, financing and operation of solar energy systems. We are committed to increase efficiency and reliability of solar technology by expert consultancy and access to our databases and customer-oriented services.
The Company builds on 24 years of expertise in geoinformatics and environmental modelling, and 13 years in solar energy and photovoltaics. We strive for development and operation of new generation high-resolution quality-assessed global databases with focus on solar resource and energy-related weather parameters. We are developing simulation, management and control tools, map products, and services for fast access to high quality information needed for system planning, performance assessment, forecasting and management of distributed power generation.
GeoModel Solar operates a set of online services, integrated within SolarGIS® information system
http://solargis.info, which includes data, maps, software, and geoinformation services for solar energy.
Members of the team have long-term experience in R&D and are active in the following international initiatives:
International Energy Agency, Solar Heating and Cooling Program, Task 46 Solar Solar Resource Assessment and Forecasting,
EU COST Action ES 1002: Weather Intelligence for Renewable Energies (WIRE).
12.2 Legal information
Considering the nature of climate fluctuations, interannual and longterm changes, as well as the uncertainty of measurements and calculations, GeoModel Solar cannot take guarantee of the accuracy of estimates. GeoModel Solar has done maximum possible for the assessment of climate conditions based on the best available data, software and knowledge. SolarGIS
® is the registered trademark of GeoModel Solar. Other brand
names and trademarks that may appear in this study are the ownership of their respective owners.
© 2013 GeoModel Solar. All rights reserved.
GeoModel Solar is ISO 9001:2008 certified company.
Authors: Ing. Branislav Schnierer, Artur Skoczek, PhD
Project manager: Naďa Šúriová, MSc
Approved by: Marcel Šúri, PhD


![Boston, MA 02]09 (0t7) 74.2-1580 · Boston, MA 02]09 (0t7) 74.2-1580 PB8 ~o 1 ? 63~. ALTERNATIVE ENVIRONMENTAL MEDIATION STRUCTURES WITHIN THE FEDERAL GOVERNMENT FINAL ... Appendix](https://img.pdfslide.us/doc/110x75/5b7834b97f8b9ade6f8e94c1/boston-ma-0209-0t7-742-1580-boston-ma-0209-0t7-742-1580-pb8-o-1-.jpg)