Embed Size (px)
Citation preview
2016 U.S. Pharmacy Compensation SurveyDATA EFFECTIVE JANUARY 1, 2016
SAMPLE
The intent of this report is to provide you with general information regarding current practices within the employee compensation and benefits environment, obtained via a survey process. The data does
not constitute recommendations or other advice regarding employee benefit programs, and the user is in no way obligated to accept or implement any information for use within their organization(s). The
decision to utilize any information provided rests solely with the user, and application of the data contained does not guarantee compliance with applicable laws or regulations regarding employee
benefits. Information provided in this report, even if generally applicable, cannot possibly take into account all of the various factors that may affect a specific individual or situation. Additionally,
practices described within the report are not intended to provide legal advice, and should not be construed as such.
The report and its content do not constitute accounting, consulting, investment, insurance, legal, tax or any other type of professional advice, and should be used only in conjunction with the services of a
Gallagher consultant and any other appropriate professional advisors who have full knowledge of the user’s situation. Gallagher does not represent or warrant that the content will be correct, accurate,
timely or otherwise reliable. Gallagher may make changes to the content at any time. Gallagher assumes no responsibility of any kind, oral or written, express or implied, including but not limited to
fitness for a particular purpose, accuracy, omissions and completeness of information. Gallagher shall in no event whatsoever be liable to licensee or any other party for any indirect, special,
consequential, incidental or similar damages, including damages for lost data or economic loss, even if Gallagher has been notified of the possibility of such loss. For the purposes of this section the term
“Gallagher” shall be construed so as to include Arthur J. Gallagher & Co. and all of its affiliates.
Copyright 2016 by Arthur J. Gallagher & Co.
All rights reserved. No part of this report, including the text, data, graphics, interior design and cover design may be reproduced or transmitted in any form or by any means without the prior written
permission of the publisher.
© 2016 GALLAGHER BENEFIT SERVICES, INC.
SAMPLE
Gallagher Surveys • Two Liberty Square • Boston, MA 02109617-227-1642
www.gallaghersurveys.com
2016U.S. Pharmacy Staff
Compensation Survey
Effective Date: January 1, 2016
Published: June 2016
SAMPLE
2016 U.S. Pharmacy Staff Compensation Survey
Confidentiality Guarantee
Gallagher Surveys ensures that all organization-specific data collected from survey participants remains strictly confidential. Individual organization namesappear in the participant lists but no correlation to their data will be provided. This is also the case when organizational data is used in other custom survey reports.
Copyright Statement
The design and content of this survey report are the property of Gallagher Surveys and its affiliates and are protected under copyright laws. Survey information shall not be communicated to any other organizations, media or individuals not directly employed by the organization or affiliate organization. Any reproduction of the information requires express written authorization from Gallagher Surveys.
© 2016 U.S. Pharmacy Staff Compensation Survey
SAMPLE
2016 U.S. Pharmacy Staff Compensation Survey
Compensation Consulting & Surveys
At Gallagher Surveys, we recognize that your organization's compensation strategy must align with your unique business priorities. Our consultants' broad range of experience and know-how, backed by our proprietary research, allows us to develop creative compensation solutions that best link pay strategy to business objectives. Our goal is to enable clients to manage talent and improve results by attracting, motivating and retaining qualified employees. Serving over 1600 organizations throughout the United States, our consultants focus on building relationships and helping clients meet immediate and long-range business needs. We provide competitive market analysis, program design and implementation through a complete menu of compensation and market research services. Compensation consulting services include:
Compensation Consulting Services
• Development of compensation strategy and philosophy• Executive and Board of Directors compensation• Annual and long-term incentive plan design• Base pay program design and implementation• Market pricing and point factor job evaluation• Compensation programs compliance• Compensation programs for employee owned (ESOP) entities• Sales compensation• Compensation program outsourcing
Annually Published Surveys
• Aviation Compensation Survey• Distribution Center Compensation Survey• Healthcare Compensation Survey• Information Technology Compensation Survey• PSI, Twin Cities and Upper Midwest Compensation Survey• Retail Grocer Compensation Survey• U.S. Pharmacy Staff Compensation Survey
For more information, please call our compensation and surveys department at 617-227-1642 or email at [email protected].
SAMPLE
2016 U.S. Pharmacy Staff Compensation Survey
Survey Definitions
Annual Bonus/Short-Term IncentiveCash bonus and/or short-term incentives (STI) paid for the most recently completed fiscal year. Payments include amounts that are generally taxable in the year distributed. Payments may be from multiple plans including, but not limited to: "formula" incentive plans, "spot" or discretionary bonus plans, monetary award programs and cash profit sharing. Does not include payouts that will be deferred, such as profit sharing payments deposited into 401(k) or other deferred retirement accounts. Where an incumbent did not receive a full bonus/incentive payment due to a partial year in the position, an annualized amount is reported rather than the actual. Does not include hiring/signing or retention bonuses. Zeros are not reported.
Criteria for Job MatchingA good match occurs when 75% or more of the job duties are comparable. Criteria were provided to facilitate better job matching. These criteria are: level of work, minimum qualifications, and typical duties.
ExemptRefers to jobs, and the incumbents in those jobs, that are excluded from the overtime provisions of the Fair Labor Standards Act (FLSA), which requires payment of the minimum wage and at least time and one-half for all overtime hours worked as defined by wage and hour regulations. These jobs areexempt from the provisions of the FLSA by meeting at least one of the exemption tests for executive, administrative, professional or sales duties.
Full-Time Equivalency (FTE)Refers to the total number of labor hours paid by the organization divided by 2,080 (which is the number of hours in a 40 hour week x 52 weeks per year).
Hourly WageThe rate of pay per hour for the job being performed, excluding any variable payments, such as annual bonus/short-term incentives, overtime payments or shift differentials.
NonexemptRefers to jobs, and the incumbents in those jobs, that are subject to the overtime provisions of the Fair Labor Standards Act (FLSA), which requires payment of the minimum wage and at least time and one-half for all overtime hours worked as defined by wage and hour regulations. These jobs are subject to the provisions of the FLSA by failing to meet at least one of the exemption tests for executive, administrative, professional or sales duties.
1
SAMPLE
2016 U.S. Pharmacy Staff Compensation Survey
Survey Definitions
On-call PayPay for time an employee must be accessible by telephone or beeper, and available to return to the worksite within a designated response time.
Region BreakoutsNORTHWEST --> WA, ORMOUNTAIN --> CO, ID, MT, NV, UT, WYNORTH CENTRAL --> IA, IL, IN, KS, KY, MI, MN, MO, ND, NE, OH, SD, WINORTHEAST --> CT, DE, MA, MD, ME, NH, NJ, NY, PA, RI, VTCALIFORNIASOUTHWEST --> AZ, NM, OK, TXSOUTHEAST --> AR, AL, FL, GA, LA, MS, NC, SC, TN, VA, WVHAWAIIALASKA
SupervisionFor purposes of this survey, supervision is defined as providing work assignments, work review, discipline and performance reviews. Supervision may also include making hire or fire decisions and salary administration. Lead workers who provide work direction should not be reported as supervisors.
Target Annual Bonus/Short-term IncentiveA formally established bonus % of pay to be paid for achieving 100% of established performance criteria or goals.
Work DirectionRefers to guidance of one or more fellow employees in their day-to-day work, as distinguished from complete supervision. This could include providing training, answering questions and giving overall direction on a daily basis.
2
SAMPLE
2016 U.S. Pharmacy Staff Compensation Survey
Survey Definitions
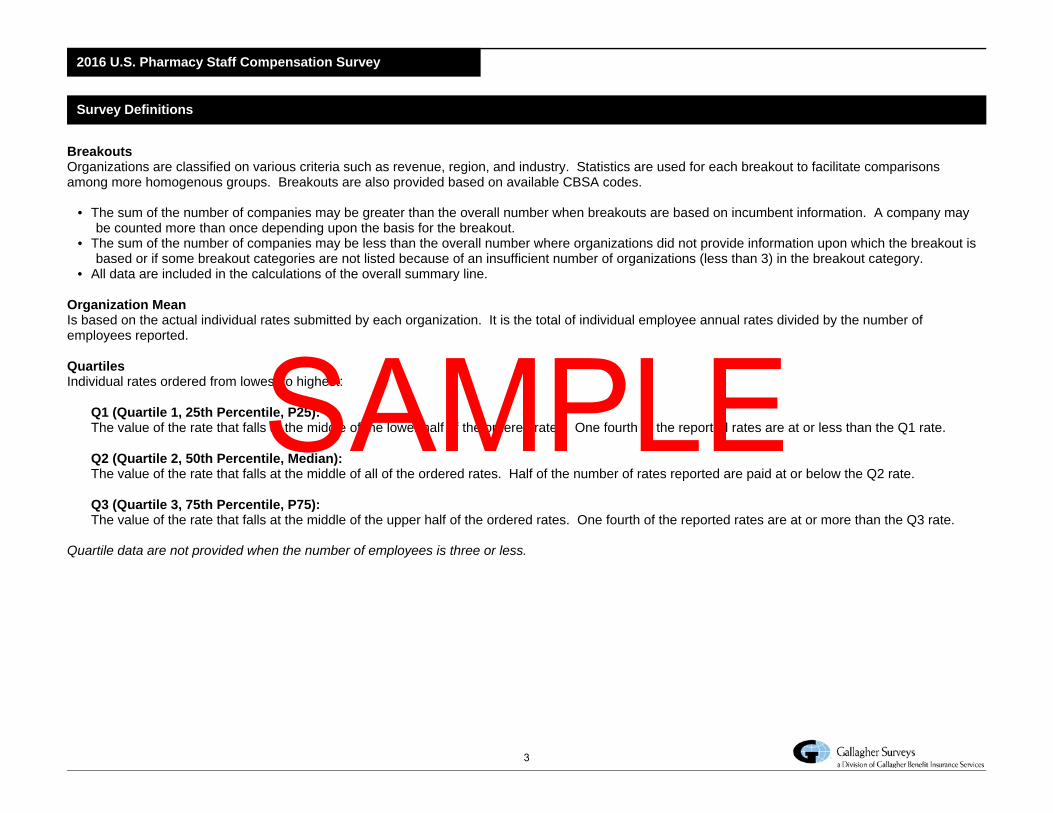
BreakoutsOrganizations are classified on various criteria such as revenue, region, and industry. Statistics are used for each breakout to facilitate comparisons among more homogenous groups. Breakouts are also provided based on available CBSA codes.
• The sum of the number of companies may be greater than the overall number when breakouts are based on incumbent information. A company may be counted more than once depending upon the basis for the breakout.
• The sum of the number of companies may be less than the overall number where organizations did not provide information upon which the breakout is based or if some breakout categories are not listed because of an insufficient number of organizations (less than 3) in the breakout category.
• All data are included in the calculations of the overall summary line.
Organization MeanIs based on the actual individual rates submitted by each organization. It is the total of individual employee annual rates divided by the number ofemployees reported.
QuartilesIndividual rates ordered from lowest to highest:
Q1 (Quartile 1, 25th Percentile, P25):The value of the rate that falls at the middle of the lower half of the ordered rates. One fourth of the reported rates are at or less than the Q1 rate.
Q2 (Quartile 2, 50th Percentile, Median):The value of the rate that falls at the middle of all of the ordered rates. Half of the number of rates reported are paid at or below the Q2 rate.
Q3 (Quartile 3, 75th Percentile, P75):The value of the rate that falls at the middle of the upper half of the ordered rates. One fourth of the reported rates are at or more than the Q3 rate.
Quartile data are not provided when the number of employees is three or less.
3
SAMPLE
2016 U.S. Pharmacy Staff Compensation Survey
Survey Calculations and Interpretations
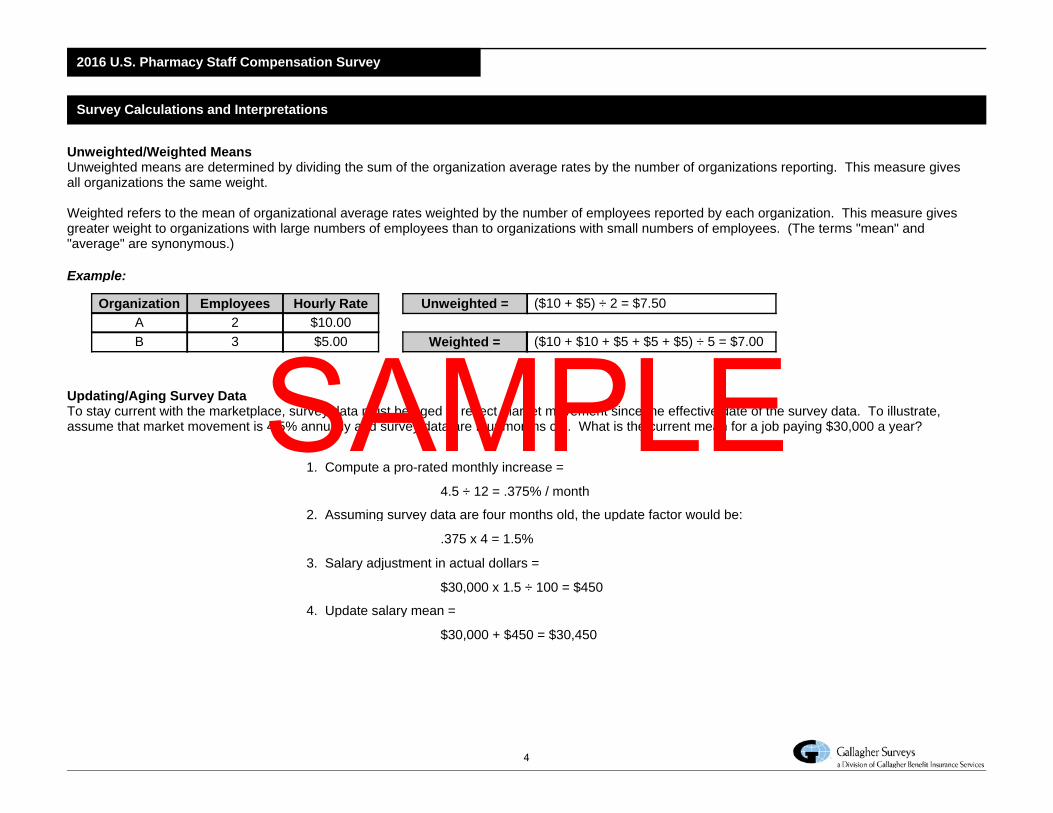
Unweighted/Weighted MeansUnweighted means are determined by dividing the sum of the organization average rates by the number of organizations reporting. This measure gives all organizations the same weight.
Weighted refers to the mean of organizational average rates weighted by the number of employees reported by each organization. This measure givesgreater weight to organizations with large numbers of employees than to organizations with small numbers of employees. (The terms "mean" and "average" are synonymous.)
Example:
Organization Employees Hourly Rate Unweighted = ($10 + $5) ÷ 2 = $7.50A 2 $10.00B 3 $5.00 Weighted = ($10 + $10 + $5 + $5 + $5) ÷ 5 = $7.00
Updating/Aging Survey DataTo stay current with the marketplace, survey data must be aged to reflect market movement since the effective date of the survey data. To illustrate,assume that market movement is 4.5% annually and survey data are four months old. What is the current mean for a job paying $30,000 a year?
1. Compute a pro-rated monthly increase =
4.5 ÷ 12 = .375% / month
2. Assuming survey data are four months old, the update factor would be:
.375 x 4 = 1.5%
3. Salary adjustment in actual dollars =
$30,000 x 1.5 ÷ 100 = $450
4. Update salary mean =
$30,000 + $450 = $30,450
4
SAMPLE
*Insufficient Data
2016 US Pharmacy Staff Compensation Survey
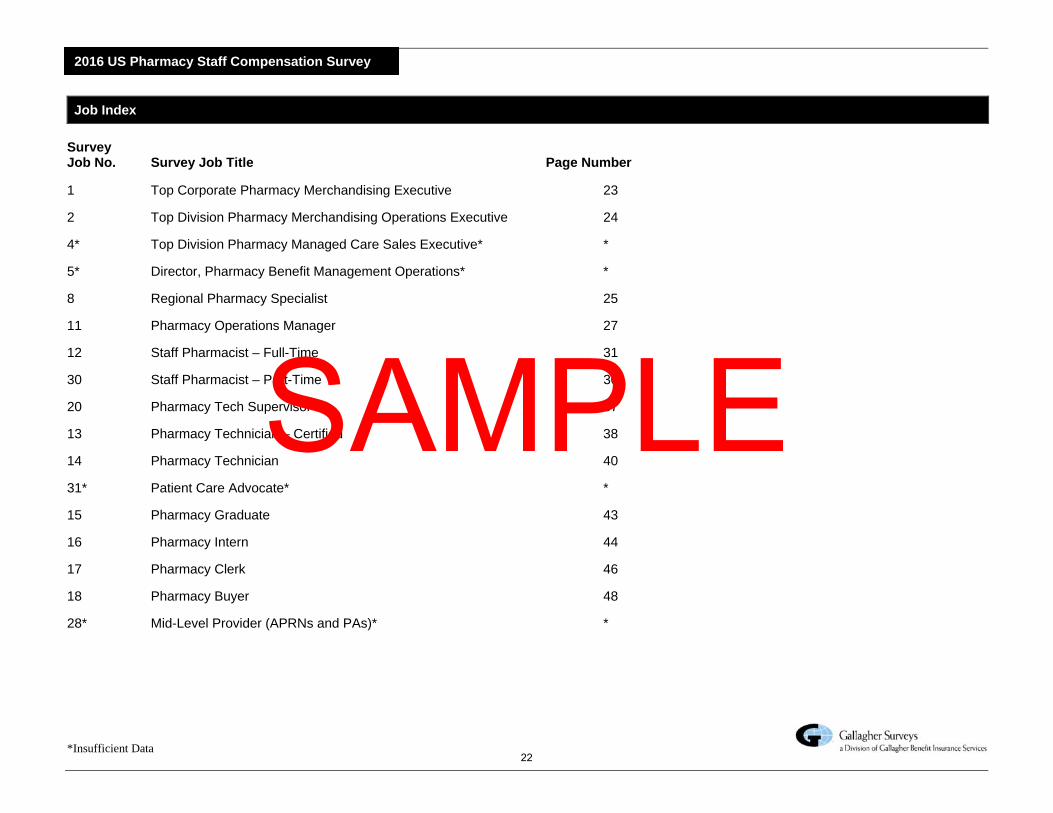
Job Index
SurveyJob No. Survey Job Title Page Number
1 Top Corporate Pharmacy Merchandising Executive 23
2 Top Division Pharmacy Merchandising Operations Executive 24
4* Top Division Pharmacy Managed Care Sales Executive* *
5* Director, Pharmacy Benefit Management Operations* *
8 Regional Pharmacy Specialist 25
11 Pharmacy Operations Manager 27
12 Staff Pharmacist – Full-Time 31
30 Staff Pharmacist – Part-Time 30
20 Pharmacy Tech Supervisor 37
13 Pharmacy Technician – Certified 38
14 Pharmacy Technician 40
31* Patient Care Advocate* *
15 Pharmacy Graduate 43
16 Pharmacy Intern 44
17 Pharmacy Clerk 46
18 Pharmacy Buyer 48
28* Mid-Level Provider (APRNs and PAs)* *
22
SAMPLE
Staff Pharmacist - Full-Time 12
# of Orgs 75th
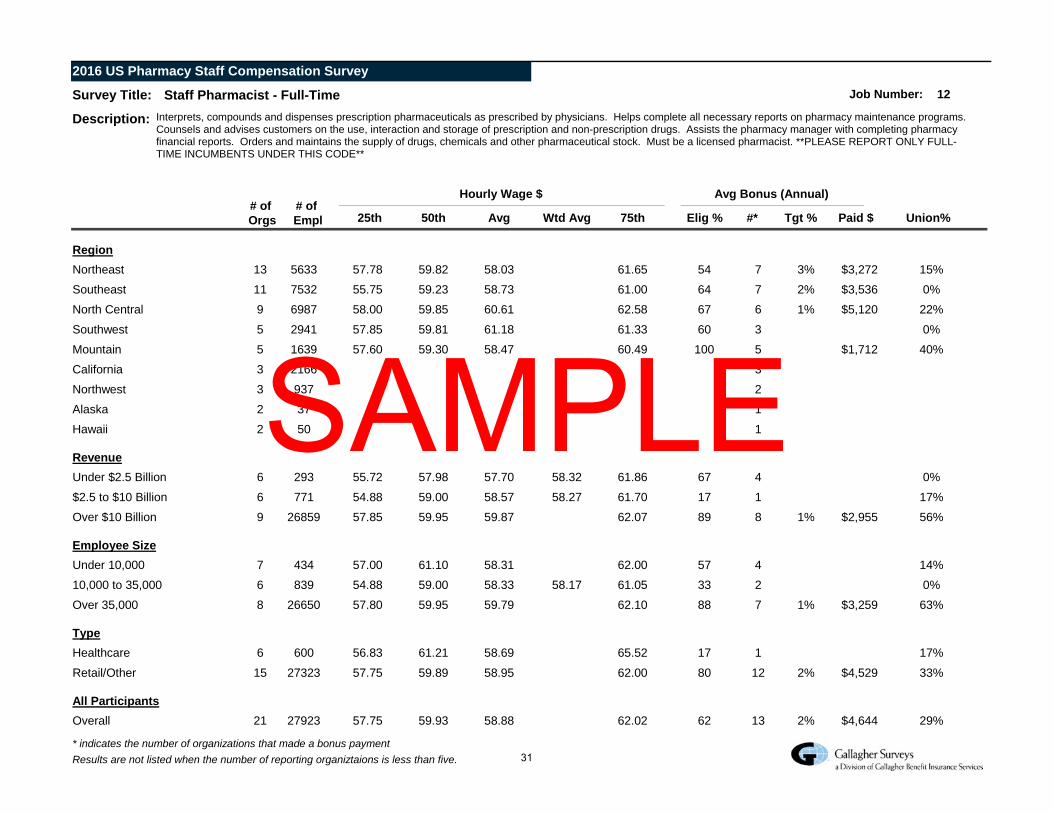
Interprets, compounds and dispenses prescription pharmaceuticals as prescribed by physicians. Helps complete all necessary reports on pharmacy maintenance programs. Counsels and advises customers on the use, interaction and storage of prescription and non-prescription drugs. Assists the pharmacy manager with completing pharmacy financial reports. Orders and maintains the supply of drugs, chemicals and other pharmaceutical stock. Must be a licensed pharmacist. **PLEASE REPORT ONLY FULL-TIME INCUMBENTS UNDER THIS CODE**
2016 US Pharmacy Staff Compensation Survey
Survey Title:
Description:
Job Number:
# of Empl Wtd Avg
Hourly Wage $
Elig % Tgt % Paid $
Avg Bonus (Annual)
Avg50th25th #* Union%
RegionNortheast 13 15%57.78 59.82 58.03 61.65 54 3% $3,27275633
Southeast 11 0%55.75 59.23 58.73 61.00 64 2% $3,53677532
North Central 9 22%58.00 59.85 60.61 62.58 67 1% $5,12066987
Southwest 5 0%57.85 59.81 61.18 61.33 60 32941
Mountain 5 40%57.60 59.30 58.47 60.49 100 $1,71251639
California 3 32166
Northwest 3 2937
Alaska 2 137
Hawaii 2 150
RevenueUnder $2.5 Billion 6 0%55.72 57.98 57.70 61.8658.32 67 4293
$2.5 to $10 Billion 6 17%54.88 59.00 58.57 61.7058.27 17 1771
Over $10 Billion 9 56%57.85 59.95 59.87 62.07 89 1% $2,955826859
Employee SizeUnder 10,000 7 14%57.00 61.10 58.31 62.00 57 4434
10,000 to 35,000 6 0%54.88 59.00 58.33 61.0558.17 33 2839
Over 35,000 8 63%57.80 59.95 59.79 62.10 88 1% $3,259726650
TypeHealthcare 6 17%56.83 61.21 58.69 65.52 17 1600
Retail/Other 15 33%57.75 59.89 58.95 62.00 80 2% $4,5291227323
All ParticipantsOverall 21 29%57.75 59.93 58.88 62.02 62 2% $4,6441327923
* indicates the number of organizations that made a bonus paymentResults are not listed when the number of reporting organiztaions is less than five. 31
SAMPLE
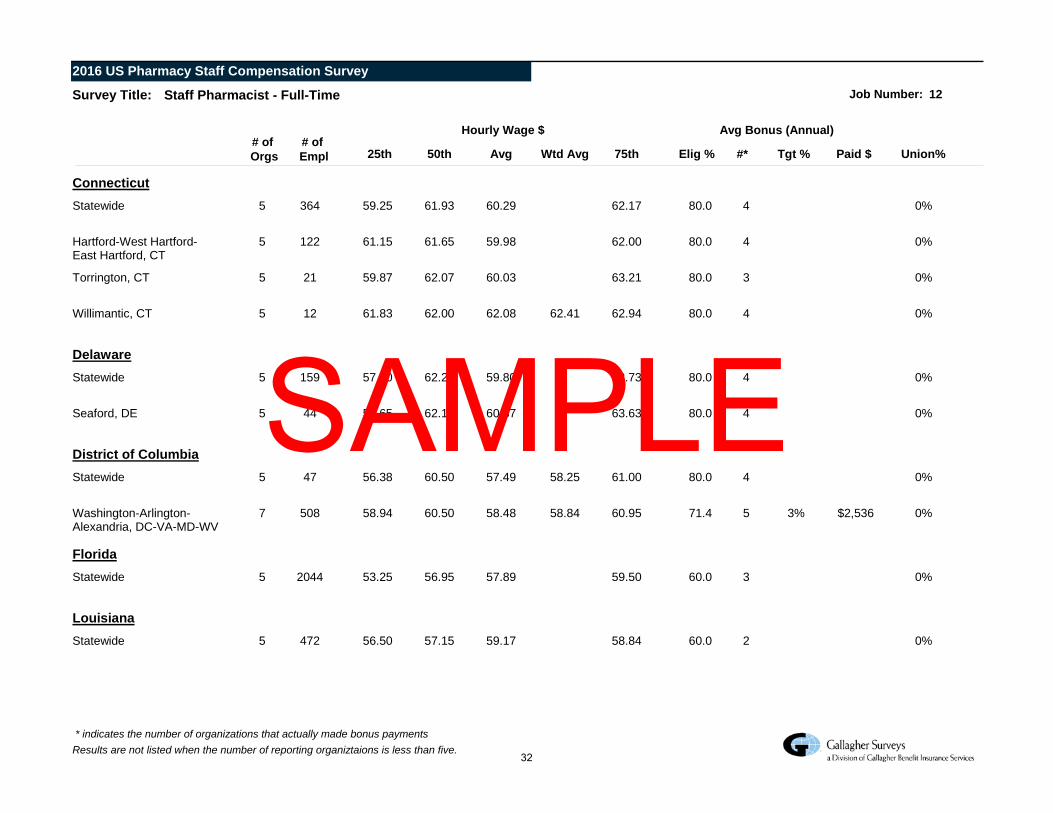
Staff Pharmacist - Full-Time 12
# of Orgs 75th Union%
2016 US Pharmacy Staff Compensation Survey
Survey Title: Job Number:
# of Empl Wtd Avg
Hourly Wage $
Elig % Tgt % Paid $
Avg Bonus (Annual)
Avg50th25th #*
ConnecticutStatewide 5 0%59.25 61.93 60.29 62.17 80.0 4364
Hartford-West Hartford-East Hartford, CT
5 0%61.15 61.65 59.98 62.00 80.0 4122
Torrington, CT 5 0%59.87 62.07 60.03 63.21 80.0 321
Willimantic, CT 5 0%61.83 62.00 62.08 62.9462.41 80.0 412
DelawareStatewide 5 0%57.80 62.25 59.80 62.73 80.0 4159
Seaford, DE 5 0%57.65 62.15 60.37 63.63 80.0 444
District of ColumbiaStatewide 5 0%56.38 60.50 57.49 61.0058.25 80.0 447
Washington-Arlington-Alexandria, DC-VA-MD-WV
7 0%58.94 60.50 58.48 60.9558.84 71.4 3% $2,5365508
FloridaStatewide 5 0%53.25 56.95 57.89 59.50 60.0 32044
LouisianaStatewide 5 0%56.50 57.15 59.17 58.84 60.0 2472
* indicates the number of organizations that actually made bonus paymentsResults are not listed when the number of reporting organiztaions is less than five.
32
SAMPLE
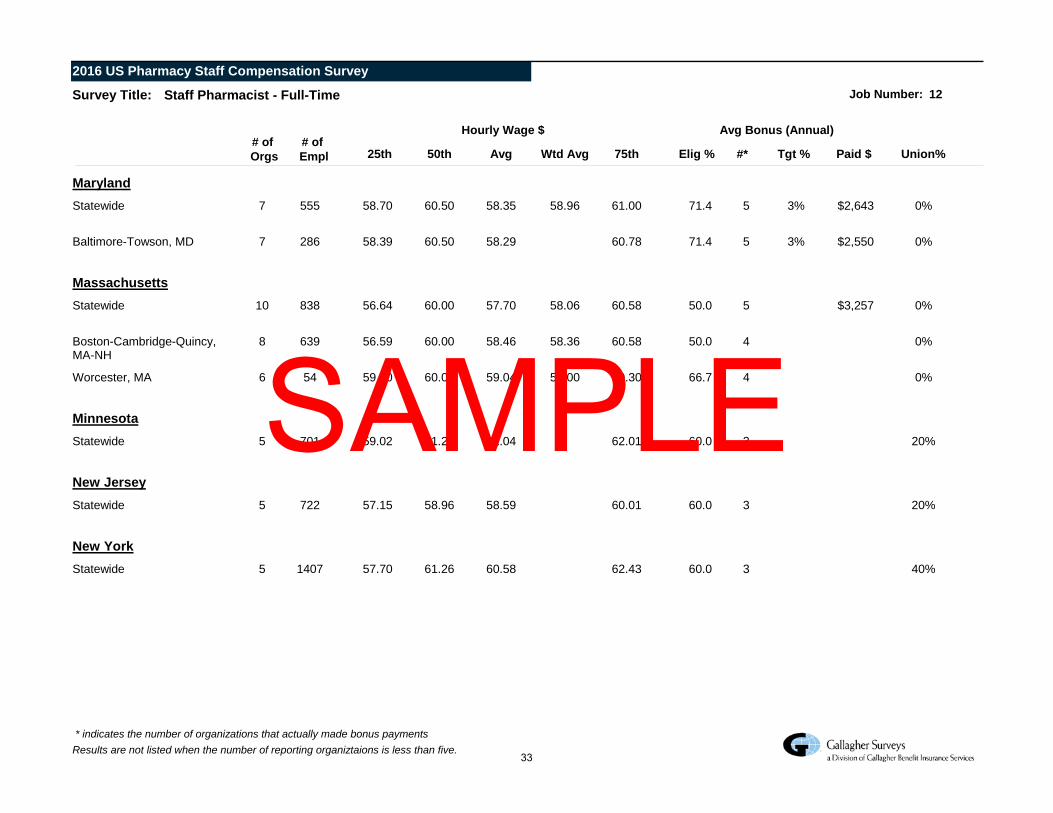
Staff Pharmacist - Full-Time 12
# of Orgs 75th Union%
2016 US Pharmacy Staff Compensation Survey
Survey Title: Job Number:
# of Empl Wtd Avg
Hourly Wage $
Elig % Tgt % Paid $
Avg Bonus (Annual)
Avg50th25th #*
MarylandStatewide 7 0%58.70 60.50 58.35 61.0058.96 71.4 3% $2,6435555
Baltimore-Towson, MD 7 0%58.39 60.50 58.29 60.78 71.4 3% $2,5505286
MassachusettsStatewide 10 0%56.64 60.00 57.70 60.5858.06 50.0 $3,2575838
Boston-Cambridge-Quincy, MA-NH
8 0%56.59 60.00 58.46 60.5858.36 50.0 4639
Worcester, MA 6 0%59.00 60.00 59.04 60.3059.00 66.7 454
MinnesotaStatewide 5 20%59.02 61.21 61.04 62.01 60.0 3701
New JerseyStatewide 5 20%57.15 58.96 58.59 60.01 60.0 3722
New YorkStatewide 5 40%57.70 61.26 60.58 62.43 60.0 31407
* indicates the number of organizations that actually made bonus paymentsResults are not listed when the number of reporting organiztaions is less than five.
33
SAMPLE
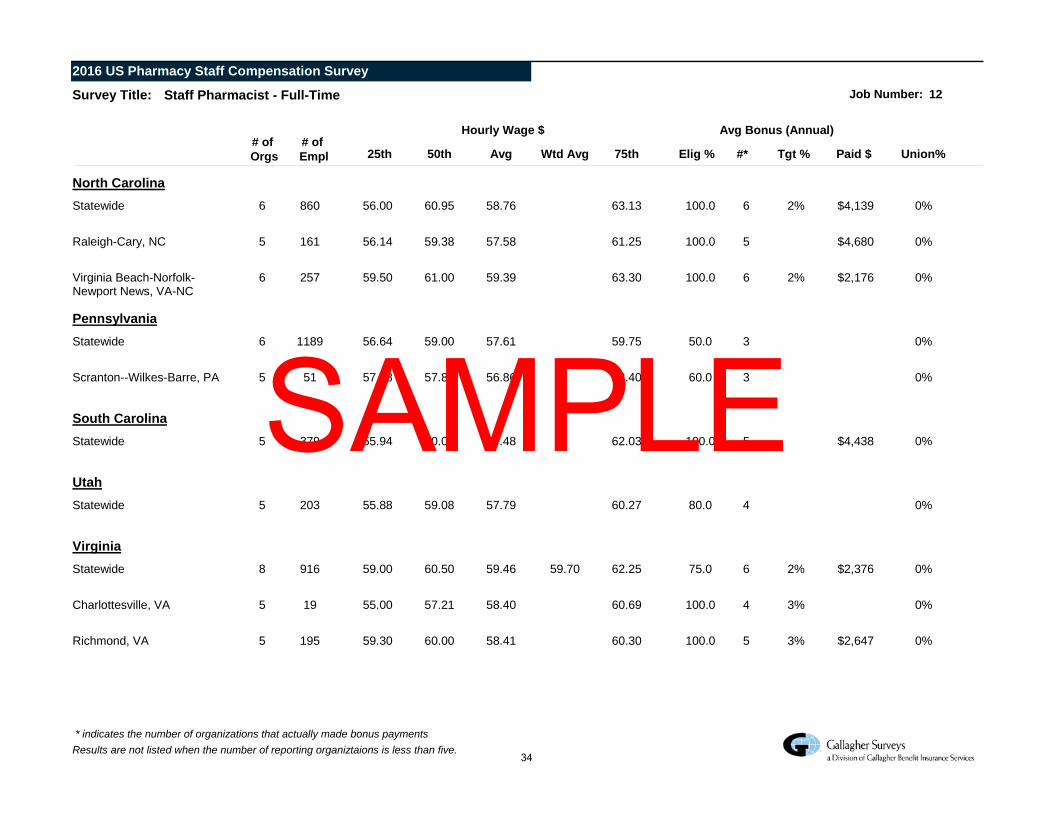
Staff Pharmacist - Full-Time 12
# of Orgs 75th Union%
2016 US Pharmacy Staff Compensation Survey
Survey Title: Job Number:
# of Empl Wtd Avg
Hourly Wage $
Elig % Tgt % Paid $
Avg Bonus (Annual)
Avg50th25th #*
North CarolinaStatewide 6 0%56.00 60.95 58.76 63.13 100.0 2% $4,1396860
Raleigh-Cary, NC 5 0%56.14 59.38 57.58 61.25 100.0 $4,6805161
Virginia Beach-Norfolk-Newport News, VA-NC
6 0%59.50 61.00 59.39 63.30 100.0 2% $2,1766257
PennsylvaniaStatewide 6 0%56.64 59.00 57.61 59.75 50.0 31189
Scranton--Wilkes-Barre, PA 5 0%57.38 57.80 56.86 58.40 60.0 351
South CarolinaStatewide 5 0%55.94 60.05 57.48 62.03 100.0 $4,4385379
UtahStatewide 5 0%55.88 59.08 57.79 60.27 80.0 4203
VirginiaStatewide 8 0%59.00 60.50 59.46 62.2559.70 75.0 2% $2,3766916
Charlottesville, VA 5 0%55.00 57.21 58.40 60.69 100.0 3%419
Richmond, VA 5 0%59.30 60.00 58.41 60.30 100.0 3% $2,6475195
* indicates the number of organizations that actually made bonus paymentsResults are not listed when the number of reporting organiztaions is less than five.
34
SAMPLE
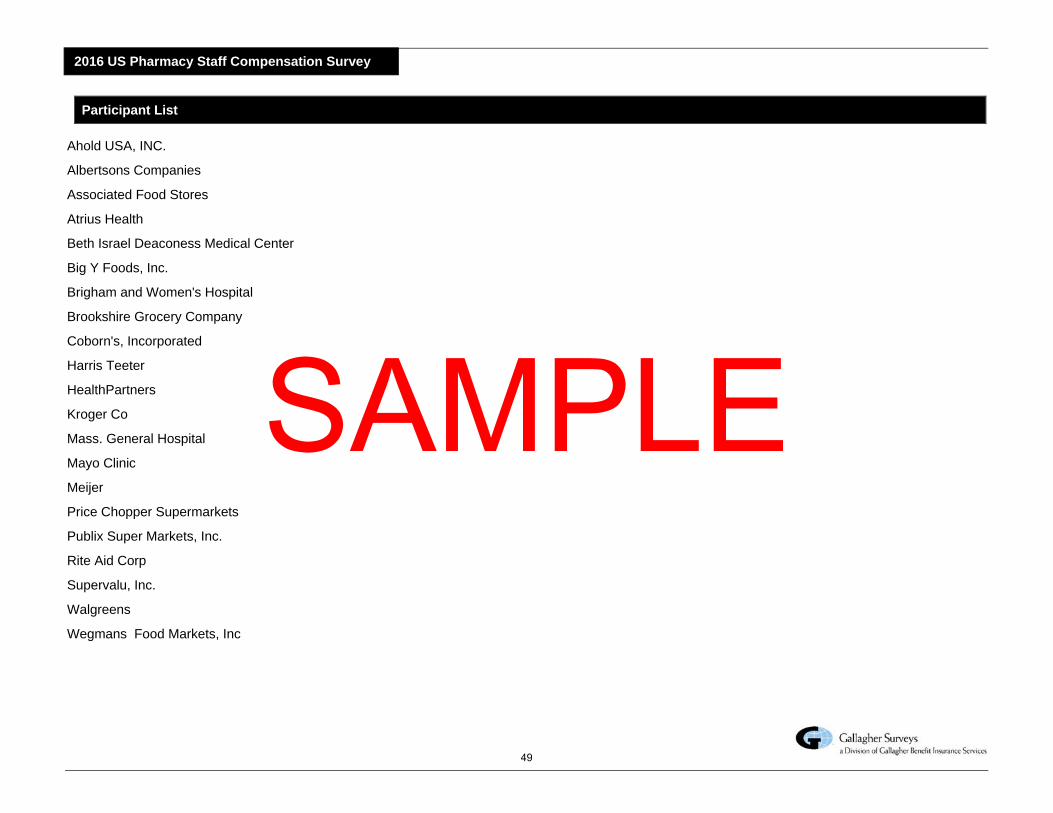
2016 US Pharmacy Staff Compensation Survey
Participant List
Ahold USA, INC.
Albertsons Companies
Associated Food Stores
Atrius Health
Beth Israel Deaconess Medical Center
Big Y Foods, Inc.
Brigham and Women's Hospital
Brookshire Grocery Company
Coborn's, Incorporated
Harris Teeter
HealthPartners
Kroger Co
Mass. General Hospital
Mayo Clinic
Meijer
Price Chopper Supermarkets
Publix Super Markets, Inc.
Rite Aid Corp
Supervalu, Inc.
Walgreens
Wegmans Food Markets, Inc
49
SAMPLE