Embed Size (px)
Citation preview

Sample Health Literacy Assessment Question
Respondents who participated in the 2003assessment were asked to complete prose,document, and quantitative literacy tasks
of varying levels of difficulty.The sample questionon the following page illustrates the type of taskused to measure the health literacy of America’sadults.This question was originally developed forthe 1992 survey and reused in 2003.
Consistent with the design of the assessment, thesample question appears before the text needed toanswer the question. The percentage of respon-dents who answered the question correctly isreported, as well as the percentage of correctresponses for each of the four health literacy assess-ment levels.
More information about the sample assessmentquestions can be found on the Internet athttp://nces.ed.gov/naal.
23
AAPPENDIX A

24
The Health Literacy of America’s Adults
Prose and Health Literacy Question
Refer to the article on the next page to answer the following question.
According to the brochure, why is it difficult for people to know if they have high blood pressure?
_______________________________________________________________________________
_______________________________________________________________________________
Correct answer
Any statement such as the following:
Symptoms are not usually present
High blood pressure is silent
All Adults Below Basic Basic Intermediate Proficient
74 10 71 94 100
NOTE: Adults are defined as people 16 years of age and older living in households or prisons. Adults who could not be interviewed because of language spoken or cognitive or mental disabilities (3 percent in 2003)
are excluded from these data.
SOURCE: U.S. Department of Education, Institute of Education Sciences, National Center for Education Statistics, 2003 National Assessment of Adult Literacy.
Percentage of adults who answered the question correctly, health literacy scale: 2003

25
Appendix A: Sample Health Literacy Assessment Question

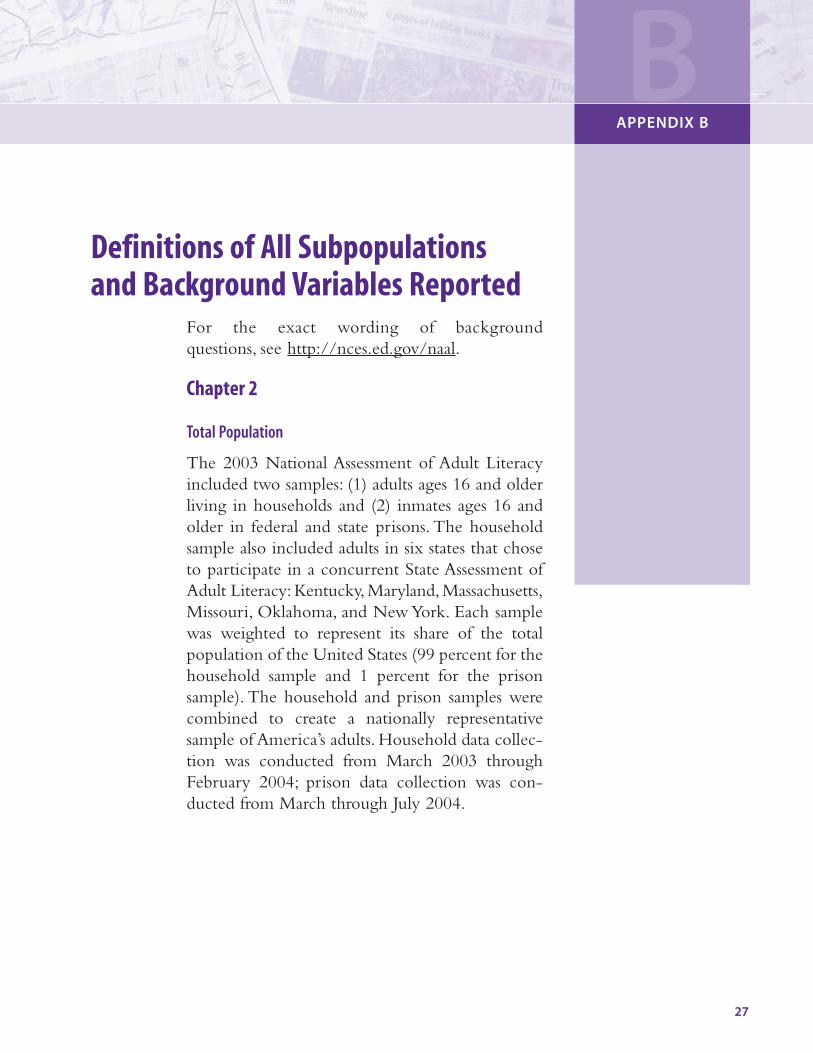
Definitions of All Subpopulations and Background Variables Reported
For the exact wording of background questions, see http://nces.ed.gov/naal.
Chapter 2
Total Population
The 2003 National Assessment of Adult Literacyincluded two samples: (1) adults ages 16 and olderliving in households and (2) inmates ages 16 andolder in federal and state prisons. The householdsample also included adults in six states that choseto participate in a concurrent State Assessment ofAdult Literacy: Kentucky, Maryland, Massachusetts,Missouri, Oklahoma, and New York. Each samplewas weighted to represent its share of the totalpopulation of the United States (99 percent for thehousehold sample and 1 percent for the prisonsample). The household and prison samples werecombined to create a nationally representativesample of America’s adults. Household data collec-tion was conducted from March 2003 throughFebruary 2004; prison data collection was con-ducted from March through July 2004.
27
BAPPENDIX B

Gender
Interviewers recorded the gender of each respondent.
Race and Ethnicity
In 2003, all respondents were asked two or threequestions about their race and ethnicity. The firstquestion asked them to indicate whether they wereHispanic or Latino.
If a respondent answered that he or she was Hispanicor Latino, the respondent was asked to choose one ormore of the following groups to describe his or herHispanic origin:
■ Mexican, Mexican American, or Chicano
■ Puerto Rican or Puerto Rican American
■ Cuban or Cuban American
■ Central or South American
■ Other Hispanic or Latino background
Respondents who identified more than one of thegroups to describe their Hispanic origin were classi-fied as “Other Hispanic or Latino background.”
Then, all respondents, including those who indicatedthey were Hispanic or Latino, were asked to chooseone or more of the following groups to describethemselves:
■ White
■ Black or African American
■ Asian
■ American Indian or Alaska Native
■ Native Hawaiian or other Pacific Islander
Individuals who responded “yes” to the first questionwere coded as Hispanic, regardless of their answer tothe second question. Individuals who identifiedmore than one group on the second question werecoded as Multiracial. Respondents of Native
Hawaiian or Pacific Islander origin were groupedwith those of Asian origin. The White, Black, andHispanic groups are reported separately. The inter-viewer recorded the race/ethnicity of respondentswho refused to answer the question.
Age
All respondents were asked to report their birthdates, and this information was used to calculate theirage. Age groups reported are 16 to 18, 19 to 24, 25to 39, 40 to 49, 50 to 64, and 65 and older. Agegroups were selected to correspond to key life stagesof many adults:
16-18: Completion of secondary education
19-24: College or job training
25-39: Early career
40-49: Mid-career
50-64: Late career
65 and older: Retirement
Highest Level of Educational Attainment
All respondents were asked to indicate the highestlevel of education they had completed.The followingoptions were provided:
■ Still in high school
■ Less than high school
■ Some high school
■ GED or high school equivalency
■ High school graduate
■ Vocational, trade, or business school after highschool
■ College: less than 2 years
■ College:Associate’s degree (A.A.)
■ College: 2 or more years, no degree
■ College graduate (B.A. or B.S.)
28
The Health Literacy of America’s Adults

■ Postgraduate, no degree
■ Postgraduate degree (M.S., M.A., Ph.D., M.D.,etc.)
Respondents who reported less than high school orsome high school were asked how many years ofeducation they completed. For certain analyses, someof these groups were collapsed. For example, respon-dents who reported some postgraduate study but nodegree were generally combined with those who hadcompleted a postgraduate degree.
Chapter 3
Self-Assessment of Overall Health
Respondents were asked how, in general, they wouldrate their overall health.They were given the follow-ing response options: excellent, very good, good,fair, poor.
Health Insurance
Respondents were asked whether they received thefollowing types of health insurance: health insurancethrough your work (school) or a family member’swork,Medicare, health insurance you or someone elsein your family purchased directly from an insurance
company or other organization that is not related topast or current employment, health insurance provid-ed as part of military service, Medicaid. Respondentscould indicate that they received multiple types ofhealth insurance.Adults who received more than onetype of health insurance were included in multiplecategories for the analyses in this report. Adults inprisons were not asked this question and they are notincluded in the analyses.
Sources of Information About Health Issues
Household respondents were asked how much infor-mation about health issues, such as diet, exercise, dis-ease prevention, or a specific disease or health condi-tion, they got from newspapers, magazines, theInternet, radio and television, books or brochures;family members, friends, or coworkers; or talking todoctors, nurses, therapists, or psychologists. Theywere given the following response options: a lot,some, a little, none. Prison respondents were askedthe same question, but instead of “family members,friends, or coworkers,” they were asked about “fami-ly members, friends, other inmates, or staff.” Prisonrespondents were not asked about the Internetbecause most prison inmates do not have access tothe Internet.
29
Appendix B: Definitions of All Subpopulations and Background Variables Reported


31
toc
1CHAPTER ONE
Technical Notes
This appendix describes the sampling, datacollection, weighting and variance estima-tion, scaling, and statistical testing proce-
dures used to collect and analyze the data for the2003 National Assessment of Adult Literacy(NAAL). Household data collection was conduct-ed from March 2003 through February 2004;prison data collection was conducted from Marchthrough July 2004.
Sampling
The 2003 National Assessment of Adult Literacyincluded two samples: (1) adults ages 16 and olderliving in households (99 percent of the sampleweighted) and (2) inmates ages 16 and older in fed-eral and state prisons (1 percent of the sampleweighted). Each sample was weighted to representits share of the total population of the United States,and the samples were combined for reporting.
Household Sample
The 2003 National Assessment of Adult Literacyhousehold sample included a nationally represen-tative probability sample of 35,365 households.The household sample was selected on the basis ofa four-stage, stratified area sample: (1) primarysampling units (PSUs) consisting of counties orgroups of contiguous counties; (2) secondary sam-pling units (referred to as segments) consisting ofarea blocks; (3) housing units containing house-holds; and (4) eligible persons within households.Person-level data were collected through a screener,
CAPPENDIX C

a background questionnaire, the literacy assessment,and the oral module. Of the 35,365 sampled house-holds, 4,671 were either vacant or not a dwelling unit,resulting in a sample of 30,694 households.1 A total of25,123 households completed the screener, whichwas used to select survey respondents. The finalscreener response rate was 81.2 percent weighted.
On the basis of the screener data, 23,732 respondentsages 16 and older were selected to complete thebackground questionnaire and the assessment; 18,186actually completed the background questionnaire. Ofthe 5,546 respondents who did not complete thebackground questionnaire, 355 were unable to do sobecause of a literacy-related barrier, either the inabil-ity to communicate in English or Spanish (the twolanguages in which the background questionnairewas administered) or a mental disability.
The final response rate for the background question-naire, which included respondents who completedthe background questionnaire and respondents whowere unable to complete the background question-naire because of language problems or a mental dis-ability, was 76.6 percent weighted. Of the 18,186adults ages 16 and older who completed the back-ground questionnaire, 17,178 completed at least onequestion on each of the three scales—prose, docu-ment, and quantitative—measured in the adult liter-acy assessment. An additional 149 were unable toanswer at least one question on each of the threescales for literacy-related reasons.2 The final responserate for the literacy assessment, which included
respondents who answered at least one question oneach scale plus the 149 respondents who were unableto do so because of language problems or a mentaldisability, was 96.6 percent weighted.
Cases were considered complete if the respondentcompleted the background questionnaire and at leastone question on each of the three scales or if therespondent was unable to answer any questionsbecause of language issues (an inability to communi-cate in English or Spanish) or a mental disability. Allother cases that did not include a complete screener,a background questionnaire, and responses to at leastone question on each of the three literacy scales wereconsidered incomplete or missing. Before imputa-tion, the overall response rate for the household sam-ple was 60.1 percent weighted.
For respondents who did not complete any literacytasks on any scale, no information is available abouttheir performance on the literacy scale they weremissing. Completely omitting these individuals fromthe analyses would have resulted in unknown biasesin estimates of the literacy skills of the national pop-ulation because refusals cannot be assumed to haveoccurred randomly. For 859 respondents3 whoanswered the background questionnaire but refused tocomplete the assessment for reasons other than lan-guage issues or a mental disability, regression-basedimputation procedures were applied to imputeresponses to one assessment item on each scale byusing the NAAL background data on age, gender,race/ethnicity, education level, country of birth, cen-sus region, and metropolitan statistical area status.
On the prose and quantitative scales, a response wasimputed for the easiest task on each scale. On the
32
The Health Literacy of America’s Adults
3 Of the 18,186 household respondents who completed the back-ground questionnaire, 17,178 completed at least one question oneach of the three scales and 149 were unable to answer at least onequestion on one or more of the scales for literacy-related reasons.The remaining 859 respondents completed the background ques-tionnaire but refused to complete the assessment.
1To increase the number of Black and Hispanic adults in the NAALsample, segments with moderate to high concentrations of Blackand Hispanic adults were given a higher selection probability.Segments in which Blacks or Hispanics accounted for 25 percentor more of the population were oversampled at a rate up to threetimes that of the remainder of the segments.
2 Of the 149 respondents who were unable to answer at least onequestion on each of the three scales for literacy-related reasons, 65respondents answered at least one question on one scale. Theremaining 84 respondents did not answer any questions on any scale.

document scale, a response was imputed for the sec-ond easiest task because that task was also included onthe health literacy scale. In each of the logistic regres-sion models, the estimated regression coefficientswere used to predict missing values of the item to beimputed. For each nonrespondent, the probability ofanswering the item correctly was computed and thencompared with a randomly generated numberbetween 0 and 1. If the probability of getting a cor-rect answer was greater than the random number, theimputed value for the item was 1 (correct).Otherwiseit was 0 (wrong). In addition, a wrong response oneach scale was imputed for 65 respondents who start-ed to answer the assessment but were unable toanswer at least one question on each scale because oflanguage issues or a mental disability.4
The final household reporting sample—includingthe imputed cases—consisted of 18,102 respondents.These 18,102 respondents are the 17,178 respon-dents who completed the background questionnaireand the assessment, plus the 859 respondents whocompleted the background questionnaire but refusedto do the assessment for non-literacy-related reasonsand have imputed responses to one item on eachscale, plus the 65 respondents who started to answerthe assessment items but were unable to answer atleast one question on each scale because of languageissues or a mental disability.After including the casesfor which responses to the assessment questions wereimputed, the weighted response rate for the house-hold sample was 62.1 percent (18,102 cases withcomplete or imputed data and an additional 439cases that had no assessment data because of languageissues or a mental disability).5
The household sample was subject to unit nonre-sponse from the screener, background questionnaire,literacy assessment, and oral module and to itemnonresponse to background questionnaire items.Although all background questionnaire items hadresponse rates of more than 85 percent, two stages ofdata collection—the screener and the backgroundquestionnaire—had unit response rates below 85percent and thus required an analysis of the poten-tial for nonresponse bias.
Table C-1 presents a summary of the householdresponse rate.
Prison Sample
The 2003 assessment also included a nationally repre-sentative probability sample of inmates in federal andstate prisons. A total of 114 prisons were selected toparticipate in the adult literacy assessment. Of these114 prisons, 107 agreed to participate, 3 refused, and4 were ineligible. The final prison response rate was97.3 percent weighted. From among the inmates inthose prisons, 1,298 inmates ages 16 and older wererandomly selected to complete the background ques-tionnaire and assessment. Of those 1,298 selectedinmates, 1,161 completed the background question-naire. Of the 137 who did not complete the back-ground questionnaire, 12 were unable to do sobecause of a literacy-related barrier, either the inabil-
33
Appendix C: Technical Notes
Table C-1. Weighted and unweighted household
response rate, by survey component: 2003
Weighted UnweightedResponse rate Response rate
Survey component (percent) (percent)
Screener 81.2 81.8
Background questionnaire 76.6 78.1
Literacy assessment 96.6 97.2
Overall response rate before imputation 60.1 62.1
Overall response rate after imputation 62.1 63.9
SOURCE: U.S. Department of Education, Institute of Education Sciences, National Center for
Education Statistics, 2003 National Assessment of Adult Literacy.
4 For a more detailed discussion of imputation see Little andRubin (2002).5 The 439 cases that had no assessment data because of languageissues or a mental disability include the 355 respondents who wereunable to complete the background questionnaire for one of thesereasons, plus the 84 respondents who did not answer any questionson any scale because of language issues or a mental disability.

ity to communicate in English or Spanish (the twolanguages in which the background questionnairewas administered) or a mental disability.
The final response rate for the prison backgroundquestionnaire, which included respondents whocompleted the background questionnaire andrespondents who were unable to complete the back-ground questionnaire because of language problemsor a mental disability, was 90.6 percent weighted. Ofthe 1,161 inmates who completed the backgroundquestionnaire, 1,125 completed at least one questionon each of the three scales—prose, document, andquantitative—measured in the adult literacy assess-ment. An additional eight were unable to answer atleast one question on each of the three scales for lit-eracy-related reasons.The final response rate for theliteracy assessment, which included respondents whoanswered at least one question on each scale or wereunable to do so because of language problems or amental disability, was 98.9 percent weighted.
The same definition of a complete case used for thehousehold sample was also used for the prison sam-ple, and the same rules were followed for imputation.Before imputation, the final response rate for theprison sample was 87.2 percent weighted.
One response on each scale was imputed on the basisof background characteristics for 28 inmates whocompleted the background questionnaire but hadincomplete or missing assessments for reasons thatwere not literacy related. The statistical imputationprocedures were the same as for the household sam-ple. The background characteristics used for themissing data imputation for the prison sample wereprison security level, region of country/prison type,age, gender, educational attainment, country of birth,race/ethnicity, and marital status. A wrong responseon each scale was imputed for the three inmates whostarted to answer the assessment but were unable toanswer at least one question on each scale because of
language issues or a mental disability.The final prisonreporting sample—including the imputed cases—consisted of 1,156 respondents. After the cases forwhich responses to the assessment questions wereimputed were included, the weighted response ratefor the prison sample was 88.3 percent (1,156 caseswith complete or imputed data and an additional 17cases that had no assessment data because of languageissues or a mental disability).
Table C-2 presents a summary of the prison responserate.
Nonresponse Bias
NCES statistical standards require a nonresponse biasanalysis when the unit response rate for a sample is lessthan 85 percent.The nonresponse bias analysis of thehousehold sample revealed differences in the back-ground characteristics of respondents who participatedin the assessment compared with those who refused.
In bivariate unit-level analyses at the screener andbackground questionnaire stages, estimated percent-ages for respondents were compared with those forthe total eligible sample to identify any potential biasowing to nonresponse. Although some statisticallysignificant differences existed, the potential for biaswas small because the absolute difference betweenestimated percentages was less than 2 percent for alldomains considered. Multivariate analyses were con-
34
The Health Literacy of America’s Adults
Table C-2. Weighted and unweighted prison
response rate, by survey component: 2003
Weighted UnweightedResponse rate Response rate
Survey component (percent) (percent)
Prison 97.3 97.3
Background questionnaire 90.6 90.4
Literacy assessment 98.9 98.8
Overall response rate before imputation 87.2 86.8
Overall response rate after imputation 88.3 87.9
SOURCE: U.S. Department of Education, Institute of Education Sciences, National Center for
Education Statistics, 2003 National Assessment of Adult Literacy.

ducted to further explore the potential for nonre-sponse bias by identifying the domains with the mostdifferential response rates. These analyses revealedthat the lowest response rates for the screener wereamong dwelling units in segments with high medianincome, small average household size, and a largeproportion of renters. The lowest response rates forthe background questionnaire were among malesages 30 and older in segments with high medianincome. However, the variables used to define theseareas and other pockets with low response rates wereused in weighting adjustments. The analysis showedthat weighting adjustments was highly effective inreducing the bias.The general conclusion was that thepotential amount of nonresponse bias attributable tounit nonresponse at the screener and backgroundquestionnaire stages was likely to be negligible.
Data Collection
Household interviews took place in respondents’homes; prison interviews generally took place in aclassroom or library in the prison. Whenever possi-ble, interviewers administered the background ques-tionnaire and assessment in a private setting. Unlessthere were security concerns, a guard was not pres-ent in the room when inmates were interviewed.
Interviewers used a computer-assisted personal inter-viewing (CAPI) system programmed into laptopcomputers. The interviewers read the backgroundquestions from the computer screen and entered allresponses directly into the computer.Skip patterns andfollow-up probes for contradictory or out-of-rangeresponses were programmed into the computer.
After completing the background questionnaire,respondents were handed a booklet with the assess-ment questions. The interviewers followed a scriptthat introduced the assessment booklet and guidedthe respondent through the assessment.
Each assessment booklet began with the same sevenquestions. After the respondent completed thosequestions, the interviewer asked the respondent forthe book and used an algorithm to determine on thebasis of the responses to the first seven questionswhether the respondent should continue in the mainassessment or be placed in the Adult LiteracySupplemental Assessment (ALSA). Three percent ofadults weighted (5 percent unweighted) were placedin the ALSA.
ALSA was a performance-based assessment thatallowed adults with marginal literacy to demonstratewhat they could and could not do when asked tomake sense of various forms of print.The ALSAstarted with simple identification tasks and sightwords and moved to connected text, using authen-tic, highly contextualized material commonly foundat home or in the community. Respondents placedin the ALSA are included in the NAAL samplebased on their responses to the seven questionsBecause the ALSA respondents got most or all of theseven questions at the beginning of the assessmentwrong, they would have been classified into theBelow Basic level on the health scale.
A respondent who continued in the main assessmentwas given back the assessment booklet, and the inter-viewer asked the respondent to complete the tasks inthe booklet and guided the respondent through thetasks.The main assessment consisted of 12 blocks oftasks with approximately 11 questions in each block,but each assessment booklet included only 3 blocksof questions.The blocks were spiraled so that acrossthe 26 different configurations of the assessmentbooklet, each block was paired with every otherblock and each block appeared in each of the threepositions (first, middle, last) in a booklet.
For ALSA interviews, the interviewer read the ALSAscript from a printed booklet and classified therespondent’s answers into the response categories in
35
Appendix C: Technical Notes

the printed booklet.ALSA respondents were handedthe materials they were asked to read
Following the main assessment or ALSA, all respon-dents were administered the oral fluency assessment(not discussed in this report).Respondents were hand-ed a booklet with passages, number lists, letter lists,word lists, and pseudoword lists to read orally.Respondents read into a microphone that recordedtheir responses on the laptop computer.
Weighting and Variance Estimation
A complex sample design was used to select assess-ment respondents.The properties of a sample select-ed through a complex design could be very differ-ent from those of a simple random sample in whichevery individual in the target population has anequal chance of selection and in which the observa-tions from different sampled individuals can be con-sidered to be statistically independent of one anoth-er. Therefore, the properties of the sample for thecomplex data collection design were taken intoaccount during the analysis of the data. Standarderrors calculated as though the data had been collect-ed from a simple random sample would generallyunderestimate sampling errors. One way of address-ing the properties of the sample design was by usingsampling weights to account for the fact that theprobabilities of selection were not identical for allrespondents.All population and subpopulation char-acteristics based on the NAAL data used samplingweights in their estimation.
The statistics presented in this report are estimates ofgroup and subgroup performance based on a sampleof respondents, rather than the values that could becalculated if every person in the nation answeredevery question on the instrument. It is thereforeimportant to have measures of the degree of uncer-tainty of the estimates. Accordingly, in addition toproviding estimates of percentages of respondents
and their average scale score, this report providesinformation about the uncertainty of each statistic.
Because the assessment used clustered sampling, con-ventional formulas for estimating sampling variabili-ty that assume simple random sampling and henceindependence of observations are inappropriate. Forthis reason, the NAAL assessment uses a Taylor seriesprocedure based on the sandwich estimator to estimatestandard errors (Binder 1983).
Scaling
As discussed above, each respondent to the NAALreceived a booklet that included 3 of the 13 assess-ments blocks. Because each respondent did notanswer all of the NAAL items, item response theory(IRT) methods were used to estimate average scoreson the health, prose, document, and quantitative literacy scales; a simple average percent correct wouldnot allow for reporting results that are comparablefor all respondents. IRT models the probability ofanswering a question correctly as a mathematicalfunction of proficiency or skill. The main purposeof IRT analysis is to provide a common scale onwhich performance on some latent trait can be compared across groups, such as those defined by sex,race/ethnicity, or place of birth (Hambleton andSwaminathan 1985).
IRT models assume that an examinee’s performanceon each item reflects characteristics of the item andcharacteristics of the examinee. All models assumethat all items on a scale measure a common latentability or proficiency dimension (e.g., prose literacy)and that the probability of a correct response on anitem is uncorrelated with the probability of a correctresponse on another item given fixed values of thelatent trait. Items are measured in terms of their dif-ficulty as well as their ability to discriminate amongexaminees of varying ability.
36
The Health Literacy of America’s Adults

The assessment used two types of IRT models toestimate scale scores. The two-parameter logistic(2PL) model, which was used for dichotomous items(that is, items that are scored either right or wrong)takes the form
,
where is the response of person j to item i, isthe proficiency of person j, is the slope or discrimi-nation parameter for item i, and is the location ordifficulty parameter for item i.
For the partial credit items, the graded responselogistic (GRL) model was used. This model followsthe 2PL model for the probability of a score of 1 (atleast partially correct):
.
It also follows the 2PL model for the probability of ascore of 2 (completely correct):
.
In the equations above, and are the stepparameters corresponding to the response categoriesof partially or fully correct.
The scale indeterminacy was solved by setting an ori-gin and unit size to the reported scale means and
standard deviations from the 1992 assessment.6 Lineartransformation was performed to transform the orig-inal scale metric to the final reporting metric.
Levels were set and items were mapped to scales basedon the scores corresponding to a 67 percent successrate on the tasks.
Statistical Testing
The statistical comparisons in this report were basedon the t statistic. Statistical significance was determinedby calculating a t value for the difference between apair of means, or proportions, and comparing thisvalue with published tables of values at a certain levelof significance, called alpha level.The alpha level is ana priori statement of the probability of inferring thata difference exists when, in fact, it does not. Thealpha level used in this report is .05, based on a two-tailed test.The formula used to compute the t statis-tic was as follows:
,
where and are the estimates to be comparedand and are their corresponding standarderrors.
37
Appendix C: Technical Notes
6 The means for the 1992 assessment were 276 for prose, 271 fordocument, and 275 for quantitative.The standard deviations for the1992 assessment were 61 for prose, 61 for document, and 66 forquantitative.The standard deviations for the 2003 assessment were59 for prose, 57 for document, and 61 for quantitative.


39
toc
1CHAPTER ONE
Standard Errors for Tables and Figures
DAPPENDIX D

40
The Health Literacy of America’s Adults
Table D2-2. Estimates and standard errors for Figure 2-2. Average health literacy scores of adults, by gender:
2003
Gender Average
Men 242 (1.3)
Women 248 (1.5)
NOTE: Standard errors are in parentheses. Adults are defined as people 16 years of age and older living in households or prisons. Adults who could not be interviewed because of language spoken or cognitive or
mental disabilities (3 percent in 2003) are excluded from this table.
SOURCE: U.S. Department of Education, Institute of Education Sciences, National Center for Education Statistics, 2003 National Assessment of Adult Literacy.
Table D2-3. Estimates and standard errors for Figure 2-3. Percentage of adults in each health literacy level, by
gender: 2003
Gender Below Basic Basic Intermediate Proficient
Men 16 (0.6) 22 (0.4) 51 (0.7) 11 (0.5)
Women 12 (0.7) 21 (0.6) 55 (0.8) 12 (0.7)
NOTE: Detail may not sum to totals because of rounding. Standard errors are in parentheses. Adults are defined as people 16 years of age and older living in households or prisons. Adults who could not be inter-
viewed because of language spoken or cognitive or mental disabilities (3 percent in 2003) are excluded from this table.
SOURCE: U.S. Department of Education, Institute of Education Sciences, National Center for Education Statistics, 2003 National Assessment of Adult Literacy.
Table D2-4. Estimates and standard errors for Figure 2-4. Average health literacy scores of adults, by
race/ethnicity: 2003
Race/ethnicity Average
White 256 (1.4)
Black 216 (2.1)
Hispanic 197 (3.3)
Asian/Pacific Islander 255 (5.6)
American Indian/Alaska Native 227 (10.3)
Multiracial 238 (3.9)
NOTE: Standard errors are in parentheses. Adults are defined as people 16 years of age and older living in households or prisons. Adults who could not be interviewed because of language spoken or cognitive or
mental disabilities (3 percent in 2003) are excluded from this table. All adults of Hispanic origin are classified as Hispanic, regardless of race.The Asian/Pacific Islander category includes Native Hawaiians.
SOURCE: U.S. Department of Education, Institute of Education Sciences, National Center for Education Statistics, 2003 National Assessment of Adult Literacy.
Table D2-1. Estimates and standard errors for Figure 2-1. Percentage of adults in each health literacy level: 2003
Literacy level Percentage
Below Basic 14 (0.5)
Basic 22 (0.4)
Intermediate 53 (0.6)
Proficient 12 (0.5)
NOTE: Detail may not sum to totals because of rounding. Standard errors are in parentheses. Adults are defined as people 16 years of age and older living in households or prisons. Adults who could not be inter-
viewed because of language spoken or cognitive or mental disabilities (3 percent in 2003) are excluded from this table.
SOURCE: U.S. Department of Education, Institute of Education Sciences, National Center for Education Statistics, 2003 National Assessment of Adult Literacy.

41
Appendix D: Standard Errors for Tables and Figures
Table D2-5. Estimates and standard errors for Figure 2-5. Percentage of adults in each health literacy level, by
race/ethnicity: 2003
Race/ethnicity Below Basic Basic Intermediate Proficient
White 9 (0.6) 19 (0.7) 58 (0.9) 14 (0.9)
Black 24 (2.1) 34 (1.5) 41 (2.3) 2 (0.5)
Hispanic 41 (1.7) 25 (0.6) 31 (1.2) 4 (0.4)
Asian/Pacific Islander 13 (2.1) 18 (1.6) 52 (2.4) 18 (2.5)
American Indian/Alaska Native 25 (5.4) 23 (2.8) 45 (5.2) 7 (2.9)
Multiracial 9 (3.7) 28 (4.7) 59 (6.1) 3 (2.3)
NOTE: Detail may not sum to totals because of rounding. Standard errors are in parentheses. Adults are defined as people 16 years of age and older living in households or prisons. Adults who could not be inter-
viewed because of language spoken or cognitive or mental disabilities (3 percent in 2003) are excluded from this table. All adults of Hispanic origin are classified as Hispanic, regardless of race.The Asian/Pacific
Islander category includes Native Hawaiians.
SOURCE: U.S. Department of Education, Institute of Education Sciences, National Center for Education Statistics, 2003 National Assessment of Adult Literacy.
Table D2-6. Estimates and standard errors for Table 2-1. Average health literacy scores of adults, by language
spoken before starting school: 2003
Language spoken before starting school Average
English only 251 (1.2)
English and Spanish 232 (3.6)
English and other 244 (4.3)
Spanish 174 (4.2)
Other language 229 (6.4)
NOTE: Standard errors are in parentheses. Adults are defined as people 16 years of age and older living in households or prisons. Adults who could not be interviewed because of language spoken or cognitive or
mental disabilities (3 percent in 2003) are excluded from this table.The English and Spanish category includes adults who spoke languages in addition to both English and Spanish.The Spanish category includes
adults who spoke Spanish and additional non-English languages.
SOURCE: U.S. Department of Education, Institute of Education Sciences, National Center for Education Statistics, 2003 National Assessment of Adult Literacy.
Table D2-7. Estimates and standard errors for Figure 2-6. Average health literacy scores of adults, by age: 2003
Age Average
16–18 244 (3.6)
19–24 249 (2.5)
25–39 256 (1.6)
40–49 249 (1.9)
50–64 246 (2.1)
65+ 214 (2.0)
NOTE: Standard errors are in parentheses. Adults are defined as people 16 years of age and older living in households or prisons. Adults who could not be interviewed because of language spoken or cognitive or
mental disabilities (3 percent in 2003) are excluded from this table.
SOURCE: U.S. Department of Education, Institute of Education Sciences, National Center for Education Statistics, 2003 National Assessment of Adult Literacy.

42
The Health Literacy of America’s Adults
Table D2-8. Estimates and standard errors for Figure 2-7. Percentage of adults in each health literacy level, by
age: 2003
Age Below Basic Basic Intermediate Proficient
16–18 11 (2.0) 23 (2.3) 58 (2.9) 8 (2.0)
19–24 10 (1.2) 21 (1.2) 58 (1.7) 11 (1.4)
25–39 10 (0.6) 18 (0.6) 55 (0.9) 16 (0.9)
40–49 11 (0.9) 21 (0.9) 56 (1.2) 12 (1.0)
50–64 13 (0.9) 21 (0.7) 53 (1.1) 12 (0.9)
65+ 29 (1.4) 30 (0.8) 38 (1.3) 3 (0.5)
NOTE: Detail may not sum to totals because of rounding. Standard errors are in parentheses. Adults are defined as people 16 years of age and older living in households or prisons. Adults who could not be inter-
viewed because of language spoken or cognitive or mental disabilities (3 percent in 2003) are excluded from this table.
SOURCE: U.S. Department of Education, Institute of Education Sciences, National Center for Education Statistics, 2003 National Assessment of Adult Literacy.
Table D2-9. Estimates and standard errors for Figure 2-8. Average health literacy scores of adults, by highest
educational attainment: 2003
Educational attainment Average
Still in high school 241 (4.6)
Less than/some high school 184 (2.6)
GED/high school equivalency 232 (2.8)
High school graduate 232 (1.8)
Vocational/trade/business school 241 (2.9)
Some college 253 (1.6)
Associate’s/2-year degree 264 (2.3)
College graduate 280 (2.2)
Graduate studies/degree 287 (2.4)
NOTE: Standard errors are in parentheses. Adults are defined as people 16 years of age and older living in households or prisons. Adults who could not be interviewed because of language spoken or cognitive or
mental disabilities (3 percent in 2003) are excluded from this table.
SOURCE: U.S. Department of Education, Institute of Education Sciences, National Center for Education Statistics, 2003 National Assessment of Adult Literacy.

43
Appendix D: Standard Errors for Tables and Figures
Table D2-10. Estimates and standard errors for Table 2-2. Average health literacy scores of adults, by poverty
threshold: 2003
Poverty threshold Average
Below poverty threshold 205 (2.6)
100–125% of poverty threshold 222 (3.0)
126–150% of poverty threshold 224 (3.6)
151–175% of poverty threshold 231 (3.1)
Above 175% of poverty threshold 261 (1.2)
NOTE: Standard errors are in parentheses. Adults are defined as people 16 years of age and older living in households or prisons. Adults who could not be interviewed because of language spoken or cognitive or
mental disabilities (3 percent in 2003) are excluded from this table. Poverty thresholds are determined by the U.S. Census Bureau and are based on family income, family size, and the ages of family members.
Because adults provided their income in ranges rather than by precise dollar figures, adults could not be exactly matched to a federal poverty category.The categories shown in this table represent the best match-
es possible based on the categorical data.
SOURCE: U.S. Department of Education, Institute of Education Sciences, National Center for Education Statistics, 2003 National Assessment of Adult Literacy.
Table D2-11. Estimates and standard errors for Figure 2-9. Percentage of adults in each health literacy level, by
highest educational attainment: 2003
Educational attainment Below Basic Basic Intermediate Proficient
Still in high school 13 (2.7) 24 (2.5) 56 (3.5) 7 (2.2)
Less than/some high school 49 (1.6) 27 (0.8) 23 (1.2) 1 (0.2)
GED/high school equivalency 14 (2.4) 30 (2.8) 54 (3.6) 3 (1.2)
High school graduate 15 (1.4) 29 (1.4) 53 (1.9) 4 (0.7)
Vocational/trade/business school 12 (1.8) 25 (2.1) 57 (2.7) 7 (1.6)
Some college 5 (0.9) 20 (1.6) 67 (2.0) 8 (1.4)
Associate’s/2-year degree 4 (0.9) 15 (1.7) 66 (2.2) 15 (2.3)
College graduate 3 (0.5) 10 (0.9) 60 (1.8) 27 (2.2)
Graduate studies/degree 3 (0.5) 8 (0.9) 57 (2.0) 33 (2.4)
NOTE: Detail may not sum to totals because of rounding. Standard errors are in parentheses. Adults are defined as people 16 years of age and older living in households or prisons. Adults who could not be inter-
viewed because of language spoken or cognitive or mental disabilities (3 percent in 2003) are excluded from this table.
SOURCE: U.S. Department of Education, Institute of Education Sciences, National Center for Education Statistics, 2003 National Assessment of Adult Literacy.

44
The Health Literacy of America’s Adults
Table D3-3. Estimates and standard errors for Figure 3-3. Average health literacy scores of adults, by type of
health insurance coverage: 2003
Type of health insurance Average
Employer provided 259 (1.2)
Military 248 (4.3)
Privately purchased 243 (2.3)
Medicare 216 (1.9)
Medicaid 212 (2.7)
No insurance 220 (2.4)
NOTE: Standard errors are in parentheses. Adults are defined as people 16 years of age and older living in households. Adults who could not be interviewed because of language spoken or cognitive or mental dis-
abilities (3 percent in 2003) are excluded from this figure. Adults who reported they had more than one type of health insurance are included in each applicable category in this table.
SOURCE: U.S. Department of Education, Institute of Education Sciences, National Center for Education Statistics, 2003 National Assessment of Adult Literacy.
Table D3-2. Estimates and standard errors for Figure 3-2. Percentage of adults in each health literacy level, by
self-assessment of overall health: 2003
Self-assessment of overall health Below Basic Basic Intermediate Proficient
Excellent 8 (0.6) 17 (0.7) 57 (1.0) 19 (1.1)
Very good 9 (0.7) 19 (0.7) 59 (0.9) 13 (0.9)
Good 16 (1.1) 27 (0.9) 51 (1.3) 6 (0.7)
Fair 33 (1.7) 30 (1.0) 34 (1.6) 3 (0.5)
Poor 42 (2.3) 27 (1.3) 29 (1.8) 3 (0.6)
NOTE: Detail may not sum to totals because of rounding. Standard errors are in parentheses. Adults are defined as people 16 years of age and older living in households or prisons. Adults who could not be inter-
viewed because of language spoken or cognitive or mental disabilities (3 percent in 2003) are excluded from this table.
SOURCE: U.S. Department of Education, Institute of Education Sciences, National Center for Education Statistics, 2003 National Assessment of Adult Literacy.
Table D3-1. Estimates and standard errors for Figure 3-1. Average health literacy scores of adults, by
self-assessment of overall health: 2003
Self-assessment of overall health Average
Excellent 262 (1.8)
Very good 254 (1.4)
Good 234 (1.7)
Fair 207 (2.5)
Poor 196 (3.9)
NOTE: Standard errors are in parentheses. Adults are defined as people 16 years of age and older living in households or prisons. Adults who could not be interviewed because of language spoken or cognitive or
mental disabilities (3 percent in 2003) are excluded from this table.
SOURCE: U.S. Department of Education, Institute of Education Sciences, National Center for Education Statistics, 1992 National Adult Literacy Survey and 2003 National Assessment of Adult Literacy.

45
Appendix D: Standard Errors for Tables and Figures
Table D3-4. Estimates and standard errors for Figure 3-4. Percentage of adults in each health literacy level, by
type of health insurance coverage: 2003
Type of health insurance Below Basic Basic Intermediate Proficient
Employer provided 7 (0.5) 17 (0.6) 62 (0.9) 14 (0.9)
Military 12 (2.1) 21 (2.0) 56 (2.7) 11 (2.2)
Privately purchased 13 (1.2) 24 (1.2) 54 (1.6) 9 (1.2)
Medicare 27 (1.4) 30 (0.9) 40 (1.4) 3 (0.5)
Medicaid 30 (1.8) 30 (1.0) 38 (1.7) 3 (0.6)
No insurance 28 (1.3) 25 (0.6) 41 (1.1) 7 (0.5)
NOTE: Detail may not sum to totals because of rounding. Standard errors are in parentheses. Adults are defined as people 16 years of age and older living in households. Adults who could not be interviewed
because of language spoken or cognitive or mental disabilities (3 percent in 2003) are excluded from this figure. Adults who reported they had more than one type of health insurance are included in each applica-
ble category in this table.
SOURCE: U.S. Department of Education, Institute of Education Sciences, National Center for Education Statistics, 2003 National Assessment of Adult Literacy.
Table D3-5. Estimates and standard errors for Figure 3-5. Percentage of adults who got information about
health issues from printed and written media: newspapers, magazines, books or brochures, and
the Internet, by health literacy level: 2003
Sources and literacy level None A little Some A lot
Newspapers
Below Basic 37 (1.6) 22 (1.4) 29 (1.5) 12 (1.0)
Basic 24 (0.9) 27 (0.9) 35 (1.0) 15 (0.8)
Intermediate 19 (0.7) 31 (0.7) 36 (0.8) 14 (0.5)
Proficient 20 (1.3) 38 (1.9) 32 (1.7) 10 (1.2)
Magazines
Below Basic 41 (1.7) 23 (1.4) 27 (1.5) 10 (1.0)
Basic 22 (0.8) 25 (0.9) 37 (1.1) 17 (0.9)
Intermediate 14 (0.6) 28 (0.7) 41 (0.8) 18 (0.7)
Proficient 12 (1.1) 35 (1.9) 40 (2.1) 12 (1.5)
Books or brochures
Below Basic 41 (1.6) 21 (1.3) 28 (1.5) 11 (0.9)
Basic 20 (0.8) 25 (0.9) 39 (1.1) 16 (0.8)
Intermediate 13 (0.5) 28 (0.7) 41 (0.8) 18 (0.6)
Proficient 11 (1.0) 35 (2.0) 36 (2.1) 18 (1.5)
Internet
Below Basic 80 (1.5) 5 (0.9) 7 (1.1) 7 (0.8)
Basic 58 (1.5) 12 (1.0) 16 (1.2) 14 (0.8)
Intermediate 33 (1.1) 19 (0.7) 27 (0.9) 21 (0.6)
Proficient 15 (1.5) 22 (2.4) 37 (2.7) 26 (2.1)
NOTE: Detail may not sum to totals because of rounding. Standard errors are in parentheses. Adults are defined as people 16 years of age and older living in households or prisons. Adults who could not be inter-
viewed because of language spoken or cognitive or mental disabilities (3 percent in 2003) are excluded from this table. Prison inmates are not included in the Internet category because they do not have access to
the Internet.
SOURCE: U.S. Department of Education, Institute of Education Sciences, National Center for Education Statistics, 2003 National Assessment of Adult Literacy.

46
The Health Literacy of America’s Adults
Table D3-7. Estimates and standard errors for Figure 3-7. Percentage of adults who got information about
health issues from personal contacts: family, friends, or coworkers; or health care professionals, by
health literacy level: 2003
Sources and literacy level None A little Some A lot
Family, friends, or coworkers
Below Basic 24 (1.4) 23 (1.4) 35 (1.7) 19 (1.3)
Basic 15 (0.7) 25 (0.9) 40 (1.0) 20 (0.8)
Intermediate 9 (0.4) 28 (0.7) 44 (0.8) 19 (0.6)
Proficient 5 (0.6) 31 (2.0) 48 (2.0) 17 (1.4)
Health care professionals
Below Basic 18 (1.1) 17 (1.2) 29 (1.6) 36 (1.6)
Basic 11 (0.5) 19 (0.8) 33 (1.1) 37 (1.1)
Intermediate 8 (0.4) 21 (0.6) 37 (0.8) 34 (0.9)
Proficient 8 (0.7) 23 (1.7) 39 (2.1) 30 (1.7)
NOTE: Detail may not sum to totals because of rounding. Standard errors are in parentheses. Adults are defined as people 16 years of age and older living in households or prisons. Adults who could not be inter-
viewed because of language spoken or cognitive or mental disabilities (3 percent in 2003) are excluded from this table. Adults living in households were asked about getting information from “family members,
friends, or coworkers”; prison inmates were asked about getting information from “family members, friends, other inmates, or staff.”
SOURCE: U.S. Department of Education, Institute of Education Sciences, National Center for Education Statistics, 2003 National Assessment of Adult Literacy.
Table D3-6. Estimates and standard errors for Figure 3-6. Percentage of adults who got information about
health issues from nonprint media: radio and television, by health literacy level: 2003
Literacy level None A little Some A lot
Below Basic 14 (0.9) 19 (1.3) 34 (1.7) 33 (1.8)
Basic 8 (0.4) 21 (0.9) 40 (1.1) 31 (1.1)
Intermediate 7 (0.3) 24 (0.7) 44 (0.8) 25 (0.8)
Proficient 9 (0.8) 30 (1.8) 43 (2.0) 17 (1.6)
NOTE: Detail may not sum to totals because of rounding. Standard errors are in parentheses. Adults are defined as people 16 years of age and older living in households or prisons. Adults who could not be inter-
viewed because of language spoken or cognitive or mental disabilities (3 percent in 2003) are excluded from this table.
SOURCE: U.S. Department of Education, Institute of Education Sciences, National Center for Education Statistics, 1992 National Adult Literacy Survey and 2003 National Assessment of Adult Literacy.

Additional Analyses
47
EAPPENDIX E
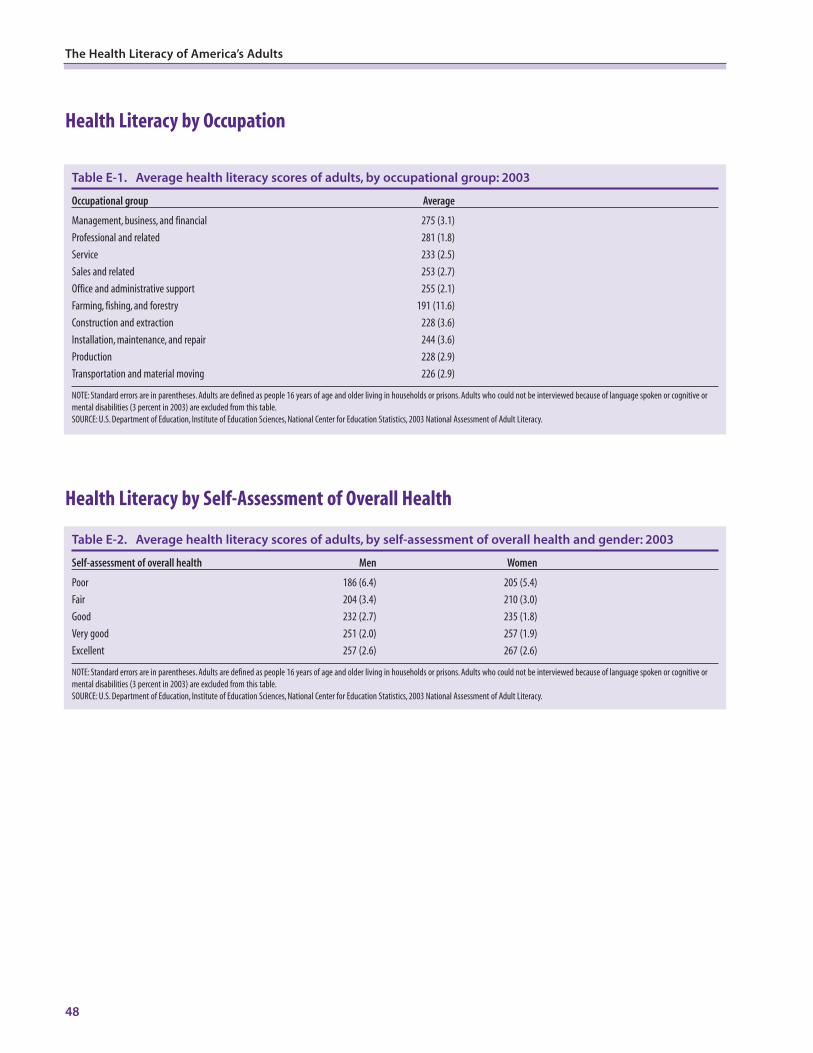
Health Literacy by Occupation
Health Literacy by Self-Assessment of Overall Health
48
The Health Literacy of America’s Adults
Table E-1. Average health literacy scores of adults, by occupational group: 2003
Occupational group Average
Management, business, and financial 275 (3.1)
Professional and related 281 (1.8)
Service 233 (2.5)
Sales and related 253 (2.7)
Office and administrative support 255 (2.1)
Farming, fishing, and forestry 191 (11.6)
Construction and extraction 228 (3.6)
Installation, maintenance, and repair 244 (3.6)
Production 228 (2.9)
Transportation and material moving 226 (2.9)
NOTE: Standard errors are in parentheses. Adults are defined as people 16 years of age and older living in households or prisons. Adults who could not be interviewed because of language spoken or cognitive or
mental disabilities (3 percent in 2003) are excluded from this table.
SOURCE: U.S. Department of Education, Institute of Education Sciences, National Center for Education Statistics, 2003 National Assessment of Adult Literacy.
Table E-2. Average health literacy scores of adults, by self-assessment of overall health and gender: 2003
Self-assessment of overall health Men Women
Poor 186 (6.4) 205 (5.4)
Fair 204 (3.4) 210 (3.0)
Good 232 (2.7) 235 (1.8)
Very good 251 (2.0) 257 (1.9)
Excellent 257 (2.6) 267 (2.6)
NOTE: Standard errors are in parentheses. Adults are defined as people 16 years of age and older living in households or prisons. Adults who could not be interviewed because of language spoken or cognitive or
mental disabilities (3 percent in 2003) are excluded from this table.
SOURCE: U.S. Department of Education, Institute of Education Sciences, National Center for Education Statistics, 2003 National Assessment of Adult Literacy.

Table E-4. Average health literacy scores of adults, by self-assessment of overall health and age: 2003
Self-assessment of overall health 16–24 25–39 40–49 50–64 65+
Poor — 227 (14.2) 189 (7.4) 201 (7.3) 179 (8.6)
Fair 226 (8.1) 207 (6.0) 214 (6.0) 215 (4.8) 192 (3.8)
Good 235 (4.8) 243 (2.8) 238 (3.1) 238 (3.0) 213 (3.2)
Very good 252 (3.0) 262 (2.9) 257 (2.7) 255 (3.2) 232 (4.0)
Excellent 252 (3.7) 268 (2.8) 266 (3.8) 273 (4.0) 231 (6.4)
—Not available due to small sample size.
NOTE: Standard errors are in parentheses. Adults are defined as people 16 years of age and older living in households or prisons. Adults who could not be interviewed because of language spoken or cognitive or
mental disabilities (3 percent in 2003) are excluded from this table.
SOURCE: U.S. Department of Education, Institute of Education Sciences, National Center for Education Statistics, 2003 National Assessment of Adult Literacy.
Table E-5. Average health literacy scores of adults, by self-assessment of overall health and highest educational
attainment: 2003
Less than/ High school graduate/GED/ College graduate/Self-assessment of overall health some high school high school equivalency At least some college graduate studies/degree
Poor 155 (5.6) 207 (6.3) 234 (9.6) 217 (22.8)
Fair 168 (4.3) 211 (3.0) 233 (4.4) 256 (6.5)
Good 185 (3.9) 226 (2.3) 246 (2.6) 273 (3.9)
Very good 202 (3.4) 242 (2.4) 261 (2.2) 285 (3.4)
Excellent 189 (3.6) 241 (3.8) 262 (2.3) 291 (2.9)
NOTE: Standard errors are in parentheses. Adults are defined as people 16 years of age and older living in households or prisons. Adults who could not be interviewed because of language spoken or cognitive or
mental disabilities (3 percent in 2003) are excluded from this table.
SOURCE: U.S. Department of Education, Institute of Education Sciences, National Center for Education Statistics, 2003 National Assessment of Adult Literacy.
49
Appendix E: Additional Analyses
Table E-3. Average health literacy scores of adults, by self-assessment of overall health and race/ethnicity: 2003
Self-assessment of overall health White Black Hispanic Other
Poor 206 (5.2) 175 (6.6) 157 (9.2) 179 (17.2)
Fair 219 (3.0) 193 (4.1) 155 (6.4) 210 (5.4)
Good 242 (2.1) 216 (2.6) 187 (5.1) 244 (5.8)
Very good 264 (1.7) 225 (2.6) 211 (4.1) 254 (7.8)
Excellent 274 (2.1) 223 (3.2) 212 (4.2) 259 (8.5)
NOTE: Standard errors are in parentheses. Adults are defined as people 16 years of age and older living in households or prisons. Adults who could not be interviewed because of language spoken or cognitive or
mental disabilities (3 percent in 2003) are excluded from this table.The “Other” category includes Asians, Pacific Islanders, Native Hawaiians, American Indians, Alaska Natives, and multiracial adults. All adults of
Hispanic origin are classified as Hispanic, regardless of race.
SOURCE: U.S. Department of Education, Institute of Education Sciences, National Center for Education Statistics, 2003 National Assessment of Adult Literacy.

Health Literacy by Health Insurance Status
50
The Health Literacy of America’s Adults
Table E-6. Average health literacy scores of adults, by type of health insurance coverage and gender: 2003
Type of health insurance Men Women
Employer provided 255 (1.4) 262 (1.7)
Military 243 (5.0) 258 (5.3)
Privately purchased 244 (4.0) 241 (2.6)
Medicare 215 (3.1) 217 (2.3)
Medicaid 201 (5.1) 217 (2.7)
No insurance 216 (3.1) 224 (3.1)
NOTE: Standard errors are in parentheses. Adults are defined as people 16 years of age and older living in households. Adults who could not be interviewed because of language spoken or cognitive or mental dis-
abilities (3 percent in 2003) are excluded from this table. Adults who reported they had more than one type of health insurance are included in each applicable category in this table.
SOURCE: U.S. Department of Education, Institute of Education Sciences, National Center for Education Statistics, 2003 National Assessment of Adult Literacy.
Table E-7. Average health literacy scores of adults, by type of health insurance coverage and race/ethnicity:
2003
Type of health insurance White Black Hispanic Other
Employer provided 266 (1.4) 226 (2.5) 229 (2.6) 258 (4.4)
Military 255 (5.1) 224 (6.8) 225 (10.1) —
Privately purchased 246 (2.4) 212 (4.3) 224 (8.8) 243 (9.0)
Medicare 222 (2.2) 178 (5.3) 161 (7.6) —
Medicaid 224 (4.4) 202 (3.1) 181 (4.7) 228 (10.2)
No insurance 241 (2.5) 212 (2.8) 170 (5.2) 229 (10.6)
—Not available due to small sample size.
NOTE: Standard errors are in parentheses. Adults are defined as people 16 years of age and older living in households. Adults who could not be interviewed because of language spoken or cognitive or mental dis-
abilities (3 percent in 2003) are excluded from this table. All adults of Hispanic origin are classified as Hispanic, regardless of race. Adults who reported they had more than one type of health insurance are includ-
ed in each applicable category in this table.
SOURCE: U.S. Department of Education, Institute of Education Sciences, National Center for Education Statistics, 2003 National Assessment of Adult Literacy.
Table E-8. Average health literacy scores of adults, by type of health insurance coverage and age: 2003
Type of health insurance 16–24 25–39 40–49 50–64 65+
Employer provided 258 (3.1) 269 (1.7) 259 (2.0) 257 (2.3) 231 (3.3)
Military 262 (11.9) 277 (5.1) 271 (12.5) 240 (6.1) 224 (8.2)
Privately purchased 261 (8.2) 266 (6.5) 263 (8.1) 252 (4.1) 219 (3.4)
Medicare — 239 (11.1) 220 (6.4) 214 (6.5) 216 (2.1)
Medicaid 224 (4.2) 229 (4.0) 201 (5.6) 192 (5.8) 185 (8.0)
No insurance 227 (3.9) 221 (3.1) 224 (4.9) 207 (5.1) 169 (9.5)
—Not available due to small sample size.
NOTE: Standard errors are in parentheses. Adults are defined as people 16 years of age and older living in households. Adults who could not be interviewed because of language spoken or cognitive or mental dis-
abilities (3 percent in 2003) are excluded from this table. Adults who reported they had more than one type of health insurance are included in each applicable category in this table.
SOURCE: U.S. Department of Education, Institute of Education Sciences, National Center for Education Statistics, 2003 National Assessment of Adult Literacy.

Health Literacy by Sources of Health Information
Printed and Written Information
Table E-10. Average health literacy scores of adults who got information about health issues from newspapers,
magazines, and books or brochures, by gender: 2003
Source and amount of information Men Women
Newspapers
None 228 (3.2) 232 (2.5)
A little 249 (2.3) 258 (2.4)
Some 245 (1.6) 248 (1.8)
A lot 241 (3.3) 245 (2.3)
Magazines
None 219 (2.9) 214 (3.6)
A little 250 (2.3) 254 (2.7)
Some 249 (2.2) 252 (1.7)
A lot 243 (2.7) 251 (1.9)
Books or brochures
None 218 (3.0) 208 (3.7)
A little 252 (2.0) 253 (2.8)
Some 245 (1.8) 251 (1.9)
A lot 246 (2.5) 255 (2.2)
NOTE: Standard errors are in parentheses. Adults are defined as people 16 years of age and older living in households or prisons. Adults who could not be interviewed because of language spoken or cognitive or
mental disabilities (3 percent in 2003) are excluded from this table.
SOURCE: U.S. Department of Education, Institute of Education Sciences, National Center for Education Statistics, 2003 National Assessment of Adult Literacy.
51
Appendix E: Additional Analyses
Table E-9. Average health literacy scores of adults, by type of health insurance coverage and highest
educational attainment: 2003
Less than/ High school graduate/GED/ College graduate/Type of health insurance some high school high school equivalency At least some college graduate studies/degree
Employer provided 205 (3.5) 241 (2.0) 261 (1.5) 288 (1.9)
Military 206 (13.5) 233 (8.5) 257 (6.7) 272 (9.3)
Privately purchased 193 (6.2) 228 (3.1) 253 (4.0) 272 (4.6)
Medicare 171 (4.5) 215 (2.5) 229 (3.4) 251 (4.5)
Medicaid 177 (4.9) 221 (3.5) 237 (4.0) 247 (13.4)
No insurance 171 (4.5) 223 (2.9) 246 (3.0) 262 (7.4)
NOTE: Standard errors are in parentheses. Adults are defined as people 16 years of age and older living in households. Adults who could not be interviewed because of language spoken or cognitive or mental dis-
abilities (3 percent in 2003) are excluded from this table. Adults who reported they had more than one type of health insurance are included in each applicable category in this table.
SOURCE: U.S. Department of Education, Institute of Education Sciences, National Center for Education Statistics, 2003 National Assessment of Adult Literacy.

Table E-12. Average health literacy scores of adults who got information about health issues from newspapers,
magazines, and books or brochures, by race/ethnicity: 2003
Source and amount of information White Black Hispanic Other
Newspapers
None 246 (2.4) 202 (3.8) 172 (5.1) 242 (8.1)
A little 264 (2.0) 222 (2.9) 203 (5.4) 248 (6.5)
Some 255 (1.8) 220 (2.1) 213 (2.8) 249 (7.5)
A lot 253 (2.6) 216 (4.1) 207 (5.9) 240 (9.1)
Magazines
None 234 (2.8) 193 (3.5) 163 (5.7) 218 (12.5)
A little 262 (2.2) 219 (3.1) 197 (4.9) 247 (6.9)
Some 259 (1.8) 222 (2.3) 215 (3.3) 255 (6.0)
A lot 258 (2.2) 223 (3.6) 221 (5.6) 241 (8.2)
Books or brochures
None 231 (3.0) 188 (5.9) 159 (5.6) 225 (15.0)
A little 262 (2.0) 219 (3.0) 202 (5.8) 245 (5.8)
Some 257 (1.9) 221 (2.5) 212 (3.4) 249 (7.3)
A lot 262 (2.3) 222 (3.6) 225 (4.2) 257 (7.5)
NOTE: Standard errors are in parentheses. Adults are defined as people 16 years of age and older living in households or prisons. Adults who could not be interviewed because of language spoken or cognitive or
mental disabilities (3 percent in 2003) are excluded from this table.The “Other” category includes Asians, Pacific Islanders, Native Hawaiians, American Indians, Alaska Natives, and multiracial adults. All adults of
Hispanic origin are classified as Hispanic, regardless of race.
SOURCE: U.S. Department of Education, Institute of Education Sciences, National Center for Education Statistics, 2003 National Assessment of Adult Literacy.
52
The Health Literacy of America’s Adults
Table E-11. Average health literacy scores of adults who got information about health issues from the Internet,
by gender: 2003
Amount of information from the Internet Men Women
None 213 (1.8) 220 (1.9)
A little 259 (2.9) 267 (2.8)
Some 265 (2.4) 266 (2.0)
A lot 264 (2.8) 262 (2.1)
NOTE: Standard errors are in parentheses. Adults are defined as people 16 years of age and older living in households or prisons. Adults who could not be interviewed because of language spoken or cognitive or
mental disabilities (3 percent in 2003) are excluded from this table. Prison inmates are not included in the Internet category because they do not have access to the Internet.
SOURCE: U.S. Department of Education, Institute of Education Sciences, National Center for Education Statistics, 2003 National Assessment of Adult Literacy.

53
Appendix E: Additional Analyses
Table E-13. Average health literacy scores of adults who got information about health issues from the Internet,
by race/ethnicity: 2003
Amount of information from the Internet White Black Hispanic Other
None 229 (1.5) 198 (2.7) 162 (4.0) 221 (9.4)
A little 270 (2.6) 230 (3.9) 239 (5.2) 255 (8.9)
Some 273 (2.1) 232 (3.3) 234 (3.7) 268 (7.9)
A lot 272 (2.1) 234 (3.0) 235 (4.0) 249 (6.3)
NOTE: Standard errors are in parentheses. Adults are defined as people 16 years of age and older living in households or prisons. Adults who could not be interviewed because of language spoken or cognitive or
mental disabilities (3 percent in 2003) are excluded from this table.The “Other” category includes Asians, Pacific Islanders, Native Hawaiians, American Indians, Alaska Natives, and multiracial adults. All adults of
Hispanic origin are classified as Hispanic, regardless of race. Prison inmates are not included in the Internet category because they do not have access to the Internet.
SOURCE: U.S. Department of Education, Institute of Education Sciences, National Center for Education Statistics, 2003 National Assessment of Adult Literacy.
Table E-14. Average health literacy scores of adults who got information about health issues from newspapers,
magazines, and books or brochures, by age: 2003
Source and amount of information 16–24 25–39 40–49 50–64 65+
Newspapers
None 241 (4.2) 245 (3.0) 229 (4.4) 217 (3.6) 182 (5.7)
A little 256 (3.7) 267 (2.5) 260 (3.5) 250 (3.5) 208 (3.8)
Some 243 (3.2) 256 (2.4) 251 (2.6) 252 (3.5) 222 (2.7)
A lot 243 (5.8) 242 (4.2) 247 (4.3) 254 (4.2) 227 (4.9)
Magazines
None 236 (4.5) 232 (3.9) 218 (4.3) 207 (4.8) 171 (4.5)
A little 247 (3.4) 263 (2.9) 260 (3.6) 251 (4.6) 213 (4.6)
Some 253 (3.6) 259 (2.2) 254 (2.6) 253 (3.1) 227 (2.6)
A lot 252 (3.5) 261 (3.6) 248 (3.7) 251 (4.1) 223 (3.6)
Books or brochures
None 236 (4.6) 222 (3.4) 221 (6.0) 198 (4.8) 172 (5.1)
A little 254 (4.0) 265 (3.1) 248 (4.0) 253 (4.6) 217 (4.0)
Some 246 (3.5) 258 (2.4) 254 (2.9) 252 (2.7) 223 (2.3)
A lot 253 (5.7) 266 (3.4) 255 (4.6) 249 (3.7) 228 (4.3)
NOTE: Standard errors are in parentheses. Adults are defined as people 16 years of age and older living in households or prisons. Adults who could not be interviewed because of language spoken or cognitive or
mental disabilities (3 percent in 2003) are excluded from this table.
SOURCE: U.S. Department of Education, Institute of Education Sciences, National Center for Education Statistics, 2003 National Assessment of Adult Literacy.
54
The Health Literacy of America’s Adults
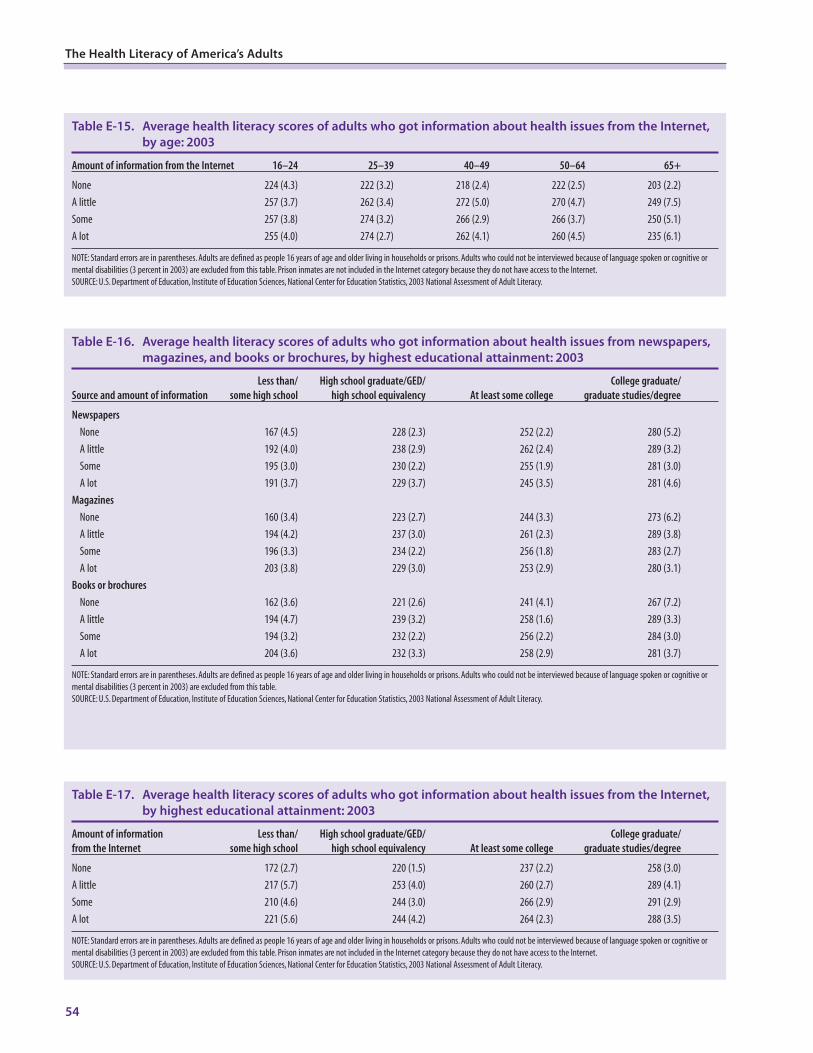
Table E-16. Average health literacy scores of adults who got information about health issues from newspapers,
magazines, and books or brochures, by highest educational attainment: 2003
Less than/ High school graduate/GED/ College graduate/Source and amount of information some high school high school equivalency At least some college graduate studies/degree
Newspapers
None 167 (4.5) 228 (2.3) 252 (2.2) 280 (5.2)
A little 192 (4.0) 238 (2.9) 262 (2.4) 289 (3.2)
Some 195 (3.0) 230 (2.2) 255 (1.9) 281 (3.0)
A lot 191 (3.7) 229 (3.7) 245 (3.5) 281 (4.6)
Magazines
None 160 (3.4) 223 (2.7) 244 (3.3) 273 (6.2)
A little 194 (4.2) 237 (3.0) 261 (2.3) 289 (3.8)
Some 196 (3.3) 234 (2.2) 256 (1.8) 283 (2.7)
A lot 203 (3.8) 229 (3.0) 253 (2.9) 280 (3.1)
Books or brochures
None 162 (3.6) 221 (2.6) 241 (4.1) 267 (7.2)
A little 194 (4.7) 239 (3.2) 258 (1.6) 289 (3.3)
Some 194 (3.2) 232 (2.2) 256 (2.2) 284 (3.0)
A lot 204 (3.6) 232 (3.3) 258 (2.9) 281 (3.7)
NOTE: Standard errors are in parentheses. Adults are defined as people 16 years of age and older living in households or prisons. Adults who could not be interviewed because of language spoken or cognitive or
mental disabilities (3 percent in 2003) are excluded from this table.
SOURCE: U.S. Department of Education, Institute of Education Sciences, National Center for Education Statistics, 2003 National Assessment of Adult Literacy.
Table E-15. Average health literacy scores of adults who got information about health issues from the Internet,
by age: 2003
Amount of information from the Internet 16–24 25–39 40–49 50–64 65+
None 224 (4.3) 222 (3.2) 218 (2.4) 222 (2.5) 203 (2.2)
A little 257 (3.7) 262 (3.4) 272 (5.0) 270 (4.7) 249 (7.5)
Some 257 (3.8) 274 (3.2) 266 (2.9) 266 (3.7) 250 (5.1)
A lot 255 (4.0) 274 (2.7) 262 (4.1) 260 (4.5) 235 (6.1)
NOTE: Standard errors are in parentheses. Adults are defined as people 16 years of age and older living in households or prisons. Adults who could not be interviewed because of language spoken or cognitive or
mental disabilities (3 percent in 2003) are excluded from this table. Prison inmates are not included in the Internet category because they do not have access to the Internet.
SOURCE: U.S. Department of Education, Institute of Education Sciences, National Center for Education Statistics, 2003 National Assessment of Adult Literacy.
Table E-17. Average health literacy scores of adults who got information about health issues from the Internet,
by highest educational attainment: 2003
Amount of information Less than/ High school graduate/GED/ College graduate/from the Internet some high school high school equivalency At least some college graduate studies/degree
None 172 (2.7) 220 (1.5) 237 (2.2) 258 (3.0)
A little 217 (5.7) 253 (4.0) 260 (2.7) 289 (4.1)
Some 210 (4.6) 244 (3.0) 266 (2.9) 291 (2.9)
A lot 221 (5.6) 244 (4.2) 264 (2.3) 288 (3.5)
NOTE: Standard errors are in parentheses. Adults are defined as people 16 years of age and older living in households or prisons. Adults who could not be interviewed because of language spoken or cognitive or
mental disabilities (3 percent in 2003) are excluded from this table. Prison inmates are not included in the Internet category because they do not have access to the Internet.
SOURCE: U.S. Department of Education, Institute of Education Sciences, National Center for Education Statistics, 2003 National Assessment of Adult Literacy.

Nonprint Media
55
Appendix E: Additional Analyses
Table E-18. Average health literacy scores of adults who got information about health issues from radio and
television, by gender: 2003
Amount of information from radio and television Men Women
None 237 (4.6) 234 (4.6)
A little 249 (2.5) 256 (2.8)
Some 247 (1.8) 251 (1.9)
A lot 229 (2.3) 239 (2.8)
NOTE: Standard errors are in parentheses. Adults are defined as people 16 years of age and older living in households or prisons. Adults who could not be interviewed because of language spoken or cognitive or
mental disabilities (3 percent in 2003) are excluded from this table.
SOURCE: U.S. Department of Education, Institute of Education Sciences, National Center for Education Statistics, 2003 National Assessment of Adult Literacy.
Table E-19. Average health literacy scores of adults who got information about health issues from radio and
television, by race/ethnicity: 2003
Amount of information from radio and television White Black Hispanic Other
None 249 (3.8) 202 (5.4) 195 (6.3) 223 (11.9)
A little 262 (2.2) 220 (3.8) 203 (5.8) 243 (7.3)
Some 258 (1.8) 219 (2.5) 202 (4.1) 257 (6.4)
A lot 247 (2.0) 214 (3.5) 187 (4.9) 239 (5.9)
NOTE: Standard errors are in parentheses. Adults are defined as people 16 years of age and older living in households or prisons. Adults who could not be interviewed because of language spoken or cognitive or
mental disabilities (3 percent in 2003) are excluded from this table.The “Other” category includes Asians, Pacific Islanders, Native Hawaiians, American Indians, Alaska Natives, and multiracial adults. All adults of
Hispanic origin are classified as Hispanic, regardless of race.
SOURCE: U.S. Department of Education, Institute of Education Sciences, National Center for Education Statistics, 2003 National Assessment of Adult Literacy.
Table E-20. Average health literacy scores of adults who got information about health issues from radio and
television, by age: 2003
Amount of information from radio and television 16–24 25–39 40–49 50–64 65+
None 246 (6.4) 252 (6.3) 245 (6.2) 223 (5.9) 192 (6.9)
A little 248 (4.4) 265 (3.9) 258 (3.6) 254 (4.1) 223 (4.7)
Some 252 (3.6) 257 (2.3) 253 (2.9) 253 (2.7) 219 (2.7)
A lot 240 (3.7) 246 (3.0) 237 (3.3) 231 (3.0) 204 (3.5)
NOTE: Standard errors are in parentheses. Adults are defined as people 16 years of age and older living in households or prisons. Adults who could not be interviewed because of language spoken or cognitive or
mental disabilities (3 percent in 2003) are excluded from this table.
SOURCE: U.S. Department of Education, Institute of Education Sciences, National Center for Education Statistics, 2003 National Assessment of Adult Literacy.

Personal Contacts
56
The Health Literacy of America’s Adults
Table E-21. Average health literacy scores of adults who got information about health issues from radio and
television, by highest educational attainment: 2003
Amount of information Less than/ High school graduate/GED/ College graduate/from radio and television some high school high school equivalency At least some college graduate studies/degree
None 172 (5.5) 219 (5.2) 256 (4.4) 282 (7.7)
A little 186 (5.1) 238 (3.0) 258 (2.6) 289 (2.9)
Some 187 (3.3) 235 (2.1) 257 (1.9) 283 (2.7)
A lot 183 (3.4) 227 (2.9) 250 (2.9) 277 (4.8)
NOTE: Standard errors are in parentheses. Adults are defined as people 16 years of age and older living in households or prisons. Adults who could not be interviewed because of language spoken or cognitive or
mental disabilities (3 percent in 2003) are excluded from this table.
SOURCE: U.S. Department of Education, Institute of Education Sciences, National Center for Education Statistics, 2003 National Assessment of Adult Literacy.
Table E-22. Average health literacy scores of adults who got information about health issues from family,
friends, or coworkers, by gender: 2003
Amount of information from family, friends, or coworkers Men Women
None 215 (3.3) 217 (3.0)
A little 249 (2.2) 251 (2.6)
Some 246 (2.0) 253 (1.8)
A lot 240 (2.5) 245 (2.3)
NOTE: Standard errors are in parentheses. Adults are defined as people 16 years of age and older living in households or prisons. Adults who could not be interviewed because of language spoken or cognitive or
mental disabilities (3 percent in 2003) are excluded from this table. Adults living in households were asked about getting information from “family members, friends, or coworkers”; prison inmates were asked
about getting information from “family members, friends, other inmates, or staff.”
SOURCE: U.S. Department of Education, Institute of Education Sciences, National Center for Education Statistics, 2003 National Assessment of Adult Literacy.
Table E-23. Average health literacy scores of adults who got information about health issues from health care
professionals, by gender: 2003
Amount of information from health care professionals Men Women
None 228 (3.6) 223 (4.4)
A little 249 (2.5) 252 (2.9)
Some 248 (2.3) 251 (2.3)
A lot 236 (1.7) 245 (1.8)
NOTE: Standard errors are in parentheses. Adults are defined as people 16 years of age and older living in households or prisons. Adults who could not be interviewed because of language spoken or cognitive or
mental disabilities (3 percent in 2003) are excluded from this table.
SOURCE: U.S. Department of Education, Institute of Education Sciences, National Center for Education Statistics, 2003 National Assessment of Adult Literacy.

57
Appendix E: Additional Analyses
Table E-24. Average health literacy scores of adults who got information about health issues from family,
friends, or coworkers, by race/ethnicity: 2003
Amount of information from family, friends, or coworkers White Black Hispanic Other
None 229 (2.8) 200 (4.9) 170 (5.3) 219 (11.6)
A little 260 (2.5) 224 (3.2) 201 (4.5) 243 (7.3)
Some 259 (1.6) 220 (3.1) 203 (4.3) 257 (7.1)
A lot 255 (2.3) 212 (2.7) 198 (6.2) 244 (6.5)
NOTE: Standard errors are in parentheses. Adults are defined as people 16 years of age and older living in households or prisons. Adults who could not be interviewed because of language spoken or cognitive or
mental disabilities (3 percent in 2003) are excluded from this table.”The “Other” category includes Asians, Pacific Islanders, Native Hawaiians, American Indians, Alaska Natives, and multiracial adults. All adults of
Hispanic origin are classified as Hispanic, regardless of race. Adults living in households were asked about getting information from “family members, friends, or coworkers”; prison inmates were asked about get-
ting information from “family members, friends, other inmates, or staff.”
SOURCE: U.S. Department of Education, Institute of Education Sciences, National Center for Education Statistics, 2003 National Assessment of Adult Literacy.
Table E-25. Average health literacy scores of adults who got information about health issues from health care
professionals, by race/ethnicity: 2003
Amount of information fromhealth care professionals White Black Hispanic Other
None 246 (3.4) 208 (3.2) 172 (5.7) 231 (10.2)
A little 260 (2.2) 221 (3.9) 196 (4.7) 252 (10.0)
Some 259 (2.1) 220 (2.7) 199 (4.1) 252 (7.7)
A lot 252 (1.6) 215 (2.9) 209 (5.0) 240 (5.2)
NOTE: Standard errors are in parentheses. Adults are defined as people 16 years of age and older living in households or prisons. Adults who could not be interviewed because of language spoken or cognitive or
mental disabilities (3 percent in 2003) are excluded from this table.The “Other” category includes Asians, Pacific Islanders, Native Hawaiians, American Indians, Alaska Natives, and multiracial adults. All adults of
Hispanic origin are classified as Hispanic, regardless of race.
SOURCE: U.S. Department of Education, Institute of Education Sciences, National Center for Education Statistics, 2003 National Assessment of Adult Literacy.
Table E-26. Average health literacy scores of adults who got information about health issues from family,
friends, or coworkers, by age: 2003
Amount of information from family, friends, or coworkers 16–24 25–39 40–49 50–64 65+
None 218 (5.5) 227 (5.6) 229 (5.4) 219 (4.3) 197 (3.4)
A little 252 (4.6) 258 (3.7) 255 (3.3) 252 (3.4) 222 (4.5)
Some 251 (3.0) 261 (2.3) 252 (2.6) 250 (3.2) 219 (3.0)
A lot 246 (3.3) 253 (3.3) 239 (4.6) 242 (4.4) 209 (5.1)
NOTE: Standard errors are in parentheses. Adults are defined as people 16 years of age and older living in households or prisons. Adults who could not be interviewed because of language spoken or cognitive or
mental disabilities (3 percent in 2003) are excluded from this table. Adults living in households were asked about getting information from “family members, friends, or coworkers”; prison inmates were asked
about getting information from “family members, friends, other inmates, or staff.”
SOURCE: U.S. Department of Education, Institute of Education Sciences, National Center for Education Statistics, 2003 National Assessment of Adult Literacy.

58
The Health Literacy of America’s Adults
Table E-27. Average health literacy scores of adults who got information about health issues from health care
professionals, by age: 2003
Amount of information from health care professionals 16–24 25–39 40–49 50–64 65+
None 239 (5.1) 230 (4.5) 230 (5.7) 221 (6.4) 178 (6.6)
A little 255 (4.2) 254 (2.9) 251 (3.7) 256 (4.8) 213 (5.8)
Some 249 (4.1) 263 (2.9) 253 (3.0) 253 (3.8) 218 (3.0)
A lot 242 (3.0) 258 (2.3) 247 (2.5) 238 (3.3) 216 (2.3)
NOTE: Standard errors are in parentheses. Adults are defined as people 16 years of age and older living in households or prisons. Adults who could not be interviewed because of language spoken or cognitive or
mental disabilities (3 percent in 2003) are excluded from this table.
SOURCE: U.S. Department of Education, Institute of Education Sciences, National Center for Education Statistics, 2003 National Assessment of Adult Literacy.
Table E-28. Average health literacy scores of adults who got information about health issues from family,
friends, or coworkers, by highest educational attainment: 2003
Amount of information from Less than/ High school graduate/GED/ College graduate/family, friends, or coworkers some high school high school equivalency At least some college graduate studies/degree
None 166 (3.7) 214 (3.1) 239 (4.2) 255 (4.7)
A little 184 (4.0) 235 (2.5) 258 (2.2) 288 (3.8)
Some 190 (3.8) 235 (2.6) 257 (1.8) 287 (2.6)
A lot 188 (4.8) 233 (2.7) 254 (3.0) 282 (4.2)
NOTE: Standard errors are in parentheses. Adults are defined as people 16 years of age and older living in households or prisons. Adults who could not be interviewed because of language spoken or cognitive or
mental disabilities (3 percent in 2003) are excluded from this table. Adults living in households were asked about getting information from “family members, friends, or coworkers;” prison inmates were asked
about getting information from “family members, friends, other inmates, or staff.”
SOURCE: U.S. Department of Education, Institute of Education Sciences, National Center for Education Statistics, 2003 National Assessment of Adult Literacy.
Table E-29. Average health literacy scores of adults who got information about health issues from health care
professionals, by highest educational attainment: 2003
Amount of information from Less than/ High school graduate/GED/ College graduate/health care professionals some high school high school equivalency At least some college graduate studies/degree
None 167 (5.2) 225 (4.4) 251 (4.6) 280 (9.0)
A little 185 (5.3) 243 (3.5) 258 (2.6) 284 (3.4)
Some 184 (3.7) 234 (2.2) 259 (1.7) 285 (2.7)
A lot 190 (3.6) 226 (2.3) 251 (2.1) 283 (2.7)
NOTE: Standard errors are in parentheses. Adults are defined as people 16 years of age and older living in households or prisons. Adults who could not be interviewed because of language spoken or cognitive or
mental disabilities (3 percent in 2003) are excluded from this table.
SOURCE: U.S. Department of Education, Institute of Education Sciences, National Center for Education Statistics, 2003 National Assessment of Adult Literacy.

59
toc
1CHAPTER ONEREFERENCES
ReferencesBaker, D.W., Gazmararian, J.A., Williams, M.V., Scott, T.,
Parker, R.M., Green, D., Ren, J., and Peel, J. (2004).Health Literacy and Use of Outpatient PhysicianServices by Medicare Managed Care Enrollees.Journal of General Internal Medicine, 19(3): 215–220.
Baker, D.W., Parker, R.M.,Williams, M.V., and Clark,W.S.(1998). Health Literacy and the Risk of Hospitalization.Journal of General Internal Medicine, 13(12): 791–798.
Berkman, N.D., DeWalt, D.A., Pignone, M.P., Sheridan,S.L., Lohr, K.N., Lux, L., Sutton, S.F., Swinson, T.,Bonito, A.J. (2004) Literacy and Health Outcomes.Evidence Report/Technology Assessment No. 87(Prepared by RTI International—University of NorthCarolina Evidence-based Practice Center underContract No. 290-02-0016). AHRQ Publication No.04-E007-2. Rockville, MD: Agency for HealthcareResearch and Quality.
Binder, D.A. (1983). On the Variances of AsymptoticallyNormal Estimates for Complex Surveys. InternationalStatistical Review, 51(3): 279–292.
Fox, S., and Rainie, L. (2000). The Online Health CareRevolution: How the Web Helps Americans Take Better Careof Themselves. Washington, DC: Pew Charitable Trusts.
Gordon, M.M., Hampson, R., Capell, H.A., and Madhok,R. (2002). Illiteracy in Rheumatoid Arthritis Patients asDetermined by the Rapid Estimate of Adult Literacy inMedicine (REALM) Score. Rheumatology (Oxford),41(7): 750–754.

60
The Health Literacy of America’s Adults
Hambleton, R.K., and Swaminathan, H. (1985). Item Response Theory: Principles and Applications. Boston:Kluwer-Nijhoff Publishing.
Hauser, R.M., Edley, C.F. Jr., Koenig, J.A., and Elliott, S.W. (Eds.). (2005). Measuring Literacy: Performance Levelsfor Adults, Interim Report. Washington, DC: National Academies Press.
Institute of Medicine (2004). Health Literacy: A Prescription to End Confusion. Washington, DC: Institute ofMedicine, Board on Neuroscience and Behavioral Health, Committee on Health Literacy.
Kutner, M., Greenberg, E., and Baer, J., (2005). A First Look at the Literacy of America's Adults in the 21st Century(NCES 2006-470). U.S. Department of Education, National Center for Education Statistics.Washington,DC: U.S. Government Printing Office.
Lindau, S.T.,Tomori, C., McCarville, M.A., and Bennett, C.L. (2001). Improving Rates of Cervical CancerScreening and Pap Smear Follow-Up for Low-Income Women With Limited Health Literacy. CancerInvestigation, 19(3): 316–323.
Little, R.J.A., and Rubin, D.B. (2002). Statistical Analysis with Missing Data. Hoboken, New Jersey:Wiley.
Rudd, R.E., Moeykens, B.A., and Colton,T.C. (1999). Health and Literacy:A Review of Medical and PublicHealth Literature. Review of Adult Learning and Literacy,Volume 1. San Francisco, CA: Jossey-Bass.
Taylor, H. (2001). The Harris Poll #19: Cyberchondriacs Update. Retrieved November 5, 2003, fromhttp://www.harrisinteractive.com/harris_poll/printerfriend/index.asp?PID=229.
U.S. Department of Health and Human Services (HHS). (2000). Healthy People 2010: Understanding andImproving Health. Washington, DC:Author.
U.S. Department of Health and Human Services (HHS). (2003). Communicating Health: Priorities and Strategies for Progress. Washington, DC. Retrieved June 15, 2006 from http://odphp.osophs.dhhs.gov/projects/HealthComm/.
White, S., and Dillow, S. (2005). Key Concepts and Features of the 2003 National Assessment of Adult Literacy(NCES 2006-471). U.S. Department of Education, National Center for Education Statistics.Washington,DC: U.S. Government Printing Office.
Williams, M.V., Davis, T., Parker, R.M., and Weiss, B.D. (2002). The Role of Health Literacy in Patient-Physician Communication. Family Medicine, 34(5): 383–389.