Embed Size (px)
Citation preview
Economics E201 (Professor Self) Sample Questions for Exam Two, Fall 2013
Your exam will have two parts covering the topics in chapters 4 (page 91 through end of chapter), 5 and 6 fromthe Parkin chapters and chapter 10 (up to page 317, up to but not including the income and substitution effect)from Hubbard that are found in your textbook and any material we discussed in class that is not in your text.Part one will have between 20 and 25 multiple choice questions and part two will have short answer questions.
Part One (MULTIPLE CHOICE): On your answer sheet darken in the letter of your choice for eachquestion. You should choose the suggested answer that BEST completes the statement or answers thequestion.
1. Robinson spends all his income on mangos and bananas. Mangos cost $3 per pound and bananascost $2 per pound. The marginal utility is 30 for the last pound of mangos purchased and 10 for thelast pound of bananas. If Robinson could buy any amount of bananas and mangos to include onlysmall pieces of each fruit, then to maximize his utility, Robinson should buy
A) more mangos and fewer bananas. B) more bananas and fewer mangos.C) only mangos. D) the present combination of goods.
2. The income elasticity of demand for vacations is 5. If incomes increase by 3 percent next year, thequantity of vacations demanded at today's price will increase by ________ percent.
A) 5 B) 3 C) 15 D) 5/3
3. You are the new vice president in charge of advertising at Taco Bell. In your upcoming advertisingcampaign, you plan to degrade the fast food competitor whose product is the closest substitute forTaco Bell's tacos. That would be the fast food chain whose cross elasticity of demand with yourtacos is equal to
A) negative 1.75. B) positive 1.00. C) negative 2.11. D) positive 1.55.
4. Last year, Jack's income was $15,000 and he bought 50 bags of potato chips. This year his incomeis $18,000 and he buys 55 bags of potato chips. Therefore, Jack's
A) price elasticity of demand for potato chips is 0.52.B) income elasticity of demand for potato chips is 0.52.C) income elasticity of demand for potato chips is 1.66.D) price elasticity of demand for potato chips is 1.66.
1
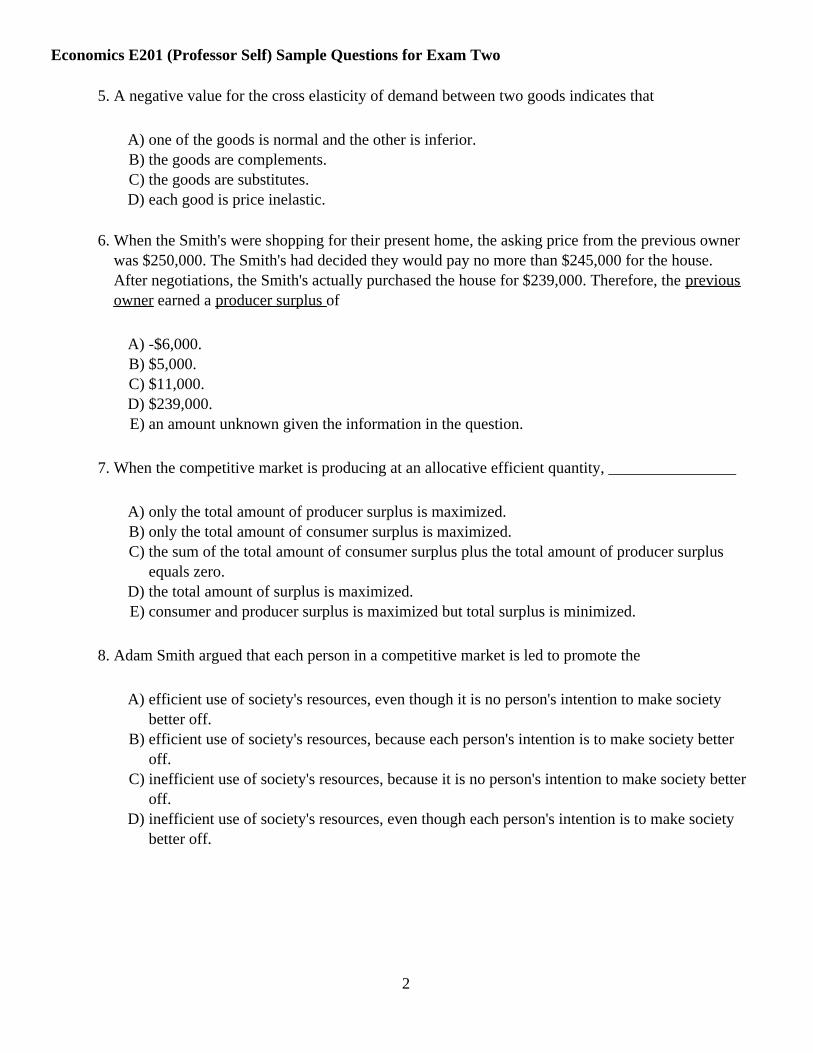
Economics E201 (Professor Self) Sample Questions for Exam Two
5. A negative value for the cross elasticity of demand between two goods indicates that
A) one of the goods is normal and the other is inferior.B) the goods are complements.C) the goods are substitutes.D) each good is price inelastic.
6. When the Smith's were shopping for their present home, the asking price from the previous ownerwas $250,000. The Smith's had decided they would pay no more than $245,000 for the house.After negotiations, the Smith's actually purchased the house for $239,000. Therefore, the previousowner earned a producer surplus of
A) -$6,000.B) $5,000.C) $11,000.D) $239,000.E) an amount unknown given the information in the question.
7. When the competitive market is producing at an allocative efficient quantity, ________________
A) only the total amount of producer surplus is maximized.B) only the total amount of consumer surplus is maximized.C) the sum of the total amount of consumer surplus plus the total amount of producer surplus
equals zero.D) the total amount of surplus is maximized.E) consumer and producer surplus is maximized but total surplus is minimized.
8. Adam Smith argued that each person in a competitive market is led to promote the
A) efficient use of society's resources, even though it is no person's intention to make societybetter off.
B) efficient use of society's resources, because each person's intention is to make society betteroff.
C) inefficient use of society's resources, because it is no person's intention to make society betteroff.
D) inefficient use of society's resources, even though each person's intention is to make societybetter off.
2
Economics E201 (Professor Self) Sample Questions for Exam Two
9. Using the "It's not fair if the result isn't fair" principle of fairness, an income tax designed totransfer income from the rich to the poor
A) decreases efficiency and presumably increases equity.B) increases efficiency and does not affect equity.C) decreases efficiency and equity.D) increases efficiency and equity.E) does not change efficiency but presumably increases equity.
10. Competitive markets with their marginal cost equal to the marginal social costs, their marginalbenefits equal to the marginal social benefits, and no government price ceilings, floors, taxes orsubsidies ________ efficient. According to the "It's not fair if the rules aren't fair" idea of fairness,competitive markets ________ fair.
A) are not; are B) are not; are not C) are; are not D) are; are
11. An effective minimum wage creates
A) inefficiency because it decreases productive unemployment.B) efficiency because it increases most workers' wages.C) inefficiency because it causes a surplus of labor hours.D) efficiency because few workers lose their jobs.E) efficiency because it increases wages and labor hours.
12. In the market for hats the supply curve is defined as Ps = Q and the demand curve is defined as Pd
= 45 - 0.5Q where P equals price and Q equals quantity. If a $20 tax is imposed on the sellersthen the economic incidence of the tax to sellers is __________ and to buyers it is _________.
A) 67% of the tax; 33% of the taxB) 50% of the tax; 50% of the taxC) 100% of the tax; 0% of the taxD) 0% of the tax; 100% of the taxE) There is not enough information to answer this question.
13. If a rise in the price of oranges from $7 to $9 a bushel, caused by a shift of the demand curve,increases the quantity of bushels supplied from 4,500 to 5,500 bushels, the
A) supply of oranges is elastic. B) supply of oranges is inelastic.C) demand for oranges is inelastic. D) demand for oranges is elastic.
3
Economics E201 (Professor Self) Sample Questions for Exam Two
14. A determinant of the price elasticity of supply is the extent to which
A) the demand for the good is relatively elastic.B) consumers like the quality of the good.C) production of the good uses commonly available resources.D) the good has many consumer substitutes.
15. An important determinant of the price elasticity of supply is
A) the time period firms have to adjust to a new price.B) whether the good is a durable or a nondurable.C) how well consumers like the commodity.D) the proportion of the consumer's total budget spent on the good.
16. Adhira buys chocolates and almonds. She has 3 bars of chocolates and 4 bags of almonds. Themarginal utility of the third chocolate bar is 18 and the marginal utility from the fourth bag ofalmonds is also 18. Is Adhira maximizing her utility?
A) No, she must buy 1 more chocolate bar to equate her quantities of the two goods.B) Yes, the marginal utility from the last unit of each good is equal.C) No, without information on her income and the prices of the two goods, we cannot answer
the question.D) No, she must cut back to 3 bags of almonds to equate her quantities of the two goods.
17. The demand for corn increases. As a result, the price of corn will ________, and the less elastic thesupply of corn, the ________ will be the effect on the price.
A) rise; smaller B) fall; smaller C) fall; greater D) rise; greater
4
Economics E201 (Professor Self) Sample Questions for Exam Two
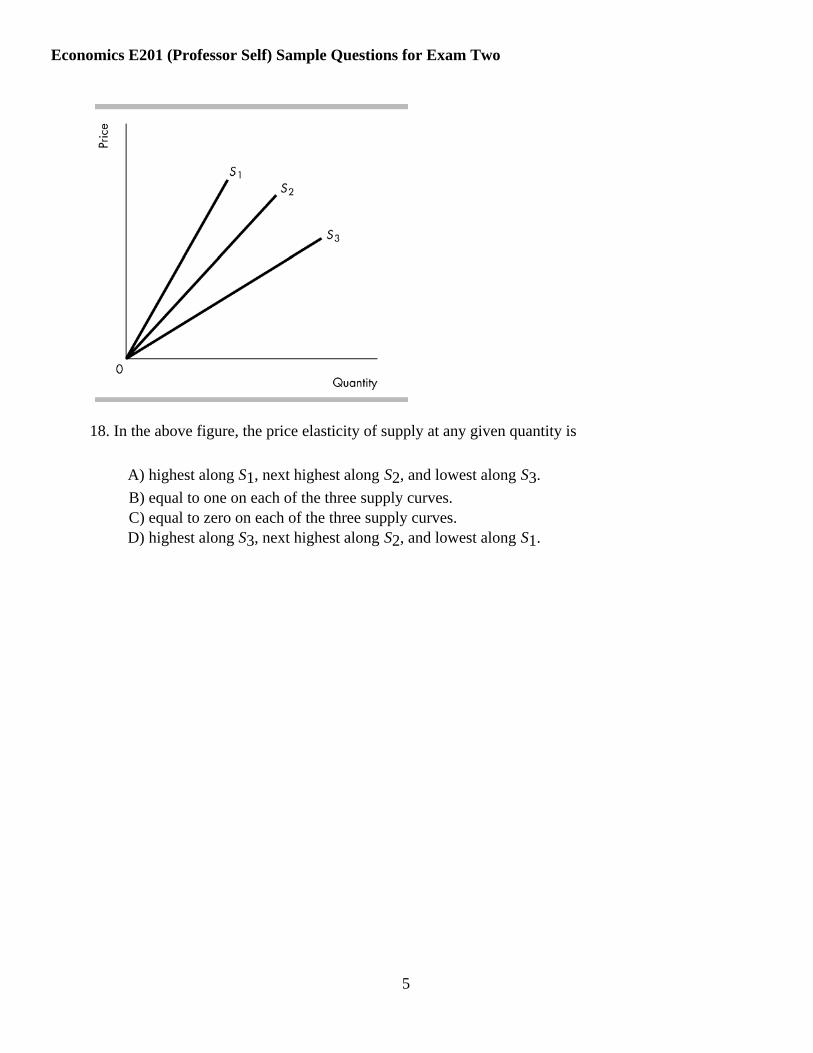
18. In the above figure, the price elasticity of supply at any given quantity is
A) highest along S1, next highest along S2, and lowest along S3.
B) equal to one on each of the three supply curves.C) equal to zero on each of the three supply curves.D) highest along S3, next highest along S2, and lowest along S1.
5

Economics E201 (Professor Self) Sample Questions for Exam Two
19. In the above figure, what does the consumer surplus equal when the market is producing theefficient quantity of hotdogs? (Hint: You will need to find the vertical intercept of the curve youare using to calculate your answer.)
A) $4,000B) $2,000C) $1,000D) $1,500E) There is not enough information to determine consumer surplus.
6
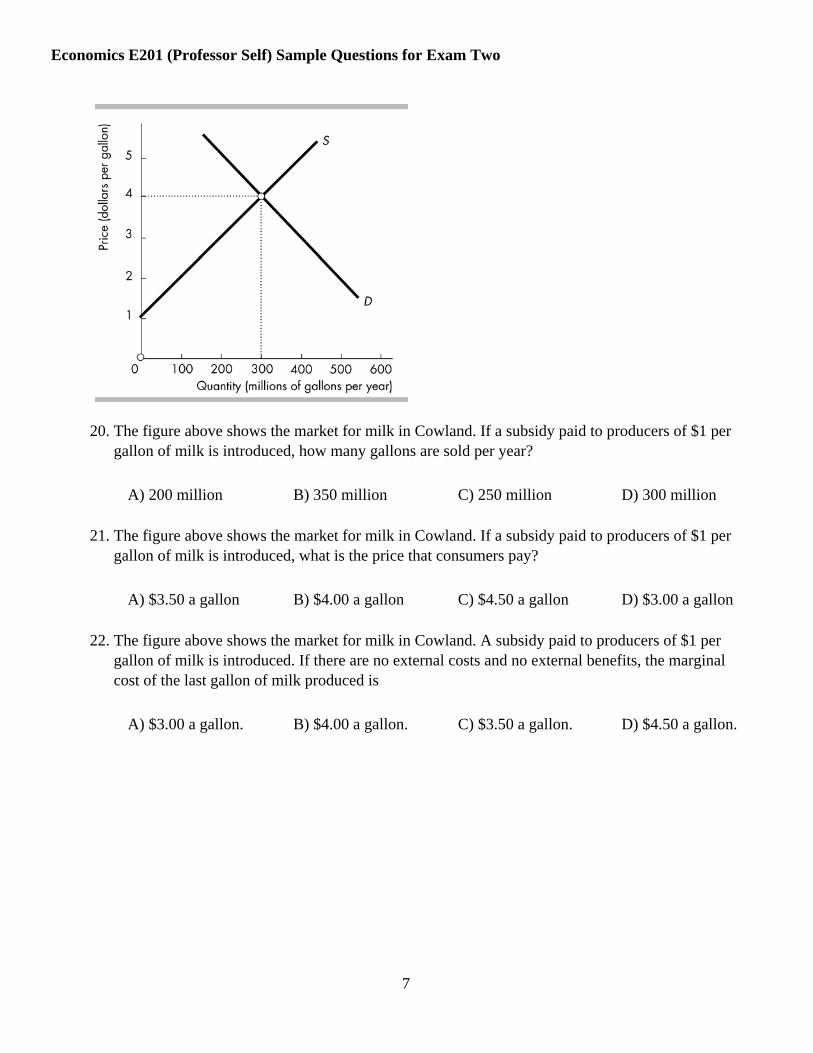
Economics E201 (Professor Self) Sample Questions for Exam Two
20. The figure above shows the market for milk in Cowland. If a subsidy paid to producers of $1 pergallon of milk is introduced, how many gallons are sold per year?
A) 200 million B) 350 million C) 250 million D) 300 million
21. The figure above shows the market for milk in Cowland. If a subsidy paid to producers of $1 pergallon of milk is introduced, what is the price that consumers pay?
A) $3.50 a gallon B) $4.00 a gallon C) $4.50 a gallon D) $3.00 a gallon
22. The figure above shows the market for milk in Cowland. A subsidy paid to producers of $1 pergallon of milk is introduced. If there are no external costs and no external benefits, the marginalcost of the last gallon of milk produced is
A) $3.00 a gallon. B) $4.00 a gallon. C) $3.50 a gallon. D) $4.50 a gallon.
7
Economics E201 (Professor Self) Sample Questions for Exam Two
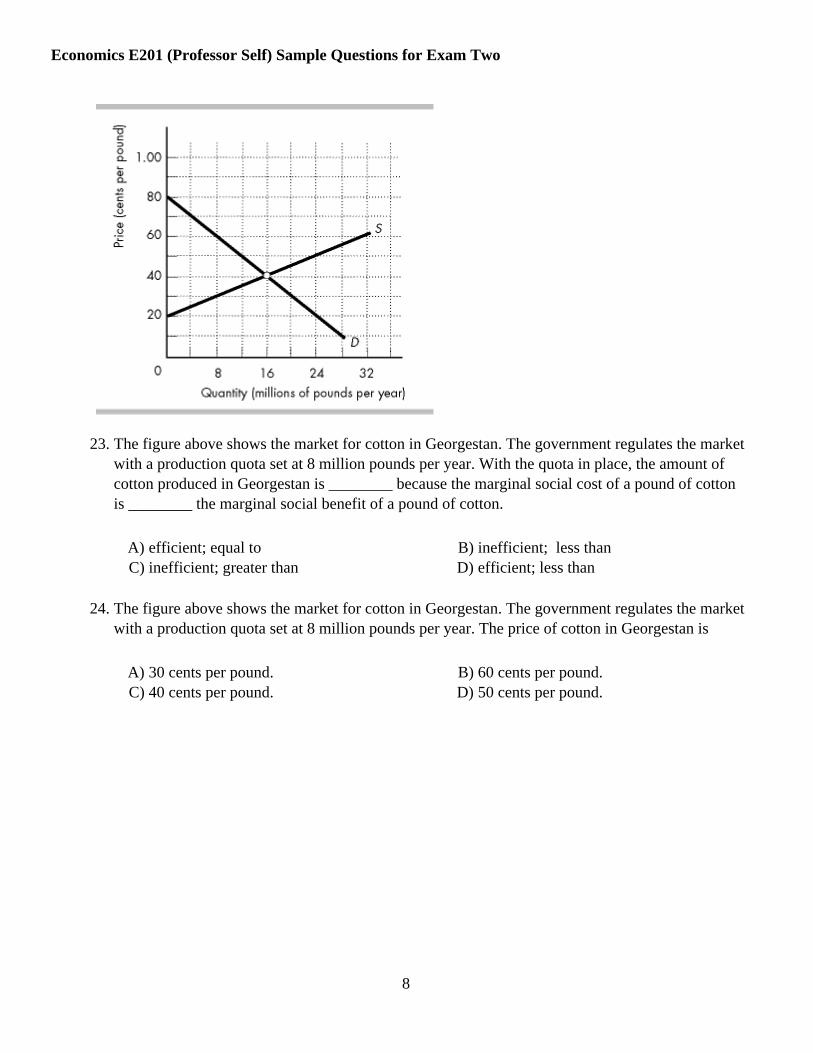
23. The figure above shows the market for cotton in Georgestan. The government regulates the marketwith a production quota set at 8 million pounds per year. With the quota in place, the amount ofcotton produced in Georgestan is ________ because the marginal social cost of a pound of cottonis ________ the marginal social benefit of a pound of cotton.
A) efficient; equal to B) inefficient; less thanC) inefficient; greater than D) efficient; less than
24. The figure above shows the market for cotton in Georgestan. The government regulates the marketwith a production quota set at 8 million pounds per year. The price of cotton in Georgestan is
A) 30 cents per pound. B) 60 cents per pound.C) 40 cents per pound. D) 50 cents per pound.
8
Economics E201 (Professor Self) Sample Questions for Exam Two
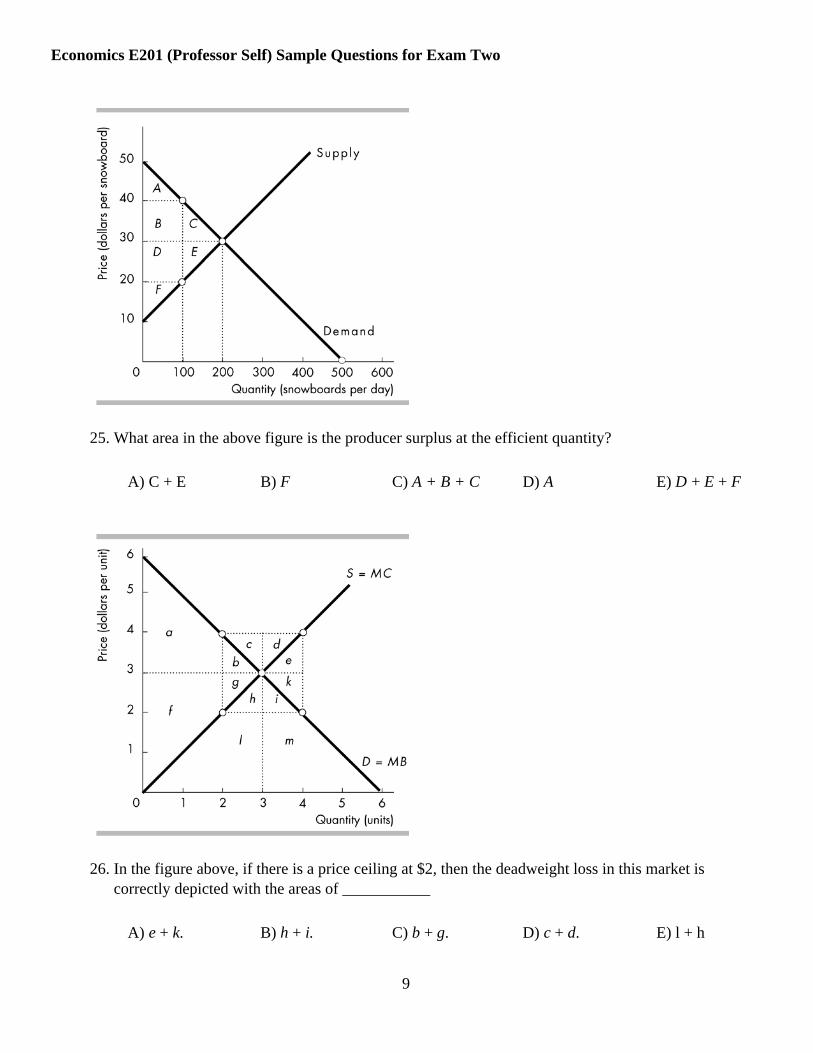
25. What area in the above figure is the producer surplus at the efficient quantity?
A) C + E B) F C) A + B + C D) A E) D + E + F
26. In the figure above, if there is a price ceiling at $2, then the deadweight loss in this market iscorrectly depicted with the areas of ___________
A) e + k. B) h + i. C) b + g. D) c + d. E) l + h
9
Economics E201 (Professor Self) Sample Questions for Exam Two
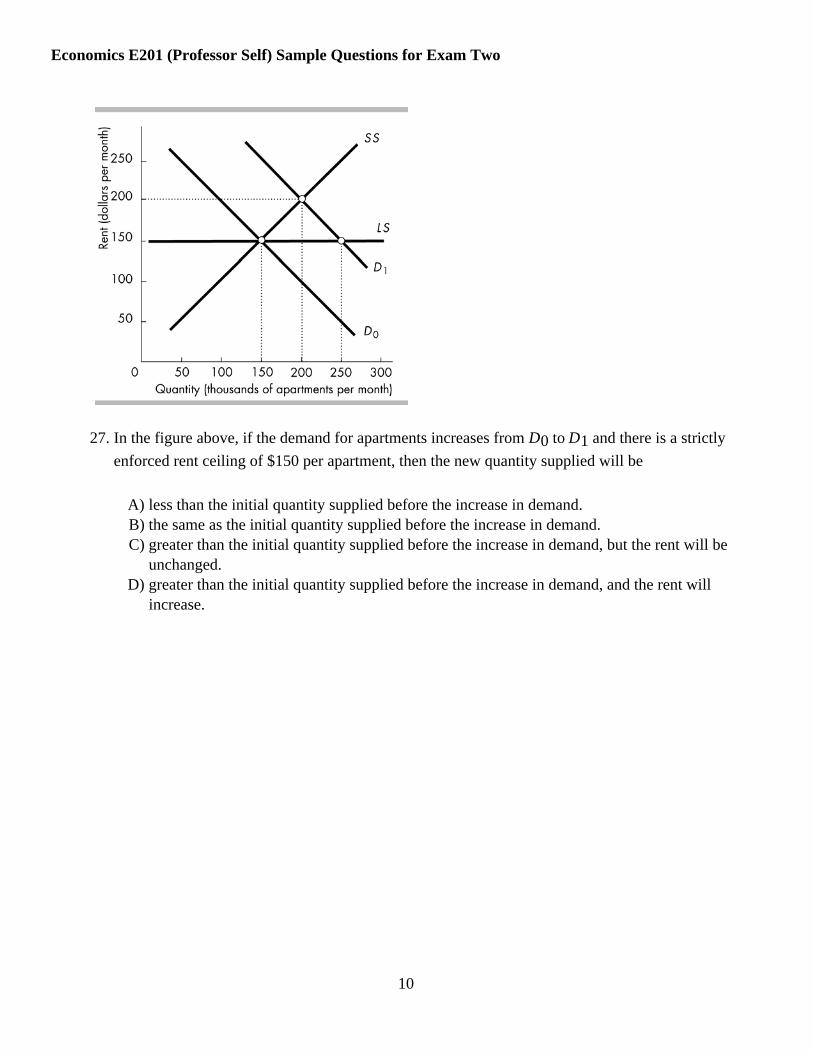
27. In the figure above, if the demand for apartments increases from D0 to D1 and there is a strictly
enforced rent ceiling of $150 per apartment, then the new quantity supplied will be
A) less than the initial quantity supplied before the increase in demand.B) the same as the initial quantity supplied before the increase in demand.C) greater than the initial quantity supplied before the increase in demand, but the rent will be
unchanged.D) greater than the initial quantity supplied before the increase in demand, and the rent will
increase.
10

Economics E201 (Professor Self) Sample Questions for Exam Two
28. In the above figure, CBL is the fine levied for breaking the law. If it is illegal to buy, but notillegal to sell, then the price consumers act on will be ________ however the visible street pricewould be ________. You can find the equation for the linier demand curve by using the to pointsshown in the diagram,
A) $500; $300B) $400; $200.C) $600; $200.D) $300; $200.E) $400; $500
11

Economics E201 (Professor Self) Sample Questions for Exam Two
Price(cents perbrownie)
Quantitydemanded(per day)
Quantitysupplied(per day)
0 1,800 010 1,600 10020 1,400 20030 1,200 30040 1,000 40050 800 50060 600 60070 400 70080 200 80090 0 900
29. In the above table, when 200 brownies are produced,
A) marginal benefit is less than marginal cost, and there is a deadweight loss.B) marginal benefit equals marginal cost, and resource use is efficient.C) marginal benefit is greater than marginal cost, and resource use is efficient.D) marginal benefit is greater than marginal cost, and there is a deadweight loss.E) marginal benefit is less than marginal cost, and there is a producer surplus that is greater than
the consumer surplus.
12
Economics E201 (Professor Self) Sample Questions for Exam Two
Price(dollars per
packet)
Quantitydemanded
(packets perweek)
Quantitysupplied
(packets perweek)
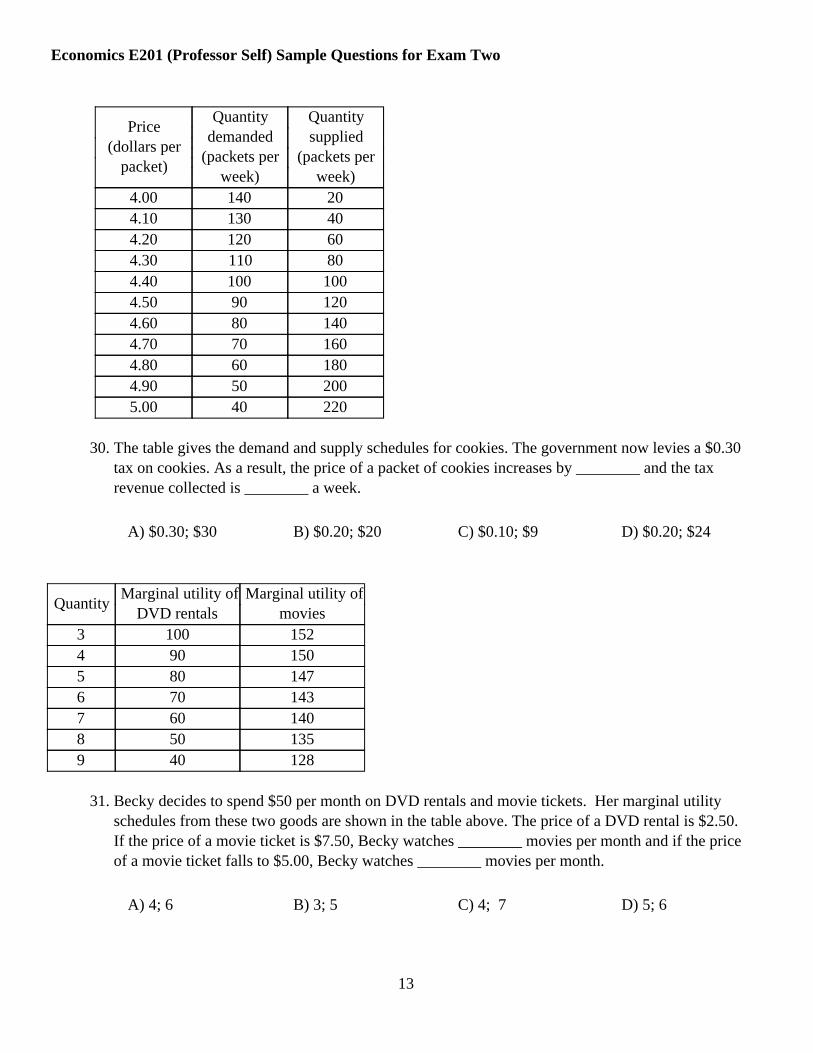
4.00 140 204.10 130 404.20 120 604.30 110 804.40 100 1004.50 90 1204.60 80 1404.70 70 1604.80 60 1804.90 50 2005.00 40 220
30. The table gives the demand and supply schedules for cookies. The government now levies a $0.30tax on cookies. As a result, the price of a packet of cookies increases by ________ and the taxrevenue collected is ________ a week.
A) $0.30; $30 B) $0.20; $20 C) $0.10; $9 D) $0.20; $24
QuantityMarginal utility of
DVD rentalsMarginal utility of
movies3 100 1524 90 1505 80 1476 70 1437 60 1408 50 1359 40 128
31. Becky decides to spend $50 per month on DVD rentals and movie tickets. Her marginal utilityschedules from these two goods are shown in the table above. The price of a DVD rental is $2.50.If the price of a movie ticket is $7.50, Becky watches ________ movies per month and if the priceof a movie ticket falls to $5.00, Becky watches ________ movies per month.
A) 4; 6 B) 3; 5 C) 4; 7 D) 5; 6
13
Economics E201 (Professor Self) Sample Questions for Exam Two
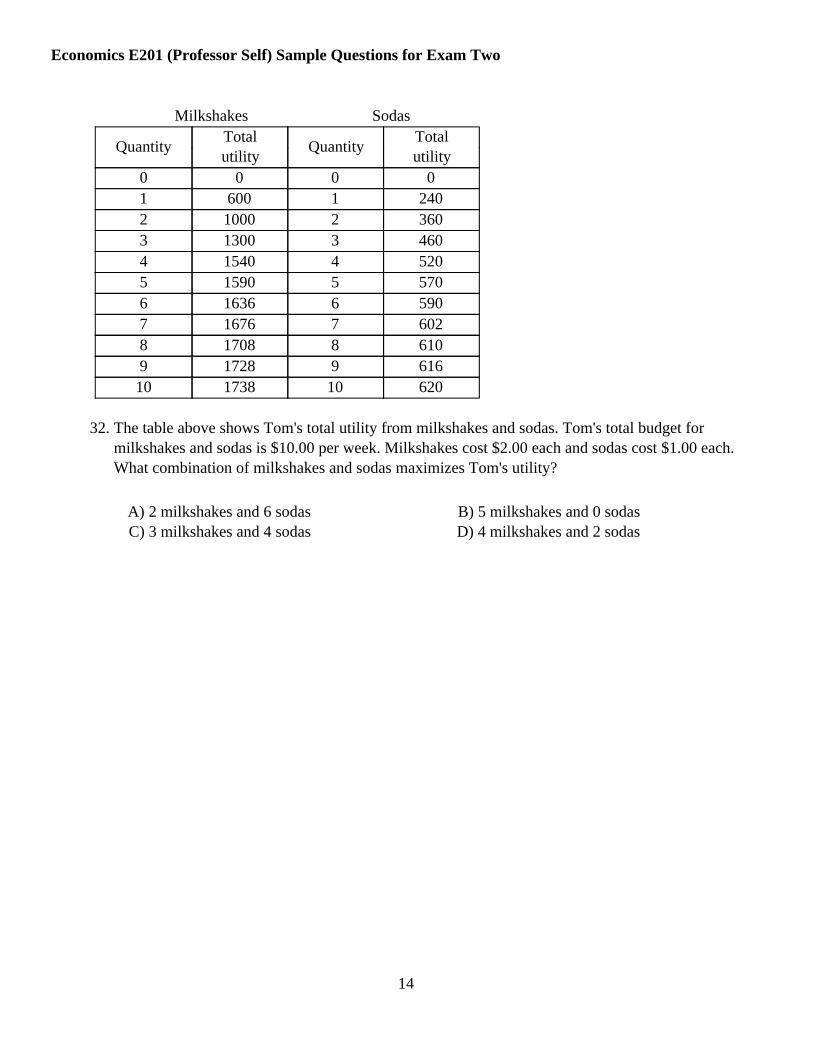
Milkshakes Sodas
QuantityTotalutility
QuantityTotalutility
0 0 0 01 600 1 2402 1000 2 3603 1300 3 4604 1540 4 5205 1590 5 5706 1636 6 5907 1676 7 6028 1708 8 6109 1728 9 61610 1738 10 620
32. The table above shows Tom's total utility from milkshakes and sodas. Tom's total budget formilkshakes and sodas is $10.00 per week. Milkshakes cost $2.00 each and sodas cost $1.00 each.What combination of milkshakes and sodas maximizes Tom's utility?
A) 2 milkshakes and 6 sodas B) 5 milkshakes and 0 sodasC) 3 milkshakes and 4 sodas D) 4 milkshakes and 2 sodas
14
Economics E201 (Professor Self) Sample Questions for Exam Two
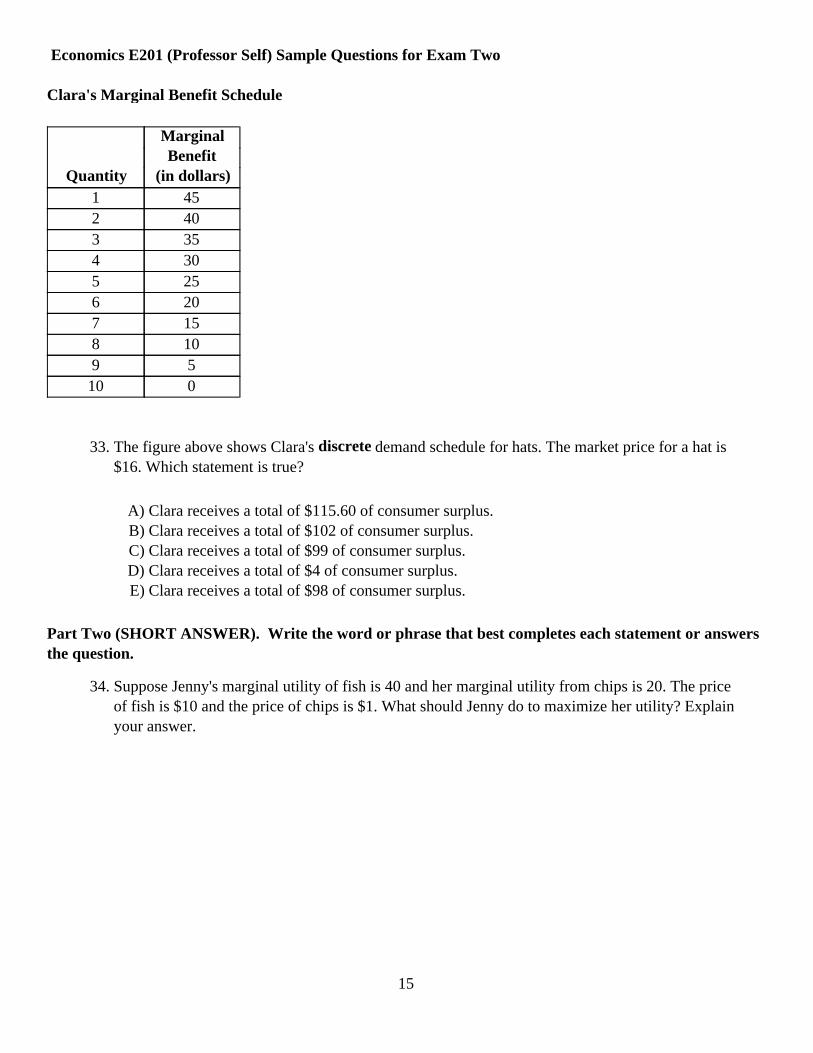
Clara's Marginal Benefit Schedule
Quantity
MarginalBenefit
(in dollars)1 452 403 354 305 256 207 158 109 510 0
33. The figure above shows Clara's discrete demand schedule for hats. The market price for a hat is$16. Which statement is true?
A) Clara receives a total of $115.60 of consumer surplus.B) Clara receives a total of $102 of consumer surplus.C) Clara receives a total of $99 of consumer surplus.D) Clara receives a total of $4 of consumer surplus.E) Clara receives a total of $98 of consumer surplus.
Part Two (SHORT ANSWER). Write the word or phrase that best completes each statement or answersthe question.
34. Suppose Jenny's marginal utility of fish is 40 and her marginal utility from chips is 20. The priceof fish is $10 and the price of chips is $1. What should Jenny do to maximize her utility? Explainyour answer.
15
Economics E201 (Professor Self) Sample Questions for Exam Two
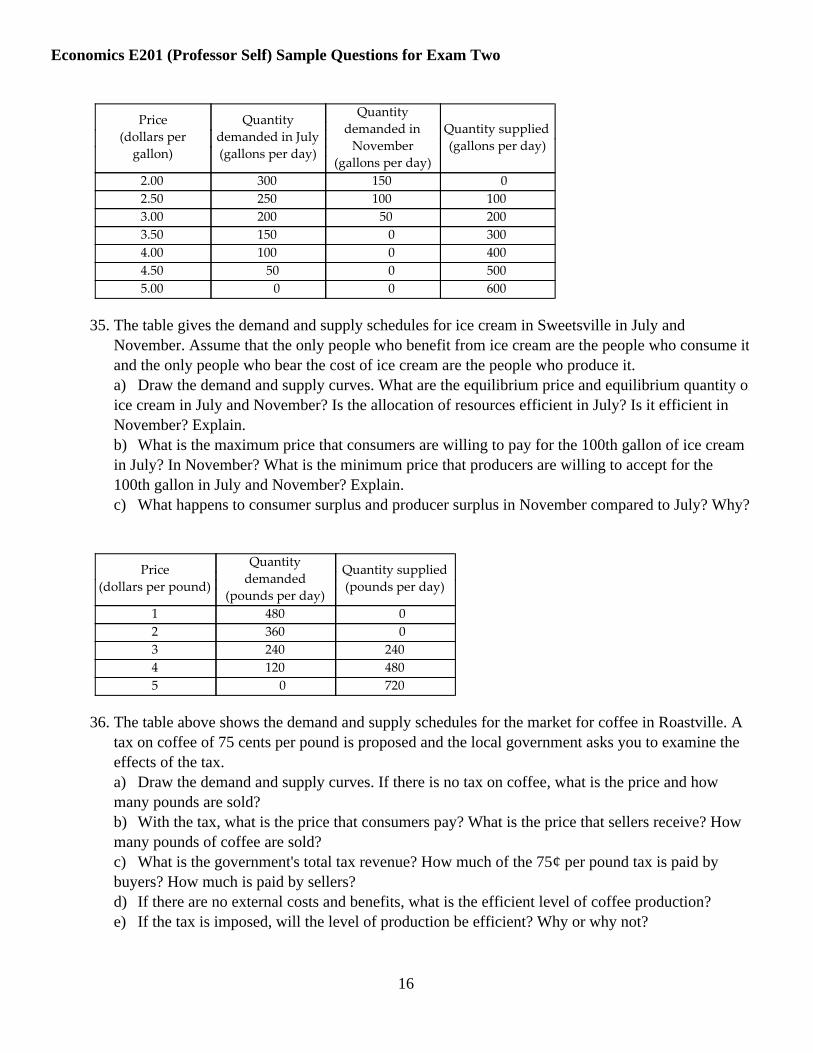
Price(dollars per
gallon)
Quantitydemanded in July(gallons per day)
Quantitydemanded in
November(gallons per day)
Quantity supplied(gallons per day)
2.00 300 150 02.50 250 100 1003.00 200 50 2003.50 150 0 3004.00 100 0 4004.50 50 0 5005.00 0 0 600
35. The table gives the demand and supply schedules for ice cream in Sweetsville in July andNovember. Assume that the only people who benefit from ice cream are the people who consume itand the only people who bear the cost of ice cream are the people who produce it.a) Draw the demand and supply curves. What are the equilibrium price and equilibrium quantity ofice cream in July and November? Is the allocation of resources efficient in July? Is it efficient inNovember? Explain.b) What is the maximum price that consumers are willing to pay for the 100th gallon of ice creamin July? In November? What is the minimum price that producers are willing to accept for the100th gallon in July and November? Explain.c) What happens to consumer surplus and producer surplus in November compared to July? Why?
Price(dollars per pound)
Quantitydemanded
(pounds per day)
Quantity supplied(pounds per day)
1 480 02 360 03 240 2404 120 4805 0 720
36. The table above shows the demand and supply schedules for the market for coffee in Roastville. Atax on coffee of 75 cents per pound is proposed and the local government asks you to examine theeffects of the tax.a) Draw the demand and supply curves. If there is no tax on coffee, what is the price and howmany pounds are sold?b) With the tax, what is the price that consumers pay? What is the price that sellers receive? Howmany pounds of coffee are sold?c) What is the government's total tax revenue? How much of the 75¢ per pound tax is paid bybuyers? How much is paid by sellers?d) If there are no external costs and benefits, what is the efficient level of coffee production?e) If the tax is imposed, will the level of production be efficient? Why or why not?
16
Economics E201 (Professor Self) Sample Questions for Exam Two
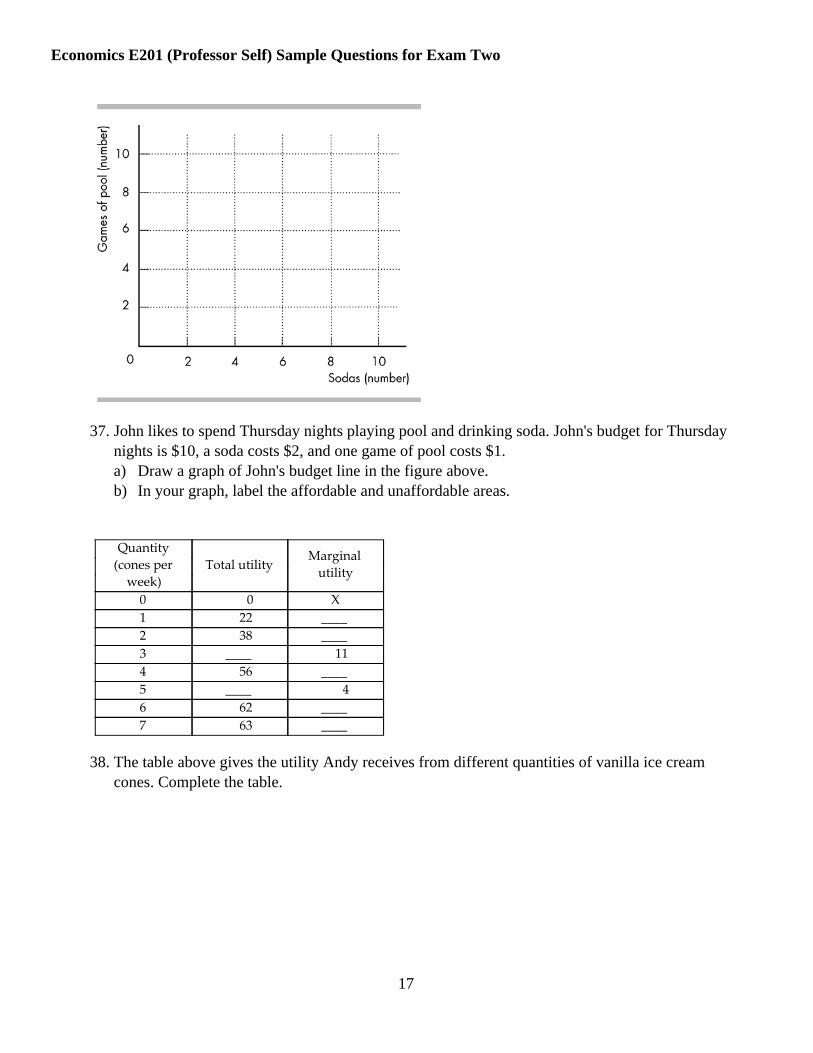
37. John likes to spend Thursday nights playing pool and drinking soda. John's budget for Thursdaynights is $10, a soda costs $2, and one game of pool costs $1.a) Draw a graph of John's budget line in the figure above.b) In your graph, label the affordable and unaffordable areas.
Quantity(cones per
week)Total utility
Marginalutility
0 0 X1 22 ____2 38 ____3 ____ 114 56 ____5 ____ 46 62 ____7 63 ____
38. The table above gives the utility Andy receives from different quantities of vanilla ice creamcones. Complete the table.
17
Answer KeyTestname: SAMPLE_E201_QUESTIONS_FOR_EXAM_2_FALL2013
1. A2. C3. D4. B5. B6. E7. D8. A9. A
10. D11. C12. A13. B14. C15. A16. C17. D18. B19. B20. B21. A22. D23. B24. B25. E26. C27. B28. C29. D30. D31. C32. D33. C34. Jenny should buy more chips and fewer fish. Her marginal utility per dollar from chips is 20 and her
marginal utility per dollar from fish is 4. If Jenny decreases her purchases of fish by $1, she loses 4 unitsof utility. But if she spends the dollar on chips, she gains 20 units of utility. Because her gain in utilityexceeds her loss, Jenny's total utility increases as she buys more chips and fewer fish.
18
Answer KeyTestname: SAMPLE_E201_QUESTIONS_FOR_EXAM_2_FALL2013
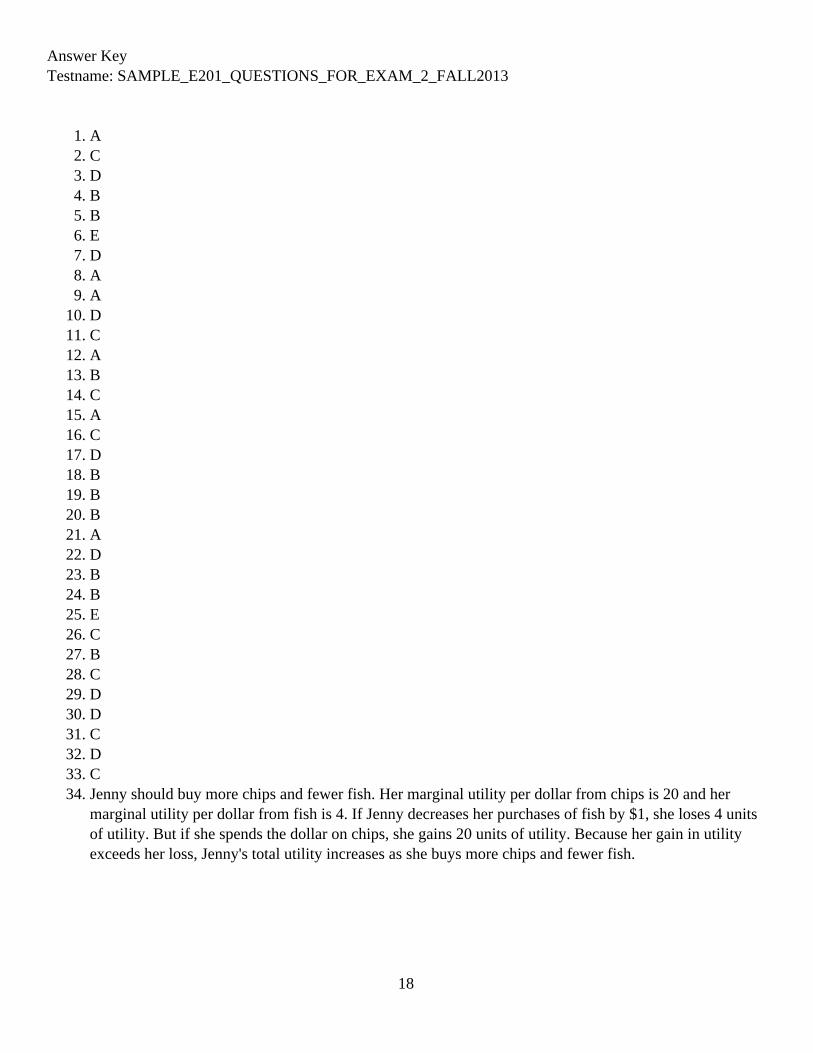
35.
a) The figure is shown above. In July, the equilibrium price is $3.00 and the equilibrium quantity is 200gallons of ice cream a day. In November, the equilibrium price is $2.50 and the equilibrium quantity is 10gallons a day. The allocation of resources is efficient in both July and November because the demandcurve is the marginal social benefit (MSB) curve and the supply curve is the marginal social cost (MSC)curve, so at equilibrium MSB = MSC, which is the efficiency condition.b) The demand curve shows consumers willingness to pay. If 100 gallons of ice cream are produced, themaximum price that consumers are willing to pay for the last gallon is $4.00 in July and $2.50 inNovember. The supply curve shows the minimum price that producers are willing to accept to produce acertain quantity. Because the supply curve remains the same, the minimum price that producers arewilling to accept to produce the 100th gallon of ice cream is $2.50 in both July and November.c) Consumer surplus is the value that consumers receive minus the price they pay summed over thequantity bought. Both the surplus received from each gallon of ice cream bought and the quantity boughtdecreased in November compared to July. Therefore, consumer surplus decreased from $200 in July to$50 in November. Producer surplus is the price of ice cream minus the marginal cost of producing it,summed over the quantity sold. Because the market price of ice cream fell while the marginal costsremained the same, both the surplus received from each gallon of ice cream sold and the quantity solddecreased in November compared to July. Therefore, producer surplus decreased from $100 in July to$25 in November.
19
Answer KeyTestname: SAMPLE_E201_QUESTIONS_FOR_EXAM_2_FALL2013
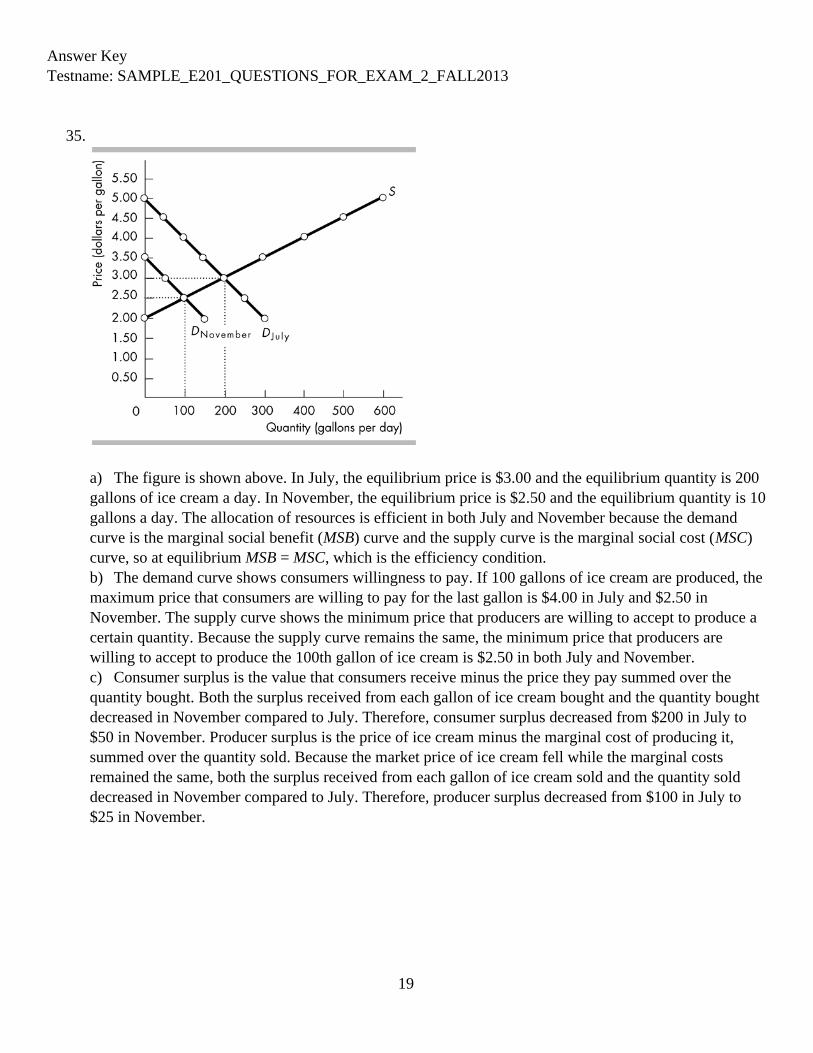
36.
a) The figure is above. With no tax, the equilibrium price is $3 and 240 pounds of coffee per day are soldb) The tax shifts the supply curve upward by $0.75. The new equilibrium price that consumers pay is$3.50. Sellers receive the price that consumers pay minus the tax, or $3.50 - $0.75 = $2.75. With the tax,180 pounds of coffee per day are sold.c) The government's tax revenue is the tax per pound, 75¢, multiplied by the number of pounds sold,180. So the government's total tax revenue is 75¢ × 180, which is $135 per day. With the tax, the pricethat buyers pay is 50¢ higher than with no tax, so the buyers pay 50¢ of the tax. Sellers pay the rest of thetax, 25¢.d) The efficient level of production is 240 pounds of coffee per day. At this level, the marginal socialbenefit ($3.00) equals the marginal social cost.e) If the tax is imposed, the level of production is not efficient. The marginal benefit from the last poundof coffee ($3.50) is greater than the marginal cost ($2.75). The underproduction is 60 pounds of coffeeper day.
20

Answer KeyTestname: SAMPLE_E201_QUESTIONS_FOR_EXAM_2_FALL2013
37.
a) The budget line is in the figure above.b) The affordable area is the lighter area and the budget line itself. The unaffordable area is the darkerarea.
38.Quantity
(cones perweek)
Total utilityMarginal
utility
0 0 X1 22 222 38 163 49 114 56 75 60 46 62 27 63 1
The completed table is above.
21