Embed Size (px)
Citation preview
CHAPTER 3: SAMPLE DESIGN IN TIMSS 2015 METHODS AND PROCEDURES IN TIMSS 2015 3.1
International Study CenterLynch School of Education, Boston College
CHAPTER 3
Sample Design in TIMSS 2015Sylvie LaRoche
Marc Joncas Pierre Foy
IntroductionTIMSS is designed to provide valid and reliable measurement of trends in student achievement in countries around the world, while keeping to a minimum the burden on schools, teachers, and students. The TIMSS program employs rigorous school and classroom sampling techniques so that achievement in the student population as a whole may be estimated accurately by assessing just a sample of students from a sample of schools. TIMSS assesses mathematics and science achievement at two grade levels and so TIMSS has two target populations—all students enrolled at the fourth grade and all students enrolled at the eighth grade. Countries may assess either or both student populations. In addition, for the TIMSS 2015 cycle, countries could participate in TIMSS Numeracy— a new, less difficult mathematics assessment at the fourth grade.
TIMSS employs a two-stage random sample design, with a sample of schools drawn as a first stage and one or more intact classes of students selected from each of the sampled schools as a second stage. Intact classes of students are sampled rather than individuals from across the grade level or of a certain age because TIMSS pays particular attention to students’ curricular and instructional experiences, and these typically are organized on a classroom basis. Sampling intact classes also has the operational advantage of less disruption to the school’s day-to-day business than individual student sampling.
National Sampling PlanEach country participating in TIMSS needs a plan for defining its national target population and applying the TIMSS sampling methods to achieve a nationally representative sample of schools and students. The development and implementation of the national sampling plan is a collaborative exercise involving the country’s National Research Coordinator (NRC) and TIMSS sampling experts.
Statistics Canada is responsible for advising the National Research Coordinator on all sampling matters and for ensuring that the national sampling plan conforms to the TIMSS

CHAPTER 3: SAMPLE DESIGN IN TIMSS 2015 METHODS AND PROCEDURES IN TIMSS 2015 3.2
International Study CenterLynch School of Education, Boston College
standards. In cooperation with sampling staff from the IEA Data Processing and Research Center (IEA DPC), Statistics Canada works with the National Research Coordinator to select the national school sample(s) and produce all supporting documentation for tracking the sampled schools. This includes ensuring that the school sampling frame (the school population list from which the school sample is drawn) provided by the National Research Coordinator is complete and satisfactory; checking that categories of excluded students are clearly defined, justified, and kept to a minimum; assisting the National Research Coordinator in determining the sample size and a stratification plan that will meet both international and national objectives; and drawing a national sample of schools. When sampling has been completed and all data collected, Statistics Canada documents population coverage and school and student participation rates and constructs appropriate sampling weights for use in analyzing and reporting the results.
The TIMSS & PIRLS International Study Center, in cooperation with Statistics Canada and the IEA DPC, provides National Research Coordinators with a series of manuals to guide them through the sampling process. More specifically, TIMSS 2015 Survey Operations Procedures Unit 1: Sampling Schools and Obtaining their Cooperation describes the steps involved in defining the national target population and selecting the school sample, and TIMSS 2015 Survey Operations Procedures Unit 3: Contacting Schools and Sampling Classes for Data Collection describes the procedure for sampling classes within the sampled schools and making preparations for conducting the assessments. Within-school sampling procedures for the field test are documented in TIMSS 2015 Survey Operations Procedures Unit 2: Preparing for and Conducting the Field Test. More information on the Survey Operations Units can be found in Chapter 6 of this volume.
The TIMSS National Research Coordinator is responsible for providing Statistics Canada with all information and documentation necessary to conduct the national sampling, and for conducting all sampling operations in the country. In particular, the NRC is expected to identify the grade(s) that correspond to the international target population(s); create a sampling frame by listing all schools in the population that have classes with students in the target grade(s); determine national population coverage and exclusions, in accordance with the TIMSS international guidelines; work with Statistics Canada to develop a national sampling plan and identify suitable stratification variables, ensuring that these variables are present and correct for all schools; contact all sampled schools and secure their participation; keep track of school participation and the use of replacement schools; and conduct all within-school sampling of classes. Each NRC is required to complete a series of sampling forms documenting the completion of each of these tasks.
A crucial feature of each international meeting of National Research Coordinators is a one-to-one meeting between each NRC and sampling staff at Statistics Canada and the IEA DPC. At these meetings, each step of the sampling process is documented and reviewed in detail, and NRCs have the opportunity to raise issues and ask questions about their national situation and any challenges they face. Statistics Canada consults with the TIMSS & PIRLS International Study Center and the

CHAPTER 3: SAMPLE DESIGN IN TIMSS 2015 METHODS AND PROCEDURES IN TIMSS 2015 3.3
International Study CenterLynch School of Education, Boston College
International Sampling Referee, as necessary, to resolve issues and questions. Final approval of TIMSS national sampling plans is the responsibility of the TIMSS & PIRLS International Study Center, based upon the advice of Statistics Canada and the International Sampling Referee.
Defining the Target PopulationAs an international study of the comparative effects of education on student achievement in mathematics and science, TIMSS defines its international target populations in terms of the amount of schooling students have received. The number of years of formal schooling is the basis of comparison among participating countries. Thus, the TIMSS international target population at the lower grade is all students in their fourth year of formal schooling, and at the upper grade, all students in their eighth year of formal schooling. Like TIMSS at the lower grade, the international target population for TIMSS Numeracy, is students in their fourth year of formal schooling. UNESCO’s International Standard Classification of Education ISCED 2011 (ISCED, 2012) provides an internationally accepted classification scheme for describing levels of schooling across countries. The ISCED system describes the full range of schooling, from pre-primary (Level 0) to the doctoral level (Level 8). ISCED Level 1 corresponds to primary education or the first stage of basic education. The first year of Level 1 “coincides with the transition point in an education system where systematic teaching and learning in reading, writing and mathematics begins” (UNESCO, 2012, p. 30). Four years after this would be the target grade for fourth grade TIMSS including TIMSS Numeracy, and is the fourth grade in most countries. Similarly, eight years after the first year of ISCED Level 1 is the target grade for eighth grade TIMSS and is the eighth grade in most countries. However, given the cognitive demands of the assessments, TIMSS wants to avoid assessing very young students. Thus, TIMSS recommends assessing the next higher grade (i.e., fifth grade for fourth grade TIMSS and ninth grade for eighth grade TIMSS) if, for fourth grade students, the average age at the time of testing would be less than 9.5 years and, for eighth grade students, less than 13.5 years.
The fourth grade and eighth grade target populations of students are defined as follows:• Fourth grade: All students enrolled in the grade that represents four years of schooling
counting from the first year of ISCED Level 1, providing the mean age at the time of testing is at least 9.5 years
• Eighth grade: All students enrolled in the grade that represents eight years of schooling counting from the first year of ISCED Level 1, providing the mean age at the time of testing is at least 13.5 years
All students enrolled in the target grade, regardless of their age, belong to the international target population and should be eligible to participate in TIMSS. Because students are sampled in two stages, first by randomly selecting a school and then randomly selecting a class from within

CHAPTER 3: SAMPLE DESIGN IN TIMSS 2015 METHODS AND PROCEDURES IN TIMSS 2015 3.4
International Study CenterLynch School of Education, Boston College
the school, it is necessary to identify all schools in which eligible students are enrolled. Essentially, eligible schools for TIMSS are those that have any students enrolled in the target grade, regardless of type of school. All schools of all educational sub-systems that have students learning full-time in the target grade are part of the international target population, including schools that are not under the authority of the national Ministry of Education.
National Target PopulationsFor most countries, the target grade for TIMSS is the fourth and/or eighth grade. However, because educational systems vary in structure and in policies and practices with regard to age of starting school and promotion and retention, there are differences across countries in how the target grades are labelled and in the average age of students. To ensure that the appropriate national target grades are selected, each NRC completes Sampling Form 1, which identifies the target grades, the country’s name for those grades, and the average age of students in those grades at the time of data collection. An example of a completed Sampling Form 1 is presented in Exhibit 3.1.

CHAPTER 3: SAMPLE DESIGN IN TIMSS 2015 METHODS AND PROCEDURES IN TIMSS 2015 3.5
International Study CenterLynch School of Education, Boston College
Exhibit 3.1: Example of Sampling Form 1

CHAPTER 3: SAMPLE DESIGN IN TIMSS 2015 METHODS AND PROCEDURES IN TIMSS 2015 3.6
International Study CenterLynch School of Education, Boston College
National Coverage and ExclusionsTIMSS is designed to describe and summarize student achievement across the entire target grade (fourth or eighth), and so it is very important that national target populations aim for comprehensive coverage of eligible students. However, in some cases, political, organizational, or operational factors make complete national coverage difficult to attain. Thus, in some rare situations, certain groups of schools and students may have to be excluded from the national target population. For example, it may be that a particular geographical region, educational sub-system, or language group cannot be covered. Such exclusion of schools and students from the target population is referred to as reduced population coverage.
Even countries with complete population coverage find it necessary to exclude at least some students from the target population because they attend very small schools, have intellectual or functional disabilities, or are non-native language speakers. Such students may be excluded at the school level (i.e., the whole school is excluded) or within the school on an individual basis.
School Level Exclusions. Although it is expected that very few schools will be excluded from the national target population, NRCs are permitted to exclude schools on the following grounds when they consider it necessary:
• Inaccessibility due to their geographically remote location
• Extremely small size (e.g., four or fewer students in the target grade)
• Offering a grade structure, or curriculum, radically different from the mainstream educational system
• Providing instruction solely to students in the student-level exclusion categories listed below (e.g., catering only to special needs students)
Student Level Exclusions. The international within-school exclusion rules are specified as follows:
• Students with functional disabilities — These are students who have physical disabilities such that they cannot perform in the TIMSS testing situation. Students with functional disabilities who are able to perform should be included in the testing.
• Students with intellectual disabilities — These are students who are considered, in the professional opinion of the school principal or by other qualified staff members, to have intellectual disabilities or who have been tested as such. This includes students who are emotionally or mentally unable to follow even the general instructions of the test. Students should not be excluded solely because of poor academic performance or normal disciplinary problems. It should be noted that students with dyslexia, or other such learning disabilities, should be accommodated in the test situation if possible, rather than excluded.

CHAPTER 3: SAMPLE DESIGN IN TIMSS 2015 METHODS AND PROCEDURES IN TIMSS 2015 3.7
International Study CenterLynch School of Education, Boston College
• Non-native language speakers — These are students who are unable to read or speak the language(s) of the test and would be unable to overcome the language barrier in the test situation. Typically, a student who has received less than one year of instruction in the language(s) of the test should be excluded.
Because disability criteria vary from country to country, NRCs are asked to translate the TIMSS international exclusion standards into the local equivalent. Students should be considered for exclusion strictly in accordance with the international standards. If a sampled school contains a class consisting entirely of students from one of the exclusion categories, such a class is excluded prior to classroom sampling.
NRCs understand that exclusion rates must be kept to a minimum in order that national samples accurately represent the national target population.
• The overall number of excluded students must not account for more than 5% of the national target population of students in a country. The overall number includes both school-level and within-school exclusions.
• The number of students excluded because they attend very small schools must not account for more than 2% of the national target population of students.
To document population coverage and exclusions, each NRC completes Sampling Form 2, which lists the number of students in the national target population and the number of students excluded at both the school level and within the school for each population to be assessed. An example of a completed Sampling Form 2 is presented in Exhibit 3.2.

CHAPTER 3: SAMPLE DESIGN IN TIMSS 2015 METHODS AND PROCEDURES IN TIMSS 2015 3.8
International Study CenterLynch School of Education, Boston College
Exhibit 3.2: Example of Sampling Form 2

CHAPTER 3: SAMPLE DESIGN IN TIMSS 2015 METHODS AND PROCEDURES IN TIMSS 2015 3.9
International Study CenterLynch School of Education, Boston College
Requirements for Sampling the Target PopulationTIMSS sets high standards for sampling precision, participation rates, and sample implementation in order to achieve national samples of the highest quality and survey estimates that are unbiased, accurate and internationally comparable.
Sampling Precision and Sample SizeBecause TIMSS is fundamentally a study of student achievement, the precision of estimates of student achievement is of primary importance. To meet the TIMSS standards for sampling precision, national student samples should provide for a standard error no greater than .035 standard deviation units for the country’s mean achievement. With a standard deviation of 100 on the TIMSS achievement scales, this standard error corresponds to a 95% confidence interval of ± 7 score points for the achievement mean and of ± 10 score points for the difference between achievement means from successive cycles (e.g., the difference between a country’s achievement mean on TIMSS 2011 and TIMSS 2015). Sample estimates of any student-level percentage estimate (e.g., a student background characteristic) should have a confidence interval of ± 3.5%.
For most countries, the TIMSS precision requirements are met with a school sample of 150 schools and a student sample of 4,000 students for each target grade. Depending on the average class size in the country, one class from each sampled school may be sufficient to achieve the desired student sample size. For example, if the average class size in a country were 27 students, a single class from each of 150 schools would provide a sample of 4,050 students (assuming full participation by schools and students). Some countries choose to sample more than one class per school, either to increase the size of the student sample or to provide a better estimate of school-level effects.
For countries choosing to participate in both TIMSS at the fourth grade and TIMSS Numeracy, the required student sample size is doubled— i.e., around 8000 sampled students. Countries could choose to select more schools or more classes within sampled schools to achieve the required sample size.
A school sample larger than the minimum of 150 schools may be required under the following circumstances:
• The average class size in a country is so small that, even when sampling more than one classroom per school, it is not possible to reach the student sample size requirements by selecting only 150 schools
• Previous cycles of TIMSS showed that the sampling precision requirements cannot be met unless a larger school sample is selected

CHAPTER 3: SAMPLE DESIGN IN TIMSS 2015 METHODS AND PROCEDURES IN TIMSS 2015 3.10
International Study CenterLynch School of Education, Boston College
• Classes within schools are tracked by student performance (more common at eighth grade than at fourth grade). This increases variation between classes in student achievement and can reduce sampling precision. In this situation, it is advisable to sample at least two classrooms per school whenever possible, in addition to sampling more schools.
• A high level of non-response is anticipated, leading to sample attrition and reduced sample size. Note that while a larger school sample helps to maintain sample size in the face of non-response, it does not compensate for non-response bias.
Field Test SampleThe school sample for the TIMSS field test is drawn at the same time and from the same population of schools as the full sample. The field test sample size requirement is 200 students per field test achievement booklet. The total field test sample size is a function of the number of achievement booklets being field tested. Typically, TIMSS has six field test booklets and so requires a field test sample of 1200 students at each grade. For TIMSS 2015, TIMSS Numeracy field tested five field test booklets and therefore required a sample size of 1000 students. As such, countries participating in both TIMSS and TIMSS Numeracy at fourth grade required a field test size of 2200 students.
Participation RatesTo minimize the potential for non-response bias, TIMSS aims for 100% participation by sampled schools, classrooms, and students, while recognizing that some degree of non-participation may be unavoidable. For a national sample to be fully acceptable it must have either:
• A minimum school participation rate of 85%, based on originally sampled schools AND
• A minimum classroom participation rate of 95%, from originally sampled schools and replacement schools AND
• A minimum student participation rate of 85%, from sampled schools and replacement schools
OR
• A minimum combined school, classroom, and student participation rate of 75%, based on originally sampled schools (although classroom and student participation rates may include replacement schools)
Classrooms with less than 50% student participation are deemed to be not participating.

CHAPTER 3: SAMPLE DESIGN IN TIMSS 2015 METHODS AND PROCEDURES IN TIMSS 2015 3.11
International Study CenterLynch School of Education, Boston College
Developing and Implementing the National Sampling PlanAlthough National Research Coordinators are responsible for developing and implementing national sampling plans, Statistics Canada and the IEA DPC work closely with NRCs to help ensure that these sampling plans fully meet the standards set by the TIMSS & PIRLS International Study Center, while also adapting to national circumstances and requirements. National sampling plans must be based on the international two-stage sample design (schools as the first stage and classes within schools as the second stage) and must be approved by Statistics Canada.
TIMSS Stratified Two-Stage Cluster Sample DesignThe basic international sample design for TIMSS is a stratified two-stage cluster sample design, as follows:
First Sampling Stage. For the first sampling stage, schools are sampled with probabilities proportional to their size (PPS) from the list of all schools in the population that contain eligible students. The schools in this list (or sampling frame) may be stratified (sorted) according to important demographic variables. Schools for the field test and data collection are sampled simultaneously using a systematic random sampling approach. Two replacement schools are also pre-assigned to each sampled school during the sample selection process, and these replacement schools are held in reserve in case the originally sampled school refuses to participate. Replacement schools are used solely to compensate for sample size losses in the event that the originally sampled school does not participate. School sampling is conducted for each country by Statistics Canada with assistance from the IEA DPC, using the sampling frame provided by the country’s National Research Coordinator.
Second Sampling Stage. The second sampling stage consists of the selection of one (or more) intact class from the target grade of each participating school. Class sampling in each country is conducted by the National Research Coordinator using the Within-School Sampling Software (WinW3S) developed by the IEA DPC and Statistics Canada. Having secured a sampled school’s agreement to participate in the assessment, the NRC requests information about the number of classes and teachers in the school and enters it in the WinW3S database. Classes smaller than a specified minimum size are grouped into pseudo-classes prior to sampling. The software selects classes with equal probabilities within schools. All students in each sampled class participate in the assessment. Sampled classes that refuse to participate may not be replaced.
For countries participating in both TIMSS at the fourth grade and TIMSS Numeracy, students within a sampled class are randomly assigned either a TIMSS or TIMSS Numeracy booklet through a booklet rotation system. This is done to ensure that TIMSS and TIMSS Numeracy are administered to probabilistically equivalent samples.
CHAPTER 3: SAMPLE DESIGN IN TIMSS 2015 METHODS AND PROCEDURES IN TIMSS 2015 3.12
International Study CenterLynch School of Education, Boston College
StratificationStratification consists of arranging the schools in the target population into groups, or strata, that share common characteristics such as geographic region or school type. Examples of stratification variables used in TIMSS include region of the country (e.g., states or provinces); school type or source of funding (e.g., public or private); language of instruction; level of urbanization (e.g., urban or rural area); socioeconomic indicators; and school performance on national examinations.
In TIMSS, stratification is used to:• Improve the efficiency of the sample design, thereby making survey estimates more
reliable
• Apply different sample designs, such as disproportionate sample allocations, to specific groups of schools (e.g., those in certain states or provinces)
• Ensure proportional representation of specific groups of schools in the sample
School stratification can take two forms: explicit and implicit. In explicit stratification, a separate school list or sampling frame is constructed for each stratum and a sample of schools is drawn from that stratum. In TIMSS, the major reason for considering explicit stratification is disproportionate allocation of the school sample across strata. For example, in order to produce equally reliable estimates for each geographic region in a country, explicit stratification by region may be used to ensure the same number of schools in the sample for each region, regardless of the relative population size of the regions.
Implicit stratification consists of sorting the schools by one or more stratification variables within each explicit stratum, or within the entire sampling frame if explicit stratification is not used. The combined use of implicit strata and systematic sampling is a very simple and effective way of ensuring a proportional sample allocation of students across all implicit strata. Implicit stratification also can lead to improved reliability of achievement estimates when the implicit stratification variables are correlated with student achievement.
National Research Coordinators consult with Statistics Canada and the IEA DPC to identify the stratification variables to be included in their sampling plans. The school sampling frame is sorted by the stratification variables prior to sampling schools so that adjacent schools are as similar as possible. Regardless of any other explicit or implicit variables that may be used, the school size is always included as an implicit stratification variable.
To document the stratification variables used in their sampling plans, each NRC completes Sampling Form 3, which lists the variables to be used for explicit and implicit stratification, and the number of levels of each stratification variable. An example of a completed Sampling Form 3 is presented in Exhibit 3.3. Appendix 3A provides the list of explicit and implicit stratification variables implemented by the countries participating at the fourth grade and Appendix 3B provides the equivalent list for eighth grade. Further details on the explicit and implicit stratification variables for each country can be found in the Characteristics of National Samples section in Chapter 5: Sampling Implementation.

CHAPTER 3: SAMPLE DESIGN IN TIMSS 2015 METHODS AND PROCEDURES IN TIMSS 2015 3.13
International Study CenterLynch School of Education, Boston College
Exhibit 3.3: Example of Sampling Form 3
CHAPTER 3: SAMPLE DESIGN IN TIMSS 2015 METHODS AND PROCEDURES IN TIMSS 2015 3.14
International Study CenterLynch School of Education, Boston College
School Sampling FrameOne of the National Research Coordinator’s most important sampling tasks is the construction of a school sampling frame for the target population. The sampling frame is a list of all schools in the country that have students enrolled in the target grade, and is the list from which the school sample is drawn. A well-constructed sampling frame provides complete coverage of the national target population without being contaminated by incorrect or duplicate entries or entries that refer to elements that are not part of the defined target population.
A suitable school measure of size (MOS) is a critical aspect of the national sampling plan, because the size of a school determines its probability of selection. The most appropriate school measure of size is an up-to-date count of the number of students in the target grade. If the number of students in the target grade is not available, total student enrollment in the school may be the best available substitute.
Sampling Form 4, presented in Exhibit 3.4, provides some basic information about the school sampling frame, including the average class size at the target grade, the number of classrooms to be sampled per school, the school measure of size (MOS) to be used for school sampling, and the school year from which the frame was constructed.

CHAPTER 3: SAMPLE DESIGN IN TIMSS 2015 METHODS AND PROCEDURES IN TIMSS 2015 3.15
International Study CenterLynch School of Education, Boston College
Exhibit 3.4: Example of Sampling Form 4

CHAPTER 3: SAMPLE DESIGN IN TIMSS 2015 METHODS AND PROCEDURES IN TIMSS 2015 3.16
International Study CenterLynch School of Education, Boston College
The school sampling frame is usually a spreadsheet containing a single entry for each school. This entry includes a unique identification number and contact information (if appropriate given the country’s privacy laws), the values of the stratification variables for the school, and the school measure of size. It is useful if the school entry also includes the number of classes in the school in the target grade because this provides a mechanism for predicting in advance the size of the eventual student sample. This predicted sample size may be compared with the eventual student sample size as a check on the sampling process.
Exhibit 3.5 provides an example of a partial sampling frame for a country assessing TIMSS 2015 at the eighth grade. In this example, region and urbanization could be used as stratification variables.
Exhibit 3.5: Example of a Partial Sampling Frame
Sampling SchoolsOnce the school sampling frame is structured to meet all international and national requirements, Statistics Canada can draw the school sample. If the sampling frame is explicitly stratified, it is necessary to decide how the school sample is to be allocated among the explicit strata (i.e., the number of schools to be sampled in each stratum). When this has been decided, a sample of schools is selected within each explicit stratum using systematic sampling with probabilities proportional to size. The PPS technique means that the larger schools, those with more students, have a higher probability of being sampled than the smaller schools. However, this difference in the selection probabilities of larger and smaller schools is largely offset at the second stage of sampling by

CHAPTER 3: SAMPLE DESIGN IN TIMSS 2015 METHODS AND PROCEDURES IN TIMSS 2015 3.17
International Study CenterLynch School of Education, Boston College
selecting a fixed number of classes (usually one or two) with equal probability from the sampled school. Classes in large schools with many classes at the target grade have a lower probability of selection than classes in smaller schools that have just one or two classes. A description of the school sampling procedure is provided in Appendix 3C.
Even though the field test is scheduled in the school year before the year of data collection in most countries, the preferred approach in TIMSS is to select both samples of schools at the same time. This ensures that both the field test and data collection samples constitute random samples representative of all schools in the country, and that no school is selected for both samples.
Replacement Schools. Ideally, all schools sampled for TIMSS should participate in the assessments, and NRCs work hard to achieve this goal. Nevertheless, it is anticipated that a 100 percent participation rate may not be possible in all countries. To avoid sample size losses, the sampling plan identifies, a priori, specific replacement schools for each sampled school. Each originally sampled school has two pre-assigned replacement schools, usually the school immediately preceding the originally sampled school on the school sampling frame and the one immediately following it. Replacement schools always belong to the same explicit stratum as the original but may come from different implicit strata if the school they are replacing is either the first or last school of an implicit stratum.
The main justification for replacement schools in TIMSS is to ensure adequate sample sizes for analysis of subpopulation differences. Although the use of replacement schools does not eliminate the risk of bias due to school nonparticipation, employing implicit stratification and ordering the school sampling frame by school size increases the chances that a sampled school’s replacements would have similar characteristics. This approach maintains the desired sample size while restricting replacement schools to strata where nonresponse occurs. Since the school frame is ordered by school size, replacement schools also tend to be similar in size to the school they are designated to replace.
NRCs understand that they should make every effort to secure the participation of all of the sampled schools. Only after all attempts to persuade a sampled school to participate have failed is the use of its replacement school considered.
Common Adjustments to the TIMSS School Sampling DesignTIMSS school sample design offers considerable flexibility in allowing countries to maximize or minimize the extent to which the same schools are assessed. In order to increase operational efficiency, some countries that administer TIMSS at both the fourth and eighth grades, where fourth and eighth graders attend the same school, find it more efficient to administer TIMSS at the same school for both grades. In other cases, countries try to ensure that assessments are spread across schools and therefore prefer that TIMSS at the fourth and eighth grades are not administered at the same school and/or that TIMSS sampling avoid, when possible, selecting schools that have

CHAPTER 3: SAMPLE DESIGN IN TIMSS 2015 METHODS AND PROCEDURES IN TIMSS 2015 3.18
International Study CenterLynch School of Education, Boston College
recently administered other national and international assessments. To provide flexibility to meet these requests, Statistics Canada implements modified sampling procedures—the details of which are described in Appendix 3D.
Sampling ClassesWithin each sampled school, all classes with students at the target grade are listed, and one or more intact classes are selected with equal probability of selection using systematic random sampling. This procedure is implemented using the WinW3S sampling software. The selection of classes with equal probability, combined with the PPS sampling method for schools, in general results in a self-weighting student sample. If the school has multi-grade classes (i.e., the class contains students from more than one grade level), only students from the target grade are eligible for sampling.
When a country participates in both TIMSS and TIMSS Numeracy at fourth grade, students within the sampled classes are randomly assigned to one study or the other by rotating the TIMSS and TIMSS Numeracy booklets within the sampled classes. This is done automatically by the WinW3S software.
Because small classes tend to increase the risk of unreliable survey estimates and can lead to reduced overall student sample size, it is necessary to avoid sampling too many small classes. Based on consideration of the size distribution of classes and the average class size, a lower class size limit or minimum class size (MCS) is specified for each country. Prior to sampling classes in a school, any class smaller than the MCS is combined with another class in the school to form a pseudoclass for sampling purposes. The procedure for sampling classes within schools is described in more detail in the Survey Operations Procedures chapter of this volume.
Sampling WeightsNational student samples in TIMSS are designed to accurately represent the target populations within a specified margin of sampling error, as described previously. After the data have been collected and processed, sample statistics such as means and percentages that describe student characteristics are computed as weighted estimates of the corresponding population parameters, where the weighting factor is the sampling weight. A student’s sampling weight is essentially the inverse of the student’s probability of selection, with appropriate adjustments for nonresponse. In principle, the stratified two-stage sampling procedure used in TIMSS, where schools are sampled with probability proportional to school size and classes are sampled with probability inversely proportional to school size, provides student samples with equal selection probabilities. However, in practice disproportionate sampling across explicit strata by varying the number of classes selected and differential patterns of nonresponse can result in varying selection probabilities, requiring a unique sampling weight for the students in each participating class in the study.

CHAPTER 3: SAMPLE DESIGN IN TIMSS 2015 METHODS AND PROCEDURES IN TIMSS 2015 3.19
International Study CenterLynch School of Education, Boston College
The student sampling weight in TIMSS is a combination of weighting components reflecting selection probabilities and sampling outcomes at three levels—school, class, and student. At each level, the weighting component consists of a basic weight that is the inverse of the probability of selection at that level, together with an adjustment for nonparticipation. The overall sampling weight for each student is the product of the three weighting components: school, class (within school), and student (within class).
Note that sampling weights are calculated independently for each grade and each study. In general, a country will have only one set of sampling weights per target population (fourth and/or eighth grade). However, with the introduction of TIMSS Numeracy in 2015, a country that participates in both TIMSS and TIMSS Numeracy would have two sets of sampling weights at fourth grade as sampling weights are calculated separately for TIMSS and TIMSS Numeracy.
School Weighting ComponentGiven that schools in TIMSS are sampled with probability proportional to school size, the basic school weight for the i th sampled school (i.e., the inverse of the probability of the i th school being sampled) is defined as:
isc
MBWin m=
where n is the number of sampled schools, mi is the measure of size for the i th school, and
==
N
imM1i
∑
where N is the total number of schools in the explicit stratum.1
School Nonparticipation Adjustment. If a sampled school does not participate in TIMSS and its two designated replacement schools do not participate, it is necessary to adjust the basic school weight to compensate for the reduction in sample size. The school-level nonparticipation adjustment is calculated separately for each explicit stratum, as follows:
21
21
rrs
nrrrssc nnn
nnnnA ++
+++=
where ns is the number of originally sampled schools that participated, nr1 and nr2 the number of first and second replacement schools, respectively, that participated, and nnr is the number of schools that did not participate. Sampled schools that are found to be ineligible2 are not included in the calculation of this adjustment.
1 For countries such as the Russian Federation that include a preliminary sampling stage, the basic school weight also incorporates the probability of selection in this preliminary stage. The basic school weight in such cases is the product of the preliminary stage weight and the school weight.
2 A sampled school is ineligible if it is found to contain no eligible students (i.e., no students in the target grade). Such schools usually are in the sampling frame by mistake or are schools that recently have closed.

CHAPTER 3: SAMPLE DESIGN IN TIMSS 2015 METHODS AND PROCEDURES IN TIMSS 2015 3.20
International Study CenterLynch School of Education, Boston College
Combining the basic school weight and the school nonparticipation adjustment, the final school weighting component for the i th school becomes:
iscsc
isc BWAFW =
It should be noted that, as well as being a crucial component of the overall student weight, the final school weighting component is a sampling weight in its own right, and can be used in analyses where the school is the analytic unit.
Class Weighting ComponentThe class weighting component reflects the class-within-school selection probability. After a school has been sampled and has agreed to participate in TIMSS, one or two classes are sampled with equal probability from the list of all classes in the school at the target grade. Because larger schools have more classes from which to sample than smaller schools, the probability of class selection varies with school size, with students in small schools more likely to have their class selected than students in large schools. This relatively greater selection probability for students in small schools offsets their lower selection probability at the first stage, where probability-proportional-to-size school sampling results in higher selection probabilities for larger schools.
The basic class-within-school weight for a sampled class is the inverse of the probability of the class being selected from all of the classes in its school. For the i th sampled school, let Ci be the total number of eligible classes and ci the number of sampled classes. Using equal probability sampling, the basic class weight for all sampled classes in the i th school is:
i
ii
cl cCBW =
For most TIMSS participants, ci takes the values 1 or 2.Class Nonparticipation Adjustment. Basic class weights are calculated for all sampled classes
in the sampled and replacement schools that participate in TIMSS. A class-level nonparticipation adjustment is applied to compensate for classes that do not participate or where the student participation rate is below 50 percent.3 Such sampled classes are assigned a weight of zero. Class nonparticipation adjustments are applied at the explicit stratum level rather than at the school level to minimize the risk of bias. The adjustment is calculated as follows:
i
ii
icl
cA
1rrs 21++
rrs 21++
=∑
∑
δ
3 Although sampling weights are calculated separately for each study when countries participate in both TIMSS and TIMSS Numeracy at fourth grade, the criteria to evaluate if student participation within a class is below 50% uses the student participation from both studies combined. Therefore, if 50% or more students from a class participated in either TIMSS or TIMSS Numeracy, the class is considered as participating when calculating sampling weights for TIMSS or TIMSS Numeracy.

CHAPTER 3: SAMPLE DESIGN IN TIMSS 2015 METHODS AND PROCEDURES IN TIMSS 2015 3.21
International Study CenterLynch School of Education, Boston College
where ci is the number of sampled classes in the i th school, as defined earlier, and δi gives the number of participating classes in the i th school.
Combining the basic class weight and the class nonparticipation adjustment, the final class weighting component, assigned to all sampled classes in the i th school, becomes:
iclcl
jicl BWAFW =,
Student Weighting ComponentThe student weighting component represents the student-within-class selection probability. The basic student weight is the inverse of the probability of a student in a sampled class being selected.
In the typical TIMSS situation where intact classes are sampled, all students in the class are included, and so this probability is unity. However, under certain circumstances, students may be sampled within the class, and in these circumstances the probability is less than unity. For TIMSS 2015, within-class sampling occurred in countries that decided to administer both TIMSS and TIMSS Numeracy at the fourth grade.
For an intact class with no student subsampling, the basic student weight for the j th class in the i th school is computed as follows:
stBW ji,1 = 1.0
For classes with student subsampling, the basic student weight for the j th class in the i th school is:
bsji
rgijst
nBW
,
jirgn ,
n ji,
2
+=
where jirgn , is the number of students in the j th class of the i th school selected to participate in TIMSS
and jibsn , is the number of students in the class not selected. In the case of countries administering
both TIMSS and TIMSS Numeracy at fourth grade, a set of weights is calculated for each study and the basic student weight is calculated differently, as the participation status is known for all the students in each sampled class. In this case, the basic student weight for the j th class in the i th school for study k is given by:
ijst3BW = rg ’
1,
bsjin ,
rg ’jin ,
n ji,+,
For students who left school or were excluded,
For all other students selected for study k
where k represents either TIMSS or TIMSS Numeracy, jirg ’n , and ji
bs’n , represent the number of students in the j th class of the i th school selected to participate in study k and the number of

CHAPTER 3: SAMPLE DESIGN IN TIMSS 2015 METHODS AND PROCEDURES IN TIMSS 2015 3.22
International Study CenterLynch School of Education, Boston College
students in the j th class of the i th school not selected for study k respectively, without counting students who either were excluded or left school after the class listing was completed.
Adjustment for Non-Participation. The student nonparticipation adjustment for the j th classroom in the i th school is calculated as:
nrji
rss ,ji
st1A , s ji,+== ji
st2A , = jist3A ,
jirss ,
where jirss , is the number of participating students (i.e., students that participated in TIMSS or
TIMSS Numeracy and have assessment scores) in the j th class of the i th school and jinrs , is the
number of students sampled in this class who were expected to have assessment scores but did not participate in the assessment. For intact classes, the sum of ji
rss , and jinrs , is the total number of
students listed in the class, not counting excluded students or students who have left the school since class list was published.
The final student weighting component for students in the j th classroom of the i th school is:
jist
jist
jist BWAFW ,,, =
where ∆ equals 1 when there was no student subsampling (intact classes), 2 when a sample of students was drawn from the students in the class and 3 when both TIMSS and TIMSS Numeracy were administered at fourth grade within the same schools and classes.
Overall Student Sampling Weight. The overall student sampling weight is the product of the final weighting components for schools, classes, and students, as follows:
stcli
sc FWFWFWW ji, ji, ji,=
Overall student sampling weights are only attributed to participating students, with non-participants weighted at 0. All student data reported in the TIMSS international reports are weighted by the overall student sampling weight, known as TOTWGT in the TIMSS international databases.
Participation RatesBecause nonparticipation can result in sample bias and misleading results, it is important that the schools, classes, and students that are sampled to participate in TIMSS actually take part in the assessments. To show the level of sampling participation in each country, TIMSS calculates both unweighted participation rates (i.e., based on simple counts of schools, classes, and students) and weighted participation rates based on the sampling weights described in the previous section. Unweighted participation rates provide a preliminary indicator that may be used to monitor

CHAPTER 3: SAMPLE DESIGN IN TIMSS 2015 METHODS AND PROCEDURES IN TIMSS 2015 3.23
International Study CenterLynch School of Education, Boston College
progress in securing the participation of schools and classes, whereas weighted participation rates are the ultimate measure of sampling participation.
TIMSS reports weighted and unweighted participation rates for schools, classes, and students, as well as overall participation rates that are a combination of all three. To distinguish between participation based solely on originally sampled schools and participation that also relies on replacement schools, school and overall participation rates are computed separately for originally sampled schools only and for originally sampled together with replacement schools.
Unweighted School Participation RateThe unweighted school participation rate is the ratio of the number of participating schools to the number of originally sampled schools, excluding any sampled schools found to be ineligible. A school is considered to be a participating school if at least one of its sampled classes has a student participation rate of at least 50 percent. The two unweighted school participation rates are calculated as follows:
sscunwR = unweighted school participation rate for originally sampled schools only
rscunwR = unweighted school participation rate, including originally sampled and first and second
replacement schools
nrrrs
ssscunw nnnn
nR+++
=21
nrrrs
rrsrscunw nnnn
nnnR +++++=
21
21
Unweighted Class Participation RateThe unweighted class participation rate is the ratio of the number of sampled classes that participated to the number of classes sampled, as follows:
=i
clunw
cR
i
rrs 21++
∑
✳ic
i
rrs 21++
∑
where ci is the number of sampled classes in the ith school, and c*i is the number of participating
classes in the ith school. Both summations are across all participating schools.

CHAPTER 3: SAMPLE DESIGN IN TIMSS 2015 METHODS AND PROCEDURES IN TIMSS 2015 3.24
International Study CenterLynch School of Education, Boston College
Unweighted Student Participation RateThe unweighted student participation rate is the ratio of the number of selected students that participated in TIMSS to the total number of selected students that should have been assessed in the participating schools and classes. Classes where less than 50 percent of the students participate are considered to be not participating, and so students in such classes also are considered to be nonparticipants.4 The unweighted student participation rate is computed as follows:
=stunwR
+ nrrs ss ji,
rssji,
ji,
ji,
ji,ji,∑∑
∑
Overall Unweighted Participation RateThe overall unweighted participation rate is the product of the unweighted school, class, and student participation rates. Because TIMSS computes two versions of the unweighted school participation rate, one based on originally sampled schools only and the other including replacements as well as originally sampled schools, there also are two overall unweighted participation rates:
sovunwR = unweighted overall participation rate for originally sampled schools only
rovunwR = unweighted overall participation rate, including originally sampled and first and second
replacement schoolsstunw
clunw
sscunw
sovunw RRRR =
stunw
clunw
rscunw
rovunw RRRR =
Weighted School Participation RateThe weighted school participation rate is the ratio of two estimates of the size of the target student population. The numerator is derived from the measure of size of those sampled schools that participated in TIMSS and the denominator is the weighted estimate of the total student enrollment in the population. Weighted school participation rates are computed for originally sampled schools and for originally sampled and replacement schools combined, as follows:
sscwtdR = weighted school participation rate for originally sampled schools only
rscwtdR = weighted school participation rate, including originally sampled and first and second
replacement schools
4 For countries that participated in both TIMSS and TIMSS Numeracy at fourth grade, this 50% criteria is applied to student participation from both studies combined.

CHAPTER 3: SAMPLE DESIGN IN TIMSS 2015 METHODS AND PROCEDURES IN TIMSS 2015 3.25
International Study CenterLynch School of Education, Boston College
++ 21 rrs
s
, jistcl
isc
stcli
sc
FWFWFW
FWFWBWsc–swtdR =
, ji , ji
, ji, ji
, ji
∑
∑
++ 21 rrs
, jistcl
isc
stcli
sc
FWFWFW
FWFWBWsc–rwtdR =
, ji , ji
, ji, ji
, ji
∑
∑++ 21 rrs
Summations in both the numerator and denominator are over all responding students and include appropriate class and student sampling weights. Note that the basic school weight appears in the numerator, whereas the final school weight appears in the denominator.
Weighted Class Participation RateThe weighted class participation rate is computed as follows:
++ 21 rrs
++ 21 rrs
, jistcl
isc
stcli
sc
FWFWBW
FWBWBWstwtdR =
, ji , ji
, ji, ji
, ji
∑
∑
where both the numerator and denominator are summations over all responding students from classes with at least 50 percent of their students participating in the study, and the appropriate student-level sampling weights are used. In this formula, the basic class weight appears in the numerator, whereas the final class weight appears in the denominator. And, the denominator in this formula is the same quantity that appears in the numerator of the weighted school participation rate for all schools, whether originally sampled or replacement.
Weighted Student Participation RateThe weighted student participation rate is computed as follows:
++ 21 rrs
++ 21 rrs
, jistcl
isc
stcli
sc
FWBWBW
BWBWBWstwtdR =
, ji , ji
, ji, ji
, ji
∑
∑

CHAPTER 3: SAMPLE DESIGN IN TIMSS 2015 METHODS AND PROCEDURES IN TIMSS 2015 3.26
International Study CenterLynch School of Education, Boston College
where both the numerator and denominator are summations over all responding students from participating schools. In this formula, the basic student weight appears in the numerator, whereas the final student weight appears in the denominator. Also, the denominator in this formula is the same quantity that appears in the numerator of the weighted class participation rate for all participating schools, whether originally sampled or replacement.
Overall Weighted Participation RateThe overall weighted participation rate is the product of the weighted school, class, and student participation rates. Because there are two versions of the weighted school participation rate, one based on originally sampled schools only and the other including replacement as well as originally sampled schools, there also are two overall weighted participation rates:
sovwtdR = weighted overall participation rate for originally sampled schools only
rovwtdR = weighted overall participation rate, including sampled, first and second replacement schools
stwtd
clwtd
sovwtd
sovwtd RRRR =
stwtd
clwtd
rscwtd
rovwtd RRRR =
Weighted school, class, student, and overall participation rates are computed for each TIMSS participant using these procedures.
ReferencesChowdhury, S., Chu, A., & Kaufman, S. (2000). Minimizing overlap in NCES surveys. Proceedings of the Survey
Methods Research Section, American Statistical Association, 174-179. Retrieved from http://www.amstat.org/sections/srms/Proceedings/papers/2000_025.pdf
UNESCO. (2012). International Standard Classification of Education ISCED 2011. Montreal: UNESCO Institute of Statistics. Retrieved from http://www.uis.unesco.org/Education/Documents/isced-2011-en.pdf

CHAPTER 3: SAMPLE DESIGN IN TIMSS 2015 METHODS AND PROCEDURES IN TIMSS 2015 3.27
International Study CenterLynch School of Education, Boston College
Appendix 3A: TIMSS 2015 Fourth Grade Stratification VariablesCountry
Explicit StratificationVariables
Number of Explicit Strata
Implicit Stratification Variables
Australia State or territory (8) 8
Geographic location (3)
School type (3)
Socioeconomic status (2)
BahrainGovernorate (5)Gender (2)
9 None
Belgium (Flemish)Region (6)School type (3)Socioeconomic status (4)
18 None
BulgariaSchool type (3)Urbanization (3)
8 Urbanization (2)
Canada
Province (5)Language (2)School type (2) within AlbertaGrade 4 only / grade 4 and 8 within
Ontario (2)School type (3) within OntarioSchool type (2) within Quebec
15
Region (4) in public and Catholic schools within Ontario
Postal code area (6) in English schools within Alberta
ChileGrade 4 / grade 4 and 8 schools (2)School type (3)Urbanization (2)
7National assessment score level (5)
Chinese Taipei Urbanization (3) 3 None
CroatiaSchool type (3)Urbanization (2)Region group (6)
15 None
Cyprus Districts (4) 4 Urbanization (2)
Czech Republic Region (14) 14 None
Denmark School type (2) 2 None
EnglandSchool type (2)Attainment level (5)
6 None
FinlandRegion (6)Urbanization (2)
10 None
France School type (3) 3 None
GeorgiaGrade 4 only / grade 4 and 8 schools (2)Region (4)Math average score (3)
14 None
GermanySchool type (2)Socioeconomic status (4)
5 None
Hong Kong SAR School finance type (5) 5 None
HungaryGrade 4 only / grade 4 and 8 schools (2)National assessment score (2)Type of community (3)
7 None

CHAPTER 3: SAMPLE DESIGN IN TIMSS 2015 METHODS AND PROCEDURES IN TIMSS 2015 3.28
International Study CenterLynch School of Education, Boston College
CountryExplicit StratificationVariables
Number of Explicit Strata
Implicit Stratification Variables
IndonesiaPerformance (3)School type (2)School funding (2)
9 None
Iran, Islamic Rep. of
School type (2)Gender (3)Region group (3)Province (6)
22 None
IrelandDEIS (3)Language of instruction (3)Gender (3)
8 Urbanization (2)
ItalySchool type (2)Region (6)
7 None
Japan Urbanization (4) 4 None
JordanSchool type (6)Achievement level (6)
31 Gender (3)
Kazakhstan
Grade 4 only / grade 4 and 8 schools (2)Region (4)Urbanization (2)Language (2)
18 None
Korea, Rep. of Urbanization (3) 3 None
Kuwait
School type (2)Region (6)Gender (2)Language (3)
15 None
LithuaniaGrade 4 / grade 4 and 8 schools (2)Languages (5)
10 Urbanization (4)
MoroccoSchool type (2)Region (16)
18 Urbanization (2)
NetherlandsSocioeconomic status level (5)Urbanization (5)
12 None
New ZealandSchool type (2)Socioeconomic status (4)Urbanization (2)
9 None
Northern IrelandRegion (5)Deprivation (5)
14 None
Norway (5)Grade 5 only / grade 5 and 9 schools (2)Language (2)Municipality size (3)
8 None
OmanSchool type (3)Governorates (11)
13 None
PolandUrbanization (4)School performance level (5)
15 None
PortugalRegion (7)School type (2)
9 None
Appendix 3A: TIMSS 2015 Fourth Grade Stratification Variables (Continued)
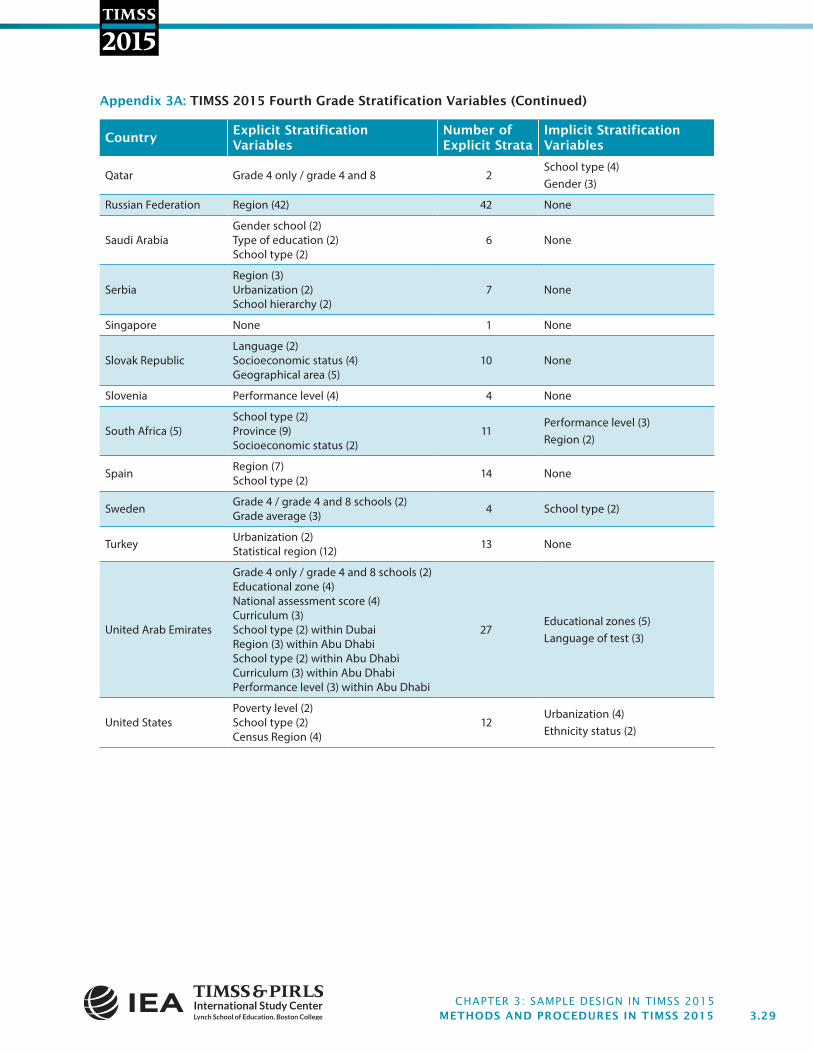
CHAPTER 3: SAMPLE DESIGN IN TIMSS 2015 METHODS AND PROCEDURES IN TIMSS 2015 3.29
International Study CenterLynch School of Education, Boston College
CountryExplicit StratificationVariables
Number of Explicit Strata
Implicit Stratification Variables
Qatar Grade 4 only / grade 4 and 8 2School type (4)Gender (3)
Russian Federation Region (42) 42 None
Saudi ArabiaGender school (2)Type of education (2)School type (2)
6 None
SerbiaRegion (3)Urbanization (2)School hierarchy (2)
7 None
Singapore None 1 None
Slovak RepublicLanguage (2)Socioeconomic status (4)Geographical area (5)
10 None
Slovenia Performance level (4) 4 None
South Africa (5)School type (2)Province (9)Socioeconomic status (2)
11Performance level (3)Region (2)
Spain Region (7)School type (2) 14 None
Sweden Grade 4 / grade 4 and 8 schools (2)Grade average (3) 4 School type (2)
Turkey Urbanization (2)Statistical region (12) 13 None
United Arab Emirates
Grade 4 only / grade 4 and 8 schools (2)Educational zone (4)National assessment score (4)Curriculum (3)School type (2) within DubaiRegion (3) within Abu DhabiSchool type (2) within Abu DhabiCurriculum (3) within Abu DhabiPerformance level (3) within Abu Dhabi
27Educational zones (5)Language of test (3)
United StatesPoverty level (2)School type (2)Census Region (4)
12Urbanization (4)Ethnicity status (2)
Appendix 3A: TIMSS 2015 Fourth Grade Stratification Variables (Continued)

CHAPTER 3: SAMPLE DESIGN IN TIMSS 2015 METHODS AND PROCEDURES IN TIMSS 2015 3.30
International Study CenterLynch School of Education, Boston College
CountryExplicit StratificationVariables
Number of Explicit Strata
Implicit Stratification Variables
Benchmarking Participants
Buenos Aires, Argentina
Grade 4 only / grade 4 and 8 schools (2)School type (2)Socioeconomic status (3)
10 None
Ontario, CanadaGrade 4 / grade 4 and 8 schools (2)Language (2)School type (3)
6 Regional office (3)
Quebec, CanadaSchool type (2)Language (2)
4 None
Norway (4)
Grade 5 only / grade 5 and 9 schools / grade 4 only (3)
Language (2)Municipality size (3)
9 None
Abu Dhabi, UAE
Grade 4 only / grade 4 and 8 schoolsRegion (3)School type (2)Curriculum (3)Performance level (3)
13 None
Dubai, UAEGrade 4 only / grade 4 and 8 schools
schools (2)School type (2)
4 Language of test (3)
Florida, US Poverty level (2) 2Urbanization (4)
Ethnicity status (2)
Appendix 3A: TIMSS 2015 Fourth Grade Stratification Variables (Continued)

CHAPTER 3: SAMPLE DESIGN IN TIMSS 2015 METHODS AND PROCEDURES IN TIMSS 2015 3.31
International Study CenterLynch School of Education, Boston College
Appendix 3B: TIMSS 2015 Eighth Grade Stratification VariablesCountry
Explicit StratificationVariables
Number of Explicit Strata
Implicit Stratification Variables
Australia State or territory (8) 8
Geographic location (3)
School type (3)
Socioeconomic status (2)
BahrainGovernorate (5)Gender (2)
9 None
Botswana (9)School type (2)Region (6)Socioeconomic status (2)
11 None
Canada
Province (4)Language (2)Grade 8 only / grade 4 and 8 (2) within
OntarioSchool type (3) within Ontario School type (2) within Quebec
12
Region (4) in public and Catholic schools within Ontario
Achievement (4) within Quebec (all but English private schools)
ChileGrade 8 / grade 4 and 8 schools (2)School type (3)Urbanization (2)
6National assessment score level (5)
Chinese TaipeiUrbanization (3)Performance level (6)
15 None
Egypt
School type (4)Region (3)Urbanization (2)Gender schools (3)
14 None
EnglandSchool type (2)Attainment level (5)
6 None
GeorgiaGrade 8 only / grade 4 and 8 schools (2)Region (4)Math average score (3)
14 None
Hong Kong SAR School finance type (4) 4 Other school characteristic (3)
HungaryGrade 8 only / grade 4 and 8 schools (2)National assessment score (2)Type of community (3)
8 None
Iran, Islamic Rep. of
School type (2)Gender (3)Region group (3)Province (6)
20 None
IrelandSchool sector (3)Socioeconomic status (3)Gender (3)
13 None
IsraelSchool sector (4)Socioeconomic status (3)Subgroups within Arab sector (3)
9 None
ItalySchool type (2)Region (6)
7 None
JapanUrbanization (4)School type (2)
5 None

CHAPTER 3: SAMPLE DESIGN IN TIMSS 2015 METHODS AND PROCEDURES IN TIMSS 2015 3.32
International Study CenterLynch School of Education, Boston College
CountryExplicit StratificationVariables
Number of Explicit Strata
Implicit Stratification Variables
JordanSchool type (6)Achievement level (6)
31 Region or grouped regions (5)
Kazakhstan
Grade 8 only / grade 4 and 8 schools (2)Region (4)Urbanization (2)Language (2)
18 None
Korea, Rep. ofUrbanization (3)School gender (3)
9 None
Kuwait
School type (2)Region (6)Gender (2)Language (2)
14 None
LebanonPerfomance level (2)School type (2)
3 Region (7)
LithuaniaGrade 8 / grade 4 and 8 schools (2)Languages (5)
9 Urbanization (4)
MalaysiaSchool type (6)Score level (6)Urbanization (2)
15
Malta None 1School type (3)
Gender (3)
MoroccoSchool type (2)Region (16)
18 Urbanization (2)
New Zealand
School type (2)Socioeconomic status (4)Urbanization (2)Gender schools (3)
13 None
Norway (9)Grade 9 / grade 5 and 9 schools (2)Language (2)Municipality size (3)
8 None
OmanSchool type (3)Governorates (11)
13 Gender (3)
Qatar Grade 8 only / grade 4 and 8 2School type (4)
Gender (3)
Russian Federation Region (42) 42 None
Saudi ArabiaGender school (2)Type of education (2)School type (2)
6 None
Singapore None 1 None
Slovenia Performance level (4) 4 None
South Africa (9)
School type (2)Province (9)Language (3)Socioeconomic status (2)
17Performance level (5)
Region (2)
Appendix 3B: TIMSS 2015 Eighth Grade Stratification Variables (Continued)

CHAPTER 3: SAMPLE DESIGN IN TIMSS 2015 METHODS AND PROCEDURES IN TIMSS 2015 3.33
International Study CenterLynch School of Education, Boston College
CountryExplicit StratificationVariables
Number of Explicit Strata
Implicit Stratification Variables
Sweden Grade average (7) 7 Grade 8 / grade 4 and 8 schools (2)
Thailand Jurisdiction (STRA) (7)Region (3) 9 None
Turkey Urbanization (2)Statistical region (12) 13 None
United Arab Emirates
Grade 8 only / grade 4 and 8 schools (2)Educational zone (4)National assessment score (4)Curriculum (3)School type (2) within DubaiRegion (3) within Abu DhabiSchool type (3) within Abu DhabiPerformance level (3) within Abu Dhabi
23Educational zones (5)Language of test (3)
United StatesPoverty level (2)School type (2)Census Region (4)
12Urbanization (4)Ethnicity status (2)
Benchmarking Participants
Buenos Aires, Argentina
Grade 8 only / grade 4 and 8 schools (2)School type (2)Socioeconomic status (3)
10 None
Ontario, CanadaGrade 8 / grade 4 and 8 schools (2)Language (2)School type (3)
6 Regional office (3)
Quebec, Canada School type (2)Language (2) 4 Math average score (3)
Norway (8)Grade 9 / grade 5 and 9 schools (2)Language (2)Municipality size (3)
8 None
Abu Dhabi, UAE
Grade 8 only / grade 4 and 8 schools (2)Region (3)School type (3)Performance level (3)
11 None
Dubai, UAE Grade 8 only / grade 4 and 8 schools (2)School type (2) 4 Language of test (3)
Florida, US Poverty level (2) 2Urbanization (4)Ethnicity status (2)
Appendix 3B: TIMSS 2015 Eighth Grade Stratification Variables (Continued)

CHAPTER 3: SAMPLE DESIGN IN TIMSS 2015 METHODS AND PROCEDURES IN TIMSS 2015 3.34
International Study CenterLynch School of Education, Boston College
Appendix 3C: Sampling SchoolsTIMSS employs random-start fixed-interval systematic sampling to draw the school sample, with each school selected with probability proportional to its size (PPS).
To sample schools using the PPS systematic sampling method, the schools from each explicit stratum in the sampling frame are sorted by implicit stratification variables and by their measure of size (MOS), as shown in the example. The MOS is accumulated from school to school and the running total (the Cumulative MOS) is listed next to each school. The cumulative MOS across the entire stratum (the Total Measure of Size) is a measure of the size of the school population in the stratum (59,614 students in the example).
First Step: Compute the Sampling IntervalDividing the Total MOS by the number of schools required for the sample (50 in the example) gives the sampling interval.
• 59,614 ÷ 50 = 1,192.2800
Second Step: Generate a Random StartGenerate a random number from a uniform (0,1) distribution and multiply it by the sampling interval. The school whose cumulative MOS contains the resulting number is the first school in the sample.
• 0.5481 x 1,192.2800 = 653.4887
• School 1718, with cumulative MOS of 690, is the first school in the sample.
Third Step: Identify the Next School in the Sample (repeat until all schools have been sampled)
• Add the sampling interval to the number computed in the previous step.
• 653.4887 + 1,192.2800 = 1,845.7687
• School 0067, with cumulative MOS of 1,855, is the second school in the sample.
• Repeat until all schools have been sampled. For example, to identify the third school:
• 1,845.7687 + 1,192.2800 = 3,038.0487
• School 0333, with cumulative MOS of 3,038, is the third school in the sample.
Fourth Step: Identify Replacement SchoolsTwo replacement schools are identified for each sampled school. The first replacement (R1) is the school that immediately follows the sampled school in the sampling frame, and the second replacement (R2) the school that immediately precedes the sampled school.

CHAPTER 3: SAMPLE DESIGN IN TIMSS 2015 METHODS AND PROCEDURES IN TIMSS 2015 3.35
International Study CenterLynch School of Education, Boston College
PPS Systemic Sampling—Schools
School Identifier
School MOS
Cumulative MOS
Sampled Schools
0829 110 110
0552 101 211
1802 98 309
1288 98 407
2043 95 502
0974 94 596 R2
1718 94 690
1807 93 783 R1
0457 93 876
0244 93 969
1817 91 1,060
1741 90 1,150
1652 89 1,239
0121 89 1,328
0309 89 1,417
0032 89 1,506
0021 89 1,595
0609 88 1,683
0399 86 1,769 R2
0067 86 1,855
0202 86 1,941 R1
0063 86 2,027
1467 86 2,113
1381 86 2,199
1043 84 2,283
1318 84 2,367
0659 84 2,451
0612 83 2,534
1696 82 2,616
0867 82 2,698
0537 81 2,779
1794 80 2,859
0695 80 2,939
0031 80 3.019 R2
0333 79 3,098
0051 79 3,177 R1
0384 79 3,256
1361 79 3,335
1189 79 3,414
0731 78 3,492
0634 78 3,570
1230 77 3,647
Sampling Parameters
Total Number of schools: 2,119
Total Measure of Size: 59,614
School Sample Size: 50
Sampling Interval: 1,192.2800
Random Start: 653.4887
First Step
Compute the Sampling Interval:
59,6914 ÷ 50 = 1,192.2800
Second Step
Generate a random start:
0.5481 X 1,192.2800 = 653.4887
Third Step (repeat until complete)
Compute the next selection numbers:
653.4887 + 1,192.2800 = 1,845.7687
1,845.7687 + 1,192.2800 = 3,038.0487
Fourth Step
Identify Replacement Schools
(R1, R2)

CHAPTER 3: SAMPLE DESIGN IN TIMSS 2015 METHODS AND PROCEDURES IN TIMSS 2015 3.36
International Study CenterLynch School of Education, Boston College
Appendix 3D: School Sampling Design Options to Accommodate Other SamplesTIMSS provides optional modifications to its sampling design for countries that want to maximize or minimize sampling overlap between schools sampled by TIMSS at the fourth and eighth grades as well as for countries that want to minimize overlap between schools sampled for TIMSS and schools sampled for other national or international assessments.
To provide options for countries in designing their school samples, Statistics Canada implemented two special sampling procedures. Method A was applied when data collection occurred simultaneously for two or more populations (as was the case in 2015 with TIMSS at fourth grade and eighth grades) and the country wanted to control the overlap between the schools. Method B was used primarily to ensure that the TIMSS samples avoided schools sampled for other studies, and also used when Method A was not appropriate.
Sampling Method A: Sampling Modifications for Simultaneous Data Collection
This procedure stratifies the school population according to whether schools contain students from both populations to be sampled (fourth and eighth grades, for example), or students from one population only (fourth grade only or eighth grade only) as a way of controlling sample overlap. Each school is assigned a measure of size (MOS) based on the number of students in the two populations combined (i.e., fourth grade and eighth grade combined). Schools are sampled according to the sampling design described in this chapter. When selecting schools from strata comprising students from both populations, a country can choose to maximize or minimize the number of schools to be sampled at each grade level.
The example below shows a hypothetical country participating in TIMSS at both grades. For reasons of administrative efficiency, the country wants to maximize the overlap between the fourth and eighth grade school samples. The 8,805 schools from the combined school frames (fourth and eighth grades) were first split in three strata and then a school sample of 164 was drawn as shown in the accompanying table.
Method A: Allocation of School Samples in a Country Participating at Two Grade Levels
Overlap StrataTotal
Sampled Schools
Allocation
To TIMSS Grade 4
To TIMSS Grade 8
Grade 4 only 14 14 0
Grade 8 only 14 0 14
Grade 4 & Grade 8 136 136 136
Total 164 150 150

CHAPTER 3: SAMPLE DESIGN IN TIMSS 2015 METHODS AND PROCEDURES IN TIMSS 2015 3.37
International Study CenterLynch School of Education, Boston College
Choosing as many schools as possible from the Grade 4 & Grade 8 stratum resulted in a sample of 150 schools (136+14) for each grade level, from a total of 164 sampled schools. In this case, both studies were administered in the 136 schools selected from the Grade 4 & Grade 8 stratum.
This sampling technique was most often used for TIMSS countries and benchmarking participants that had schools with students in both fourth and eighth grade populations, where there was a strong correlation between the measure of size at both grades across these schools, and when school samples could be drawn at the same time.
Sampling Method B: Sampling Modifications for Sequential Data Collection
Method B was used to minimize overlap with another study such as a national study that also samples schools, and was also used when Method A was not appropriate (e.g., low correlation between MoS for fourth grade and eighth grade, samples not drawn simultaneously). In Method B, schools were sampled using a technique described in Chowdhury, Chu, and Kaufman (2000). As explained by the authors, the method can be used to either minimize or maximize overlap amongst several samples. This method is illustrated below with an example where the aim was to minimize the overlap between a current sample of schools S2 and a previously selected school sample S1. (For a complete description of the method, readers are referred to the original paper).
Let RL (Response Load) be the number of times a school was sampled from previous samples. In this example, given that there is only one previous sample, RL takes the value ‘1’ if the school was already selected and ‘0’ otherwise.
Given that the RL variable splits the current school frame in two distinct subsets of schools, S1 and S1, we have the following relation:
Pi(S2) = Pi(S2|S1) Pi(S1) + Pi(S2|S1) Pi(S1) (1)
where Pi(Sj) gives the probability that school i be selected in the sample (Sj), and Pi(Sj|Sk) gives the probability that school i be selected in sample (Sj) given that school i already belongs to (Sk). The idea here is to derive the conditional probabilities in such a way that the unconditional probability of selecting a school in the current sample, Pi(S2), be equal to the expected probability (as defined by the TIMSS sample design).
Note that the first term after the equal sign in equation (1) is related to cases where the school response load is one, while the last term is related to cases where the school response load is zero. Therefore, minimizing the sample overlap is equivalent to zeroing the first term. In such case, equation (1) becomes:
Pi(S2) = 0 Pi(S1) + Pi(S2|S1) Pi(S1)

CHAPTER 3: SAMPLE DESIGN IN TIMSS 2015 METHODS AND PROCEDURES IN TIMSS 2015 3.38
International Study CenterLynch School of Education, Boston College
and consequently,
Pi(S2|S1) = Pi(S2)/Pi(S1)
In other words, in the current sample S2, schools would be selected with the following conditional probabilities:
0 if school i was already selected in the first sample,
Pi(S2)/Pi(S1) otherwise
However, equation (1) no longer holds if expression Pi(S2)/Pi(S1) is greater than one. This can beavoided by setting one as an upper bound. We now have the following expression:
Pi(S2) = Pi(S2|S1) Pi(S1) + 1 Pi(S1)
and consequentlyPi(S2) – Pi(S1)
Pi(S1) = Pi(S2|S1)
Combining these two results, the conditional probabilities to use when selecting the current sample of schools are given by:
Pi(S2) – Pi(S1)Pi(S1)
0 ,Max
Pi(S2)Pi(S1)
,Min 1
Note that maximizing rather than minimizing the overlap between two studies can be done by simply zeroing the last term of equation (1) rather than zeroing the first term, and following the above logic to get the conditional probabilities. The Chowdhury, Chu, and Kaufman (2000) method can be generalized to more than two samples as described in their paper.
Further details about the implementation of this method for the countries and benchmark participants can be found in the Sample Implementation in TIMSS 2015 chapter.
if school i was already selected in the first sample
otherwise