Embed Size (px)
Citation preview

PO-IR-08-2
UNIVERSITY OF CALIFORNIA COOPERATIVE EXTENSION
2008
SAMPLE COSTS TO PRODUCE
POTATOES
CHIPPERS for PROCESSING IN THE KLAMATH BASIN OF THE INTERMOUNTAIN REGION
Prepared by: Harry L. Carlson UC Cooperative Extension Farm Advisor, Modoc & Siskiyou Counties and
Director, Intermountain Research & Extension Center Karen M. Klonsky UC Cooperative Extension Economist, Department of Agricultural and
Resource Economics, UC Davis Pete Livingston UC Cooperative Extension Staff Research Associate, Department of
Agricultural and Resource Economics, UC Davis
2008 Potato Cost and Return Study (Chippers for Processing) Intermountain Region- Klamath Basin UC Cooperative Extension 2
STUDY CONTENTS INTRODUCTION …………………………………………………………………………………..……...………….. 2 ASSUMPTIONS ………………………………………………………………………………………………. 3 CULTURAL PRACTICES AND MATERIAL INPUTS …………….………………………………….….………...... 3 CASH OVERHEAD COSTS ..………….……………………………………………………….………………… 6 NON-CASH OVERHEAD COSTS ..………….……………………………………………….…...……………… 7 REFERENCES ………………………………………………………………………………..….…………………… 8 Table 1. COSTS PER ACRE TO PRODUCE POTATOES ……….……….……………………………..……………. 10 Table 2. COSTS AND RETURNS PER ACRE TO PRODUCE POTATOES ……..………………………………….. 12 Table 3. MONTHLY CASH COSTS TO PRODUCE POTATOES …………………………………….…….……….. 14 Table 4. WHOLE FARM EQUIPMENT, INVESTMENT, AND BUSINESS OVERHEAD COSTS ….……......…… 15 Table 5. HOURLY EQUIPMENT COSTS ………………..………………………………..………………...………. 16 Table 6. RANGING ANALYSIS …………………………………………………..…………………….….………...... 17 Table 7. COSTS AND RETURNS/BREAKEVEN ANALYSIS ..………………..………………….………....…..….. 18 Table 8. DETAILS BY OPERATION ……………………………………………………………………..………..….. 19
INTRODUCTION The sample costs to grow potatoes in the Klamath Basin of the Intermountain Region bound for processing (chippers) are presented in this study. The study is intended as a guide only, and can be used in making production decisions, determining potential returns, preparing budgets and evaluating production loans. The practices described are based on production procedures considered typical for this crop and area but will not apply to every situation. Sample costs for labor, materials, equipment, and custom services are based on current figures. A “Your Costs” column in Tables 1 and 2 is provided for you to enter your costs. The hypothetical farm operation, production practices, overhead, and calculations are described under the assumptions. For additional information or explanation of calculations used in the study call the Department of Agricultural and Resource Economics, University of California, Davis, California, 530-752-2414 or the Intermountain Research and Extension Center, 530-667-5117. An additional cost of production study for fresh market potatoes grown in this region is also available: “Sample Costs To Produce Potatoes, Fresh Market, Klamath Basin Of The Intermountain Region - 2008”. Sample Cost of Production studies for many commodities are available and can be requested through the Department of Agricultural and Resource Economics, UC Davis, 530-752-1517. Current and some archived studies can be obtained from selected county UC Cooperative Extension offices or downloaded from the department website http://coststudies.ucdavis.edu. The University of California prohibits discrimination or harassment of any person on the basis of race, color, national origin, religion, sex, gender identity , pregnancy (including childbirth, and medical conditions related to pregnancy or childbirth), physical or mental disability , medical condition (cancer-related or genetic characteristics), ancestry, marital status, age, sexual orientation, citizenship, or service in the uniformed services (as defined by the Uniformed Services Employment and Reemployment Rights Act of 1994: service in the uniformed services includes membership, application for membership, performance of service, application for service, or obligation for service in the uniformed services) in any of its programs or activities. University policy also prohibits reprisal or retaliation against any person in any of its programs or activities for making a complaint of discrimination or sexual harassment or for using or participating in the investigation or resolution process of any such complaint. University policy is intended to be consistent with the provisions of applicable State and Federal laws. Inquiries regarding the University’s nondiscrimination policies may be directed to the Affirmative Action/Equal Opportunity Director, University of California, Agriculture and Natural Resources, 1111 Franklin Street, 6th Floor, Oakland, CA 94607, (510) 987-0096.

2008 Potato Cost and Return Study (Chippers for Processing) Intermountain Region- Klamath Basin UC Cooperative Extension 3
ASSUMPTIONS The following assumptions pertain to sample costs to grow potatoes for the processing market (also known as chippers) in the Klamath Basin of the Intermountain Region. Practices described should not be considered recommendations by the University of California, but represent production procedures considered typical for this crop and area. Some of the costs and practices may not be applicable to your situation or used during every production year. Other practices not indicated may be needed. Cultural practices and costs to produce potatoes will vary by grower and region, and can be significant. The practices and inputs used in this cost study serve as a sample or guide, only. The costs are presented on an annual, per acre basis. The use of trade names in this report does not constitute an endorsement or recommendation by the University of California nor is any criticism implied by omission of other similar products. Farm. This report is based on a hypothetical 1,500 acre farm. Potatoes are grown on 250 acres of which the grower owns 30% of the potato acreage and rents the other 70%. The whole 1,500 acre farm has 50 acres (10 owned acres and 40 rented acres) are roads, irrigation systems, farmstead, and unused or unusable land. Typically, a grower with this amount of potato acreage will have several non-adjacent fields and the cultural practices will probably vary among fields. Additionally, extra costs may be involved for moving equipment between fields, but are not included in this study. Other crops that might be grown in rotation with the potatoes include onions, small grains, alfalfa, and horseradish. In this report, practices completed on less than 100% of the acres are denoted as a percentage of the total potato crop acreage. Owned potato land normally ranges from $3,000 to $4,000 per acre. This study uses a value of $3,500 per acre or $3,646 per producing acre. In this study only 30% of the land is owned by the grower. Rented land in this region range between $180 to $350 per acre with surface water attached to the land, but the water is not paid for by the landowner. The cost of the water is borne by the grower renting the land. A rental price of $300 per acre is used in this study or $313 per producing acre.
CULTURAL PRACTICES AND MATERIAL INPUTS Land Preparation. It is assumed that the ground planted to the potato crop is coming out rotation of another crop. It is also assumed that 80% of the acreage will need the proceeding crop residue chopped to start ground preparations in the fall before planting. A heavy disc is then used to start incorporating residue into the soil and performs the operation 1.5 times on the fields. Only 25% of the ground is ripped, but that ground is ripped 1.5 times. The fields are set with a solid set of sprinklers. When the ground is dry enough 25% of the acres are rotospiked and a pesticide, Vapam, is injected into the soil. The last fall operation is made in October with gypsum spread on 25% of the fields by a custom operator. Beginning in April a quarter of the potato ground is chiseled followed by rotospiking the remaining 75% of the land that had not been done in the fall. During the rotospike operation Vapam is applied also, but on only 65% of the same acres. Irrigation. Irrigation begins in September with of 2.0 acre-inches of water sprinkled on 30% of the acres of the potato fields. Growers will place a portable pump with a diesel engine and fuel tank along a canal. With the pump end situated in the canal a solid set of sprinkler pipes is placed in the furrows and only moved once during the growing season to cultivate the beds. Potatoes are irrigated for four months after planting. A total of 23.0 acre-inches of water are sprinkled on during the growing season and usually
2008 Potato Cost and Return Study (Chippers for Processing) Intermountain Region- Klamath Basin UC Cooperative Extension 4
apply either fertilizers or pesticides during the irrigations. Potatoes are irrigated during June through August. Prior to harvest all of the pipes are removed from the fields. Fertilization. A mixed preplant fertilizer with other nutrients is custom applied in May. Nitrogen, phosphorus, potassium, zinc, manganese, and copper are put directly into the beds prior to planting. During the growing season calcium nitrate is applied through the sprinklers in June and August. Planting. Potato seeds are cut, treated with a pesticide, and hauled to the grower by a custom service for $3.25 per hundredweight (cwt). The seed stock cost $13.00 per cwt and is planted at a density of 33 cwt per acre. An additional fungicide, such as Quadris is often applied in the seed furrow at planting. Potatoes are planted in 36 inch-beds at a rate of 33 cwt per acre by the grower. Pest Management. The pesticides and rates mentioned in this cost study are listed in UC Integrated Pest Management Guidelines, Potato. For more information on pest identification, monitoring, and management visit the UC IPM website at www.ipm.ucdavis.edu. Written recommendations are required for many pesticides, and are made by licensed pest control advisors. For information on pesticide use permits, contact the local county agricultural commissioner’s office. After planting, all treatments of potatoes using pesticides are made by either chemigation (pesticides and/or fertilizers applied through the irrigation water) or by airplane. Some pesticides and fertilizers are mixed and applied together during the same irrigation. Most pesticides are applied to a portion of the potato acreage. Weeds. A single cultivation occurs soon after the potatoes are planted in May. Chemigation of herbicides starts in June using Prowl and Outlook on 25% of the acreage and Matrix used on 100 % of the acreage. Insects and nematodes. Control of insects also begins with a chemigation in June with Vydate applied on 30% of the acreage. The last insecticide treatment consists of Monitor to control worms and aphids sprayed by aircraft over 90% of the acreage. The application is made in August. Diseases. The most problematic pests of potatoes are diseases. Control begins with Ridomil Gold Bravo combined with a June irrigation over 90% of the acres. In July the potatoes are chemigated again with two separate applications of Endura for white mold control and a third treatment of Ridomil Gold Bravo in the irrigation water. The Ridomil Gold Bravo application is used on 90% of the crop. The final disease management sprays are put on by two separate aircraft applications of Dithane and Bravo for early blight control both are applied in August prior to harvest. Growth Regulator and Desiccant. A growth regulator, Royal MH-30, is used to prevent sprouting in storage and is applied in August by aircraft over 25% of the acreage. Later in September a desiccant is used to dry out the remaining plant tops. Much of the above-ground vegetative matter dries out with crop maturity or killing fall frosts, but Reglone is applied by aircraft on 50% of the acreage to help harvesting by drying out remaining growth. Harvest. After sprinkler pipe removal the beds and vines are flattened by a roller and vines cut. A windrower is then used to dig and place two rows of potatoes on top of the two nearest un-dug rows. The potatoes are then harvested with a large horsepower tractor pulling a two-row digger and deposited in a 20 foot, 15-22 ton bottom-conveyor belt truck for transport to storage. Because the harvester digs two rows and picks up the other two rows that the windrower placed on the un-dug rows the two-row digger is actually harvesting four rows with each pass.
2008 Potato Cost and Return Study (Chippers for Processing) Intermountain Region- Klamath Basin UC Cooperative Extension 5
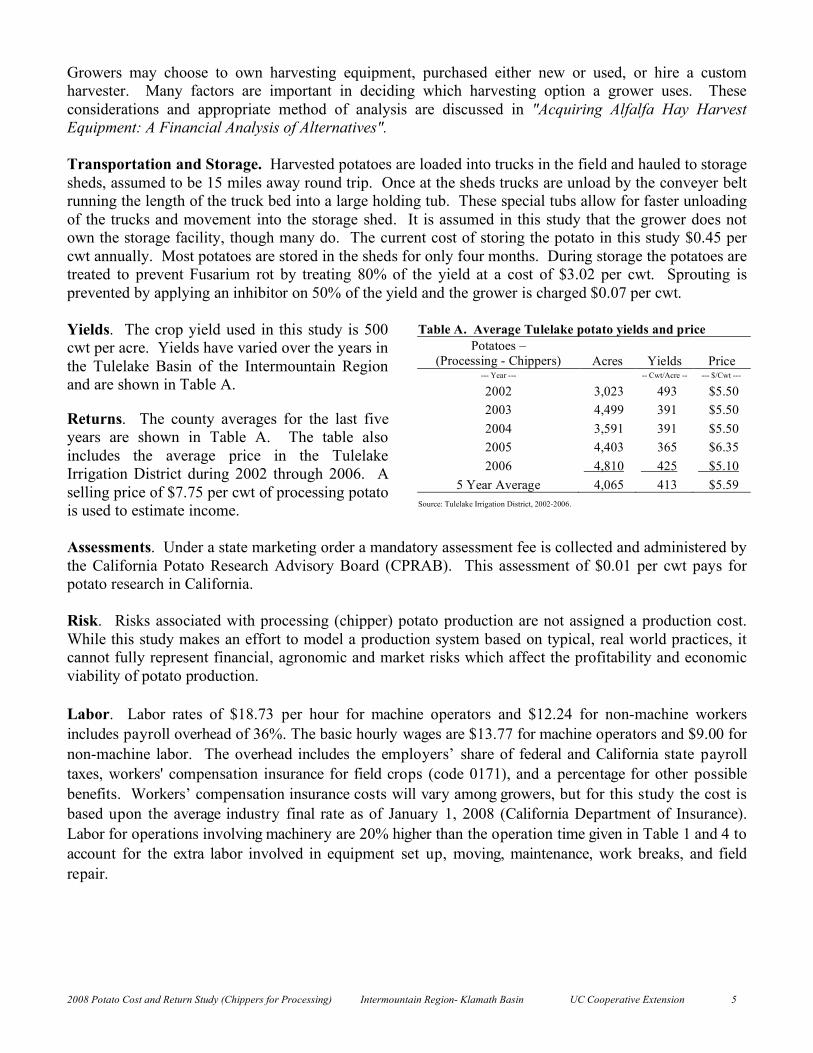
Growers may choose to own harvesting equipment, purchased either new or used, or hire a custom harvester. Many factors are important in deciding which harvesting option a grower uses. These considerations and appropriate method of analysis are discussed in "Acquiring Alfalfa Hay Harvest Equipment: A Financial Analysis of Alternatives". Transportation and Storage. Harvested potatoes are loaded into trucks in the field and hauled to storage sheds, assumed to be 15 miles away round trip. Once at the sheds trucks are unload by the conveyer belt running the length of the truck bed into a large holding tub. These special tubs allow for faster unloading of the trucks and movement into the storage shed. It is assumed in this study that the grower does not own the storage facility, though many do. The current cost of storing the potato in this study $0.45 per cwt annually. Most potatoes are stored in the sheds for only four months. During storage the potatoes are treated to prevent Fusarium rot by treating 80% of the yield at a cost of $3.02 per cwt. Sprouting is prevented by applying an inhibitor on 50% of the yield and the grower is charged $0.07 per cwt. Yields. The crop yield used in this study is 500 cwt per acre. Yields have varied over the years in the Tulelake Basin of the Intermountain Region and are shown in Table A.
Returns. The county averages for the last five years are shown in Table A. The table also includes the average price in the Tulelake Irrigation District during 2002 through 2006. A selling price of $7.75 per cwt of processing potato is used to estimate income. Assessments. Under a state marketing order a mandatory assessment fee is collected and administered by the California Potato Research Advisory Board (CPRAB). This assessment of $0.01 per cwt pays for potato research in California. Risk. Risks associated with processing (chipper) potato production are not assigned a production cost. While this study makes an effort to model a production system based on typical, real world practices, it cannot fully represent financial, agronomic and market risks which affect the profitability and economic viability of potato production. Labor. Labor rates of $18.73 per hour for machine operators and $12.24 for non-machine workers includes payroll overhead of 36%. The basic hourly wages are $13.77 for machine operators and $9.00 for non-machine labor. The overhead includes the employers’ share of federal and California state payroll taxes, workers' compensation insurance for field crops (code 0171), and a percentage for other possible benefits. Workers’ compensation insurance costs will vary among growers, but for this study the cost is based upon the average industry final rate as of January 1, 2008 (California Department of Insurance). Labor for operations involving machinery are 20% higher than the operation time given in Table 1 and 4 to account for the extra labor involved in equipment set up, moving, maintenance, work breaks, and field repair.
Table A. Average Tulelake potato yields and price Potatoes –
(Processing - Chippers) Acres Yields Price --- Year --- -- Cwt/Acre -- --- $/Cwt ---
2002 3,023 493 $5.50 2003 4,499 391 $5.50 2004 3,591 391 $5.50 2005 4,403 365 $6.35 2006 4,810 425 $5.10
5 Year Average 4,065 413 $5.59 Source: Tulelake Irrigation District, 2002-2006.
2008 Potato Cost and Return Study (Chippers for Processing) Intermountain Region- Klamath Basin UC Cooperative Extension 6
CASH OVERHEAD
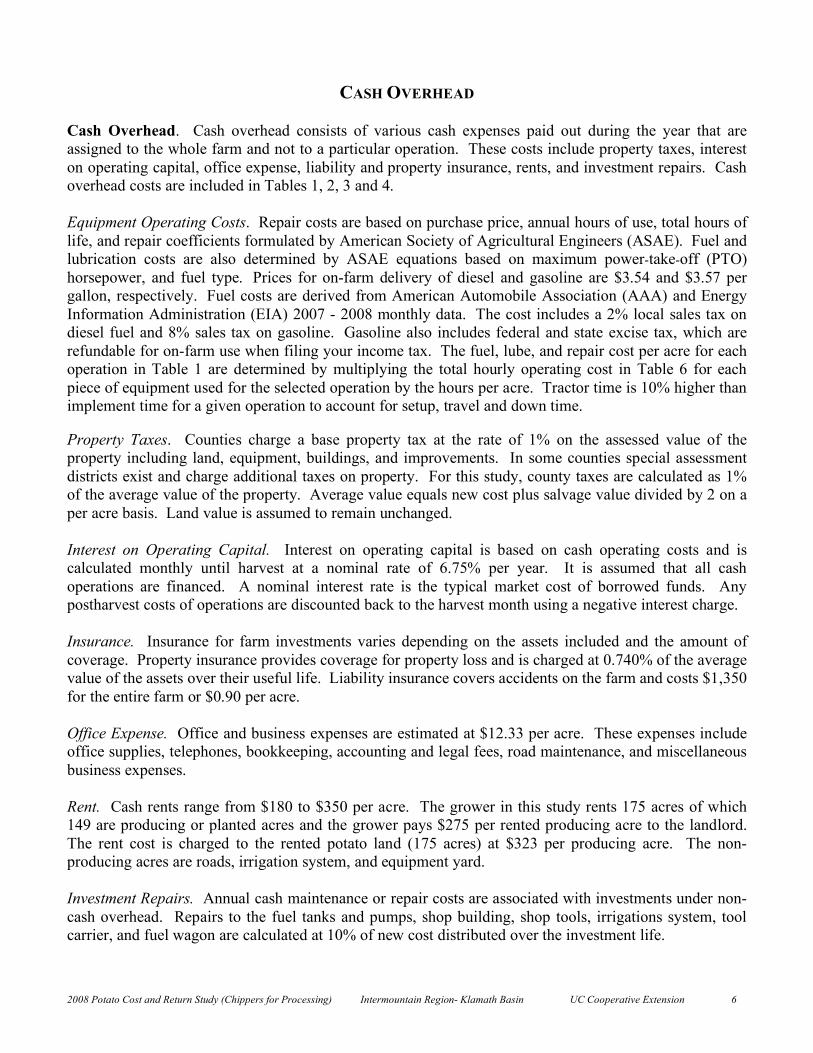
Cash Overhead. Cash overhead consists of various cash expenses paid out during the year that are assigned to the whole farm and not to a particular operation. These costs include property taxes, interest on operating capital, office expense, liability and property insurance, rents, and investment repairs. Cash overhead costs are included in Tables 1, 2, 3 and 4. Equipment Operating Costs. Repair costs are based on purchase price, annual hours of use, total hours of life, and repair coefficients formulated by American Society of Agricultural Engineers (ASAE). Fuel and lubrication costs are also determined by ASAE equations based on maximum power-take-off (PTO) horsepower, and fuel type. Prices for on-farm delivery of diesel and gasoline are $3.54 and $3.57 per gallon, respectively. Fuel costs are derived from American Automobile Association (AAA) and Energy Information Administration (EIA) 2007 - 2008 monthly data. The cost includes a 2% local sales tax on diesel fuel and 8% sales tax on gasoline. Gasoline also includes federal and state excise tax, which are refundable for on-farm use when filing your income tax. The fuel, lube, and repair cost per acre for each operation in Table 1 are determined by multiplying the total hourly operating cost in Table 6 for each piece of equipment used for the selected operation by the hours per acre. Tractor time is 10% higher than implement time for a given operation to account for setup, travel and down time. Property Taxes. Counties charge a base property tax at the rate of 1% on the assessed value of the property including land, equipment, buildings, and improvements. In some counties special assessment districts exist and charge additional taxes on property. For this study, county taxes are calculated as 1% of the average value of the property. Average value equals new cost plus salvage value divided by 2 on a per acre basis. Land value is assumed to remain unchanged. Interest on Operating Capital. Interest on operating capital is based on cash operating costs and is calculated monthly until harvest at a nominal rate of 6.75% per year. It is assumed that all cash operations are financed. A nominal interest rate is the typical market cost of borrowed funds. Any postharvest costs of operations are discounted back to the harvest month using a negative interest charge. Insurance. Insurance for farm investments varies depending on the assets included and the amount of coverage. Property insurance provides coverage for property loss and is charged at 0.740% of the average value of the assets over their useful life. Liability insurance covers accidents on the farm and costs $1,350 for the entire farm or $0.90 per acre. Office Expense. Office and business expenses are estimated at $12.33 per acre. These expenses include office supplies, telephones, bookkeeping, accounting and legal fees, road maintenance, and miscellaneous business expenses. Rent. Cash rents range from $180 to $350 per acre. The grower in this study rents 175 acres of which 149 are producing or planted acres and the grower pays $275 per rented producing acre to the landlord. The rent cost is charged to the rented potato land (175 acres) at $323 per producing acre. The non-producing acres are roads, irrigation system, and equipment yard. Investment Repairs. Annual cash maintenance or repair costs are associated with investments under non-cash overhead. Repairs to the fuel tanks and pumps, shop building, shop tools, irrigations system, tool carrier, and fuel wagon are calculated at 10% of new cost distributed over the investment life.

2008 Potato Cost and Return Study (Chippers for Processing) Intermountain Region- Klamath Basin UC Cooperative Extension 7
NON-CASH OVERHEAD COSTS
Non-cash overhead is calculated as the capital recovery cost for equipment and other farm investments. This study shows the current purchase price for new equipment and then adjusts the potato to 40% of new cost to indicate a mix of new and used equipment. Annual ownership costs for equipment and investments are shown in Tables 1, 2, and 4 as the capital recovery cost on an annual per acre basis. Capital Recovery Costs. Capital recovery cost is the annual depreciation and interest costs for a capital investment. It is the amount of money required each year to recover the difference between the purchase price and salvage value (unrecovered capital). Put another way, it is equivalent to the annual payment on a loan for the investment with the down payment equal to the discounted salvage value. This is a more complex method of calculating ownership costs than straight-line depreciation and opportunity costs, but more accurately represents the annual costs of ownership because it takes the time value of money into account (Boehlje and Eidman). The calculation for the annual capital recovery costs is as follows:
!
Purchase " SalvagePr ice Value
#
$ %
&
' ( )
Factor
Capital
Recovery#
$ % %
&
' ( (
*
+ , ,
-
. / /
+ Salvage ) InterestValue Rate
*
+ ,
-
. /
Salvage Value. Salvage value is an estimate of the remaining value of an investment at the end of its useful life. For farm machinery (tractors and implements) the remaining value is a percentage of the new cost of the investment (Boehlje and Eidman). The percent remaining value is calculated from equations developed by the ASAE based on equipment type and years of life. The life in years is estimated by dividing the wearout life, as given by ASAE by the annual hours of use in this operation. For other investments including irrigation systems, buildings, and miscellaneous equipment, the value at the end of its useful life is zero. The salvage value for land is equal to the purchase price because land does not depreciate. The purchase price and salvage value for certain equipment and investments are shown in Table 5. Interest Rate. The interest rate of 4.25% is used to calculate capital recovery cost is the effective long term interest rate in April, 2008. The interest rate is provided by a local farm lending agency and will vary according to risk and amount of loan. Equipment. Other equipment is listed as investments and are used on the entire farm. The cost of these investments shows up as non-cash cost in tables 1 and 2. Each investment current purchase price, assumed years of life, and other costs are listed in table 4. Table Values. Due to rounding, the totals may be slightly different from the sum of the components. Acknowledgements. The authors appreciate the help provided by those growers and other cooperators who provided information for this study.

2008 Potato Cost and Return Study (Chippers for Processing) Intermountain Region- Klamath Basin UC Cooperative Extension 8
REFERENCES American Society of Agricultural Engineers. 2003. American Society of Agricultural Engineers Standards
Yearbook. Russell H. Hahn and Evelyn E. Rosentreter (ed.) St. Joseph, Missouri. 41st edition.
Barker, Doug. California Workers’ Compensation Rating Data for Selected Agricultural Classifications as of January 2008. California Department of Insurance, Rate Regulation Branch.
Boehlje, Michael D., and Vernon R. Eidman. 1984. Farm Management. John Wiley and Sons. New
York, NY Blank, Steve, Karen Klonsky, Kim Norris, and Steve Orloff. 1992. Acquiring Alfalfa Hay Equipment: A
Financial Analysis of Alternatives. University of California. Oakland, CA: Giannini Information Series No. 92-1. http://giannini.ucop.edu/InfoSeries/921-HayEquip.pdf. Internet accessed April, 2008.
California Chapter of the American Society of Farm Managers and Rural Appraisers. 2008. Trends in
Agricultural Land and Lease Values. California Chapter of the American Society of Farm Managers and Rural Appraisers, Inc. Woodbridge, CA.
California State Automobile Association. 2008. Gas Price Averages 2007 - 2008. AAA Press Room, San
Francisco, CA. http://www.csaa.com/portal/site/CSAA/menuitem.5313747aa611bd4e320cfad592278a0c/?vgnextoid=8d642ce6cda97010VgnVCM1000002872a8c0RCRD. Internet accessed April, 2008.
California State Board of Equalization. Fuel Tax Division Tax Rates.
http://www.boe.ca.gov/sptaxprog/spftdrates.htm. Internet accessed April, 2008. Carlson, Harry L., Karen M. Klonsky, and Pete Livingston. 2008. Sample Costs to Produce Potatoes,
Fresh Market, Klamath Basin in the Intermountain Region – 2008. University of California, Cooperative Extension. Department of Agricultural and Resource Economics. Davis, CA. http://coststudies.ucdavis.edu. Internet accessed May, 2008.
Energy Information Administration. 2008. Weekly Retail on Highway Diesel Prices.
http://tonto.eia.doe.gov/oog/info/gdu/gasdiesel.asp. Internet accessed April, 2008.
Tulelake Irrigation District. 2002. 2002 Crop Report.
Tulelake Irrigation District. 2003. 2003 Crop Report.
Tulelake Irrigation District. 2004. 2004 Crop Report. Tulelake Irrigation District. 2005. 2005 Crop Report. Tulelake Irrigation District. 2006. 2006 Crop Report. Integrated Pest Management Education and Publications. 2008. “UC Pest Management Guidelines,
Potatoes.” In M. L. Flint (ed.) UC IPM Pest Management Guidelines. University of California. Division of Agriculture and Natural Resources. Oakland, CA. Publication 3339. http://www.ipm.ucdavis.edu/PMG/selectnewpest.tomatoes.html. Internet accessed May, 2008.
2008 Potato Cost and Return Study (Chippers for Processing) Intermountain Region- Klamath Basin UC Cooperative Extension 9
Statewide Integrated Pest Management Project. 1992. Integrated Pest Management for Potato. Second Edition. University of California. Division of Agriculture and Natural Resources. Oakland, CA: Publication 3280.
USDA-ERS. 2008. Farm Sector: Farm Financial Ratios. Agriculture and Rural Economics Division,
ERS. USDA. Washington, DC. http://usda.mannlib.cornell.edu/reports/nassr/price/zap-bb/agpran04.txt; Internet accessed April, 2008.
________________________
For information concerning the above or other University of California publications, contact UC DANR Communications Services at 800-994-8849, online at http://anrcatalog.ucdavis.edu/InOrder/Shop/Shop.asp, or your local county UC Cooperative Extension office.

2008 Potato Cost and Return Study (Chippers for Processing) Intermountain Region- Klamath Basin UC Cooperative Extension 10
UC COOPERATIVE EXTENSION Table 1. COSTS PER ACRE TO PRODUCE POTATOES
KLAMATH BASIN IN THE INTERMOUNTAIN REGION- 2008 CHIPPERS FOR PROCESSING
Labor Rate: $18.73/hr. machine labor Interest Rate: 6.75% $12.24/hr. non-machine labor Yield per Acre: 500.0 Cwt
Operation ---------------- Cash and Labor Costs per Acre -------------------- Time Labor Fuel, Lube Material Custom/ Total Your Operation (Hrs/A) Cost & Repairs Cost Rent Cost Cost Preplant: Land Preparation: Chop Crop Residue on 80% of Acres 0.15 4 8 0 0 12 Land Preparation: Stubble Disc Field 1.5X 0.22 5 13 0 0 18 Land Preparation: Rip 1.5X on 25% of Acres 0.10 2 7 0 0 9 Land Preparation: Pre-irrigate 0.15 2 0 12 0 14 Land Preparation: Rotospike & Vapam 25% of Acre 0.05 1 3 41 0 46 Land Preparation: Apply Gypsum on 25% of Acres 0.00 0 0 12 2 13 Land Preparation: Chisel 25% of Acres 0.03 1 2 0 0 3 Land Preparation: Rotospike & Vapam (65%) 75% of Acres 0.16 4 10 106 0 120 Fertilize Beds 0.00 0 0 335 25 360 TOTAL PREPLANT COSTS 0.86 18 44 506 27 594 Cultural: Plant Potatoes 0.25 6 19 486 3 514 Weed Control - Cultivate 0.14 3 7 0 0 10 Irrigate & Fertilize 2.60 33 0 68 0 100 Weed Control - Outlook & Prowl on 25% of Acres 0.50 6 0 21 0 27 Weed Control- Matrix on 50% of Acres 0.50 6 0 36 0 42 Disease Control - Ridomil Gold Bravo on 90% of Acres 0.50 6 0 47 0 54 Irrigate 3.58 45 0 64 0 109 Disease Control - Endura 2X 1.16 15 0 76 0 90 Disease Control - Ridomil Gold Bravo on 90% of Acres 0.58 7 0 49 0 56 Insect Control - Monitor 2X - on 90% of Acres 0.00 0 0 32 8 39 Disease Control - Dithane 0.00 0 0 6 9 15 Disease Control - Bravo 0.00 0 0 8 9 16 Growth Regulator - Royal on 25% of Acres 0.00 0 0 15 2 17 Pickup Truck Use (6 Pickups) 0.38 26 14 0 0 40 ATV Use 0.19 9 2 0 0 10 TOTAL CULTURAL COSTS 10.38 162 42 907 30 1,141 Preharvest: Desiccant Application 50% Acre 0.00 0 0 18 4 22 Take Out Pump & Pipe 2.30 29 0 0 0 29 Roll Crop 0.11 2 2 0 0 4 TOTAL PREHARVEST COSTS 2.41 31 2 18 4 55 Harvest: Cut Beds 0.14 3 5 0 0 8 Dig Potatoes 1.00 46 136 0 0 182 Windrow Potatoes 0.67 15 36 0 0 51 Bulk Potatoes 3.00 38 0 0 0 38 Haul From Field 0.50 46 52 0 0 98 Assessments/Fees 0.00 0 0 80 0 80 Elevate & Remove Dirt 0.80 18 33 0 0 52 Holding Tub 0.80 56 7 0 0 63 Treat For Fusarium (Storage) on 80 % of Yield 0.00 0 0 0 0 0 Store Potatoes In Shed 0.00 0 0 0 200 200 Treat For Sprouts on 50% of Yield 0.10 1 0 18 0 19 TOTAL HARVEST COSTS 7.00 223 269 98 200 790 Interest on Operating Capital @ 6.75% 62 TOTAL OPERATING COSTS/ACRE 435 357 1,529 261 2,643
2008 Potato Cost and Return Study (Chippers for Processing) Intermountain Region- Klamath Basin UC Cooperative Extension 11
UC COOPERATIVE EXTENSION Table 1. continued
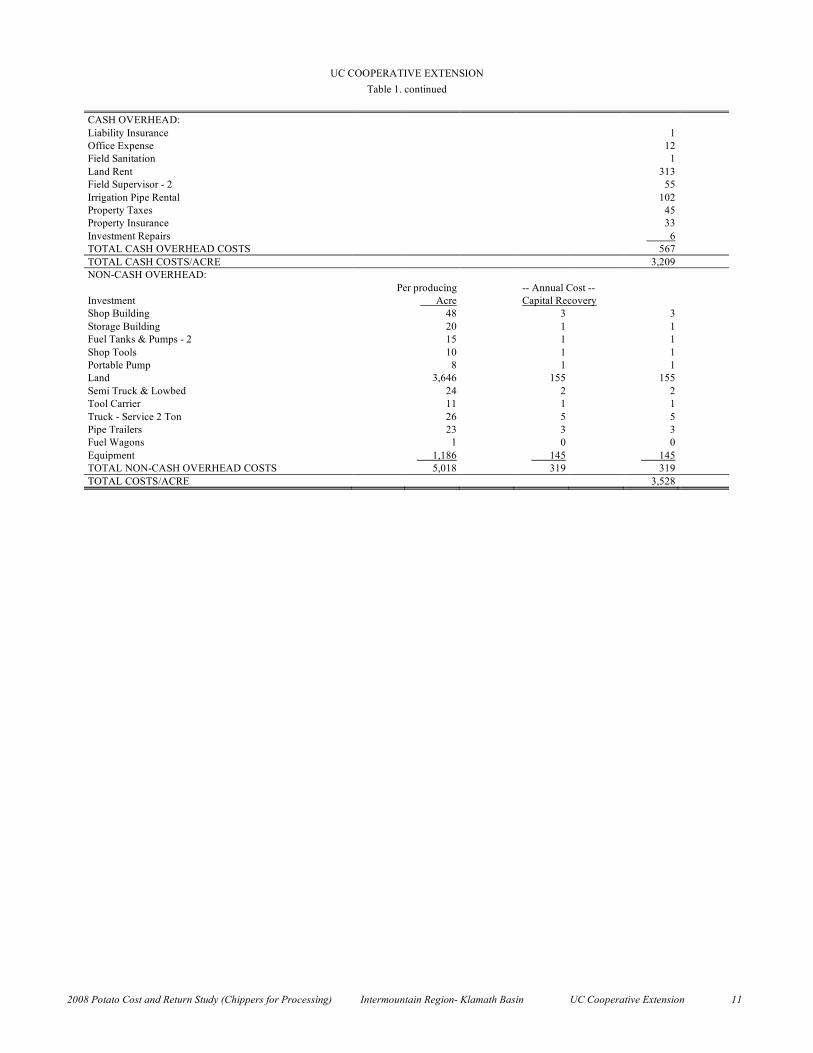
CASH OVERHEAD: Liability Insurance 1 Office Expense 12 Field Sanitation 1 Land Rent 313 Field Supervisor - 2 55 Irrigation Pipe Rental 102 Property Taxes 45 Property Insurance 33 Investment Repairs 6 TOTAL CASH OVERHEAD COSTS 567 TOTAL CASH COSTS/ACRE 3,209 NON-CASH OVERHEAD: Per producing -- Annual Cost -- Investment Acre Capital Recovery Shop Building 48 3 3 Storage Building 20 1 1 Fuel Tanks & Pumps - 2 15 1 1 Shop Tools 10 1 1 Portable Pump 8 1 1 Land 3,646 155 155 Semi Truck & Lowbed 24 2 2 Tool Carrier 11 1 1 Truck - Service 2 Ton 26 5 5 Pipe Trailers 23 3 3 Fuel Wagons 1 0 0 Equipment 1,186 145 145 TOTAL NON-CASH OVERHEAD COSTS 5,018 319 319 TOTAL COSTS/ACRE 3,528
2008 Potato Cost and Return Study (Chippers for Processing) Intermountain Region- Klamath Basin UC Cooperative Extension 12
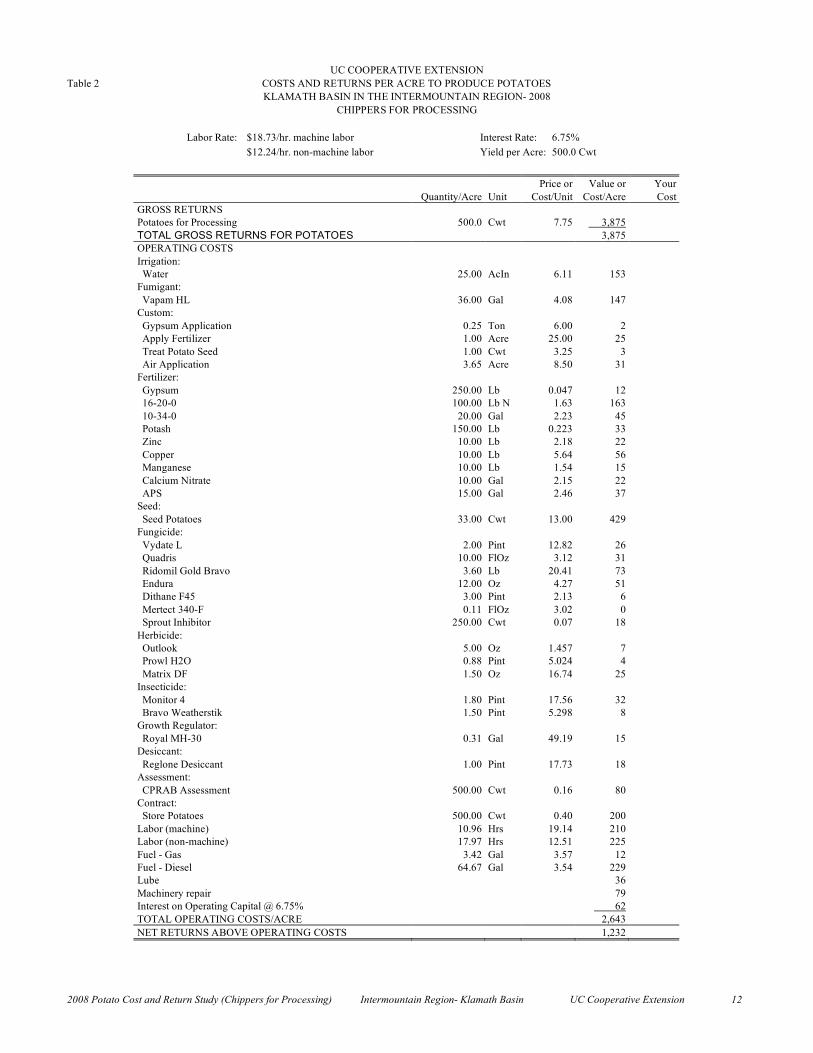
UC COOPERATIVE EXTENSION Table 2 COSTS AND RETURNS PER ACRE TO PRODUCE POTATOES
KLAMATH BASIN IN THE INTERMOUNTAIN REGION- 2008 CHIPPERS FOR PROCESSING
Labor Rate: $18.73/hr. machine labor Interest Rate: 6.75% $12.24/hr. non-machine labor Yield per Acre: 500.0 Cwt
Price or Value or Your Quantity/Acre Unit Cost/Unit Cost/Acre Cost GROSS RETURNS Potatoes for Processing 500.0 Cwt 7.75 3,875 TOTAL GROSS RETURNS FOR POTATOES 3,875 OPERATING COSTS Irrigation: Water 25.00 AcIn 6.11 153 Fumigant: Vapam HL 36.00 Gal 4.08 147 Custom: Gypsum Application 0.25 Ton 6.00 2 Apply Fertilizer 1.00 Acre 25.00 25 Treat Potato Seed 1.00 Cwt 3.25 3 Air Application 3.65 Acre 8.50 31 Fertilizer: Gypsum 250.00 Lb 0.047 12 16-20-0 100.00 Lb N 1.63 163 10-34-0 20.00 Gal 2.23 45 Potash 150.00 Lb 0.223 33 Zinc 10.00 Lb 2.18 22 Copper 10.00 Lb 5.64 56 Manganese 10.00 Lb 1.54 15 Calcium Nitrate 10.00 Gal 2.15 22 APS 15.00 Gal 2.46 37 Seed: Seed Potatoes 33.00 Cwt 13.00 429 Fungicide: Vydate L 2.00 Pint 12.82 26 Quadris 10.00 FlOz 3.12 31 Ridomil Gold Bravo 3.60 Lb 20.41 73 Endura 12.00 Oz 4.27 51 Dithane F45 3.00 Pint 2.13 6 Mertect 340-F 0.11 FlOz 3.02 0 Sprout Inhibitor 250.00 Cwt 0.07 18 Herbicide: Outlook 5.00 Oz 1.457 7 Prowl H2O 0.88 Pint 5.024 4 Matrix DF 1.50 Oz 16.74 25 Insecticide: Monitor 4 1.80 Pint 17.56 32 Bravo Weatherstik 1.50 Pint 5.298 8 Growth Regulator: Royal MH-30 0.31 Gal 49.19 15 Desiccant: Reglone Desiccant 1.00 Pint 17.73 18 Assessment: CPRAB Assessment 500.00 Cwt 0.16 80 Contract: Store Potatoes 500.00 Cwt 0.40 200 Labor (machine) 10.96 Hrs 19.14 210 Labor (non-machine) 17.97 Hrs 12.51 225 Fuel - Gas 3.42 Gal 3.57 12 Fuel - Diesel 64.67 Gal 3.54 229 Lube 36 Machinery repair 79 Interest on Operating Capital @ 6.75% 62 TOTAL OPERATING COSTS/ACRE 2,643 NET RETURNS ABOVE OPERATING COSTS 1,232
2008 Potato Cost and Return Study (Chippers for Processing) Intermountain Region- Klamath Basin UC Cooperative Extension 13
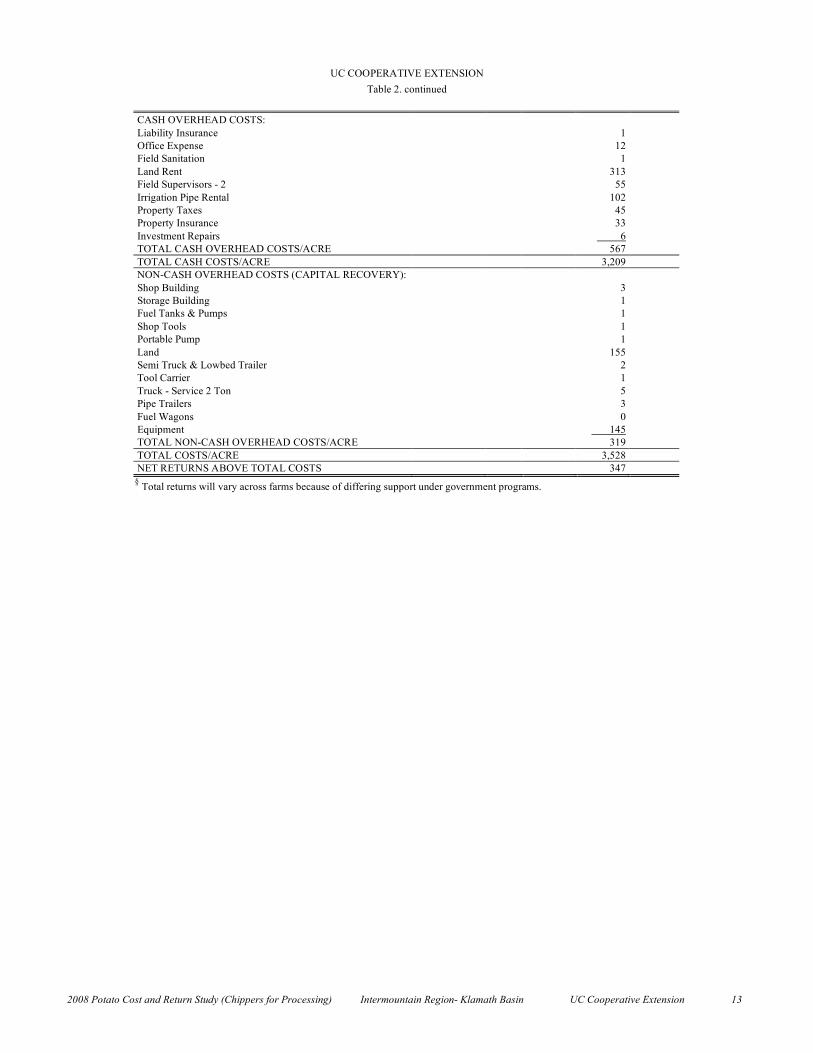
UC COOPERATIVE EXTENSION Table 2. continued
CASH OVERHEAD COSTS: Liability Insurance 1 Office Expense 12 Field Sanitation 1 Land Rent 313 Field Supervisors - 2 55 Irrigation Pipe Rental 102 Property Taxes 45 Property Insurance 33 Investment Repairs 6 TOTAL CASH OVERHEAD COSTS/ACRE 567 TOTAL CASH COSTS/ACRE 3,209 NON-CASH OVERHEAD COSTS (CAPITAL RECOVERY): Shop Building 3 Storage Building 1 Fuel Tanks & Pumps 1 Shop Tools 1 Portable Pump 1 Land 155 Semi Truck & Lowbed Trailer 2 Tool Carrier 1 Truck - Service 2 Ton 5 Pipe Trailers 3 Fuel Wagons 0 Equipment 145 TOTAL NON-CASH OVERHEAD COSTS/ACRE 319 TOTAL COSTS/ACRE 3,528 NET RETURNS ABOVE TOTAL COSTS 347
§ Total returns will vary across farms because of differing support under government programs.

2008 Potato Cost and Return Study (Chippers for Processing) Intermountain Region- Klamath Basin UC Cooperative Extension 14
UC COOPERATIVE EXTENSION Table 3. MONTHLY CASH COSTS PER ACRE TO PRODUCE POTATOES
KLAMATH BASIN IN THE INTERMOUNTAIN REGION- 2008 CHIPPERS FOR PROCESSING
Beginning SEP 06 SEP OCT NOV DEC JAN FEB MAR APR MAY JUN JUL AUG SEP OCT TOTAL Ending OCT 07 07 07 07 07 08 08 08 08 08 08 08 08 08 08 Preplant: Land Prep: Chop Crop Residue on 80% of Acres 12 12 Land Prep: Stubble Disc Field 1.5X 18 18 Land Prep: Rip 1.5X on 25% of Acres 9 9 Land Prep: Pre-irrigate 14 14 Land Prep: Rotospike & Vapam 25% of Acre 46 46 Land Prep: Apply Gypsum on 25% of Acres 13 13 Land Prep: Chisel 25% of Acres 3 3 Land Prep: Rotospike & Vapam (65%) 75% of Acres 120 120 Fertilize Beds 360 360 TOTAL PREPLANT COSTS 98 13 123 360 594 Cultural: Plant Potatoes 514 514 Weed Control - Cultivate 10 10 Irrigate & Fertilize 100 100 Weed Control - Outlook & Prowl on 25% of Acres 27 27 Weed Control- Matrix on 50% of Acres 42 42 Disease Control - Ridomil Gold Bravo on 90% of Acres 54 54 Irrigate 19 62 28 109 Disease Control - Endura 2X 90 90 Disease Control - Ridomil Gold Bravo on 90% of Acres 56 56 Insect Control - Monitor 2X - on 90% of Acres 39 39 Disease Control - Dithane 15 15 Disease Control - Bravo 16 16 Growth Regulator - Royal on 85% of Acres 17 17 Pickup Truck Use (6 Pickups) 40 40 ATV Use 1 1 1 1 1 1 1 1 1 1 1 1 1 1 10 TOTAL CULTURAL COSTS 1 1 1 1 1 1 1 1 525 224 167 150 29 41 1,141 Preharvest: Dessicant Application on 50% of Acres 22 22 Take Out Pump & Pipe 29 29 Roll Crop 4 4 TOTAL PREHARVEST COSTS 55 55 Harvest: Cut Beds 8 8 Dig Potatoes 182 182 Windrow Potatoes 51 51 Bulk Potatoes 38 38 Haul From Field 98 98 Assessments/Fees 80 80 Elevate & Remove Dirt 52 52 Holding Tub 63 63 Treat For Fusarium (Storage) on 80% of Yield 0 0 Store Potatoes In Shed 200 200 Treat For Sprouts on 25% of Yield 19 19 TOTAL HARVEST COSTS 790 790 Interest on Operating Capital @ 8.75% 1 1 1 1 1 1 1 1 6 8 9 9 10 15 62 TOTAL OPERATING COSTS/ACRE 99 15 1 1 1 1 1 125 891 231 175 160 94 846 2,643 CASH OVERHEAD: Liability Insurance 1 1 Office Expense 1 1 1 1 1 1 1 1 1 1 1 1 1 1 12 Field Sanitation 0 0 0 0 0 0 0 0 0 0 0 0 1 Land Rent 313 313 Field Supervisor - 2 4 4 4 4 4 4 4 4 4 4 4 4 4 4 55 Irrigation Pipe Rental 8 8 8 8 8 8 8 8 8 8 8 8 102 Property Taxes 22 22 45 Property Insurance 17 17 33 Investment Repairs 0 0 0 0 0 0 0 0 0 0 0 0 6 TOTAL CASH OVERHEAD COSTS 326 14 14 14 15 53 14 14 14 14 53 14 5 5 567 TOTAL CASH COSTS/ACRE 426 28 15 15 16 54 15 139 905 245 228 174 98 850 3,209
2008 Potato Cost and Return Study (Chippers for Processing) Intermountain Region- Klamath Basin UC Cooperative Extension 15
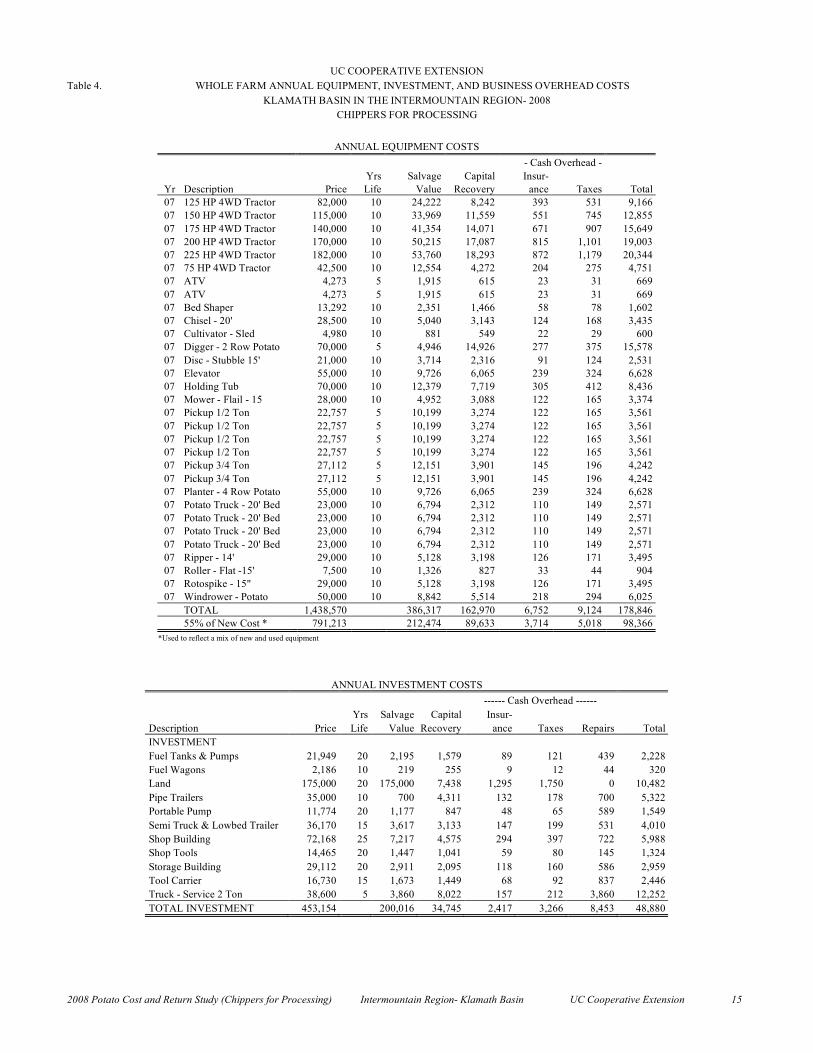
UC COOPERATIVE EXTENSION Table 4. WHOLE FARM ANNUAL EQUIPMENT, INVESTMENT, AND BUSINESS OVERHEAD COSTS
KLAMATH BASIN IN THE INTERMOUNTAIN REGION- 2008 CHIPPERS FOR PROCESSING
ANNUAL EQUIPMENT COSTS
- Cash Overhead - Yrs Salvage Capital Insur-
Yr Description Price Life Value Recovery ance Taxes Total 07 125 HP 4WD Tractor 82,000 10 24,222 8,242 393 531 9,166 07 150 HP 4WD Tractor 115,000 10 33,969 11,559 551 745 12,855 07 175 HP 4WD Tractor 140,000 10 41,354 14,071 671 907 15,649 07 200 HP 4WD Tractor 170,000 10 50,215 17,087 815 1,101 19,003 07 225 HP 4WD Tractor 182,000 10 53,760 18,293 872 1,179 20,344 07 75 HP 4WD Tractor 42,500 10 12,554 4,272 204 275 4,751 07 ATV 4,273 5 1,915 615 23 31 669 07 ATV 4,273 5 1,915 615 23 31 669 07 Bed Shaper 13,292 10 2,351 1,466 58 78 1,602 07 Chisel - 20' 28,500 10 5,040 3,143 124 168 3,435 07 Cultivator - Sled 4,980 10 881 549 22 29 600 07 Digger - 2 Row Potato 70,000 5 4,946 14,926 277 375 15,578 07 Disc - Stubble 15' 21,000 10 3,714 2,316 91 124 2,531 07 Elevator 55,000 10 9,726 6,065 239 324 6,628 07 Holding Tub 70,000 10 12,379 7,719 305 412 8,436 07 Mower - Flail - 15 28,000 10 4,952 3,088 122 165 3,374 07 Pickup 1/2 Ton 22,757 5 10,199 3,274 122 165 3,561 07 Pickup 1/2 Ton 22,757 5 10,199 3,274 122 165 3,561 07 Pickup 1/2 Ton 22,757 5 10,199 3,274 122 165 3,561 07 Pickup 1/2 Ton 22,757 5 10,199 3,274 122 165 3,561 07 Pickup 3/4 Ton 27,112 5 12,151 3,901 145 196 4,242 07 Pickup 3/4 Ton 27,112 5 12,151 3,901 145 196 4,242 07 Planter - 4 Row Potato 55,000 10 9,726 6,065 239 324 6,628 07 Potato Truck - 20' Bed 23,000 10 6,794 2,312 110 149 2,571 07 Potato Truck - 20' Bed 23,000 10 6,794 2,312 110 149 2,571 07 Potato Truck - 20' Bed 23,000 10 6,794 2,312 110 149 2,571 07 Potato Truck - 20' Bed 23,000 10 6,794 2,312 110 149 2,571 07 Ripper - 14' 29,000 10 5,128 3,198 126 171 3,495 07 Roller - Flat -15' 7,500 10 1,326 827 33 44 904 07 Rotospike - 15" 29,000 10 5,128 3,198 126 171 3,495 07 Windrower - Potato 50,000 10 8,842 5,514 218 294 6,025
TOTAL 1,438,570 386,317 162,970 6,752 9,124 178,846 55% of New Cost * 791,213 212,474 89,633 3,714 5,018 98,366
*Used to reflect a mix of new and used equipment
ANNUAL INVESTMENT COSTS ------ Cash Overhead ------ Yrs Salvage Capital Insur- Description Price Life Value Recovery ance Taxes Repairs Total INVESTMENT Fuel Tanks & Pumps 21,949 20 2,195 1,579 89 121 439 2,228 Fuel Wagons 2,186 10 219 255 9 12 44 320 Land 175,000 20 175,000 7,438 1,295 1,750 0 10,482 Pipe Trailers 35,000 10 700 4,311 132 178 700 5,322 Portable Pump 11,774 20 1,177 847 48 65 589 1,549 Semi Truck & Lowbed Trailer 36,170 15 3,617 3,133 147 199 531 4,010 Shop Building 72,168 25 7,217 4,575 294 397 722 5,988 Shop Tools 14,465 20 1,447 1,041 59 80 145 1,324 Storage Building 29,112 20 2,911 2,095 118 160 586 2,959 Tool Carrier 16,730 15 1,673 1,449 68 92 837 2,446 Truck - Service 2 Ton 38,600 5 3,860 8,022 157 212 3,860 12,252 TOTAL INVESTMENT 453,154 200,016 34,745 2,417 3,266 8,453 48,880
2008 Potato Cost and Return Study (Chippers for Processing) Intermountain Region- Klamath Basin UC Cooperative Extension 16
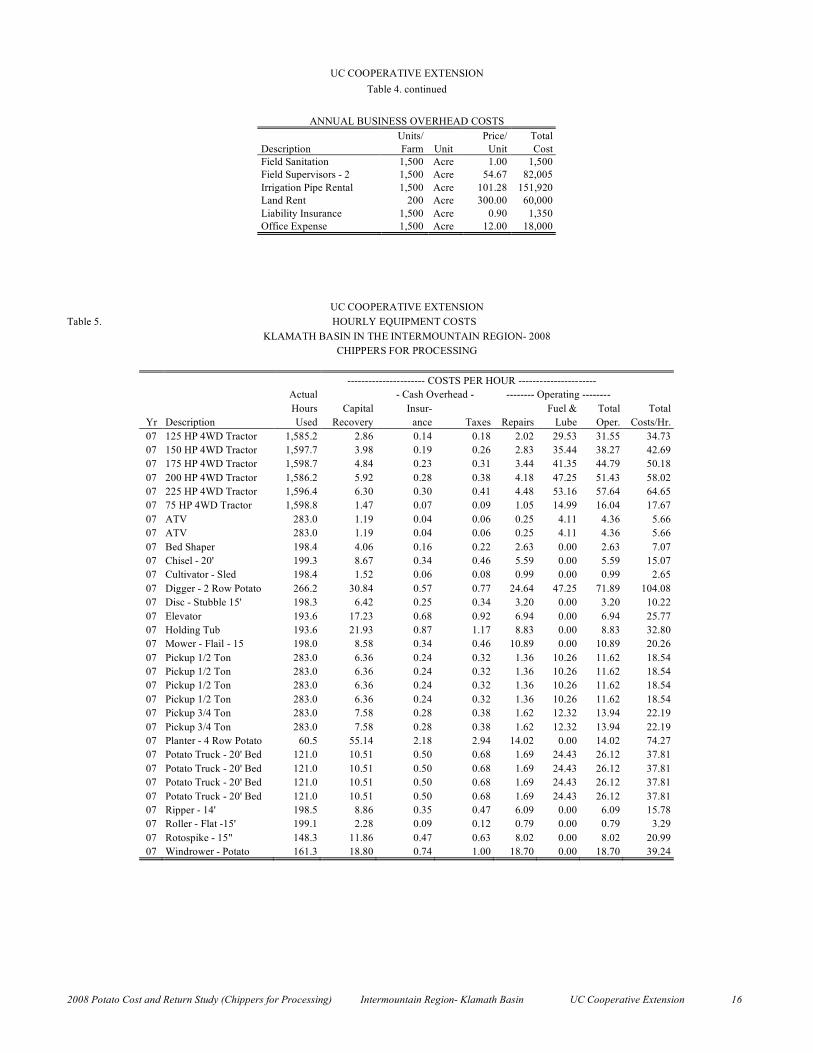
UC COOPERATIVE EXTENSION Table 4. continued
ANNUAL BUSINESS OVERHEAD COSTS
Units/ Price/ Total Description Farm Unit Unit Cost Field Sanitation 1,500 Acre 1.00 1,500 Field Supervisors - 2 1,500 Acre 54.67 82,005 Irrigation Pipe Rental 1,500 Acre 101.28 151,920 Land Rent 200 Acre 300.00 60,000 Liability Insurance 1,500 Acre 0.90 1,350 Office Expense 1,500 Acre 12.00 18,000
UC COOPERATIVE EXTENSION Table 5. HOURLY EQUIPMENT COSTS
KLAMATH BASIN IN THE INTERMOUNTAIN REGION- 2008 CHIPPERS FOR PROCESSING
---------------------- COSTS PER HOUR ---------------------- Actual - Cash Overhead - -------- Operating -------- Hours Capital Insur- Fuel & Total Total
Yr Description Used Recovery ance Taxes Repairs Lube Oper. Costs/Hr. 07 125 HP 4WD Tractor 1,585.2 2.86 0.14 0.18 2.02 29.53 31.55 34.73 07 150 HP 4WD Tractor 1,597.7 3.98 0.19 0.26 2.83 35.44 38.27 42.69 07 175 HP 4WD Tractor 1,598.7 4.84 0.23 0.31 3.44 41.35 44.79 50.18 07 200 HP 4WD Tractor 1,586.2 5.92 0.28 0.38 4.18 47.25 51.43 58.02 07 225 HP 4WD Tractor 1,596.4 6.30 0.30 0.41 4.48 53.16 57.64 64.65 07 75 HP 4WD Tractor 1,598.8 1.47 0.07 0.09 1.05 14.99 16.04 17.67 07 ATV 283.0 1.19 0.04 0.06 0.25 4.11 4.36 5.66 07 ATV 283.0 1.19 0.04 0.06 0.25 4.11 4.36 5.66 07 Bed Shaper 198.4 4.06 0.16 0.22 2.63 0.00 2.63 7.07 07 Chisel - 20' 199.3 8.67 0.34 0.46 5.59 0.00 5.59 15.07 07 Cultivator - Sled 198.4 1.52 0.06 0.08 0.99 0.00 0.99 2.65 07 Digger - 2 Row Potato 266.2 30.84 0.57 0.77 24.64 47.25 71.89 104.08 07 Disc - Stubble 15' 198.3 6.42 0.25 0.34 3.20 0.00 3.20 10.22 07 Elevator 193.6 17.23 0.68 0.92 6.94 0.00 6.94 25.77 07 Holding Tub 193.6 21.93 0.87 1.17 8.83 0.00 8.83 32.80 07 Mower - Flail - 15 198.0 8.58 0.34 0.46 10.89 0.00 10.89 20.26 07 Pickup 1/2 Ton 283.0 6.36 0.24 0.32 1.36 10.26 11.62 18.54 07 Pickup 1/2 Ton 283.0 6.36 0.24 0.32 1.36 10.26 11.62 18.54 07 Pickup 1/2 Ton 283.0 6.36 0.24 0.32 1.36 10.26 11.62 18.54 07 Pickup 1/2 Ton 283.0 6.36 0.24 0.32 1.36 10.26 11.62 18.54 07 Pickup 3/4 Ton 283.0 7.58 0.28 0.38 1.62 12.32 13.94 22.19 07 Pickup 3/4 Ton 283.0 7.58 0.28 0.38 1.62 12.32 13.94 22.19 07 Planter - 4 Row Potato 60.5 55.14 2.18 2.94 14.02 0.00 14.02 74.27 07 Potato Truck - 20' Bed 121.0 10.51 0.50 0.68 1.69 24.43 26.12 37.81 07 Potato Truck - 20' Bed 121.0 10.51 0.50 0.68 1.69 24.43 26.12 37.81 07 Potato Truck - 20' Bed 121.0 10.51 0.50 0.68 1.69 24.43 26.12 37.81 07 Potato Truck - 20' Bed 121.0 10.51 0.50 0.68 1.69 24.43 26.12 37.81 07 Ripper - 14' 198.5 8.86 0.35 0.47 6.09 0.00 6.09 15.78 07 Roller - Flat -15' 199.1 2.28 0.09 0.12 0.79 0.00 0.79 3.29 07 Rotospike - 15" 148.3 11.86 0.47 0.63 8.02 0.00 8.02 20.99 07 Windrower - Potato 161.3 18.80 0.74 1.00 18.70 0.00 18.70 39.24

2008 Potato Cost and Return Study (Chippers for Processing) Intermountain Region- Klamath Basin UC Cooperative Extension 17
UC COOPERATIVE EXTENSION Table 6. RANGING ANALYSIS
KLAMATH BASIN IN THE INTERMOUNTAIN REGION- 2008
COSTS PER ACRE AT VARYING YIELD TO PRODUCE CHIPPER POTATOES FOR PROCESSING
YIELD (CWT/ACRE) 350 400 450 500 550 600 650 OPERATING COSTS/ACRE: Preplant Cost 594 594 594 594 594 594 594 Cultural Cost 1,141 1,141 1,141 1,141 1,141 1,141 1,141 Pre-harvest Cost 55 55 55 55 55 55 55 Harvest Cost 616 674 732 790 848 906 965
Interest on Operating Capital 61 61 62 62 62 63 63
TOTAL OPERATING COSTS/ACRE 2,467 2,526 2,584 2,643 2,701 2,760 2,818 TOTAL OPERATING COSTS/TON 7.05 6.31 5.74 5.29 4.91 4.60 4.34
CASH OVERHEAD COSTS/ACRE 567 567 567 567 567 567 567
TOTAL CASH COSTS/ACRE 3,034 3,092 3,151 3,209 3,268 3,326 3,385 TOTAL CASH COSTS/TON 8.67 7.73 7.00 6.42 5.94 5.54 5.21
NON-CASH OVERHEAD COSTS/ACRE 318 318 318 319 319 319 319
TOTAL COSTS/ACRE 3,352 3,410 3,469 3,528 3,586 3,645 3,704 TOTAL COSTS/TON 9.58 8.53 7.71 7.06 6.52 6.08 5.70
NET RETURNS PER ACRE ABOVE OPERATING COSTS FOR CHIPPER POTATOES FOR PROCESSING PRICE YIELD
(DOLLARS/CWT) (CWT/ACRE) Chippers for Processing 350 400 450 500 550 600 650
6.25 -280 -26 228 482 736 990 1,245 6.75 -105 174 453 732 1,011 1,290 1,570 7.25 70 374 678 982 1,286 1,590 1,895 7.75 245 574 903 1,232 1,561 1,890 2,220 8.25 420 774 1,128 1,482 1,836 2,190 2,545 8.75 595 974 1,353 1,732 2,111 2,490 2,870 9.25 770 1,174 1,578 1,982 2,386 2,790 3,195
NET RETURNS PER ACRE ABOVE CASH COSTS FOR CHIPPER POTATOES FOR PROCESSING PRICE YIELD
(DOLLARS/CWT) (CWT/ACRE) Chippers for Processing 350 400 450 500 550 600 650
6.25 -846 -592 -338 -84 170 424 678 6.75 -671 -392 -113 166 445 724 1,003 7.25 -496 -192 112 416 720 1,024 1,328 7.75 -321 8 337 666 995 1,324 1,653 8.25 -146 208 562 916 1,270 1,624 1,978 8.75 29 408 787 1,166 1,545 1,924 2,303 9.25 204 608 1,012 1,416 1,820 2,224 2,628
NET RETURNS PER ACRE ABOVE TOTAL COSTS FOR CHIPPER POTATOES FOR PROCESSING PRICE YIELD
(DOLLARS/CWT) (CWT/ACRE) Chippers for Processing 350 400 450 500 550 600 650
6.25 -1,164 -910 -657 -403 -149 105 359 6.75 -989 -710 -432 -153 126 405 684 7.25 -814 -510 -207 97 401 705 1,009 7.75 -639 -310 18 347 676 1,005 1,334 8.25 -464 -110 243 597 951 1,305 1,659 8.75 -289 90 468 847 1,226 1,605 1,984 9.25 -114 290 693 1,097 1,501 1,905 2,309
2008 Potato Cost and Return Study (Chippers for Processing) Intermountain Region- Klamath Basin UC Cooperative Extension 18
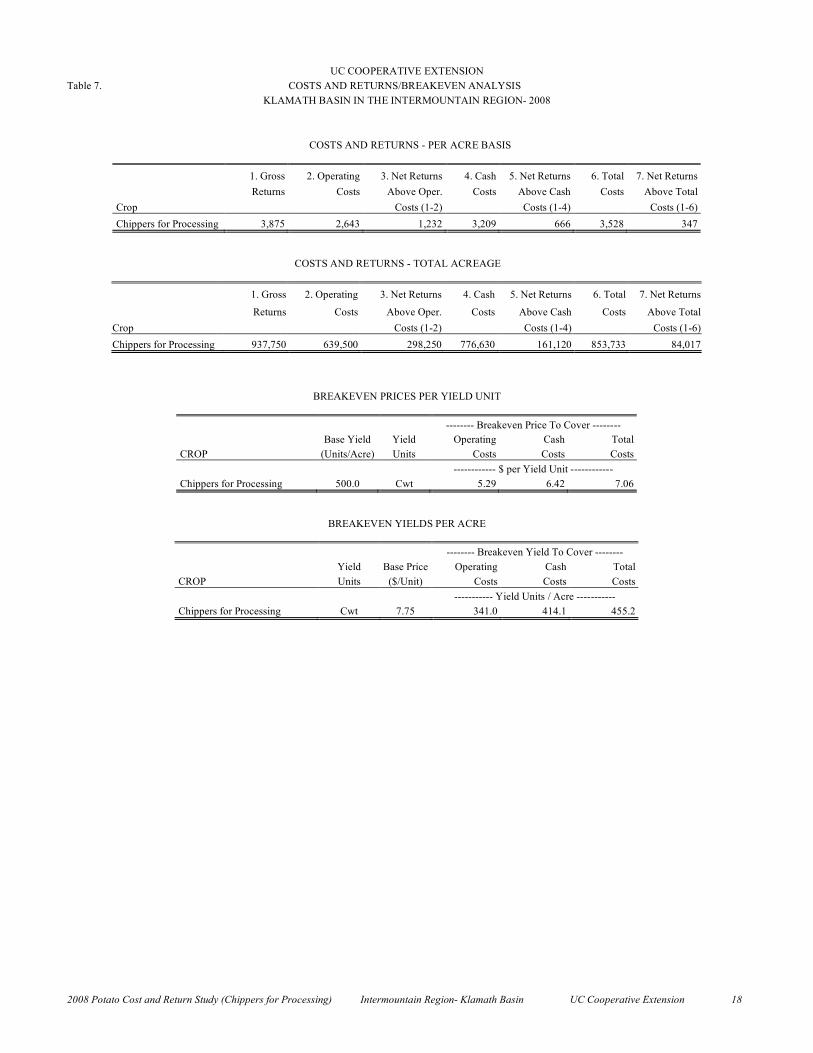
UC COOPERATIVE EXTENSION Table 7. COSTS AND RETURNS/BREAKEVEN ANALYSIS
KLAMATH BASIN IN THE INTERMOUNTAIN REGION- 2008
COSTS AND RETURNS - PER ACRE BASIS
1. Gross 2. Operating 3. Net Returns 4. Cash 5. Net Returns 6. Total 7. Net Returns Returns Costs Above Oper. Costs Above Cash Costs Above Total Crop Costs (1-2) Costs (1-4) Costs (1-6) Chippers for Processing 3,875 2,643 1,232 3,209 666 3,528 347
COSTS AND RETURNS - TOTAL ACREAGE
1. Gross 2. Operating 3. Net Returns 4. Cash 5. Net Returns 6. Total 7. Net Returns
Returns Costs Above Oper. Costs Above Cash Costs Above Total Crop Costs (1-2) Costs (1-4) Costs (1-6) Chippers for Processing 937,750 639,500 298,250 776,630 161,120 853,733 84,017
BREAKEVEN PRICES PER YIELD UNIT
-------- Breakeven Price To Cover -------- Base Yield Yield Operating Cash Total CROP (Units/Acre) Units Costs Costs Costs ------------ $ per Yield Unit ------------ Chippers for Processing 500.0 Cwt 5.29 6.42 7.06
BREAKEVEN YIELDS PER ACRE
-------- Breakeven Yield To Cover -------- Yield Base Price Operating Cash Total CROP Units ($/Unit) Costs Costs Costs ----------- Yield Units / Acre ----------- Chippers for Processing Cwt 7.75 341.0 414.1 455.2
2008 Potato Cost and Return Study (Chippers for Processing) Intermountain Region- Klamath Basin UC Cooperative Extension 19
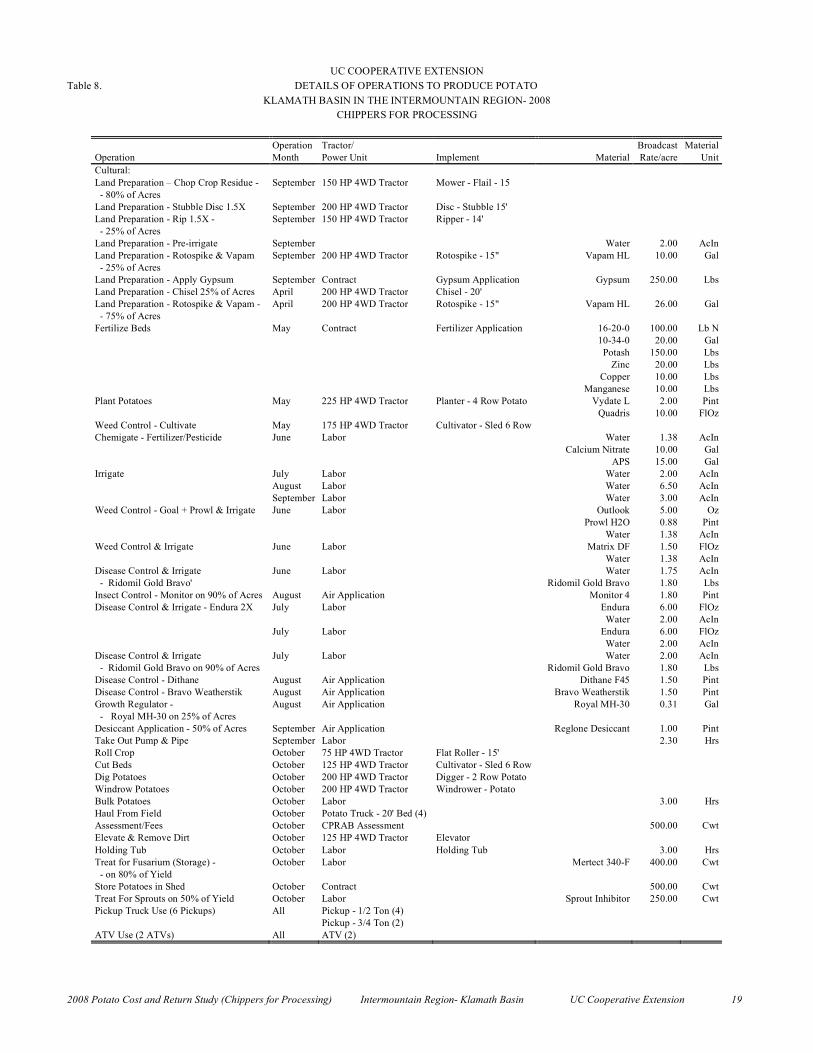
UC COOPERATIVE EXTENSION Table 8. DETAILS OF OPERATIONS TO PRODUCE POTATO
KLAMATH BASIN IN THE INTERMOUNTAIN REGION- 2008 CHIPPERS FOR PROCESSING
Operation Tractor/ Broadcast Material Operation Month Power Unit Implement Material Rate/acre Unit Cultural: Land Preparation – Chop Crop Residue - September 150 HP 4WD Tractor Mower - Flail - 15 - 80% of Acres Land Preparation - Stubble Disc 1.5X September 200 HP 4WD Tractor Disc - Stubble 15' Land Preparation - Rip 1.5X - September 150 HP 4WD Tractor Ripper - 14' - 25% of Acres Land Preparation - Pre-irrigate September Water 2.00 AcIn Land Preparation - Rotospike & Vapam September 200 HP 4WD Tractor Rotospike - 15" Vapam HL 10.00 Gal - 25% of Acres Land Preparation - Apply Gypsum September Contract Gypsum Application Gypsum 250.00 Lbs Land Preparation - Chisel 25% of Acres April 200 HP 4WD Tractor Chisel - 20' Land Preparation - Rotospike & Vapam - April 200 HP 4WD Tractor Rotospike - 15" Vapam HL 26.00 Gal - 75% of Acres Fertilize Beds May Contract Fertilizer Application 16-20-0 100.00 Lb N 10-34-0 20.00 Gal Potash 150.00 Lbs Zinc 20.00 Lbs Copper 10.00 Lbs Manganese 10.00 Lbs Plant Potatoes May 225 HP 4WD Tractor Planter - 4 Row Potato Vydate L 2.00 Pint Quadris 10.00 FlOz Weed Control - Cultivate May 175 HP 4WD Tractor Cultivator - Sled 6 Row Chemigate - Fertilizer/Pesticide June Labor Water 1.38 AcIn Calcium Nitrate 10.00 Gal APS 15.00 Gal Irrigate July Labor Water 2.00 AcIn August Labor Water 6.50 AcIn September Labor Water 3.00 AcIn Weed Control - Goal + Prowl & Irrigate June Labor Outlook 5.00 Oz Prowl H2O 0.88 Pint Water 1.38 AcIn Weed Control & Irrigate June Labor Matrix DF 1.50 FlOz Water 1.38 AcIn Disease Control & Irrigate June Labor Water 1.75 AcIn - Ridomil Gold Bravo' Ridomil Gold Bravo 1.80 Lbs Insect Control - Monitor on 90% of Acres August Air Application Monitor 4 1.80 Pint Disease Control & Irrigate - Endura 2X July Labor Endura 6.00 FlOz Water 2.00 AcIn July Labor Endura 6.00 FlOz Water 2.00 AcIn Disease Control & Irrigate July Labor Water 2.00 AcIn - Ridomil Gold Bravo on 90% of Acres Ridomil Gold Bravo 1.80 Lbs Disease Control - Dithane August Air Application Dithane F45 1.50 Pint Disease Control - Bravo Weatherstik August Air Application Bravo Weatherstik 1.50 Pint Growth Regulator - August Air Application Royal MH-30 0.31 Gal - Royal MH-30 on 25% of Acres Desiccant Application - 50% of Acres September Air Application Reglone Desiccant 1.00 Pint Take Out Pump & Pipe September Labor 2.30 Hrs Roll Crop October 75 HP 4WD Tractor Flat Roller - 15' Cut Beds October 125 HP 4WD Tractor Cultivator - Sled 6 Row Dig Potatoes October 200 HP 4WD Tractor Digger - 2 Row Potato Windrow Potatoes October 200 HP 4WD Tractor Windrower - Potato Bulk Potatoes October Labor 3.00 Hrs Haul From Field October Potato Truck - 20' Bed (4) Assessment/Fees October CPRAB Assessment 500.00 Cwt Elevate & Remove Dirt October 125 HP 4WD Tractor Elevator Holding Tub October Labor Holding Tub 3.00 Hrs Treat for Fusarium (Storage) - October Labor Mertect 340-F 400.00 Cwt - on 80% of Yield Store Potatoes in Shed October Contract 500.00 Cwt Treat For Sprouts on 50% of Yield October Labor Sprout Inhibitor 250.00 Cwt Pickup Truck Use (6 Pickups) All Pickup - 1/2 Ton (4) Pickup - 3/4 Ton (2) ATV Use (2 ATVs) All ATV (2)